one button validation of network and datacenter ... white papers/data...at 10 gigabit rates ......
TRANSCRIPT

10 Gbps Networks are deployed in most criticaljunctions of your network. Ensuring it is runningat optimal performance 24/7 from day one iscritical to your business. Empower your teamswith tools that can troubleshoot intermittentproblems and assess performance over timewith 24/7 automated testing and cloud-basedtrend analysis that will improve your operationefficiency and maintain high customersatisfaction.
One button validation of network and datacenter performanceat 10 Gigabit rates
Datasheet: OneTouch™ AT 10G Network Assistant
10 Gigabit: built-in 100 M/1 G/10 G copper and 1 G/10 G fiber optic test ports for troubleshooting andperformance measurement
All-in-one: a handheld tester combining infrastructure, network service and end-to-end path performancemeasurement in one tool
Accurate: create and save site-specific test profiles that emulate how client devices experience the network,including local, intranet and cloud-based services
Consistent: everyone on the team uses the same preconfigured test profiles to encourage standardizationand best practices
Fast: measure end-to-end path performance to validate the performance of newly installed networkinfrastructure and critical network links within the LAN or data center
Pre-deployment: automated wired analysis provides visibility into connected devices, key device properties,device interconnections and problems
Independent: verify independently that service providers are meeting agreed upon service levels (SLAs)and maintaining QoS end-to-end
Long-term: launch a repetitive test-and-upload trending process to collect results over time - testing is selfcontained, requiring no user interaction, and test results are uploaded to the OneTouch AT Cloud Service forstorage and analysis
Cloud Service: view color-coded charts of performance over time to establish a performance baseline, toperform more rigorous network acceptance testing and to troubleshoot intermittent problems – when andwhere it is convenient
Discovery: see connected devices, key device attributes, connection paths and problems within thebroadcast domain
1 of 12
OneTouch AT 10G Network Assistant Features10G Ethernet tester for copper and fiber optic networksThe OneTouch AT 10G Network Assistant incorporates one RJ-45 test port for 100/1000/10GBASE-T and one SFP+ transceiver port for 1/10Gbps Fiber EthernetNetwork. Easily troubleshoot 10G connectivity issues and measure end-to-end network path performance at rates up to 10 Gbps.
Configurable profiles for standardized testingUse the intuitive touch interface and the Setup Wizard to create test profiles, where a profile is a set of tests tailored to your network, services, and applications. Createsimple profiles with only a few tests or advanced profiles consisting of dozens of tests. You can build profiles to accommodate different types of users, devices, locationsor technologies. Once created, profiles can be saved for quick and easy reuse later. Create a library of standardized profiles to elevate the troubleshooting know-how ofnetwork support staff. Share profiles with other OneTouch AT users. Use profiles to establish best practices for consistent, faster, more productive troubleshooting andnetwork acceptance testing.
End-to-end path performance measurementThe OneTouch AT 10G Network Assistant features 10G and 1G Wired Performance tests for validating and troubleshooting end-to-end network path performance. TheseWired Performance tests facilitate measurement of throughput, frame loss, latency and jitter across wide area networks, local area networks and within sites anddatacenters.
Enterprise network managers use the Wired Performance tests for:
Assessing network performance prior to deployment of new services or network infrastructureValidating the performance of newly installed network infrastructure and critical network links within the LAN or data centerTroubleshooting network and service performance problemsVerifying independently that service providers are meeting agreed upon service levels (SLAs) and maintaining QoS end-to-end
Service providers and system integrators use the Wired Performance tests for:
Documenting network performance from layer 1 to 7 where the documentation serves as proof that the services they provided were delivered successfullyProviding value-added service to their enterprise customers in the form of network assessments and troubleshooting
To learn more about end-to-end performance testing visit OneTouch AT 10G Network Assistant Performance Testing Datasheet
2 of 12
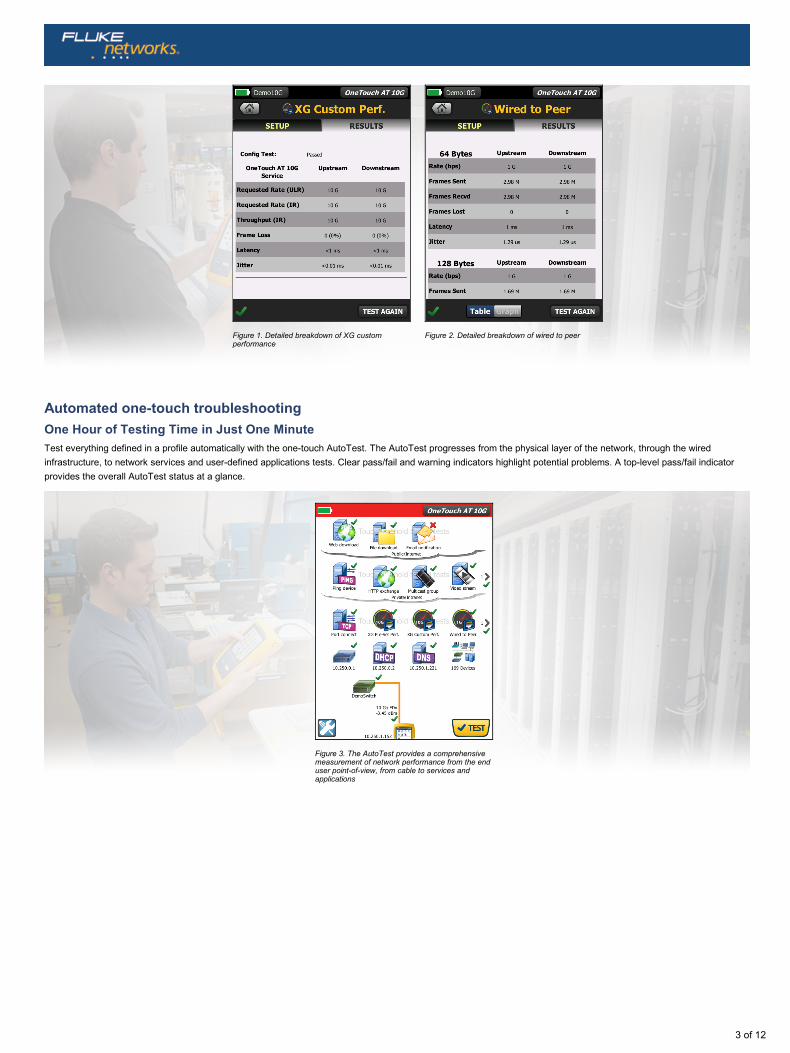
Automated one-touch troubleshootingOne Hour of Testing Time in Just One MinuteTest everything defined in a profile automatically with the one-touch AutoTest. The AutoTest progresses from the physical layer of the network, through the wiredinfrastructure, to network services and user-defined applications tests. Clear pass/fail and warning indicators highlight potential problems. A top-level pass/fail indicatorprovides the overall AutoTest status at a glance.
Figure 1. Detailed breakdown of XG customperformance
Figure 2. Detailed breakdown of wired to peer
Figure 3. The AutoTest provides a comprehensivemeasurement of network performance from the enduser point-of-view, from cable to services andapplications
3 of 12

Client view of network performanceMost network trouble tickets start where a client device is connected to the network—where the device could be a PC, tablet, IP phone, printer, POS terminal, industrialequipment controller or a medical imager. Troubleshoot common issues—or prove that the network is not the cause—by emulating the client device and measuringnetwork performance.
Infrastructure to application testingThe cause of a network problem can be elusive. Identify the root cause of a problem by measuring and analyzing the performance of the critical network elements: thenetwork cabling, the connection to the nearest switch, and the performance of key network services and server-based applications.
Network services testingTest DHCP server responsiveness. Identify the DHCP servers and view the offer and acceptance timing and lease information. Test DNS server responsiveness. Identifythe DNS servers and view the DNS lookup time.
Network application testingDetermine if a server-based application is the root cause of a reported problem by measuring availability and responsiveness metrics. Add to the AutoTest profile theperformance test appropriate for the application: ping (ICMP), connect (TCP), web (HTTP), file (FTP), multicast (IGMP), video (RTSP) or email (SMTP). Each test isgraphically represented on the OneTouch AT home page as an icon. After running the AutoTest, touch a test icon on the home page to get a detailed breakdown ofapplication performance including DNS lookup time, server response time and data rate.
The test results are presented side-by-side for easy IPv4/IPv6 performance comparisons. A few examples: connect to port 2000 on your VoIP call manager, download apage of an application with a web interface, upload or download a file from a server, subscribe to a multicast group, access video content from an on-demand streamingvideo server or email a text message to your mobile phone.
Local, intranet and internet performanceUnderstand the performance of network services and server-based applications wherever they are hosted: locally in the datacenter, on a corporate intranet server or on aserver reached via the public internet. Create location centric AutoTest profiles by grouping together co-located services and applications. Measure service levels to thedifferent groups to quickly spot problems.
4 of 12
Cloud-based trendingThe Trending feature automatically and repeatedly uploads AutoTest results to the cloud for additional analysis. Control the number of AutoTest results uploaded bysetting the trending duration and interval. Trending runs automatically once launched, untethering the user from the tester. The user does not need to be present to gathertest results; simply launch Trending and leave. Trend results for up to 1 week, or until manually stopped. Long duration testing is invaluable when trying to troubleshootsporadic, intermittent problems that frequently occur when network support staff is away.
Cloud analyticsOpen a OneTouch AT Cloud Service account to view and analyze AutoTest results uploaded via the Trending feature. Correlate network events by viewing multiple testresults simultaneously in side-by-side charts. All the test results uploaded during a single Trending session are available for analysis. The number of tests is defined by thecomplexity of your AutoTest profile and the number of results is defined by the Trending duration and interval. Select one or more of the tests within the trending sessionto analyze the results. The Cloud Service plots sequential results on a single color-coded chart to simplify analysis over time. Charting makes it easy to see performanceirregularities. Zoom permits an even more detailed analysis of the sub-processes that comprise each individual test.
Access the Cloud Service over the web at anytime from anywhere using a web-connected smart device with a web browser. View and analyze results when and whereconvenient using a PC or smart device.
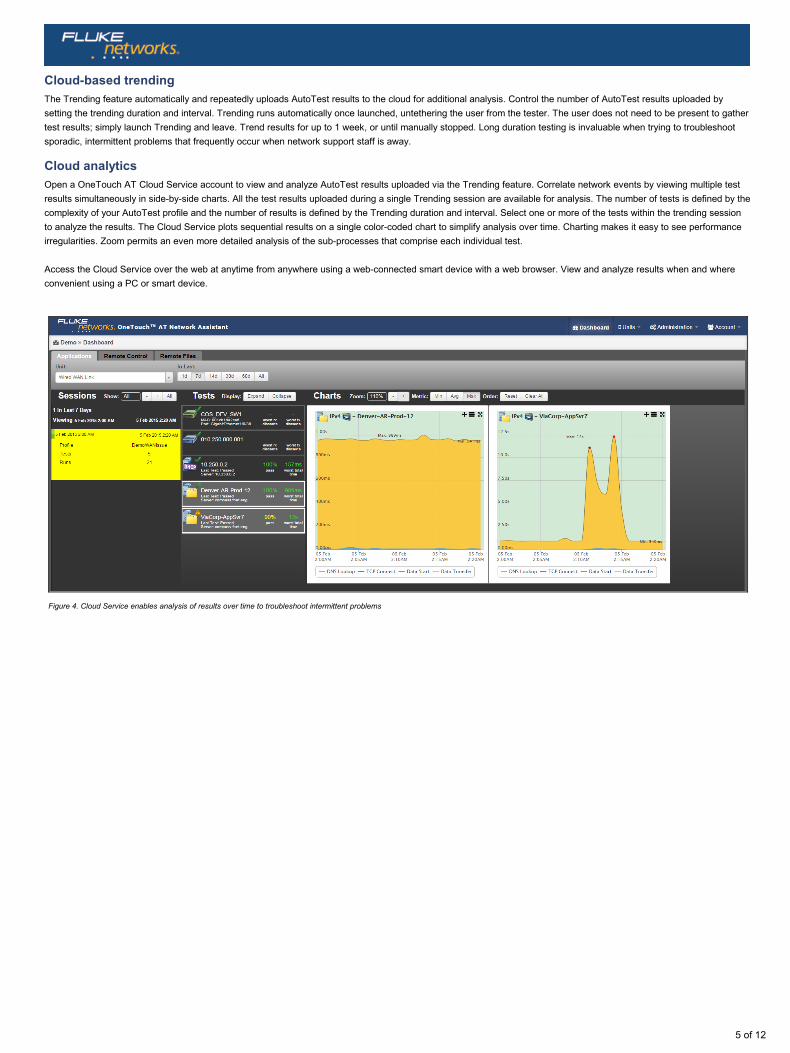
Figure 4. Cloud Service enables analysis of results over time to troubleshoot intermittent problems
5 of 12

Remote control and file accessUse the built-in RJ-45 management port or optional USB Wi-Fi adapter to remotely control the tester and access saved files. Any action that can be performed directly onthe instrument using the touch screen can be performed remotely using a PC, laptop, tablet or smart phone. Manage the tester remotely when and where convenient.Minimize the time, expense and inconvenience of traveling to the client location where the problem was reported. Webcam support enables live, remote viewing of thephysical environment near the tester.
Remotely control the OneTouch AT 10G tester and access saved files from the Cloud Service web application. Increase productivity by remotely managing the tester andviewing trended AutoTest results all from a single location. Remote management via the Cloud Service web application also allows traversal of NAT devices, which is veryadvantageous when troubleshooting outside the office.
Problem avoidance and performance optimizationCloud trending and analytics let you use the OneTouch AT 10G tester for proactive problem avoidance and performance optimization. Set a long trending duration – up toone week – and use Cloud Service analytics to identify potential vulnerabilities and performance bottlenecks. In this use model, the tester serves as a 24/7 portablenetwork probe and the Cloud Service as the analytics engine. Identify and correct potential network, service or application vulnerabilities before they become problemsthat adversely impact users. Identify performance bottlenecks and reconfigure the network to optimize end user response time.
The OneTouch AT 10G tester excels at both "firefighting" - reactive troubleshooting of both persistent and intermittent problems – and daily network management forproactively avoiding problems and optimizing performance.
Wired network discovery and analysisAutomatically discover copper and fiber-connected devices and key device properties. Select from among fourteen different sorts to obtain different views into the wirednetwork. For example, sort by IPv4 or IPv6 address to identify used and available addresses. Or sort by switch name/slot/port to understand where on the networkdevices are connected. Sort by discovered problems to quickly identify potential issues. Additional discovery-assisted analysis tools aid with troubleshooting and profilecreation. For example, the Multiport Statistics tool provides visibility into switch, router and AP port statistics including speed, duplex, slot, port, VLANs, host count,utilization, discards and errors. The Devices on Port tool provides visibility into the devices connected to an individual switch port. The Path Analysis tool provides a layer2 and 3 trace route from the OneTouch AT to a target device including time to each hop and SNMP switch and router port statistics.
Packet captureCapture network traffic when a packet-level view is required to solve a complex network or application issue. Filter the traffic to capture what is most important. Export thecapture file to a PC for decoding and analysis using protocol analysis software. Capture traffic on either the copper or fiber optic port at rates up to 100 Mbps. Optionallycapture traffic while the AutoTest runs.
6 of 12

Additional OneTouch AT 10G Network Assistant FeaturesCopper and Fiber Optic Cable TestingCopper and Fiber Optic Cable Testing Troubleshoot twisted pair cable by measuring cable length. Measure the optical power received through fiber optic links. Verify thecleanliness of fiber optic connections by viewing connector end faces with the optional FiberInspector™ USB video probe.
Troubleshoot your IPv6 NetworkEasily compare and contrast IPv4 and IPv6 network performance by viewing test results side-by-side.
Save Test ResultsSave the test results in a report to share with colleagues or outside parties. A report serves as trouble ticket documentation, as a record of historical performance forbenchmarking or as a certification report after new infrastructure deployment and turn up. Define which test results to include in the report (AutoTest, Wired Analysis,Tools Settings) and the report format (PDF, XML). Open the results in a spreadsheet for flexibility in results analysis.
Setup WizardSimply AutoTest profile creation while learning about the tester's capabilities by running the Setup Wizard. The wizard simplifies profile creation with step-by-step guidedinstructions, yes/no prompts, on-screen help and graphical progress indicators. Experienced users can bypass the wizard if desired.
Purpose-built for Field TestingThe OneTouch AT 10G Network Assistant is engineered specifically for network support professionals on the go. Useful test and management tools include a webbrowser, Telnet/SSH client, webcam support and optional fiber optic connector inspection camera. The durable platform provides years of reliable operation in toughenvironments.
Gold SupportProtect your investment with Gold Support. Gold Support benefits include Gold Cloud Service, software upgrades, unlimited priority repair service with loaner units, annualfactory performance verification, free accessory replacement and 24x7 technical support with priority members-only access numbers.
7 of 12

Technical SpecificationsGeneral
Dimensions (with module and batteryinstalled)
10.3 in x 5.3 in x 2.9 in (26.2 cm x 13.5 cm x 7.3 cm)
Weight (with module and battery installed) 3.5 lb (1.6 kg)
Display 5.7 in (14.5 cm) LCD with projected capacitance touch screen, 480 x 640 pixels
AC adapterInput: 100-240 Vac, 50-60 Hz, 1.0 A
Output: +15 Vdc, 2.0 A
Battery type Lithium ion battery pack, 7.2 V
Battery lifeApproximately 3-4 hours depending on type of usage, 4 hours to charge from 10% capacity to 90% capacity with theunit powered off
Memory
Internal: 2 GB shared between system and user files
SD card: 4/8 GB, brand and model selected for optimal performance
USB 2.0 type A port: for use with USB mass storage devices
8 of 12
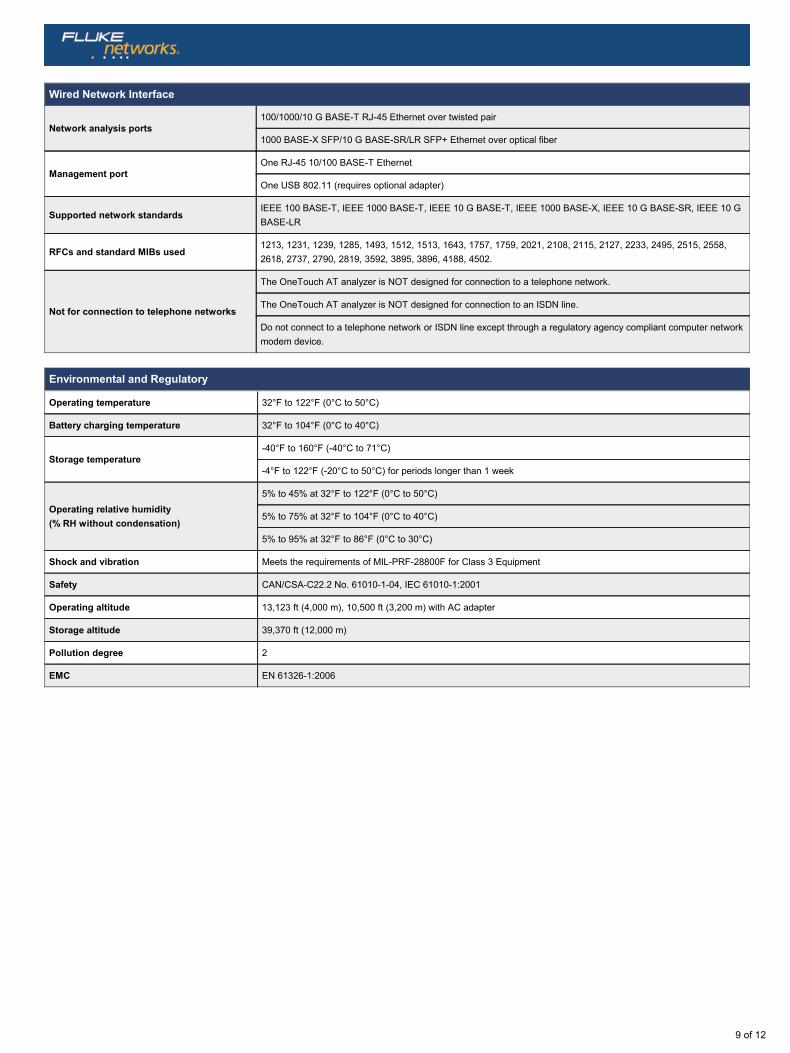
Wired Network Interface
Network analysis ports100/1000/10 G BASE-T RJ-45 Ethernet over twisted pair
1000 BASE-X SFP/10 G BASE-SR/LR SFP+ Ethernet over optical fiber
Management portOne RJ-45 10/100 BASE-T Ethernet
One USB 802.11 (requires optional adapter)
Supported network standardsIEEE 100 BASE-T, IEEE 1000 BASE-T, IEEE 10 G BASE-T, IEEE 1000 BASE-X, IEEE 10 G BASE-SR, IEEE 10 GBASE-LR
RFCs and standard MIBs used1213, 1231, 1239, 1285, 1493, 1512, 1513, 1643, 1757, 1759, 2021, 2108, 2115, 2127, 2233, 2495, 2515, 2558,2618, 2737, 2790, 2819, 3592, 3895, 3896, 4188, 4502.
Not for connection to telephone networks
The OneTouch AT analyzer is NOT designed for connection to a telephone network.
The OneTouch AT analyzer is NOT designed for connection to an ISDN line.
Do not connect to a telephone network or ISDN line except through a regulatory agency compliant computer networkmodem device.
Environmental and Regulatory
Operating temperature 32°F to 122°F (0°C to 50°C)
Battery charging temperature 32°F to 104°F (0°C to 40°C)
Storage temperature-40°F to 160°F (-40°C to 71°C)
-4°F to 122°F (-20°C to 50°C) for periods longer than 1 week
Operating relative humidity(% RH without condensation)
5% to 45% at 32°F to 122°F (0°C to 50°C)
5% to 75% at 32°F to 104°F (0°C to 40°C)
5% to 95% at 32°F to 86°F (0°C to 30°C)
Shock and vibration Meets the requirements of MIL-PRF-28800F for Class 3 Equipment
Safety CAN/CSA-C22.2 No. 61010-1-04, IEC 61010-1:2001
Operating altitude 13,123 ft (4,000 m), 10,500 ft (3,200 m) with AC adapter
Storage altitude 39,370 ft (12,000 m)
Pollution degree 2
EMC EN 61326-1:2006
9 of 12
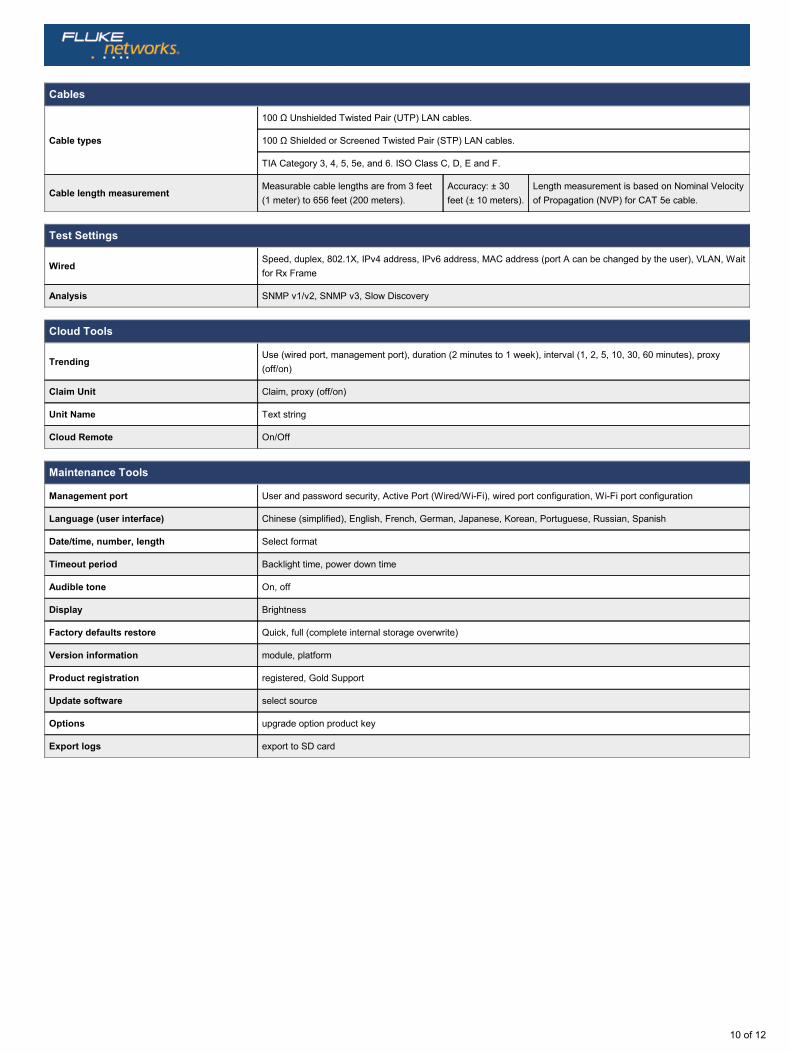
Cables
Cable types
100 Ω Unshielded Twisted Pair (UTP) LAN cables.
100 Ω Shielded or Screened Twisted Pair (STP) LAN cables.
TIA Category 3, 4, 5, 5e, and 6. ISO Class C, D, E and F.
Cable length measurementMeasurable cable lengths are from 3 feet(1 meter) to 656 feet (200 meters).
Accuracy: ± 30feet (± 10 meters).
Length measurement is based on Nominal Velocityof Propagation (NVP) for CAT 5e cable.
Test Settings
WiredSpeed, duplex, 802.1X, IPv4 address, IPv6 address, MAC address (port A can be changed by the user), VLAN, Waitfor Rx Frame
Analysis SNMP v1/v2, SNMP v3, Slow Discovery
Cloud Tools
TrendingUse (wired port, management port), duration (2 minutes to 1 week), interval (1, 2, 5, 10, 30, 60 minutes), proxy(off/on)
Claim Unit Claim, proxy (off/on)
Unit Name Text string
Cloud Remote On/Off
Maintenance Tools
Management port User and password security, Active Port (Wired/Wi-Fi), wired port configuration, Wi-Fi port configuration
Language (user interface) Chinese (simplified), English, French, German, Japanese, Korean, Portuguese, Russian, Spanish
Date/time, number, length Select format
Timeout period Backlight time, power down time
Audible tone On, off
Display Brightness
Factory defaults restore Quick, full (complete internal storage overwrite)
Version information module, platform
Product registration registered, Gold Support
Update software select source
Options upgrade option product key
Export logs export to SD card
10 of 12
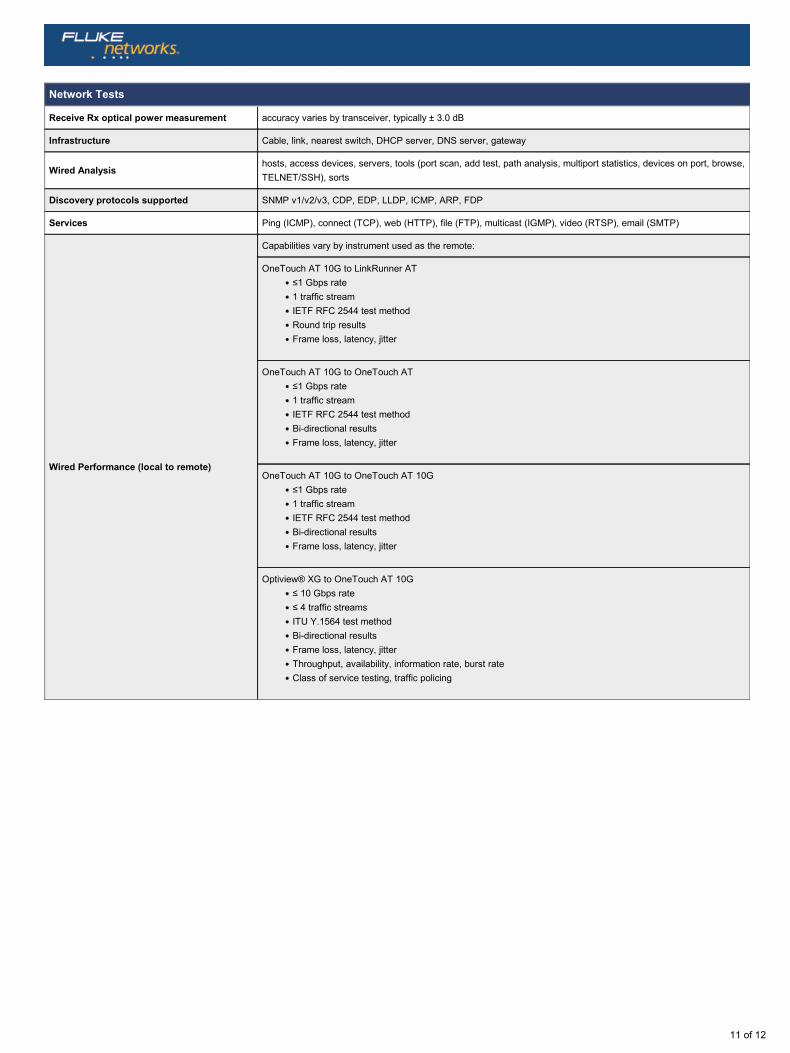
Network Tests
Receive Rx optical power measurement accuracy varies by transceiver, typically ± 3.0 dB
Infrastructure Cable, link, nearest switch, DHCP server, DNS server, gateway
Wired Analysishosts, access devices, servers, tools (port scan, add test, path analysis, multiport statistics, devices on port, browse,TELNET/SSH), sorts
Discovery protocols supported SNMP v1/v2/v3, CDP, EDP, LLDP, ICMP, ARP, FDP
Services Ping (ICMP), connect (TCP), web (HTTP), file (FTP), multicast (IGMP), video (RTSP), email (SMTP)
Wired Performance (local to remote)
Capabilities vary by instrument used as the remote:
OneTouch AT 10G to LinkRunner AT≤1 Gbps rate1 traffic streamIETF RFC 2544 test methodRound trip resultsFrame loss, latency, jitter
OneTouch AT 10G to OneTouch AT≤1 Gbps rate1 traffic streamIETF RFC 2544 test methodBi-directional resultsFrame loss, latency, jitter
OneTouch AT 10G to OneTouch AT 10G≤1 Gbps rate1 traffic streamIETF RFC 2544 test methodBi-directional resultsFrame loss, latency, jitter
Optiview® XG to OneTouch AT 10G≤ 10 Gbps rate≤ 4 traffic streamsITU Y.1564 test methodBi-directional resultsFrame loss, latency, jitterThroughput, availability, information rate, burst rateClass of service testing, traffic policing
11 of 12
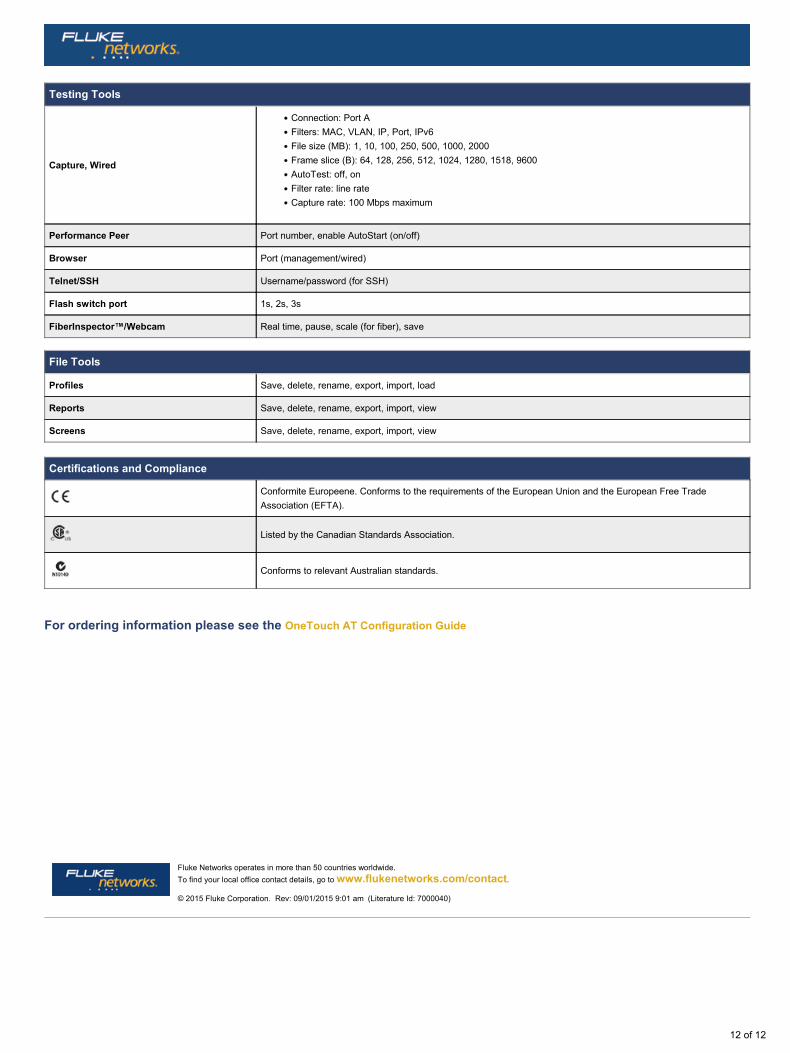
Testing Tools
Capture, Wired
Connection: Port AFilters: MAC, VLAN, IP, Port, IPv6File size (MB): 1, 10, 100, 250, 500, 1000, 2000Frame slice (B): 64, 128, 256, 512, 1024, 1280, 1518, 9600AutoTest: off, onFilter rate: line rateCapture rate: 100 Mbps maximum
Performance Peer Port number, enable AutoStart (on/off)
Browser Port (management/wired)
Telnet/SSH Username/password (for SSH)
Flash switch port 1s, 2s, 3s
FiberInspector™/Webcam Real time, pause, scale (for fiber), save
File Tools
Profiles Save, delete, rename, export, import, load
Reports Save, delete, rename, export, import, view
Screens Save, delete, rename, export, import, view
Certifications and Compliance
Conformite Europeene. Conforms to the requirements of the European Union and the European Free TradeAssociation (EFTA).
Listed by the Canadian Standards Association.
Conforms to relevant Australian standards.
For ordering information please see the OneTouch AT Configuration Guide
Fluke Networks operates in more than 50 countries worldwide. To find your local office contact details, go to www.flukenetworks.com/contact.
© 2015 Fluke Corporation. Rev: 09/01/2015 9:01 am (Literature Id: 7000040)
12 of 12