on the thermal conductivity and thermal diffusivity of
TRANSCRIPT

-I
On the thermal conductivity and thermaldiffusivity of highly compacted bentonite
Sven KnutssonUniversity of Luleå
Lulea, Sweden October 1983

J- 1
ON THE THERMAL CONDUCTIVITY AND THERMAL DIFFUSIVITY
OF HIGHLY COMPACTED BENTONITE
Sven Knutsson
Division cf Soil MechanicsUniversity of LuleåLuleå, Sweden October 1983
This report concerns a study which was conductedfor SKBF/KBS. The conclusions and viewpointspresented in the report are those of the author(s)and do not necessarily coincide with those ofthe client.
A list of other reports published in thisseries during 1983 is attached at the endof this report. Information on KBS technicalreports from 1977-1978 (TR 121) , 1979 (TR 79-28),1980 (TR 80-26), 1981 (TR 81-17) and 1982(TR 82-28) is available through SKBF/KBS.
SUMMARY
The report concerns the thermal conductivity and the
thermal diffusivity of highly compacted bentonite,
which has been suggested as embedding substance in
the Swedish concept for the disposition of highly
radioactive unreprocessed nuclear waste products.
The first part of the report describes the testing
method used, which is called the Transient Hot Strip
method (THS). By this, the thermal conductivity and
the thermal diffusivity were determined simultaneously
in a test which was performed within 10-15 seconds.
The measuring unit was a small metal strip, which was
placed in the center of the tested bentonite sample.
Due to the short measuring time (10-15 sec), the risk
of water redistribution due to thermal gradients was
reduced to a minimum. This made the method well adapted
for the determination of the thermal properties of the
moist bentonite.
The experimental set-up, including the use of the
swelling pressure oedometers in which the bentonite
samples were mounted, with the metal strip in the
center, are described.
The second part of the report, describes the experiments,
which were performed on bentonite bodies, mostly cylindri-
cal in shape with a diameter of 50 mm and a height of 20 mm,
From the tests of the air dry samples it was found
that the thermal conductivity increased as the pressure
on the sample increased. This was explained by an
improved thermal contact between the measuring metal
strip and the bentonite body at increasing pressure.
The determined conductivities were compared with the
values obtained from a theoretical model for the

j 1prediction of the thermal conductivity of moist
geological materials. The agreement was good and the
model was then used to calculate the thermal conduc-
tivity of the bentonite as water was taken up by the
sample. The experimentally obtained conductivities
during this process, agreed fairly well with the
calculated values.
At low pressures, the thermal conductivity was found
to be 0.83-1.08 W/m,K at a water content of 4.1% and
a bulk density of 1.96-2.17 t/m . At complete water
saturation, the conductivity was estimated at 1.35-
-1.45 W/m,K at the bulk density of 2.0-2.1 t/m3, being
representative for the ultimate conditions in a
repository.
The mass heat capacity of the bentonite was found to
be 0.96-1.05 J/g,K, which vas slightly higher than the
expected value that can be derived on values from tne
literature. The successfully increasing volumetric heat
capacity during water uptake was also determined and this
was predicted by the model used.

7
On the thermal conductivity and thermal diffusivity
of highly compacted bentonite
Sven Knutsson
Div of Soil Mechanics
University of Luleå
October 1983

3-
CONTENTS
1 . INTRODUCTION
2. MATERIAL
3. TESTING METHOD
4. TEST RESULTS
5. DISCUSSION
6. CONCLUSIONS
7. ACKNOWLEDGEMENTS
8. REFERENCES
Appendix 1
Appendix 2

1. INTRODUCTION
The Swedish concept for the disposition of highly
radioactive, unreprocessed nuclear waste products
implies that copper canisters containing the radio-
active material be surrounded by highly compacted
Na bentonite clay. In the repository the dense clay
separates the canisters from the rock and the thermal
properties of the clay is therefore of major concern.
The thermal conductivity of the buffer substance is
the main parameter since it controls how effectively
the heat produced in the canister is transported
through the clay to the rock. If an accurate calculation
of the time dependent temperature field around a canister
is to be performed, information of the volumetric heat
capacity of the buffer substance is needed as well.
In a porous mass the porosity as well as the water content
have a major influence on the thermal properties in addition to
the conductivity and heat capacity of the solid phase
itself. It is therefore of great importance to know how
the properties change as water is taken up as well as
the rate of this process.
During the initial phase of deposition, the buffer
substance of bentonite will have a moderate water
content of 8-13%. When the repository is closed water
migrates from the rock into the clay in which the water
content increases. This yields successively higher values
of the thermal parameters thus implying decreasing
temperatures in the vicinity of the canister. This means
that the initial stage of deposition will be the least

ö
favourable; i.e. a low water content and thus low
thermal conductivity and the highest temperatures.
The scope of this study has been to determine the
thermal conductivity and the thermal diffusivity
of highly compacted bentonite when water is taken up
and the water content increases.
A second purpose has been to compare theoretically
computed values of the thermal properties and experi-
mentally determined equivalents.

J
2. MATERIAL
All the tests in this study have been performed on
samples of highly compacted bentonite. The clay
material consisted of granulated Na bentonite type
MX-80 (American Colloid Co). The granulometric
composition was characterized by a minus 2 ym content
of approximately 85% and a montmorillonite content of
about 80-90% of this fraction [5].
From the air-dry material high density clay bodies were
made by compressing the powder under high pressure
(50 MPa). The procedure yielded almost homogeneous bodies
with preset densities. Most test samples had a cylind-
rical shape with a diameter of 50 mm and a height of
10 mm, while some were rectangular. These were made by
cutting big blocks of compacted bentonite into pieces
of desired shape.
The initial water content of the samples varied between
4% and 14% anc
1,96-2,17 t/irT
4% and 14% and the bulk densities were of the order.3

3. TESTING METHOD
The testing method used for the determination of the
thermal properties (the thermal conductivity and the
volumetric heat capacity), is a newly developed technique
called Transient Hot Strip method (THS). It was developed
at the Department of Physics at the Chalmers University
of Technology and is described in detail in [1] and [2].
The main advantages of the THS-method compared to other
techniques are:
1. The measuring procedure is very fast, each test is
performed within 10-15 seconds. This reduces the risk
of water redistribution due to thermal gradients to a
minimum. This is of special concern, when tests are
made on moist samples.
2. The test is developed for simultaneous measurement of
the thermal conductivity i\) and the thermal diffusivity
(a), i.e. the quotient between thermal conductivity
and volumetric heat capacity.
3. The temperature increase in the measuring unit is
small, below 0,5 K. This reduces the temperature
gradients in the sample to low values.
4. The measuring unit consists of a thin metal strip
with small dimensions. This makes it possible to
measure the thermal properties of small objects.

3.1 Testing principle
The testing principle, as well as the exact mathematical
deductions are given in detail in [2]. In this report
just a brief description of the testing technique will
be given.
A very thin metal film is brought in contact with the
investigated material. The metal fi?m is then used as
a plane heat source and as a resist, nee thermometer.
When testing solid material the metal strip is pressed
between two pieces of the material. The two pieces must
have at least one flat surface each, so the metal strip
is approximately a plane heat source. During the test,
a constant electrical current is supplied to the metal
film. Thus, heat is produced according to the electrical
resistance in the strip and consequently its temperature
increases. This causes an increasing electrical resistance
of the strip, since this is dependant of the temperature.
This is monitored as a subsequent voltage increase between
the two ends of the strip.
The temperature increase of the metal strip is due to
how fast the heat is conducted into the surrounding
material. If this has a high thermal conductivity, heat
is carried away quickly, yielding a low temperature
increase and thus a low value of the monitored change of
the electrical voltage. On the contrary, if the thermal
conductivity has a low value the temperature of the metal
strip is increased to higher values giving rise to large
changes of the monitored voltage change. Consequently,
the change of the electrical voltage between the two ends
of the metal strip, can be directly related to the thermal
properties of the material surrounding the strip.

J 1The electrical current is supplied to the metal strip
during 5 to 10 seconds and the voltage between its ends
(U ) is simultaneously recorded by a digital voltmeter.
The data recorded is directly transmitted to a computer
where all the calculations are performed. The thermal
conductivity and diffusivity are thus measured within a
very short time. It is of course required, that the
electrical current, the resistivity and the dimensions
of the metal film are all known with sufficient accuracy
The electrical resistivity of the metal strip changes
with the time after the onset of the heating, according
to equation (1)
P(T) = PoM+a(T(0,y,t)-To) (1)
where
is the resistivity of the metal strip
at the temperature T , i.e. before the
test
0(T) is the resistivity at the temperature T
is the temperature dependence of the
resistivity of the metal used for the
strip
T(0,y,t) is the temperature at the surface of
the metal strip at the position y at
the time t

T
dy
Fig. 3.1 The metal strip with the coordinate system
used for the mathematical deductions
Since the resistance of an element of the strip is given
by eq. (2), the total resistance of the strip can be
expressed by (3)
dR(T) = p(T)h/vdy (2)
where
h is the total length of the strip
v is the thickness of the strip
R(t) =
d2
Rofi +!{<T(0fy,t)-d2
-To)dy (3)
P(To) - h
vd (4)

58
R(t) is the total resistance of the metal strip
at the time (t) after the onset of the
current
The integral divided by the width (d) in equation (3), can
be regarded as an average temperature rise in the strip at
time t (AT ) . It should be noticed, however, that equation
(3) is valid only if the value of a is small and the
temperature increase of the strip is restricted to low
values. A typical maximum increase is 0,5 K. From [2] it
is concluded, that a can be regarded as sufficiently small
if it is smaller than 5«10 K " 1 .
By using Ohm's law, with a constant current through the
strip (I) the voltage between the two ends of the strip is
now given by eq. (5)
U(t) = U (1 + a AT ) (5)
where
U is the initial voltage at time t=0
By solving the differential equation of heat conduction,
with appropriate boundary and initial conditions, a value
of AT can be obtained, /nalytical solutions for many
problems are given in 13], from which the present solution
was derived.
By introducing AT in equation (5), the final expression
for the total variation of the electrical voltage between
the two ends of the metal strip yields eq. (6).

alUU(t) = U^ | 1 + — f (B/t)
2hA/?1 (6)
B =2,'a (7)
where
a = thermal diffusivity
h = the length of the metal strip
d = the width of the strip
The function f(B/t) can be computed for given values of B
and t according to (8)
f (B/t) = B/t erf - exp
• 1 f-Eif^l ^I V ^ /• / 4 * 7 T <• B̂ t'
(8)
in eq. (8)
2 z -v2erf(z) = — / e x dx
/i o(9)
-1Ei(-z) = - / x exp(-x)dx (10)
Eq.(6) can be put in the form of ei.(11)

310
U = U + C f(B/t)t o (11)
in which
C =alU
2h>.»/ir(12)
The msaning of eq. (11) is, that for the right value of
the factor B there will be a linear relationship between
the voltage U and the function f(B/t).
In a test, where successive readings of the voltage (U )
are recorded at different times (t), it is possible to
find the right value of B by using an iteration procedure.
The constant value of B is thus changed until the correla-
tion coefficient as calculated from U and f (B.̂ t) has reached
its maximum. From this value of B it is possible to determine
the thermal diffusivity by using eq. (7). The thermal
conductivity is given by eq. (12), i.e. the slope and the
intercept of the line with the highest correlation
coefficient, since all the other parameters are known.
It should be noticed, that a main requirement for getting
the two thermal properties out of one and the same test is
that the metal strip has a finite width.
If this is very large, there will be a thermal gradient
just in one direction and consequently the test yields
information of the thermal conductivity only. On the
other hand, if the strip is very narrow, approximating a
very thin wire, again we will have a thermal gradient in
just one direction. The latter condition has been widely
used in various methods based on transient heat flow,
for the determination of the thermal conductivity. Two
well-known methods based on the assumption of one thermal
gradient only are the heating wire technique used in [4]
and the thermal probe method.

7
3.2 Experimental procedure
The experimental layout of the electrical circuit was
designed at the Department of Physics at Chalmers University
and it is described in detail in [3], In Fig. 3.2 the
circuit is schematically illustrated. The main components
are: S - the sample with its metal strip, P - the power
supply, R - standard resistor used for the measurement of
the electrical current, R - current limiting resistor and
R, - balancing resistor.
Fig. 3.2 Layout of the electrical circuit used for the
THS-tests.
The resistor R has a resistance about 100 times larger than
that of the metal strip. When the latter is changed
during the test, no corresponding change of the current will
take place, since the total resistance in the measuring
circuit will be unchanged due to the high constant resistance
of R.

12
U and V are both digital voltmeters, V being used for
measuring the current and U for the detection of the
voltage change in the metal strip. Since the changes are
very small (10 to 10 V) a differential amplifier with
an offset voltage is used in order to get as high precision
as possible in the measurements. The digital voltmeter V
is directly connected to a computer (HP 9825A). By this,
the recording procedure is controlled and the recorded
data is stored.
The recorded values of U is then combined with different
values of the function f(B/t) until the highest coefficient
of correlation is reached. From the slope and the intercept
of the straight line thus obtained the thermal conductivity
and the thermal diffusivity is calculated.
The small dimensions of the metal strip has made it possible
to perform the measurements of the thermal properties of the
bentonite, confined in a swelling pressure oedometer.
The strip, having a length of 40 mm and a width of 3 mm
has been placed between two halves of precoirpacted
bentonite, which were then applied in a swelling pressure
oedometer before the start of the test, see Fig. 3.3.
Much effort was put to the arrangement of a leak-free
passage for the electrical connections to the metal
strip, because no leakage of water or clay particles
from the bentonite sample was accepted. This would have
had caused changes in the swelling pressure in the
bentonite.
During the test, water was let in from above only, since
the inlet at the lower end of the oedometer was used for
the electrical connections. The determination of the swelling
pressure, which was made parallel to the recording of the
thermal properties, followed the same procedure as descri-
bed in [5], i.e. the sample was confined in the cylind-
rical space and the total volume was kept constant
throughout the test.

13
WATER INLET
METAL STRIP
ACRYLICPLASTIC
ROD OF BRASS
BOTTOM PLATE OFSTAINLESS STEEL
Fig. 3.3 The swelling pressure oedometer with the metal
strip in the centre of the bentonite body. The
arrangement for the lead-through of the
electrical connectors are shown as well.
The tested bentonite samples had a diameter of 50 mm and
a height of 20 mm.
As shown in Fig. 3.3 the electrical connections to the
metal strip consisted of two rods of brass which were
screwed through plugs of acrylic plastic glued to the
bottom plate of stainless steel. This yielded a perfect
sealing against leakage of water and the two rods also
supplied good supports for the metal strip which was
soldered to the rods.

14
4. TEST RESULTS
A large number of tests have been performed in order to
study the variation of the thermal conductivity and the
thermal diffusivity of the highly compacted bentonite
(MX-80), when the densities and water contents were
varied.
The experimental technique used in this work had the
advantage of being fast in operation once the test equip-
ment had been set up. This made it possible to make several
test within a restricted period of time, yielding a
statistical mean value and coefficient of variation for
the determined thermal properties at each testing condi-
tion. Thus, each value of the thermal conductivity and
diffusivity reported here, is a mean of 4 to 10 individual
measurements.
Most of the tests were carried out with the bentonite
samples constrained in the swelling pressure oedometers.
However, four complementary tests were carried
out on non-constrained blocks of precompressed bentonite.
For each test, two blocks were used being 0,08x0,04x0,015 m
in size. The blocks were pressed together during the test
by the use of screw-clamps, with the measuring metal strip
in between.
The results from these tests are given in Table 1 in which the
thermal conductivities (X) and the thermal diffusivities
(I) are calculated mean values. For each test the
coefficients of variation (S, and S ) are given as well,
i.e. the ratio of the standard deviation and arithmetic
mean values.
From the obtained thermal conductivity and thermal
diffusivity, the volumetric heat capacity can be calculated
by using eq (13).

15
\ = a- C (13)
where
Test
C = volumetric heat capacity (J/m ,K)
a = thermal diffusivity (m /s)
Table 1. Thermal properties of highly compacted bentonite
(non-constrained samples)
w
A
B
C
D
(t/m3)
2,17
2,12
2,11
2,11
(%)
11,0
13,9
12,1
9,5
(W/m,K)
1,012
1,145
1,081
1,052
(10 m /s)
4,075
4,281
4,250
4,151
(10 J/m ,K)
2,483
2,687
2,541
2,534
(%)
0,52
0,32
0,26
0,50
2,7
3,2
1,6
2,1
From Table 1 it is clear that the uncertainty in the
determination of the thermal diffusivity is larger (S ~2%)
than that of the thermal conductivity (S,<0,5%). The reasonA
for this is the experimental procedure, which is known to
give the smallest variation of the thermal conductivity,
see [2], This is due to the fact that the slopeof the curve U =U +C f(B/t) is used in this case, while the
t o
diffusivity is calculated from the factor B in eq. (7). This
yields the somewhat larger variation for the latter parameter.
The highly compacted bentonite mounted in the swelling
pressure oedometers had an initial water content of 4.2%
in four of the tests. This is a low value but it was chosen
in order to get a clear picture of the change of the thermal
conductivity when water was let into the sample. The bulk
densities were different in the four tests, the major
characteristics being shown in Table 2.
16
Table 2
Sample
1
2
3
4
0
(t/m3)
1,971,962,092,17
w
(%)
4 , 2
4 , 2
4 , 2
4 , 1
Porosityn
(%)
28,729,024,321,3
When water is let into the oedometer, it is taken up by
the bentonite and consequently the water content increases.
At the same time a swelling pressure will develop. It is
reasonable to believe that these two effects will increase
the recorded thermal conductivity of the bentonite. The
increasing water content will increase the thermal
conductivity since water has a higher thermal conductivity
than the successively replaced pore air. The swelling
pressure will increase the recorded thermal conductivity,
mainly by the following three effects:
a successively better thermal contact will develop
between the measuring unit, i.e. the metal strip,
and the surrounding bentonite blocks when the pressure
is increased. Consequently, the evaluated conductivity
is increased too.
small cracks within the precompresseu blocks will be
closed, when the pressure is increased. Thus a higher
thermal conductivity will be obtained.
The bentonite blocks are made of a granulated powder
and the contacts between the individual granules
might also be better as the pressure increases.
Consequently, the thermal conductivity of the block
increases.

17 1In order to quantify the pressure dependent part of the
increase of the thermal conductivity, this was determined
at a successively increased pressure. The tests were made
on samples 1-4, after mounting them in the oedometers
but before water was let in. The pressure was externally
applied to the samples by putting the oedometers in a
compression machine, in which the force could be regulated
with high precision. When a given pressure was reached
measurements of the thermal conductivity and diffusivity
were performed. The detailed tests results, as well as
the coefficients of variation in each test, are given in
Appendix 1. Fig. 4.1 shows the evaluated mean values of
the thermal conductivity as a function of the external
pressure.
In all the four samples, there is an obvious tendency of
a higher value of thermal conductivity (X) when the
pressure is increased. The increase of the conductivity is
0,18 - 0,28 W/m,K as the pressure is raised from 0 to
50 MPa. The lower value (0,18) is obtained from sample 4,
while sample 1 and 2 have the higher value. Sample 3 has
an intermediate increase of 0,22 W/m,K.
After the pressure had been increased to 50 MPa, it was lowered
stepwise to zero again. During this operation the thermal
conductivity and diffusivity, were determined at the same
pressures as during the pressure increasing cycle. Again,
practically the same values were obtained, which indicates
that no hysteresis is present. This also indicates, that
no permanent structural change has taken place, since it
probably should have caused a permanent change of the
conductivity. Consequently, the increase of the conductivity
has a temporary character mainly caused by an improved
thermal contact between the metal strip and the surrounding
bentonite. To some extent the closure and re-opening of
microcracks car have

18
1.30
1.20
1.10
1.00
0.90
0.80
>y
**
/ /
/ // /
/ /
/. - • •
/ '
*
v
^^ 4
20 40 60
MPa
Fig. 4.1 The evaluated thermal conductivity of highly
compacted bentonite for different external
pressures. The tests are made before water
is let into the oedometers.
19
had the same effect. However, these two effects cannot
be separated from each other in the present study.
As can be seen in Appendix 1, the coefficient of variation
of the thermal conductivity tests was very low <1%.
In most of them this coefficient was actually lower
than 0.6%. In the determination of the
thermal diffusivity a larger scatter was found between
the individual measurements in each test. Here,the
coefficient of variation was found to be lower than 5%;
typically about 2%, which again is higher than that for
the conductivity, cf. test A - D in Table 1.
In Fig. 4.2 the thermal conductivity obtained for
sample 1-4 have been replotted as a function of the bulk
density. The vertical line for each sample, indicates
the variation of the thermal conductivity as the pressure
is changed. The lower end of the line gives the thermal
conductivity at the pressure 0 MPa, while the upper end
gives the value obtained for 50 MPa.
As shown in Fig. 4.2 the thermal conductivity increases
with the bulk density for a constant water content. This
is what could be expected, since both the dry density and
the degree of water saturation are higher for sample 4
than for those with lower densities. In addition two
curves A and B are shown in Fig. 4.2, curve A illustrating
the thermal conductivities which can be calculated by the
use of the mathematical model presented in [6] and [7].
This model gives the thermal conductivity of a non-
-saturated soil sample by the use of eq. (14)-(17)

20
2.0 2.2
P (%••)
Fig. 4.2 Thermal conductivities of highly compacted
bentonite with a water content of 4,2%.
The vertical lines indicates the dependency
of the external pressure.
= \ * K (A -\ )o e 1 o
(14]
and
-2,10,034 n
= 0,56n • 2 1' n
Kg = 1 + log S r
(15)
(16)
(17)

21
where
n = porosity
S = degree of water saturation
Eq. (15) gives the conductivity of a completely dry
material, while (16) gives the corresponding value for
a water saturated sample. Fig. 4.2 shows that the model
yields acceptable predictions of the conductivity for
compacted bentonite with low degrees of water saturation,
but it has a tendency to overestimate the conductivity at
higher values of the bulk density.
Another model, presented in [4] is used in comparison,
and the values given by this, are shown by curve B in
Fig. 4.2. However, this model underestimates the experi-
mentally obtained values systematically by about 25 percent,
From the thermal conductivity and diffusivity obtained
from the tests with different external pressure on the
bentonite body, the volumetric heat capacity can be
derived by using eq. (13). This value if of course highly
influenced of the water content and the densitv of the
sample and therefore it is practical to deal with the
values of the specific heat, i.e. the mass heat capacity
of each component. Eq. (18) gives the relationship between
the volumetric (C) and mass (c ) heat capacities with
respect to the water content.
^ T (cw
w) (18)
where c = mass heat capacity of water (4,2 J/g,K)
w
P
= water content
= bulk density

22
The evaluated data of the mass heat capacities are given
in detail in Appendix 1. In Fig. 4.3 the heat capacities
are plotted as a function of the applied pressure.
1.2
0.8
(J/9.K)0,4
•A
1 |
•0
•
C
1
o•1
12345
20 40
MPa
60
Fig. 4.3 The mass heat capacity (cs) of highly compactedbentonite at different pressures.
At zero external pressure, the mean value of all the
tests performed is 0,86 J/g,K. This is in accordance with
data reported elsewhere for clays and clay-shales, i.e.
0,81-0,87 J/g,K, see [7] anc [8]. However, the heat
capacity seems to be pressure-dependent and at higher
pressures it increases to about 1,04 J/g,K. This value is
reached at 20 MPa and for pressures exceeding this, no
change can be detected.
36
23
After the initial tests at the low water contents in the
samples, water was let into the oedometers through the
upper pistons. This made it possible for the bentonite
samples to take up water, thus yielding successively
larger degree of water saturation. During this process
a swelling pressure was developed since the samples were
totally constrained. However, during this process small
internal displacements took place within the bentonite
body, although the overall volume was practically kept
constant. The movements were caused by the homogenizing
process that ultimately leads to complete water saturation.
However, small displacements caused serious damage in the
experimental set up, since the metal strips mounted in
the center of the samples were very fragile. Consequently,
most of the metal strips were broken and thus no
measurements of the thermal properties could be
carried out when the water content was increasing.
Only one test out of the total number of 12 could be
successfully completed. Two additional tests could be pursued
during a short period of time, while the rest of the
tests were unsuccessful for the reason described.
In the successful test (sample 4), the increase of the
thermal conductivity as water was taken up, could be
followed for about 13 days (305 hours) before the metal
strip was broken. The results are shown in Fig. 4.4 as
well as in Appendix 2.
As shown in Fig. 4.4 the conductivity increased from the
initial value of 1,08 W/m,K for the "dry" sample (WQ=4,1%)
to the final value of 1,59 W/m,K. This value was reached
after about 250 hours at which time the sample was almost
completely saturated.
37

24
By using eq. (16) the conductivity of the water saturated
sample is found to be 1.55 W/m,K, i.e. a difference
of about 0,04 W/ir.,K between the recorded and calculated
values which corresponds to a deviation of 2,5% of the
measured value.
A theoretical prediction of the successive increase of
the conductivity in the bentonite has been carried out
for comparison with the experimentally obtained values.
The calculations were based on the assumption that the
water migrated into the bentonite in the form of a
diffusion process with the diffusion coefficient 4-10 m /s,
[9]. The upper boundary condition was a constant water
content, corresponding to a complete water saturation in
this samplejno 4, W =10,2%. At the bottom of the sample
a condition corresponding to a free boundary was used. The
latter was utilized since no flow of water could take
place perpendicular to this lower end of the sample.
The increase of the water content in the center of the
sample, i.e. where the metal strip was placed, was then
determined by solving the diffusion equation.

I
25
1.80,
1,60 -
1.40
1.20
1.00
1
yT •-'
• •""/ /
-^*» - • -
- • * •
100 200
TIME (h)300 400
Fig. 4.4 The successive increase of the thermal
conductivity of highly compacted bentonite
as water is taken up. Water was subjected
to the sample from the top side only. The
broken line represents the calculated
values.

326
For sample 4, the calculated water contents are shown
in Table 3.
By the use of these values and eq- (14)- (17) the thermal
conductivities at different times after the inlet of
water could be calculated.
Table 3 Calculated water contents in the center of
sample 4.
Time
(hours)
0
13,9
27,8
41,7
55,6
83,3
111,1
138,9
166,7
194,4
222,2
250,0
Water c
%
4,1
4,8
5,6
6,3
6,8
7,6
8,2
8,7
9,0
9,3
9,5
9,7
The results are shown in Fig. 4.4 and an acceptable
resemblance is found between the calculated and recorded
thermal conductivities.
Fig. 4.5 and 4.6 show the corresponding increase in
thermal conductivity for the two samples 5 and 6
respectively.

27
1.80
1.60
1.40
1.20
1.00
EXP.
/
I
COMPUTEDiL.
Fig. 4.5
100 200
TIME
300 400
(h)
The recorded and calculated increase of the
thermal conductivity for sample 5. The
bentonite was subjected to the water at
time 0.
In sample 4 the swelling pressure and the conductivity
were recorded simultaneously and Fig. 4.7 shows the
relationship between the two parameters. As can be seen
in Fig. 4.7 the conductivity increases with the swelling
pressure, which is logical since the pressure increase
is caused by the water uptake, which also increases the
conductivity.
28
1.30
0.30100 200
TIME (h)
300
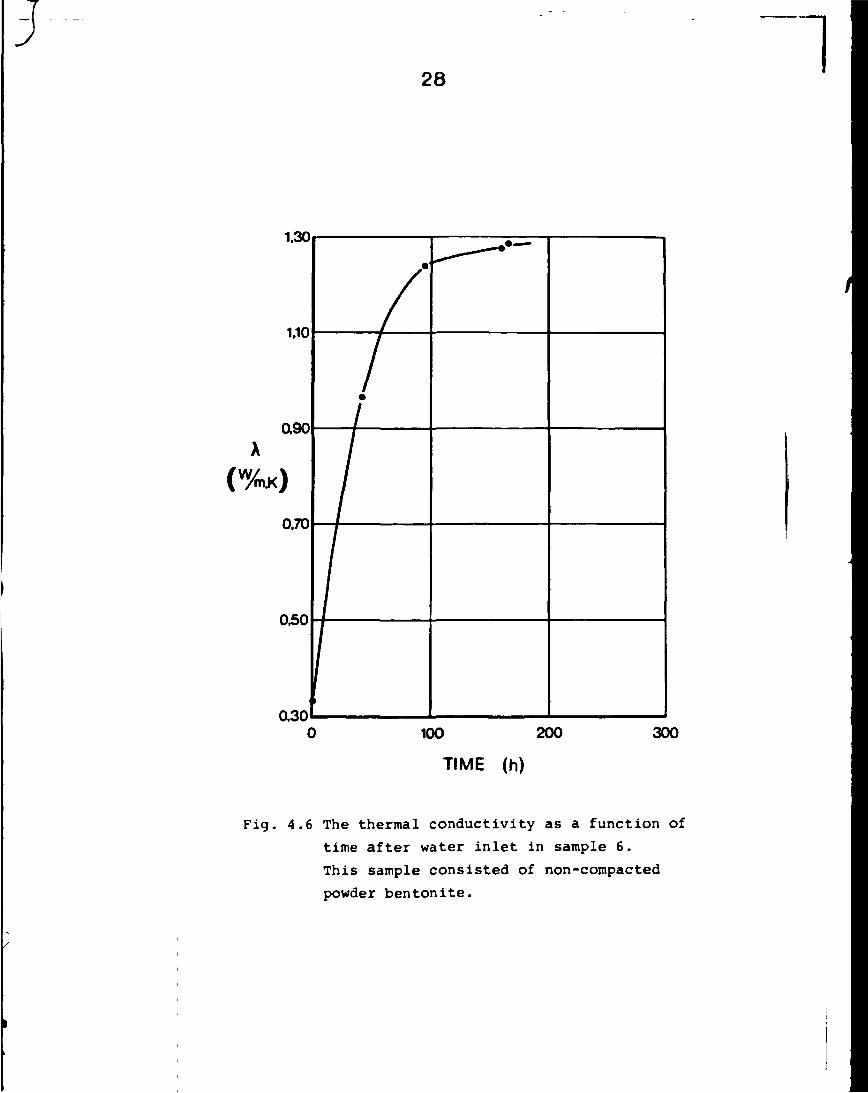
Fig. 4.6 The thermal conductivity as a function of
time after water inlet in sample 6.
This sample consisted of non-compacted
powder bentonite.

29
1.80
1.60
1,40
1.20
1,00
>
20 40 60 80 100
(MPa)
Fig. 4.7 The thermal conductivity as a function of
the swelling pressure in sample 4. The solid
line represents the pressure dependence of
the "dry" sample, i.e. before water uptake.
If the increase of the conductivity due to pressure
increase only, i.e. without any water uptake present,
is taken into account it can be concluded that the
conductivity in the swelling bentonite in this test
was increased by 0,35 - 0,40 W/m,K due to water uptake.
Since the thermal diffusivity was determined at the same
time as the thermal conductivity, it was possible also
to determine the successive increase of the volumetric
heat capacity as water was taken up by the bentonite.

30
Again, this was only possible for sample 4 for the reason
given earlier.
Fig. 4.8 shows the volumetric heat capacity as a
function of the time after water was let into the sample.
As expected a successive increase was found as water was
taken up. The heat capacity increased from 2,3'10 J/m ,K
for the "dry" sample to about 3,2*10 J/m ,K at water
saturation (W~10,2%).
4.0
3.0
2.0
I
100 200
TIME (h)
300
Fig. 4.8 The volumetric heat capacity as a function
of the time after the water inlet into the
oedometer. ( • ) .
Calculated values are shown as well (O) .
By using the same water contents as derived in Table 3
the theoretical increase of the heat capacity can be
calculated by using eq. (18). These values are shown
in Fig. 4.8 in addition. The calculations are based
on a mean mass heat capacity of 1,05 J/g,K, which is

31
given by Fig. 4.3. There is a close resemblance between
the recorded and calculated values before about ICO
hours have passed. After this time the recorded values
are higher, but the scatter increases as well. The
latter can be explained by the
experimental procedure, which is less accurate in the
determination of the heat capacity than in the thermal
conductivity. The high recorded values after about 100
hours are all connected with high coefficients of
variations, typically above 10%. Taking this into
account, the calculated values in all the cases lie
within one o-bound of each recorded value. However,
at zero time, a discrepancy between the recorded and
the calculated values still exists but this is explained
by incomplete thermal contact between the metal strip
and the bentonite. The relationship is clearly shown
in Fig. 4.3. At zero external pressure the mass heat
capacity is about 0,86 J/g,K giving a theoretical
volumetric heat capacity of 2,15-10 J/m ,K. This
value should be compared to the somewhat larger
recorded value of 2,26-2,31*11
beginning of the actual test.recorded value of 2,26-2,31•1 O6 J/m3,K at the

32
5. DISCUSSION
The thermal conductivity of highly compacted bentonite
has been investigated as a function of the water
content and the bulk density. This has been done by
others, recently by Kahr et. al [4] and earlier by
the author [6]. In the different investigations different
testing methods were used. In [6] a radial stationary
method was used giving a thermal conductivity of about
0,75 W/m,K for a sample characterized of p=2,02 t/m
and w=11%.
In the work by Kahr et. al [4]an instationary heating
wire technique was used. The non-stationary method
guaranteed, that no water redistribution due to thermal
gradients took place during the test since the
test is fast compared to the stationary heat flow methods.
A third method is used in this work. Here a metal strip
is place between two halves of the tested material. The
strip is very small and can be placed in small volumes.
This made it possible to mount the strip within a swelliny
pressure oedometer. The continuous change of the thermal
conductivity as water was taken up could thus be detected.
No water was redistributed during the test, since the
measuring operation was finished within 10 seconds, and
the two non-stationary methods should therefore yield
comparable results.

j33
From all the tests performed by Kahr et. al [4] an
empirical relationship was derived giving the thermal
conductivity of bentonite for different bulk densities,
water contents and temperatures. Values obtained by this
relationship have been compared to the experimental values
presented in this report.
The theoretical model for the thermal conductivity
given by eq. (14)-(17) and in [6], has also been used.
This model was primarily derived for calculating the
thermal conductivity of natural geological deposits.
However, it has proved to be applicable to many soil
materials and it is therefore reasonable to believe,
that it also models the conductivity of the bentonite
with reasonable accuracy.
In Fig. 5.1 all the experimentally obtained thermal
conductivities from the present study have been plotted
together with the theoretically deduced values. Both the
described models were used.
From Fig. 5.1 it is clear that the model proposed by
Kahr et. al [4] underestimates the thermal conductivity.
This tendency is most pronounced for the constrained samples
where they were subjected to large external pressures,
samples 1-4. In the samples where the bentonite bodies
were just kept together by a clamp with the metal strip
in between, the calculated values were in closer
accordance with the recorded values. The latter
experimental procedure was similar to that used in [4]
and it is therefore believed, that the increase of the re-
corded conductivity with increased pressure is due to an im-
proved thermal contact between the strip and the surround-
ing sample. Consequently, when the pressure is low this
contact is incomplete, leading to recorded values of the

34
• 20%O 2.0Hl(XDCO
OJ
1.0
0.0
/Avt/
-20%
0.0
COMPUTED
10 2.0
X
Fig. 5.1 Comparison between the experimentally obtained
thermal conductivities and those calculated
by the use of two different theoretical models.
O represents values obtained by the model
given in [4]
• represents values obtained by the model
presented in this work eq. (14) — (17).
conductivities which are too small. Since the empirical
model used in [4] is based on conductivities obtained
fiom tests where the pressures on the samples have been
low, it is logically explained that the model underestimates
the values of constrained samples. The latter values are
approximately 1.5 times higher than those yielded by the
empirical relationship in [4].
The model presented here, eq. (14)-(17), and in [6] is
in close agreement with the conductivities obtained from
the constrained samples, but it slightly overestimates

35
the conductivities in the samples with low external
pressure. The overestimation is due to incomplete
contact between the metal strip and the sample. This means
that the latter model, at present, seems to be the
best one for calculating the conductivity in highly
compacted bentonite. The model also gives a good
agreement between the thermal conductivity and the
time, when water is successively taken up by the
bentonite, see Fig. 4.4.
It should be added here, that the influence of pressure
on the resistivity of the metal strip has been determined
as well. This was made by using data from a test on sample
1. In this test, the resistance in the metal strip, which
was mounted in the oedometer, was determined at different
pressures and temperatures. From the measured resistance
it was then possible to compute the resistivity of the
metal strip at different pressures. It was shown that
the resistivity was practically insensitive for the
pressures within the actual range, see Table 4. The deter-
mined resistivities were also close to the value which
was used in the computations of the conductivities in the
different tests, i.e. ct = O. 00348 K~1.
Table 4. Computed resistivities of the metal strip
Pressure Resistivity (a)
(MPa) (K~1)
0
10
20
30
40
50
0.00360
0,00352
0,00349
0,00331
0,00339
0,00330

36
The experimental method used in [6] gave conductivities
which were lower than t .ose which could be computed by
the use of eq. (14)-(17) and the equation given in [4].
The main reason for this is the incomplete thermal
contact between the sample and the heating element in
the center. However, the use cf such an experimental
procedure always yields conductivities which are lower
than the "true" ones. In the application of the bentonite
which is discussed here, i.e. as a buffer mass substance
in a repository for nuclear waste, this will yield
computed temperatures around a canister which are higher
than those arising in a real repository. This means, that
the conductivity obtained in this way will be on the "safe"
side.
The thermal conductivities of highly compacted bentonite,
which are discussed here, are all representative for con-
ditions at room temperatures, i.e. about 20 C. At elevated
temperatures the conductivity increases with the temperature
and the dependency of this is given by eq. (19).
(19)
where thermal conductivity at the temperature T_
thermal conductivity at the temperature T1
parameter for the temperature dependency
In Table 5 it is shown some data of the factor B in highly
compacted bentonite for different temperature intervals.
The value of this factor is in the range of 0.06 - 0.17-10
°C , implying an increase of the conductivity with
3-8.5 percent if the temperature increases with 50 C.
-2

37
Table 5. The temperature correction factor for the thermal
conductivity in compacted bentonite.
RefMaterial
HCB M>-80
p=2.02 t/m3
w=11%
HCB Mx-80
p = 2.0 t/m3
w=10%
Tempera
58-43
73-58
73-43
70-50
90-70
90-50
0.09
0.17
0.14
0.06
0.06
0.06
1
1
1
1
1
1
0
o"2
o"2
o"2
o"2
o'2
[6]
[6]
[6]
[4]
[4]
[4]

/
38
CONCLUSIONS
The thermal conductivity of the highly compacted
bentonite can at about +20 °C be computed by the
use of eq. (14)-(17) .
Conductivities calculated by these equations are
representative for bentonite bodies which have
good thermal contact with its surroundings.
The model is well describing the increase of the
thermal conductivity as water is taken up.
The volumetric heat capacity can be computed by
eq. (18) as water is taken up.
The mass heat capacity of the bentonite is, when
the thermal contact is good, in the range of
0,96 - 1,05 J/g,K.
If the thermal contact is incomplete, i.e. at
low external pressures, the corresponding value
is 0,80 - 0,87 J/g,K.
By the use of the model described and the tests
performed the thermal conductivity of the
completely saturated bentonite with the bulk
density of 2,0 - 2,1 t/m can be estimated to
1,35 - 1,45 W/m,K. This is valid at room
temperature (+20 °C).
At higher temperatures the thermal conductivity will
have a higher value; this increasing with about
0.1 percent per C.
The volumetric heat capacity for the saturated
bentonite with the bulk density 2,0 - 2,1 t/m
can be computed to 3,10'106 - 3,40-106 J/m3,K.

39
7. ACKNOIVLEDGE.MENTS
The author wishes to express his special thanks to
Dr. Ernest Karawacki, Dept. of Physics, Chalmers Uni-
versity of Technology, who made possible the use
of the electronic equipment involved in the THS-method.
He was also responsible for some of the computer
programs which were used in the present study.
Also, the author is very much indebted to Mr. Sven Juhlin
and Mr. Lars Vikström, both at the Division of Soil Mecha-
nics, University of Luleå, who were responsible for the
experimental work and who made a very careful job.

540
8. REFERENCES
[1] Gustavsson, S.E. and Karawacki, E., 1979.
Transient hot strip method for simultaneously
measuring thermal conductivity and thermal
diffusivity. Nordic Symposium on Earth Heat
Pump Systems, pp. 55-61, Göteborg.
[2] Gustavsson, S.E., Karawacki, E. and Khan,
M.N., 1979.
Transient hot-strip method for simultaneously
measuring thermal conductivity and thermal
diffusivity of solids and fluids, J. Phys. D:
Appl. Phys. vol. 12 pp. 1411-1421.
[3] Carslaw, H.S. and Jaeger, J.C., 1959.
Conduction of heat in solids, Clarendon Press
Oxford.
[4] Kahr, G. and Muller-von Moos, M., 1982.
Wärmeleitfähigkeit von bentonit MX-80 und von
Montigel nach der Heizdrahtmethode. Institut
fur Grundbau und Bodenmechanik, ETH, Zurich.
Technischer Bericht 82-06, NAGRA, Baden.
[5] Pusch, R., 1980.
Swelling pressure of highly compacted bentonite,
Div. of soil mechanics, Luleå, KBS Technical
Report TR 80-13.
[6] Knutsson, S., 1972.
Värmeledningsförsök på buffertsubstans av
kompakterad bentonit, Högskolan i Luleå,
KBS Technical Report 72.

41
[7] Johansen, 0. and Frivik, P.E., 1980.
Thermal properties of soils and rock materials.
The 2nd International Symposium on Ground
Freezing, pp. 427-453, Norwegian Institute of
Technology, Trondheim.
[8] Landolt-Börnstein, 1967. Jahlenwerte und
Funktionen. IV. Band, 4. Teil Wärmetechnik,
Bandteil. a. 975-944, Springer Verlag, Berlin.
[9] Pusch, P.., Börgesson, L. and Nilsson, J., 1982
Buffer Mass Test - Buffer Materials. Stripa
Project, Internal Report 82-06, Stockholm.

42Appendix 1
Sample \ a C Cs P S> S a
(W/m,K) (10~7 m 2 / s ) (106 J /m3 ,K) ( J /g ,K) (MPa) (%) (%)
1
p=1,97 t /m 3
Wo=4,2%
2
p=1,96 t /m
W =4,2%o
3
0=2,09 t /m 3
Wo=4,2%
4
p=2,17 t /m 3
Wo=4,1%
0,825
0,820
0,889
0,954
1,012
1,074
1,102
0,843
0,916
0,991
1,044
1,103
1,128
0,962
1,014
1,063
1,118
1,160
1,184
1,083
1,105
1,160
1,199
1,243
1,265
1,081
4,621
4,360
4,184
4,154
4,418
4,620
4,728
4,111
3,926
4,237
4,446
4,855
4,647
4,945
4,627
4,656
4,850
5,120
4,957
4,782
4,307
4,611
4,776
5,024
5,155
4,673
1,785
1,881
2,125
2,295
2,290
2,325
2,330
2,051
2,333
2,338
2,348
2,273
2,428
1,945
2,191
2,282
2,306
2,265
2,338
2,264
2,566
2,516
2,509
2,475
2,453
2,314
0,77
0,82
0,95
1,04
1,04
1,05
1,06
0,91
1,06
1,07
1,07
1,03
1,11
0,80
0,92
0,96
0,98
0,96
1,02
0,914
1,059
1,035
1,032
1,015
1,005
0,938
0
0
10
20
30
40
50
0
10
20
30
40
50
0
10
20
30
40
50
0
10
20
30
40
50
0
0,44
0,28
0,90
0,14
0,89
0,59
0,88
0,28
0,17
0,55
0,68
0,51
0,08
0,40
0,43
0,24
0,33
0,27
0,68
0,38
0,58
0,54
0,38
0,60
0,57
0,41
5,60
3,94
5,50
5,11
1,25
2,88
2,02
5,04
1,44
2,32
2,54
4,12
1,74
1,35
4,18
0,66
2,45
2,31
2,57
1,82
3,23
3,76
0,72
5,16
4,46
3,59

43Appendix 2
Sanple
4
p=2,17 t /m 3
W =4,1%o
5
p=2,01 t /m 3
WQ=5,3%
6
p=1,158 t /m 3
Wo=10,1%
Tame
(hours)
16,5
20,8
44,5
65,7
89,0
98,0
119,5
136,0
161,0
185,0
237,4
304,1
0
14,5
39,1
63,2
043,1
95,5
161,8
168,3
X
(W/m,K)
1,343
1,378
1,498
1,505
1,490
1,517
1,545
1,523
1,576
1,527
1,586
1,586
0,833
1,044
1,232
1,325
0,331
0,970
1,243
1,281
1,290
a
(10~7 n\2/s)
5,065
5,085
5,270
5,229
4,626
4,885
6,217
5,009
7,150
4,636
7,175
12,690
4,161
4,481
5,038
4,980
2,331
4,513
4,833
4,729
4,706
C
(106 J/m3,K)
2,650
2,711
2,843
2,878
3,221
3,106
2,485
3,050
3,339
3,294
2,213
1,250
2,002
2,107
2,372
2,715
1,420
2,149
2,572
2,709
2,741
SX(%)
0,42
0,35
1,01
1,19
1,54
0,30
1,09
0,26
0,74
1,50
1,86
0,77
0,80
0,52
0,64
1,36
1,67
1,33
1,95
0,13
1,73
Sa(%)
3,96
3,71
8,97
6,83
7,72
1,21
11,86
2,40
12,08
11,30
19,62
14,06
6,53
3,09
2,98
9,05
4,66
3,39
14,91
3,42
15,36
Ust of KBS's Technical Reports
1977-78TR121KBS Technical Reports 1-120.Summaries. Stockholm. May 1979.
1979TR 79-28The KBS Annual Report 1979.KBS Technical Reports 79-01 - 79-27.Summaries. Stockholm, March 1980.
1980TR 80-26The KBS Annual Report 1980.KBS Technical Reports 80-01 - 80-25.Summaries. Stockholm, March 1981.
1981TR 81-17The KBS Annual Report 1981.KBS Technical Reports 81-01 - 81-16.Summaries. Stockholm, April 1982.
TR 82-28The KBS Annual Report 1982.KBS Technical Reports 82-01 - 82-27.
7903TR 83-01Radionuclide transport in a single fissureA laboratory studyTrygve E EriksenDepartment of Nuclear ChemistryThe Royal Institute of TechnologyStockholm. Sweden 1983-01-19
TR 83-02The possible effects of alfa and betaradiolysis on the matrix dissolution ofspent nuclear fuelI GrentheI PuigdoménechJ BrunoDepartment of Inorganic ChemistryRoyal Institute of TechnologyStockholm, Sweden, January 1983
TR 83-03Smtctite alternationProceedings of a colloquium at StateUniversity of New York at Buffalo,May 26-27,1982Compiled by Duwayne M AndersonState University of New York at BuffaloFebruary 15,1983
TR 83-04Stability of bentonite gels in crystallinerock - Physical aspectsRoland PuschDivision Soil Mechanics, Univensty of LuleåLuleå, Sweden, 1983-02-20
TR 83-05Studies in pitting corrosion on archeo-logical bronzes - CopperÅke BresleJozef SaersBirgit ArrheniusArchaeological Research LaboratoryUniversity of StockholmStockholm, Sweden 1983-01-02
TR 83-06Investigation of the stress corrosioncracking of pure copperL A BenjaminD HardieR N ParkinsUniversity of Newcastle upon TyneDepartment of Metallurgy and engineering MaterialsNewcastle upon Tyne, Great Britain, April 1983
TR 83-07Sorption of radionuclides on geologicmedia - A literature survey.I: Fission ProductsK AnderssonB AllardDepartment of Nuclear ChemistryChalmers University of TechnologyGöteborg, Sweden 1983-01-31
TR 83-08Formation and properties of actinidecolloidsU OlofssonB AllardM BengtssonB Torstenf eltK AnderssonDepartment of Nuclear ChemistryChalmers University of TechnologyGöteborg, Sweden 1983-01-30
TR 83-09Complexes of actinides with naturallyoccurring organic substances -Literature surveyU OlofssonB AllardDepartment of Nucluear ChemistryChalmers University of TechnologyGöteborg, Sweden 1983-02-15

TR 83-24Corrosion resistance of a coppercanister for spent nuclear fuelThe Swedish Corrosion Research Instituteand its reference groupStockholm. Sweden April 1983
TR 83-25Feasibility study of electron beamwelding of spent nuclear fuel canistersA Sanderson, T F Szluha, J L Turner, R H LeggattThe Welding Institute CambridgeThe United Kingdom April 1983
TR 83-26The KBS UO2 leaching programSummary Report 1983-02-01Ronald Forsyth, Studsvik Energiteknik ABNyköping, Sweden February 1983
TR 83-27Radiation effects on the chemicalenvironment in a radioactive wasterepositoryTrygve EriksenRoyal Institute of Technology, StockholmArvid JacobssonUniverisity of LuleåLuleå. Sweden 1983-07-01
TR 83-28An analysis of selected parameters forthe BIOPATH-programU BergströmA-BWilkensStudsvik Energiteknik ABNyköping, Sweden 1983-06-08
TR 83-29On the environmental impact of arepository for spent nuclear fuelOtto BrotzenStockholm, Sweden april 1983
TR 83-30Encapsulation of spent nucler fuel-Safety AnalysisES-konsult ABStockholm, Sweden April 1983
TR 83-31Final disposal of spent nuclear fuel- Standard programme for siteinvestigations
UlfThoregrenSwedish GeologicalApril 1983
TR 83-32Feasibility study of detection of defectsin thick welded copperTekniska Röntgencentralen ABStockholm, Sweden April 1983
TR 83-33The interaction of bentonite and glasswith aqueous mediaM MosslehiA LambrosaJ A MarinskyState University of New YorkBuffalo, NY, USA April 1983
TR 83-34Radionuclide diffusion and mobilities incompacted bentoniteB TorstenfeltBAIIardK AnderssonH KipatsiL EliassonU OlofssonH PerssonChalmers University of TechnologyGöteborg, Sweden April 1983
TR 83-35Actinide solution equilibria andsolubilities in geologic systemsB AllardChalmers University of TechnologyGöteborg, Sweden 1983-04-10
TR 83-36Iron content and reducing capacity ofgranites and bentoniteB TorstenfeltB AllardWJohanssonT innerChalmers University of TechnologyGöteborg, Sweden April 1983
TR 83-37Surface migration in sorption processesA RasmusonI NeretnieksRoyal Institute of TechnologyStockholm, Sweden March 1983
TR 83-38Evaluation of some tracer tests in thegranitic rock at FinnsjönL MorenoI NeretnieksRoyal Institute of Technology, StockholmC-E KlockarsSwedish GeologicalUppsala April 1983

3 1TR83-10Radilysis in nature:Evidence from the Oklo natural reactorsDavid 6 CurtisAlexander J GancarzNew Mexico, USA February 1983
TR 83-11Description of recipient areas related tofinal storage of unreprocessed spent nu-clear fuelBjörn SundbladUlla BergströmStudsvik Energiteknik ABNyköping. Sweden 1983-02-07
TR83-12Calculation of activity content andrelated propeties in PWR and BWR fuelusing ORIGEN 2Ove EdlundStudsvik Energiteknik ABNyköping, Sweden 1983-03-07
TR 83-13Sorption and diffusion studies of Cs and Iin concreteK AnderssonB TorstenfeltB AllardDepartment of Nuclear ChemistryChalmers University of TechnologyGöteborg, Sweden 1983-01-15
TR 83-14The complexation of Eu (III) by fulvic acidJ A MarinskyState University of New York at BuffaloBuffalo, NY 1983-03-31
TR83-15Diffusion measurements in crystallinerocksKristina SkagiusIvars NeretnieksRoyal Institute of TechnologyStockholm, Sweden 1983-03-11
TR83-16Stability of deep-sited smectite mineralsin crystalline rock - chemical aspectsRoland PuschDivision of Soil Mechanics, University of LuleåLuleå 1983-03-30
TR83-17Analysis of groundwater from deep bore-holes in GideéSif LaurentSwedish Environmental Research InstituteStockholm, Sweden 1983-03-09
TR83-18Migration experiments in StudsvikO LandströmStudsvik Energiteknik ABC-E Klockars0 PerssonE-L TullborgS Å LarsonSwedish GeologicalK AnderssonB AllardB TorstenfeltChalmers University of Technology1983-01-31
TR83-19Analysis of groundwater from deep bore-holes in FjällvedenSif LaurentSwedish Environmental Research InstituteStockholm, Sweden 1983-03-29
TR 83-20Encapsulation and handling of spent nu-clear fuel for final disposal1 Welded copper canisters2 Pressed copper canisters (HIPOW)3 BWR Channels in ConcreteB Lönnerbeg, ASEA-ATOMH Larker, ASEAL Ageskog. VBBMay 1983
TR 83-21An analysis of the conditions of gasmigration from a low-level radioactivewaste repositoryC BraesterIsrael Institute of Technology, Haifa. IsraelR ThunvikRoyal Institute of TechnologyStockholm, Sweden November 1982
TR 83-22Calculated temperature field in andaround a repository for spent nuclearfuelTaivo Tarandi, VBBStockholm, Sweden April 1983
TR 83-23Preparation of titanates and zeolites andtheir uses in radioactive waste manage-ment, particularly in the treatment ofspent resinsA Hultgren, editorCAirolaStudsvik Energiteknik ABS Forberg, Royal Institute of TechnologyL Faith, University of LundMay 1983

TR 83-39Diffusion in the matrix of granitic rockField test in the Stripa mire. Part 2L BirgerssonI NeretnieksRoyal Institute of TechnologyStockholm. Sweden March 1983
TR 83-40Redox conditions in groundwaters fromSvartboberget, Gideå, Fjällveden andKamlungePWikbergI GrentheK AxelsenRoyal Institute of TechnologyStockholm, Sweden 1983-05-10
TR 83-41Analysis of groundwater from deep bore-hcles in SvartbobergetSif LaurentSwedish Environmental Research InstituteStockholm. Sweden 1983-06-10
TR 83-42Final disposal of high-levels waste andspent nuclear fuel - foreign activitiesR GelinStudsvik Energiteknik ABNyköping. Sweden May 1983
TR 83-^3Final disposal of spent nuclear fuel -geological, hydrogeological and geo-physical methods for site characteriza-tionK AhlbomL CarlssonO OlssonSwedish GeologicalSweden May 1983
TR 83-44Final disposal of spent nuclear fuel -equipment for site characterizationK Almén, K Hansson, B-E Johansson, G NilssonSwedish GeologicalO Andersson, IPA-KonsultP Wikberg, Royal Institute of TechnologyHÅhagen, SKBF/KBSMay 1983
TR 83-45Model calculations of the groundwaterflow at Finnsjön, Fjällveden, Qideé andKamlungeL CarlssonAWinbergSwedish Geological, GöteborgB GrundfortKemakta Consultant Company,Stockholm May 1983
TR 83-46Use of clays as buffers in radioactiverepositoriesRoland PuschUniversity of LuleåLuleå May 25 1983
TR 83-47Stress/strain/time properties of highlycompacted bentoniteRoland PuschUniversity of LuleåLuleå May 1983
TR 83-48Model calculations of the migration ofradio-nuclides from a respository forspent nuclear fuelA BengtssonKemakta Consultant Company, StockholmM MagnussonI NeretnieksA RasmusonRoyal Institute of Technology, StockholmMay 1983
TR 83-49Dose and dose commitment calculationsfrom groundwaterbome radioactiveelements released from a repository forspent nuclear fuelU BergströmStudsvik Energiteknik ABNyköping, Sweden May 1983
TR 83-50Calculation of fluxes through arepository caused by a local wellR ThunvikRoyal Institute of TechnologyStockholm, Sweden May 1983
TR 83-516WHRT - A finite element solution to thecoupled ground water flow and heattransport problem in three dimeMionsB GrundfeltKemakta Consultant CompanyStockholm, Sweden May 1983
TR 83-52Evaluation of the geological, geophysicaland hydrogeological conditions at Fjäll-vedenK AhlbomL CarlssonL-E CarlstenO DuranN-Å LarssonO OlssonSwedish GeologicalMay 1983
3Evaluation of the geological, geophysicaland hydrogeological conditions at GideAKAhlbomB AlbinoL CarlssonG NilssonOOlssonL StenbergHTimjeSwedish GeologicalMay 1963
TR 83-54Evaluation of the geological, geophysicaland hydrogeological conditions atKamlungeKABAibmoL CarlssonJ DanielssonG NilssonO OlssonS SehlstedtVStejskalL StenbergSwedish GeologicalMay 1983
TR 83-55Evaluation of the geological, geophysicaland hydrogeological conditions at Svart-
KAhlbomL CarlssonB GentzscheinA JämtlidO OlssonSTirénSwedish GeologicalMay 1983
TR 83-56I: Evaluation of the hydrogeological
conditions at FinnsjönL CarlssonG Gidlund
II: Supplementary geophysical investiga-tions of the Stärnö peninsulaB Hesselström
Swedish GeologicalMay 1983
TR 83-57Neotactonics in northern Sweden -geophysical investigationsHHenkeiK HultL ErikssonGeological Survey of SwedenLJohanssonSwedish GeologicalMay 1983
TR 83-58Neotactonics in northern Sweden -geological investigationsRLagefbacKFWitschardGeological Survey of SwedenMay 1983
TR 83-59Chemistry of deep groundwaters fromgranitic bedrockb.JiardChalmers University of TechnologySÅ LarsonE L TullborgSwedish GeologicalPWfcbergRoyal Institute of TechnologyMay 1963
TR 83-60On the solubility of technetium in geo-chemical systemsBAIIardBTorstenfettChalmers University of TechnologyGöteborg. Sweden 1983-05-05
TR 83-61Sorption behaviour of well-definedoxidation statesBAIIardU OlofssonBTorstenfeltHKipatsiChalmers University of TechnologyGöteborg, Sweden 1983-05-15
TR 83-62The distribution coefficient concept andaspects on experimental distributionstudiesBAIIardK AnderssonB TcrstenfeitChalmers University of TechnologyGöteborg, Sweden May 1983
TR 83-63Sorption of radionuclides in geologicsystemsK AnderssonB TorstenfeltBAIIardChalmers University of TechnologyGöteborg, Sweden 1983-06-15

-JTR 83-64Ion exchange capacities and surfaceareas of some major components andcommon fracture filling materials ofigneous rocksB AllardM KarlssonChalmers University of TechnologyE-L TullborgS Å LarsonSwedish GeologicalGöteborg, Sweden May 1983
TR 83-65Sorption of actinides on uranium dioxideand zirconium dioxide in connection withleaching of uranium dioxide fuelB AllardN BerrerK AnderssonU OlofssonB TorstenfeltChalmars University of TechnologyR ForsythStudsvik Energiteknik ABMay 1983
TR 83-66The movement of radionuclides past aredox frontI NeretnieksB ÅslundRoyal Institute of TechnologyStockholm, Sweden 1983-04-22
TR 83-67Some notes in connection with thestudies of final disposal of spent fuel.Part 2I NeretnieksRoyal Institute of TechnologyStockholm, Sweden May 1983
TR 83-68Two dimensional movements of a redoxfront downstream from a repository fornuclear waste.' NeretnieksB ÅslundRoyal Institute of TechnologyStockholm, Sweden 1983-06-03
TR 83-69An approach to modelling radionuclidemigration in a medium with stronglyvarying velocity and block sizes alongthe flow pathI NeretnieksA RasmusonRoyal Institute of TechnologyStockholm, Sweden May 1983
TR 83-70Analysis of groundwater from deep bore-holes in KamlungeS LaurentSwedish Environmental Research InstituteStockholm, Sweden May 1983
TR 83-71Gas migration through bentonite clayRoland PuschThomas ForsbergUniversity of LuleåLuleå, Sweden May 31,1983
TR 83-72On the thermal conductivity and thermaldiff usivity of highly compacted bentoniteSven KnutssonUniversity of LuleåLuleå, Sweden October 1983