on the scaling characteristics of observed and simulated spatial soil
TRANSCRIPT

Nonlin. Processes Geophys., 16, 141–150, 2009www.nonlin-processes-geophys.net/16/141/2009/© Author(s) 2009. This work is distributed underthe Creative Commons Attribution 3.0 License.
Nonlinear Processesin Geophysics
On the scaling characteristics of observed and simulated spatial soilmoisture fields
M. Gebremichael1, R. Rigon2, G. Bertoldi3, and T. M. Over4
1Department of Civil and Environmental Engineering, University of Connecticut, Storrs, CT 06269, USA2Dipartimento di Ingegneria Civile e Ambientale/CUDAM, Universita di Trento, Via Mesiano, 77, 38050 Trento, Italia3Institute for Alpine Environment, EURAC research, Viale Druso 1, 39100 Bolzano, Italia4Department of Geology/Geography, Eastern Illinois University, 600 Lincoln Ave., Charleston, IL 61920-3099, USA
Received: 31 January 2008 – Revised: 27 November 2008 – Accepted: 9 December 2008 – Published: 25 February 2009
Abstract. By providing continuous high-resolution simula-tions of soil moisture fields, distributed hydrologic modelscould be powerful tools to advance the scientific commu-nity’s understanding of the space-time variability and scal-ing characteristics of soil moisture fields. However, in orderto use the soil moisture simulations from hydrologic mod-els with confidence, it is important to understand whetherthe models are able to represent in a reliable way the pro-cesses regulating soil moisture variability. In this study, acomparison of the scaling characteristics of spatial soil mois-ture fields derived from a set of microwave radiometer obser-vations from the Southern Great Plains 1997 experiment andcorresponding simulations using the distributed hydrologicmodel GEOtop is performed through the use of generalizedvariograms. Microwave observations and model simulationsare in agreement with respect to suggesting the existence ofa scale-invariance property in the variograms of spatial soilmoisture fields, and indicating that the scaling characteristicsvary with changes in the spatial average soil water content.However, observations and simulations give contradictory re-sults regarding the relationship between the scaling parame-ters (i.e. spatial organization) and average soil water content.The drying process increased the spatial correlation of themicrowave observations at both short and long separationdistances while increasing the rate of decay of correlationwith distance. The effect of drying on the spatial correlationof the model simulations was more complex, depending onthe storm and the simulation examined, but for the largeststorm in the simulation most similar to the observations, dry-ing increased the long-range correlation but decreased the
Correspondence to:M. Gebremichael([email protected])
short-range. This is an indication that model simulations,while reproducing correctly the total streamflow at the out-let of the watershed, may not accurately reproduce the runoffproduction mechanisms. Consideration of the scaling char-acteristics of spatial soil moisture fields can therefore serveas a more intensive means for validating distributed hydro-logic models, compared to the traditional approach of onlycomparing the streamflow hydrographs.
1 Introduction
Near-surface soil moisture is an important variable that in-fluences atmospheric, hydrologic, and biogeochemical pro-cesses over a wide range of scales. Ignoring the small-scalevariability of soil moisture fields could lead to large errors inapplications (e.g. Nykanen and Foufoula-Georgiou, 2001).Characterizing the spatial pattern of soil moisture variabil-ity is also important to provide quantitative confidence to thecurrent Aqua-AMSR (Njoku et al., 2003) and planned SMOS(Silvestrin et al., 2001) satellite soil moisture products.
Based on limited number of soil moisture images derivedfrom short-term aircraft-based microwave observations, sev-eral studies have shown the existence of scale-invarianceproperties in the spatial soil moisture fields (e.g. Rodriguez-Iturbe et al., 1995; Hu et al., 1997; Nykanen and Foufoula-Georgiou, 2001; Oldak et al., 2002; Das and Mohanty, 2008).The implication of scale-invariance is that only a few param-eters (2 to 3) are required to transform spatial soil moisturefields between different scales. The practical feasibility ofthis approach hinges on the ability to estimate the scaling pa-rameters from large-scale observables, and this remains thestumbling block preventing the scientific community from
Published by Copernicus Publications on behalf of the European Geosciences Union and the American Geophysical Union.

142 M. Gebremichael et al.: Scaling characteristics of soil moisture
using this approach to downscale spatial soil moisture fields.More research is needed to examine the temporal evolu-tion of the scaling parameters and to establish linkages withphysical factors and processes (e.g. Albertson and Montaldo,2003). Identifying the capability of a hydrological model toaccurately represent soil moisture scaling would also serveas a means of model testing in order to provide confidence inthe simulated spatial patterns.
Distributed hydrologic models can be powerful tools forsuch scaling investigations by virtue of their ability to sim-ulate continuous, high-resolution, soil moisture fields. In arecent study, Manfreda et al. (2007) investigated the scalingcharacteristics of spatial soil moisture fields simulated withthe variable infiltration capacity (VIC) (Nijssen et al., 1997)hydrologic model over the southern Great Plains region byexamining the variance of spatial averages at different reso-lutions from 0.125◦ to 1.0◦, and reported the following re-sults: (i) variance of spatial soil moisture fields in the top10 cm and top 100 cm exhibit scale-invariance; (ii) the dry-ing process tends to reduce the spatial correlation of the soilmoisture; and (iii) changes in the scaling parameter valuesare controlled not only by the mean value of the process butalso by the different dynamics of the wetting and drying cy-cles.
With distributed hydrologic models, it is possible to per-form such investigations and advance our understanding ofthe scaling properties of soil moisture fields. However touse the hydrologic models with confidence, it is important tounderstand whether the models are able to represent in a re-liable way the processes regulating soil moisture variability.So far, there is only little work done to compare the scalingproperties of simulated soil moisture fields to observations(Dubayah et al., 1997; Peters-Lidard et al., 2001). Thus, it isworth exploring in detail how distributed hydrologic modelsperform in retrieving observed scaling parameters.
This paper is a contribution towards filling this gap. Forthis study, we chose the GEOtop hydrologic model (Rigonet al., 2006) because it is a process-based model that inte-grates the 3-D Richards Equation. Specifically, we seek tounderstand how well GEOtop can simulate the observed scal-ing properties of spatial soil moisture fields obtained fromremote sensing observations. We will also investigate howmuch the initialization scheme and data resolutions affectthe results. We take advantage of the soil moisture estimatesmade using aircraft-based imagery from the Southern GreatPlains 1997 (SGP97) Hydrology Experiment (Jackson, 1997)for validation of simulation results. The case study takesplace from 27 June to 16 July and encompasses both wet-ting and drying cycles in order to observe the performanceof GEOtop under both conditions and to test its ability tomake a transition from one to the other. In particular, weinvestigate if the observed and simulated moisture fields ex-hibit scale invariance in their generalized variograms, and toanalyze the relationship between the scaling parameters andspatial average soil water content.
2 Study region and data
2.1 Study region
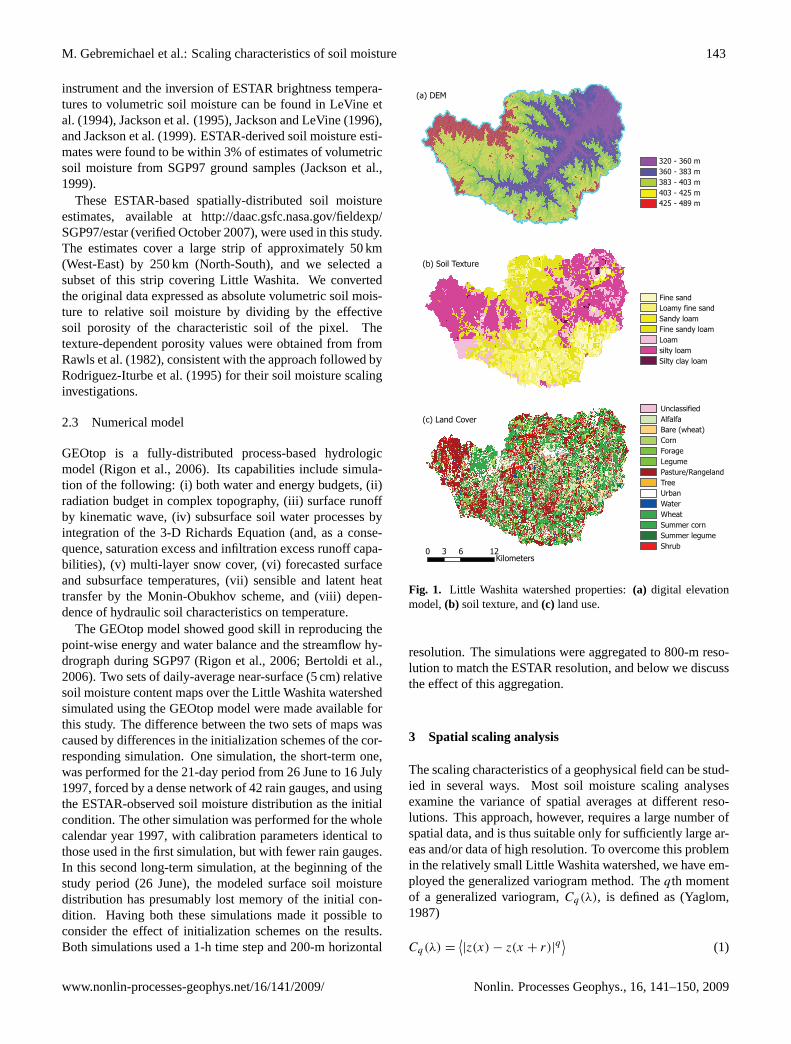
Our study region is the Little Washita watershed located inthe southwest Oklahoma in the Southern Great Plains regionof the USA. The watershed, which has a drainage area of602 km2 upstream of the USGS stream gauge 07327550 nearNinnekah, OK, is operated as an experimental watershed bythe US Department of Agriculture – Agricultural ResearchService. As a result, it is well-instrumented for hydrologicalstudies and has been the site for several major soil moisturefield experiments. We chose to study the Little Washita wa-tershed because of its dense network of meteorological sitesand soil moisture fields from aircraft-based imagery to forcesimulations and evaluate model performance. The study pe-riod spans from 27 June to 16 July 1997, which encompassestwo dry-down periods interrupted on 11 July by a convectivestorm with a basin averaged daily precipitation of 53 mm, anamount comparable to the average monthly rainfall in Julyof 56.4 mm (Allen and Naney, 1991). The topography of theregion is gently rolling, changing about 10 m per kilometers,with no major orographic features. In general, the soils arewell-drained loams and sands, 1–2 m in depth, and overliesandstone and shale bedrock (Allen and Naney, 1991). Thesoil texture is dominated by silty loam in the western andeastern parts, and by sandy soils in the central part. Land useis dominated by agriculture and rangeland (63%), with sig-nificant areas of winter wheat and other crops concentratedin the floodplain and western portions of the watershed area.Figure 1 shows the topography derived from a 30-m USGSNED digital elevation model dataset, soil texture obtainedfrom Mohanty et al. (2002), and land cover obtained fromGoddard Earth Sciences Data and Information Services Cen-ter.
2.2 Observations
The Southern Great Plains 1997 Hydrology Experiment(SGP97) (Jackson et al., 1999) was a cooperative effort be-tween NASA, USDA, and several other government agenciesand universities conducted with the primary goal of collect-ing a time series of spatial soil moisture data. The core of theexperiment involved the deployment of the L-band electron-ically scanned thinned array radiometer (ESTAR) for dailymapping of surface soil moisture. ESTAR is a synthetic aper-ture, passive microwave radiometer operating at a frequencyof 1.413 GHz (21 cm). ESTAR was flown on a P-3B air-craft (at an altitude of 7.5 km) operated by the NASA Wal-lops Flight Facility. The P-3B flew over Little Washita atapproximately 16:00 UTC (10:00 CST). The footprint of theraw brightness temperature data is 400 m, but the raw datawere resampled to a pixel grid size of 800 m×800 m to derivemoisture maps that are representative of the top 5 cm of soil(e.g. Famiglietti et al., 1999). Further details on the ESTAR
Nonlin. Processes Geophys., 16, 141–150, 2009 www.nonlin-processes-geophys.net/16/141/2009/
M. Gebremichael et al.: Scaling characteristics of soil moisture 143
instrument and the inversion of ESTAR brightness tempera-tures to volumetric soil moisture can be found in LeVine etal. (1994), Jackson et al. (1995), Jackson and LeVine (1996),and Jackson et al. (1999). ESTAR-derived soil moisture esti-mates were found to be within 3% of estimates of volumetricsoil moisture from SGP97 ground samples (Jackson et al.,1999).
These ESTAR-based spatially-distributed soil moistureestimates, available athttp://daac.gsfc.nasa.gov/fieldexp/SGP97/estar(verified October 2007), were used in this study.The estimates cover a large strip of approximately 50 km(West-East) by 250 km (North-South), and we selected asubset of this strip covering Little Washita. We convertedthe original data expressed as absolute volumetric soil mois-ture to relative soil moisture by dividing by the effectivesoil porosity of the characteristic soil of the pixel. Thetexture-dependent porosity values were obtained from fromRawls et al. (1982), consistent with the approach followed byRodriguez-Iturbe et al. (1995) for their soil moisture scalinginvestigations.
2.3 Numerical model
GEOtop is a fully-distributed process-based hydrologicmodel (Rigon et al., 2006). Its capabilities include simula-tion of the following: (i) both water and energy budgets, (ii)radiation budget in complex topography, (iii) surface runoffby kinematic wave, (iv) subsurface soil water processes byintegration of the 3-D Richards Equation (and, as a conse-quence, saturation excess and infiltration excess runoff capa-bilities), (v) multi-layer snow cover, (vi) forecasted surfaceand subsurface temperatures, (vii) sensible and latent heattransfer by the Monin-Obukhov scheme, and (viii) depen-dence of hydraulic soil characteristics on temperature.
The GEOtop model showed good skill in reproducing thepoint-wise energy and water balance and the streamflow hy-drograph during SGP97 (Rigon et al., 2006; Bertoldi et al.,2006). Two sets of daily-average near-surface (5 cm) relativesoil moisture content maps over the Little Washita watershedsimulated using the GEOtop model were made available forthis study. The difference between the two sets of maps wascaused by differences in the initialization schemes of the cor-responding simulation. One simulation, the short-term one,was performed for the 21-day period from 26 June to 16 July1997, forced by a dense network of 42 rain gauges, and usingthe ESTAR-observed soil moisture distribution as the initialcondition. The other simulation was performed for the wholecalendar year 1997, with calibration parameters identical tothose used in the first simulation, but with fewer rain gauges.In this second long-term simulation, at the beginning of thestudy period (26 June), the modeled surface soil moisturedistribution has presumably lost memory of the initial con-dition. Having both these simulations made it possible toconsider the effect of initialization schemes on the results.Both simulations used a 1-h time step and 200-m horizontal
0 6 123Kilometers
AlfalfaBare (wheat)CornForageLegumePasture/RangelandTreeUrbanWaterWheatSummer cornSummer legumeShrub
(c) Land Cover
Fine sandLoamy fine sandSandy loamFine sandy loamLoamsilty loamSilty clay loam
Unclassified
(b) Soil Texture
320 - 360 m360 - 383 m383 - 403 m403 - 425 m425 - 489 m
(a) DEM
Fig. 1. Little Washita watershed properties:(a) digital elevationmodel,(b) soil texture, and(c) land use.
resolution. The simulations were aggregated to 800-m reso-lution to match the ESTAR resolution, and below we discussthe effect of this aggregation.
3 Spatial scaling analysis
The scaling characteristics of a geophysical field can be stud-ied in several ways. Most soil moisture scaling analysesexamine the variance of spatial averages at different reso-lutions. This approach, however, requires a large number ofspatial data, and is thus suitable only for sufficiently large ar-eas and/or data of high resolution. To overcome this problemin the relatively small Little Washita watershed, we have em-ployed the generalized variogram method. Theqth momentof a generalized variogram,Cq(λ), is defined as (Yaglom,1987)
Cq(λ) =⟨|z(x) − z(x + r)|q
⟩(1)
www.nonlin-processes-geophys.net/16/141/2009/ Nonlin. Processes Geophys., 16, 141–150, 2009

144 M. Gebremichael et al.: Scaling characteristics of soil moisture
06/2
7
06/2
806
/29
06/3
007
/01
07/0
207
/03
07/0
407
/05
07/0
607
/07
07/0
807
/09
07/1
007
/11
07/1
207
/13
07/1
407
/15
07/1
60
10
20
30
40
50
Valu
es
ESTAR: Mean Relative Soil Moisture (%)GEOtop: Mean Relative Soil Moisture (%)Mean Rain Rate (mm/day)
Date
Fig. 2. Time series of watershed-scale mean relative soil mois-ture (from ESTAR observations and GEOtop simulations) and meandaily rain rate (from a dense network of rain gauges) for the LittleWashita watershed from 27 June to 16 July 1997.
where|r|=λ is the separation distance,z(x) is the value ofthe field being analyzed at locationx, and<> is the ensem-ble averaging operator. The definition ofCq(λ) assumes thatthe random field of the soil moisture differences is stationary,because theqth moment is supposed to depend only on theseparation distance. This assumption is often made in mostpractical applications.
The qth momentCq (λ) of the generalized variogram issaid to be scaling if the following relation holds:
Cq(λ) = λK(q)Cq(1) ∝ λK(q). (2)
We estimated the scaling exponent (or scaling parameter)K(q) after logarithmically transforming this equation. Forboth the ESTAR estimates and the GEOtop simulationscoarse-grained to 800 m, we considered separation distancesranging from 0.8 km to 10.4 km. The total number of pairs ofsoil moisture data used ranges from 1984 at a separation dis-tance of 0.8 km to 1216 at 10.4 km. We examined the scalingproperties of the following four spatial soil moisture datasets:(1) the ESTAR estimates at 800 m resolution, (2) the short-term GEOtop simulation coarse-grained to 800 m resolu-tion, (3) the long-term GEOtop simulation coarse-grained to800 m resolution, and (4) the short-term GEOtop simulationat the model resolution of 200 m.
The results of this analysis will be presented belowin terms of two parameters characterizing the variogram,Cq=1(λ=0.8 km), a measure of short-range variability, andK(q=1), the slope of the fitted variogram power-law. Thephysical interpretation of these parameters is as follows.First, one expects that the variogram will increase with sep-aration distance, at least for small separation distances. Therate at which the variogram increases with separation dis-tance is a measure of the organization or spatial structureof the soil moisture field. For a nearly uncorrelated field,increasing separation distance beyond some small positivevalue will have an insignificant effect on the variogram, giv-ing a more or less constant but large value ofC1(λ) indepen-
dent of separation distance, and therefore smallK(q) val-ues. At the opposite extreme, a nearly uniform field willhave small but again more or less constantC1(λ) values, andtherefore again a smallK(q) value. However, a field withcorrelation that continuously decreases with separation dis-tance exhibits small variogram values for small separationdistances (because nearby points are likely to be very similarin magnitude) but increasing differences in field valuesz(x)
as separation distance is increased, causing a continuous risein the plot of the variogram versus separation distance, andtherefore highK(q) values. The particular valueK(q) takesis an indicator of the rate at which the correlation decreaseswith separation distance.
4 Results and discussion
4.1 Watershed-averaged soil moisture
Figure 2 compares the time series watershed-averaged rela-tive soil moisture values obtained from ESTAR observationsand the short-term GEOtop simulations on the days when theESTAR estimates are available. Superimposed in the figureis the corresponding spatial mean of daily rainfall obtainedfrom the dense network of 42 rain gauges. The ESTAR spa-tial mean relative soil moisture (r.s.m.) during the study pe-riod encompasses four different trends: (i) an initially-drydry-down period (29 June–10 July, ESTAR mean r.s.m. de-creases from 31% to 13% spatial mean r.s.m.), (ii) a strongincrease in wetness (10 July–11 July, with 53 mm of rain-fall, and ESTAR mean r.s.m. of 49%), (iii) an initially-wetdry-down period (11 July–14 July, ESTAR mean r.s.m. from49% to 31%), and (iv) a mild increase in wetness (14 July vs.16 July, when, following a mild storm, ESTAR mean r.s.m.increases to 37%).
We note that soil moisture estimates from both the ES-TAR observations and the GEOtop simulations respondedto temporal rainfall fluctuations (i.e. spatial mean soil mois-ture content increases following storms, and decreases duringdry-downs), suggesting that both ESTAR observations andGEOtop simulations represented realistic patterns of tempo-ral variability of soil moisture at the watershed-scale. Thecorrelation between the time-series of spatial mean ESTARobservations and GEOtop simulations was 0.95, confirm-ing agreement in temporal fluctuation behavior. However,for most of the days when ESTAR-observed spatial meanexceeded 20% r.s.m., the simulated soils were drier thanESTAR-observed soils, and the magnitude of this discrep-ancy increased with the wetness level. For the driest day (i.e.ESTAR-observed spatial mean of 13% r.s.m.), the simulatedsoils were wetter than ESTAR-observed soils.
4.2 Scaling
Figure 3 shows the variograms and best-fit lines of logs ofthe generalized variogramsC1(λ), C2(λ), andC4(λ), as a
Nonlin. Processes Geophys., 16, 141–150, 2009 www.nonlin-processes-geophys.net/16/141/2009/
M. Gebremichael et al.: Scaling characteristics of soil moisture 145
July 11
1 10100
101
102
103
104
105
106
July 14
1 10100
101
102
103
104
105
106
1 10100
101
102
103
104
105
106
1 10100
101
102
103
104
105
106
1 10100
101
102
103
104
105
106
1 10100
101
102
103
104
105
106
1 10100
101
102
103
104
105
106
1 10100
101
102
103
104
105
106
(separation distance, km) (separation distance, km)
ESTA
R 80
0mG
EOto
p 80
0m
GEO
top
800m
(1-y
r)G
EOto
p 20
0m
(a) (e)
(b)
(c)
(d)
(f )
(g)
(h)
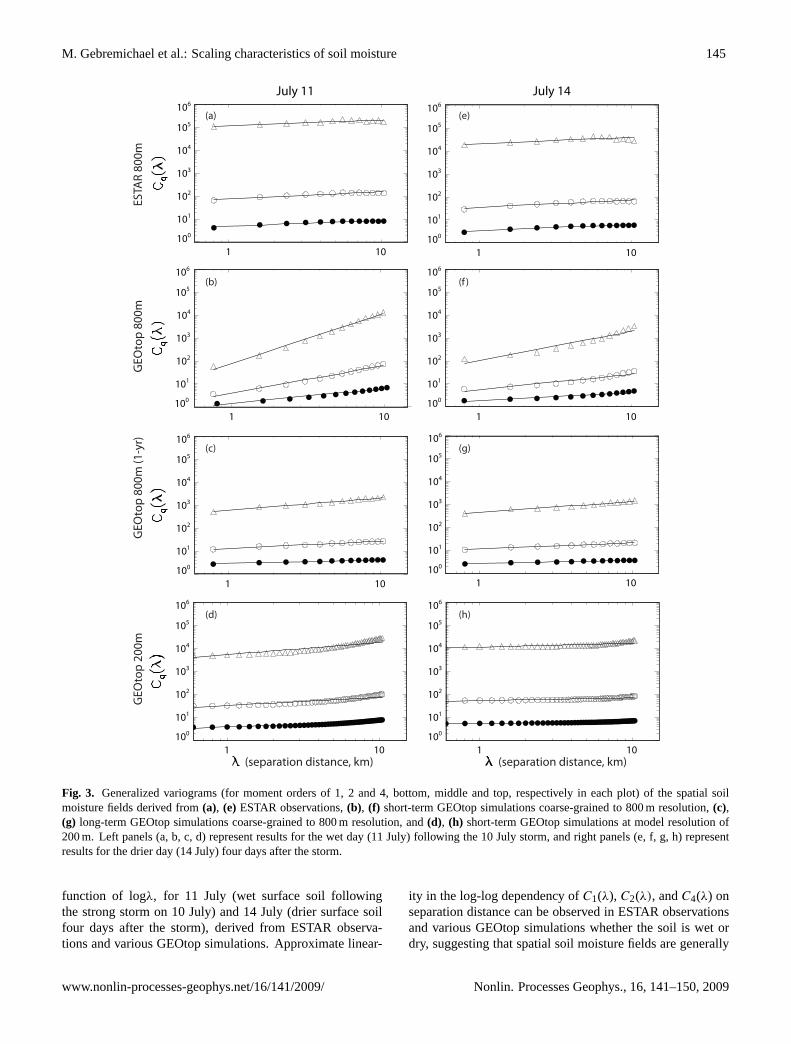
Fig. 3. Generalized variograms (for moment orders of 1, 2 and 4, bottom, middle and top, respectively in each plot) of the spatial soilmoisture fields derived from(a), (e) ESTAR observations,(b), (f) short-term GEOtop simulations coarse-grained to 800 m resolution,(c),(g) long-term GEOtop simulations coarse-grained to 800 m resolution, and(d), (h) short-term GEOtop simulations at model resolution of200 m. Left panels (a, b, c, d) represent results for the wet day (11 July) following the 10 July storm, and right panels (e, f, g, h) representresults for the drier day (14 July) four days after the storm.
function of logλ, for 11 July (wet surface soil followingthe strong storm on 10 July) and 14 July (drier surface soilfour days after the storm), derived from ESTAR observa-tions and various GEOtop simulations. Approximate linear-
ity in the log-log dependency ofC1(λ), C2(λ), andC4(λ) onseparation distance can be observed in ESTAR observationsand various GEOtop simulations whether the soil is wet ordry, suggesting that spatial soil moisture fields are generally
www.nonlin-processes-geophys.net/16/141/2009/ Nonlin. Processes Geophys., 16, 141–150, 2009

146 M. Gebremichael et al.: Scaling characteristics of soil moisture
06/2
7
06/2
906
/30
07/0
107
/02
07/0
3
07/1
107
/12
07/1
307
/14
07/1
6
Date
0
1
2
3
4
5
6
7
C (λ
=0.8
)
ESTAR 800mGEOtop 800m (1-yr)GEOtop 800mGEOtop 200m
q=1
Fig. 4. Time series of generalized variogram valuesCq=1(λ=0.8 km) derived from ESTAR observations and vari-ous GEOtop simulations.
scale-invariant in separation distances that range from, 0.8to 10.4 km; both observed and simulated fields continue toencounter variability throughout this range of scales. Thisresult is consistent with previous findings (e.g. Rodriguez-Iturbe et al., 1995; Hu et al., 1997; Oldak et al., 2002). How-ever, we note differences in the temporal fluctuation of theslopes and intercepts of the log-log relationships among theobservations and simulations; these differences are describedin the sections below.
4.3 Variability at a separation distance of 0.8 km
Figure 4 presents the time series of the variogramCq=1(λ=0.8 km), a proxy for the intercept parameter, de-rived from ESTAR observations and various GEOtop simula-tions. During the dry-down periods (29 June–3 July and 11–14 July), ESTAR’sC1(0.8) values progressively decrease, in-dicating that the short-range variability decreased as the soilsdried. The variability increases following the rain events on10 July and 15 July. The picture that emerges from this anal-ysis is that the short-range variability of ESTAR observationsis strongly tied to the mean soil moisture content, and thatthe spatial soil moisture field becomes more variable for wetconditions. This behavior is consistent with observations inhumid areas (e.g. Bell et al., 1980; Famiglietti et al., 1999).
Let us now examine the short-term GEOtop simulationcoarse-grained to 800 m (denoted “GEOtop 800 m” in thefigure). GEOtop’sC1(0.8) values are smaller overall thanthe corresponding ESTAR values, indicating that the simu-lations had less short-range spatial variability than those ofthe observations. During the initially-dry dry-down period(29 June–3 July), GEOtop’sC1(0.8) values decreased as thesoils dried, indicating that the simulations had less short-range variability for dry conditions when the GEOtop’s spa-
tial mean soil moisture content was within the range of 20%r.s.m. to 17% r.s.m., a behaviour consistent with ESTAR ob-servations. However, during the initially-wet dry-down pe-riod (11–14 July) when GEOtop’s spatial mean soil moisturecontent decreased from 49% r.s.m. to 31% r.s.m., the short-range variability increased as the soils dried, a behavior thatcontradicts ESTAR observations. GEOtop’s variability de-creases following the rain events on 10 July and 15 July, con-tinuing the contradiction with ESTAR observations. The pic-ture that emerges from this analysis is that (1) the relationshipbetween GEOtop’s short-range spatial variability and wet-ness level depends on the range of the wetness level; (2) fordry soils, the simulation’s short-range variability decreaseswith decreasing mean water content, consistent with ESTARobservations; (3) for relatively wetter soils, the simulation’sshort-range variability increases with decreasing mean watercontent, contradicting ESTAR observations.
The GEOtop 800 m results discussed above were obtainedusing short-term simulation initialized on 26 June with in-put rainfall data from a dense network of 42 rain gauges.The amount and spatial variability of rainfall was thereforewell-represented in the GEOtop model. However, the lack ofsufficient time for model spin up might have affected the ac-curacy of the simulation, particularly in the early days of thesimulation period. To investigate this, we have analyzed thelong-term GEOtop simulation performed for the whole yearof 1997, i.e. initialized on 1 January 1997. The simulationwas performed using the calibrated parameters of the short-term simulation. However, only three rain gauges had dataavailable for the whole year; therefore the model was forcedonly with these three stations. The long-term GEOtop sim-ulation results coarse-grained to 800 m (labeled as “GEOtop800 m (1-yr)” in the figures) therefore had a longer spin-upperiod but suffered from a coarse representation of spatialrainfall variability. The long-term GEOtop 800 m simulationusually had higher short-range variability, measured by theC1(0.8) values, than the short-term GEOtop simulation, mak-ing it closer to ESTAR observations particularly during wetdays, but its variability changed very little with mean watercontent, contradicting both ESTAR observations and short-term GEOtop simulations, suggesting that the coarse spatialrepresentation of rainfall in the model might have affectedthe ability of the model to reproduce the temporal dynam-ics between soil moisture variability and wetness level in thelong-term simulation.
All the above simulation results were derived from800 m×800 m gridded soil moisture information, which wereobtained by coarse graining the 200 m×200 m model sim-ulations. To understand the effect of coarse graining onthe simulation results, we have analyzed the short-term200 m×200 m model simulation (labeled “GEOtop 200 m”in the figures). The GEOtop 200 mC1(0.8) values werehigher than the corresponding GEOtop 800 m results, as ex-pected from statistical theory (i.e. averaging reduces vari-ability). However, in terms of the relationship between
Nonlin. Processes Geophys., 16, 141–150, 2009 www.nonlin-processes-geophys.net/16/141/2009/

M. Gebremichael et al.: Scaling characteristics of soil moisture 147
06/2
7
06/2
906
/30
07/0
107
/02
07/0
3
07/1
107
/12
07/1
307
/14
07/1
60
0.1
0.2
0.3
0.4
0.5
0.6
ESTAR 800mGEOtop 800m (1-yr)GEOtop 800mGEOtop 200m
Date
k(1)
Fig. 5. Time series of generalized variogram scaling exponentK(1)values derived from ESTAR observations and various GEOtop sim-ulations.
variability and mean water content, the GEOtop 200 m simu-lation results were consistent with the GEOtop 800 m results(i.e. there is a high temporal correlation betweenC1(0.8) val-ues obtained from the 200-m and 800-m pixel sizes), sug-gesting that the coarse-graining preserves the behavior of therelationship between variability and mean water content ob-served at the model resolution.
4.4 Scaling parameter
Here, we evaluate the scaling parameterK(q=1) values. Asdiscussed in Sect. 3,K(q) is a measure of the rate of decreaseof spatial correlation of the field:K(q) values are higher forfields whose spatial correlation decreases faster with separa-tion distance. Figure 5 presents the time series ofK(1) val-ues obtained from the ESTAR observations and the variousGEOtop simulations.
During the dry-down periods, ESTAR’sK(1) values in-crease slightly and the correspondingC1(0.8) values de-crease (Fig. 4) as the soils dry, showing that the effect ofdry-down on ESTAR-derived observed spatial correlation ofsoil moisture was to increase short-range correlation whileincreasing somewhat the decay of correlation with distance.However, the impact of rainfall on the rate of decay of spa-tial correlation seems to depend on the nature of the rainfallvariability or depth. The strong storm of 10 July caused apronounced decrease in ESTAR’s rate of decay of spatial cor-relation with distance and a corresponding decrease in short-range correlation (according to the largeC1(0.8) value shownin Fig. 4), but the mild storm of 15 July caused a pronouncedincrease in ESTAR’s rate of decay of spatial correlation butagain a decrease in short-range correlation (Fig. 4), implyingthat long-range correlation has become much smaller.
The “GEOtop 800 m” (short-term) simulation gave lowerK(1) values prior to the 10 July storm and higherK(1) val-
0
0.1
0.2
0.3
0.4
0.5
0.6ESTAR 800mGEOtop 800m (1-yr)GEOtop 800mGEOtop 200m
100 20 30 40 50Watershed-averaged Soil Moisture (%)
K(1)
Fig. 6. Generalized variogram scaling exponentK(1) as a functionof watershed-averaged soil moisture content, derived from ESTARobservations and various GEOtop simulations.
!
!
!
!
!
!
!!
!
!
!
!
!
!
!
!
!
!!!
!
! !
!
!
!
!
!
!
!
!
!
!
!
!
!
! !
!
!
0
9
9
0
72
86
204545
9365 74 48
378687
6049 49
51
63 53 24
26
4334
3656
8139
2329 18 21
24
1113
162 117
116148
102
Fig. 7. Depth of rainfall total (mm) recorded on 10 July 1997, ateach rain gauge location in the Little Washita watershed.
ues after the storm compared to ESTAR observations, in-dicating that soil moisture patterns in this GEOtop simula-tion and the ESTAR observations responded differently tothe changes in mean water content. During the initially-wetdry-down phase (11 July–14 July), GEOtop’sK(1) estimatesdecreased dramatically with decreasing mean water content,while itsC1(0.8) value rose from a low initial value (Fig. 4),indicating that the drying process decreased the short-rangespatial correlation but increased the long-range correlation,a behavior that contradicts the ESTAR observations. Thestrong storm of 10 July caused an decrease in GEOtop’s spa-tial correlation at large separation distances, contradictingESTAR observations. The mild storm of 15 July also causeda decrease in GEOtop’s long-range spatial correlation, butin the case of this storm, this is consistent with the ESTAR
www.nonlin-processes-geophys.net/16/141/2009/ Nonlin. Processes Geophys., 16, 141–150, 2009

148 M. Gebremichael et al.: Scaling characteristics of soil moisture
ESTA
R 80
0m
July 11 July 14
GEO
top
800m
< 20
20 - 30
30 - 40
40 - 50> 50
%r.s.m.
(a)
(b)
(c)
(d)
Fig. 8. Spatial maps of relative soil moisture content in the Little Washita watershed derived from(a), (c) ESTAR observations and(b),(d) short-term GEOtop simulation coarse-grained to 800 m. Left panels (a, b) indicate results for the wet day on 11 July 1997, following thestorm on 10 July; and right panels (c, d) indicate results for the dry day on 14 July, four days after the storm.
observations. However, the ESTAR observations showed adecrease in short-range correlation (Fig. 4) while GEOtopshowed a slight increase.
We have also examined how much the initializationscheme and coarse-graining affect the simulation’sK(1) re-sults. The long-term simulation results show relatively lit-tle temporal variation inK(1), contradicting both the ES-TAR observations and the short-term GEOtop simulations,suggesting low quality of the long-term simulation with re-spect to soil moisture patterns, perhaps due to their coarserepresentation of spatial rainfall. Comparison of the short-term “GEOtop 200 m” and the corresponding coarse-grained“GEOtop 800 m” simulation results indicate that coarse-graining preserves the dynamic relationship between simu-lation’s K(1) and mean water content, the same conclusionas was drawn from the comparison of theirC1(0.8) values asshown in Fig. 4.
The relationship betweenK(1) and mean water content ispresented in a generalized way in Fig. 6. The results indicatethat as the soils dried, theC1(λ) curves of the ESTAR ob-servations steepened, indicating a faster decay of correlationwith separation distance, while the GEOtop simulations hadthe opposite behavior.
Focusing on the initially-wet dry-down period (11–14July), let us investigate how the drying process could haveinduced contradictory spatial structures for observations andsimulations. Figure 7 presents the spatial pattern of the 10
July daily rainfall, derived from the dense network of 42 raingauges. The storm depths show a west-east gradient, heavierin the western part and lighter in the eastern part. The leftpanel of Fig. 8 presents the spatial patterns of soil moistureon 11 July following the 10 July storm, derived from ES-TAR observations and the short-term 800-m GEOtop sim-ulations. The effect of the drainage network on the spatialpattern of soil moisture is pronounced in the ESTAR obser-vations (compare the topography shown in Fig. 1), but it istotally missing in the GEOtop simulations. This indicatesthat the drainage network exerted more control on the spa-tial variability of soil moisture pattern for ESTAR observa-tions during wet days. On the other hand, the GEOtop sim-ulation results are more correlated with the rainfall pattern(correlation between gauge rainfall and the correspondingGEOtop soil moisture was about 0.9, which is significantlylarger than the correlation of 0.3 between gauge rainfall andESTAR soil moisture), indicating that the rainfall pattern ex-erted more control on the spatial variability of soil moisturepattern for the GEOtop simulations. The fact that ESTARshows river-network control on soil moisture immediatelyafter the rainfall event might be an indication that GEOtop,while reproducing correctly the total streamflow, does not re-produce so accurately the runoff production mechanism (i.e.whether it is from infiltration excess, saturation excess, andsubsurface flows). It appears that the lateral re-distributionis much faster in the ESTAR observations than it is in the
Nonlin. Processes Geophys., 16, 141–150, 2009 www.nonlin-processes-geophys.net/16/141/2009/
M. Gebremichael et al.: Scaling characteristics of soil moisture 149
GEOtop simulation. Looking at the scaling of soil mois-ture can therefore be a more effective verification method fordistributed hydrologic models, compared to just streamflowcomparisons and visual inspections.
The right panel of Fig. 8 presents the spatial pattern ofsoil moisture on 14 July, after the soils dried for four daysafter the 10 July storm. The effect of the drainage networkiss less pronounced on this dry day in the ESTAR observa-tions, resulting in more spatially correlated ESTAR obser-vations. However, the GEOtop simulation became less spa-tially correlated at short-range as the short-range smoothnessin spatial soil moisture induced by the rainfall pattern is lostthrough inhomogeneous soil water loss mechanisms. Mean-while, at long-range, the GEOtop simulation results becamemore spatially correlated as the long-range rainfall inhomo-geneity decreased through drying.
5 Conclusions
In this study, we have evaluated the ability of a distributedhydrologic model to reproduce the scaling characteristics ofobserved near-surface (5 cm) spatial soil moisture fields. Wechose the GEOtop hydrologic model because it is a process-based model that integrates the 3-D Richards Equation. Wetook advantage of the ESTAR microwave radiometer-basedestimates of soil moisture, available for the Little Washitawatershed during the SGP97 field campaign, for validationof model simulation results. We studied the scaling char-acteristics through the use of generalized variograms. Thefollowing conclusions are worth emphasizing:
1. Both microwave observations and model simulationsreveal that spatial soil moisture fields exhibit approx-imate scale-invariance in their generalized variogramsover length scales between 0.8 and 10.4 km.
2. Analyses of the parameters characterizing the vari-ograms of the values of microwave observations andmodel simulations indicate significant changes withspatial average soil water content. However, microwaveobservations and model simulations give contradictoryresults regarding the relationship between the variogramparameters which measure spatial organization and av-erage soil water content. Following the largest (53 mmaveraged over the watershed) rain event during the studyperiod, the drying process was seen to reduce the short-range spatial correlation of the model simulations whileincreasing the long-range, while it increased the spatialcorrelation of the microwave observations.
3. Visual inspection of spatial soil moisture maps indicatethat while microwave observations show river-networkcontrol on soil moisture immediately after the largerainfall event, model simulations fail to show this. Thisis an indication that the model simulations, though re-producing correctly the total streamflow at the outlet of
the watershed, do not accurately reproduce the runoffproduction mechanisms. Looking at the scaling char-acteristics of spatial soil moisture fields can thereforeserve as a more refined means of validating distributedhydrologic models, as compared to the traditional ap-proach of just comparing the streamflow hydrographs.
Edited by: J. de LimaReviewed by: A. Tarquis and another anonymous referee
References
Albertson, J. D. and Montaldo, N.: Temporal Dynamics of SoilMoisture Variability: 1. Theoretical Basis, Water Resour. Res.,39(10), 1274, doi:10.1029/2002WR001616, 2003.
Allen, P. B. and Naney, J. W.: Hydrology of the Little WashitaRiver Watershed, Oklahoma: Data and Analyses, USDA/ARS-90, USDA Agricultural Research Service, Durant, OK, 74 pp.,available from National Agricultural Water Quality Laboratory,Durant, OK 74702/, 1991.
Bell, K. R., Blanchard, B. J., Schmugge, T. J., and Witczak, M. W.:Analysis of surface moisture variations within large-field sites,Water Resour. Res., 16(4), 797–810, 1980.
Bertoldi, G., Rigon, R., and Over, T. M.: Impact of watershed geo-morphic characteristics on the energy and water budgets, J. Hy-drometeorol., 7, 389–403, 2006.
Das, N. N. and Mohanty, B. P.: Temporal dynamics of PSR-basedsoil moisture across spatial scales in an agricultural landscapeduring SMEX02: A wavelet approach, Rem. Sens. Environ., 112,522–534, 2008.
Dubayah, R., Wood, E. F., and Lavalee, D.: Multiscaling analysisin distributed modeling and remote sensing: an application us-ing soil moisture, in: Scale in Remote Sensing and GIS, editedby: Quattrochi, D. A. and Goodchild, M. F., Boca Raton (FL),CRC/Lewis Publishers, pp. 93–111, 1997.
Famiglietti, J. S., Devereaux, J. A., Laymon, C. A., Tsegaye, T.,Houser, P. R., and Jackson, T. J., Graham, S., Rodell, M., andvan Oevelen, P.: Ground-based investigation of soil moisturevariability within remote sensing footprints during the SouthernGreat Plains 1997 (SGP97) Hydrology Experiment, Water Re-sour. Res., 35(6), 1839–1851, 1999.
Hu, Z., Islam, S., and Chen, Y.: Statistical characterization of re-motely sensed soil moisture images, Rem. Sens. Environ., 61,310–318, 1997.
Jackson, T. J.: Southern Great Plains 1997 (SGP97) Hydrology Ex-periment Plan, USDA-ARS Hydrology Laboratory, Beltsville,MD, 178 pp., available from Beltsville Agricultural ResearchCenter, Room 104, Building 007, BARC-West, Beltsville, MD20705, 1997.
Jackson, T. J. and LeVine, D. M.: Mapping of soil moisture usingan aircraft-based passive microwave instrument: Algorithm andexample, J. Hydrol., 184, 85–99, 1996.
Jackson, T. J., LeVine, D. M., Hsu, A. Y., Oldak, A., Starks, P. J.,Swift, C. T., Isham, J. D., and Haken, M.: Soil moisture map-ping at regional scales using microwave radiometry: the South-ern Great Plains hydrology experiment, IEEE Trans. Geosci. Re-mote Sens., 37(5), 2136–2151, 1999.
www.nonlin-processes-geophys.net/16/141/2009/ Nonlin. Processes Geophys., 16, 141–150, 2009

150 M. Gebremichael et al.: Scaling characteristics of soil moisture
Jackson, T. J., Levine, D. M., Schmugge, C. T., and Schiebe, F. R.:Large area mapping of soil moisture using the ESTAR passivemicrowave radiometer in Washita ’92, Rem. Sens. Environ., 53,27–37, 1995.
LeVine, D. M., Griffiths, A. J., Swift, C. T., and Jackson, T. J.:ESTAR: A synthetic aperture microwave radiometer for remotesensing applications, Proc. IEEE, 82, 1787–1801, 1994.
Manfreda, S., McCabe, M. F., Fiorentino, M., Rodriguez-Iturbe, I.,and Wood, E. F.: Scaling characteristics of spatial patterns ofsoil moisture from distributed modeling, Adv. Water Resour., 30,2145–2150, 2007.
Mohanty, B. P., Shouse, P. J., Miller, D. A., and van Genuchten,M. T.: Soil property database: Southern Great Plains1997 Hydrology Experiment, Water Resour. Res., 38, 1047,doi:10.1029/2000WR000076, 2002.
Nijssen, B., Lettenmaier, D. P., Liang, X., Wetzel, S. W., and Wood,E. F.: Streamflow simulation for continental-scale river basins,Water Resour. Res., 33(4), 711–724, 1997.
Njoku, E. G., Jackson, T. J., Lakshmi, V., Chan, T. K., and Nghiem,S. V.: Soil moisture retrieval from AMSR-E, IEEE Geosci. Rem.Sens., 41(2), 215–229, 2003.
Nykanen, D. K. and Foufoula-Georgiou, E.: Soil moisture vari-ability and scale-dependency of nonlinear parameterizations incoupled land-atmosphere models, Adv. Water Resour., 24, 1143–1157, 2001.
Oldak, A., Pachepsky, Y., Jackson, T. J., and Rawls, W. J.: Statisti-cal properties of soil moisture images revisitied, J. Hydrol., 255,12–24, 2002.
Peters-Lidard, C. D., Pan, F., and Wood, E. F.: A re-examinationof modeled and measured soil moisture spatial variability and itsimplications for land surface modeling, Adv. Water Resour., 24,1069–1083, 2001.
Rawls, W., Brakensiek, D. L., and Saxton, K. E.: Estimation of soilproperties, Trans. ASAE, 25(5), 1316–1326, 1982.
Rigon, R., Bertoldi, G., and Over, T. M.: GEOtop; A distributedhydrological model with coupled water and energy budgets, J.Hydromet., 7, 371–388, 2006.
Rodriguez-Iturbe, I., Vogel, C. K., Rigon, R., Entekhabi, D.,Castelli, F., and Rinaldo, A.: On the spatial organization of soilmoisture fields, Geophys. Res. Lett., 22(20), 2757–2760, 1995.
Silvestrin, P., Berger, M., Kerr, Y. H., and Font, J.: ESA’s secondearth explorer opportunity mission: the soil moisture and oceansalinity mission – SMOS, IEEE Geosc. Rem. Sens. Newsl., 118,11–14, 2001.
Yaglom, A. M.: Correlation Theory of Stationary and Related Ran-dom Functions, vol. 1, Basic Results, Springer-Verlag, 526 pp.,1987.
Nonlin. Processes Geophys., 16, 141–150, 2009 www.nonlin-processes-geophys.net/16/141/2009/