on the path to health equity: building capacity to … capacity to measure health... · social and...
TRANSCRIPT

ON THE PATH TO HEALTH EQUITY:BUILDING CAPACITY TO MEASURE HEALTH
OUTCOMES IN COMMUNITY DEVELOPMENT
Findings From a National Demonstration Project

ON THE PATH TO HEALTH EQUITY:BUILDING CAPACITY TO MEASURE HEALTH OUTCOMES IN COMMUNITY DEVELOPMENT
2
The Health Outcomes Demonstration Project was jointly implemented by Enterprise Community Partners and Success Measures® at NeighborWorks® America and supported by the Robert Wood Johnson Foundation, The Kresge Foundation, The Hearst Foundation, NeighborWorks America, Enterprise Community Partners, and the U.S. Department of Housing and Urban Development. In-kind support was provided by the Federal Reserve Bank of San Francisco.
Enterprise Community Partners and Success Measures at NeighborWorks America are grateful for the guidance, support and engaged participation in the Health Outcomes Demonstration Project by the project funders. We would also like to acknowledge the commitment and thoughtful contributions of the 20 housing and community development organizations that made this project a success, as well as Nemon Consulting and Karen Horsch Consulting for the valuable technical assistance they provided along the way.
© Copyright 2019 Neighborhood Reinvestment Corporation. All rights reserved.
ACKNOWLEDGMENTS
The Health Outcomes Demonstration Project cohort and project team at the final convening in November 2018.
Enterprise Community Partners Knowledge, Impact and Strategy
Stephany De Scisciolo, Ph.D., Vice President Lindsay Eilers, Director of Impact Assessment & EvaluationBethany Boland, Program OfficerMargaret Scott, Information Analyst
Success Measuresat NeighborWorks America
Maggie Grieve, Vice PresidentJessica Mulcahy, Director of Philanthropic Evaluation StrategiesLinda Kahn, Editor
Report design by Aaron Geis
THIS REPORT WAS PREPARED BY-

ON THE PATH TO HEALTH EQUITY:BUILDING CAPACITY TO MEASURE HEALTH OUTCOMES IN COMMUNITY DEVELOPMENT
3
EXECUTIVE SUMMARY .............................................................................................4
INTRODUCTION ........................................................................................................8
BUILDING BLOCKS FOR SUCCESS ........................................................................... 12
TRAJECTORY OF IMPACT ....................................................................................... 20
Understand and Connect .........................................................................................................21
Measure and Improve ..............................................................................................................26
Prepare and Commit ................................................................................................................ 36
Partner and Transform .............................................................................................................40
INSIGHTS FOR THE FIELD ....................................................................................... 44
CONCLUSION AND NEXT STEPS ............................................................................. 50
APPENDICES .......................................................................................................... 52
Appendix A ............................................................................................................................... 53
Appendix B ............................................................................................................................... 57
Appendix C ............................................................................................................................... 61
TABLE OF CONTENTS

ON THE PATH TO HEALTH EQUITY:BUILDING CAPACITY TO MEASURE HEALTH OUTCOMES IN COMMUNITY DEVELOPMENT
4
EXECUTIVE SUMMARY
Across the United States, many communities are grappling with persistent health inequities and the effect that they have on people’s lives. These inequities are heavily influenced by the “conditions in the places where people live, learn, work, and play,”i referred to as the social determinants of health (SDOH).
Researchers and practitioners are working to better understand the effect of place on individual and population health outcomes.ii There is growing recognition that differences in community conditions are directly tied to significant disparities in health outcomes. It is telling that only 20 percent of our health is shaped by clinical care, while 50 percent is determined by social and economic factors and the physical environment and 30 percent by our individual behaviors.iii
Yet even as the understanding of the importance of the SDOH has broadened, health care interventions largely remain focused on meeting the needs of single individuals (such as the “frequent flyers” in an emergency department) rather than addressing the root causes of poor health, which often occur at a community level.
For decades, community development organizations have been addressing these root causes by focusing on the SDOH. Working on the front lines of managing the critical needs of the populations they serve, community development practitioners are integral to the efforts to reduce health disparities. The Centers for Disease Control and Prevention underscores the importance of the role of community development in achieving
10%PHYSICAL
ENVIRONMENT
40%SOCIAL AND
ECONOMIC FACTORS
30%HEALTH
BEHAVIORS
20%CLINICAL CARE
Access to Care
Air & Water Quality
Housing
Transportation
Jobs & Income
Social Cohesion
Community Safety
Child Development
Diet& Exercise
Education
Health and Well-Being
80% of individuals’ healthis determined by their behaviors and the social and environmental conditions in which they live, work and play.
FACTORS THAT IMPACTHEALTH AND WELL-BEING
EXECUTIVE SUMMARY

ON THE PATH TO HEALTH EQUITY:BUILDING CAPACITY TO MEASURE HEALTH OUTCOMES IN COMMUNITY DEVELOPMENT
5
health equity: “By applying what we know about the SDOH, we can not only improve individual and population health but also advance health equity.”iv
The health sector is beginning to address community-based challenges. Health care systems are working to reduce the expenses of high-utilization patients by buying food, offering temporary housing, and covering their transportation costs.v
Strengthening the bonds between the community development and health care sectors is a logical and necessary next step in the evolution of both fields of practice. By these two sectors recognizing their common goals and working together to address the powerful interplay of individual circumstances and neighborhood conditions, the trend of rising health care costs and increasing inequities in health outcomes can be slowed.
Initiatives that link community development and health care have been scaled and are increasingly seen as critical health interventions, such as on-site health services for residents at affordable housing developments. However, evaluating and documenting the shared outcomes between these fields has been an ongoing challenge. The lack of standard measurement practices
has hindered the ability of the community development sector to make its case in a way that resonates with health care providers and payers who strictly adhere to evidence-based practices.
The Health Outcomes Demonstration Project addressed this gap by helping 20 affordable housing and community development organizations evaluate the health outcomes of one of their programs. This national initiative was jointly designed and implemented by NeighborWorks America and Enterprise Community Partners, two national intermediaries in the affordable housing and community development field.
Marietta Rodriguez, CEO and President of NeighborWorks America, highlighted the importance of this work: “I think everyone who works in community development has seen evidence of how individuals and families begin to thrive when they are able to live in a healthy, stable home and a connected, strong community. But we haven’t had good ways to document the results of our efforts to address the many social determinants and place-based factors that contribute to health. This project has taken a big step in demonstrating how that can be done and it’s very exciting!” Laurel Blatchford, President of Enterprise Community Partners,
EXECUTIVE SUMMARY

ON THE PATH TO HEALTH EQUITY:BUILDING CAPACITY TO MEASURE HEALTH OUTCOMES IN COMMUNITY DEVELOPMENT
6
further emphasized the value of projects like this in building the capacity of organizations to establish their impact. “Having the power to demonstrate the positive impacts of your work on people’s lives is a key driver in bringing about the systems change necessary to eliminate persistent health disparities and improve health outcomes for people of color.”
The Robert Wood Johnson Foundation (RWJF), one of the project’s funders, recognized the alignment between the goals of the demonstration project and its own Culture of Health Action Framework, which emphasizes the complex community factors that influence health and calls for engagement across sectors to address them.
“As the largest U.S. foundation that works solely on health, the Robert Wood Johnson Foundation believes that everyone deserves to be healthy,” said Oktawia Wójcik, Ph.D., Senior Program Officer at the Robert Wood Johnson Foundation. “But now that involves much more than health care—it needs to be intermingled with other sectors, like community development, to really create healthier, more equitable communities. It
takes organizations, like the ones in this important project, to be innovative and to change the mindset about what equity means by changing policy, leveraging financing and activating partnerships.”
The 20 organizations from across the United States that participated in the Health Outcomes Demonstration Project evaluated a range of community-based programs that address the SDOH. The evaluated programs include neighborhood improvement and community safety initiatives, youth education and services, housing improvements, and service coordination for residents in crisis, as well as housing-based services that focus on nutrition, physical activity, financial literacy, social activities, mental health and employment.
The project deployed an innovative set of health outcome measurement tools developed by Success Measures, the evaluation group at NeighborWorks America—alongside technical assistance, peer-learning opportunities and grant resources—to foster organizational learning and expand evaluation capacity.
EXECUTIVE SUMMARY

ON THE PATH TO HEALTH EQUITY:BUILDING CAPACITY TO MEASURE HEALTH OUTCOMES IN COMMUNITY DEVELOPMENT
7
EXECUTIVE SUMMARY
Over the course of the project, the organizations moved along a continuum of learning that expanded their capacity to understand and evaluate their role in improving health outcomes for their residents or clients. This continuum, with key steps summarized below, reflects the key ways in which the demonstration project built this capacity and offers a framework for similar efforts.
• Understand & Connect: Focusing an evaluation on the social determinants of health helped participants understand the connection between their work and the health and well-being of the people they serve in a deeper way.
• Measure & Improve: Implementing the evaluation process and collecting data positioned the participants to better understand their clients and improve programs to strengthen health outcomes.
• Prepare & Commit: Building evaluation capacity prepared participating organizations to implement and evaluate evidence-based solutions.
• Partner & Transform: Engaging with diverse perspectives throughout the evaluation process equipped the participants to initiate and deepen transformative cross-sector partnerships.
By the end of the project, the organizations had moved through this continuum and acquired the language, evaluation tools and evidence needed to articulate the connection between their work and individual health outcomes and were equipped to convey their findings in a way that would resonate with current and future health care partners.
Unique in many ways, this highly collaborative project brought together two large national affordable housing intermediaries, 20 independent community-based nonprofit organizations, and multiple funders representing health and community development. Each evaluation differed, and each organization had its own goals and mission. A shared commitment to demonstrating the value of community-based solutions and improving individual and population health outcomes was the connective tissue that held it all together.
The success of this project can energize others to form the deep, cross-sector partnerships necessary to create the lasting change in communities that will lead to equitable health outcomes for all. This report highlights the transformative process that the cohort experienced, with the Health Outcomes Demonstration Project serving as a catalyst for change.
“It takes organizations, like the ones in this important project, to be innovative and to change the mindset about what equity means by changing policy, leveraging financing and activating partnerships.”
Oktawia Wójcik, Ph.D.Senior Program Officer at the Robert Wood Johnson Foundation

ON THE PATH TO HEALTH EQUITY:BUILDING CAPACITY TO MEASURE HEALTH OUTCOMES IN COMMUNITY DEVELOPMENT
8
INTRODUCTION
The Health Outcomes Demonstration Project was a multi-year national initiative created to address the challenges that affordable housing and community development organizations face in demonstrating the effects of their programs on the health outcomes of those they serve.
The project evolved out of the growing recognition that health is largely driven by individual and community factors that take place outside the walls of a hospital or physician’s office. These include the physical, social, environmental and economic factors that influence health both directly and indirectly. Known as the “social determinants of health” (SDOH), they represent the complex set of factors in our daily lives that shape individual and community health.vi
The SDOH model offers a framework for evaluation, as it demonstrates the connection between the factors addressed by community development initiatives and health outcomes. The demonstration project intentionally used the SDOH model as an evaluation framework to highlight this connection so that community development organizations can better understand
the health of their communities, improve their program offerings and partner more effectively with the health sector. However, demonstrating the health outcomes of community development is challenging without data collection tools that capture relevant health information and allow organizations to effectively evaluate the effects of their programs on client health.
This demonstration project addressed that gap, equipping affordable housing and community development organizations with the measurement tools necessary to evaluate the influence of their programs on the health outcomes of the people they serve. Jointly implemented by Enterprise Community Partners (Enterprise) and Success Measures at NeighborWorks America (Success Measures), this innovative national initiative provided measurement tools and evaluation resources to a cohort of 20 affordable housing and community development organizations from across the United States that are working on the front lines of community health. The insights and capacity that they developed over the course of the project were a valuable step toward advancing health equity in the communities where they work.
THE SOCIAL DETERMINANTS OFHEALTH FRAMEWORK
HEALTH OUTCOMES
HEALTH FACTORS
POLICIES & PROGRAMS
SOCIAL FACTORS
ECONOMIC FACTORS
CULTURAL NORMS & HEALTH BEHAVIORS
PHYSICAL ENVIRONMENT
CLINICAL CARE
Family & Social SupportSocial CohesionLeadership, Empowerment, EfficacyCommunity SafetyChildhood Development
Alcohol, Drug and Tobacco UseDiet & ExerciseSexual ActivitySocial Norms
EducationJobs & IncomeSelf-Sufficiency Opportunities
Air & Water QualityHousing & TransitInfrastructure
Access to CareQuality of Care
LENGTH OF LIFE
QUALITY OF LIFE
Adapted by the demonstration project team from the County Health Rankings model © 2014 UWPHI
INTRODUCTION

ON THE PATH TO HEALTH EQUITY:BUILDING CAPACITY TO MEASURE HEALTH OUTCOMES IN COMMUNITY DEVELOPMENT
9
PARTICIPATING ORGANIZATIONS
AVENUE COMMUNITYDEVELOPMENT CORPORATION
CHICANOS POR LA CAUSA
CLARETIAN ASSOCIATES
COMMUNITY HOUSING PARTNERS CORPORATION
SELFHELP COMMUNITY SERVICES, INC.
CAMBA/CAMBAHOUSING VENTURES, INC.
CORNERSTONE COMMUNITY HOUSING
SPOKANE NEIGHBORHOOD ACTION PARTNERS
EAH HOUSING
WEST ANGELES COMMUNITY DEVELOPMENT CORPORATION
HOUSING PARTNERSHIP, INC.
COMMUNITY HOUSING PARTNERSHIP
CHHAYA COMMUNITY DEVELOPMENT CORPORATION
NEIGHBORWORKS ALASKA
THE NEIGHBORHOOD DEVELOPERS, INC.
NEIGHBORWORKS ROCHESTER
NEIGHBORWORKS OF WESTERN VERMONT
MADISON PARKDEVELOPMENT CORPORATION
SERVICES FOR THE UNDERSERVED, INC.
LITTLE TOKYO SERVICE CENTER
Housing-Based Services
= 14Services Provided
to Community
= 6Neighborhood
Improvement Initiatives
= 2
Resident Services
INTRODUCTION
Supportive Housing Housing Rehab and Healthy Housing Initiatives
Financial Counseling and Asset Building Community-Level Initiatives

ON THE PATH TO HEALTH EQUITY:BUILDING CAPACITY TO MEASURE HEALTH OUTCOMES IN COMMUNITY DEVELOPMENT
10
Over a two-year period, from early 2017 through early 2019, the 20 participating organizations were guided through the process of designing and implementing a health outcomes evaluation, which included two rounds of primary data collection. This report provides an overview of the project and highlights the participants’ continuum of learning with insights for broader application to the field.
The information presented in this report is based on planning exercises, client and community resident surveys, analysis
of client and resident data at the organizational level and across the cohort of participating organizations, reports and presentations, participant observations, and a capacity assessment survey administered by the project team.
Taken together, the project’s key findings present a compelling case for the benefits of evaluating the health outcomes of community development work and offer a path for strengthening the strategic alignment between these two sectors.
HEALTH OUTCOMES DEMONSTRATION PROJECT GOALS
Advance existing efforts to improve individual and community health through housing and community development programs and strategies.
Support organizations in developing and implementing an outcome measurement method for their health-related programs.
Build organizational capacity to effectively use evaluation data to inform program improvement, cross-sector partnership development and communications with residents and other stakeholders.
Contribute to a national body of evidence articulating the intrinsic relationship between housing, community development and health.
INTRODUCTION

ON THE PATH TO HEALTH EQUITY:BUILDING CAPACITY TO MEASURE HEALTH OUTCOMES IN COMMUNITY DEVELOPMENT
11
I. BUILDING BLOCKS FOR SUCCESS:

ON THE PATH TO HEALTH EQUITY:BUILDING CAPACITY TO MEASURE HEALTH OUTCOMES IN COMMUNITY DEVELOPMENT
12
BUILDING BLOCKS FOR SUCCESS
Participants, Partnerships and Project Design
The highly collaborative Health Outcomes Demonstration Project brought together 20 diverse housing and community development organizations from across the country, as well as two national housing and community development intermediaries, health-focused foundations and other philanthropic partners around a shared goal. Committed organizations, strong partnerships and a comprehensive project design were key building blocks necessary to ensure success.
Representing the Diversity of the FieldThe participating community-based organizations were essential to the project’s success. Their collective commitment, engagement and contributions created a rich opportunity for capacity building and peer learning that strengthened the project’s impact and helped bring about many of the insights shared in this report.
Selecting the 20 organizations to participate was a critical step in the process, as each needed to demonstrate readiness to conduct a health outcomes evaluation of an existing program. Organizations were chosen through a competitive Request for Proposals process jointly run by Enterprise and Success Measures. The selected organizations (shown in Table 1) represent the breadth and depth of the affordable housing and community development field, working with their communities to identify local challenges and develop place-based solutions in both rural and urban areas in 13 different states.
While all of the organizations operate a robust set of programs and services, they each selected one program for evaluation as part of this demonstration project. The programs serve from 100 to more than 1,300 individuals and target a variety of demographic groups, including youth, elders, renters, homeowners and the formerly homeless.
Of the 20 organizations, 14 chose to evaluate housing-based services offered to residents of their multifamily affordable housing properties, including services focused on nutrition, physical activity, financial literacy, social activities, mental health, tutoring and employment. Two of the organizations evaluated programs that focus on neighborhood improvement initiatives, and the remaining four organizations focused on programs that offer services and support to specific populations at a city or regional scale, including physical improvements to housing, youth education and services, community safety, and service coordination for residents in crisis.
BUILDING BLOCKS FOR SUCCESS

ON THE PATH TO HEALTH EQUITY:BUILDING CAPACITY TO MEASURE HEALTH OUTCOMES IN COMMUNITY DEVELOPMENT
13
The StayWell! Initiative organizes resident services and programs for older adult residents, including healthy eating, physical and mental health education, community building, andcivic engagement.
EAH Housing
Marin County, CA
TABLE 1. PARTICIPATING ORGANIZATIONS
Organization Program Evaluated
The ACDC Resident Services Program assists residents with the development of educational,financial and vocational skills through after-school programs and coaching.
Avenue CommunityDevelopment Corporation
Houston, TX
CAMBA provides access to health care and mental health care, including counseling and other training programs, to residents of a permanent supportive housing development.
CAMBA/CAMBA Housing Ventures, Inc.
Brooklyn, NY
The Asset Building Program provides clients with tools and information to achieve economic independence through housing counseling, financial capability and asset building.
Chhaya Community Development Corporation
Queens, NY
The CPLC Healthy Aging elderly service programs include health education, multi-purpose activities, healthy meals and food, and regularly scheduled social events.
Chicanos Por La Causa
Phoenix, AZ
Claretian Associates offers supportive wrap-around services to residents of their senior and multifamily affordable housing rental units, including providing space on-site for a health clinic to treat residents on a regular basis, financial education, food programs and art classes.
Claretian Associates
Chicago, IL
The CHP Resident Services Program includes chronic disease self-management, nutrition classes, wellness checks, smoking cessation, food pantry meals, mobility through movement, resident activities and crime watch.
Community HousingPartners Corporation
Sites throughout Virginiaand in Baltimore, MD
Community Housing Partnership’s Clinical Behavioral Health Services are based on a recovery model, guided by trauma-informed and harm-reduction principles and include intensive clinical case management.
CommunityHousing Partnership
San Francisco, CA
The Extra Helping program offers free fresh produce distribution that addresses food insecurity, social cohesion, and financial health and well-being.
CornerstoneCommunity Housing
Lane County, OR
BUILDING BLOCKS FOR SUCCESS
The High-Fidelity Wraparound (HFW) model is used to serve clients diagnosed with mental illness and features an intensive planning and service coordination process.
Housing Partnership, Inc.
Palm Beach County, FL

ON THE PATH TO HEALTH EQUITY:BUILDING CAPACITY TO MEASURE HEALTH OUTCOMES IN COMMUNITY DEVELOPMENT
14
The Smoke-Free Initiative started in 2015 when Spokane Neighborhood Action Partners implemented a policy across its housing portfolio banning indoor smoking to improve the residents’ health.
Spokane NeighborhoodAction Partners
Spokane, WA
TABLE 1. PARTICIPATING ORGANIZATIONS (continued)
Organization Program Evaluated
The Resident Services Youth Program provides creative and unique opportunities for mentorship, academic tutoring, recreational activities and leadership development.
Little Tokyo Service Center
Los Angeles, CA
Healthy Eating in Roxbury’s activities include regularly scheduled nutrition education events, such as guided grocery store tours, cooking and smoothie demonstrations, and other educational events, as well as support for two community gardens.
Madison ParkDevelopment Corporation
Roxbury, MA
The Homeownership Center’s Financial Capability Program teaches interested homeowners about the purchase process and works on post-purchase plans for new homeowners.
NeighborWorks Alaska
Anchorage, AK
The Healthy Blocks initiative is a targeted neighborhood stabilization effort to improve property conditions, facilitate resident engagement and bolster neighborhood identity.
NeighborWorks Rochester
Rochester, NY
The Selfhelp Active Services for the Aging Model (SHASAM) blends social services and health promotion activities, including social services intake, screening, assistance and advocacy for benefits, health screenings, wellness programs, socialization events, access to technology, and a range of other services.
Selfhelp Community Services, Inc.
Queens, NY
The S:US urban farms initiative operates community gardens where residents serve as the primary caretakers by planting, tending and harvesting organic produce shared amongall residents.
Services for theUnderServed, Inc.
Brooklyn, NY
Chelsea Thrives is a cross-sector collaborative launched in 2014 that seeks to reduce crimeby 30 percent over 10 years and improve the community’s sense of safety.
The NeighborhoodDevelopers, Inc.
Chelsea, MA
The West Angeles resident services program for senior residents includes yoga, line dancing, massages, and classes on diabetes awareness, financial literacy, and healthy cooking.
West Angeles Community Development Corporation
Los Angeles, CA
Note: Additional information about the organizations and programs can be found in Appendix A.
BUILDING BLOCKS FOR SUCCESS
The Health and HEAT Squad partners with medical providers to address housing conditions associated with asthma and chronic obstructive pulmonary disease, as well as accessibility for the handicapped and elderly.
NeighborWorksof Western Vermont
West Rutland, VT

ON THE PATH TO HEALTH EQUITY:BUILDING CAPACITY TO MEASURE HEALTH OUTCOMES IN COMMUNITY DEVELOPMENT
15
Assuring Success with National PartnershipsThe national demonstration project leveraged the strengths of NeighborWorks and Enterprise. Each organization has a deep network of affordable housing and community development organizations across the country. Recognizing their collaborative power and synergy, the two organizations joined forces to design and implement a project that could increase the capacity of community-based organizations to conduct thoughtful evaluations focused on the health outcomes of their work. By doing so, NeighborWorks and Enterprise aimed to position these organizations to contribute to the national conversation about the connections between community conditions and health.
For more than 40 years, NeighborWorks has supported a network of local housing and community development member organizations through grants, training and technical assistance to implement a broad range of programs in affordable housing and homeownership, financial capability, comprehensive community development, healthy homes and communities, community building, and resident engagement. In the last five years, the network organizations—now numbering almost 245—have generated more than $34 billion in investment across the country.
Success Measures, a social enterprise at NeighborWorks, is an evaluation resource group with significant expertise and experience in building organizational capacity for evaluation. Success Measures offers evaluation consulting services, technical assistance and more than 350 measurement tools for the affordable housing and community development sector to use when conducting evaluations.
Complementing Success Measures’ role on the project, Enterprise brings a national perspective on the intersection between health, the built environment and community development. An early pioneer in the field of healthy affordable housing, Enterprise has created nearly 585,000 homes and invested $43.6 billion over the past 35 years and has a long history of partnering with nonprofit community development organizations on capacity building and technical assistance efforts.
The Knowledge, Impact and Strategy (KIS) team at Enterprise promotes data-driven decision-making by creating tools and resources for use in the field, cultivating key partnerships and implementing a broad research agenda for the affordable housing and community development field.
BUILDING BLOCKS FOR SUCCESS

ON THE PATH TO HEALTH EQUITY:BUILDING CAPACITY TO MEASURE HEALTH OUTCOMES IN COMMUNITY DEVELOPMENT
16
From the beginning, Success Measures included NeighborWorks’ Healthy Homes and Communities Program as a key collaborator, leveraging its expertise and networks in both the health and community development arenas. Similarly, KIS collaborated with Enterprise’s Health and Housing Initiative, a national team dedicated to building cross-sector partnerships among community members, health systems, health insurers, housing developers, policymakers, public health associations, community development organizations, social impact investors and foundations.
The deep and shared commitment on the part of both NeighborWorks and Enterprise to transforming communities for the benefit all residents contributed mightily to the success of the project.
Together, NeighborWorks and Enterprise sit at the nexus of a broad network of organizations and partners. These connections inform the work of both organizations at the intersection of health and community development, enable them to leverage a diverse set of stakeholders and position them to disseminate key learnings to the broader field.
From its initial planning stages, the demonstration project benefited from the philanthropic and field-building initiatives being implemented by the project’s funders, as well as by the work of other national partners, including the Build Healthy Places Network, the Well Being Trust and Kaiser Permanente.
In particular, the project’s SDOH framework and the Success Measures Health Outcome Tools (Health Tools) are closely aligned with the RWJF Culture of Health Action Framework, which moves the definition of health beyond traditional clinical or population-level measures to action areas that are routinely a part of the work of housing and community development. Using the SDOH framework as the basis for the project evaluations provided a way to translate elements of the Culture of Health, a national vision and measurement effort, to the community level.
Additionally, the demonstration project was significantly informed by the research, thought leadership and health equity grantmaking of The Kresge Foundation, the Federal Reserve Bank of San Francisco’s community development program and the deep experience of The Hearst Foundation in both the health and community development fields. The participating organizations also benefited from the engagement of the project funders and other partners in the project’s in-person convenings that brought together the entire project cohort.
All the project funders and partners are deeply committed to reducing health inequities and improving communities. Their support of efforts in the field, like the demonstration project, will lead to lasting, transformative change to existing systemic and institutional barriers that contribute to wide disparities in health outcomes among low-income populations and people of color.
BUILDING BLOCKS FOR SUCCESS
HEALTH OUTCOMES DEMONSTRATION PROJECT FUNDING PARTNERS
• Robert Wood Johnson Foundation
• The Kresge Foundation
• The Hearst Foundation
• NeighborWorks America
• Enterprise Community Partners
• U.S. Department of Housing and Urban Development
• Federal Reserve Bank of San Francisco (in-kind support)

ON THE PATH TO HEALTH EQUITY:BUILDING CAPACITY TO MEASURE HEALTH OUTCOMES IN COMMUNITY DEVELOPMENT
17
BUILDING BLOCKS FOR SUCCESS
Increasing Evaluation Capacity With Comprehensive Project Design The project was intentionally designed to enable housing and community development organizations to better understand the health of their communities and the contributions of their work and programming on health outcomes. Each of the 20 organizations designated two staff members to serve as the primary project participants, oversee the organizations’ evaluation process and communicate what they learned to the rest of the organization.
Key components of design and implementation ensured that participants had the proper support and resources to successfully engage in the evaluation effort. These key components included a planning stage, in which the organizations planned their evaluations and created their surveys, and two rounds of data collection and analysis.

ON THE PATH TO HEALTH EQUITY:BUILDING CAPACITY TO MEASURE HEALTH OUTCOMES IN COMMUNITY DEVELOPMENT
18
CREATEOUTCOME MAP
• Identify program outcomes • Connect work to the SDOH
PLAN FOR DATA COLLECTION
• Create evaluation plan• Develop customized surveys for local context using the Health Tools
COLLECT ROUND ONE DATA
• Create data collection plan• Conduct round one data collection
ANALYZE ROUNDONE DATA
• Analyze round one data • Identify needed program changes based on data
COLLECT ROUND TWO DATA
• Identify changes to survey questions and data collection methods to improve data quality• Conduct round two data collection
ANALYZE ROUND TWO DATA
• Analyze round two data• Develop final report and presentation detailing evaluation findings
PROJECT START PROJECT ENDIn-Person Convening and Capacity Survey
Implementing for learning Supported by a variety of learning opportunities, the organizations went through the process of planning and conducting their evaluations using the SDOH as an organizing framework. This process helped them understand how their work connects to the SDOH and how specific programs and interventions can positively influence these factors and lead to better health outcomes. Two rounds of data collection allowed the organizations to test data collection methods and strategies in the first round, reflect on the information they received, and then refine methods in the second round.
Allowing the independence and flexibility to design and refine their methods between data collection rounds enabled organizations to engage with the SDOH framework in ways that were most useful and applicable to their community. Three convenings—at the project’s beginning, midpoint and end—provided opportunities to learn and share in person as the project progressed.
Throughout each phase, the project team administered capacity assessment surveys to understand how organizational capacity changed over time, with a focus on organizations’ strengths,
growth areas and support needed. The capacity surveys conducted at the project’s start and midpoint were particularly valuable because the findings allowed the project team to shape and then hone the technical assistance provided to better support the organizations in strengthening their evaluation knowledge and skills.
The results of the capacity survey, which are referenced throughout this report, highlight the ways in which the organizations evolved in their understanding of the SDOH and their ability to select health outcome measures aligned with their work.
Aligning resources to meet critical needsAs the organizations moved through the project, key resources were provided to support their efforts. The provision of technical assistance and grant resources alongside measurement tools equipped the participants to successfully complete a health outcomes evaluation. Coupled with opportunities for peer learning and engaging with national experts, this comprehensive set of resources and supports was a crucial part of the overall project design.
BUILDING BLOCKS FOR SUCCESS
KEY PROJECT MILESTONES

ON THE PATH TO HEALTH EQUITY:BUILDING CAPACITY TO MEASURE HEALTH OUTCOMES IN COMMUNITY DEVELOPMENT
19
BUILDING BLOCKS FOR SUCCESS
Innovative tools to measure health outcomesMeasurements of individual health outcomes have historically focused on clinical measures. While critical indicators of health, clinical measures best capture the consequences, rather than the upstream factors, that influence individual and community health. Though many community development organizations are involved in health-related programming, most are not equipped to collect or analyze the factors that influence health outcomes, which limits their ability to evaluate program effectiveness. Without a set of tools to measure and track changes in health outcomes, community development organizations have lacked the ability to connect their work to improved health in a meaningful way.
To help housing and community development organizations measure and document changes in health outcomes, Success Measures developed a set of more than 65 health outcome measurement tools. Publicly released in 2017, the Success Measures Health Outcome Tools (Health Tools) cover topics ranging from attitudes about health to the accessibility of health care and community resources. Tools include multiple survey questions, interview guides and other resources that can be used to gather data from clients, residents or community members.
These tools provide a comprehensive way to measure the impact of affordable housing and community development programs on factors that influence individual and community health outcomes. The project participants served as an important pilot group for the new set of tools, enabling Success Measures to gain important insight into the ways in which these organizations used the tools to develop evaluation surveys.
To understand the reliability and usefulness of the Success Measures tools to measure health outcomes by housing and community development organizations, RWJF engaged Community Science as a third-party evaluator. Community Science is a research and development organization that works with public and nonprofit organizations on solutions to social problems. Findings from their evaluation are available in a public report and will help shape future iterations of the Health Tools.vii
Technical assistance and financial supportOrganizations received critical support throughout the project in the form of technical assistance, financial support and peer-learning opportunities. Experienced evaluation technical assistance providers offered one-on-one coaching, while monthly training webinars reinforced key evaluation concepts and helped to ensure that the organizations were able to successfully complete the project. Three in-person convenings, which were attended by all participants, provided opportunities for peer learning, as well as a chance to interact with the project funders and national experts who helped them to understand the significance of their efforts to measure health outcomes within the context of the SDOH.
Each organization received unlimited access to the Health Tools, as well as a subscription to the Success Measures Data System, a web-based platform that facilitated survey design and data collection.
The organizations also received $45,000 grants to support staff time to conduct their evaluations and offset data collection expenses, in addition to travel funds to participate in the convenings. This support made it possible for the participating organizations to devote the staff and leadership time needed to successfully complete the project, refine an existing program based on client data and increase their organizational capacity for future evaluation work.

ON THE PATH TO HEALTH EQUITY:BUILDING CAPACITY TO MEASURE HEALTH OUTCOMES IN COMMUNITY DEVELOPMENT
20
TRAJECTORY OF IMPACT
Moving From Awareness to Action
The project design moved the organizations along an “Awareness to Action” continuum. As participants worked through the individual components of designing and implementing an evaluation, each step enabled them to learn a new skill or consider their work in a different way.
The results from their evaluations, coupled with an applied understanding of the SDOH framework, gave participants the confidence needed to approach local health partners and explore working together to achieve their shared goal of improving health outcomes, a critical step on the path to pursuing health equity in their communities. These partnerships can be catalytic in “moving the needle” on health disparities; each organization is now equipped and energized to put its newfound skills and knowledge to work in service of its community.
The continuum of learning facilitated by the project is represented in the following graphic, moving the participants through the components of understanding and connecting the SDOH framework to their work, measuring outcomes and improving their programs based on their evaluation findings, preparing their organizations to commit to evaluation as a means to inform evidence-based solutions, and partnering with health organizations to spark transformative change within their communities. We explore each of these components in more detail in the following sections of the report.
DEMONSTRATION PROJECT CONTINUUM OF LEARNING
TRAJECTORY OF IMPACT
Understand& Connect
Focusing an evaluation on the social determinants of health helped participants understand the connection between their work and the health and well-being of the people they serve in a deeper way.
Measure& Improve
Implementing the evaluation process and collecting data positioned the participants to better understand their clients and improve programs to strengthen health outcomes.
Prepare& Commit
Building evaluation capacity prepared participating organizations to implement and evaluate evidence-based solutions.
Partner& Transform
Engaging with diverse perspectives throughout the evaluation process equipped the participants to initiate and deepen transformativecross-sector partnerships.

ON THE PATH TO HEALTH EQUITY:BUILDING CAPACITY TO MEASURE HEALTH OUTCOMES IN COMMUNITY DEVELOPMENT
21
Embracing the SDOH FrameworkPeople who work in the affordable housing and community development fields often have an intuitive understanding of the impact of community conditions on health outcomes. Many have personally observed how quality, stable housing —particularly when coupled with support services—can help people maintain or improve their health. However, few organizations have the framework or data collection tools to effectively connect interventions such as stable housing to individual health outcomes, whether clinical or social. Even less recognized is how other types of interventions, such as financial literacy or community gardening, can influence health.
Given this reality, the project relied on the SDOH as a framework for evaluation to help housing and community development organizations understand and illustrate how community-based interventions can influence health outcomes. At the outset, the first capacity survey found that familiarity with the SDOH varied among the participants. Less than 60 percent of respondents (21 out of 38 respondents) associated social connections, such as a sense of connection and social supports, with health. Similarly, only 23 respondents associated the physical environment (quality housing, streets, sidewalks, safety, etc.)
with health outcomes. These findings served as an important reminder to the project team that the SDOH must be a continual focus to strengthen participant understanding of the connection between their work and health.
Consequently, initial work with the organizations focused on helping them connect and describe their programs in the context of their contribution to health outcomes using the SDOH framework. Throughout the first in-person convening and one-on-one technical assistance sessions, “outcome maps” were used as a tool for helping the organizations conceptually link their programs to the SDOH framework. Working with their technical assistance provider, the participants used the outcome map worksheets to indicate the short-, mid- and long-term outcomes of their programs and identify the target population that benefits from their work.
The process of creating an outcome map helped the participants determine which health outcomes to measure as part of their evaluation, serving as a bridge between having a general understanding of their contribution to health outcomes and designing surveys to measure those outcomes.
TRAJECTORY OF IMPACT
Understand & Connect
Focusing an evaluation on the social determinants of health helped participants understand the connection between their work and the health and well-being of the people they serve in a deeper way.
“The outcome map approach was very helpful in truly understanding the impact of addressing SDOH on residents. The [project] work was being conducted at the same time that [we had] been working to understand the health impact of providing social services across multiple populations. The outcome map is useful for demonstrating the anticipated impact of services across multiple programs, not just housing.”
Selfhelp Community Services, Inc.

ON THE PATH TO HEALTH EQUITY:BUILDING CAPACITY TO MEASURE HEALTH OUTCOMES IN COMMUNITY DEVELOPMENT
22
Applying the SDOH Framework to EvaluationParticipants’ initial outcome maps typically reflected multiple SDOH categories they expected to influence with their programs. As they planned their evaluations and designed their data collection instruments, participants began to focus on the outcomes they most wanted to measure. This narrowing of focus is a critical step in evaluation and an important lesson for organizations to carry forward in future evaluation work.
With the guidance and support of their technical assistance providers, organizations identified relevant survey questions from the Health Tools and created original questions as needed to address specific aspects of a program. These customized survey instruments were aimed at measuring each program’s intended outcomes. Table 2 below provides examples of survey questions used by some organizations to measure their program outcomes.
TABLE 2. EXAMPLES OF SURVEY QUESTIONS USED BY ORGANIZATIONS
Social Determinants of Health Category Example Survey Questions
Overall, considering everything, how much do you feel that people in your community can count on each other when they need help?
Family & Social Support
How much do you think the people in your apartment community get along with each other?Social Cohesion
How much do you think the people in your apartment community actively participate in community or civic organizations?
Leadership, Empowerment, Efficacy
How safe do you feel in your home during the day?Community Safety
How secure do you feel your financial situation is right now?Self-Sufficiency Opportunities
Do you smoke cigarettes?Alcohol, Drug and Tobacco Use
On a typical day, how often do you include vegetables of any type (either cooked or raw) in the meals you eat?
Diet & Exercise
How do you feel about your current housing situation?Housing & Transit
During the past 12 months, was there any time when you needed health care for yourself, but you didn’t get it?
Access to Care
TRAJECTORY OF IMPACT

ON THE PATH TO HEALTH EQUITY:BUILDING CAPACITY TO MEASURE HEALTH OUTCOMES IN COMMUNITY DEVELOPMENT
23
As the participants developed and implemented their surveys, and their understanding of the SDOH framework became more targeted and nuanced, they continued to review and refine their outcome maps to focus on fewer and fewer outcome categories. As a result, the surveys
deployed in the second round of data collection focused on far fewer SDOH categories because the participants better understood which outcomes were most directly related to their programs. Table 3 highlights this evolution from awareness to understanding.
TABLE 3. NUMBER OF SDOH CATEGORIES CONSIDERED AT EACH STAGE OF THE EVALUATION PROCESS ACROSS ALL PARTICIPANTS
Social Determinantsof Health Categories
# of Categories Considered
28
Social Factors
• Family & Social Support• Social Cohesion• Leadership, Empowerment, Efficacy• Community Safety• Childhood Development
OutcomeMaps
Round 1Client Surveys
Round 2Client Surveys
28 30
18
Economic Factors
• Education• Jobs & Income• Self-Sufficiency Opportunities
13 10
21
Cultural Norms & Health Behaviors
• Alcohol, Drug and Tobacco Use• Diet & Exercise• Sexual Activity• Social Norms
19 16
14
Physical Environment
• Air & Water Quality• Housing & Transit• Infrastructure
2 2
15
Clinical Care
• Access to Care• Quality of Care
10 10
TOTAL SDOH CATEGORIES CONSIDERED 72 6896
TRAJECTORY OF IMPACT
ON THE PATH TO HEALTH EQUITY:BUILDING CAPACITY TO MEASURE HEALTH OUTCOMES IN COMMUNITY DEVELOPMENT
24
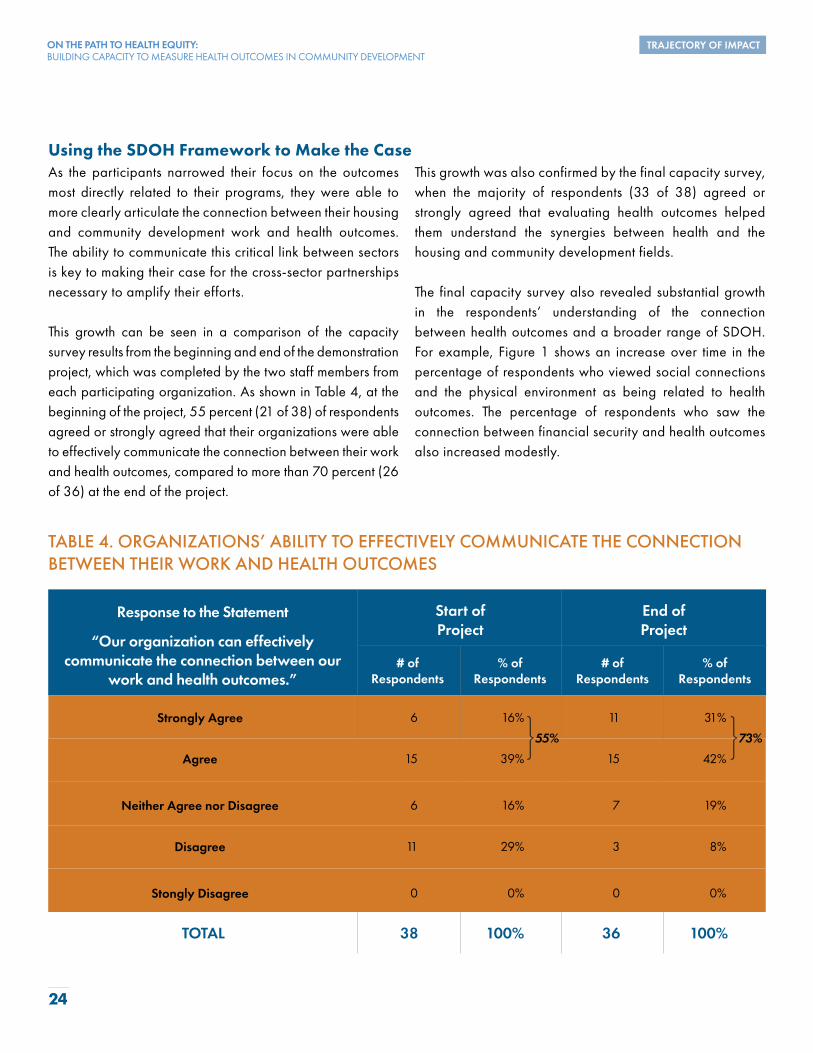
Using the SDOH Framework to Make the CaseAs the participants narrowed their focus on the outcomes most directly related to their programs, they were able to more clearly articulate the connection between their housing and community development work and health outcomes. The ability to communicate this critical link between sectors is key to making their case for the cross-sector partnerships necessary to amplify their efforts.
This growth can be seen in a comparison of the capacity survey results from the beginning and end of the demonstration project, which was completed by the two staff members from each participating organization. As shown in Table 4, at the beginning of the project, 55 percent (21 of 38) of respondents agreed or strongly agreed that their organizations were able to effectively communicate the connection between their work and health outcomes, compared to more than 70 percent (26 of 36) at the end of the project.
This growth was also confirmed by the final capacity survey, when the majority of respondents (33 of 38) agreed or strongly agreed that evaluating health outcomes helped them understand the synergies between health and the housing and community development fields.
The final capacity survey also revealed substantial growth in the respondents’ understanding of the connection between health outcomes and a broader range of SDOH. For example, Figure 1 shows an increase over time in the percentage of respondents who viewed social connections and the physical environment as being related to health outcomes. The percentage of respondents who saw the connection between financial security and health outcomes also increased modestly.
TABLE 4. ORGANIZATIONS’ ABILITY TO EFFECTIVELY COMMUNICATE THE CONNECTION BETWEEN THEIR WORK AND HEALTH OUTCOMES
Response to the Statement
“Our organization can effectively communicate the connection between our
work and health outcomes.”
Start of Project
Strongly Agree
End of Project
# ofRespondents
% ofRespondents
# ofRespondents
% ofRespondents
6 16% 11 31%
Agree 15 39% 15 42%
Neither Agree nor Disagree 6 16% 7 19%
Disagree 11 29% 3 8%
Stongly Disagree 0 0% 0 0%
TOTAL 100%38 36 100%
55% 73%
TRAJECTORY OF IMPACT

ON THE PATH TO HEALTH EQUITY:BUILDING CAPACITY TO MEASURE HEALTH OUTCOMES IN COMMUNITY DEVELOPMENT
25
FIGURE 1. ORGANIZATIONS’ PERCEPTIONS OF FACTORS RELATED TOHEALTH OUTCOMES
Financial Security/Economic Well-Being
Physical Environment(quality housing, streets,
sidewalks, safety, etc.)
Social Connections(sense of connection,
social supports)
0% 10% 20% 30% 40% 50% 60% 70% 80% 90% 100%
Project Start Project Midpoint Project End
One participant expressed having always believed that health outcomes are affected by many individual or neighborhood factors, but that now their thinking about this connection is more structured and organized. This concrete understanding can be catalytic for organizations poised to deliver solutions that can substantially impact community health.
In almost every case, use of the SDOH framework broadened organizational perspectives about the value and impact of their work and strengthened their ability to articulate the connection between community development and health outcomes. This enabled the organizations to integrate health outcomes as part of new grant applications and funding opportunities.
Chicanos por la Causa in Phoenix, Arizona, observed, “Using the concepts and applications from this evaluation capacity-building grant, we are able to frame grant-writing opportunities around SDOH and utilize the mapping tools and questions to develop evaluation plans for programs.”
Which of the following areas do you relate to health outcomes? (Select all that apply.)
TRAJECTORY OF IMPACT
ON THE PATH TO HEALTH EQUITY:BUILDING CAPACITY TO MEASURE HEALTH OUTCOMES IN COMMUNITY DEVELOPMENT
26
Moving from Evaluation Planning to ImplementationWith outcome maps, evaluation plans and survey instruments in hand, the participating organizations moved on to data collection. Gathering data in support of program evaluation is a key way organizations can learn more about the people they serve, explore how their work affects communities and make informed decisions based on new information. This knowledge also helps community development practitioners understand community needs and disparities, enabling them to strategically fill these gaps—a fundamental step along the path to health equity.
For the participants, data collection further reinforced their understanding of the SDOH within the context of their work. As Housing Partnership, an organization focused on wraparound mental health services in Palm Beach County, Florida, noted in its final report, “Having both pre- and post-test [surveys] is helping our staff truly see how functional needs will drive daily life improvements. Now, [staff] see the connection to [the] social determinants of health and how they play a vital factor into clients having more stability and increased feeling of self-efficacy and less reliance on community assistance.”
Measure & Improve
Implementing the evaluation process and collecting data positioned the participants to better understand their clients and improve programs to strengthen health outcomes.
Meeting the Challenge of Collecting Health Outcome DataTo lay the foundation for a successful data collection process, participants charted a customized path forward with an evaluation directly suited to their organization and designed to provide the most useful and actionable insights to inform their work. With the help of their technical assistance provider, the participants were able to tailor their evaluations to meet the unique challenges and needs of their local client populations.
The project team recognized that collecting primary level survey data from clients and community residents requires a great deal of time and resources. Even with long-standing relationships in their communities, organizations had to work through the common challenges associated with primary data collection, including incentivizing participation, getting clients to complete surveys and finding the best way to implement the survey. Collecting data in the second round was particularly challenging for many participants. Despite ongoing contact with clients and residents, effectively following up within a 12-month period for a second round of data collection proved difficult for many organizations.
To assist the organizations with these challenges, the project team conducted webinars to share techniques and provide examples of how best to prepare for and carry out data collection. These
learning opportunities reinforced the support given by the individual technical assistance providers. The participants’ efforts were also bolstered during the in-person convenings, where organizations were able to share their challenges and the most effective strategies to overcome them.
A unique challenge of this project was the requirement that organizations collect data from at least 50 respondents in both rounds of data collection; the minimum requirement was lowered for organizations operating in rural areas. A minimum number of respondents would ensure that participants would be able to analyze and interpret their evaluation findings to guide programmatic improvements and partnerships. This requirement proved to be difficult in certain cases. For some, the selected program served just over 50 clients per year which meant they would need to achieve nearly a 100 percent response rate for each round of data collection. However, dedicated staff worked closely with the technical assistance providers to review data collection plans, adjust outreach to community members and ensure that the data collection requirements were met. It was a significant achievement that all organizations met this minimum requirement, and over half far exceeded it.
TRAJECTORY OF IMPACT

ON THE PATH TO HEALTH EQUITY:BUILDING CAPACITY TO MEASURE HEALTH OUTCOMES IN COMMUNITY DEVELOPMENT
27
BUILDING BLOCKS FOR SUCCESS
Improving Data Collection MethodsConducting two rounds of data collection was especially instructive for the organizations and provided an important learning opportunity. Many organizations adjusted their data collection methods based on what they learned through the first round of collection and through interaction with their peers.
This learning took several forms. Some participants modified their data collection plans to improve the information received in the second round. For example, some organizations focused on collecting data at planned private client meetings, rather than relying on community or building-wide events to conduct data collection. Others shifted from electronic surveys to paper
surveys, while some opted to move toward an electronic survey to streamline the collection process, cut down on staff time and allow more privacy for survey respondents. Others refined the survey itself by reducing the length and shifting from more complicated open-ended questions to single-select or multi-select answer choices, allowing them to collect data that was easier to interpret and analyze, as well as encouraging a higher rate of response.
Changes like these implemented by the organizations between data collection rounds were successful in improving the quality of data collected.
Recognizing the Diversity of Clients SurveyedAcross all 20 organizations, 2,955 individual clients were surveyed throughout the project period. Since each organization focused its evaluation on only one of its many programs, this number represents only a fraction of the total population served by the organizations. The set of clients surveyed was diverse in terms of age, race, ethnicity and gender, as shown in Tables 5 through 8.
Most of the programs evaluated provide services to adults, particularly clients over the age of 65. The largest racial group
represented was Caucasian (34% of respondents), followed by Black/African American (24%), while the largest ethnic population represented was those not of Hispanic origin (57% of respondents). A full 22 percent of respondents chose not to provide their race when responding to surveys , and 15 percent declined to provide their ethnicity. Additionally, the majority of survey respondents identified as female (57% of respondents).
TRAJECTORY OF IMPACT

ON THE PATH TO HEALTH EQUITY:BUILDING CAPACITY TO MEASURE HEALTH OUTCOMES IN COMMUNITY DEVELOPMENT
28
TABLE 5. AGES OF CLIENTS SURVEYED ACROSS ALL ORGANIZATIONS(both rounds of data collection)
Age Range # of Respondents
24 and younger
% of Respondents
282 9.5%
25—34 343 11.6%
35—44 426 14.4%
45—54 371 12.6%
55—64 420 14.2%
65—74 379 12.8%
75 and older 307 10.4%
No response 427 14.5%
TOTAL 2,955 100%
TABLE 6. RACE OF CLIENTS SURVEYED ACROSS ALL ORGANIZATIONS(both rounds of data collection)
Race # of Respondents
American Indian/Aleut/Eskimo/Alaska Native
% of Respondents
49 1.7%
Asian 212 7.2%
Black/African American 712 24.1%
Caucasian/White 1,013 34.3%
Mixed race 293 9.9%
Native Hawaiian/Pacific Islander 17 0.6%
No response 659 22.2%
TOTAL 2,955 100%
TRAJECTORY OF IMPACT

ON THE PATH TO HEALTH EQUITY:BUILDING CAPACITY TO MEASURE HEALTH OUTCOMES IN COMMUNITY DEVELOPMENT
29
TABLE 7. ETHNICITY OF CLIENTS SURVEYED ACROSS ALL ORGANIZATIONS(both rounds of data collection)
Ethnicity # of Respondents
Yes, Hispanic/Latino/Latina/Spanish origin
% of Respondents
825 27.9%
No, not Hispanic/Latino/Latina/Spanish origin 1,679 56.8%
No response 451 15.3%
TOTAL 2,955 100%
TABLE 8. GENDER OF CLIENTS SURVEYED ACROSS ALL 20 ORGANIZATIONS(both rounds of data collection)
Gender # of Respondents
Female
% of Respondents
1,696 57.4%
Male 829 28.1%
Trans 51 1.7%
TOTAL 2,955 100%
Other 7 0.2%
No response 372 12.6%
Of the 2,955 individuals surveyed, 1,060 (36%) participated in both rounds of data collection, providing organizations the opportunity to analyze changes in client responses between two points in time. This is an important achievement for the organizations, many of which were performing an in-depth evaluation for the first time. In addition, these change-over-time data provided further insight into the needs of their clients and how they might better serve them.
In addition to collecting demographic information from their clients, each organization asked a question regarding self-perceived health status. This question was asked uniformly across
all 20 organizations to provide context on the overall health status of those individuals served by the programs evaluated. Of the 1,060 clients who completed both rounds of data collection, nearly two-thirds reported their health status as good, very good, or excellent as seen in Table 9. Table 10 notes that nearly half of the respondents experienced no change in health status between the two rounds of data collection, while some experienced an improvement and some a decline. These insights, which highlight that a majority of individuals considered themselves to be in good health, contradict traditional assumptions regarding the poor health status of lower income individuals.
TRAJECTORY OF IMPACT

ON THE PATH TO HEALTH EQUITY:BUILDING CAPACITY TO MEASURE HEALTH OUTCOMES IN COMMUNITY DEVELOPMENT
30
TABLE 9. PERCEIVED GENERAL HEALTH STATUS OF ALL CLIENTS PARTICIPATING (both rounds of data collection)
Perceived General Health Status Round 1 Data Collection
Excellent
Round 2 Data Collection
11.4% 9.6%
Very Good 21.7% 21.4%
Good 34.3% 33.7%
Fair 22.6% 23.5%
Poor 5.7% 5.7%
No response 4.3% 6.1%
TOTAL 100% 100%
TABLE 10. CHANGE IN PERCEIVED GENERAL HEALTH STATUS OF ALL CLIENTS PARTICIPATING (both rounds of data collection)
Change in PerceivedGeneral Health Status
% of Clients Participating inBoth Rounds of Data Collection
Reported improvement in health status 27%
Reported no change in health status 46%
Reported decline in health status 27%
TOTAL 100%
TRAJECTORY OF IMPACT

ON THE PATH TO HEALTH EQUITY:BUILDING CAPACITY TO MEASURE HEALTH OUTCOMES IN COMMUNITY DEVELOPMENT
31
Applying Findings From Data CollectionAt the most fundamental level, the participating organizations were able to gain important insights in several key areas to help guide their work, including information about their clients, service delivery and programming; communication with residents, staff, external stakeholders and potential partners; strategic planning; and demonstrating program effectiveness. These findings helped organizations better relate to and understand the communities they serve.
Almost all organizations made minor changes to their programs or employed new communication approaches based on their evaluation findings. For some, their data analysis led to a deeper level of understanding of their client needs, which resulted in identifying significant improvements to existing strategies. The participants are now poised to continue developing and implementing data-informed solutions that can lead to better outcomes. The examples provided throughout this section of the report illustrate how organizations applied learnings from the data they collected.
Understanding client needsThe data collected provided useful context on clients and their needs that may not have otherwise been recognized by the organizations. Little Tokyo Service Center (LTSC), an organization providing programming for youth in Los Angeles, was able to use its evaluation effort to better understand the challenges faced by the youth that it serves and make important programmatic changes to address those concerns.
In its first round of data collection, LTSC observed that some measures of the youth’s expectations for the future were not as positive as expected. As a result, staff developed a series of summer workshops for the youth, focusing on their overall development and growth during this formative time in their lives.
LTSC gained an even stronger understanding of the youths’ needs during its second round of data collection, in which youth expressed concern about bullying, suicide and drug abuse. In response, the organization focused the workshops on
these important and sensitive topics. The workshops saw high attendance, and the youth were very engaged. In its final report, LTSC reflected on the role of data collection in bringing these needs to light: “We don’t know if the need for these workshops would have arisen without the data collection activities.”
Improving service delivery and programmingSurvey findings equipped organizations to make informed updates and changes to their services and programs, while considering client needs in the process. For example, Selfhelp Community Services (Selfhelp), a New York City-based organization focused on on-site resident services for the elderly living in affordable independent housing, used the process of conducting an evaluation to strengthen existing programming for residents. Its evaluation approach emphasized cultural appropriateness and awareness of the immigration experience that many of the senior residents have. To demonstrate an understanding of those realities and to manage any language differences, Selfhelp staff reviewed individual survey results with each participant and used the discussion as an opportunity to provide culturally sensitive one-on-one health education.
After the first round of data collection, Selfhelp observed that respondents reported lower levels of exercise even though a majority understood the connection between exercise and health. Selfhelp’s survey surfaced many of the residents’ barriers to exercise, including diagnosed medical conditions, bad weather, lack of motivation or enjoyment and a lack of a convenient location.
In response, Selfhelp offered new fitness classes to expand exercise opportunities available to its clients and facilitated a “TV Exercise” program to visually demonstrate exercise techniques to residents of all languages. The television format also enabled residents to pause the session when they needed to rest or to practice a movement further. Selfhelp also worked with its Resident Advisory Council to get the word out to residents about these new offerings.
TRAJECTORY OF IMPACT

ON THE PATH TO HEALTH EQUITY:BUILDING CAPACITY TO MEASURE HEALTH OUTCOMES IN COMMUNITY DEVELOPMENT
32
In their second round of data collection, staff observed that these efforts had paid off, as residents self-reported that they were now exercising more. Selfhelp also found that offering exercise opportunities on-site may have contributed to the increase in resident activity and reduced the perceived barriers of bad weather and inconvenience. This result is a powerful example of how understanding both resident needs and perceived barriers can provide insights that help shape programming in meaningful ways.
Communicating with residents, externalstakeholders and partnersParticipating organizations readily acknowledged that engaging in data collection and evaluation was useful not only for program design but also for communication with clients and other key stakeholders. Claretian Associates (Claretian), located in Chicago, focuses on providing resident services at its affordable housing properties. Claretian engaged residents by sharing results from the
first round of data collection in colorful posters displayed at the properties (see Figure 2). Each of the evaluation findings shared on the poster was accompanied by a statement about how the organization planned to respond to the finding.
This communication strategy helped residents see how participating in data collection efforts could lead to positive change that they would experience in tangible ways. For example, in response to survey data suggesting less-than-optimal consumption of fruits and vegetables, the organization built garden beds and will work with residents to grow healthy foods on-site.
Communicating evaluation findings also creates opportunities to share an evidence base that is informing programmatic and funding decisions. This evidence can help organizations demonstrate the direct connection between client needs and their programming decisions over time.
FIGURE 2. CLARETIAN ASSOCIATES’ POSTERCOMMUNICATING EVALUATION FINDINGS TO RESIDENTS
CLARETIAN ASSOCIATES’ RESIDENTS: WE HEARD FROM YOU AND HERE ARE THE RESULTS!
Claretian Associates will connect residents with the resources they need to sucessfully manage their health.
HEALTH
91% of surveyed residents are receiving primary health care at a clinic or doctor’s office
We will continue to offer health clinics to make sure all residents have access to quality medical care.
THE HEALTH SURVEY RESIDENTS PARTCIPATED IN ALLOWED US TO LEARN HOW TO BETTER SERVE YOU
The health survey was completed as a part of the Health Outcomes Demonstration Project
FITNESS
MEDICAL CARE
1/2 of residents reported that they are either not motivated, too tired, or don’t have time to exercise
Claretian Associates built garden beds and will work with residents this spring to grow healthy food!
We are going to work with you to find creative ways for residents to get active!
FOOD & DIET
CLARETIAN ASSOCIATES’ RESIDENTS: WE HEARD FROM YOU AND HERE ARE THE RESULTS!
Claretian Associates will connect residents with the resources they need to sucessfully manage their health.
HEALTH
91% of surveyed residents are receiving primary health care at a clinic or doctor’s office
We will continue to offer health clinics to make sure all residents have access to quality medical care.
THE HEALTH SURVEY RESIDENTS PARTCIPATED IN ALLOWED US TO LEARN HOW TO BETTER SERVE YOU
The health survey was completed as a part of the Health Outcomes Demonstration Project
FITNESS
MEDICAL CARE
1/2 of residents reported that they are either not motivated, too tired, or don’t have time to exercise
Claretian Associates built garden beds and will work with residents this spring to grow healthy food!
We are going to work with you to find creative ways for residents to get active!
FOOD & DIET Fruit and Vegetable Intake Per Day
1% 1%
38%
19%
33%
49%
18% 20%
10% 11%
Fruit Vegetables
THREE OR MORE TIMESABOUT TWICEABOUT ONCELESS THAN ONCENEVER
CLARETIAN ASSOCIATES’ RESIDENTS: WE HEARD FROM YOU AND HERE ARE THE RESULTS!
Claretian Associates will connect residents with the resources they need to sucessfully manage their health.
HEALTH
91% of surveyed residents are receiving primary health care at a clinic or doctor’s office
We will continue to offer health clinics to make sure all residents have access to quality medical care.
THE HEALTH SURVEY RESIDENTS PARTCIPATED IN ALLOWED US TO LEARN HOW TO BETTER SERVE YOU
The health survey was completed as a part of the Health Outcomes Demonstration Project
FITNESS
MEDICAL CARE
1/2 of residents reported that they are either not motivated, too tired, or don’t have time to exercise
Claretian Associates built garden beds and will work with residents this spring to grow healthy food!
We are going to work with you to find creative ways for residents to get active!
FOOD & DIET
TRAJECTORY OF IMPACT

ON THE PATH TO HEALTH EQUITY:BUILDING CAPACITY TO MEASURE HEALTH OUTCOMES IN COMMUNITY DEVELOPMENT
33
Informing strategyBeyond informing programming changes, evaluation data can also provide valuable direction to inform broader strategic decisions that can begin to address health disparities. Cornerstone Community Housing, in Lane County, Oregon, evaluated its program that is part of a countywide collaboration that brings fresh produce in a “farmers market style” to community rooms in affordable housing communities.
Through its evaluation, Cornerstone found that its programming was increasing participants’ positive views and behaviors around health and helping to increase produce intake and the nutritional quality of the foods consumed. Staffalso observed that the program was helping support their
clients’ ability to stretch resources for other needs, including paying rent on time, as can be seen in Figure 3 below.
Although Cornerstone’s evaluation findings indicated that the program helped clients gain access to more fresh fruits and vegetables and was contributing positively to their health, the survey responses also demonstrated that more work remained to be done. Despite the benefits that clients experienced through the program, many were still struggling with food insecurity. For example, in the first round of data collection, a majority (63%) of respondents reported that they “often” or “sometimes” thought food would run out before the household got money to buy more (see Figure 4).viii
FIGURE 3. EVALUATION DATA DEMONSTRATE FOOD PROGRAMMING HELPSSTRETCH FINANCIAL RESOURCES
Percent of respondents reporting late payment of rent, heating or electric bills in the last 12 months
Rarely Participate in Food ProgrammingSometimes Participate in Food ProgrammingAlways Participate in Food Programming
38%33%
93%
Percent of Respondents Who Report Late Bill Payment
TRAJECTORY OF IMPACT

ON THE PATH TO HEALTH EQUITY:BUILDING CAPACITY TO MEASURE HEALTH OUTCOMES IN COMMUNITY DEVELOPMENT
34
In response, Cornerstone used this understanding of both its programmatic success and its clients’ ongoing needs to drive its forward-looking strategy in this work, including—
• Increasing the type and number of community partners that conduct outreach at its program to expand client exposure to available resources and supports;
• Sharing the evaluation results with partners to help expand this type of programming in other communities with similar needs;
• Aligning with one of the state’s largest food banks to communicate with local and state leaders about the need for both food assistance and housing; and
• Communicating with local coordinated care organizations, health care organizations and food support organizations to support greater resources and partnership for this work.
Demonstrating program effectivenessThe Neighborhood Developers (TND) is part of the Chelsea Thrives initiative, a cross-sector collaborative in Chelsea, Massachusetts, that was launched in 2014 with the goal of reducing crime by 30 percent over 10 years and improving the community’s sense of safety. Improvements to the downtown area of Chelsea, identified as a crime hotspot, have included hiring a downtown coordinator to work with the small businesses and help activate the public spaces, appointing four community police to the downtown area to increase relationships with the community and committing to an investment of $5.3 million for physical improvements.
TND’s evaluation focused on this downtown area using a community-level survey with indicators that include clean-up of problem properties, crime reporting, increased police presence and improved street lighting. Its evaluation suggests that the collaborative’s focus and investment in the downtown area are
FIGURE 4. CORNERSTONE’S EVALUATION DATA DEMONSTRATING FOOD INSECURITY
I thought my/our food would run out before I/we got money to buy more.
22%
41%
22%
12%4%
Often True Sometimes True Rarely True Never True N/A
TRAJECTORY OF IMPACT

ON THE PATH TO HEALTH EQUITY:BUILDING CAPACITY TO MEASURE HEALTH OUTCOMES IN COMMUNITY DEVELOPMENT
35
FIGURE 5. SATISFACTION WITHPOLICE RESPONSE IN CHELSEA
Percent of downtown Chelsea residents who rated police response “very good” or “good”
2017 2018
68%
48%
FIGURE 6. PERCEIVED SAFETY OF RESIDENTS WALKING DOWNTOWN
Percent of residents reportingfeeling “very safe” or “safe” walking downtown
2017
66%
23%
80%
40%
2018
Day Night
improving residents’ perceptions of safety, even though many of the investments in the downtown area have not yet been fully implemented. As evidence of this, Figure 5 demonstrates an increase in satisfaction with police response, an important factor in community safety.
TND’s evaluation also found that residents’ perception of safety increased between the first and second rounds of data collection, as shown in Figure 6.
These findings demonstrate increased perception of safety in the downtown Chelsea area immediately following a strategic investment in the area’s safety. To better understand what additional factors may be shaping resident perceptions of safety, TND also used its evaluation to measure social connectedness by asking how many people they can turn to in an emergency. The findings revealed that residents who have stronger social connections are less fearful when walking at night. The evidence from TND’s evaluation provides additional support for continuing the comprehensive outreach the collaborative is undertaking as part of this work.
The evaluation results also helped TND tie safety more directly to the goal of creating a healthier community and integrate health into its organizational strategy. In its final report, TND noted that it had included “health and community development as an agency-wide goal for 2019 across all departments.”
These examples illustrate just some of the ways in which the organizations were able to act on their evaluation results to better meet the long-term goal of improving the health outcomes of their residents or clients. The new skills acquired throughout the project will continue to serve the participants as they address the changing needs of their clients and the communities where they live.
TRAJECTORY OF IMPACT
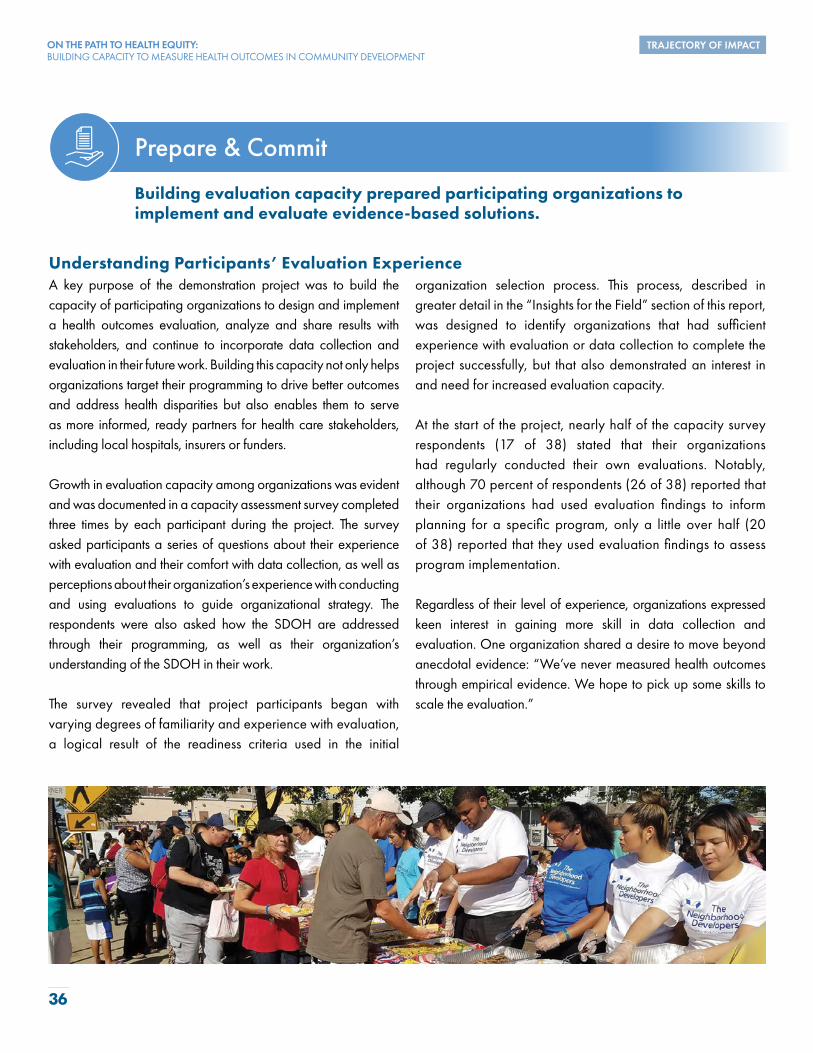
ON THE PATH TO HEALTH EQUITY:BUILDING CAPACITY TO MEASURE HEALTH OUTCOMES IN COMMUNITY DEVELOPMENT
36
Understanding Participants’ Evaluation ExperienceA key purpose of the demonstration project was to build the capacity of participating organizations to design and implement a health outcomes evaluation, analyze and share results with stakeholders, and continue to incorporate data collection and evaluation in their future work. Building this capacity not only helps organizations target their programming to drive better outcomes and address health disparities but also enables them to serve as more informed, ready partners for health care stakeholders, including local hospitals, insurers or funders.
Growth in evaluation capacity among organizations was evident and was documented in a capacity assessment survey completed three times by each participant during the project. The survey asked participants a series of questions about their experience with evaluation and their comfort with data collection, as well as perceptions about their organization’s experience with conducting and using evaluations to guide organizational strategy. The respondents were also asked how the SDOH are addressed through their programming, as well as their organization’s understanding of the SDOH in their work.
The survey revealed that project participants began with varying degrees of familiarity and experience with evaluation, a logical result of the readiness criteria used in the initial
organization selection process. This process, described in greater detail in the “Insights for the Field” section of this report, was designed to identify organizations that had sufficient experience with evaluation or data collection to complete the project successfully, but that also demonstrated an interest in and need for increased evaluation capacity.
At the start of the project, nearly half of the capacity survey respondents (17 of 38) stated that their organizations had regularly conducted their own evaluations. Notably, although 70 percent of respondents (26 of 38) reported that their organizations had used evaluation findings to inform planning for a specific program, only a little over half (20 of 38) reported that they used evaluation findings to assess program implementation.
Regardless of their level of experience, organizations expressed keen interest in gaining more skill in data collection and evaluation. One organization shared a desire to move beyond anecdotal evidence: “We’ve never measured health outcomes through empirical evidence. We hope to pick up some skills to scale the evaluation.”
Prepare & Commit
Building evaluation capacity prepared participating organizations to implement and evaluate evidence-based solutions.
TRAJECTORY OF IMPACT

ON THE PATH TO HEALTH EQUITY:BUILDING CAPACITY TO MEASURE HEALTH OUTCOMES IN COMMUNITY DEVELOPMENT
37
Measuring Growth in Capacity for Data Collection At baseline, nearly 80 percent of respondents (29 of 37 respondents) characterized their ability to plan for data collection as part of an evaluation as either “good” or “very good,” although only 68 percent (25 of 37 respondents) noted that they felt secure in their ability to implement data collection. Participants indicated that their greatest needs for support were in the areas of designing data collection instruments, analyzing qualitative and quantitative data, drawing conclusions from data analysis, creating an evaluation report and communicating evaluation findings to external stakeholders.
Consistent with the capacity survey findings, participating organizations required extensive technical assistance from the project team throughout the early stages of the project to identify health outcomes, design their data collection tools and develop a methodology for data collection. This initial need for technical assistance affirmed the project’s design, which emphasized allowing organizations to have independence and flexibility, while also providing one-on-one coaching, given the complexity of designing and implementing a successful evaluation.
The project’s customized approach to data collection and survey design provided participants with training directly relevant to their organization, program and clients. The project team could see this training take hold as organizations analyzed their first round of data collection and, in anticipation of their second round of data collection, made adjustments to better suit the program, their clients or the organization itself.
By the end of the demonstration project, many participants expressed an increased awareness of the nature of survey design and felt more equipped to choose appropriate data collection methods for their programs and services. As illustrated in Figure 7, the percentage of participants who felt their ability to implement data collection was “very good” increased from 14 percent (5 of 38) at baseline to 53 percent (20 of 38) at the end of the project. While this is a positive increase, additional growth is still possible, as nearly half of respondents reported that they were not fully comfortable with this part of the evaluation process.
FIGURE 7. CAPACITY SURVEY RESPONDENTS’ REFLECTIONS ON THEIR ABILITY TO PLAN FOR AND IMPLEMENT DATA COLLECTION
How would you characterize your ability to plan for data collection as part of an evaluation?
How would you characterize your current ability to implement data collection as part of an evaluation?
PLANNING IMPLEMENTING
0%
10%
20%
30%
40%
50%
60%
70%
80%
Project Start Project End
90%
100%
Project Start Project End
Very Poor
Poor
Fair
Good
Very Good
TRAJECTORY OF IMPACT

ON THE PATH TO HEALTH EQUITY:BUILDING CAPACITY TO MEASURE HEALTH OUTCOMES IN COMMUNITY DEVELOPMENT
38
Results from the capacity survey administered at the midpoint of the project revealed surprising insights. Although the project team had expected that the number of participants needing substantial support identifying program outcomes would decline, the number rose from 5 percent (2 of 38) of respondents at baseline to 26 percent (9 of 36) at the project midpoint (see Table 11). This increase likely reflects a greater awareness of the intricacies of evaluation design and data collection, even as organizations gained new skills and capacity. It may also reflect the participants’ growing understanding of the SDOH and the inherent difficulties in measuring health outcomes. By the end of the project, most organizations indicated that they needed little to no support in identifying program outcomes.
Through the provision of individualized technical assistance, financial resources, peer-learning opportunities, training webinars and in-person convenings, organizations substantially expanded their capacity for evaluation. While almost half of the capacity survey respondents at baseline (18 of 38) reported feeling “very comfortable” with conducting another evaluation beyond this project, this grew to 68 percent of respondents (26 of 36) by project completion, despite staff turnover that brought new participants to the project as the evaluations were wrapping up. This shift indicates an increase in confidence and an important marker of the growth in evaluation capacity, as seen in Figure 8.
BUILDING BLOCKS FOR SUCCESS
Assessing Growth in Evaluation Capacity
TABLE 11. CAPACITY SURVEY RESPONDENTS’ LEVEL OF SUPPORT NEEDED FOR IDENTIFYING PROGRAM OR PROJECT OUTCOMES
Level of Support Needed for Identifying Program or
Project Outcomes
% of Respondents at
Project Start
A Great Deal of Support 5% 11%
Some Support 54% 21%
A Little Support 35% 44%
No Support 6% 24%
TOTAL 100% 100%
% ofRespondents at Project Midpoint
% of Respondents at
Project End
27%
29%
32%
12%
100%
FIGURE 8. CAPACITY SURVEY RESPONDENTS’ REFLECTIONS ON THEIR COMFORT LEVEL WITH CARRYINGOUT FUTURE EVALUATIONS
How would you rate your comfort level with carrying out another evaluation?
Very Comfortable Somewhat Comfortable Not At All Comfortable
0%
10%
20%
30%
40%
50%
60%
70%
80%
Project Start Project End
90%
100%

ON THE PATH TO HEALTH EQUITY:BUILDING CAPACITY TO MEASURE HEALTH OUTCOMES IN COMMUNITY DEVELOPMENT
39
BUILDING BLOCKS FOR SUCCESS
Building Capacity for Future EvaluationsThe project also helped shape how participants viewed the role of evaluation in their organization and how they intended to use evaluation results moving forward. The capacity survey results showed growth in this area, and participants indicated that they needed less assistance in using evaluation findings for decision-making at the end of the project than they had at baseline.
Organizations also placed an increased emphasis on using evaluation to inform organizational priorities, with growth in the number of participants who intend to use evaluation to inform organizational strategy, program planning and fundraising efforts (see Figure 9). This commitment to embedding evaluation into the fabric of their organizations demonstrates the lasting impact that building capacity in the field can have on strategic, data-informed decision-making to improve resident and client outcomes. Although this demonstration project focused on health outcomes, the skills learned and the capacity built can be applied to any programming pursued by these organizations.
Many organizations described how the project had given them momentum to continue to incorporate evaluation into their work. For example, Services for the UnderServed, in New York City, shared that it would be “forming an Evaluation Committee to involve individuals across the agency to help select and champion future program evaluations.”
CAMBA, in Brooklyn, New York, observed that the learning process had enhanced its capacity to collect and analyze data, which, in turn, will enable it to make future programming decisions based on evidence of what works. “We are in a position to adequately track and measure resident health outcomes that would help us to improve services offered to our clients,” CAMBA staff noted.
FIGURE 9. CAPACITY SURVEY RESPONDENTS’ REFLECTIONS ON HOW THEIR ORGANIZATION INTENDS TO USE EVALUATION RESULTS
To InformOrganizational
Strategic Planning
To InformProgram Planning
To Raise Funds or Report to Current Funders/
Stakeholders
0% 10% 20% 30% 40% 50% 60% 70% 80% 90% 100%
Project Start Project End
How is your organization interested in using evaluation of a project/program’s effectiveness or impact?
To Measure the Program’s Outcomes or Impact on
Project/Program Participants

ON THE PATH TO HEALTH EQUITY:BUILDING CAPACITY TO MEASURE HEALTH OUTCOMES IN COMMUNITY DEVELOPMENT
40
Bridging Community Development and HealthRecently, leaders in the health care sector have begun to move beyond patient-specific interventions toward effective and scalable solutions that address the complex and systemic factors that drive health outcomes. Successful collaborations between hospital systems and community-based organizations to address the needs of frequent utilizers of health care underscore the intrinsic relationship between community conditions and health outcomes.
With their long history of improving individual outcomes through the delivery of comprehensive supports, community development organizations are becoming catalytic partners in national efforts to reverse the trend of rising health costs and growing health inequities.
The demonstration project aimed to create a bridge between the community development and health sectors by equipping participating organizations with the tools necessary to evaluate and connect their work to health outcomes. Participants were exposed to thought leaders in both the health and community development fields, as well as national philanthropic partners at the forefront of improving community health. As part of the
ongoing learning process, participants were also connected to resource partners, like the Build Healthy Places Network, which provided training webinars on topics such as partnership development with health institutions.
These efforts were intended to better position the participating organizations as strategic partners and changemakers in advancing the health equity goals of their community. Although some of the organizations had existing relationships with health partners, these were largely transactional (e.g., medical services provided at affordable housing properties) and focused on improving individual health outcomes.
To be seen as an essential pathway to health equity, the community development field needs a stronger value proposition. The project team believed that one key to long-lasting success was ensuring that participants gained an understanding of the challenges facing their health care partners and framed the results of their evaluation in ways that would resonate as possible solutions to these challenges. Becoming fluent in the “language of health” was an important step in making their case.
Partner & Transform
Engaging with diverse perspectives throughout the evaluation process equipped the participants to initiate and deepen transformative cross-sector partnerships.
TRAJECTORY OF IMPACT

ON THE PATH TO HEALTH EQUITY:BUILDING CAPACITY TO MEASURE HEALTH OUTCOMES IN COMMUNITY DEVELOPMENT
41
Bringing Diverse Perspectives to In-Person ConveningsThroughout the project, participants were encouraged to see themselves as integral to creating a stronger bridge between sectors. Speaking at the first in-person convening, Laurel Blatchford, President of Enterprise Community Partners, noted, “You are playing an important role in building the evidence to tell a complete story about housing, community development and health.”
During this first convening, the project team and funders highlighted how the participating organizations’ community-level work has a significant role in the national effort to bridge community development and health. The project funders stressed the importance of evidence and a clear message. Chris Kabel, then Deputy Director of the Health Program at The Kresge Foundation, emphasized, “To demonstrate how different forms of community development benefit communities, organizations need to strengthen the capacity to make the case.”
The conversation continued during the second in-person convening, focusing on the need for greater alignment among philanthropy, the health sector and community development organizations to sustain and scale effective solutions. David Erickson, Director of Community Development at the Federal Reserve Bank of San
Francisco, Tyler Norris, Chief Executive of Well Being Trust, and Pamela Schwartz, Senior Director for Community Health Impact and Learning at Kaiser Permanente, joined the conversation, emphasizing that engaging the community development field in a more strategic way can enable philanthropy and health care organizations to design and fund more effective long-term solutions.
At the final convening, the conversation between the organizations and the philanthropic community continued. Katie Byerly, Program Officer at The Kresge Foundation, and Vedette Gavin, Director of Research and Partnerships at the Conservation Law Foundation, encouraged participants to see themselves as powerful stakeholders capable of using data and evidence to effectively create a bridge between the communities they serve and funders and other partners. The speakers emphasized that the organizations are now poised to help health-focused partners understand the critical role of community development in improving health outcomes. In her remarks, Tiffany Manuel—then Vice President of Knowledge, Impact and Strategy at Enterprise Community Partners—challenged the organizations, stating, “The next phase of your work is about building systems change and bringing in new stakeholders.”
“Community development can build the systems we need to improve the environment for resident health.”
David EricksonDirector of Community Development at theFederal Reserve Bank of San Francisco
TRAJECTORY OF IMPACT
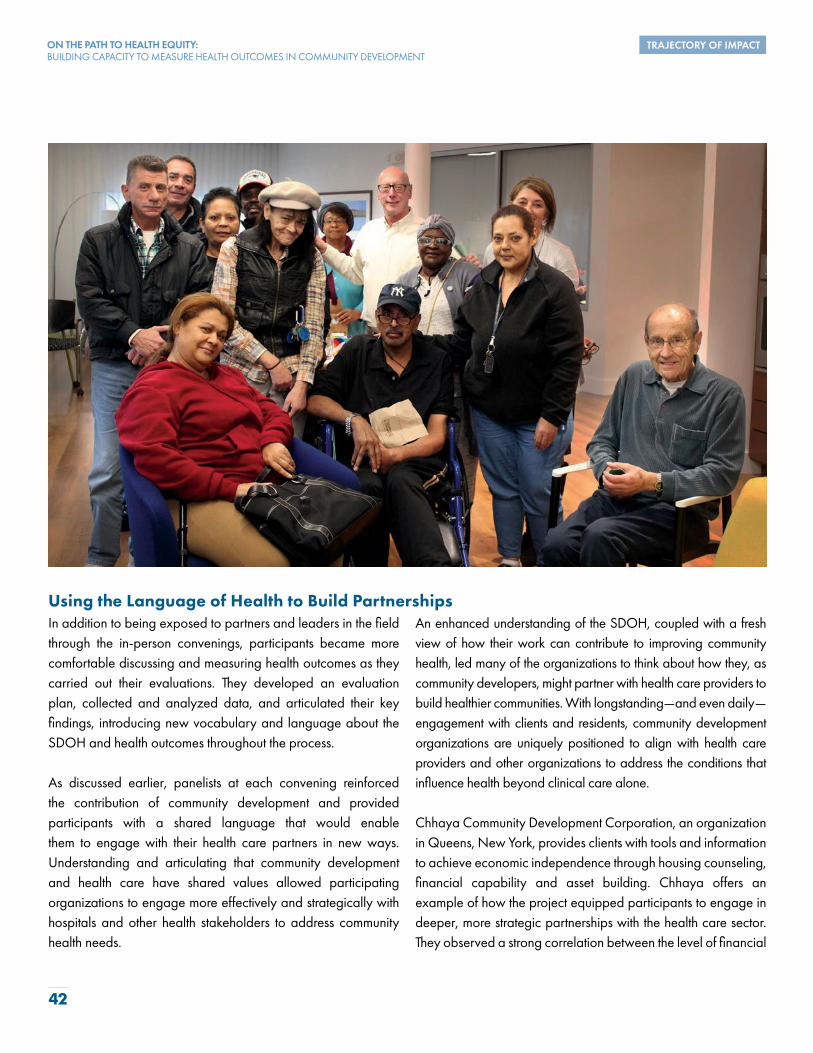
ON THE PATH TO HEALTH EQUITY:BUILDING CAPACITY TO MEASURE HEALTH OUTCOMES IN COMMUNITY DEVELOPMENT
42
Using the Language of Health to Build Partnerships In addition to being exposed to partners and leaders in the field through the in-person convenings, participants became more comfortable discussing and measuring health outcomes as they carried out their evaluations. They developed an evaluation plan, collected and analyzed data, and articulated their key findings, introducing new vocabulary and language about the SDOH and health outcomes throughout the process.
As discussed earlier, panelists at each convening reinforced the contribution of community development and provided participants with a shared language that would enable them to engage with their health care partners in new ways. Understanding and articulating that community development and health care have shared values allowed participating organizations to engage more effectively and strategically with hospitals and other health stakeholders to address community health needs.
An enhanced understanding of the SDOH, coupled with a fresh view of how their work can contribute to improving community health, led many of the organizations to think about how they, as community developers, might partner with health care providers to build healthier communities. With longstanding—and even daily—engagement with clients and residents, community development organizations are uniquely positioned to align with health care providers and other organizations to address the conditions that influence health beyond clinical care alone.
Chhaya Community Development Corporation, an organization in Queens, New York, provides clients with tools and information to achieve economic independence through housing counseling, financial capability and asset building. Chhaya offers an example of how the project equipped participants to engage in deeper, more strategic partnerships with the health care sector. They observed a strong correlation between the level of financial
TRAJECTORY OF IMPACT

ON THE PATH TO HEALTH EQUITY:BUILDING CAPACITY TO MEASURE HEALTH OUTCOMES IN COMMUNITY DEVELOPMENT
43
and housing stability and the health outcomes reported by respondents in their first round of data collection.
Chhaya shared these compelling results in a presentation to a group of hospitals, public health professionals and other community-based organizations to further the conversation about the interconnectedness of housing stability and health outcomes. The evaluation findings provided a strong platform for them to initiate more strategic conversations with local health partners.
An Arizona-based organization, Chicanos por la Causa, used the findings from the second round of data collection to bolster communication with key stakeholders and make a case for its work. In a conversation with key stakeholders, the organization was able to demonstrate a connection between social services and health care outcomes using its evaluation results. The staff shared that their audience was “very impressed that we had numbers to pair with the testimonials and anecdotal stories. Organized data is a source of power. The [project] findings are powerful.”
The evaluation findings allowed many of the organizations to better explain the needs of the people they serve, supporting the necessity of their programming and enabling them to make a stronger case for the importance of their work. At the project’s end, 87 percent of the capacity survey respondents (33 of 38) agreed or strongly agreed that “measuring health outcomes will better equip my organization to engage in lasting cross-sector collaboration.”
As staff from NeighborWorks Alaska observed, “This data also makes the case for partnerships with health-based organizations that are working to improve community health, such as health foundations.” Through the results of the capacity survey and in their own reflections, the participants consistently demonstrated an increased confidence in their ability to successfully engage in meaningful discussions and collaborations with their health care partners.
“Never before have we had the support and capacity to really look deeper at the work we do and how it impacts the households we serve. The timing could not have been better. Changes in health care, particularly in Oregon, continue to focus on outcomes of the work, and we want to be able to share the value of our work to the partners and funders who help invest in and expand the types of work that we do. We are already using this work to leverage conversations with our local Coordinated Care Organizations, and this has helped us talk about our work in a sophisticated way.”
Cornerstone Community Housing
TRAJECTORY OF IMPACT

ON THE PATH TO HEALTH EQUITY:BUILDING CAPACITY TO MEASURE HEALTH OUTCOMES IN COMMUNITY DEVELOPMENT
44
INSIGHTS FOR THE FIELD
Preparing Community Development Organizations to Work Across Sectors
The demonstration project was designed to equip housing and community development organizations with the evaluation tools and data needed to inform their work, improve programming and build new or deeper partnerships in the health sector. The project was structured to maximize the potential for success and ensure that the organizations received significant benefit from participation. By project end, all 20 organizations had successfully designed and implemented a health outcomes evaluation. Although many aspects of the project contributed to its success, four key factors played an instrumental role:
•Selection criteria ensured the readiness of participating organizations.•Program-specific evaluations maximized learning. •Individualized technical assistance helped organizations manage staff turnover.•In-person convenings facilitated peer learning.
Ensuring the Readiness of Participating OrganizationsThe project team was committed to convening a diverse cohort of organizations. To this end, they developed both organizational and program-specific readiness criteria to guide the process of selecting organizations. The criteria were developed based on Enterprise and NeighborWorks’ understanding of the field and expertise in conducting
evaluations and building evaluation-related capacity. Selections were made through a competitive process, including interviews with finalists to assess their readiness for participation. This process was critical to assembling a cohort of committed participants ready to engage in a project of this magnitude.
INSIGHTS FOR THE FIELD

ON THE PATH TO HEALTH EQUITY:BUILDING CAPACITY TO MEASURE HEALTH OUTCOMES IN COMMUNITY DEVELOPMENT
45
INSIGHTS FOR THE FIELD
Defining organizational readinessThe criteria used to evaluate organizational readiness were important for identifying participants who would be able to apply their learnings to inform and advance their work. The organizational readiness criteria included four components:
• Experience with data collection. Although the project provided training and technical assistance to guide organizations in their evaluations, organizations were required to have demonstrated ability to implement data collection. Because data collection is a crucial building block of evaluation, this was considered a critical element of the readiness criteria. During the interview process, candidates were asked to provide examples of their data collection experience and to share how they planned to use lessons learned from past efforts to improve data collection for this project.
• Designation of two staff. Organizations were required to designate two staff members for the duration of the project, so they would have staff capacity to complete the evaluation, to provide more opportunities for knowledge sharing across the organization and to create continuity in the case of staff turnover.
• Support from organizational leadership. Support from organizational leadership was required to build “buy-in” for the demonstration project across the organization. Assessed during the proposal process and the finalist interviews, leadership support was identified as critical for ensuring that staff could continue to dedicate time to the project, even if competing organizational priorities emerged during the project period.
• Commitment to organizational learning. Organizations were required to demonstrate an interest in expanding organizational capacity for evaluation by identifying how their participation in the project could affect their use of evaluation results to modify existing programs, design future programs, scope evaluations and influence organizational strategy. Ensuring this commitment increased the likelihood that participating organizations would apply the lessons learned and embed evaluation in their current and future work.
Identifying programs ready for evaluationIn addition to organizational readiness, it was also important that the selected programs be appropriate candidates for a health outcomes evaluation. The program readiness criteria included three primary components:
• Ongoing operations. The program chosen for evaluation had to have operated for at least one year prior to proposal submission, enabling the organizations to move directly into preparing for the evaluation. Organizations also had to commit to continuing the program throughout the life of the project to allow participation in two rounds of data collection.
• Population size. The program needed to serve at least 100 individuals annually to ensure a sufficient sample size for data collection purposes. The minimum sample size for rural organizations was reduced during the project to 50, because of the challenges of data collection in areas of lower population density and the smaller number of people served by some rural programs.
• Relevance to organizational strategy around health. Although the organizations were required to select a program connected to health outcomes, explicit health programming was intentionally not required. Rather, the focus on the SDOH encouraged a diversity of organizations and programs, consistent with the project’s commitment to connecting health outcomes to community interventions beyond traditional health programming.

ON THE PATH TO HEALTH EQUITY:BUILDING CAPACITY TO MEASURE HEALTH OUTCOMES IN COMMUNITY DEVELOPMENT
46
INSIGHTS FOR THE FIELD
Bringing commitment through readiness Overall, the readiness criteria helped ensure that organizations were set up for success from the start, bringing in highly motivated organizations with ongoing programming that was well aligned with the project goals. Participating organizations were ambitious in what they hoped to achieve and were intent on using the experience to improve outcomes for the people they serve. Many believed that the evaluation process would highlight ways in which they could deliver more effective programming and provide them with the data necessary to better articulate and strengthen their organization’s value proposition.
In their applications, participants were focused on improving their data collection methods and identifying leading indicators to help measure progress and impact. All were committed to improving their use of program evaluation moving forward.
Organizations were also eager to use “meaningful data” to communicate more effectively with residents, staff and board members alike. EAH Housing, an affordable housing
development and management organization in California and Hawaii, echoed this belief: “A roof is just the beginning, and we believe quantifiable results will energize internal and external partners as we tackle some of the hard issues facing affordable housing communities in the next decade.”
Lastly, organizations also expressed excitement about learning from peers and saw participation as a way to strengthen their ability to substantiate and communicate their findings to external partners and funders, particularly as the housing and health fields continue to collaborate more closely. NeighborWorks of Western Vermont recognized this opportunity to collaborate in their application: “Participation in this demonstration project will give us the opportunity to cross into other community sectors.” The project brought together a cohort of committed organizations and staff, intent on learning how effective program evaluations can help make the case for their work and provide the tools necessary to engage in innovative, cross-sector partnerships.
“Evaluation is a mindset—part of an organization’s culture. We recognize this and want to use every tool available to continue to move the organization toward that.”
Housing Partnership, Inc.
Maximizing Learning With Program-Specific EvaluationsRather than focus on a cohort of similar programs, the project was designed to bring together diverse programs to demonstrate the connection between community development and health in the broadest way possible. Each program and set of services offered by the organizations are designed to meet the specific needs and challenges of a local community. This diverse cohort also allowed the Health Tools to be used in a range of settings, demonstrating the wide applicability of these tools across the housing and community development sector.
Given this diversity of programs, the project team recognized that program-specific evaluation approaches would be
critical to maximize learning opportunities for participating organizations. As a result, the project was designed to support organizations in developing evaluations that would directly address their key questions and measure program outcomes. This approach enabled the organizations to adapt their data collection methods, to explore the SDOH most relevant for their program and to use survey questions and data collection strategies most appropriate for their organizational context and clients. This customization has enhanced their ability to contextualize their findings, making the data all the more relevant to each organization’s unique set of stakeholders.
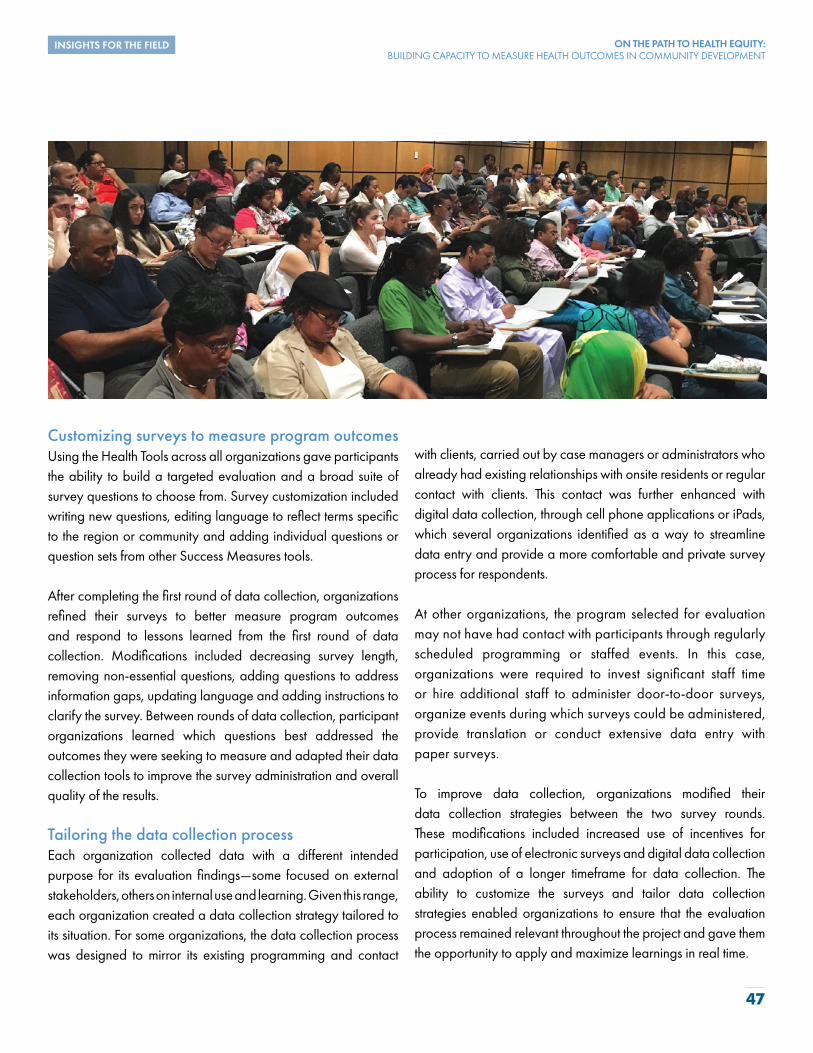
ON THE PATH TO HEALTH EQUITY:BUILDING CAPACITY TO MEASURE HEALTH OUTCOMES IN COMMUNITY DEVELOPMENT
47
INSIGHTS FOR THE FIELD
Customizing surveys to measure program outcomes Using the Health Tools across all organizations gave participants the ability to build a targeted evaluation and a broad suite of survey questions to choose from. Survey customization included writing new questions, editing language to reflect terms specific to the region or community and adding individual questions or question sets from other Success Measures tools.
After completing the first round of data collection, organizations refined their surveys to better measure program outcomes and respond to lessons learned from the first round of data collection. Modifications included decreasing survey length, removing non-essential questions, adding questions to address information gaps, updating language and adding instructions to clarify the survey. Between rounds of data collection, participant organizations learned which questions best addressed the outcomes they were seeking to measure and adapted their data collection tools to improve the survey administration and overall quality of the results.
Tailoring the data collection processEach organization collected data with a different intended purpose for its evaluation findings—some focused on external stakeholders, others on internal use and learning. Given this range, each organization created a data collection strategy tailored to its situation. For some organizations, the data collection process was designed to mirror its existing programming and contact
with clients, carried out by case managers or administrators who already had existing relationships with onsite residents or regular contact with clients. This contact was further enhanced with digital data collection, through cell phone applications or iPads, which several organizations identified as a way to streamline data entry and provide a more comfortable and private survey process for respondents.
At other organizations, the program selected for evaluation may not have had contact with participants through regularly scheduled programming or staffed events. In this case, organizations were required to invest significant staff time or hire additional staff to administer door-to-door surveys, organize events during which surveys could be administered, provide translation or conduct extensive data entry with paper surveys.
To improve data collection, organizations modified their data collection strategies between the two survey rounds. These modifications included increased use of incentives for participation, use of electronic surveys and digital data collection and adoption of a longer timeframe for data collection. The ability to customize the surveys and tailor data collection strategies enabled organizations to ensure that the evaluation process remained relevant throughout the project and gave them the opportunity to apply and maximize learnings in real time.
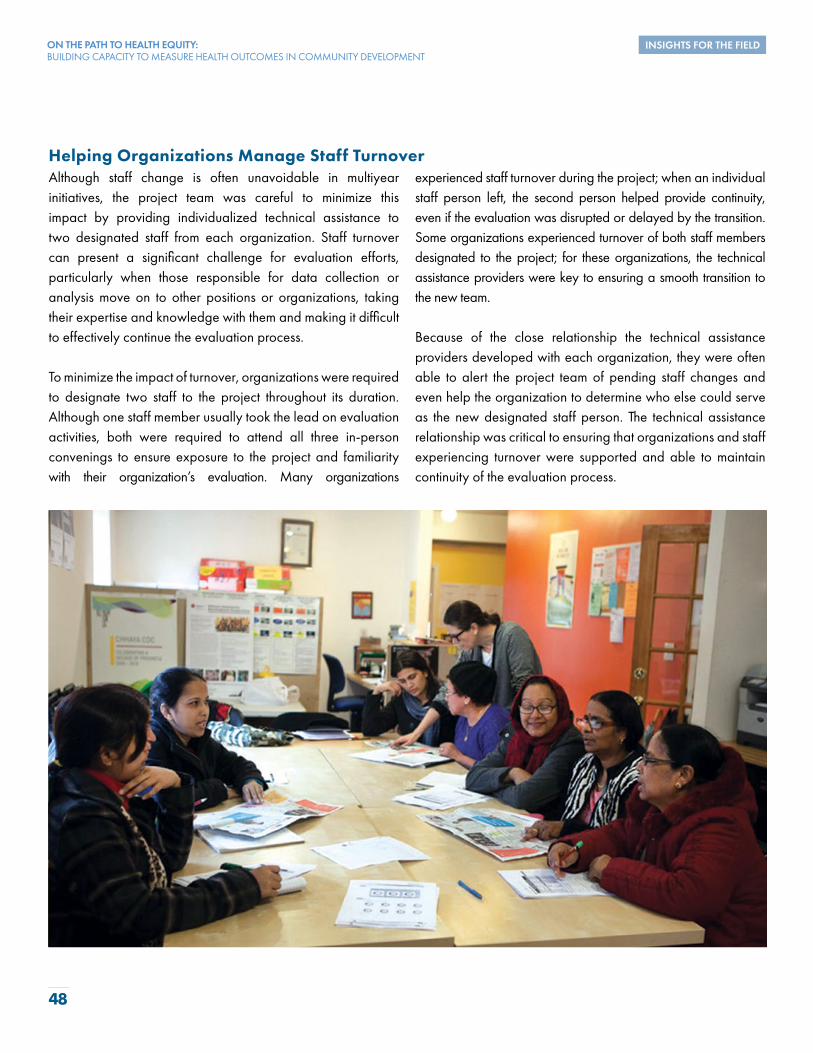
ON THE PATH TO HEALTH EQUITY:BUILDING CAPACITY TO MEASURE HEALTH OUTCOMES IN COMMUNITY DEVELOPMENT
48
Helping Organizations Manage Staff TurnoverAlthough staff change is often unavoidable in multiyear initiatives, the project team was careful to minimize this impact by providing individualized technical assistance to two designated staff from each organization. Staff turnover can present a significant challenge for evaluation efforts, particularly when those responsible for data collection or analysis move on to other positions or organizations, taking their expertise and knowledge with them and making it difficult to effectively continue the evaluation process.
To minimize the impact of turnover, organizations were required to designate two staff to the project throughout its duration. Although one staff member usually took the lead on evaluation activities, both were required to attend all three in-person convenings to ensure exposure to the project and familiarity with their organization’s evaluation. Many organizations
experienced staff turnover during the project; when an individual staff person left, the second person helped provide continuity, even if the evaluation was disrupted or delayed by the transition. Some organizations experienced turnover of both staff members designated to the project; for these organizations, the technical assistance providers were key to ensuring a smooth transition to the new team.
Because of the close relationship the technical assistance providers developed with each organization, they were often able to alert the project team of pending staff changes and even help the organization to determine who else could serve as the new designated staff person. The technical assistance relationship was critical to ensuring that organizations and staff experiencing turnover were supported and able to maintain continuity of the evaluation process.
INSIGHTS FOR THE FIELD

ON THE PATH TO HEALTH EQUITY:BUILDING CAPACITY TO MEASURE HEALTH OUTCOMES IN COMMUNITY DEVELOPMENT
49
Learning Through In-Person ConveningsOne defining feature of the project design was the creation of a cohort of 20 organizations that moved through the evaluation process together. Peer learning across the cohort was facilitated remotely and in-person. Informal monthly webinars covered key topics relevant to each stage in the data collection and analysis process.
Although the webinars were effective for communicating information and building participant capacity, they did not facilitate the dynamic-peer learning conversations originally intended. Many of the participants had limited time for remote peer learning and engagement, because much of their time dedicated to the project was focused on planning and implementing the evaluation. Rather than rely solely on remote learning through webinars and information sharing, three in-person convenings created a dedicated space and time for the participants to engage about their clients, challenges and the role of evaluation within their organizations.
In-person convenings were two-day meetings held at the beginning, midpoint and end of the project period. The convenings brought together participants, the project team, funders and national experts working at the intersection of health and community development. The convenings created opportunities for sharing across organizations, with small-group exercises intended to help organizations connect and reflect on their experiences. Together, participants explored the relevance of the SDOH framework to their work,
considered strategies to improve data collection and practiced communicating findings to key stakeholders.
The participants valued the opportunity to collaborate with a diverse set of organizations. Following an exercise on outcome mapping during the first convening, organizations expressed hopeful reflections on future collaboration. For example, one organization shared, “We identified large differences between the groups at this table. We deal with the same populations, but the ways we serve them are largely different. It gives me hope, we have something to strive for. There is such a large difference —but here we are all trying to do the same thing.”
Many organizations appreciated the opportunity to learn from one another. For example, one participant explained: “I found the breakout sessions to be very useful. It not only served as a socializing space to learn about each other and the work that we do, but most importantly we were able to share our program and engage in dialogue that led to different realizations and prompted many ideas that can help us better measure the outcomes of our program.”
These comments suggest that relying solely on group trainings via webinar would have limited the ability of the organizations to learn from one another and to form the unique bond that characterized the project cohort. Convening in person was critical to the project’s success and, importantly, put in place long-lasting relationships that will serve the field in the future.
INSIGHTS FOR THE FIELD

ON THE PATH TO HEALTH EQUITY:BUILDING CAPACITY TO MEASURE HEALTH OUTCOMES IN COMMUNITY DEVELOPMENT
50
CONCLUSION AND NEXT STEPS
Looking Ahead to Deeper Partnerships
By any number of measures, the Health Outcomes Demonstration Project was successful in achieving its goals. The capacity of the participating organizations to conduct future evaluations grew, and their more nuanced understanding of the way their programs influenced the SDOH sparked strategic discussions and deeper partnerships with local health care organizations.
CONCLUSION AND NEXT STEPS
The diversity of the organizations and their programs and their commitment to the evaluation project contributed substantially to its success. Additionally, the value of the strong partnership between Enterprise and NeighborWorks and the project’s funders cannot be overlooked. By working closely together, the team was able to leverage their unique roles to implement a project that had clear objectives, placed the needs of the participating organizations front and center and provided the critical supports necessary to bring all 20 organizations across the finish line. The project team anticipated potential challenges, made mid-course corrections as necessary and worked to synthesize the lessons learned for future value to the field. Just as the participating organizations were conducting their own evaluations, the project team was continuously assessing its own effectiveness in delivering on the project’s objectives. In this way, a culture of learning was infused from start to finish.
Most importantly, the project design had enough structure to ensure consistent support for and growth across the organizations, but enough flexibility to enable the organizations to apply their learnings directly to their unique programs, clients and communities. Participating organizations were able to use their evaluation results immediately; many responded by making changes to enhance program effectiveness, using the results in their strategic planning processes and committing to future evaluations.
Claretian Associates in Chicago reflected on the importance of this growth for achieving impact in their community: “[The demonstration project] has allowed us to see the power of having good and current data. Evaluating our performance and listening to the needs of the community will ensure that our work remains relevant and impactful…This has allowed us to serve them more holistically.”
Reflecting on Critical Factors for Project Success

ON THE PATH TO HEALTH EQUITY:BUILDING CAPACITY TO MEASURE HEALTH OUTCOMES IN COMMUNITY DEVELOPMENT
51
CONCLUSION AND NEXT STEPS
Continuing on the Pathway to Health EquityThe results of the project powerfully demonstrate the importance of evaluating health outcomes in housing and community development and the progress made by the 20 participating organizations, yet these accomplishments are just the beginning. A continued emphasis on the connection between community development and health outcomes is necessary and urgent. As health disparities grow and the goal of health equity seems more and more distant, the community development field must be recognized as a critical part of the health ecosystem.
The demonstration project built the capacity of the cohort of community-based organizations to understand their role in this ecosystem and gave them the tools needed to demonstrate the significance of their programs in improving the health outcomes of the people they serve. They began to own this new language of health and became able to articulate results in ways that would resonate and attract new and deeper partnerships with their local health care providers.
This work should be continued in ways that will advance health equity by demonstrating the effectiveness of community-based solutions to persistent health disparities. Future efforts should focus on fostering partnerships between community organizations and local health care providers to operationalize the social determinants underlying specific health disparities and develop “treatment plans” that address root causes.
An important foundation has been laid through this project to help organizations understand and recognize their impact on the SDOH. The next phase of this work must focus on building the evidence base around effective interventions and demonstrating a catalytic partnership model that will achieve desired outcomes and move toward achieving health equity for all. However, these future efforts must recognize that developing the evidence base around community-based interventions is often difficult and costly. When affordable housing and community organizations bear both the cost and the burden of data collection in developing the evidence base, they must pull precious time and resources away from the programs and services that are critical to advancing health equity. To protect this important work while building the evidence base, partnerships at the nexus of health and community development must include sufficient resources for measurement.
The Health Outcomes Demonstration Project offers a compelling picture of the role of community development in shaping health outcomes, lifting up successes and providing a call to action for deeper and more strategic engagement across sectors. It is vital that we both celebrate this success and recognize that the work is far from done.

ON THE PATH TO HEALTH EQUITY:BUILDING CAPACITY TO MEASURE HEALTH OUTCOMES IN COMMUNITY DEVELOPMENT
52
APPENDICES
A. Program Descriptions of Participating Organizations
B. List of Success Measures Health Outcome Tools
C. Sources and Notes

ON THE PATH TO HEALTH EQUITY:BUILDING CAPACITY TO MEASURE HEALTH OUTCOMES IN COMMUNITY DEVELOPMENT
53
APPENDIX A: PROGRAM DESCRIPTIONS OF PARTICIPATING ORGANIZATIONS
Organization ProgramDescription
The ACDC Resident Services Program assists residents with the development of educational, financial and vocational skills through after-school programs and coaching.
Avenue CommunityDevelopment Corporation
Houston, TX
CAMBA/CAMBA Housing Ventures, Inc.
Brooklyn, NY
The Asset Building Program provides clients with tools and information to achieve economic independence through housing counseling, financial capability and asset building.
Chhaya Community Development Corporation
Queens, NY
TargetPopulation
Residents living in multifamily affordable housing properties
Program Delivery
Supportive housing
Geography
Urban
CAMBA provides access to health care and mental health care, including counseling and other training programs, to residents of a permanent supportive housing development.
Formerly homeless residents living with severe and persistent mental illness or a chronic health condition in affordable and supportive housing
Supportive housing Urban
Low- to moderate-income New Yorkers of South Asian origin
Financial counseling and asset building
Urban
Chicanos Por La Causa
Phoenix, AZ
The CPLC Healthy Aging elderly service programs include health education, multi-purpose activities, healthy meals and food, and regularly scheduledsocial events.
Low-income, multicultural and Latino senior residents
Resident services Urban
Claretian Associates offers supportive wrap-around services to residents of their senior and multifamily affordable housing rental units, including providing space on-site for a health clinic to treat residents on a regular basis, financial education, food programs and art classes.
Claretian Associates
Chicago, IL
Residents living in an affordable and supportive housing development
Resident services Urban
APPENDICES

ON THE PATH TO HEALTH EQUITY:BUILDING CAPACITY TO MEASURE HEALTH OUTCOMES IN COMMUNITY DEVELOPMENT
54
APPENDIX A (continued)
Organization ProgramDescription
The CHP Resident Services Program includes chronic disease self-management, nutrition classes, wellness checks, smoking cessation, food pantry meals, mobility through movement, resident activities and crime watch.
Community Housing Partners Corporation
Sites throughout Virginia
and in Baltimore, MD
Community Housing Partnership
San Francisco, CA
The Extra Helping program offers free fresh produce distribution that addresses food insecurity, social cohesion, and financial health and well-being.
Cornerstone Community Housing
Lane County, OR
TargetPopulation
Senior and disabled residents of affordable housing properties
Program Delivery
Resident services
Geography
Rural, Suburban, Urban
Community Housing Partnership’s Clinical Behavioral Health Services are based on a recovery model, guided by trauma-informed and harm-reduction principles and include intensive clinical case management.
Formerly homeless single adults, seniors, and Transitional-Age Youth residents with complex behavioral health issues in14 supportive housing sites
Supportive housing Urban
Residents of affordable and supportive housing developments
Resident services Suburban, Urban
EAH Housing
Marin County, CA
The StayWell! Initiative organizes resident services and programs for older adult residents, including healthy eating, physical and mental health education, community building, and civic engagement.
Low-income residents living in affordable housing developments
Resident services Suburban, Urban
The High-Fidelity Wraparound (HFW) model is used to serve clients diagnosed with mental illness and features an intensive planning and service coordination process.
Housing Partnership, Inc.
Palm Beach County, FL
Community residents with diagnosed mental illness
Community-level initiatives
Rural, Suburban, Urban
APPENDICES

ON THE PATH TO HEALTH EQUITY:BUILDING CAPACITY TO MEASURE HEALTH OUTCOMES IN COMMUNITY DEVELOPMENT
55
APPENDIX A (continued)
Organization ProgramDescription
The Resident Services Youth Program provides creative and unique opportunities for mentorship, academic tutoring, recreational activities and leadership development.
Little Tokyo Service Center
Los Angeles, CA
Madison Park Development Corporation
Roxbury, MA
TargetPopulation
Youth ages 8—18 who live in affordable housing and in the surrounding neighborhoods
Program Delivery
Community-level initiatives
Geography
Urban
Healthy Eating in Roxbury’s activities include regularly scheduled nutrition education events, such as guided grocery store tours, cooking and smoothie demonstrations, and other educational events, aswell as support for two community gardens.
Residents of affordable housing developments and Roxbury community members
Resident services Urban
The Health and HEAT Squad partners with medical providers to address housing conditions associated with asthma and chronic obstructive pulmonary disease, as well as accessibility for the handicapped and elderly.
NeighborWorks ofWestern Vermont
West Rutland, VT
Low- and moderate- income households, including elderly and handicapped residents
Housing rehab and healthy housing initiatives
Rural
NeighborWorks Rochester
Rochester, NY
The Healthy Blocks initiative is a targeted neighborhood stabilization effort to improve property conditions, facilitate resident engagement and bolster neighborhood identity.
Existing residents and those looking for homeownership opportunities, as well as merchants and landlords in targeted neighborhoods
Community-level initiatives
Urban
APPENDICES
NeighborWorks Alaska
Anchorage, AK
The Homeownership Center’s Financial Capability Program teaches interested homeowners about the purchase process and works on post-purchase plans for new homeowners.
Low- and moderate-income individuals and families
Financial counseling and asset building
Urban

ON THE PATH TO HEALTH EQUITY:BUILDING CAPACITY TO MEASURE HEALTH OUTCOMES IN COMMUNITY DEVELOPMENT
56
APPENDIX A (continued)
Organization ProgramDescription
TargetPopulation
Program Delivery
Geography
The S:US urban farms initiative operates community gardens where residents serve as the primary caretakers by planting, tending and harvestingorganic produce sharedamong all residents.
Services for the UnderServed, Inc.
Brooklyn, NY
Spokane Neighborhood Action Partners
Spokane, WA
Chelsea Thrives is a cross-sector collaborative launched in 2014 that seeks to reduce crime by 30 percent over 10 years and improve the community’s sense of safety.
The Neighborhood Developers, Inc.
Chelsea, MA
Formerly homeless single adults with severe mental illness and substance use disorders living in permanent supportive housing
Supportive housing Urban
The Smoke-Free Initiative started in 2015 when Spokane Neighborhood Action Partners implemented a policy across its housing portfolio banning indoor smoking to improve the residents’ health.
Residents living in affordable and supportive housing developments
Housing rehab and healthy housing initiatives
Suburban
Community residents Community-level initiatives
Urban
West Angeles Community Development Corporation
Los Angeles, CA
Low-income senior residents living in affordable housing
Resident services Urban The West Angeles resident services program for senior residents includes yoga, line dancing, massages, and classes on diabetes awareness, financial literacy, and healthy cooking.
APPENDICES
The Selfhelp Active Services for the Aging Model (SHASAM) blends social services and health promotion activities, including social services intake, screening, assistance and advocacy for benefits, health screenings, wellness programs, socialization events, access to technology and a range of other services.
Selfhelp Community Services, Inc.
Queens, NY
Residents (primarily immigrant) of affordable and supportive housing developments
Resident services Urban

ON THE PATH TO HEALTH EQUITY:BUILDING CAPACITY TO MEASURE HEALTH OUTCOMES IN COMMUNITY DEVELOPMENT
57
APPENDIX B: LIST OF SUCCESS MEASURES HEALTH OUTCOME TOOLSThe complete set of tools is available at www.successmeasures.org/healthtools.
INDIVIDUAL AND COMMUNITY HEALTH STATUS
Individual Health StatusMedical Conditions Disease Management Overall Health Health Metrics
Community Health Status Community MorbidityCommunity MortalityMedical Visit Metrics
INDIVIDUAL HEALTH BELIEFS AND ATTITUDES
Attitudes and Discussions about HealthViews on Health Health Discussions with Household MembersHealth Discussions with Friends
Views on a Healthy LifestyleViews on EatingViews on Physical Activity Views on Alcohol, Tobacco and Drug Use Views on Relaxation and Stress Management
INDIVIDUAL HEALTH BEHAVIORS
Health Knowledge and Use of Health CareHealth Care Knowledge Use of Health Care ServicesHealth Insurance
Participation in a Healthy LifestyleEating BehaviorPhysical Activity BehaviorAlcohol, Tobacco and Drug Use Behavior Relaxation and Stress Management Behavior
Care Giving and ReceivingCaring for Others Receiving Care from Others
APPENDICES

ON THE PATH TO HEALTH EQUITY:BUILDING CAPACITY TO MEASURE HEALTH OUTCOMES IN COMMUNITY DEVELOPMENT
58
APPENDIX B (continued)
INDIVIDUAL FACTORS AND INFLUENCES
Individual FactorsIndividual Demographics - HealthHousing CostsFinancial StabilityFood SecurityFunctional StatusInterest in Education and TrainingEmployment and Workforce DevelopmentPersonal TraitsSocial Support and SafetyHousing Stability
Use of Community Services and Amenities Use of Amenities Use of Community Services
Social and Cultural Contexts Social ConnectionsCultural Context
Influences on Individual Influences on Individual’s Views on HealthInfluences on Individual’s Eating Influences on Individual’s Physical ActivityInfluences on Individual’s Alcohol and Tobacco Use
COMMUNITY ENVIRONMENTAL FACTORS
Housing ConditionsInterior of Residence: Resident PerceptionInterior of Residence: Expert AssessmentExterior of Residence: Resident PerceptionResidential Building Exterior and Site: Expert AssessmentMultifamily Common Areas: Resident PerceptionMultifamily Common Areas and Building Systems: Expert AssessmentHousing in the Community New Housing: Resident PerceptionRehab Housing: Resident Perception
APPENDICES

ON THE PATH TO HEALTH EQUITY:BUILDING CAPACITY TO MEASURE HEALTH OUTCOMES IN COMMUNITY DEVELOPMENT
59
APPENDIX B (continued)
Land Use and Physical FeaturesDesign and Management: Key Informant InterviewEnvironmental Metrics Land Use and MaintenanceTraffic and Pedestrian Safety
Community Services and AmenitiesAvailability and Quality of Amenities: Key Informant InterviewAccessibility and Perception of AmenitiesServices and Trainings in the Community: Available DataServices and Trainings in the Community: Key Informant PerceptionServices and Trainings in the Community: Resident Perception
COMMUNITY DEMOGRAPHICS AND SOCIAL FACTORS
Population CharacteristicsCommunity Demographics - Health
Social FactorsCommunity Social Cohesion
AVAILABILITY, QUALITY, AND CULTURAL SENSITIVITY OF HEALTH CARE SERVICES
Availability and Quality of Health Care Availability of Hospital and Health Care Services: Key Informant InterviewAvailability and Practices of Primary Care Services: Key Informant InterviewFeatures and Barriers in Health Care System: Key Informant Interview
Cultural Sensitivity and Interaction with Health Care ProvidersAccessibility of Health Care ServicesCultural Sensitivity of Health Care PracticesInteraction with Health Care Providers
COLLABORATIONS AND PARTNERSHIPS
Satisfaction with Collaborative Partnership
APPENDICES

ON THE PATH TO HEALTH EQUITY:BUILDING CAPACITY TO MEASURE HEALTH OUTCOMES IN COMMUNITY DEVELOPMENT
60

ON THE PATH TO HEALTH EQUITY:BUILDING CAPACITY TO MEASURE HEALTH OUTCOMES IN COMMUNITY DEVELOPMENT
61
APPENDIX C: SOURCES AND NOTES
i Centers for Disease Control and Prevention (CDC). 2018. “Social Determinants of Health: Know What Affects Health.” www.cdc.gov/socialdeterminants/index.htm. Accessed on March 15, 2019.
ii Image adapted from www.pwc.com/us/en/industries/health-services/case-for-intervening-upstream.html. iii PwC. 2019. “The case for intervening upstream.” www.pwc.com/us/en/industries/health-services/case-for-intervening-upstream.html. Accessed on April 15, 2019. iv CDC. 2018. “Social Determinants of Health.” www.cdc.gov/socialdeterminants/index.htm v Castrucci, Brian, and John Auerbach. “Meeting Individual Social Needs Falls Short of Addressing Social Determinants of Health.” vHealth Affairs. www.healthaffairs.org/do/10.1377/hblog20190115.234942/full/. Accessed on February 15, 2019. vi The Health Outcomes Demonstration Project adapted a SDOH model developed by the County Health Rankings, a collaboration between the Robert Wood Johnson Foundation and the University of Wisconsin Population Health Institute, for use in the project. More information on the County Health Rankings can be found at: www.countyhealthrankings.org/explore-health-rankings/measures-data-sources/county-health-rankings-model.
vii Community Science (2019). Assessing Health Outcomes in a Community Development Context: Lessons Learned from the Evaluation of the Success Measures Health Tools. Gaithersburg, MD: Author.
viii Due to rounding, the percentages reflected in this chart add up to 101 percent.
APPENDICES

ON THE PATH TO HEALTH EQUITY:BUILDING CAPACITY TO MEASURE HEALTH OUTCOMES IN COMMUNITY DEVELOPMENT
62

ON THE PATH TO HEALTH EQUITY:BUILDING CAPACITY TO MEASURE HEALTH OUTCOMES IN COMMUNITY DEVELOPMENT
63© Copyright 2019 Neighborhood Reinvestment Corporation. All rights reserved.
FOR MORE INFORMATION
For more information about the Health Outcomes Demonstration Project, please contact the project co-directors and visit the project web pages:
Lindsay Eilers, [email protected] Community Partners project web pagewww.enterprisecommunity.org/solutions-and-innovation/health-and-housing/health-outcomes-demonstration-project
Jessica Mulcahy, [email protected] NeighborWorks America project web pagewww.neighborworks.org/Training-Services/Outcome-Measurement/Success-Measures-Health-Tools/Health-Outcomes-Demonstration-Project
About Enterprise Community Partnerswww.enterprisecommunity.org
Enterprise Community Partners, Inc. is a national affordable housing intermediary that works to ensure that every family has a safe, affordable home in neighborhoods of opportunity by incubating programs to create solutions to challenging housing problems; investing capital to support the production and preservation of affordable housing; and advocating for policies that safeguard, expand and improve affordable housing and community development programs. The Knowledge, Impact, and Strategy team at Enterprise promotes data-driven decision-making by creating practitioner-focused tools and resources, cultivating key partnerships, and implementing a broad research agenda for the affordable housing and community development field.
About NeighborWorks America/Success Measureswww.nw.org | www.successmeasures.org
NeighborWorks America, a Congressionally chartered national nonpartisan nonprofit, is a leader in affordable housing and community development, working to create opportunities for low- and moderate-income people to live in affordable homes, improve their lives and strengthen their communities. Success Measures at NeighborWorks America offers evaluation consulting, technical assistance, measurement tools, and technology to assist nonprofits, funders and intermediaries in the community development and health-related fields to measure the impacts of their programs and investments.

ON THE PATH TO HEALTH EQUITY:BUILDING CAPACITY TO MEASURE HEALTH OUTCOMES IN COMMUNITY DEVELOPMENT
64
www.nw.org • www.enterprisecommunity.org