on the brics of collapse? - demos.org · centre for the study of governance innovation • 1 on the...
TRANSCRIPT

C E N T R E F O R T H E S T U DY O F G O V E R N A N C E I N N O VAT I O N • 1
On the BRICS of Collapse?Why Emerging Economies Need a Different Development Model
I N T R O D U C T I O N
Ever since the investment bank Goldman Sachs coined the acronym BRICs and launched it in the global debate in the early 2000s, there has been much talk about the rise of new powers in the international political economy. Brazil, Russia, India, China and, later on, South Africa have thus become the symbols of a global shift,
from an old global economic system led by the so-called West (the US and, to a lesser degree, European countries) to a new development trajectory, in which traditionally “un-der-developed” countries have come to play a leading a role. The immediate aftermath of the 2008 financial crisis further reinvigorated such a thesis, as the emerging powers contin-ued to grow their economies at a speed unparalleled by any advanced economy, seemingly unaffected by the fall of Wall Street that plunged both the US and Europe into a prolonged economic recession.
Yet, the reality appears much more complex than the “global power shift” discourse would have us believe. First of all, the BRICS countries have little in common in political terms. As many analysts have argued, the “alliance” can be better described as a marriage of conve-nience rather than a real partnership for change. The only uniting factor is the scale of their economies in terms of gross domestic product (GDP) and their sustained growth rates in
Paper prepared by the Centre for the Study of Governance Innovation (GovInn) University of Pretoria (South Africa)
The Centre for Study of Governance Innovation (GovInn) is the first research institution in Africa dedicated entirely to governance innovation, focusing not only on cutting-edge research but on creating an ‘innovation laboratory’ capable of generating new thinking about governance processes and attracting governance innova-tors from all over the world.
E Q U A L C H A N C E F O R A L LA N E Q U A L S A Y A N D A N

2 • O N T H E B R I C S O F C O L L A P S E ?
the past two decades. They are, for all intents and purposes, a “GDP club.” As resource-rich economies, they have adopted a development paradigm based on intensive extraction of natural resources (e.g. fossil and bio-fuels, minerals, etc.), which drive most of their ex-ports, and cheap labor, especially in China and India. They have pursued GDP growth with little or no investment in human development, thereby allowing the gap between the haves and have-nots to widen. In the few common initiatives developed so far, such as the pro-posal for a BRICS Development Bank, the focus has been on infrastructure investment for new forms of extractive practices, an approach to economic development that is increas-ingly volatile and unsustainable in a global context marked by extreme financial instability, costly and potentially catastrophic environmental pressures, and rising inequality. In line with their focus on extractive development, Brazil, China, India and South Africa sank the world’s hopes for a binding agreement on climate change in the Copenhagen negotiations of 2009. Yet, as some have argued, “if the international community fails to confront its most serious challenges—from the need for a sound global economic architecture to addressing climate change—[the BRICS countries] are the ones that will pay the highest price.”1
In part, this is already happening. While the BRICS countries were relatively unscathed by the 2008 financial collapse and its immediate aftermath, their GDP growth rates have begun to slow down and, in some cases, they have fallen dramatically since 2011. Income inequality has spiralled out of control, while social cohesion is fundamentally challenged by a development paradigm that has produced significant negative externalities on social rela-tions. Finally, environmental degradation has compounded all these problems, hampering human development and exacerbating inequality.
This paper provides an overview of development trends in the BRICS countries, focusing on economic, social and ecological trends. Section 2 analyzes the lack of a common political vision behind the BRICS alliance and identifies GDP growth as the only uniting factor. Sec-tion 3 discusses recent economic trends in these countries and points out deficiencies and challenges. Section 4 moves on to analyze some critical social and environmental trends, using a variety a data from different international sources. Finally, the concluding section identifies the changes that need to happen to support an alternative BRICS development path, one that will enable equitable and sustainable progress within the large developing economies and also promote common action toward transforming the global economy on the same principles.
T H E B R I C S A S A “G D P C LU B”
The acronym BRIC was coined in 2001 by the then head of asset management at Goldman Sachs, Jim O’Neill, with a paper titled “Building Better Global Economic BRICs.” In his analysis, O’Neill singled out Brazil, Russia, India and China as the largest emerging mar-kets, whose rate of growth he saw as challenging the leading role of the G7 economies.2 In a 2003 follow-up paper, the Goldman Sachs team projected the BRIC’s economic expansion into the next decades and concluded that these countries were on track to overtake the

C E N T R E F O R T H E S T U DY O F G O V E R N A N C E I N N O VAT I O N • 3
G7 by 2040. As they reported, “The relative importance of the BRICs as an engine of new demand growth and spending power may shift more dramatically and quickly than expect-ed.”3 In 2005, they introduced a Growth Environment Score, which placed the BRIC coun-tries consistently in the top half of the global rankings, among the best environments for sustained economic growth.4 Skyrocketing consumption levels and continuous extraction and exportation of commodities and manufactured goods was, in the Goldman Sachs’ anal-ysis, the main reason to be “optimistic” about the rise of the BRICs.5
Since its inception, the BRIC concept has been founded on economic growth projections, with no reference to other parameters such as political/social development and inclusivity, let alone sustainability, as these dimensions are entirely neglected by GDP. As evinced in Goldman Sachs’ underlying assumptions, contemporary global governance is indeed in-creasingly influenced by economic parameters, which have, by and large, replaced tradi-tional military factors. GDP size is the main prerequisite for membership in multilateral dialogue platforms such as the G7-8 or the G20, as well as for membership in powerful policy institutions such as the Organization for Economic Cooperation and Development (OECD) and for voting power in the World Bank and International Monetary Fund (IMF). In the global race for economic success, GDP has come to count more than any other factor, which explains why analysts believe that, by sustaining high rates of GDP growth, the BRIC countries are likely to generate a fundamental power-shift in global governance institutions.
The critical importance of the “GDP factor” in defining the very nature of the BRICS became even more apparent in the controversy (in 2010) surrounding the inclusion of South Africa, Africa’s largest economy. As O’Neill himself declared: “South Africa has too small an economy. There are not many similarities with the other four countries in terms of the numbers.”6
Besides the inherent GDP-link uniting these five nations, there is little else they have in common. Politically, the BRICS comprise three democracies (including the largest in the world, India), a totalitarian regime (China), and a nation characterized by significant authoritarian tendencies (Russia). China and India have been forced to an uneasy cohabi-tation, due to longstanding geopolitical rivalries, including territorial disputes over Tibet.7 The two countries are also divided with respect to Pakistan. China has also been opposed (or at least lukewarm) to India’s bid to join the permanent members of the UN Security Council. Although trade between the two giants has been growing rapidly, Indian author-ities have been vocal against the slow pace in opening Chinese markets, while China has accused the Indian government of carrying out a containment policy through its outreach to East Asian nations such as Japan, Indonesia and South Korea.8
As continental powerhouses, South Africa and Brazil have been ambivalent as to how to combine their regional commitments with their membership in BRICS. In addition, while Brazil, India and South Africa have traditionally supported a progressive human rights agenda, both China and Russia (the only two permanent members of the UN Secu-rity Council among the BRICS) have systematically opposed it. Moreover in Africa (and in
4 • O N T H E B R I C S O F C O L L A P S E ?
South Africa too), there is growing unease with the type of resource-focused investment policy pursued by China in parts of the continent, which has prompted some leaders to speak of “a new form of imperialism.”9 Along with India, China has been making large strategic land purchases in Sub-Saharan Africa (and also in South America), a form of ag-gressive investment (popularly termed “land grabbing”) the aim of which is to increase food production and the associated water provision for Chinese internal consumption, with the collateral effect of reducing resources available for African consumption. These foreign investment patterns are decidedly at odds with South Africa’s (and Brazil’s) commitments to promote development in their respective regions.10 Moreover, growing demand in Asia for ivory and rhino horn, which are protected by national wildlife regulations, has turned poaching into a serious security problem in South Africa.
The fundamental characteristics of the BRICS export-driven economies are also different. Brazil, Russia and South Africa are exporters of minerals and energy and, in the past decade, have taken advantage of rising commodity prices to fuel their economic expansion (e.g., oil and natural gas account for 58 percent of all exports in Russia). India and China have leveraged their low labor costs to increase market shares in services and manufacturing re-spectively.11 As a group, their relationship is somewhat symbiotic: higher demand for raw materials in India and China has been boosting the GDP of Russia, South Africa and Brazil. Although they vow to cooperate in restructuring the global financial architecture, they have not been able to achieve consensus on virtually any major issue thus far. For instance, they did not agree on a candidate for the leadership of the IMF (as opposed to Europe-backed Christine Lagarde), nor did they unite forces to support an alternative candidate for the presidency of the World Bank (against US-backed Jim Yong Kim).
Since 2009, when the BRICS heads of state and governments met for the first time, there have been five consecutive summits.12 In 2012, they pledged $75 billion to boost the IMF’s rescue plan for the global financial crisis, but tied the loan to voting reforms within the Bret-ton Woods institutions. In 2013, they agreed on founding a new “development bank” aimed at mobilizing resources (worth $4.5 trillion over an initial 5-year period) for infrastructure projects in BRICS and other emerging economies and developing countries. In theory, the idea is to supplant the World Bank as the main lending institution for the developing world. They also established a business council to facilitate private-sector partnerships, a trade and development “risk pool,” and a contingent reserve arrangement, with a pool of $100 billion to cushion member states against any future economic shocks. China is expected to con-tribute $41 billion to the reserve, followed by Brazil and Russia ($18 billion each) and South Africa ($5 billion).
E C O N O M I C T R E N D S I N T H E B R I C S
The BRICS countries collectively represent almost 3 billion people (43 percent of world pop-ulation), with a combined nominal GDP of $14.8 trillion (about a quarter of global income), 17 percent of world trade, and an estimated $4 trillion in combined foreign reserves. They

C E N T R E F O R T H E S T U DY O F G O V E R N A N C E I N N O VAT I O N • 5
occupy 20 percent of world territory and, over the past 10 years, their aggregate income has more than quadrupled. By 2018, overall economic output in the BRICS may overtake that of the US. By 2020, 33 percent of world GDP may be accounted for by the BRICS. By 2027, China’s GDP is expected to equal the United States’ and, by 2050, the BRICS economies may absorb 50 percent of global markets. Consumption in the BRICS countries has also grown steadily and, in the next decade, 70 percent of global car sales growth is projected to occur in these emerging economies.
The BRICS have been successful in attracting foreign direct investment (FDI). A large part of FDI inflows in China has focused on manufacturing, while the bulk of FDI in Brazil, Russia and South Africa has been oriented toward the exploitation of natural resources, par-ticularly oil and mining. In India, by contrast, FDI primarily flows to the service sector. The BRICS’ combined share of total world exports has more than doubled in the past decades, from 8 percent in 2001 to 17 percent in 2012, with China accounting for the lion’s share, comprising 54 percent of BRICS’ exports in 2001, and 64 percent in 2012 (Figure 1). The share of capital goods exports from the BRICS has been increasing, from 14 percent in 2001 to 24 percent in 2012, while consumption goods exports have seen their share decline from 34 percent to 28 percent during the same period.
† J. Maia (2013) ‘Trade Patterns Between South Africa and the BRICS, and Future Export Opportunities’, Industrial Development Corporation, presentation given at BRICS Economic Outlook Conference, Sandton, 4-5 June 2013.
Figure 1. BRICS’ Share of Global Exports From 2001 to 2012
Top World Exporters in 2001 (USD 6.1 trillion)
Others 39% USA 12% Germany 9% BRICS 8%Japan 7%France 5%UK 4%Canada 4%Italy 4%Netherlands 4%Hong Kong 3%Africa (Excl. SA) 1%
Top World Exporters in 2012 (USD 18.1 trillion)
Others 41% USA 8% Germany 8% BRICS 12%Japan 4%France 3%UK 3%Republic of Canada 3%Italy 3%Netherlands 4%Hong Kong, China 3%Africa (Excl. SA) 3%

6 • O N T H E B R I C S O F C O L L A P S E ?
The BRICS’ common focus on accelerating economic growth has helped them leverage their position in various governance forums, but recent years have seen a significant de-celeration in their growth trajectories. As Figure 2 shows, GDP growth in the BRICS has experienced a sharp deceleration in the years following the 2008 global financial meltdown.
Throughout the past decade, most of growth in the BRICS was due to the scale of China’s “economic boom,” with its surge of exports, thirst for commodities, and build-up of for-eign-exchange reserves. Since the late 1990s, China’s economy has been fuelled by public credit expansion, with state-owned banks encouraged to finance as many new skyscrap-ers, highways, airports, dams and other infrastructure projects as needed to sustain the GDP-centered growth model. Free-flowing liquidity kept stocks and real estate prices buoy-ant, foreign investors were generously rewarded, and many citizens started filling the ranks of the country’s new middle class. Total credit reached 200 percent of GDP in 2013, up from 130 percent in 2008. However, as reported by Bloomberg in June 2013, “China’s leaders avoided bursting one bubble in 2008 by creating new ones,” especially in the transport and real estate sectors. “Yet China cannot forever delay its day of reckoning.”13 The Economist agrees that “China’s turbocharged investment and export model has run out of puff. Because its population is ageing fast, the country will have fewer workers, and because it is more prosperous, it has less room for catch-up growth.”14
† Author’s elaboration based on IMF World Outlook 2013
Figure 2. Economic Growth in the BRICS (% of Real GDP Growth 2000-2012)
2000 2001 2002 2003 2004 2005 2006 2007 2008 2009 2010 2011 2012
20
15
10
5
0
-5
-10
Brazil China India Russia SA
C E N T R E F O R T H E S T U DY O F G O V E R N A N C E I N N O VAT I O N • 7
In mid-2013, China’s imports and exports also declined. Overseas shipments fell by 3.1 percent compared to 2012 (while surveys had estimated a 3.7 percent gain), imports dropped by 0.7 percent (while the median projection was for a 6 percent increase). Plagued by overcapacity, especially in sectors such as shipping, cement, steel and car production, many Chinese industries have found themselves in dire straits and in need of significant state support. At the same time, the State Council has presented a hard line on financial risks arising from China's overcapacity problems. In a statement released in June 2013, they declared: “We will strictly prohibit providing new credit supply or direct financing in any form to illegal construction projects in sectors with overcapacity, so as to avoid reckless in-vestment exacerbating the problem of excess production capacity.”15 More power was also given to banks to write off “bad loans.” A few days later, China’s largest private shipyard, Rongsheng Heavy Industries, appealed to the state for a bailout.16
Chinese policymakers face multiple tradeoffs between real estate controls, monetary policy and propping up internal consumption, even as the latter increasingly appears to be the only possible way for the country to continue achieving high rates of economic growth. The most critical issue for the Chinese economy and, as a consequence, for the BRICS (which largely depend on Chinese investment and purchasing power) is not the short-term slide in growth, but the potential long-term effects of a systematic decline in the Asian giant’s economic performance. It seems unlikely that China will hit its official target of 7.5 percent growth in 2013, which is in any case a far cry from the double-digit rates the country boast-ed in the past. At the BRICS level, there is evidence that China’s slowdown is already im-pacting the other members of the club. The most vulnerable counterparts are Russia, Brazil and South Africa, which have traditionally propelled their GDP thanks to rising energy and commodities prices driven upward by Chinese growth. Russia is set to reach about 3 percent growth this year, after having been the only BRICS country to be heavily affected by the global financial crisis, which sank its GDP growth to -8 percent in 2009. In Brazil, economic growth in 2012 was a meagre 0.87 percent and, in South Africa, it has hovered around 2.5 percent. GDP growth in India has also fallen to about 5 percent, less than half of what it was prior to 2008. Collectively, the BRICS are likely to average 3 percent in 2013.17 As the Chinese economy slows down, Brazil has joined South Africa as the only two BRICS countries to experience a trade deficit in 2013.
In 2013, capital flight has undercut the stocks, bonds and currencies of Brazil, Russia, India and China in a common pattern. South Africa’s national currency (the rand) has also collapsed because of uncertainty over the economic trajectory of the country and extensive social unrest in the mining sector. As of July 2013, investors had withdrawn $13.9 billion from equity mutual funds invested in Brazil, Russia, India and China. In Brazil, the central bank alerted policymakers to the risk of stagflation (high inflation coupled with a stagnating economy) as projected inflation exceeded 6 percent while the depreciation of the national currency (the real) reached the lowest levels since the global financial crisis.19 Inflation, especially in the real estate sector, has been a fundamental problem in China as well. In Feb-
8 • O N T H E B R I C S O F C O L L A P S E ?
ruary 2013, the government circulated “new measures” to regulate the real estate market. The State Council not only reiterated the importance of curbs on purchases and loan restric-tions, and the determination to crack down on speculative and investment-driven home purchases, but it also demanded that local governments announce property price-control targets each year. In addition, it committed to establishing prompt implementation of pur-chase restrictions in cities where property prices have risen too fast, and it pledged to de-velop a system for the stabilization of property prices. A recent Foreign Affairs forum titled “Broken BRICS” captures the feeling of many observers of these destabilizing economic and political trends.20
S O C I A L A N D E N V I R O N M E N TA L T R E N D S I N T H E B R I C S
As the BRICS countries have few social safety nets (e.g. welfare mechanisms are weak and often under-resourced), they are particularly susceptible to external economic shocks such as cyclical drops in demand for commodities, or currency fluctuations. Given that external shocks undercut exports and drive up unemployment, or in some cases drive up inflation, weak social safety nets (coupled with limited accountability and widespread corruption) naturally lead to social unrest. In some cases, as we saw in Brazil recently, stark contrasts between high-profile public works (the World Cup 2014 stadiums) and inefficient, low-qual-ity public services, spark large-scale protests. Moreover, while the BRICS still see themselves as “developing” countries, their societies are already suffering from a variety of negative externalities generally associated with advanced stages of industrial development, such as environmental degradation, pollution-related health hazards, and income inequality.
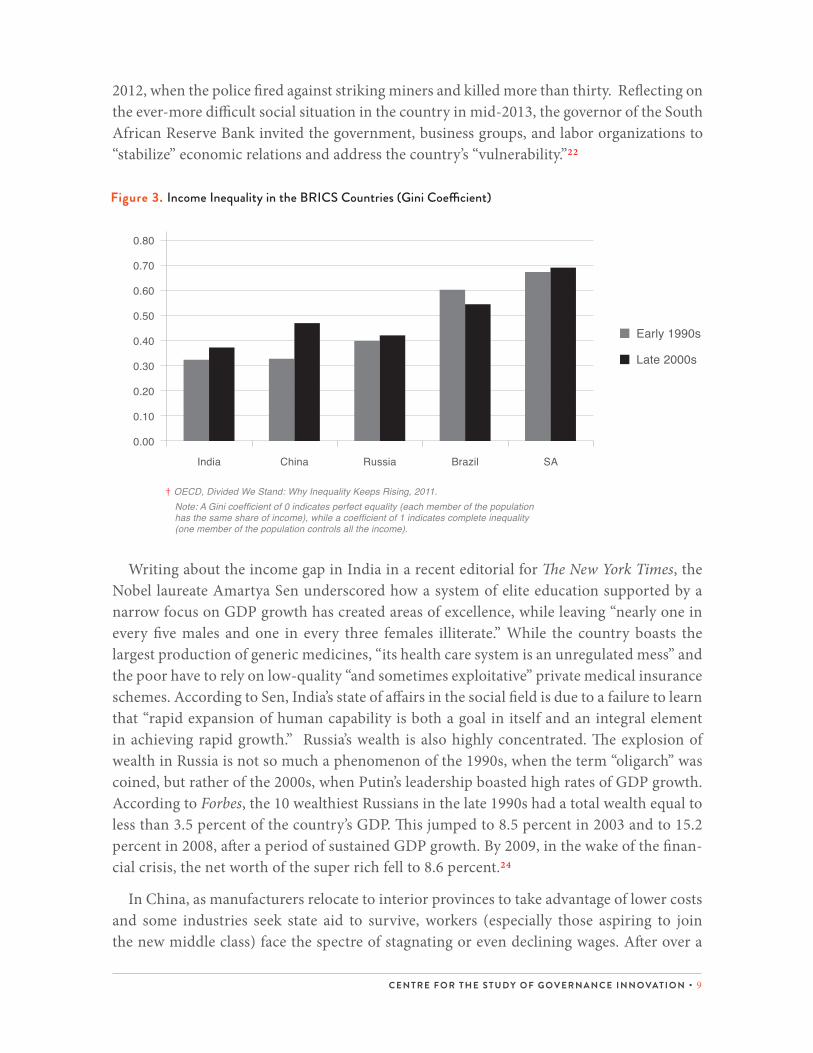
Parallel to the growth of GDP, income inequality has risen steadily in the BRICS countries over the last two decades, with only one exception (Figure 3). South Africa still tops the list, actually showing a slight increase compared to the apartheid era. For many South Africans, growing inequality casts doubt on how democracy has been implemented after apartheid. Several reforms in the field of land redistribution, minimum wage, public healthcare, and education, which were championed by the liberation movements during the struggle for de-mocracy, have been systematically delayed or shelved because of a rather myopic emphasis on structural adjustment policies aimed at privatizing public services, reducing public ex-penditure, and supporting rent-seeking positions in the economy (especially in the mining sector).21 South Africa’s wealth is still largely concentrated in a few hands, mostly within the white racial group, although the number of black millionaires is also growing (the so-called “black diamonds”). While the country’s prosperous areas enjoy world-class (private) health-care and education, most of the country is still lagging behind, with public schools and hospi-tals in abysmal conditions. Social unrest is escalating dramatically, with continuous protests triggered by lack of service delivery in townships and rural areas. These protests sometimes mutate into xenophobic attacks against migrants from other African countries, in what is be-coming a dangerous war of the marginalized. The mining sector, one of the traditional pillars of the country’s extractive development strategy, has been marred by turmoil ever since late
C E N T R E F O R T H E S T U DY O F G O V E R N A N C E I N N O VAT I O N • 9
† OECD, Divided We Stand: Why Inequality Keeps Rising, 2011. Note: A Gini coefficient of 0 indicates perfect equality (each member of the population has the same share of income), while a coefficient of 1 indicates complete inequality (one member of the population controls all the income).
Figure 3. Income Inequality in the BRICS Countries (Gini Coefficient)
India RussiaChina Brazil SA
0.80
0.70
0.60
0.50
0.40
0.30
0.20
0.10
0.00
Early 1990s
Late 2000s
Writing about the income gap in India in a recent editorial for The New York Times, the Nobel laureate Amartya Sen underscored how a system of elite education supported by a narrow focus on GDP growth has created areas of excellence, while leaving “nearly one in every five males and one in every three females illiterate.” While the country boasts the largest production of generic medicines, “its health care system is an unregulated mess” and the poor have to rely on low-quality “and sometimes exploitative” private medical insurance schemes. According to Sen, India’s state of affairs in the social field is due to a failure to learn that “rapid expansion of human capability is both a goal in itself and an integral element in achieving rapid growth.” Russia’s wealth is also highly concentrated. The explosion of wealth in Russia is not so much a phenomenon of the 1990s, when the term “oligarch” was coined, but rather of the 2000s, when Putin’s leadership boasted high rates of GDP growth. According to Forbes, the 10 wealthiest Russians in the late 1990s had a total wealth equal to less than 3.5 percent of the country’s GDP. This jumped to 8.5 percent in 2003 and to 15.2 percent in 2008, after a period of sustained GDP growth. By 2009, in the wake of the finan-cial crisis, the net worth of the super rich fell to 8.6 percent.24
In China, as manufacturers relocate to interior provinces to take advantage of lower costs and some industries seek state aid to survive, workers (especially those aspiring to join the new middle class) face the spectre of stagnating or even declining wages. After over a
2012, when the police fired against striking miners and killed more than thirty. Reflecting on the ever-more difficult social situation in the country in mid-2013, the governor of the South African Reserve Bank invited the government, business groups, and labor organizations to “stabilize” economic relations and address the country’s “vulnerability.”22

10 • O N T H E B R I C S O F C O L L A P S E ?
decade of silence on inequality data, the Chinese National Bureau of Statistics published Gini coefficient estimates in 2013, finding a level of about 0.47 (with a peak of 0.49 experi-enced in 2008)—well above the 0.4 level that is usually considered a critical threshold for potential unrest.25 Yet, even these figures—all the more alarming for a country that is still officially inspired by socialist ideology—are too low according to other estimates. A study of 8,438 households carried out by the Survey and Research Center for China Household Finance, a body set up by the Finance Research Institute of the People’s Bank of China and Southwestern University of Finance and Economics, found that the Gini coefficient in China was 0.61 in 2010, with 10 percent of households capturing up to 58 percent of the country’s disposable income.26 The Chinese Academy of Social Sciences, a state research institute, estimated inequality at 0.54 in 2008.27 The International Monetary Fund confirms that income inequality in China has risen more than in any other Asian economy in the last two decades.28 It appears that China is among the ten most unequal societies on the planet, after a handful of sub-Saharan African countries, and overtaking Brazil. In January 2013, the Chinese leadership published a 35-point plan to address income redistribution.29 Ac-cording to the Chinese Academy of Social Sciences in Beijing: “The income gap in China is so big now that it brings huge risks of derailing China from its growth path.30
Brazil is the only BRICS country in which measured inequality has been reduced over the past decade. Arguably this has been possible through a set of innovative policies aimed at supporting the poorest segments of the population, such as Fome Zero (Zero Hunger), which has included cash transfers to needy families, compulsory vaccinations, financial aid for school-going children, support for subsistence family farming and various forms of mi-crocredit. One of its key components, Bolsa Familia (Family Allowance) is among the larg-est welfare mechanisms in the world, reaching over 11 million families or over 26 percent of the population.31 Despite the success of these policies (which should be replicated in other BRICS countries), Brazil is still one of the most unequal societies in the world. Moreover, its education and healthcare systems have been largely privatized, which means additional costs for households (albeit these may escape official statistics).32 There is little doubt that the recent social unrest in Brazil, pointed to earlier, has also been motivated by popular dis-satisfaction with the pace of reform, especially in times of high inflation.
Interpersonal trust, a fundamental ingredient of social cohesion and social capital, has also experienced a downward trend in most BRICS countries (Figure 4). In Brazil, about 7 percent of citizens interviewed in the mid-1990s believed that “most people can be trusted” (which is the standard question used in comparative surveys to measure public trust). The same opinion was shared by only 2.8 percent of respondents at the end of the decade. South Africa also experienced a collapse of public trust, down from 28 percent in 1990 (when apartheid was still in existence and four years before the first democratic elections) to about 12 percent in the early 2000s. Russia also saw a dip in public trust (from 37 percent to 23 percent), while India moved in the opposite direction, with a growing minority of citizens who trust each other (from 35 percent to 41 percent). China is the only country in which a

C E N T R E F O R T H E S T U DY O F G O V E R N A N C E I N N O VAT I O N • 11
Brazil
China
India
Russia
South Africa
† World Values Survey (Databank)
Figure 4. Public Trust in the BRICS (% of those who believe that most people in their country can be trusted)
Early 1990s Late 1990s Mid 2000s
70%
60%
50%
40%
30%
20%
10%
0%
When it comes to environmental degradation, the BRICS countries show numerous signs of unsustainable development. The emissions of greenhouse gases (GHG) have steadily in-creased in the BRICS, largely propelled by the energy-intensive growth of the Chinese econ-omy and, to a lesser degree, of India (Figure 5).
At the per-capita level, however, the worst emitters are South Africa, Brazil, and espe-cially Russia. Ever since the mid-1990s, when the former Soviet Union’s highly polluting industrial system was partly replaced with new technologies, resulting in a sharp but tem-porary decline in emissions, Russia has been on an upward curve in both collective and per capita GHG emissions. There are considerable differences among the BRICS in terms of the intensity and composition of renewable sources of energy. The diffusion of wind and solar photovoltaic technologies appears to have developed rapidly in China and India, much less so in the other BRICS countries. This is mainly due to the abundance of fossil fuels in Russia and South Africa, the availability of hydro energy in Brazil, and the presence of national policies that support nuclear technology (especially in Russia and South Africa, which have signed an agreement for technology transfer in the nuclear energy field).33
majority of citizens believe that most people can be trusted. Yet, the trend has been down-ward here too: from 60 percent to 54 percent.

12 • O N T H E B R I C S O F C O L L A P S E ?
Figure 5. Aggregate GHG Emissions in the BRICS (Metric Tons of CO2 Equivalent)
† World Values Survey (Databank)
Brazil
China
India
Russia
South Africa
1990 1995 2000 2005 2008 2009 2010
12000
10000
8000
6000
4000
2000
0
All BRICS countries have also experienced significant losses in terms of per capita bio-capacity (that is, the capacity of a segment of land or sea to supply resources and absorb waste), while at the same time relentlessly enlarging their ecological footprints.34 Brazil tops the list in terms of biocapacity loss, with a decline from over 23 global hectares per capita in 1961 to about 10 in 2009. While China experiences a lower biocapacity loss (at least compared to Brazil), its ecological footprint has skyrocketed: from less than one global hectare per capita in the early 1960s to about 2.5 in 2009. The per capita biocapacity of India has also decreased (from 0.6 to 0.5 in fifty years), while its ecological footprint has grown, from about 0.7 to 0.9. In South Africa, biocapacity has halved (from over 3 to 1.5 hectares per capita) and in Russia per capita ecological footprint has grown to 4.4 from less than 3 in the 1960s. The Environmental Performance Index (published by Yale University in part-nership with the World Economic Forum), which assesses the performance of a country’s environmental policies, identifies Brazil as the only BRICS country whose policies can be considered “good,” with a ranking of 30th out of 132 countries. Russia and China are con-sidered bad performers (106th and 116th respectively), followed by India and South Africa, which rank near the bottom of the Index (125th and 128th respectively).
Also, natural capital, that is, the measured asset value of natural resources such as agri-cultural land, cropland, forests, timber, fossil fuels, and minerals, has decreased steadily in the BRICS countries due to extractive practices (Figure 6). In China, minerals and fossil fuels have accounted for most of the loss, while Russia has experienced severe reductions in terms of agricultural land and cropland, coupled with loss of natural capital associated with the extraction of natural gas. In India, pastureland, cropland and agricultural land have seen a slight upward trend, with minerals accounting for most of the depletion in nat-

C E N T R E F O R T H E S T U DY O F G O V E R N A N C E I N N O VAT I O N • 13
† UNEP, UNU-IHDP (2013) Inclusive Wealth Report 2012 (Cambridge: Cambridge University Press)
Figure 6. Natural Capital in the BRICS (Bill ions of Constant US $ of Year 2000)
China
Russia
Brazil
India
South Africa
1990 1992 1994 1996 1998 20042000 20062002 2008
8,000
7,000
6,000
5,000
4,000
3,000
2,000
1,000
0
1990 1992 1994 1996 1998 20042000 20062002 2008
1,800
1,600
1,400
1,200
1,000
800
600
400
200
0
ural capital. In the case of South Africa, depletion of natural capital mainly has been due to the extraction of coal. Although Brazil had managed to reduce deforestation in the past few years, recent data released by the government show that the positive trend has been reversed.35 Brazil’s national space agency has registered 465 square km of deforestation during the month of May 2013, nearly a five-fold year-over-year increase. From August 2012 to May 2013, a total of 2,338 square km—an area roughly three times the size of New York City—was registered as “lost.”

14 • O N T H E B R I C S O F C O L L A P S E ?
The economic costs of environmental degradation in China took center stage in public debate with the introduction of an official “green GDP” assessment in 2006. With data from 2004, the first report showed that the economic losses caused by pollution amounted to 511.8 billion yuan ($66.3 billion), equivalent to 3.05 percent of the national economy. Broken down, environmental costs from water pollution, air pollution and solid wastes accounted for (respectively) 55.9%, 42.9% and 1.2% of the total costs.36 With a view to conducting proper environmental assessments, the State Environmental Protection Administration (SEPA, which was upgraded to Ministry of Environmental Protection in 2008) ordered the closure of 30 construction sites worth over $14 billion, including some projects associated with the controversial Three Gorges Dam, the world’s largest power station that has caused the displacement of 1.3 million people since 2005. The National Bureau of Statistics, which led the data gathering process, affirmed that the green GDP initiative was introduced to help people understand the hidden costs of development, urging them to realize that “it is unrea-sonable to purely seek economic growth while ignoring the importance of the resources and environment.”37 SEPA also admitted that the pilot was “only the beginning of our efforts in a Green GDP calculation,” as estimates were based on partial measurements and sectoral damage, which excluded significant areas of environmental degradation.38 According to Pan Yue, China’s Vice Minister of the Environment, the country’s economic performance is in peril: “This miracle will end soon because the environment can no longer keep pace.” He believes that environmental damage has cost China 8 to 15 percent of GDP per year (well beyond the official green GDP estimates of 2006) and concludes “that China has lost almost everything it has gained since the late 1970s due to pollution.”39 More recently, this data has also been confirmed by the World Bank, which estimates the cost of environmental degradation in China at 9 percent of GDP.40 The green GDP assessment was discontinued after the 2006 pilot, mainly because of opposition from political leaders in high-pollution provinces such as Ningxia, Hebei, Shanxi and Inner Mongolia. However, in 2013, as envi-ronmental clean-up costs spiked while official GDP growth began to slow down, the central government took steps to revive the calculation of green GDP.41
According to the Global Burden of Disease Study 2010, published in the medical journal The Lancet, 1.2 million people die in China every year from pollution-related causes; the term “airpocalypse” has now become a catchword among foreign observers living in the country.42 The much-discussed transition of the Chinese economy from investment-led growth to a consumption-based model does not promise relief from this environmental crisis; in fact, expanding internal demand may outpace export growth in terms of resource pressures and emissions, while adding massive new consumer waste flows within China.
Although Chinese megacities top the world’s rankings of the most polluted areas of the world—including Linfen (which sits in the heart of the country’s coal belt), Tianying (one of the nation’s centers for lead mining and processing) and of course Beijing—the world’s most polluted air is found in South Africa, about 100kms east of Johannesburg, in the town of Emalahleni (previously known as Witbank). According to a study funded by the European

C E N T R E F O R T H E S T U DY O F G O V E R N A N C E I N N O VAT I O N • 15
Union and carried out between 2011 and 2013, the levels of chromium and barium are so high that conventional monitoring instruments have been unable provide accurate mea-surements.43 The area is at the heart of South Africa’s coal industry, one of its major exports to China and India (South Africa is the world’s fifth largest coal exporter and the sixth larg-est consumer of coal). According to the Geosciences Council, a government research body attached to the Department of Minerals and Energy, at least 6,000 mines in South Africa have been abandoned in pursuit of more profitable sites and clean-up costs are estimated at about 100 billion rand (about $10 billion dollars), which is the equivalent of 2.5 percent of the country’s GDP.44 Despite growing concerns about the environmental and health-relat-ed impacts of intensive extraction of coal, the South African government obtained a $3.75 billion loan from the World Bank in 2010 to build the Medupi Power Station, the world’s fourth largest coal-fired plant.45 The African Development Bank also supported the initia-tive with an investment of $500 million. The overall cost of the project is estimated at 150 billion rand (about $15 billion dollars), which makes it the most expensive coal-fired plant in the world.46
The World Bank recently estimated that environmental damage costs India $80 billion per year, an equivalent of 5.7 percent of its GDP. The most serious causes include air pollution, the degradation of croplands, pastures, and forests, and poor water supply and sanitation. According to the team that conducted the assessment, “India has performed remarkably well economically, but that’s not reflected in its environmental outcomes. […] ‘Grow now, clean up later’ really doesn’t work.”47 The country suffers from dust and exceptionally bad air pollution, mainly caused by coal-fired power stations, vehicles, and industry, especially in the construction field. For the Environmental Performance Index, India has the world’s worst air pollution effects on human health (and is home to 13 of the 20 most polluted cities among big economies), sitting at the bottom of the global ranking, a few positions below China.48 The World Health Organization has found that acute respiratory infections are among the most common causes of deaths for India’s children.49 For the World Bank, as many as 23 percent of deaths among children may be attributed to environmental factors, “which means that about 350,000 under-fives die each year as a result of bad air, contam-inated water or similar problems.”50 Environmental disasters are also rather frequent in a country experiencing more severe climate conditions every year. Recently, severe floods in the northern state of Uttarakhand killed about 6,000 people. According to the National In-stitute of Disaster Management, a governmental research institution, the causes of the trag-edy are to be found in the combination of heavy rains, deforestation (including tree cutting for road construction), other activities such as building construction, mining, and hydro-electric projects, as well as out-of-control development in what used to be an old river bed.51
C H A R T I N G A S U S TA I N A B I L I T Y T R A N S I T I O N F O R T H E B R I C S
There are compelling reasons to believe that the BRICS are experiencing a convergence of crises that may not only offset the gains of economic growth, but also threaten the over-
16 • O N T H E B R I C S O F C O L L A P S E ?
all political and social stability of these countries. Their ambition to lead the internation-al community in a different direction (as compared to the type of leadership exercised so far by the US and, to a lesser degree, European countries) is undermined by the lack of a clear political vision and by the inconsistencies affecting their own development model. The question therefore is: Will the BRICS be able to question the long-term sustainability of their development model? Will they provide a new global leadership built on a different economic paradigm?
Path dependency, in this regard, poses a serious risk. Business-as-usual is comfortable for political leaders, especially when accountability channels are weak and entrenched powers are supported by complacent business interests. Moreover, the omnipresence of GDP as a global governance tool is more resilient than many critics of conventional development statistics may believe. Countries strive to achieve high rates of GDP growth to get access to global decision-making power. Recently, for instance, Nigeria has challenged the role of South Africa in both the BRICS and the G20, as the West African country may soon become Africa’s largest economy after changing the way in which its GDP is calculated.52 Neverthe-less, as the BRICS struggle to find their feet in a world dominated by conventional economic powers and largely anchored to an unsustainable development model, these emerging econ-omies may very well turn into a force for a new kind of progress.
To change this state of affairs, the BRICS countries should—at a very minimum—re-think their stances on a series of fundamental issues for both domestic and global eco-nomic governance. To begin with, the BRICS need to take a different approach to the global governance of climate change. Although their emphasis on historical responsibility is un-doubtedly fair, the BRICS cannot hide the fact that their contributions to climate change are growing at alarming rates. Even from a purely self-interested perspective, tackling climate change should be a priority for the BRICS, as their citizens are more vulnerable to harsher climates than is the case in most advanced industrial economies. In the field of global finan-cial reform, the BRICS would reap significant benefits from a stable and productive financial sector. As the hubs of contemporary global production, they have a profound self-interest in re-embedding finance in society to limit speculative markets that misallocate resources and produce imbalances. Although neo-liberal agendas have influenced some critical policies in these countries (especially in the field of education and healthcare), the BRICS are also marked by substantial popular resistance to the type of market fundamentalism supported by Washington. They could easily build on their own institutional diversity and pragmatism “to articulate a new global narrative that emphasizes the real economy over finance, policy diversity over harmonization, national policy space over external constraints, and social inclusion over technocratic elitism.”53
At a deeper level, however, the BRICS would need to fundamentally rethink what it means to be “developed” in the twenty-first century. As we have seen, their macro-economic ap-proach has largely fallen in line with the mainstream developmental discourse of the mid-to-late-twentieth century: market liberalization, privatization of social services, export-driven

C E N T R E F O R T H E S T U DY O F G O V E R N A N C E I N N O VAT I O N • 17
† UNEP, UNU-IHDP (2013) Inclusive Wealth Report 2012 (Cambridge: Cambridge University Press)
Figure 7. Human vs. produced capital in the BRICS (bil l ions of constant US$ of year 2000)
Human capital
Produced Capital
1990 1992 1994 1996 1998 20042000 20062002 2008
25,000
20,000
15,000
10,000
5,000
0
economy, cheap labor, and industrial growth based on the depletion of natural resources. In some ways, China and Russia have taken their own paths, yet their overall developmental trajectories are neither socially nor environmentally sustainable. Although this development model has propelled the BRICS GDP growth rates, it has generated several imbalances and negative externalities. As growth slows down, fundamental questions regarding the lack of social inclusion and the costs of environmental damage can no longer be avoided.
The UN distinguishes three types of capital that can drive economic growth: natural, pro-duced and human capital. We have already discussed how natural capital has been following a downward trend in all BRICS countries, thus endangering the capacity of these countries to sustain their environments. Produced capital, that is, the fixed capital assets and infra-structure that support most conventional economic activities (such as roads, buildings, ma-chinery, etc.), has experienced a more ambivalent trend, with growth in some sectors and slumps in others, following more directly the type of curves we have seen in the case of GDP. It is only in the field of human capital that the BRICS have been able to generate new resources and promote a general growth of wealth. Human capital has to do with people. It embodies the value of education, knowledge, and innovation and how these forms of wealth contribute to economic performance. As Figure 7 shows, human capital, not produced cap-ital, comprises the real “wealth of nations” in the BRICS countries, accumulating at a ratio of nearly 2-to-1.
While conventional growth requires an incessant depletion of natural resources and sky-rocketing environmental costs, investing in people is arguably the most cost-effective and sus-tainable trajectory for the BRICS economies. In order to harness the potential of human capital as a driver of economic and social progress, the BRICS will have to re-design their educational policies, especially at the level of primary education, where there are wide performance gaps. While the BRICS have designed their political economies around the “tangible” assets pro-duced by GDP growth, it is now time to realize that most of their wealth is to be found in the intangible value represented by the knowledge and creativity of their own citizens.
18 • O N T H E B R I C S O F C O L L A P S E ?
A people-driven transition is an enabling context within which to pursue a shift to a low-carbon economy in the BRICS. This transition will need to be based—at the very least—on natural resource management, income redistribution and new approaches to energy. While the introduction of renewable resources is paramount, it will not achieve much if the overall parameters of conventional development are not reconsidered. A different form of natural resource management, capable of showing the economic as well as the ecological value of natural capital, would help direct policies toward the preservation and promotion of environmental resources and biodiversity. Extractive industrial practices will need to be reconsidered, as they often tend to consume more wealth than they actually produce, thus undermining a country’s effort to save for the future. New metrics of inclusive wealth, which take into account the social, economic and ecological dimensions of development, will need to replace GDP as the guiding parameter for the design, implementation and monitoring of economic policies. Social policy reforms will be needed to tackle income inequality, not least through broadening access to education and healthcare. As many now recognize, in a knowledge-intensive global economy, the conventional theory of tradeoffs between social investment and economic growth is no longer useful. There is general agreement today that human development—largely a public responsibility—is the fundamental factor behind in-clusive, sustainable, long-term growth.
Finally, the BRICS countries will need to rethink their approach to energy, especially how it is produced and distributed. As remarked by the UN Industrial Development Orga-nization—not a traditional champion of environmental governance—the BRICS countries “installed capacity to produce renewable energy will need to be enhanced significantly in the near future, if growth in the BRICS is to be sustainable.”54 While large infrastructure projects constituted the backbone of the previous centuries’ development policies (since, at least, the Industrial Revolution), including huge investments in railroads, national grids and power plants, the twenty-first century demands a fundamental shift toward decentral-ization and more efficient transport. Microgrids and off-the-grid solutions could provide much-needed energy independence to hundreds of millions of people in the developing world, including the BRICS. Technological advances in the field of 3D printing and open-source hardware, which allow individuals to design and produce their own artifacts (and sell them locally), hold the potential to reorganize the current industrial system into a net-work of local small-scale producers, where innovation and creativity (rather than mass pro-ductivity and low cost) are the drivers of growth. Through genuine leapfrogging in tech-nology and through horizontal (rather than vertical, top-down) energy systems, the BRICS countries could spearhead a global transition toward “sustainable energy for all,” as the UN has pledged to achieve by 2030.

C E N T R E F O R T H E S T U DY O F G O V E R N A N C E I N N O VAT I O N • 19
1. D. Rodrik (2013). “What the World Needs from the BRICS,” Project Syndicate, 10 April 2013. Available online: http://www.project-syndicate.org/commentary/the-brics-and-global-economic-leadership-by-dani-rodrik.
2. J. O’Neill (2001). “Building Better Global Economic BRICs,” Global Economics Paper No. 66, Goldman Sachs, London.
3. D. Wilson and R. Purushotaman (2003). “Dreaming with BRICs: The Path to 2050,’ Global Economics Paper No. 99, Goldman Sachs, London, p.2.
4. J. O’Neil et al (2005). “How Solid Are the BRICs?,” Global Economics Paper No. 134, Goldman Sachs, London.
5. Wilson and Purushotaman (2003), p. 3.
6. “South Africa’s Presence ‘Drags Down Brics,’” The Mail & Guardian, March 13, 2012. Available online: http://mg.co.za/article/2012-03-23-sa-presence-drags-down-brics.
7. “Brics Summit Exposes the High Wall Between India and China,” The Daily Maverick, March 30, 2012. Available online: http://www.dailymaverick.co.za/article/2012-03-30-brics-summit-exposes-the-high-wall-between-india-and-china#.UgZ004U5vP8.
8. “For Group of 5 Nations, Acronym is Easy, but Common Ground is Hard,” The New York Times, March 28, 2012. Available online: http://www.nytimes.com/2012/03/29/world/asia/plan-of-action-proves-elu-sive-for-emerging-economies-in-brics.html.
9. “BRICS Chafe Under Charge of ‘New Imperialists’ in Africa,” Reuters, March 26, 2013. Available online: http://www.reuters.com/article/2013/03/26/brics-africa-idUSL1N0CE7I720130326.
10. P. Carmody (2011). The New Scramble for Africa (London: Polity Press); “How Food and Water Are Driving a 21st Century African Land Grab,” The Guardian, March 7, 2010. Available online: http://www.theguardian.com/environment/2010/mar/07/food-water-africa-land-grab .
11. “Another BRIC in the Wall,” The Economist, April 21, 2008. Available online: http://www.economist.com/node/11075147.
12. “Russia Says BRICS Eye Joint Anti-Crisis Fund,” Reuters, June 21, 2012. Available online: http://in.reu-ters.com/article/2012/06/21/russia-brics-imf-idINDEE85K04C20120621.
13. “China Loses Control of Its Frankenstein Economy,” June 24, 2013. Available online: http://mobile.bloomberg.com/news/2013-06-24/china-loses-control-of-its-frankenstein-economy.html.
14. “The Great Deceleration,” The Economist, July 27, 2013. Available online: http://www.economist.com/news/leaders/21582256-emerging-market-slowdown-not-beginning-bust-it-turning-point.
15. “As Shipbuilders Suffer Globally, China’s Rongscheng Seeks Government Help,” The Wall Street Journal, July 5, 2013. Available online: http://online.wsj.com/article/SB10001424127887324853704578586782265899040.html.
16. “Too Sick to Sail,” The Economist, July 13, 2013. Available online: http://www.economist.com/news/business/21581753-ailing-shipbuilders-test-chinas-commitment-reform-too-sick-sail.
17. See also “The Great Deceleration” (cited).
18. “Grim Trade Outlook for China as Exports Dive,” Business Day, July 11, 2013.
19. “Brazil Central Banks Sees Inflation Up, GDP Down,” Reuters, June 27, 2013. Available online: http://www.reuters.com/article/2013/06/27/brazil-cenbank-inflation-idUSL2N0F30BB20130627.
20. “Broken BRICs: Why The Rest Stopped Rising,” Foreign Affairs, November/December 2012. Available online: http://www.foreignaffairs.com/articles/138219/ruchir-sharma/broken-brics .
21. P. Bond (2000). Elite Transition: From Apartheid to Neoliberalism in South Africa (London: Pluto Press); R. Southall (2013) Liberation Movements in Power (Pietermaritzburg: UKZN Press).
22. G. Marcus (2013) “The Implications of the Crisis for Monetary Policy,” speech given at the Bureau for Economic Research annual conference, Sandton, June 6, 2013. Available online: http://www.bis.org/review/r130611a.pdf .

20 • O N T H E B R I C S O F C O L L A P S E ?
23. A. Sen (2013.) “Why India Trails China,” The New York Times, June 19, 2013. Available online: http://www.nytimes.com/2013/06/20/opinion/why-india-trails-china.html .
24. “The 100 Richest Russians,” Forbes, July 23, 2004. See also “Russia’s Richest: Forbes Publishes Bil-lionaire List,” RT, April 18, 2013. Available online: http://rt.com/business/russias-richest-billion-aire-forbes-list-059/.
25. “China Breaks Long Silence on Inequality Statistics,” The Telegraph, January 18, 2013. Available online: http://www.telegraph.co.uk/finance/economics/9810436/China-breaks-long-silence-on-inequality-sta-tistic.html .
26. “China’s Gini Index at 0.61, University Report Says,” Caixin Online, October 12, 2012. Available online: http://english.caixin.com/2012-12-10/100470648.html.
27. “China Survey Shows Wealth Gap Soaring as Xi Pledges Help,” Bloomberg, December 9, 2012. Available online: http://www.bloomberg.com/news/2012-12-09/china-s-wealth-gap-soars-as-xi-pledges-to-nar-row-income-divide.html.
28. “China Survey Shows Wealth Gap Soaring as Xi Pledges Help” (cited).
29. “People’s Daily Hails China’s Income Redistribution Plan,” People’s Daily Online, February 6, 2013. Available online: http://english.people.com.cn/90785/8123927.html.
30. “China Approves Income Plan As Wealth Divide Poses Risks,” Bloomberg, February 6, 2013. Available online: http://www.bloomberg.com/news/2013-02-05/china-approves-income-plan-as-wealth-divide-poses-risks.html.
31. International Poverty Centre (2007). Evaluating the Impact of Brazil’s Bolsa Familia Cash Transfer Pro-grammes in Comparative Perspective (New York: United Nations Development Programme).
32. “Brazil’s ‘Educational Apartheid’ Cements Inequality Early in Life,” Global Post, January 17, 2013. Avail-able online: http://www.globalpost.com/dispatch/news/regions/americas/brazil/130111/brazil-educa-tion-income-inequality.
33. UNIDO-UNU (2012). Structural Change, Poverty Reduction and Industrial Policy in the BRICS (Vienna: UNIDO-UNU).
34. All data is gathered from the 2010 Data Tables made available by the Ecological Footprint Network at: http://www.footprintnetwork.org/en/index.php/GFN/page/footprint_data_and_results/.
35. “Brazil Data Indicate Increase in Amazon Deforestation,” July 5, 2013. Available online: http://www.reuters.com/article/2013/07/05/us-brazil-deforestation-idUSBRE9640ZD20130705.
36. “Green GDP Accounting Study Report 2004 issues,” available on the official website of the Chinese gov-ernment at: http://www.gov.cn/english/2006-09/11/content_384596.htm.
37. “Green GDP system to debut in 3-5 years in China,” People’s Daily Online, March 12, 2004. Available online: http://english.people.com.cn/200403/11/eng20040311_137244.shtml.
38. “China issues first ‘green GDP’ report,” China Dialogue, September 7, 2006.
39. “The Man Making China Green,” The New Statesman, December 2006-January 2007, pp. 60-61.
40. “Environmental Damage Costs India $80bn a Year,” Financial Times, July 17, 2013. Available online: http://www.ft.com/intl/cms/s/0/0a89f3a8-eeca-11e2-98dd-00144feabdc0.html.
41. “China’s Green GDP Resurfaces,” Radio Free Asia, February 13, 2012. Available online: http://www.rfa.org/english/commentaries/energy_watch/greengdp-02132012120520.html.
42. The various research articles comprising the study can be accessed for free at: http://www.thelancet.com/themed/global-burden-of-disease.
43. “Witbank Air Dirtiest in the World,” News 24, April 25, 2013. Available online: http://www.news24.com/Green/News/Witbank-air-dirtiest-in-the-world-20130425.
44. Greenpeace (2008). The True Cost of Coal, November 27, 2008. Available online: http://www.greenpeace.org/international/en/publications/reports/cost-of-coal/.

C E N T R E F O R T H E S T U DY O F G O V E R N A N C E I N N O VAT I O N • 21
45. “World Bank’s $3.75bn Coal Plant Loan Defies Environmental Criticism,” The Guardian, April 9, 2010. Available online: http://www.theguardian.com/business/2010/apr/09/world-bank-criticised-over-pow-er-station.
46. “Medupi’s Hidden Costs Add to Our Woes,” The Star, August 2, 2013. Available online: http://www.iol.co.za/news/medupi-s-hidden-costs-add-to-our-woes-1.1556961#.UgOQuW1adK4.
47. “Environmental Damage Costs India $80bn a Year” (cited).
48. The rankings can be viewed at: http://epi.yale.edu/dataexplorer/indicatorprofiles?ind=eh.air.
49. “India’s Air the World’s Unhealthiest, Study Says,” The New York Times, February 1, 2012. Available online: http://india.blogs.nytimes.com/2012/02/01/indias-air-the-worlds-unhealthiest-study-says/?_r=0.
50. “Environmental Damage Costs India $80bn a Year” (cited)
51. The report can be accessed here: http://www.indiaenvironmentportal.org.in/files/file/Uttarakhand%20Disaster.pdf.
52. Lorenzo Fioramonti, “Nigeria vs. South Africa in Flawed GDP Battle,” The Mail & Guardian, July 28, 2013. Available online: http://mg.co.za/article/2013-06-28-00-nigeria-vs-sa-in-flawed-gdp-battle.
53. Rodrik (2013) “What the World Needs from the BRICS” (cited).
54. UNIDO-UNU (2012). Structural Change, Poverty Reduction and Industrial Policy in the BRICS (cited).