on land or underwater disposal of mine waste
TRANSCRIPT

Nand Davé
Metal Mine Tailings Management WorkshopIqaluit, Nunavut
February 9 & 10th, 2006
On Land or Underwater Disposal of Mine Waste
Presentation Outline• Acid generation control strategy• Cover technologies• Dry covers - case history and performance• Permafrost encapsulation• Water and ice covers - case history and
performance• Disposal in natural water bodies• Saturated cover concept

Sulphide Oxidation Process
Sulphide oxidation• Acid generating processes:
FeS2 + (15/4) O2 + (7/2) H2O = Fe(OH)3 + 2SO4-2 + 4H+
• Non acid generating processes:ZnS+2O2 = Zn+2 +SO4
-2
Other oxidation processes
• Ammonia oxidation
NH4+ + 2O2 = NO3
- + H2O + 2H+

Sulphide Oxidation - Control Strategy• Sulphide minerals, oxygen and water - key
ingredients of sulphide oxidation/acid generation problem
• Perpetual collection and treatment strategy unsuitable for long-term management
• Prevention and control measures - best strategy for long-term management:• Removal of sulphide minerals -
uneconomical• Exclusion of air, and hence oxygen – dry
and wet covers• Exclusion of water or both – dry covers• Natural material like till, clay and synthetic
liners - oxygen and water limiting• Water covers - oxygen limiting
FeS2
O2H2O
Sulphide Oxidation - Control Strategy
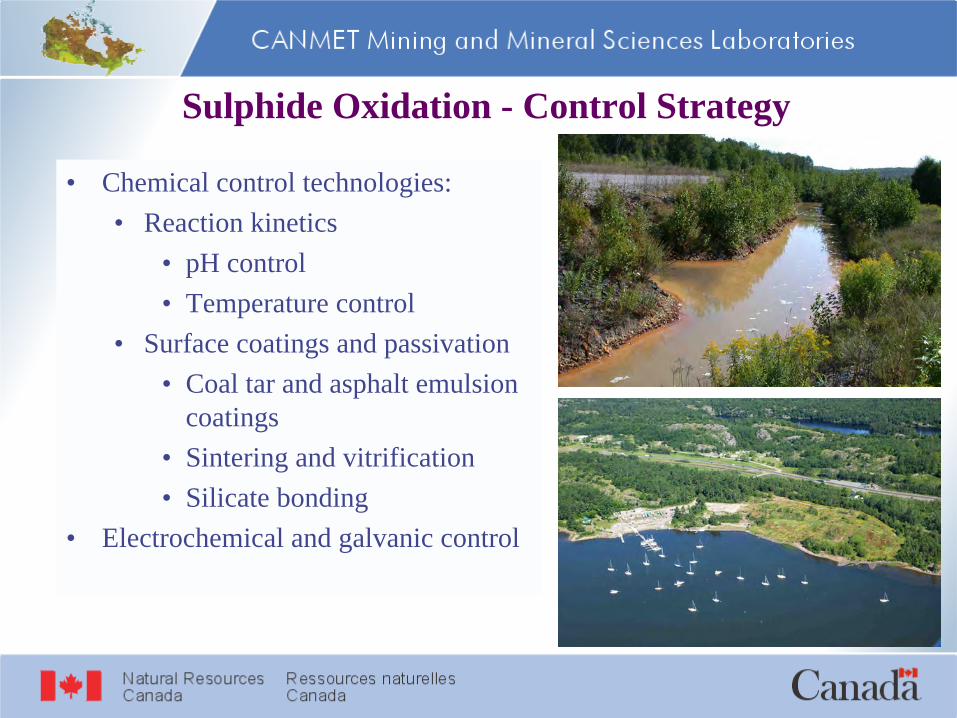
• Chemical control technologies:• Reaction kinetics
• pH control• Temperature control
• Surface coatings and passivation• Coal tar and asphalt emulsion
coatings• Sintering and vitrification• Silicate bonding
• Electrochemical and galvanic control
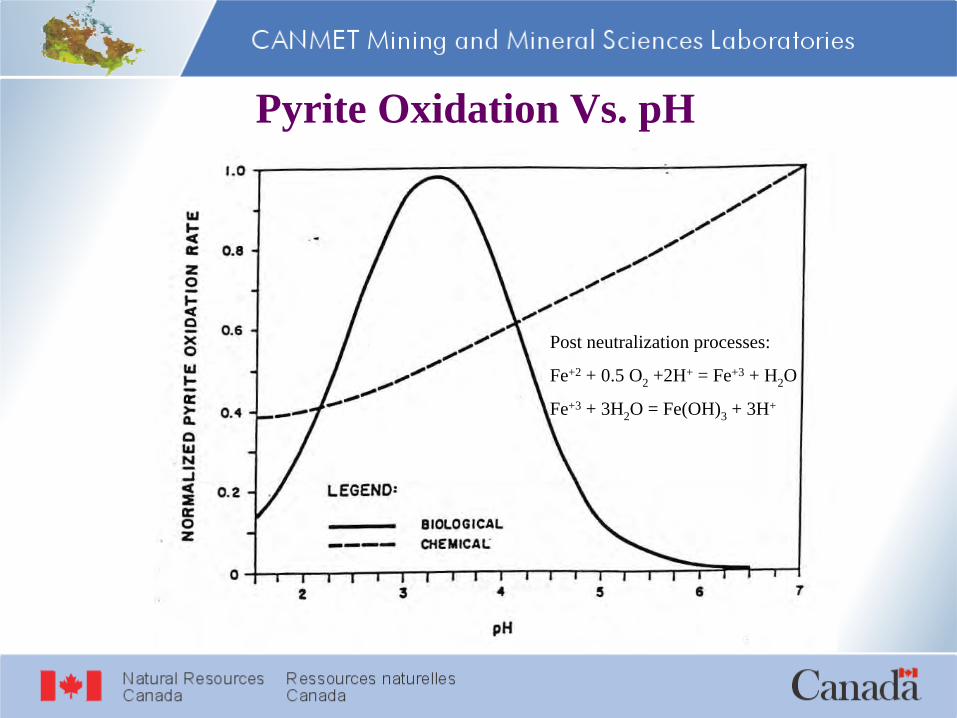
Pyrite Oxidation Vs. pH
Post neutralization processes:
Fe+2 + 0.5 O2 +2H+ = Fe+3 + H2O
Fe+3 + 3H2O = Fe(OH)3 + 3H+
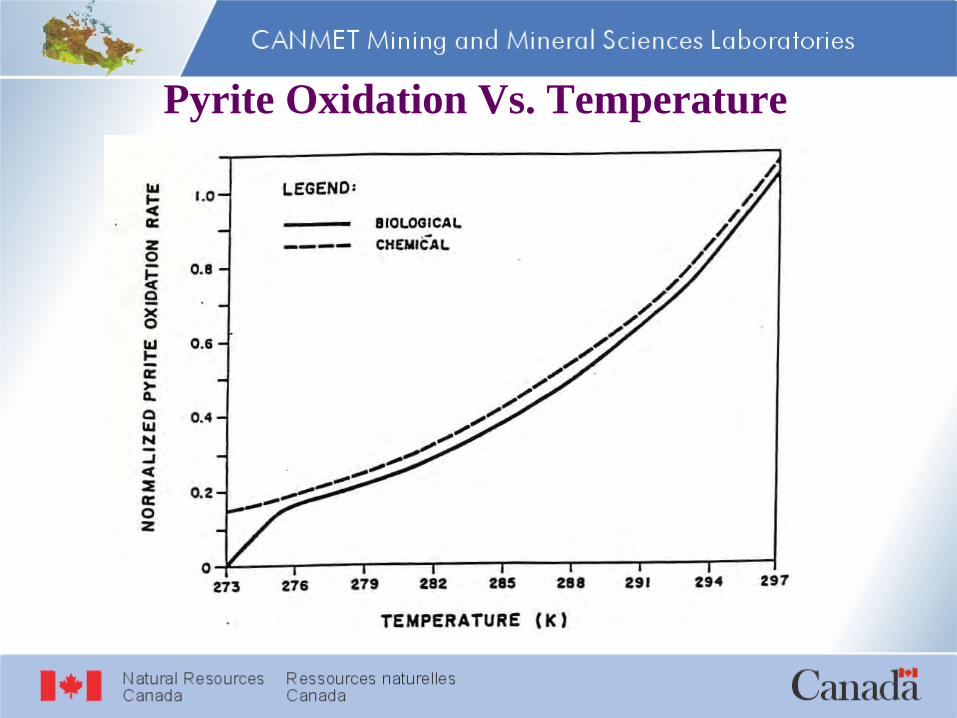
Pyrite Oxidation Vs. Temperature

Oxygen Diffusion - Unsaturation ConditionsUnsaturated Tailings - No Cover
0.0
0.5
1.0
1.5
2.0
2.5
3.0
0 100 200 300 400Oxygen Concentration, g/m3
Dep
th o
f Tai
lings
, m
T = 0 °C
T = 4 °C
T = 25 °C
Air Filled Pore SpaceOxygen Flux Vs. Temperature
0.0
0.2
0.4
0.6
0.8
1.0
1.2
-20 -10 0 10 20 30Temperature, °C
Nor
mal
ized
Oxy
gen
Flux
/ R
ate
Con
stan
t
O2 Flux O2 Rate Const.
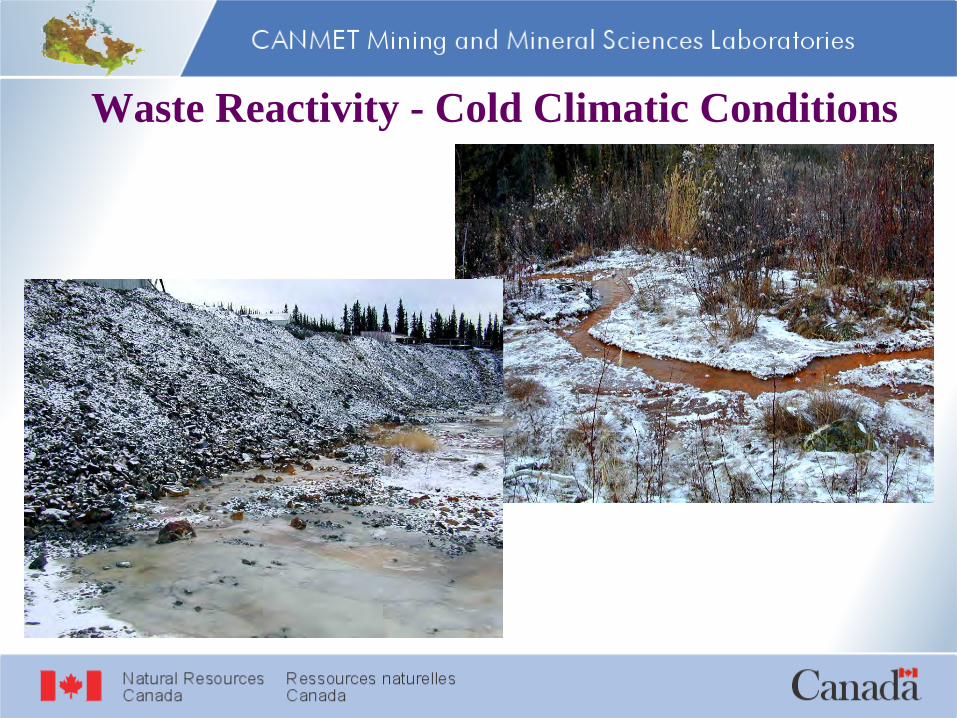
Waste Reactivity - Cold Climatic Conditions

Sulphide Reactivity Vs. TemperatureCullaton Lake S-Zone (0.4 % S, NP/AP = 0.16)
Cullaton Lake S-Zone - 25 °CpH Vs.Time
0
2
4
6
8
10
0 50 100 150 200 250 300Time, days
pH
pH - 1 pH - 2 pH - Avg.
Cullaton Lake S-Zone - 25 °CTotal Acidity Vs.Time
0
400
800
1200
1600
2000
0 50 100 150 200 250 300Time, days
Aci
dity
, mg
CaC
O3/L
Acidity - 1 Acidity - 2 Acidity - Avg.
Cullaton Lake S-Zone - 2 °CpH Vs.Time
0
2
4
6
8
10
0 200 400 600 800Time, days
pH
pH Avg. - Cold pH Avg.-Room
Cullaton Lake S-Zone - 2 °CTotal Acidity Vs.Time
0
200
400
600
800
1000
0 200 400 600 800Time, days
Aci
dity
, mg
CaC
O3/L
Acidity - 1 Acidity - 2 Acidity - Avg

Sulphide Reactivity Vs. TemperatureCullaton Lake S-Zone (0.4 % S, NP/AP = 0.16)
Cullaton Lake S-Zone - 25 °CCopper Concentration Vs.Time
0.0
0.2
0.4
0.6
0.8
1.0
0 50 100 150 200 250 300Time, days
Cop
per,
mg/
L
Cu - 1 Cu - 2 Cu - Avg.
Cullaton Lake S-Zone - 25 °CNickel Concentration Vs.Time
0
1
2
3
4
5
0 50 100 150 200 250 300Time, days
Nic
kel,
mg/
L
Ni - 1 Ni - 2 Ni - Avg.
Cullaton Lake S-Zone - 2 °CCopper Concentration Vs.Time
0
1
2
3
4
5
0 200 400 600 800Time, days
Cop
per,
mg/
L
Cu - 1 Cu - 2 Cu - Avg
Cullaton Lake S-Zone - 2 °CNi Concentration Vs.Time
0
1
2
3
4
5
0 200 400 600 800Time, days
Nic
kel,
mg/
L
Ni - 1 Ni - 2 Ni - Avg
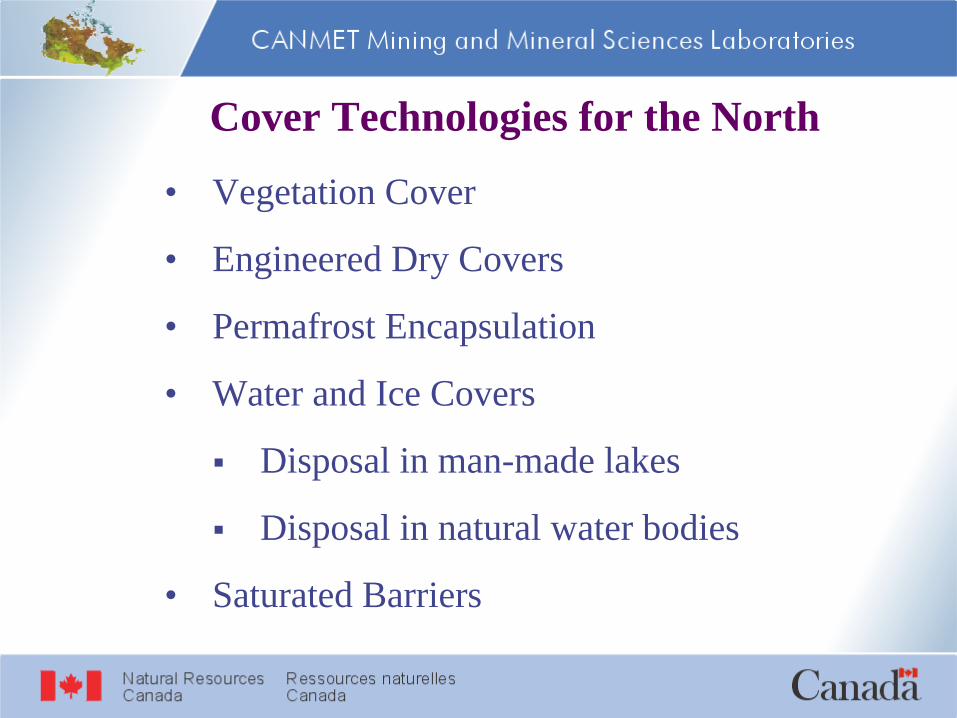
Cover Technologies for the North
• Vegetation Cover
• Engineered Dry Covers
• Permafrost Encapsulation
• Water and Ice Covers
Disposal in man-made lakes
Disposal in natural water bodies
• Saturated Barriers

Vegetation Cover - Successes / Challenges • Successful site remediation • Surface stabilization, and wind
and water related erosion control • Greatly improved site aesthetics• Acid rock drainage continues
unabated• Limited growth period and
availability of native seed species in the north
• Ongoing effluent collection and treatment required on a long-term basis (perpetuity)
• Sludge collection, disposal and management required
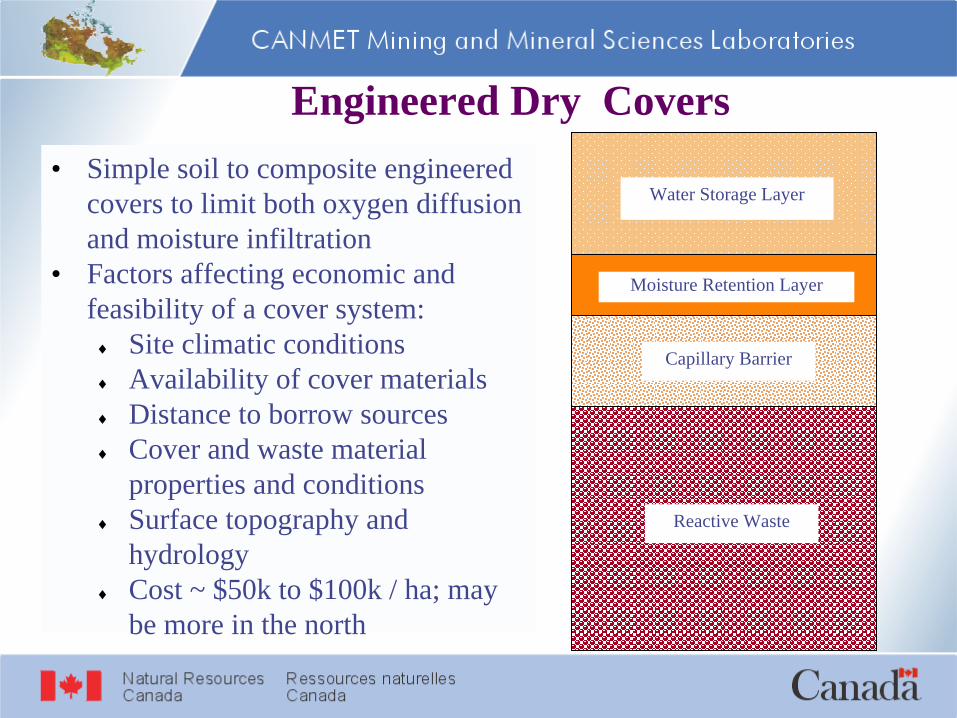
Engineered Dry Covers• Simple soil to composite engineered
covers to limit both oxygen diffusion and moisture infiltration
• Factors affecting economic and feasibility of a cover system:♦ Site climatic conditions♦ Availability of cover materials♦ Distance to borrow sources♦ Cover and waste material
properties and conditions♦ Surface topography and
hydrology♦ Cost ~ $50k to $100k / ha; may
be more in the north
Reactive Waste
Capillary Barrier
Moisture Retention Layer
Water Storage Layer
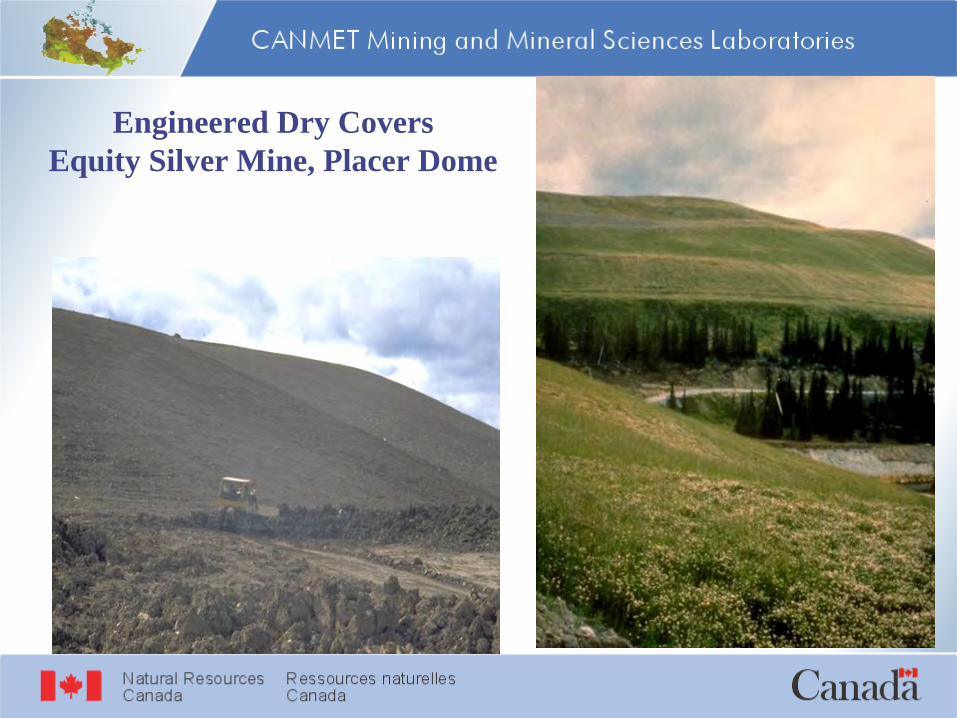
Engineered Dry Covers Equity Silver Mine, Placer Dome

Equity Silver Mine, Placer Dome, Houston, BC
• Site located in the central BC, approximately 35 km southeast ofHouston at an elevation of ~ 1300m
• Open pit and underground mining operation• Approximately 77.4 Mt of acid generating waste rock containing
~ 2 - 5 % pyrite, placed in three separate waste rock dumps• Engineered composite cover consisted of ~ 0.5 m compacted clay
layer as moisture retaining oxygen barrier overlaid by ~ 0.3 m of un-compacted till as erosion control and vegetation growth medium
• Site remediation started in 1990 and completed in 1997• The cover has reduced precipitation infiltration, oxygen ingress and
lime consumption, but the overall treatment cost is still high• Annual variations in precipitation continues to affect cover
performance

Engineered Dry Covers Equity Silver Mine, Placer Dome
Effluent Treatment - Annual Lime Consumption
Residual Oxygen conc.
LIME CONSUMPTION: Calendar Year - Quarterly
0
1000
2000
3000
4000
5000
6000
7000
1985
1986
1987
1988
1989
1990
1991
1992
1993
1994
1995
1996
1997
1998
1999
2000
2001
2002
2003
2004
LIM
E -
Tonn
es Additional4th Quarter3rd Quarter2nd QuarterIst Quarter
Dumps covered
PlantsiteFlush Years
LTA, Barrick Gold
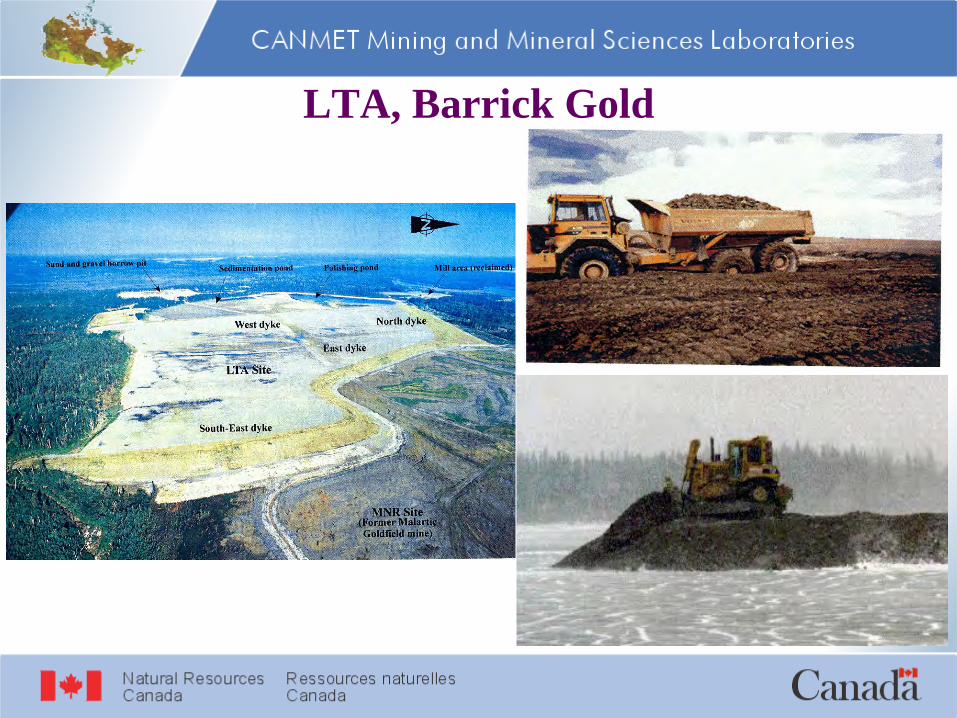
Les Terrains Aurifères (LTA) Barrick Gold, Malartic, QC
• LTA site is located approximately 8.5 km southeast of the City of of Malartic, Northern Québec
• Approximately 8 Mt of acid generating tailings placed over ~ 10 Mt of alkaline tailings covering an area of ~ 140 ha
• Alkaline tailings deposited from Malartic Goldfield Mine from 1930 to 1965, and acid generating tailings from Barrick’s Bousquet Mine from 1977 to 1994
• Engineered dry cover using sand-gravel as drainage and MNR mine site alkaline tailings as oxygen barrier layers
• The designed cover has reduced tailings oxidation rate by~ 95% and the oxygen barrier layer moisture saturation is maintained at ~ 85 %
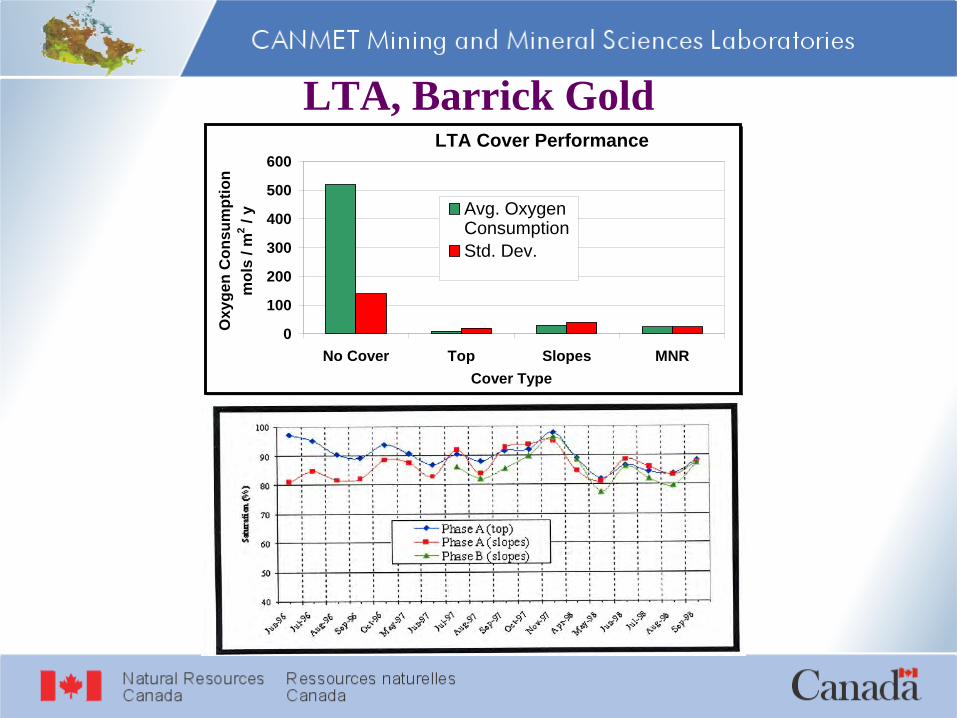
LTA, Barrick GoldLTA Cover Performance
0
100
200
300
400
500
600
No Cover Top Slopes MNRCover Type
Oxy
gen
Con
sum
ptio
n m
ols
/ m2 /
y Avg. Oxygen ConsumptionStd. Dev.

1997
Engineered Dry Covers – Geo-membranes Mine Poirier, Joutel, QC
Before Rehabilitation
After Rehabilitation
Membrane Cover

Permafrost Encapsulation• Suitable for northern permafrost regions of continuous
and/or wide spread discontinuous permafrost• Limiting oxygen ingress, exposure depth and infiltration
flow paths • Raising of permafrost table by placement of suitable
insulating surface covers • Use of thermal siphons to promote additional freezing• Discharge of paste / thickened tailings to promote
freezing• Alternate tailings disposal cells for freezing purposes• Negative implications of long-term climate change

Permafrost Encapsulation
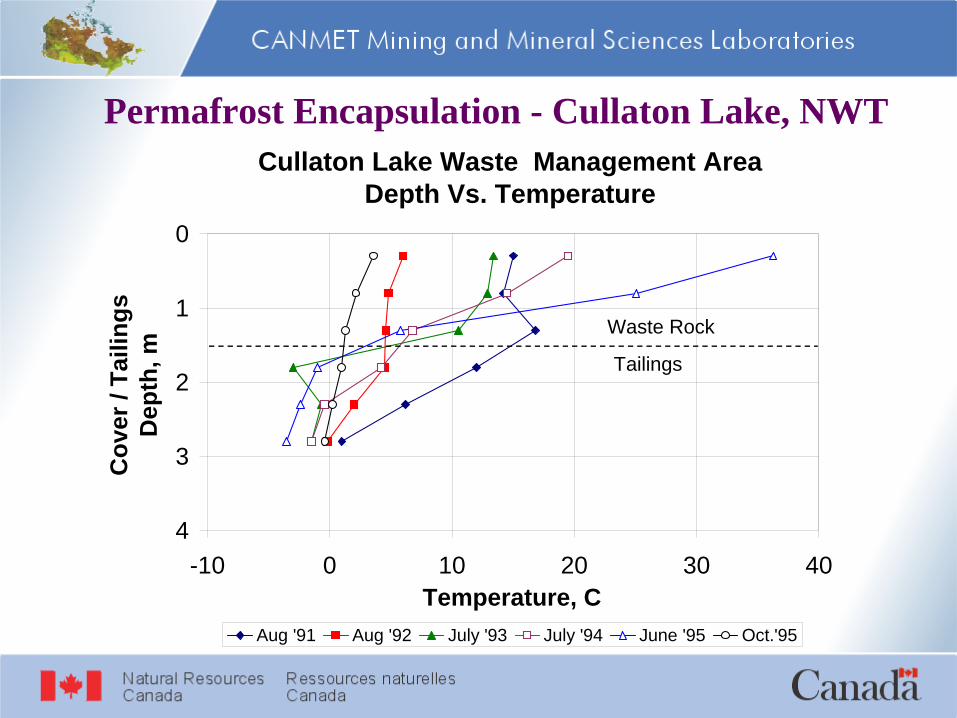
Permafrost Encapsulation - Cullaton Lake, NWTCullaton Lake Waste Management Area
Depth Vs. Temperature0
1
2
3
4-10 0 10 20 30 40
Temperature, C
Cov
er /
Taili
ngs
Dep
th, m
Aug '91 Aug '92 July '93 July '94 June '95 Oct.'95
Waste Rock
Tailings
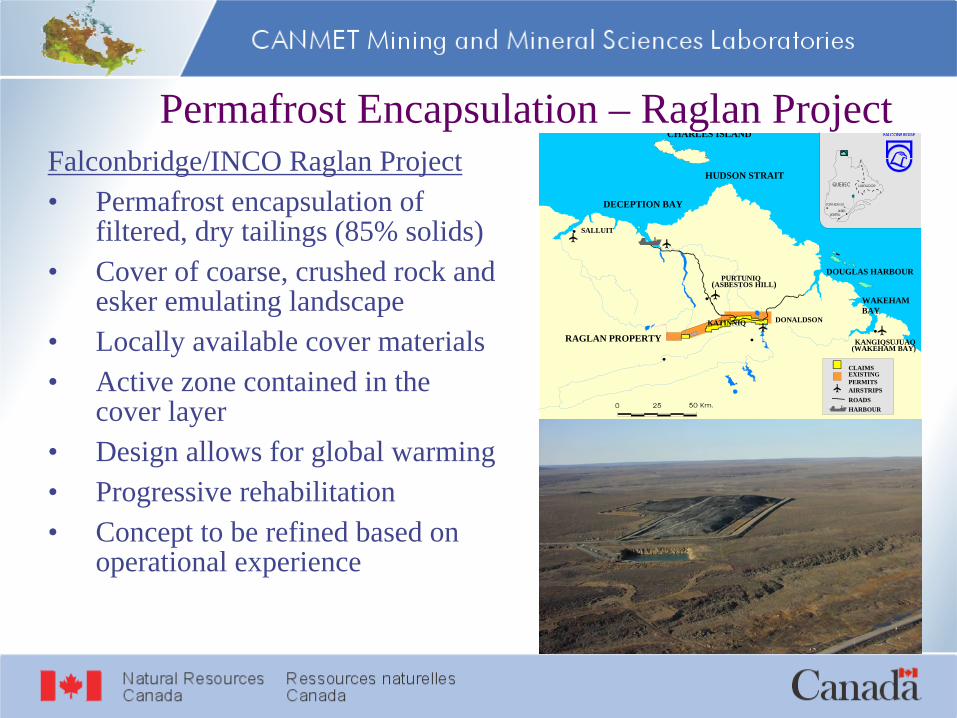
Permafrost Encapsulation – Raglan ProjectFalconbridge/INCO Raglan Project• Permafrost encapsulation of
filtered, dry tailings (85% solids)• Cover of coarse, crushed rock and
esker emulating landscape• Locally available cover materials• Active zone contained in the
cover layer• Design allows for global warming• Progressive rehabilitation• Concept to be refined based on
operational experience
SOCISOCIÉÉTTÉÉ MINIMINIÈÈRE RAGLAN DU QURE RAGLAN DU QUÉÉBEC LTBEC LTÉÉEE
RAGLAN LOCATION MAPRAGLAN LOCATION MAP
SALLUITSALLUIT
DECEPTION BAY
CHARLES ISLAND
HUDSON STRAIT
PURTUNIQ(ASBESTOS HILL)
RAGLAN PROPERTY
DONALDSON
KANGIQSUJUAQ(WAKEHAM BAY)
WAKEHAMBAY
DOUGLAS HARBOUR
CLAIMSEXISTINGPERMITSAIRSTRIPSROADSHARBOUR
KATINNIQ

Permafrost Encapsulation – Raglan Project
1.2 m Crushed Esker
Permanently Frozen Tailings
1.2 m Rockfill
FREEZING POINT
DEPRESSION- 0.5 deg. C
O.25 m
AverageYear Thaw
1:100Year Thaw
Top of Cover = Top of Thermal Model
Permafrost Encapsulation – Raglan Project
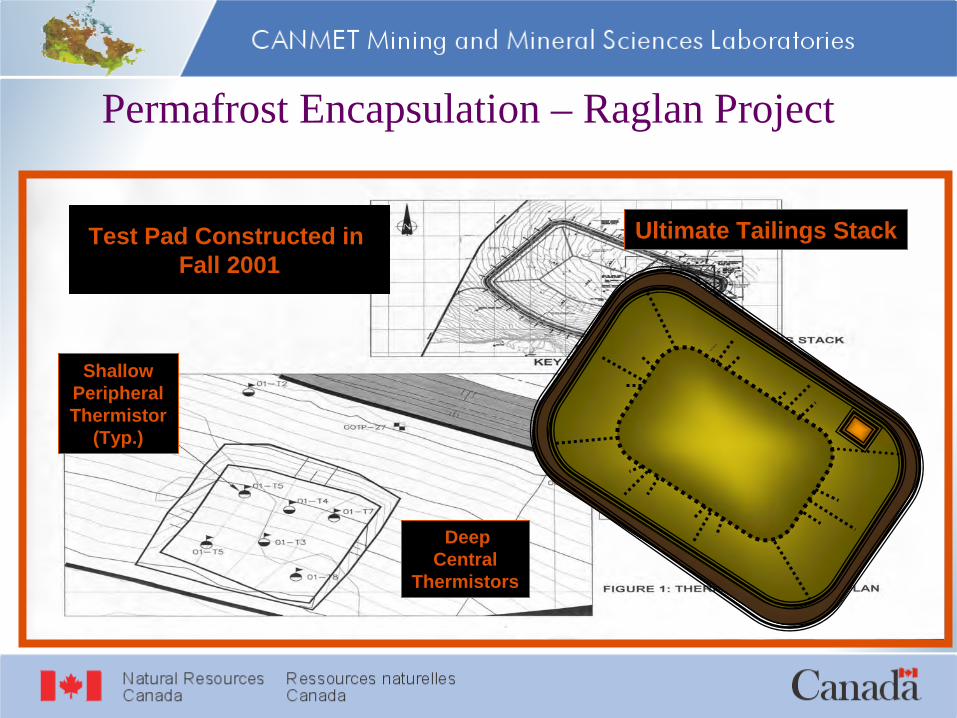
Test Pad Constructed in Fall 2001
Ultimate Tailings Stack
ShallowPeripheral Thermistor
(Typ.)
Deep Central
Thermistors
Permafrost Encapsulation – Raglan Project
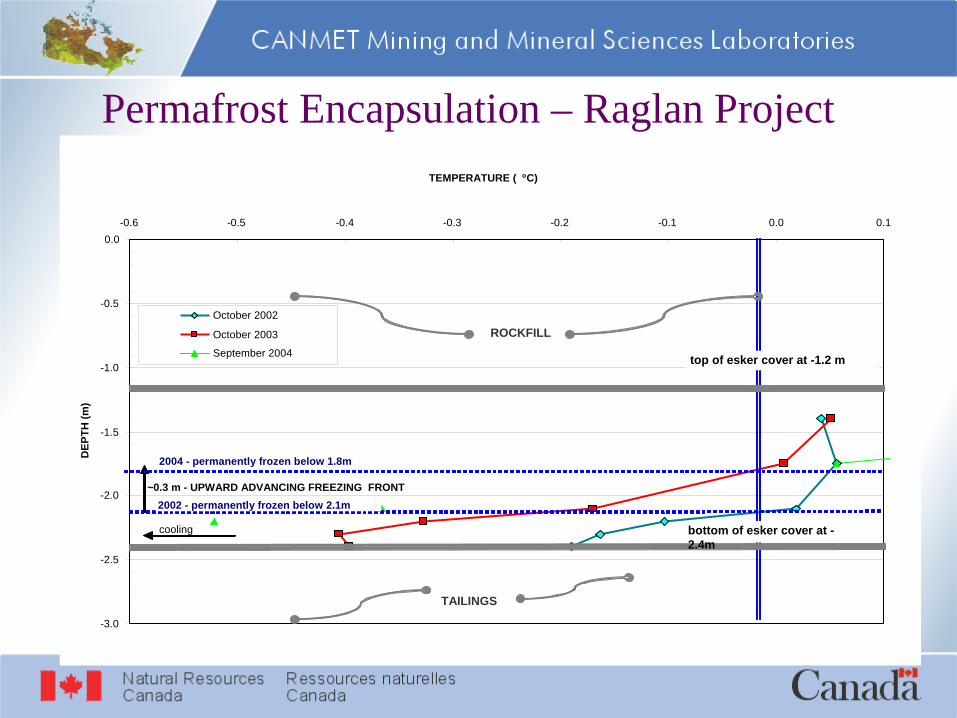
-3.0
-2.5
-2.0
-1.5
-1.0
-0.5
0.0-0.6 -0.5 -0.4 -0.3 -0.2 -0.1 0.0 0.1
TEMPERATURE ( oC)
DEP
TH (m
)
October 2002
October 2003
September 2004 top of esker cover at -1.2 m
2004 - permanently frozen below 1.8m
cooling bottom of esker cover at -2.4m
2002 - permanently frozen below 2.1m~0.3 m - UPWARD ADVANCING FREEZING FRONT
TAILINGS
ROCKFILL
Permafrost Encapsulation – Raglan Project• Active zone is contained within the cover• Freezing of deeper tailings zone has advanced• Upward advance of freezing is occurring• Based on the modelling, reaching steady-state will
take 50 + years. • At the current time there appears to be no reason
indicating that an adjustment to the cover design is necessary.
• Refinement of the cover layers can be undertaken closer to closure

Dry Covers - Summary• Small foot print and low and to medium overall risk
of catastrophic failure (depending on dam heights and water table elevation)
• Cover selection, design and placement dependent on site specific conditions
• Inclusion of local landforms conditions in overall cover design
• Local availability of cover materials is prerequisite• Most engineered dry cover sites are still at
experimental stages and no integrated, long-term performance record is available

Dry Covers - Summary• Implications of freeze-thaw heaving, ice lens formation,
differential thermal or mechanical deformations and winter desiccation on cover integrity in the north are yet to be fully evaluated
• Longevity of membrane covers at persistently low temperatures, specifically thermal shrinkage/stretching and cracking, is yet to be established
• Progressive reclamation may not be always possible and the waste may be partially exposed during the operating phase
• Permafrost encapsulation is very promising for the north, however, its applicability is most impacted by the global warming trend
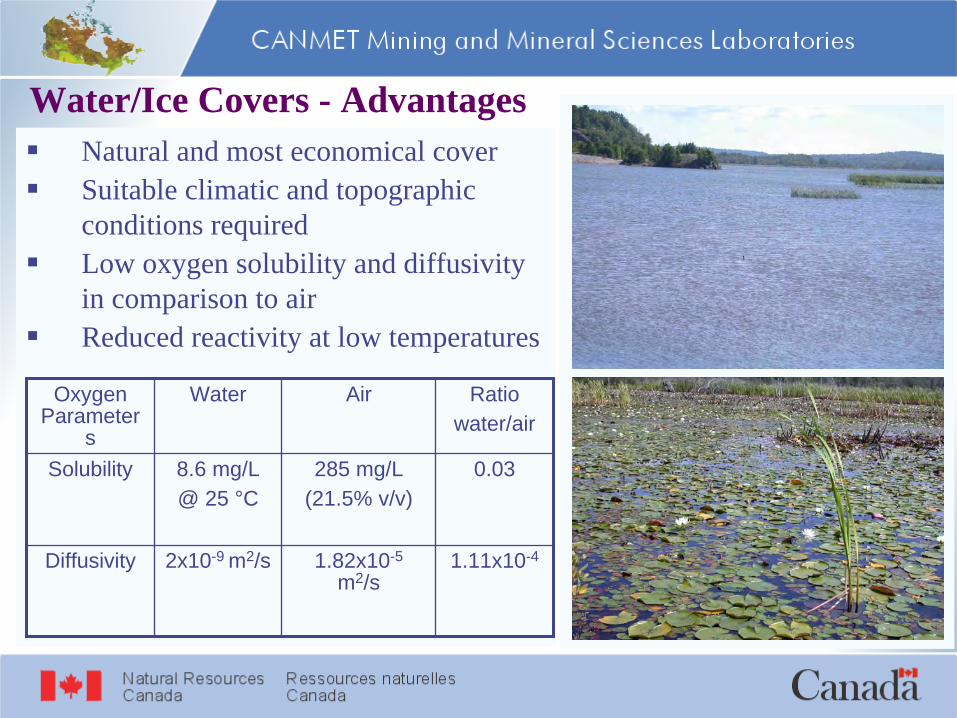
Water/Ice Covers - AdvantagesNatural and most economical coverSuitable climatic and topographic conditions required Low oxygen solubility and diffusivity in comparison to airReduced reactivity at low temperatures
1.11x10-41.82x10-5
m2/s2x10-9 m2/sDiffusivity
0.03285 mg/L(21.5% v/v)
8.6 mg/L@ 25 °C
Solubility
Ratiowater/air
AirWaterOxygen Parameter
s
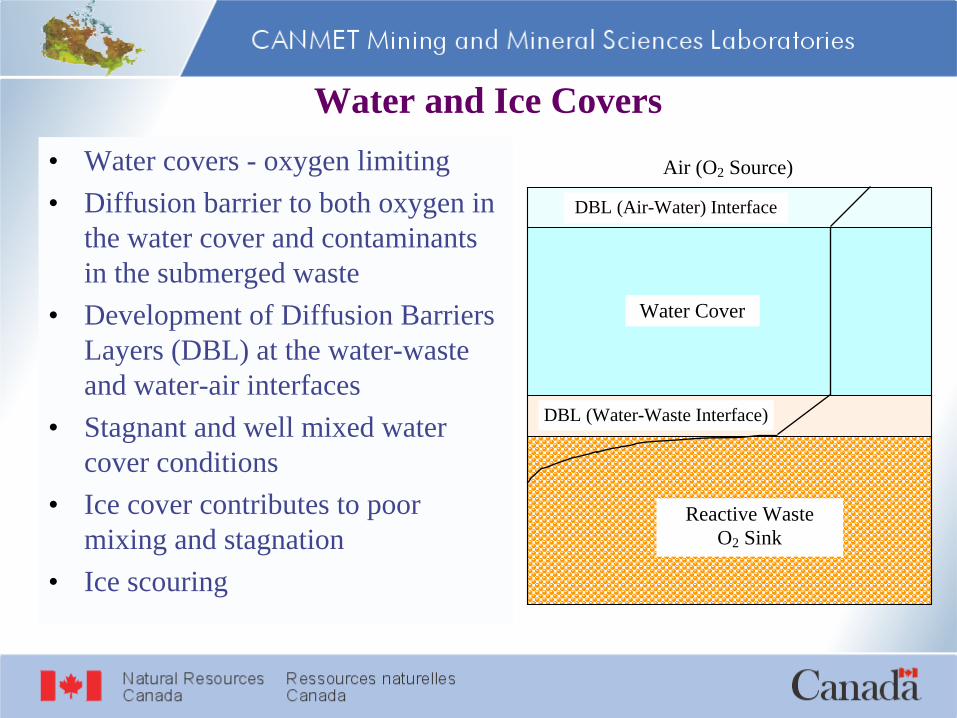
• Water covers - oxygen limiting• Diffusion barrier to both oxygen in
the water cover and contaminants in the submerged waste
• Development of Diffusion Barriers Layers (DBL) at the water-waste and water-air interfaces
• Stagnant and well mixed water cover conditions
• Ice cover contributes to poor mixing and stagnation
• Ice scouring
Water and Ice Covers Air (O2 Source)
DBL (Air-Water) Interface
Water Cover
DBL (Water-Waste Interface)
Reactive Waste O2 Sink
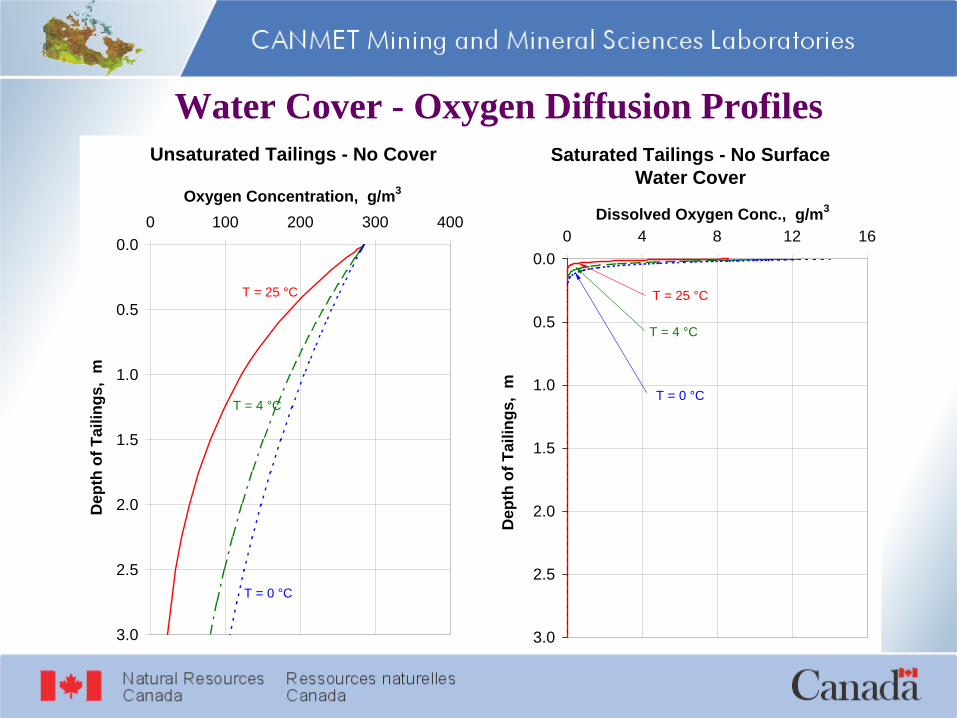
Water Cover - Oxygen Diffusion ProfilesUnsaturated Tailings - No Cover
0.0
0.5
1.0
1.5
2.0
2.5
3.0
0 100 200 300 400Oxygen Concentration, g/m3
Dep
th o
f Tai
lings
, m
T = 0 °C
T = 4 °C
T = 25 °C
Saturated Tailings - No Surface Water Cover
0.0
0.5
1.0
1.5
2.0
2.5
3.0
0 4 8 12 16Dissolved Oxygen Conc., g/m3
Dep
th o
f Tai
lings
, m
T = 0 °C
T = 4 °C
T = 25 °C
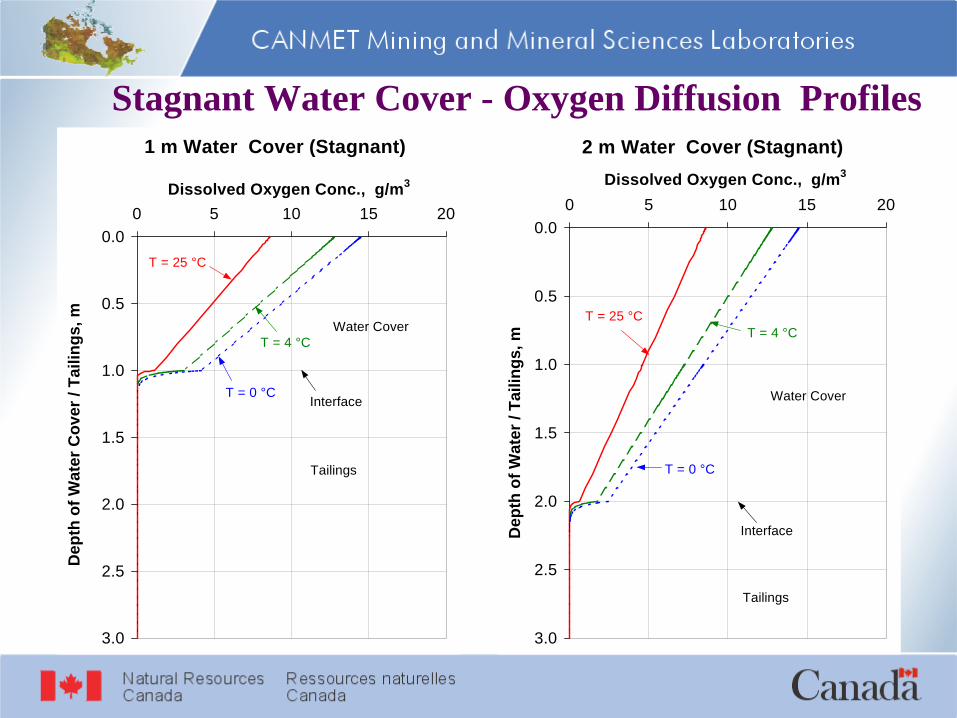
Stagnant Water Cover - Oxygen Diffusion Profiles 1 m Water Cover (Stagnant)
0.0
0.5
1.0
1.5
2.0
2.5
3.0
0 5 10 15 20Dissolved Oxygen Conc., g/m3
Dep
th o
f Wat
er C
over
/ Ta
iling
s, m
T = 0 °C
T = 4 °C
T = 25 °C
Water Cover
Tailings
Interface
2 m Water Cover (Stagnant)
0.0
0.5
1.0
1.5
2.0
2.5
3.0
0 5 10 15 20Dissolved Oxygen Conc., g/m3
Dep
th o
f Wat
er /
Taili
ngs,
m
T = 0 °C
T = 4 °CT = 25 °C
Interface
Water Cover
Tailings

Well Mixed Water Cover - Oxygen Diffusion Profiles 1 m well mixed surface water cover
Oxygen limiting coverOxygen transfer/diffusion controlled by a Diffusion Boundary Layer (DBL) at the waste-water interfaceNo impact of water cover depth unless stagnant water columnBulk oxidation of unsaturated waste reduced to a very shallow zone surface oxidation under water cover conditions
1 m Water Cover (Well Mixed)
0.0
0.5
1.0
1.5
2.0
2.5
3.0
0 5 10 15 20Dissolved Oxygen Conc., g /m3
Dep
th o
f Wat
er C
over
/ Ta
iling
s, m
T = 25 °C
T = 4 °C
T = 0 °C
Interface
Water Cover
Tailings

Water Cover - Temperature EffectsWater Filled Pore Space
Oxygen Flux Vs. Temperature
0.0
0.2
0.4
0.6
0.8
1.0
1.2
0 5 10 15 20 25 30Temperature, °C
Nor
mal
ized
DO
Fl
ux /
Rat
e C
onst
.
0
4
8
12
16
20
Dis
solv
ed
Oxy
gen
Con
c.
DO Flux O2 Rate Const. DO Conc.
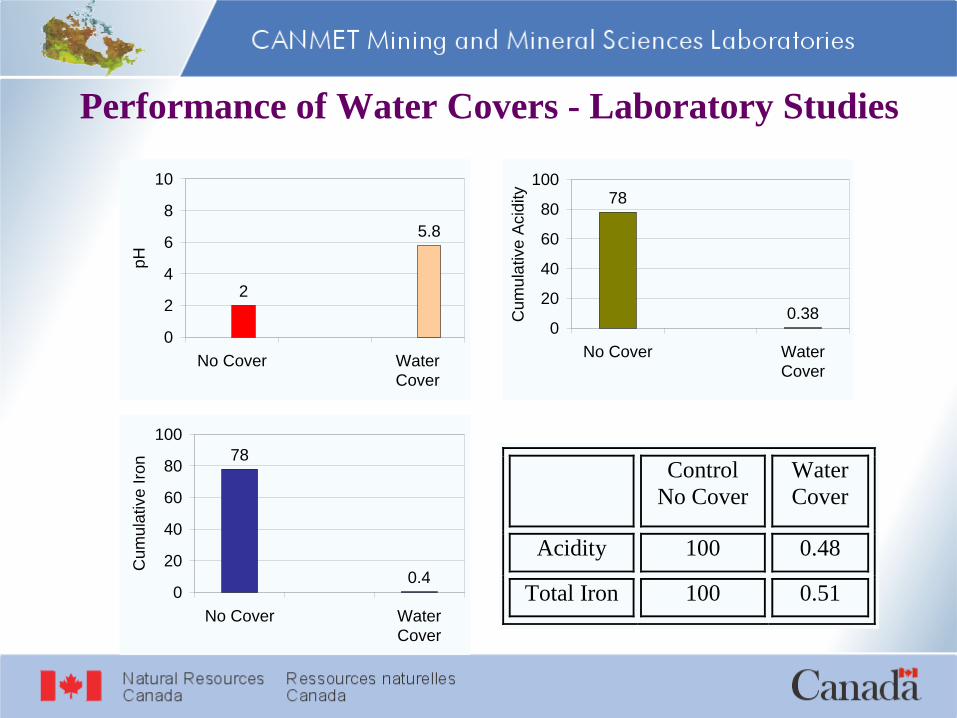
Performance of Water Covers - Laboratory Studies
2
5.8
0
2
4
6
8
10
No Cover WaterCover
pH
78
0.380
20
40
60
80
100
No Cover WaterCover
Cum
ulat
ive
Aci
dity
78
0.40
20
40
60
80
100
No Cover WaterCover
Cum
ulat
ive
Iron Control
No Cover Water Cover
Acidity 100 0.48
Total Iron 100 0.51

Performance of Water Covers - Field Sites (Man-made)Four study sites: Denison, Panel, Quirke and Stanleigh Tailings Management Areas (TMAs) located at Elliot Lake, Ontario, CanadaLow ore grade (~0.1% U) and uranium market conditions led to mine closer in early to mid 1990sHighly acid generating pyritic uranium tailings containing 5-10% pyrite; NNP = -100 to -150 kg CaCO3/tonneAcid-leach milling process, very small to nil available alkalinityExtensive field sites having in-situ shallow water covers of minimum 1 m depth; site rehabilitation during 1992 to 1999All sites on care and maintenance
Denison Tailings63 M tonnes
271 haflooded

Water Cover Sites - Denison TMA• Mine operation from 1957 to 1992• 63 M tonnes of acid generating pyritic
U tailings; 5-7% pyrite• Two tailings management areas (TMA-
1 and TMA-2); combined area 290 ha; separate single elevation water covers
• Decommissioning activities 1993 to 1996; impervious containment dams; reinforcement 1993; designed precipitation run-off facilities
• Tailings dredged; single elevation water cover provided and maintained by natural run-off from containment area catchment basin
• In situ lime addition and periodic effluent treatment

• Mine operation from 1956 to 1961, and from 1968 to 1990
• 42 M tonnes acid generating U tailings and 4 M tonnes waste rock
• TMA 192 ha, ~ 15 m elevation difference along the site
• Rehabilitation and decommissioning 1992 to 1995; five hydraulically interconnected internal dykes and cells provide a terraced configuration;
• Single elevation water cover in each cell• Water cover maintained by gravity flow
from an upstream Gravel Pit Lake• Lime incorporation in the tailings
substrate and periodical addition to maintain neutral conditions in WC
Water Cover Sites - Quirke TMA

• Mine operations from 1957 to 1968 and from 1957 to 1960
• 14.7 M tonnes of acid generating uranium tailings in two TMAs having a combined area of 131 ha; ~ 5-7% pyrite
• Successful revegetation of tailings for past 25 yrs
• Dams and facilities upgraded in 1998-99
• Sites on care and maintenance basis; effluent collected and treated continuously
Vegetated Sites – Nordic/Lacnor TMAs
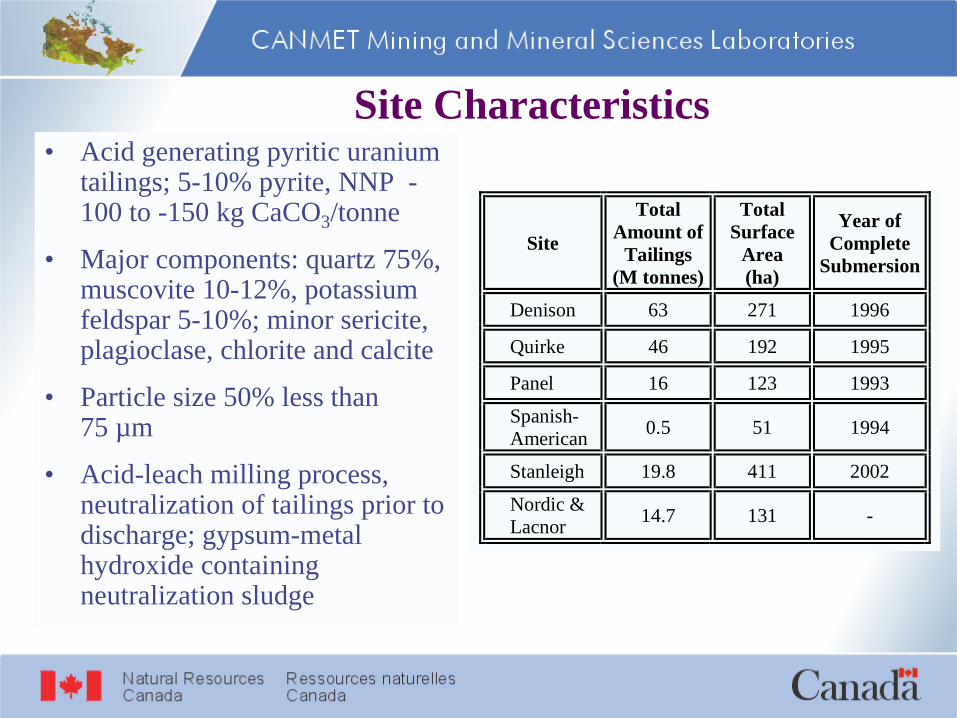
Site Characteristics • Acid generating pyritic uranium
tailings; 5-10% pyrite, NNP -100 to -150 kg CaCO3/tonne
• Major components: quartz 75%, muscovite 10-12%, potassium feldspar 5-10%; minor sericite, plagioclase, chlorite and calcite
• Particle size 50% less than 75 µm
• Acid-leach milling process, neutralization of tailings prior to discharge; gypsum-metal hydroxide containing neutralization sludge
Site
Total Amount of
Tailings (M tonnes)
Total Surface
Area (ha)
Year of Complete
Submersion
Denison 63 271 1996
Quirke 46 192 1995
Panel 16 123 1993
Spanish-American 0.5 51 1994
Stanleigh 19.8 411 2002
Nordic & Lacnor 14.7 131 -
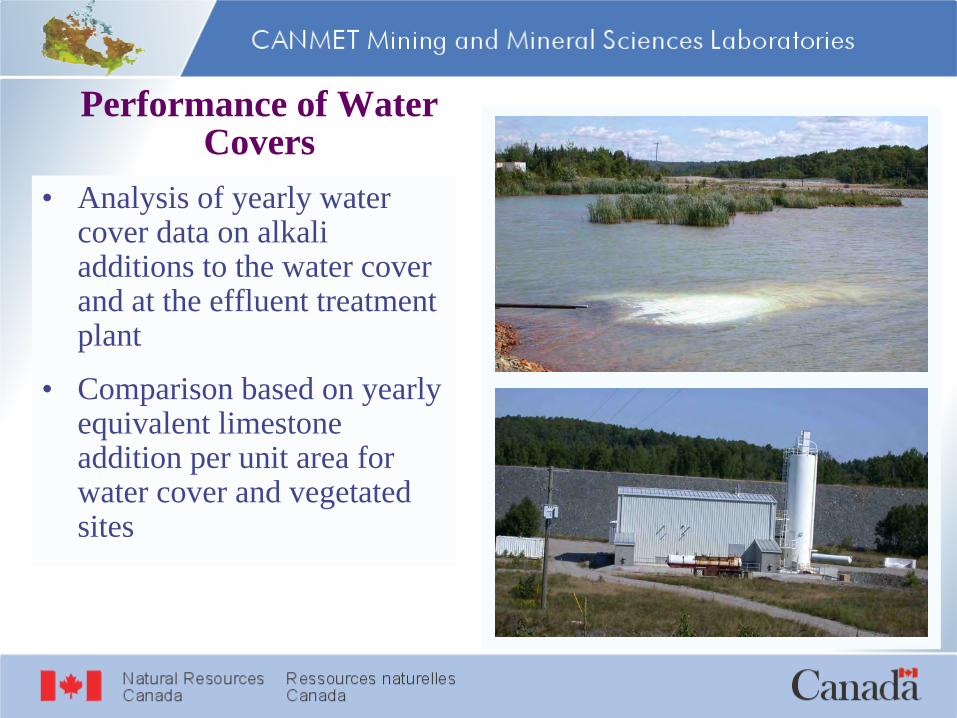
Performance of Water Covers
• Analysis of yearly water cover data on alkali additions to the water cover and at the effluent treatment plant
• Comparison based on yearly equivalent limestone addition per unit area for water cover and vegetated sites

Performance of Water Covers - Denison TMA
Year Total CaCO3 Equivalent
(tonnes/year)
Total CaCO3 Equivalent
(tonnes/ha/year) 1990 42,779 157.858 1991 52,119 192.320 1992 6,636 24.487 1993 3,201 11.813 1994 10,288 37.963 1995 9,024 33.300 1996 74 0.275 1997 59 0.218 1998 18 0.065 1999 1 0.002 2000 1 0.002 2001 2 0.006 2002 0.16 0.001
Denison TMA-1& 2Yearly Total Limestone Consumption (1990-2002)
Per Unit Area
0
50
100
150
200
250
1990 1992 1994 1996 1998 2000 2002Calendar Year
Equi
vale
nt L
imes
tone
, To
nnes
CaC
O3/
ha /
Year
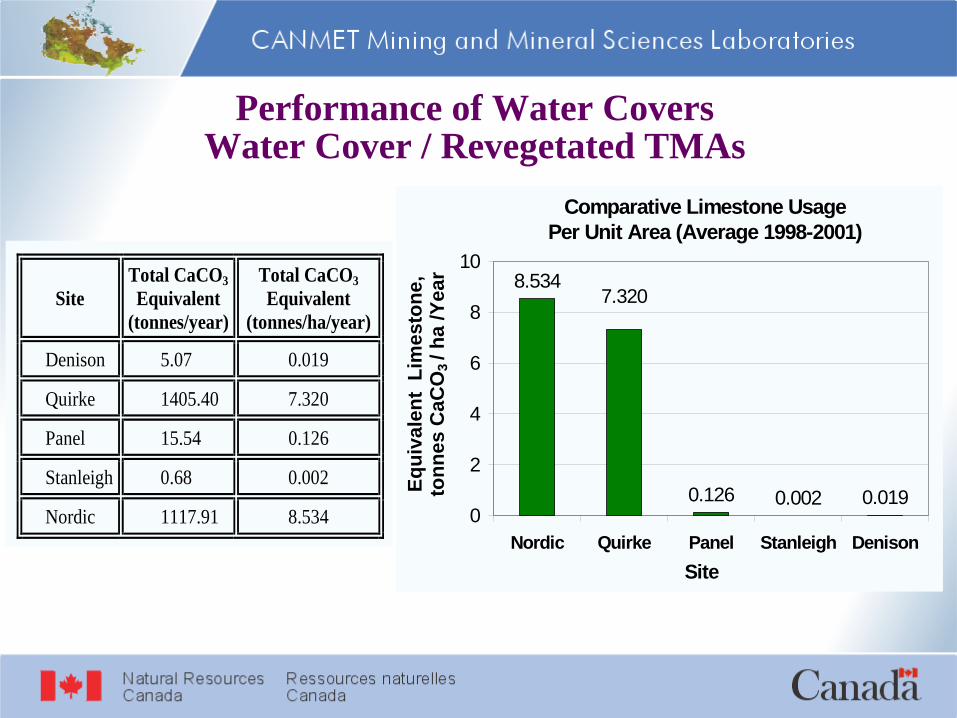
Performance of Water Covers Water Cover / Revegetated TMAs
Comparative Limestone UsagePer Unit Area (Average 1998-2001)
8.534
0.002 0.0190.126
7.320
0
2
4
6
8
10
Nordic Quirke Panel Stanleigh DenisonSite
Equi
vale
nt L
imes
tone
, to
nnes
CaC
O3
/ ha
/Yea
r
Site Total CaCO3 Equivalent
(tonnes/year)
Total CaCO3 Equivalent
(tonnes/ha/year)
Denison 5.07 0.019
Quirke 1405.40 7.320
Panel 15.54 0.126
Stanleigh 0.68 0.002
Nordic 1117.91 8.534
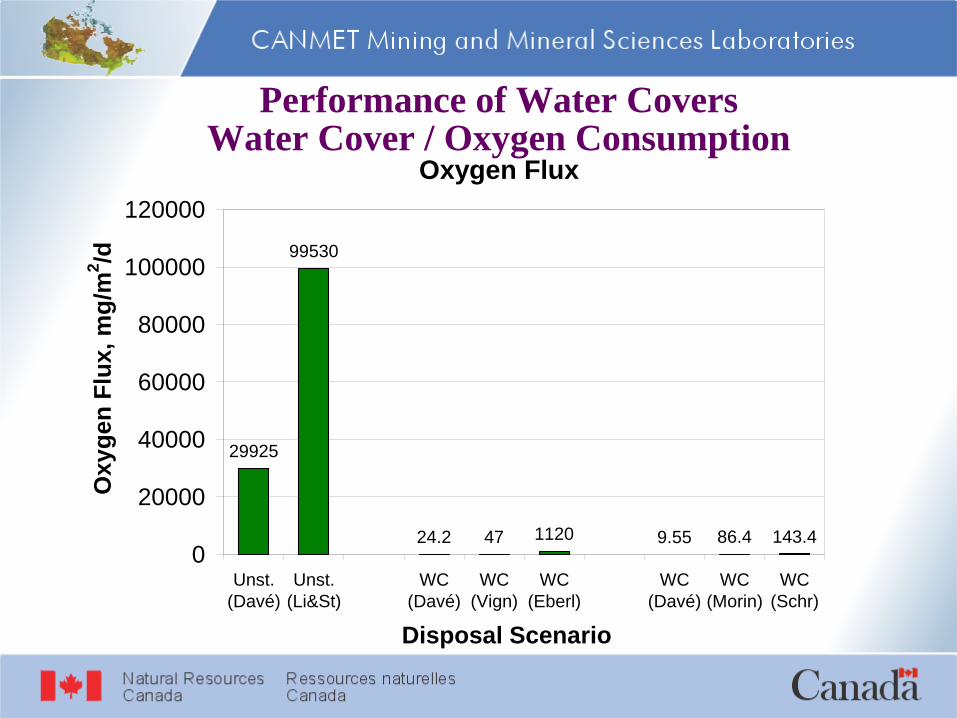
Performance of Water Covers Water Cover / Oxygen Consumption
Oxygen Flux
29925
99530
24.2 47 1120 9.55 86.4 143.40
20000
40000
60000
80000
100000
120000
Unst.(Davé)
Unst.(Li&St)
WC(Davé)
WC(Vign)
WC(Eberl)
WC(Davé)
WC(Morin)
WC(Schr)
Disposal Scenario
Oxy
gen
Flux
, mg/
m2 /d

Stekenjokk Mine, Sweden• Site located 800 m above sea level,
~ 65° latitude, in the Lapland mountains in northwestern Sweden
• 4.4 M tonnes of pyritic tailings, ~ 20 % S as pyrite, 0.64 % Zn and 0.19 % Cu
• Site decommissioned with water cover since 1991
• Frequency of very high wind conditions
• Incorporation of waste rock breakwaters; sand cover on tailings in the shallow water cover area
• Acceptable surface water quality; no treatment required
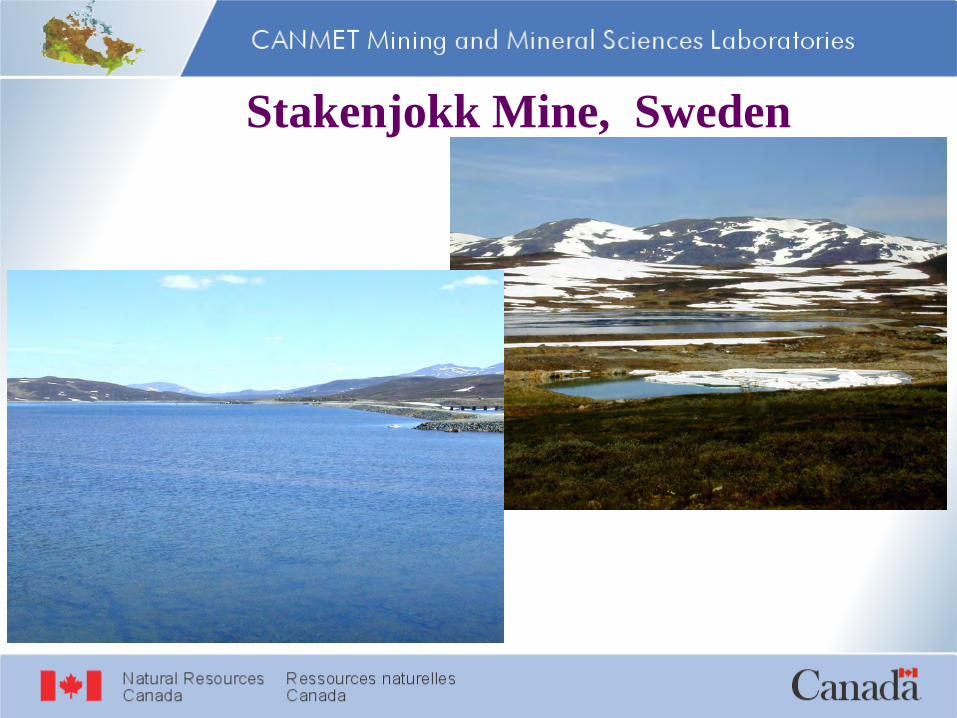
Stakenjokk Mine, Sweden
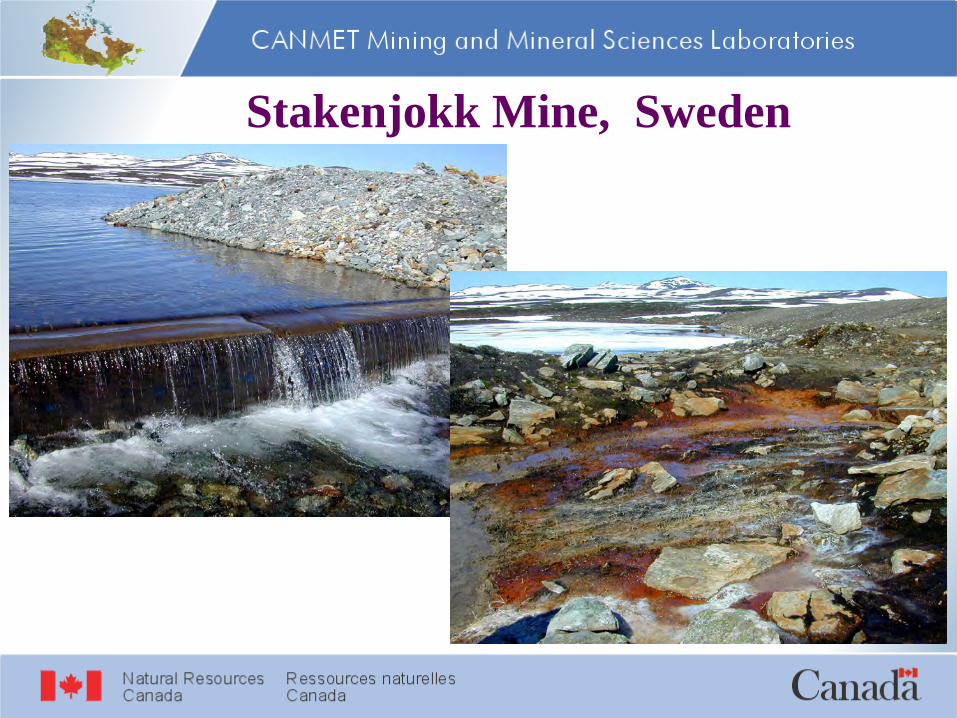
Stakenjokk Mine, Sweden

Water Covers Performance Summary Field sites performing well as per design specification; water cover maintained at near neutral pH conditionsAcid generation rate at Denison TMA has reduced to less than 0.03% and 0.15% of pre-water cover operating and during site rehabilitationIn comparison to the revegetated Nordic/Lacnor site, acid generation rates at Denison, Panel and Stanleigh TMAs have decreased to less than 1.6%Flushing of the previously generated acidity and oxidation reaction products at the Quirke TMA are resulting in its high alkali demand comparable to that at Nordic TMA
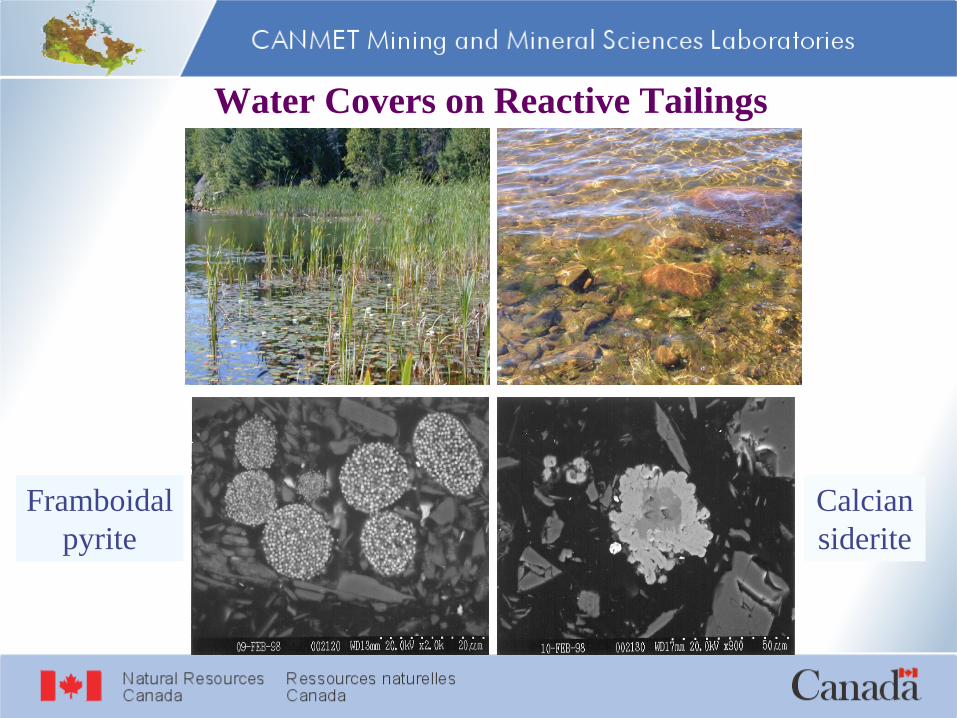
Water Covers on Reactive Tailings
Framboidalpyrite
Calciansiderite

Water Covers – Permafrost Regions• Application limited to suitable climatic conditions• Thawing of permafrost below tailings impoundment;
increased flow paths• Stability of permafrost dam cores• Ice dams and jamming• Wave action and ice sloshing; wave breakers may be
required• Long-term integrity of containment structures and the
associated high risk factor• Limited biological activity and organic matter
production• In pit or below grade disposal
Summary Water Covers – Man-made Lakes• Suitable for both existing and new waste management sites• Design for closure for new sites; waste oxidation could be
minimized• Integration of local topography and biota• Water quality could be maintained in-situ to meet discharge
standards; downstream treatment could be minimized• Designed for maximum probable precipitation events and extreme
draught conditions• Incorporation of minimum water cover depth and/or wave
breakers to control wind-wave induced erosion• Medium to high risk associated with the long-term maintenance
of water retention dams and flow structures; large footprint in case of catastrophic failure
• Impact of global warming on water cover depth and retention
In Lake or Submarine Disposal
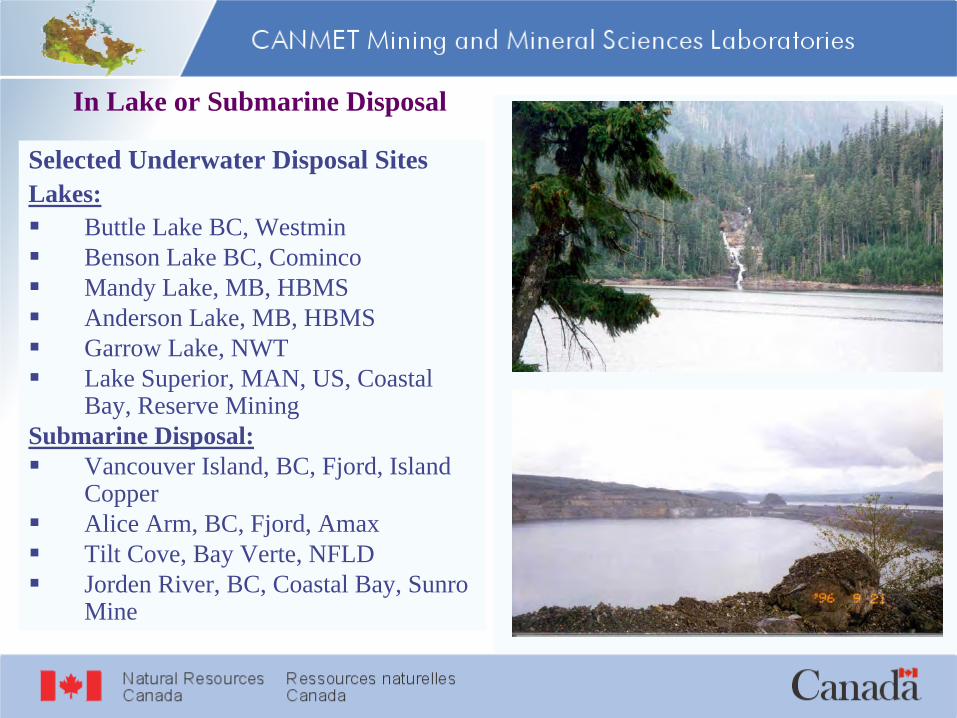
Selected Underwater Disposal SitesLakes:
Buttle Lake BC, WestminBenson Lake BC, ComincoMandy Lake, MB, HBMSAnderson Lake, MB, HBMSGarrow Lake, NWTLake Superior, MAN, US, Coastal Bay, Reserve Mining
Submarine Disposal:Vancouver Island, BC, Fjord, Island CopperAlice Arm, BC, Fjord, AmaxTilt Cove, Bay Verte, NFLDJorden River, BC, Coastal Bay, SunroMine

Quirke Lake Disposal CaseExpansion of Uranium mines: mid to late 1970sPoor lake water quality: low pH, and high acidity, TDS and Ra-226 conc., low biological productivityExtensive tailings impoundments along the lake perimeterLong-lived radionuclides, T1/2 Ra (~1600 y), Th-230 (~80,000 y)Impervious dam requirementsMaintenance of waste management facilities for 10,000 to 100,00 yearsSuitable site to contain all existing and future tailings
Kilometres
QuirkePanel
Denison
Spanish
American
TMA-2
TMA-1
Quirke
Lake
Stanrock
Canmet
Stanleigh
Lacnor
Nordic
Main
NordicUranium Tailings
Miles
Elliot
Lake
SudburySault
Ste. Marie
North Channel
Pronto
Mi.
Km
West Arm
Elliot
Lake
In Lake Disposal
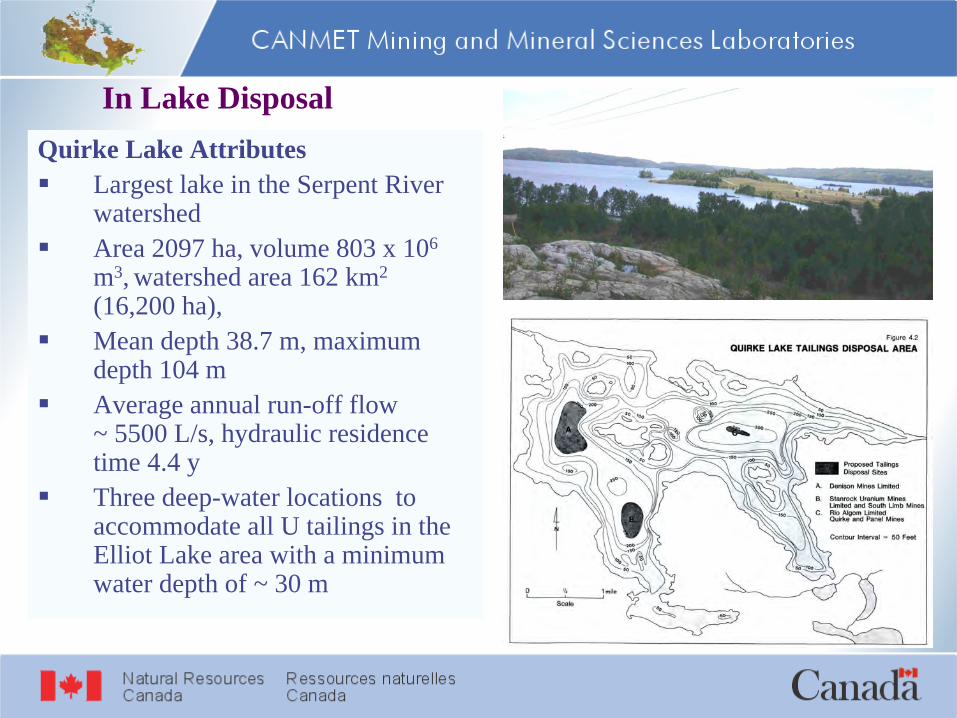
Quirke Lake AttributesLargest lake in the Serpent River watershedArea 2097 ha, volume 803 x 106
m3, watershed area 162 km2
(16,200 ha), Mean depth 38.7 m, maximum depth 104 mAverage annual run-off flow ~ 5500 L/s, hydraulic residence time 4.4 yThree deep-water locations to accommodate all U tailings in the Elliot Lake area with a minimum water depth of ~ 30 m
In Lake Disposal
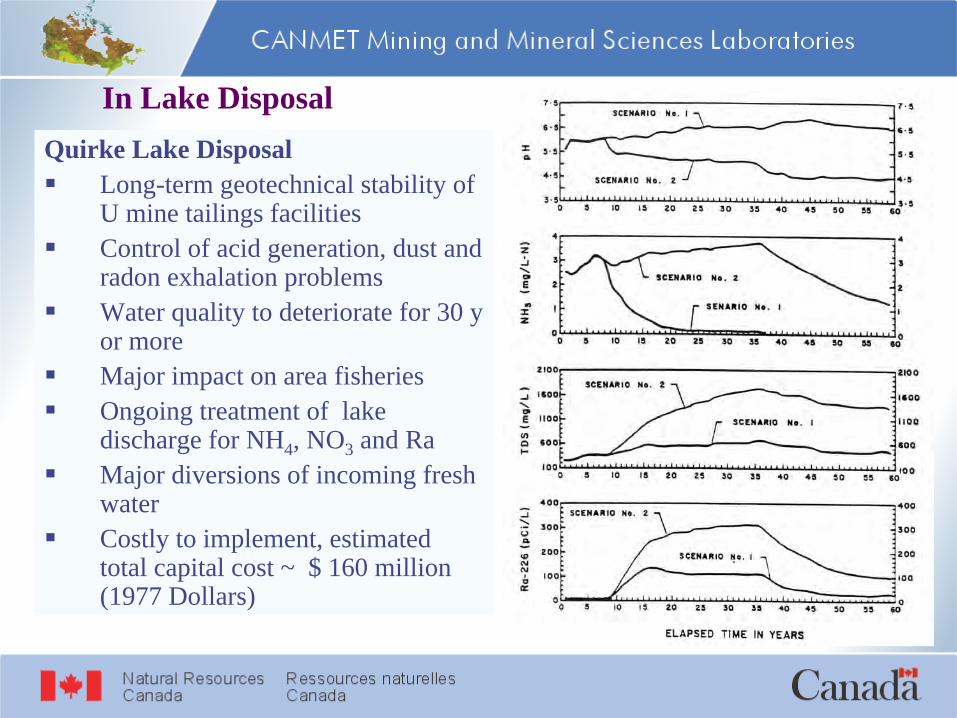
Quirke Lake DisposalLong-term geotechnical stability of U mine tailings facilitiesControl of acid generation, dust and radon exhalation problemsWater quality to deteriorate for 30 y or moreMajor impact on area fisheriesOngoing treatment of lake discharge for NH4, NO3 and RaMajor diversions of incoming fresh waterCostly to implement, estimated total capital cost ~ $ 160 million (1977 Dollars)
In Lake Disposal

On Land or Underwater Disposal ?No regulatory support for underwater disposal in natural lake basins (over my dead body)Underwater water disposal (deep water cover) facilities offer minimal opportunities for environmental controlIn most cases, both the liquid and solid phases of the tailings slurry remain uncontrolledIn a dry land based disposal system maximum environmental control under a given set of conditions is possible
John Hawley
Paper presented at the CIM Annual General Meeting
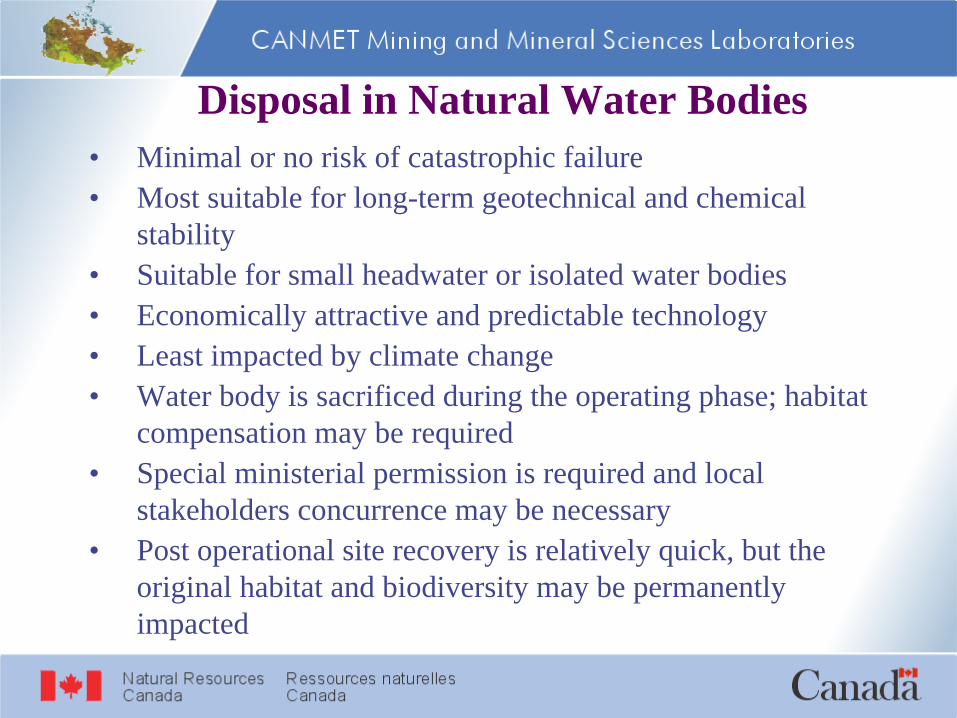
Disposal in Natural Water Bodies• Minimal or no risk of catastrophic failure• Most suitable for long-term geotechnical and chemical
stability• Suitable for small headwater or isolated water bodies• Economically attractive and predictable technology• Least impacted by climate change• Water body is sacrificed during the operating phase; habitat
compensation may be required• Special ministerial permission is required and local
stakeholders concurrence may be necessary• Post operational site recovery is relatively quick, but the
original habitat and biodiversity may be permanently impacted

Elevated Water Table / Saturated Cover Concept• Placement of sand/till or other non-
reactive tailings surface cover, ~ 0.3 – 0.5 m in thickness
• Raising of water table to or above the tailings/waste surface
• Same advantage as a free surface water cover
• Increased impoundment dams stability, no free water surface required
• Ice erosion and scouring minimized• Surface stability through native
vegetation; may be impacted by differential snow depth and freezing
• Proposed by Lupin mine; full-scale investigations are required
Reactive Waste
Sand/Till Cover
Water Table
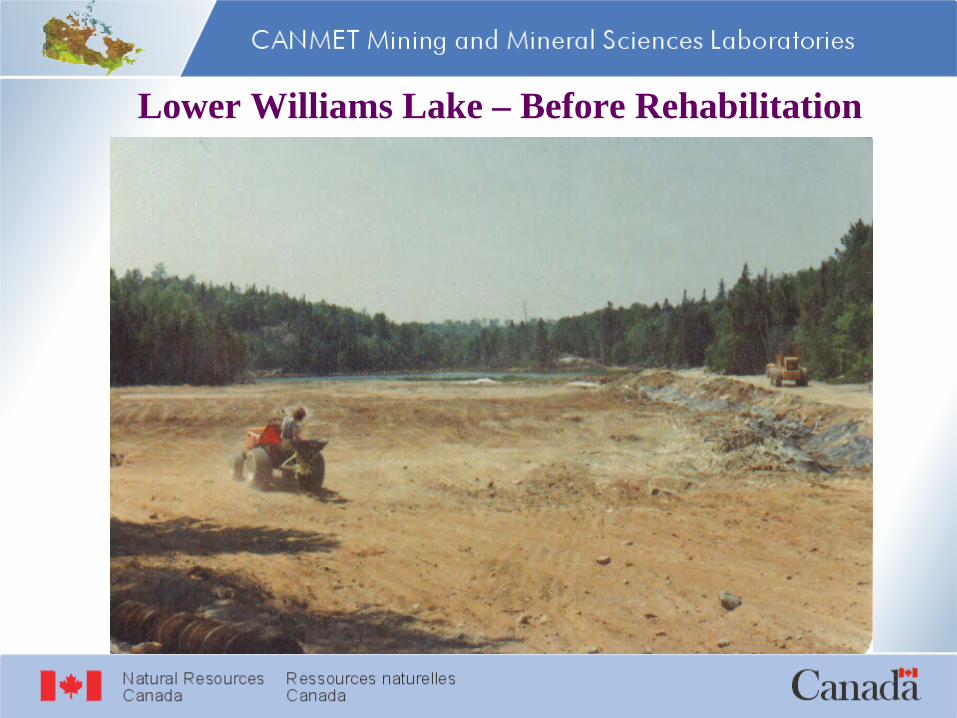
Lower Williams Lake – Before Rehabilitation

Lower Williams Lake – After Rehabilitation
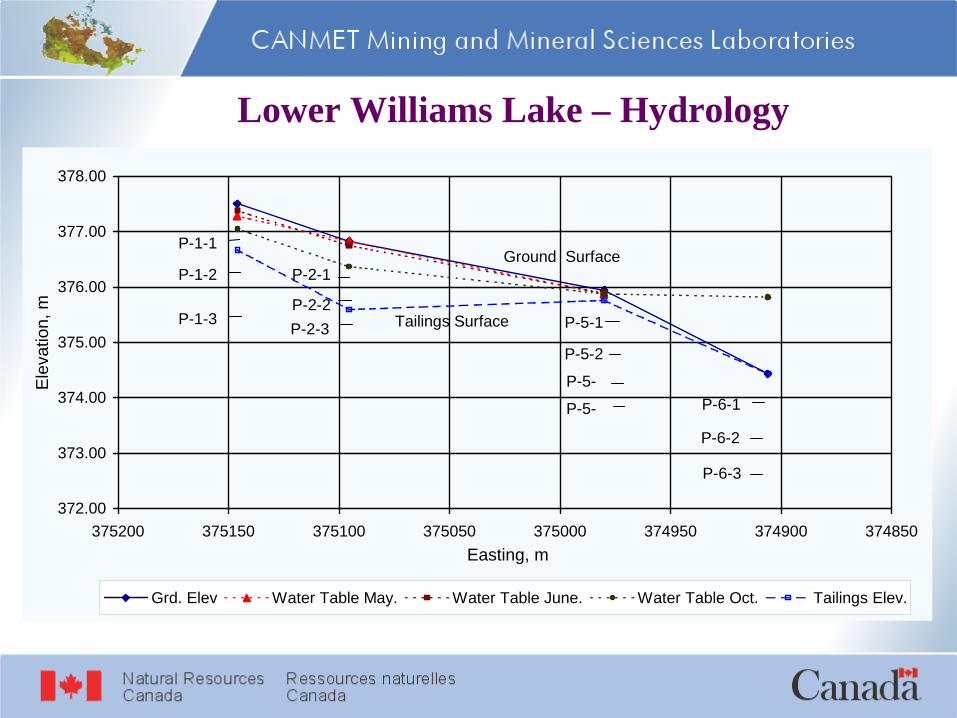
Lower Williams Lake – Hydrology
372.00
373.00
374.00
375.00
376.00
377.00
378.00
374850374900374950375000375050375100375150375200Easting, m
Ele
vatio
n, m
Grd. Elev Water Table May. Water Table June. Water Table Oct. Tailings Elev.
Tailings Surface
Ground SurfaceP-1-1
P-1-2
P-1-3
P-2-1
P-2-2P-2-3 P-5-1
P-5-2
P-5-
P-5-
P-6-2
P-6-3
P-6-1
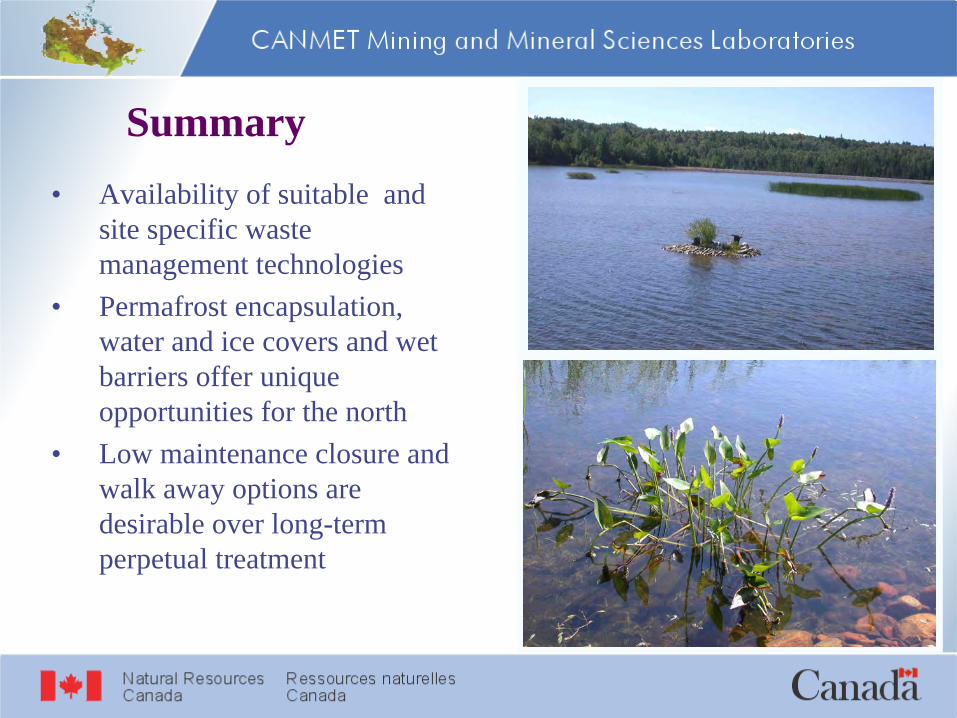
Summary• Availability of suitable and
site specific waste management technologies
• Permafrost encapsulation, water and ice covers and wet barriers offer unique opportunities for the north
• Low maintenance closure and walk away options are desirable over long-term perpetual treatment
Thank You!
http://envirolab.nrcan.gc.ca