older american drivers and traffic safety culture: a...
TRANSCRIPT
Older American Driversand Traffic Safety Culture:A LongROAD StudyNovember 2014
607 14th Street, NW, Suite 201 | Washington, DC 20005 | AAAFoundation.org | 202-638-5944
Seniors face serious driving safety and mobility issues.
1
Title
Older American Drivers and Traffic Safety Culture: A LongROAD Study. (November 2014)
Authors
Alexander J. Mizenko, Brian C. Tefft, Lindsay Arnold, and Jurek Grabowski.
Acknowledgments
We would like to thank J. Peter Kissinger and the three peer reviewers for thoughtful feedback on the
manuscript.
About the Sponsor
AAA Foundation for Traffic Safety
607 14th Street, NW, Suite 201
Washington, DC 20005
202-638-5944
www.aaafoundation.org
This research was funded and supported by the AAA Foundation for Traffic Safety.
Founded in 1947, the AAA Foundation in Washington, D.C. is a not-for-profit, publicly supported
charitable research and education organization dedicated to saving lives by preventing traffic crashes and
reducing injuries when crashes occur. Funding for this report was provided by voluntary contributions
from AAA/CAA and their affiliated motor clubs, from individual members, from AAA-affiliated insurance
companies, as well as from other organizations or sources.
This publication is distributed by the AAA Foundation for Traffic Safety at no charge, as a public service.
It may not be resold or used for commercial purposes without the explicit permission of the Foundation. It
may, however, be copied in whole or in part and distributed for free via any medium, provided the AAA
Foundation is given appropriate credit as the source of the material. The AAA Foundation for Traffic
Safety assumes no liability for the use or misuse of any information, opinions, findings, conclusions, or
recommendations contained in this report.
If trade or manufacturer’s names are mentioned, it is only because they are considered essential to the
object of this report and their mention should not be construed as an endorsement. The AAA Foundation
for Traffic Safety does not endorse products or manufacturers.
©2014 AAA Foundation for Traffic Safety
2
Introduction
Background
The United States is at the edge of a major demographic shift in which the characteristics of overall
population will move from middle aged workers to older retirees. This shift can be attributed to people
aged 65 years and over making up the fastest growing segment of the population. This temporal trend is
the consequence of two concurrent factors: first, many couples are choosing to have fewer children (3.72
births per women during the peak of the baby boom in 1957 versus 2.01 in 2013 (Colby and Ortman, 2014;
CIA Factbook, 2013)) and second, people are living longer lives- the median age around the peak of the
Baby Boom was 29.5 years compared to 37.2 years in 2010 (Howden and Meyer, 2011). Notwithstanding
some attrition due to mortality, the general prediction is that longer lives and fewer births will continue
to contribute to an ever increasing proportion of older Americans to the point where the percent of the
population 65 and older, which increased from 4% in 1900 to 12% in 2000 is projected to reach 19% by
2030 and 20% by 2050 (Hobbs and Stoops, 2002; United States Census Bureau, 2008). No age group will
experience a growth as large as the group over age 65 through the year 2060 (United States Census
Bureau, 2012).
Because nearly 75% of today’s adults over 65 say they are in good to excellent health (BRFSS, 2012), 42%
report they have attended some college (United States Census Bureau, 2011) and the median income is
$33,848 (DeNavas-Walt, et.al, 2013), older Americans are living active lives in which many still hold
careers, participate in community and religious groups, and some are even caring for older parents
(Bateson, 2013). To engage in these activities, a majority of older Americans are still regularly using cars;
it is estimated that 86% of those aged 65 or older still drive (AAAFTS, 2014). An estimated 36 million
drivers, or 17% of the driving population, are over the age of 65. Of those drivers, approximately 13
million are 65-69, approximately 9 million are 70-74, and approximately 14 million are over the age of 75
(Federal Highway Administration, 2012). By the year 2020, it is expected that 56 million Americans will
be over the age of 65 (United States Census Bureau, 2012) and assuming a licensure rate of 86% holds
steady over time, it is estimated that there will be 48 million drivers over the age of 65 on American roads
by 2020. That number may increase to 72 million by 2050 if current United States Census projections
hold.
From another point of view, drivers over 65 account for nearly 219 billion miles driven per year. In the
period between May 2008 and April 2009, drivers aged 65-69 drove 97.4 billion miles, drivers aged 70-74
drove 55.2 billion miles, and drivers above the age of 75 drove 66.6 billion miles (Federal Highway
Administration, 2011). Furthermore, although the rate of motor vehicle crash deaths has increased in the
population as a whole, it is notable that this decline has occurred at a faster pace among those aged 70
and older since the death rate peaked in 1997 (Insurance Institute for Highway Safety, 2014).
As older drivers remain healthier for a longer, driving will undoubtedly continue to play a major role in
their ability to stay mobile, independent, and engaged in their community. Hence, there is a need to
better understand and delineate the changes that occur in the attitudes and perceptions of older drivers
as they continue to age and whether or not it is reasonable to treat all drivers over the age of 65 as one
unified group in traffic safety research. Most previous studies, unless specifically targeting older drivers,
have treated those aged 65 and older as a homogeneous group. Recent research findings, however,
challenge this assumption (Antsey and Wood, 2011). Understanding these traffic culture differences
among older drivers is important in that while older drivers are sometimes perceived as being an unsafe
presence on our roads (due in part to previous literature and media coverage of accidents involving older
drivers (Langford et.al, 2008)), older drivers are more likely to hold “pro-traffic safety” stances on a
variety of issues, including more government intervention and funding with regard to traffic safety and
support for police enforcement of traffic laws (Girasek, 2013). This report aims to determine whether
3
variability in driving attitudes and perceptions exists between three groups of older drivers: 65-69, 70-74,
and 75+ year olds.
Methods
Data Source Every year since 2007, the AAA Foundation for Traffic Safety has conducted a nationwide survey known
as the Traffic Safety Culture Index. It is a web based nationally-representative probability-based survey
of U.S. residents 16 years of age and older. Data was analyzed from the 2011, 2012, and 2013 versions,
which were conducted from June 6, 2011 to June 28, 2011, September 7, 2012 to September 24, 2012, and
September 18 through October 3, 2013. The annual survey assesses indicators of traffic safety culture at
the driver level.
Respondents were recruited by GfK, a large market research firm, into their KnowledgePanel® (For more
details please refer to earlier reports by the AAA Foundation for Traffic Safety Survey). Data was
weighted for the following factors: probability of selection for recruitment into the panel, probability of
selection for this survey, non-response, and create a representative sample of Americans 16 and older
with regard to gender, age, race/Hispanic ethnicity, education, census region, metropolitan area, number
of 16+ year olds in the household, and household income using data from the Current Population Survey.
All analyses were based on weighted data (AAA Foundation for Traffic Safety, 2014).
Between the years 2011 and 2013, study participants of all ages were surveyed for the annual survey
(N=3100, 3892, and 3147, respectively). They were excluded from the current analysis of older drivers if
they reported their age as 64 years or younger at the time of the survey resulting in 1793 study subjects
(518 from 2011, 824 from 2012, and 451 from 2013) being used for this analysis. The age 65 and older
sample was categorized into three age groups: 65-69, 70-74, and 75 and older. For questions regarding
the frequency of engagement in driving behaviors, responces were excluded if participants reported not
having driven in the last thirty days; the sample for this sub-analysis was 1631 people.
Anytime a question was asked throughout the years, it was asked in exactly the same way. However, not
all questions were asked in all three years and not all questions were asked of all participants. Questions
related to cannabis use and driving were new to 2013. Questions about support for speed and red light
cameras, along with support for regulations on in-car technology, were not asked in 2011. When questions
about speed and red-light cameras were asked, each participant was randomly asked only three of a
possible six questions. The 2011 survey also did not ask participants if they approved or disapproved of
speeding in urban areas or school zones or about the frequency of internet use while driving.
Data Cleaning Operationalization of Variables
Survey respondents were asked to rate their view of driving behaviors as completely acceptable,
somewhat acceptable, somewhat unacceptable, and completely unacceptable. These responses were
dichotomized as acceptable or unacceptable. Support for interventions was rated by respondents as
support strongly, support somewhat, oppose somewhat, and oppose strongly. These were dichotomized as
support or oppose. Respondents were able to refuse to answer any questions. Refusals were coded as
missing observations. Therefore, the sample sizes for various outcomes were different.
4
Respondents were also asked about how often they engaged in various driving behaviors in the last thirty
days. They had five options: regularly, fairly often, rarely, just once, and never. These answers were not
re-coded. However, refusals were re-coded as missing.
Respondents were then asked to rate how much of a threat they viewed various elements of driving. Their
choices were: very serious threat, somewhat serious threat, minor threat, or not a threat at all. The
responses were re-coded as a dichotomous variable: very/somewhat serious threat, minor threat/non-
threat.
Number of moving violations over the last 2 years was coded into the categories: 0, 1, and 2 or more. For
crashes, the categories were: 0, 1, 2, and 3 or more. This was done to ensure an adequate sample size for
the higher amount of moving violations.
For metropolitan status, observations were not “self-reported”. GfK coded observations as “metro” or “non-
metro” based on the ZIP code where the respondent resided. If the ZIP code lay in a metropolitan area as
defined by the Office of Management and Budget (OMB), the observation was coded as “metro;” if not, it
was coded as “non-metro.” The OMB defines a metropolitan area as a geographic entity with 50,000 or
more people.
Deletion of Observations
During the analysis of crashes, one data cell was deleted because it was suspected to be an error in coding
the data, and thus considered an outlier. A respondent with 9 self-reported crashes in the last two years
responded that they had never been seriously injured in an accident, had no moving violations, and drove
fewer than sixty minutes per week. The mean number of crashes per driver in the last two years in the
sample was .108 with a standard deviation of .471; the deleted observation was over 18 standard
deviations away from the mean. That cell was recoded as missing for the crash analysis. However, since
the number of crashes was the only outlier in this observation, this respondent was included in other
analyses discussed in this paper.
Data Analysis
Univariate Analysis
For all dependent variables: demographic information (Table 1), prevalence of crashes violations, and
injuries (Table 2), attitudes towards driving behaviors (Table 3), support for interventions (Table 4), and
engagement in behaviors (Table 5), the frequency of responses was calculated. A chi-squared test statistic
was calculated for demographic information and prevalence of crashes, violations, and injuries to
determine whether the proportions were evenly distributed between age categories. For driving attitudes
and support for interventions, logistic regression was used to model age category as a predictor of the
dependent variables and the chi-square test statistic on the effect of age category on the model was used
to determine statistical significance. An odds ratio and 95% confidence interval comparing those aged 65-
69 (the reference group) to the other two categories was calculated for each dependent variable. For
engagement in unsafe behaviors (i.e., distracted driving, speeding, impaired driving, etc.), the outcome
was not binary, so ordinal logistic regression was used to test for significance.
Bivariate and Multivariate Analysis
Multi-variate analysis was performed using either logistic or ordinal logistic regression, where age was
used as a predictor of the outcomes of interest and other demographic factors were added to the model.
The following independent variables were included in the multivariate model as predictors: sex, whether
5
respondent drove in the last thirty days, race, education, employment status, income, marital status, type
of primary vehicle, and metropolitan status. Sex and metropolitan status were inherently dichotomous
variables; the others were converted into dichotomous variables. Race was dichotomized as white, non-
white; education was some college or lower, college degree or more; vehicle was car, non-car; employment
status was employed, not-employed; income was <$75,000 per year, $75,000 per year +; and marital
status was married, not married.
Separate analyses were also performed controlling only for driving status in the last thirty days and then
controlling only for sex. The analysis controlling for driving status was to ensure that the impact of age on
the various outcomes was not confounded by whether one drives. The analysis controlling for gender was
done because preliminary analysis showed that it was a significant predictor in models of the outcomes of
interest and because previous literature shows that sex is a predictor of risky driving (Rhodes, 2010).
For behaviors or laws related to alcohol use, a separate analysis was conducted to control for alcohol use,
with an alcohol user defined as someone who drinks at least once a month or more. For behaviors related
to cannabis use, a separate analysis was done controlling for whether or not someone was a heavy
cannabis user, defined as someone who uses the drug a few times a week or more.
Analysis on the frequency of driving behaviors was only done on those who drove in the last thirty days,
so that variable was excluded in the modeling on these outcomes.
Statistical Software
All calculations were done on the weighted data using SAS V.9.4. Procedure Survey Logistic was used for
tests involving logistic regression. Procedure Frequency was used for the calculation of descriptive
statistics. Statistical significance for all tests was set at p ≤ .05.
Results
The weighted sample had a mean age of 72.8 years with a standard deviation of 6.1 years and ranged
from 65 years to 95 years. The sample was representative of the population of the United States with
regard to sex, race/ethnicity, education level, employment status, household income, metropolitan status,
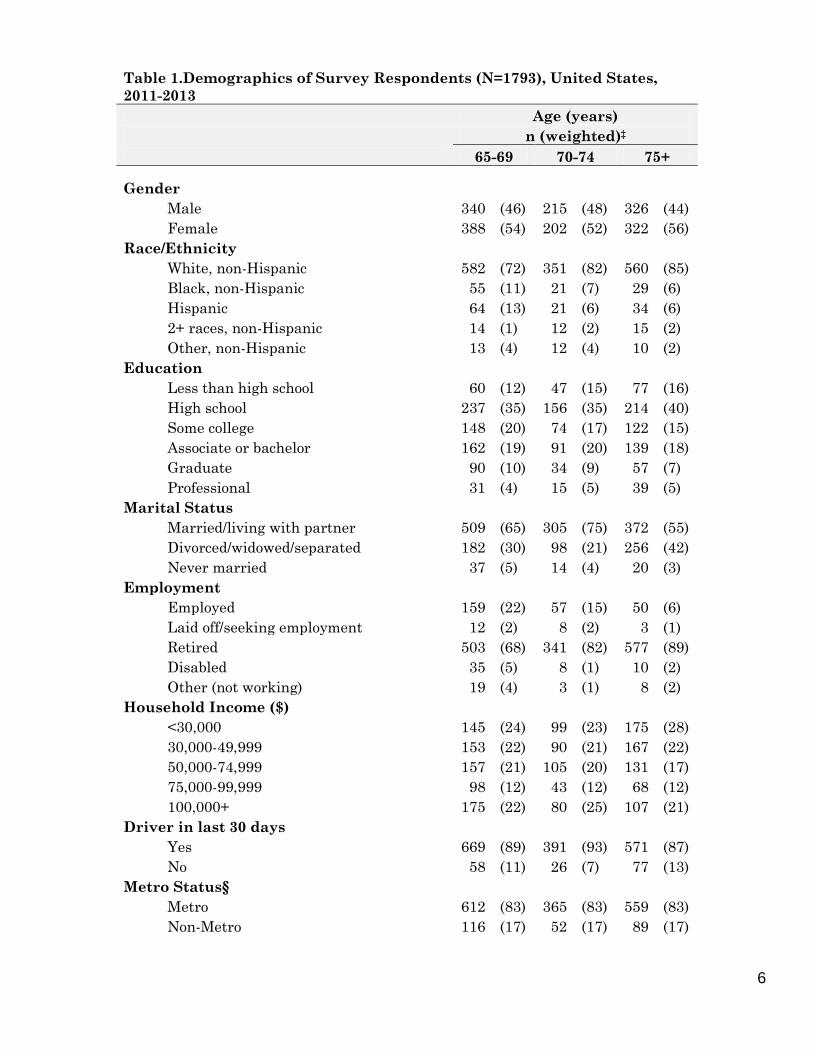
and marital status. The sample’s demographic characteristics can be found in Table 1. Drivers 75+ were
more likely to be white non-hispanics and less likely to be married or employed. They were also more
likely to drive a car as opposed to a van, mini-van, SUV or truck.
6
Table 1.Demographics of Survey Respondents (N=1793), United States,
2011-2013
Age (years)
n (weighted)‡
65-69 70-74 75+
Gender
Male 340 (46) 215 (48) 326 (44)
Female 388 (54) 202 (52) 322 (56)
Race/Ethnicity
White, non-Hispanic 582 (72) 351 (82) 560 (85)
Black, non-Hispanic 55 (11) 21 (7) 29 (6)
Hispanic 64 (13) 21 (6) 34 (6)
2+ races, non-Hispanic 14 (1) 12 (2) 15 (2)
Other, non-Hispanic 13 (4) 12 (4) 10 (2)
Education
Less than high school 60 (12) 47 (15) 77 (16)
High school 237 (35) 156 (35) 214 (40)
Some college 148 (20) 74 (17) 122 (15)
Associate or bachelor 162 (19) 91 (20) 139 (18)
Graduate 90 (10) 34 (9) 57 (7)
Professional 31 (4) 15 (5) 39 (5)
Marital Status
Married/living with partner 509 (65) 305 (75) 372 (55)
Divorced/widowed/separated 182 (30) 98 (21) 256 (42)
Never married 37 (5) 14 (4) 20 (3)
Employment
Employed 159 (22) 57 (15) 50 (6)
Laid off/seeking employment 12 (2) 8 (2) 3 (1)
Retired 503 (68) 341 (82) 577 (89)
Disabled 35 (5) 8 (1) 10 (2)
Other (not working) 19 (4) 3 (1) 8 (2)
Household Income ($)
<30,000 145 (24) 99 (23) 175 (28)
30,000-49,999 153 (22) 90 (21) 167 (22)
50,000-74,999 157 (21) 105 (20) 131 (17)
75,000-99,999 98 (12) 43 (12) 68 (12)
100,000+ 175 (22) 80 (25) 107 (21)
Driver in last 30 days
Yes 669 (89) 391 (93) 571 (87)
No 58 (11) 26 (7) 77 (13)
Metro Status§
Metro 612 (83) 365 (83) 559 (83)
Non-Metro 116 (17) 52 (17) 89 (17)
7
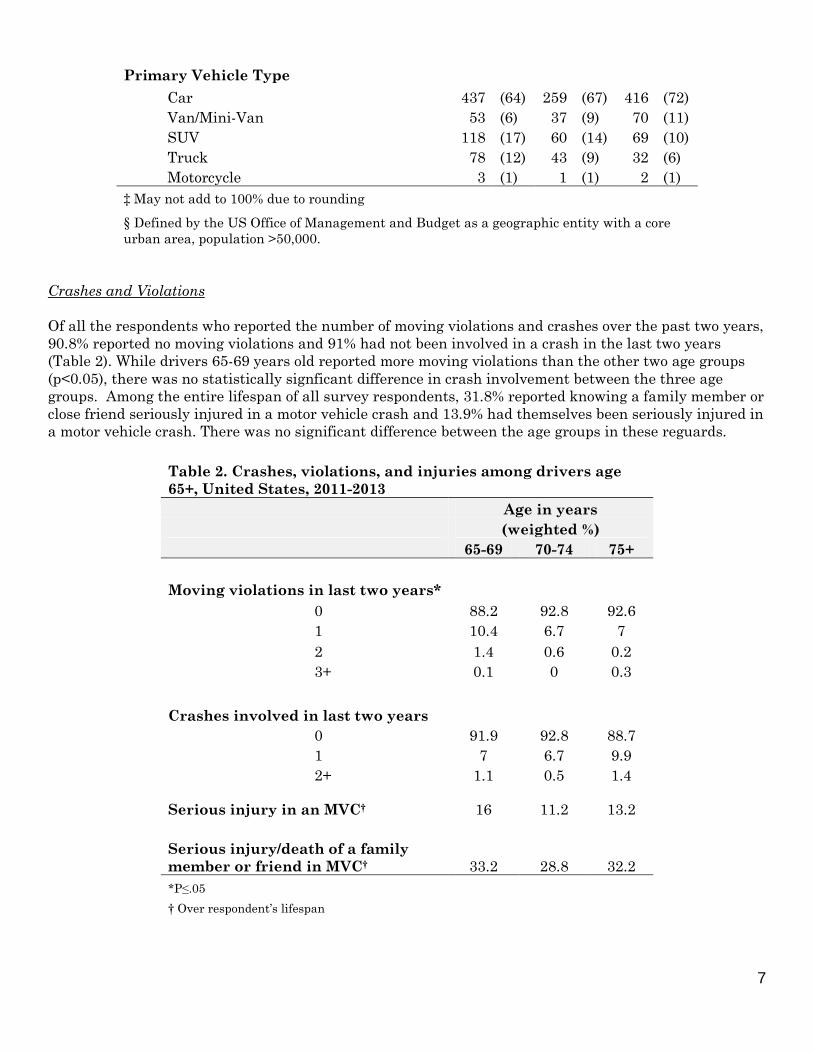
Primary Vehicle Type
Car 437 (64) 259 (67) 416 (72)
Van/Mini-Van 53 (6) 37 (9) 70 (11)
SUV 118 (17) 60 (14) 69 (10)
Truck 78 (12) 43 (9) 32 (6)
Motorcycle 3 (1) 1 (1) 2 (1)
‡ May not add to 100% due to rounding
§ Defined by the US Office of Management and Budget as a geographic entity with a core
urban area, population >50,000.
Crashes and Violations
Of all the respondents who reported the number of moving violations and crashes over the past two years,
90.8% reported no moving violations and 91% had not been involved in a crash in the last two years
(Table 2). While drivers 65-69 years old reported more moving violations than the other two age groups
(p<0.05), there was no statistically signficant difference in crash involvement between the three age
groups. Among the entire lifespan of all survey respondents, 31.8% reported knowing a family member or
close friend seriously injured in a motor vehicle crash and 13.9% had themselves been seriously injured in
a motor vehicle crash. There was no significant difference between the age groups in these reguards.
Table 2. Crashes, violations, and injuries among drivers age
65+, United States, 2011-2013
Age in years
(weighted %)
65-69 70-74 75+
Moving violations in last two years*
0 88.2 92.8 92.6
1 10.4 6.7 7
2 1.4 0.6 0.2
3+ 0.1 0 0.3
Crashes involved in last two years
0 91.9 92.8 88.7
1 7 6.7 9.9
2+ 1.1 0.5 1.4
Serious injury in an MVC† 16 11.2 13.2
Serious injury/death of a family
member or friend in MVC† 33.2 28.8 32.2
*P≤.05
† Over respondent’s lifespan
8
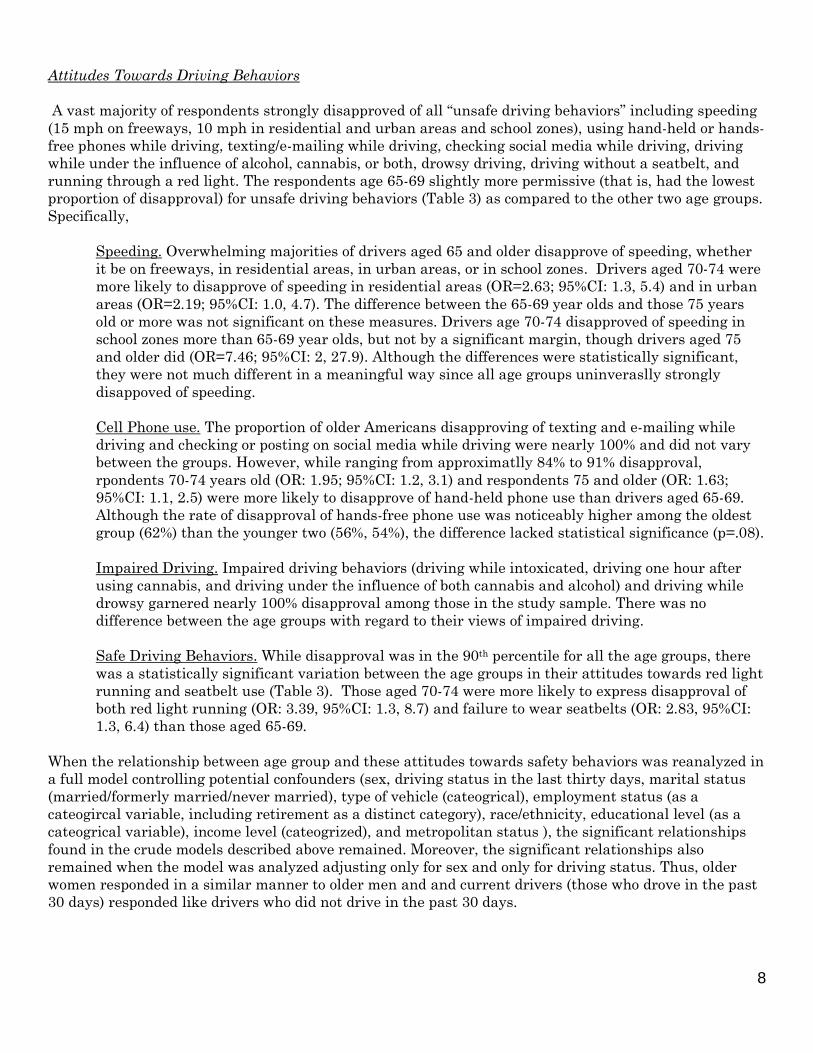
Attitudes Towards Driving Behaviors
A vast majority of respondents strongly disapproved of all “unsafe driving behaviors” including speeding
(15 mph on freeways, 10 mph in residential and urban areas and school zones), using hand-held or hands-
free phones while driving, texting/e-mailing while driving, checking social media while driving, driving
while under the influence of alcohol, cannabis, or both, drowsy driving, driving without a seatbelt, and
running through a red light. The respondents age 65-69 slightly more permissive (that is, had the lowest
proportion of disapproval) for unsafe driving behaviors (Table 3) as compared to the other two age groups.
Specifically,
Speeding. Overwhelming majorities of drivers aged 65 and older disapprove of speeding, whether
it be on freeways, in residential areas, in urban areas, or in school zones. Drivers aged 70-74 were
more likely to disapprove of speeding in residential areas (OR=2.63; 95%CI: 1.3, 5.4) and in urban
areas (OR=2.19; 95%CI: 1.0, 4.7). The difference between the 65-69 year olds and those 75 years
old or more was not significant on these measures. Drivers age 70-74 disapproved of speeding in
school zones more than 65-69 year olds, but not by a significant margin, though drivers aged 75
and older did (OR=7.46; 95%CI: 2, 27.9). Although the differences were statistically significant,
they were not much different in a meaningful way since all age groups uninveraslly strongly
disappoved of speeding.
Cell Phone use. The proportion of older Americans disapproving of texting and e-mailing while
driving and checking or posting on social media while driving were nearly 100% and did not vary
between the groups. However, while ranging from approximatlly 84% to 91% disapproval,
rpondents 70-74 years old (OR: 1.95; 95%CI: 1.2, 3.1) and respondents 75 and older (OR: 1.63;
95%CI: 1.1, 2.5) were more likely to disapprove of hand-held phone use than drivers aged 65-69.
Although the rate of disapproval of hands-free phone use was noticeably higher among the oldest
group (62%) than the younger two (56%, 54%), the difference lacked statistical significance (p=.08).
Impaired Driving. Impaired driving behaviors (driving while intoxicated, driving one hour after
using cannabis, and driving under the influence of both cannabis and alcohol) and driving while
drowsy garnered nearly 100% disapproval among those in the study sample. There was no
difference between the age groups with regard to their views of impaired driving.
Safe Driving Behaviors. While disapproval was in the 90th percentile for all the age groups, there
was a statistically significant variation between the age groups in their attitudes towards red light
running and seatbelt use (Table 3). Those aged 70-74 were more likely to express disapproval of
both red light running (OR: 3.39, 95%CI: 1.3, 8.7) and failure to wear seatbelts (OR: 2.83, 95%CI:
1.3, 6.4) than those aged 65-69.
When the relationship between age group and these attitudes towards safety behaviors was reanalyzed in
a full model controlling potential confounders (sex, driving status in the last thirty days, marital status
(married/formerly married/never married), type of vehicle (cateogrical), employment status (as a
cateogircal variable, including retirement as a distinct category), race/ethnicity, educational level (as a
cateogrical variable), income level (cateogrized), and metropolitan status ), the significant relationships
found in the crude models described above remained. Moreover, the significant relationships also
remained when the model was analyzed adjusting only for sex and only for driving status. Thus, older
women responded in a similar manner to older men and and current drivers (those who drove in the past
30 days) responded like drivers who did not drive in the past 30 days.
9
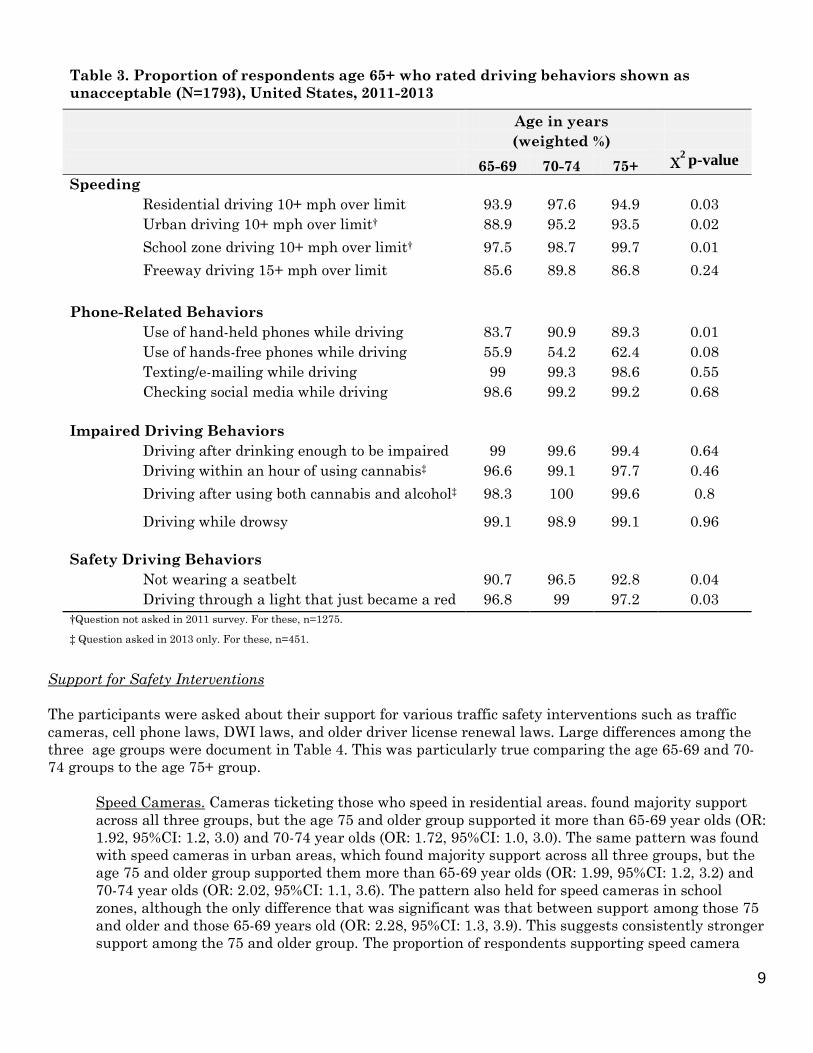
Table 3. Proportion of respondents age 65+ who rated driving behaviors shown as
unacceptable (N=1793), United States, 2011-2013
Age in years
(weighted %)
65-69 70-74 75+ χ2 p-value
Speeding
Residential driving 10+ mph over limit 93.9 97.6 94.9 0.03
Urban driving 10+ mph over limit† 88.9 95.2 93.5 0.02
School zone driving 10+ mph over limit† 97.5 98.7 99.7 0.01
Freeway driving 15+ mph over limit 85.6 89.8 86.8 0.24
Phone-Related Behaviors
Use of hand-held phones while driving 83.7 90.9 89.3 0.01
Use of hands-free phones while driving 55.9 54.2 62.4 0.08
Texting/e-mailing while driving 99 99.3 98.6 0.55
Checking social media while driving 98.6 99.2 99.2 0.68
Impaired Driving Behaviors
Driving after drinking enough to be impaired 99 99.6 99.4 0.64
Driving within an hour of using cannabis‡ 96.6 99.1 97.7 0.46
Driving after using both cannabis and alcohol‡ 98.3 100 99.6 0.8
Driving while drowsy 99.1 98.9 99.1 0.96
Safety Driving Behaviors
Not wearing a seatbelt 90.7 96.5 92.8 0.04
Driving through a light that just became a red 96.8 99 97.2 0.03
†Question not asked in 2011 survey. For these, n=1275.
‡ Question asked in 2013 only. For these, n=451.
Support for Safety Interventions
The participants were asked about their support for various traffic safety interventions such as traffic
cameras, cell phone laws, DWI laws, and older driver license renewal laws. Large differences among the
three age groups were document in Table 4. This was particularly true comparing the age 65-69 and 70-
74 groups to the age 75+ group.
Speed Cameras. Cameras ticketing those who speed in residential areas. found majority support
across all three groups, but the age 75 and older group supported it more than 65-69 year olds (OR:
1.92, 95%CI: 1.2, 3.0) and 70-74 year olds (OR: 1.72, 95%CI: 1.0, 3.0). The same pattern was found
with speed cameras in urban areas, which found majority support across all three groups, but the
age 75 and older group supported them more than 65-69 year olds (OR: 1.99, 95%CI: 1.2, 3.2) and
70-74 year olds (OR: 2.02, 95%CI: 1.1, 3.6). The pattern also held for speed cameras in school
zones, although the only difference that was significant was that between support among those 75
and older and those 65-69 years old (OR: 2.28, 95%CI: 1.3, 3.9). This suggests consistently stronger
support among the 75 and older group. The proportion of respondents supporting speed camera
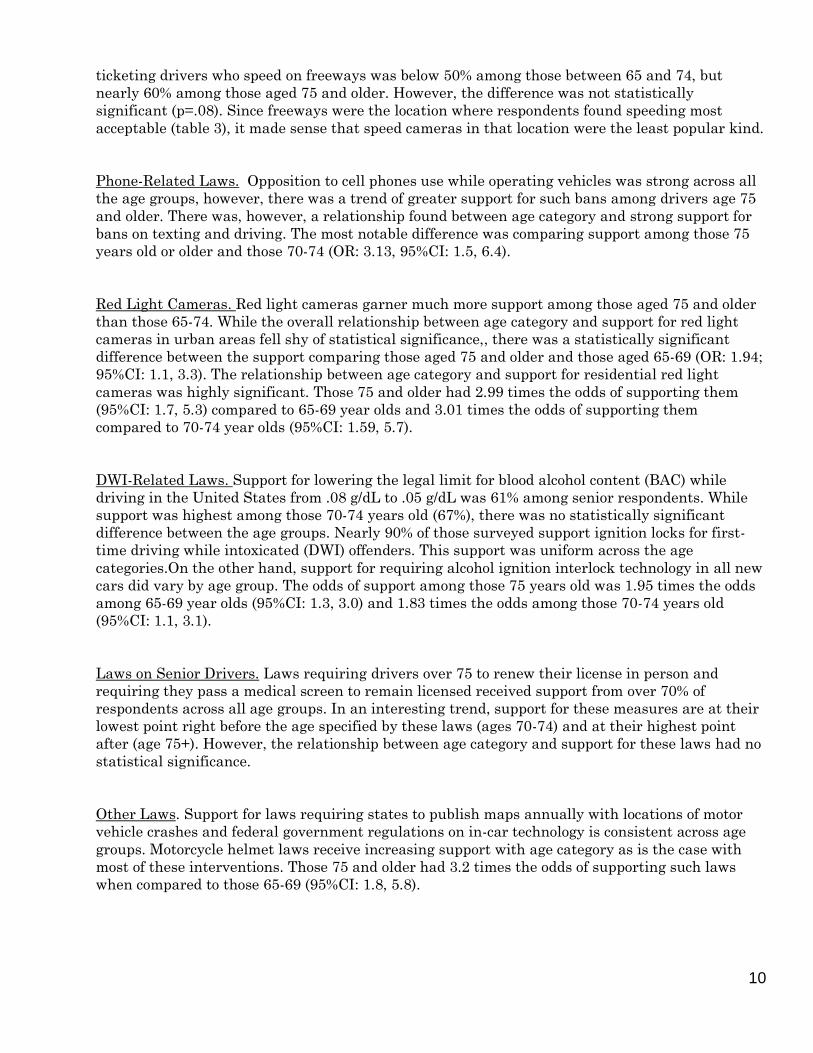
10
ticketing drivers who speed on freeways was below 50% among those between 65 and 74, but
nearly 60% among those aged 75 and older. However, the difference was not statistically
significant (p=.08). Since freeways were the location where respondents found speeding most
acceptable (table 3), it made sense that speed cameras in that location were the least popular kind.
Phone-Related Laws. Opposition to cell phones use while operating vehicles was strong across all
the age groups, however, there was a trend of greater support for such bans among drivers age 75
and older. There was, however, a relationship found between age category and strong support for
bans on texting and driving. The most notable difference was comparing support among those 75
years old or older and those 70-74 (OR: 3.13, 95%CI: 1.5, 6.4).
Red Light Cameras. Red light cameras garner much more support among those aged 75 and older
than those 65-74. While the overall relationship between age category and support for red light
cameras in urban areas fell shy of statistical significance,, there was a statistically significant
difference between the support comparing those aged 75 and older and those aged 65-69 (OR: 1.94;
95%CI: 1.1, 3.3). The relationship between age category and support for residential red light
cameras was highly significant. Those 75 and older had 2.99 times the odds of supporting them
(95%CI: 1.7, 5.3) compared to 65-69 year olds and 3.01 times the odds of supporting them
compared to 70-74 year olds (95%CI: 1.59, 5.7).
DWI-Related Laws. Support for lowering the legal limit for blood alcohol content (BAC) while
driving in the United States from .08 g/dL to .05 g/dL was 61% among senior respondents. While
support was highest among those 70-74 years old (67%), there was no statistically significant
difference between the age groups. Nearly 90% of those surveyed support ignition locks for first-
time driving while intoxicated (DWI) offenders. This support was uniform across the age
categories.On the other hand, support for requiring alcohol ignition interlock technology in all new
cars did vary by age group. The odds of support among those 75 years old was 1.95 times the odds
among 65-69 year olds (95%CI: 1.3, 3.0) and 1.83 times the odds among those 70-74 years old
(95%CI: 1.1, 3.1).
Laws on Senior Drivers. Laws requiring drivers over 75 to renew their license in person and
requiring they pass a medical screen to remain licensed received support from over 70% of
respondents across all age groups. In an interesting trend, support for these measures are at their
lowest point right before the age specified by these laws (ages 70-74) and at their highest point
after (age 75+). However, the relationship between age category and support for these laws had no
statistical significance.
Other Laws. Support for laws requiring states to publish maps annually with locations of motor
vehicle crashes and federal government regulations on in-car technology is consistent across age
groups. Motorcycle helmet laws receive increasing support with age category as is the case with
most of these interventions. Those 75 and older had 3.2 times the odds of supporting such laws
when compared to those 65-69 (95%CI: 1.8, 5.8).
11
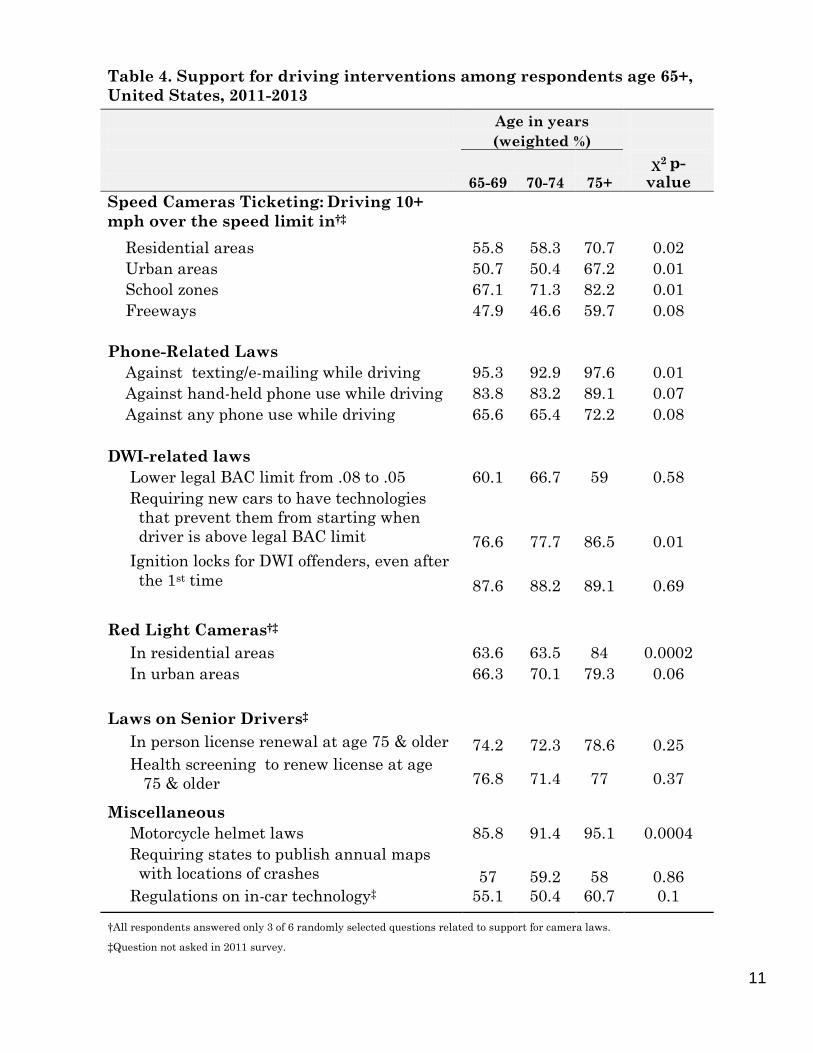
Table 4. Support for driving interventions among respondents age 65+,
United States, 2011-2013
Age in years
(weighted %)
65-69 70-74 75+
χ2 p-
value
Speed Cameras Ticketing: Driving 10+
mph over the speed limit in†‡
Residential areas 55.8 58.3 70.7 0.02
Urban areas 50.7 50.4 67.2 0.01
School zones 67.1 71.3 82.2 0.01
Freeways 47.9 46.6 59.7 0.08
Phone-Related Laws
Against texting/e-mailing while driving 95.3 92.9 97.6 0.01
Against hand-held phone use while driving 83.8 83.2 89.1 0.07
Against any phone use while driving 65.6 65.4 72.2 0.08
DWI-related laws
Lower legal BAC limit from .08 to .05 60.1 66.7 59 0.58
Requiring new cars to have technologies
that prevent them from starting when
driver is above legal BAC limit 76.6 77.7 86.5 0.01
Ignition locks for DWI offenders, even after
the 1st time 87.6 88.2 89.1 0.69
Red Light Cameras†‡
In residential areas 63.6 63.5 84 0.0002
In urban areas 66.3 70.1 79.3 0.06
Laws on Senior Drivers‡
In person license renewal at age 75 & older 74.2 72.3 78.6 0.25
Health screening to renew license at age
75 & older 76.8 71.4 77 0.37
Miscellaneous
Motorcycle helmet laws 85.8 91.4 95.1 0.0004
Requiring states to publish annual maps
with locations of crashes 57 59.2 58 0.86
Regulations on in-car technology‡ 55.1 50.4 60.7 0.1
†All respondents answered only 3 of 6 randomly selected questions related to support for camera laws.
‡Question not asked in 2011 survey.
12
When all potential confounders were added to the model predicting support for these interventions, the
effect of age category did not appreciably change when compared to the crude model. In other words,
adjusted for all other demographic factors, age categoryremains a significant predictor of support for
driving interventions. Although the crude model did not show a significant relationship between age
category and support for freeway speed cameras, the full multivariate model did (P=.02). However, when
adjusted for only sex or only driving status in the last thirty days, it was not a significant predictor (P=.06
and P=.08, respectively).
When only age or only age and driving status were included in the model predicting support for urban red
light cameras, age was not a significant predictor. However, it was a significant predictor in the full
model and the model including only age category and sex.
For all other outcomes tested, the results from the crude and adjusted bivariate and multivariate models
showed no change in statistical significance.
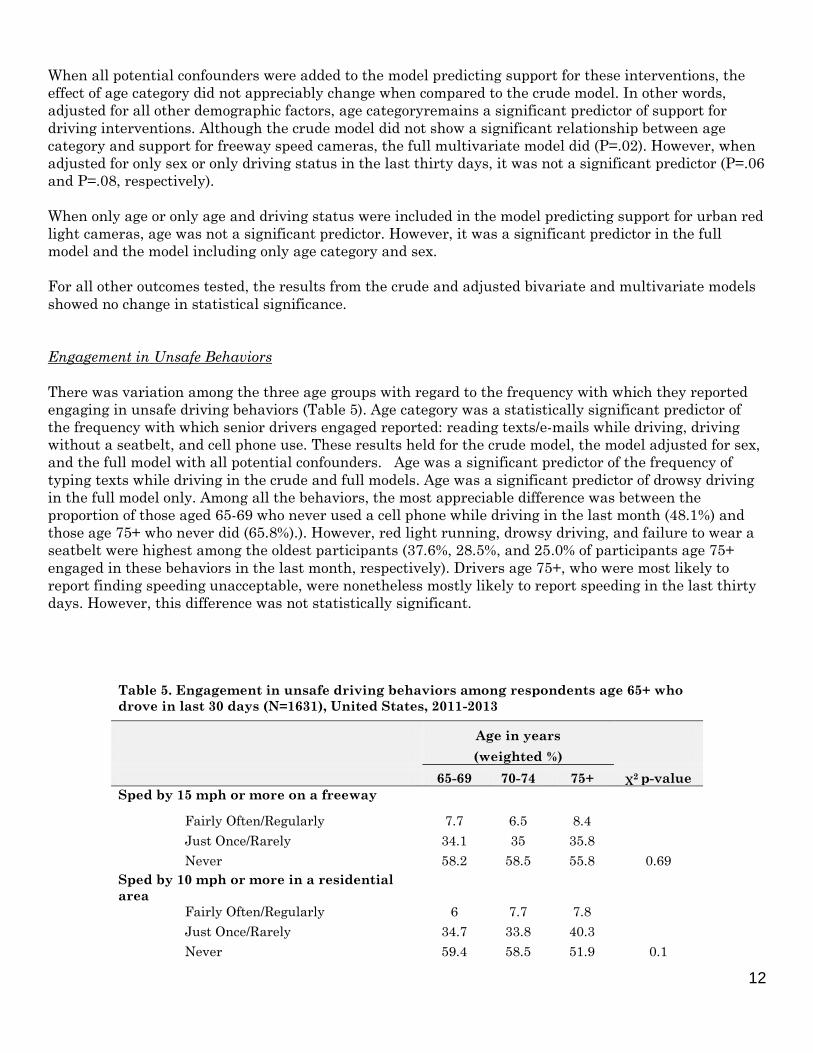
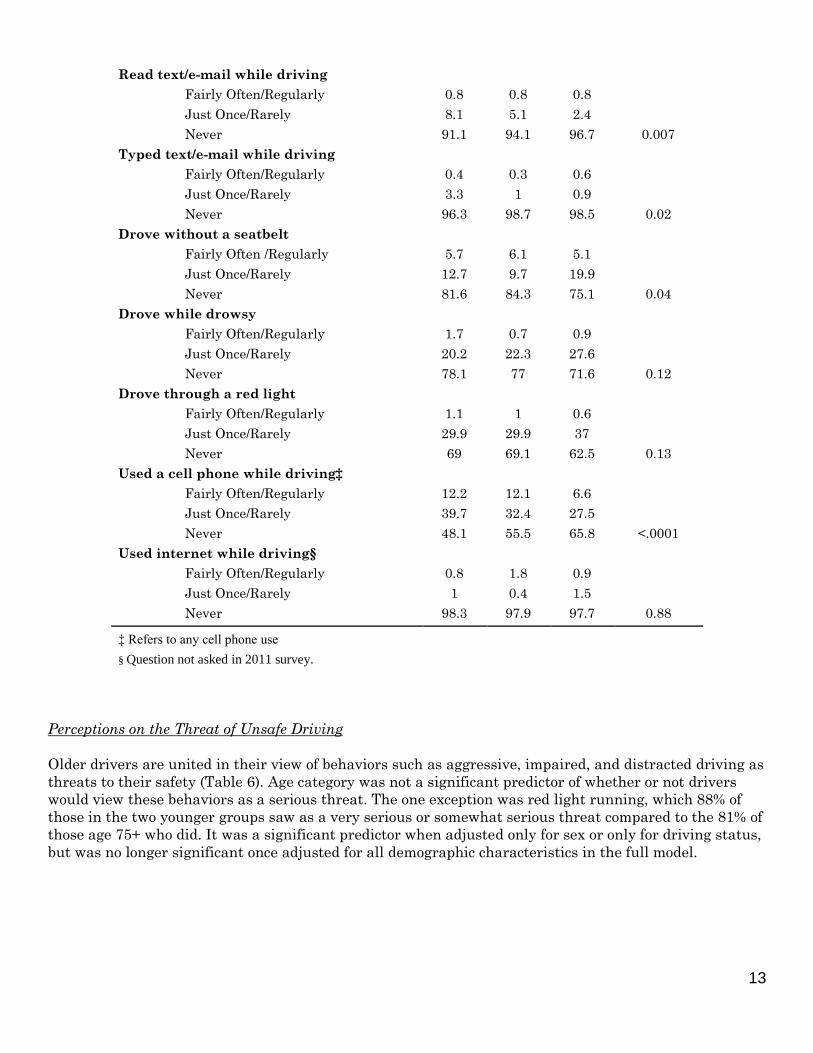
Engagement in Unsafe Behaviors
There was variation among the three age groups with regard to the frequency with which they reported
engaging in unsafe driving behaviors (Table 5). Age category was a statistically significant predictor of
the frequency with which senior drivers engaged reported: reading texts/e-mails while driving, driving
without a seatbelt, and cell phone use. These results held for the crude model, the model adjusted for sex,
and the full model with all potential confounders. Age was a significant predictor of the frequency of
typing texts while driving in the crude and full models. Age was a significant predictor of drowsy driving
in the full model only. Among all the behaviors, the most appreciable difference was between the
proportion of those aged 65-69 who never used a cell phone while driving in the last month (48.1%) and
those age 75+ who never did (65.8%).). However, red light running, drowsy driving, and failure to wear a
seatbelt were highest among the oldest participants (37.6%, 28.5%, and 25.0% of participants age 75+
engaged in these behaviors in the last month, respectively). Drivers age 75+, who were most likely to
report finding speeding unacceptable, were nonetheless mostly likely to report speeding in the last thirty
days. However, this difference was not statistically significant.
Table 5. Engagement in unsafe driving behaviors among respondents age 65+ who
drove in last 30 days (N=1631), United States, 2011-2013
Age in years
(weighted %)
65-69 70-74 75+ χ2 p-value
Sped by 15 mph or more on a freeway
Fairly Often/Regularly 7.7 6.5 8.4
Just Once/Rarely 34.1 35 35.8
Never 58.2 58.5 55.8 0.69
Sped by 10 mph or more in a residential
area
Fairly Often/Regularly 6 7.7 7.8
Just Once/Rarely 34.7 33.8 40.3
Never 59.4 58.5 51.9 0.1
13
Read text/e-mail while driving
Fairly Often/Regularly 0.8 0.8 0.8
Just Once/Rarely 8.1 5.1 2.4
Never 91.1 94.1 96.7 0.007
Typed text/e-mail while driving
Fairly Often/Regularly 0.4 0.3 0.6
Just Once/Rarely 3.3 1 0.9
Never 96.3 98.7 98.5 0.02
Drove without a seatbelt
Fairly Often /Regularly 5.7 6.1 5.1
Just Once/Rarely 12.7 9.7 19.9
Never 81.6 84.3 75.1 0.04
Drove while drowsy
Fairly Often/Regularly 1.7 0.7 0.9
Just Once/Rarely 20.2 22.3 27.6
Never 78.1 77 71.6 0.12
Drove through a red light
Fairly Often/Regularly 1.1 1 0.6
Just Once/Rarely 29.9 29.9 37
Never 69 69.1 62.5 0.13
Used a cell phone while driving‡
Fairly Often/Regularly 12.2 12.1 6.6
Just Once/Rarely 39.7 32.4 27.5
Never 48.1 55.5 65.8 <.0001
Used internet while driving§
Fairly Often/Regularly 0.8 1.8 0.9
Just Once/Rarely 1 0.4 1.5
Never 98.3 97.9 97.7 0.88
‡ Refers to any cell phone use
§ Question not asked in 2011 survey.
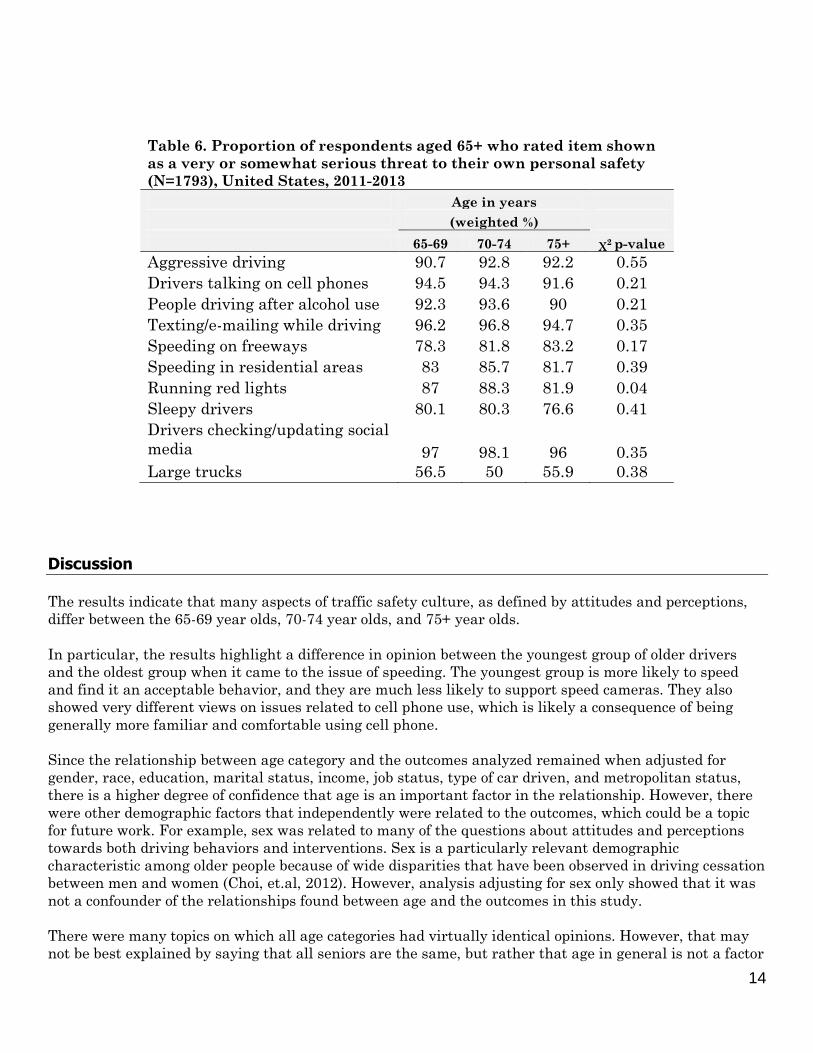
Perceptions on the Threat of Unsafe Driving
Older drivers are united in their view of behaviors such as aggressive, impaired, and distracted driving as
threats to their safety (Table 6). Age category was not a significant predictor of whether or not drivers
would view these behaviors as a serious threat. The one exception was red light running, which 88% of
those in the two younger groups saw as a very serious or somewhat serious threat compared to the 81% of
those age 75+ who did. It was a significant predictor when adjusted only for sex or only for driving status,
but was no longer significant once adjusted for all demographic characteristics in the full model.
14
Table 6. Proportion of respondents aged 65+ who rated item shown
as a very or somewhat serious threat to their own personal safety
(N=1793), United States, 2011-2013
Age in years
(weighted %)
65-69 70-74 75+ χ2 p-value
Aggressive driving 90.7 92.8 92.2 0.55
Drivers talking on cell phones 94.5 94.3 91.6 0.21
People driving after alcohol use 92.3 93.6 90 0.21
Texting/e-mailing while driving 96.2 96.8 94.7 0.35
Speeding on freeways 78.3 81.8 83.2 0.17
Speeding in residential areas 83 85.7 81.7 0.39
Running red lights 87 88.3 81.9 0.04
Sleepy drivers 80.1 80.3 76.6 0.41
Drivers checking/updating social
media 97 98.1 96 0.35
Large trucks 56.5 50 55.9 0.38
Discussion
The results indicate that many aspects of traffic safety culture, as defined by attitudes and perceptions,
differ between the 65-69 year olds, 70-74 year olds, and 75+ year olds.
In particular, the results highlight a difference in opinion between the youngest group of older drivers
and the oldest group when it came to the issue of speeding. The youngest group is more likely to speed
and find it an acceptable behavior, and they are much less likely to support speed cameras. They also
showed very different views on issues related to cell phone use, which is likely a consequence of being
generally more familiar and comfortable using cell phone.
Since the relationship between age category and the outcomes analyzed remained when adjusted for
gender, race, education, marital status, income, job status, type of car driven, and metropolitan status,
there is a higher degree of confidence that age is an important factor in the relationship. However, there
were other demographic factors that independently were related to the outcomes, which could be a topic
for future work. For example, sex was related to many of the questions about attitudes and perceptions
towards both driving behaviors and interventions. Sex is a particularly relevant demographic
characteristic among older people because of wide disparities that have been observed in driving cessation
between men and women (Choi, et.al, 2012). However, analysis adjusting for sex only showed that it was
not a confounder of the relationships found between age and the outcomes in this study.
There were many topics on which all age categories had virtually identical opinions. However, that may
not be best explained by saying that all seniors are the same, but rather that age in general is not a factor
15
that shapes opinions on those issues among seniors. Therefore, null results should not be interpreted as
an argument that older drivers should all be treated as one collective group. As a whole, the findings
show that “older” drivers defined as those aged 65 and older should not be treated as one unified group in
traffic safety research. Despite many physiological and demographic similarities between the 65-69 year
olds, 70-74 year olds, and those 75 and older, it is evident that changes in both demographics and values
occurred with age in the sample.
The results show that older people, especially those aged 75 and older, are supportive of a positive traffic
safety culture. There is both strong disapproval of negative driving behaviors and strong support for
interventions that would correct these behaviors. In addition, they show low levels of participation in the
same behaviors that they express disapproval of. It is particularly noteworthy that more than 3 in 4
seniors support both mandating in-person license renewals and medical screenings for those drivers over
the age of 75, a figure boosted by respondents over age 75. Although one could argue that seniors might
overestimate their ability to pass a medical screening, the fact that so many are willing to accept a
different set of rules for license renewals than the rest of the population suggests that traffic safety is an
important value among this group. It also suggests that program like Iowa’s limited driving test, which
allows some older drivers who cannot meet the requirements for a standard full-privilege driver’s license
to continue driving with restrictions, might gain a foothold in more states. This program appears to be
efficacious in allowing older drivers to maintain the ability to drive, and therefore a sense of
independence, longer (Stutts and Wilkins, 2012).
A theme of previous reports from the AAA Foundation for Traffic Safety on traffic safety culture has been
“do as I say, not as I do” (AAAFTS, 2014). In other words, it is the idea that people support a pro-safety
traffic culture and want other drivers to engage in safe behaviors, even though they may not do so
themselves. The results of this analysis show that this pattern is seen among Americans over 65. For
example, nearly 90% of respondents said speeding in excess of 15 mph on freeways is unacceptable (Table
3). However, 8% of respondents reported engaging in this behavior fairly often or regularly and 35% of
respondents reported engaging in this behavior just once or rarely (Table 5). And in spite of the fact that
nearly all respondents found red light running unacceptable, 1 in 3 respondents had run a red light in the
month preceding the survey. This shows that the traffic safety culture older Americans would like to see
does not match the one they actually live by. This has important implications in the quest for safer roads.
It demonstrates that changing opinions is not enough to change behavior and make our roads safer.
The fact that these programs have strong support among those who are most highly impact is a good
rationale for supporting them. Furthermore, the fact that drivers over 75 had the highest proportion of
respondents involved in a crash in the sample and were more likely to have reported running red lights
and driving drowsy in the last thirty days than respondents 65-74 demonstrates that this group contains
high-risk drivers who would probably be identified through these two measures. The aforementioned
results may suggest a manifestation of the signs of aging: declining cognitive ability and health in
particular. This is in line with earlier research, which shows that increasing age in seniors is significantly
associated with traffic light errors (e.g.-running red lights), among other errors (Anstey and Wood, 2011).
It also is consistent with previous literature that shows an increase in crash rates per miles driven after
age 75 (Tefft, 2012). Given that the number of adults age 75 and older will continue to increase for the
foreseeable future, this finding could have troubling consequences. This could lead to more crashes
involving drivers over age 75, who in particular show a higher level of fragility, resulting in a higher risk
of death when involved in a crash (Li, et.al, 2003).
However, it is possible that the rise of autonomous driving technologies that warn drivers about issues
such as lane deviation and being too close to another car will help prevent many accidents that may
otherwise happen among senior drivers who are cognitively impaired. Previous research has found that a
person giving driving directions and help to older drivers reduce the rate at which they commit errors,
which the researchers noted suggests efficacy for navigation systems in the cars of older drivers (Wood,
16
et.al, 2009).
These findings have implications for those who those who want to make driving safer. They show that
older Americans, particularly ones over age 75, are important allies in their mission. Considering the
projected growth in this population in the coming years, traffic safety advocates are sure to find more and
more success. That of course assumes that age leads to a change in attitudes. If those drivers aged 65-69
do not change with age and are representative of Baby Boomers, the older drivers of ten to twenty years
from now may look a lot different than the ones today. That all being said, this analysis demonstrates
that there are some unsafe driving behaviors that have a high level of acceptability, even among seniors,
which suggests more education is needed.
Limitations and Future Work
Many of the statistically significant relationships found in this analysis were likely due to the large
sample size that was analyzed. Therefore, it is important to reinforce that statistical significance is not
always meaningful. In many cases, the differences between the three age groups was slight, even when
p<.05 or even when p<.01. For example, the increase in red light running observed in the oldest age group
can be explained by an increasing number of respondents saying they engaged in this behavior just once
or rarely. Although any increase in red light running is distressing, the fact that is the result of people
who do it just once does not have major practical implications, and may even be explained by older
respondents simply being more candid.
A key limitation is the fact that because this is a survey, all answers are self-reported. Respondents may
be uncomfortable expressing approval of or admitting engagement in negative driving behaviors. They
may also be hesitant to express opposition to traffic regulations. It is even possible that this could vary by
age cohort, which would have impacted the results. The first part may be especially true because
respondents were asked about how they believe others feel about negative driving behaviors before they
were asked how they felt. In fact, analysis showed a strong relationship between what respondents
thought the norms were regarding driving behaviors and their own opinions. Future work may want to
focus on personal attitudes without introducing questions about perceptions of norms. In addition, future
work may want to focus on further stratification of those aged 65 and above, particularly among the group
aged 75 and older. This group contains a range of ages upwards of 25 years and is a time of great change,
particularly in the rate of licensure and number of miles driven per year. Given the size and nature of this
sample, such stratification was not practical in this analysis and the results would not have held much
statistical power. A key question that this research cannot answer is whether 65-69 year olds are always
different from those 75 or older or it is a generational difference. After all, many of the 65-69 year olds in
this sample are Baby Boomers, while none of those 75 and older are. This is a potential topic for future
work.
Future work should also compare these older respondents to respondents under 65 to better understand
what makes older respondents unique. This research is currently in progress at the AAA Foundation for
Traffic Safety. It will be conducted and presented in a similar manner to this analysis.
17
References
AAA Foundation for Traffic Safety (2014). Understanding Older Drivers: An Examination of Medical
Conditions, Medication Use, and Travel Behavior. Washington, DC: AAA Foundation for Traffic
Safety.
AAA Foundation for Traffic Safety (2014) . 2013 Traffic Safety Culture Index. Washington, DC: AAA
Foundation for Traffic Safety.
Anstey, K.J., Wood, J. (2011). Chronological age and age-related cognitive deficits are associated with an
increase in multiple types of driving errors in late life. Neuropsychology, 25(5), 613-621.
Bateson, M.C. (2013). Changes in the Life Course: Strengths and Stages. In C. Lynch & J. Danely (Eds.),
Transitions & Transformations: Cultural Perspectives on Aging and the Life Course (pp. 21-36).
New York, NY: Berghahn Books.
Centers for Disease Control. Behavioral Risk Factor Surveillance System Survey 2012. Atlanta, GA:
National Center for Chronic Disease Prevention and Health Promotion, Centers for Disease
Control, U.S. Department of Health and Human Services, August 2013.
Central Intelligence Agency. “The World Factbook” 2013-2014: United States. Washington, DC: Central
Intelligence Agency, 2013.
Choi, M., Mezuk, B., Lohman, M.C., Edwards, J.D., and Rebok, G.W. (2013). Gender and racial disparities
in driving cessation among older adults. Journal of Aging and Health, 25(8S),147S-162S.
Colby, S.L., Ortman, J.M. The Baby Boom Cohort in the United States: 2012 to 2060, Population
Estimates and Projections, Washington, DC: U.S. Census Bureau, May 2014.
DeNavas-Walt, C., Proctor, B.D., and Smith, J.C. Income, Poverty, and Health Insurance Coverage in the
United States, 2012. Washington, DC: U.S. Census Bureau, 2013.
Federal Highway Administration. Highway statistics 2012. Washington, DC: Office of Highway Policy
Information, Federal Highway Administration, U.S. Department of Transportation, December
2013.
Federal Highway Administration. 2009 National Household Travel Survey. Washington, DC: Federal
Highway Administration, U.S. Department of Transportation, 2011.
Girasek, D.C. (2013). Gauging popular support for traffic safety in the United States. Accident
Analysis and Prevention 50, 1112-1117.
Hobbs, F.and Stoops, N. Table 5. Population by Age and Sex for the United States: 1900 to 2000, Part A.
Census 2000 Special Reports, Series CENSR-4, Demographic Trends in the 20th Century.
Washington, DC: U.S. Census Bureau, 2002
Insurance Institute for Highway Safety. General statistics 2012. Washington, DC.: Highway Loss Data
Institute, Insurance Institute for Highway Safety, 2014.
Howden, L.M., Meyer, J.A. Age and Sex Composition: 2010, 2010 Census Briefs. Washington, DC: U.S.
18
Census Bureau, May 2011.
Langford, J., Bohensky, M., Koppel, S., Newstead, S. (2008). Do older drivers pose a risk to other road
users? Traffic Injury Prevention, 9 (3), 181-189.
Li, G., Braver, E.R., Chen, L.H. (2003). Fragility versus excess crash involvement as determinants of high
death rates per vehicle-mile travel among older drivers. Accident Analysis and Prevention 35 (2),
227-235.
Rhodes, N., Pivik, K. (2011). Age and gender differences in risky driving: The roles of positive affect and
risk perception. Accident Analysis and Prevention 43, 923-931.
United States Census Bureau. Projections of the population by selected age groups and sex for the United
States: 2015 to 2060. Washington, DC: Population Projections Program, Population Division, U.S.
Census Bureau, 2012.
United States Census Bureau. Table 12. Projections of the Population by Age and Sex for the United
States: 2010 to 2050 (NP2008-T12). Washington, DC: Population Division, U.S. Census Bureau,
2008.
United States Census Bureau. Statistical Abstract of the United States: 2012 (131st Edition). Table 231.
Educational Attainment by Selected Characteristics: 2010. Washington, DC: U.S. Census Bureau,
2011.
Tefft, B. (2012). Motor Vehicle Crashes, Injuries, and Deaths in Relation to Driver Age: United States,
1995–2010. Project Summary Report. Washington, D.C.: AAA Foundation for Traffic Safety.
Wood, J.M., Anstey, K.J., Lacherez, P.F., Kerr, G.K., Mallon, K., Lord, S.R. (2009). The on-road difficulties
of older drivers and their relationship with self-reported motor vehicle crashes. Journal of the
American Geriatrics Society 57, 2062-2069.