berkshire older drivers insight study
DESCRIPTION
Insight Study exploring the circumstances surrounding collisions involving older drivers in BerkshireTRANSCRIPT
Age,Mobility&Risk
Version2.2 Tanya Fosdick September 2012

Page | 2
CONTENTS EXECUTIVE SUMMARY ............................................................................................................................ 3
INTRODUCTION ....................................................................................................................................... 5
RISK PROFILE ........................................................................................................................................... 6
CRASH PROFILES ................................................................................................................................. 6
WHAT? ............................................................................................................................................ 6
WHEN? .......................................................................................................................................... 10
WHERE?......................................................................................................................................... 11
HOW? ............................................................................................................................................ 12
OLDER CAR DRIVER PROFILES ........................................................................................................... 14
MOSAIC ANALYSIS ............................................................................................................................. 19
INDEX OF MULTIPLE DEPRIVATION (IMD) ........................................................................................ 21
ENGAGEMENT PLAN ......................................................................................................................... 27
Self Assessment ............................................................................................................................ 27
Manual for Older Drivers .............................................................................................................. 27
Flourish Course ............................................................................................................................. 27
Driving Assessments ..................................................................................................................... 27
Website & Apps ............................................................................................................................ 27
Messages ....................................................................................................................................... 28
EVALUATION ..................................................................................................................................... 29
CURRENT LOCAL SCHEMES ............................................................................................................... 30
SUMMARY OF OTHER EVIDENCE AND SUCCESSFUL SCHEMES ........................................................ 30
EXISTING SCHEMES ....................................................................................................................... 31
Page | 3
EXECUTIVE SUMMARY Analysis of collisions involving people over the age of 60 years, either resident of or injured within
Berkshire, has been undertaken to determine the extent of the issue. The following is a summary of
this report’s findings:
21% of Berkshire’s fatalities between 2006 and 2010 were aged over 60 years.
60% of Berkshire’s over 60 year old casualties were drivers. These drivers are most likely to be
aged between 60 and 69 years old.
84% of over 60 year old casualties injured in Berkshire were involved in a collision with a driver
aged 60 years or over (suggesting that passenger and pedestrian casualty rates could be
positively affected by reductions in driver risk). Passengers of older drivers tend to be of similar
age to the driver and so are likely to be peers or partners. Children (perhaps grandchildren)
appear as passengers for some of the younger age group of 60 to 64 year olds.
Over 60 year old car drivers from Berkshire tend to crash on weekdays and during the day. This
is consistent with national findings where some older drivers self‐regulate to avoid difficult
situations. Most of their collisions occur in daylight and fine weather. 69% were involved in
collisions on 30mph or 40mph roads.
39% were not at a junction whereas 30% were at a T‐junction and 12% were at a roundabout.
47% of the drivers were going straight ahead; 11% were moving off or stopping; and 14% were
turning right. Two‐thirds of the drivers were involved in collisions with one other vehicle.
56% of Berkshire’s older car drivers were considered to be at fault in their collision. This is
consistent with national research that found that 85 to 89 year olds were four times more likely
to have caused the crash than to have been innocently involved. The most common contributory
factors assigned to Berkshire’s older drivers are: ‘failed to look properly’; ‘failed to judge other
person’s path or speed’; and ‘poor turn or manoeuvre’. ‘Illness or disability, mental or physical’
and ‘Uncorrected, defective eyesight’ are more likely to be attributed to older drivers than all
drivers.
The highest percentages of collision‐involved older drivers come from West Berkshire; Windsor
and Maidenhead; and Wokingham. These areas have also seen the largest percentage increases
in the older population since 1981 and also have the highest percentages of crash‐involved older
drivers from the 25% least deprived IMD deciles. 65% of older drivers involved in collisions in
Berkshire came from Berkshire.
Super output areas within Wokingham, Bracknell Forest and Windsor and Maidenhead have
been highlighted as areas of high risk based on average annual rates of collision involvement.
One area of Wokingham has an average annual rate of one‐in‐332 older people involved in injury
collisions as drivers.
Three Mosaic Groups were highlighted as over‐represented amongst Berkshire’s older drivers –
these are Groups C, D and L. Groups C and D share some characteristics – both types of people
are successful, comfortably off and enjoy the arts and classical music. They are well educated
and are likely to have grown up children. They also have high internet usage. This Group is over‐
represented in the younger age group but does not represent as many drivers in the collision
statistics. However, the analysis did identify that there were some less affluent older drivers that
need to be accounted for. Their communication preferences are face‐to‐face engagement, local
newspapers and post.
Page | 4
Three personas have been created to allow us to visualise the target audience and shape the
intervention to fit their needs.
Other research has found that a combination of on‐road training and in‐class education, tailored
to specific needs, can be a positive intervention with older car drivers. It has also been
recommended that ceasing driving should be made as painless as possible and that an
information pack, providing details of alternative transport and forms of support, should be
provided. There have been a variety of schemes based on these lines that have been provided
across the country
The intervention culminating from the research is called Flourish and is about assessment and
self‐regulation being key to safer mobility in later life. The intervention is comprised of multiple
components, including self‐assessment; a manual of advice; an educational course; driving
assessments; and website and apps. All components are based on the research contained within
this Insight Study.
Process and outcome evaluations will be undertaken by measuring the number of self‐
assessments undertaken and how many subsequent Flourish courses and driving assessments
booked.
Page | 5
INTRODUCTION It is a known fact that there is an ageing population – a combination of lower birth rates and
reductions in mortality have led to a situation where there is a greater proportion of older people in
the population than younger people. “Currently in the UK around one in six of the population is aged
65 or over, and it is predicted that by 2050 one in five will be.”i With increases in the older
population, measures should be put in place to ensure their independence, mobility and safety when
using the roads.
This report sets out analysis undertaken using MAST, an online analysis tool which combines
casualty and collision data from the Department for Transport with socio‐demographic insights
created by Experian through Mosaic Public Sector. The postcodes of drivers and casualties involved
in collisions are used to determine which Mosaic Groups and Types these individuals are likely to
belong to and this can be used by road safety professionals to understand who needs to be targeted
in road safety interventions. The report looks at older people involved in collisions in Berkshire and
also, more importantly, focuses on older people who live in Berkshire who have been involved in
injury collisions. The intention of this report is to provide the road safety practitioner in Berkshire
with a full understanding of the types of collision involving older people and to equip them with the
tools to target the issue.
The report works through the analysis by first determining the extent to which older people are
involved in collisions in Berkshire and in what context they are involved. The analysis shows that,
overwhelmingly, older people are most likely to be injured in Berkshire as car drivers. As such, the
remainder of the analysis focuses most intensively on car drivers who are aged over 60 years old,
who are from Berkshire and who were involved in an injury collision between 2006 and 2010.
Environmental factors, such as when, where and how the older car drivers were involved in collisions
are explored and provide information on the topics and issues that could be focused upon within an
intervention.
A large part of the analysis focuses on profiling the older car driver, with the aim of producing
‘personas’ that can be used to visualise the target audience. These personas are created using a
variety of socio‐demographic data, including looking at Indices of Multiple Deprivation, rurality and
Mosaic Groups. Profiling in this way allows the practitioner to understand how the older drivers will
respond to a road safety intervention and in what way it should be delivered.
All of this culminates in an ‘Engagement Plan’, where experts from Safer Roads have used all the
available information from the analysis, external research, and learning outcomes from other older
driver schemes, to create an intervention design.
The report also contains a plan for evaluating the intervention, both in terms of assessing the
processes involved in delivery and the overall effectiveness of the scheme. Principles and tools
developed and promoted by RoSPA are used for creating the evaluation design.ii

Page | 6
RISK PROFILE This profile covers two distinct areas: information about the crash and information about the person
involved. Both are relevant to the analysis and are considered separately.
CRASH PROFILES
WHAT?
In order to determine who to focus on for the analysis into older road users in Berkshire, some
preparatory work was undertaken. Firstly, a needs analysis was undertaken to establish whether or
not older road users represented a road risk in Berkshire. National research has found that:
From the evidence available it is possible to deduce that older people are as safe behind the
wheel as the rest of the population. Contrary to popular belief the majority of older drivers
have good driving records. Up to age 80 most older drivers appear to perform as well as
middle‐aged motorists and after this age only a small minority of active older drivers, often
travelling less than approximately 2000 miles per year, are at an elevated risk per mile basis.
The fatality rate per driving licence increases with age because as people get older they
become increasingly frail, and so are more vulnerable to injury when involved in an accident.
Older drivers are in fact involved in fewer slight accidents than younger travelers, but a
disproportionate number of older travelers are killed in road accidents due to frailty. Drivers
also tend to reduce the distance they travel as they get older, which increases the casualty
rate per mile driven for the group. iii
This study seeks to uncover what the casualty and collision issues are in Berkshire in relation to older
residents; how these findings compare to the national picture and what interventions could be
adopted to reduce Berkshire’s older citizens’ collision involvement.
Looking at collision data from 2006 to 2010, there were 141 people over the age of 60 years old who
were killed on Berkshire’s roads. This represents 21% of Berkshire’s fatalities. In terms of serious and
slight casualties, over 60 year olds represented 12% and 9% of Berkshire’s casualties respectively. It
would suggest that over 60 year olds are not over‐represented amongst Berkshire’s casualties
generally but are more likely to be killed or seriously injured (KSI) than the average Berkshire
casualty – 15% of over 60 years injured in Berkshire are KSI casualties compared to 10% for all
casualties injured in Berkshire. To put this into context using population data, over 65 year olds
represented 13% of Berkshire’s population in 2010 but, on average, 17% of fatal casualties in
Berkshire. When indices are applied to the average annual rates of fatalities per head of population,
over 65 year olds have an index of 123. This is in comparison to the index of 121 applied to 16 to 64
year olds in Berkshire, which is a much larger age range (unfortunately there are restrictions in the
available population data available by age at local authority level). The over‐representation as fatal
and serious casualties could be due to the type of collision older people are involved in; their
vulnerability to injury and likelihood to suffer a collision due to frailty and existing conditions; or a
combination of the two. The analysis would suggest that interventions aimed at older road users
would be beneficial to reduce this severity ratio, especially when the ageing population is
considered.
Page | 7
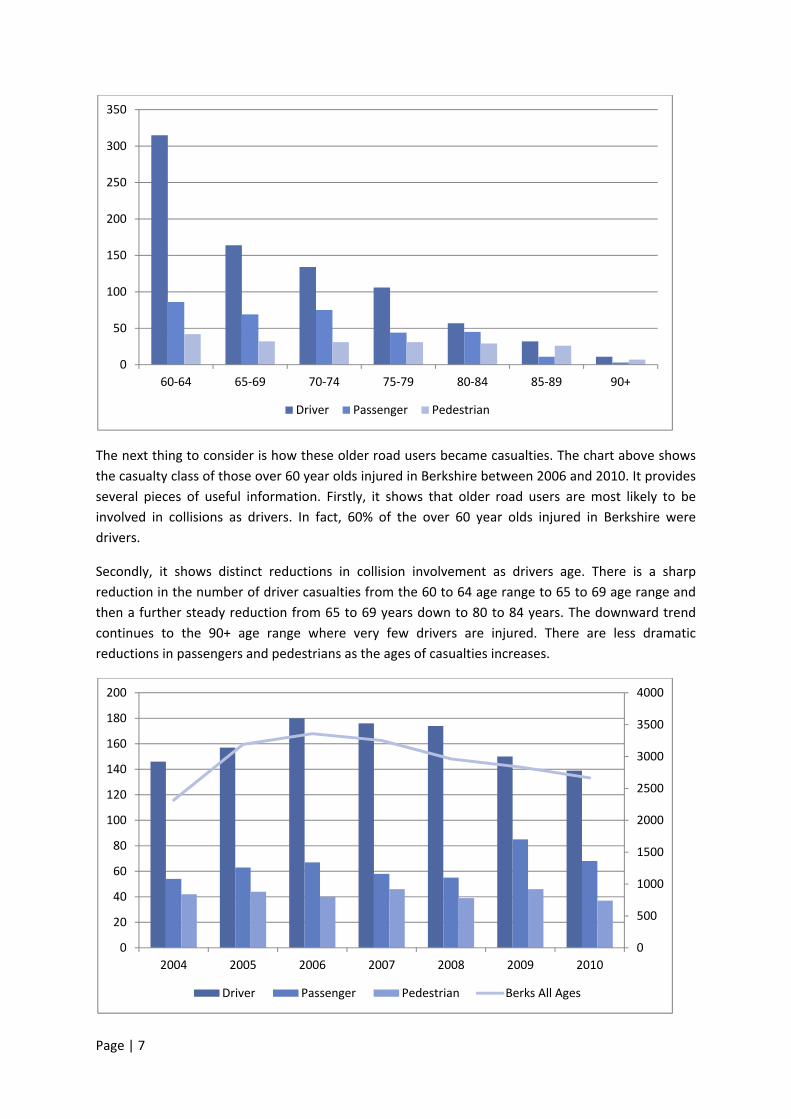
The next thing to consider is how these older road users became casualties. The chart above shows
the casualty class of those over 60 year olds injured in Berkshire between 2006 and 2010. It provides
several pieces of useful information. Firstly, it shows that older road users are most likely to be
involved in collisions as drivers. In fact, 60% of the over 60 year olds injured in Berkshire were
drivers.
Secondly, it shows distinct reductions in collision involvement as drivers age. There is a sharp
reduction in the number of driver casualties from the 60 to 64 age range to 65 to 69 age range and
then a further steady reduction from 65 to 69 years down to 80 to 84 years. The downward trend
continues to the 90+ age range where very few drivers are injured. There are less dramatic
reductions in passengers and pedestrians as the ages of casualties increases.
0
50
100
150
200
250
300
350
60‐64 65‐69 70‐74 75‐79 80‐84 85‐89 90+
Driver Passenger Pedestrian
0
500
1000
1500
2000
2500
3000
3500
4000
0
20
40
60
80
100
120
140
160
180
200
2004 2005 2006 2007 2008 2009 2010
Driver Passenger Pedestrian Berks All Ages
Page | 8
The last area to consider is to determine how the crash involvement of over 60 year olds has
changed, if at all, in Berkshire over recent years. The previous chart shows the number of over 60
year old casualties, by casualty class, since 2004. It shows that the number of older driver casualties
increased in 2005, remained steady until 2008 and has decreased in 2010 to just below the 2004
figure. The number of older pedestrians injured in Berkshire each year has remained fairly static and
older passenger numbers have actually increased. It also shows the number of casualties of all ages
injured in Berkshire (as the line). This line shows a similar trend to the older drivers pattern: an
increase to 2006 in the number of casualties, followed by a plateau and then a reduction after 2007.
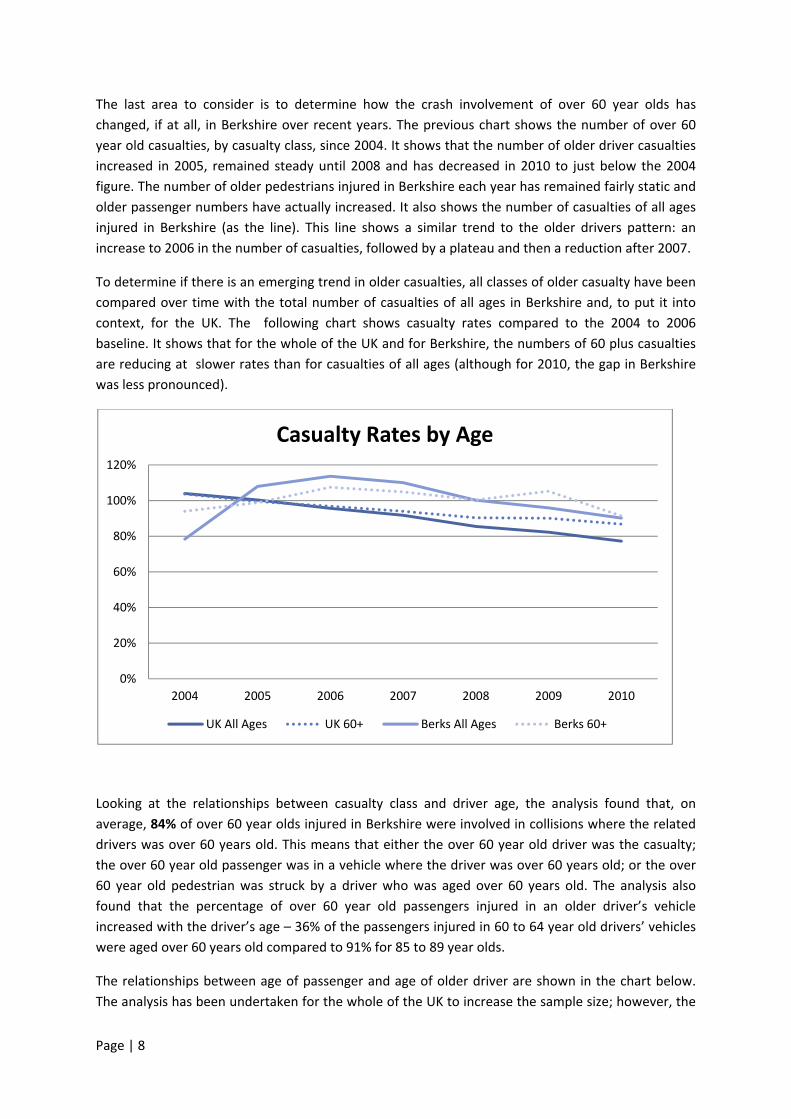
To determine if there is an emerging trend in older casualties, all classes of older casualty have been
compared over time with the total number of casualties of all ages in Berkshire and, to put it into
context, for the UK. The following chart shows casualty rates compared to the 2004 to 2006
baseline. It shows that for the whole of the UK and for Berkshire, the numbers of 60 plus casualties
are reducing at slower rates than for casualties of all ages (although for 2010, the gap in Berkshire
was less pronounced).
Looking at the relationships between casualty class and driver age, the analysis found that, on
average, 84% of over 60 year olds injured in Berkshire were involved in collisions where the related
drivers was over 60 years old. This means that either the over 60 year old driver was the casualty;
the over 60 year old passenger was in a vehicle where the driver was over 60 years old; or the over
60 year old pedestrian was struck by a driver who was aged over 60 years old. The analysis also
found that the percentage of over 60 year old passengers injured in an older driver’s vehicle
increased with the driver’s age – 36% of the passengers injured in 60 to 64 year old drivers’ vehicles
were aged over 60 years old compared to 91% for 85 to 89 year olds.
The relationships between age of passenger and age of older driver are shown in the chart below.
The analysis has been undertaken for the whole of the UK to increase the sample size; however, the
0%
20%
40%
60%
80%
100%
120%
2004 2005 2006 2007 2008 2009 2010
Casualty Rates by Age
UK All Ages UK 60+ Berks All Ages Berks 60+

Page | 9
pattern is very similar in Berkshire. It shows how the ages of passengers increase with driver age,
implying that the passengers are partners and peers. For the younger older driver, there are younger
passengers and this could reflect time spent caring for grandchildren in the early stages of
retirement.
These findings are consistent with an Australian study, which found that:
older drivers have been shown not to pose a substantial threat to other road users. Once
involved in a crash, older drivers are likely to be the ones either killed or injured. The next
largest group consists of older drivers’ passengers, themselves likely to be elderly.iv
Lastly, the vehicle type of older drivers involved in collisions in Berkshire was examined. It found that
86% of the over 60 year olds were driving a car.
Based on the scoping analysis, it has been decided that the rest of the report will focus on over 60
year old car drivers as not only do they represent the largest casualty and driver group amongst
older road users in Berkshire but there are potential casualty reduction benefits to be gained for
older passengers and older pedestrians from reducing older driver crash involvement. Analysis of
Berkshire’s pedestrians aged over 60 years old found that 15% were struck by a driver aged over 60
years old. Looking at the times of day for when older drivers, passengers and pedestrians are all
injured shows that they all share the same time patterns as shown overleaf. This would suggest that
older people tend to be out and about at the same times of day thus bringing older drivers and older
pedestrians into conflict. There have sadly been cases across the country where older drivers have
run over older friends and relatives (often on driveways and in car parks) by accidently pressing the
accelerator instead of the brake and reversing instead of moving forward. It could be that restricted
mobility of the older pedestrians prevents them from moving out of the way when these errors
occur.v
0
500
1000
1500
2000
2500
UK Age of Passenger verses Age of Driver
60‐64 65‐69 70‐74 75‐79 80‐84 85‐89 90+
Page | 10
WHEN?
The remainder of the analysis focuses on older drivers known to be from Berkshire rather than those
who were involved in collisions in Berkshire but could live anywhere in the country.
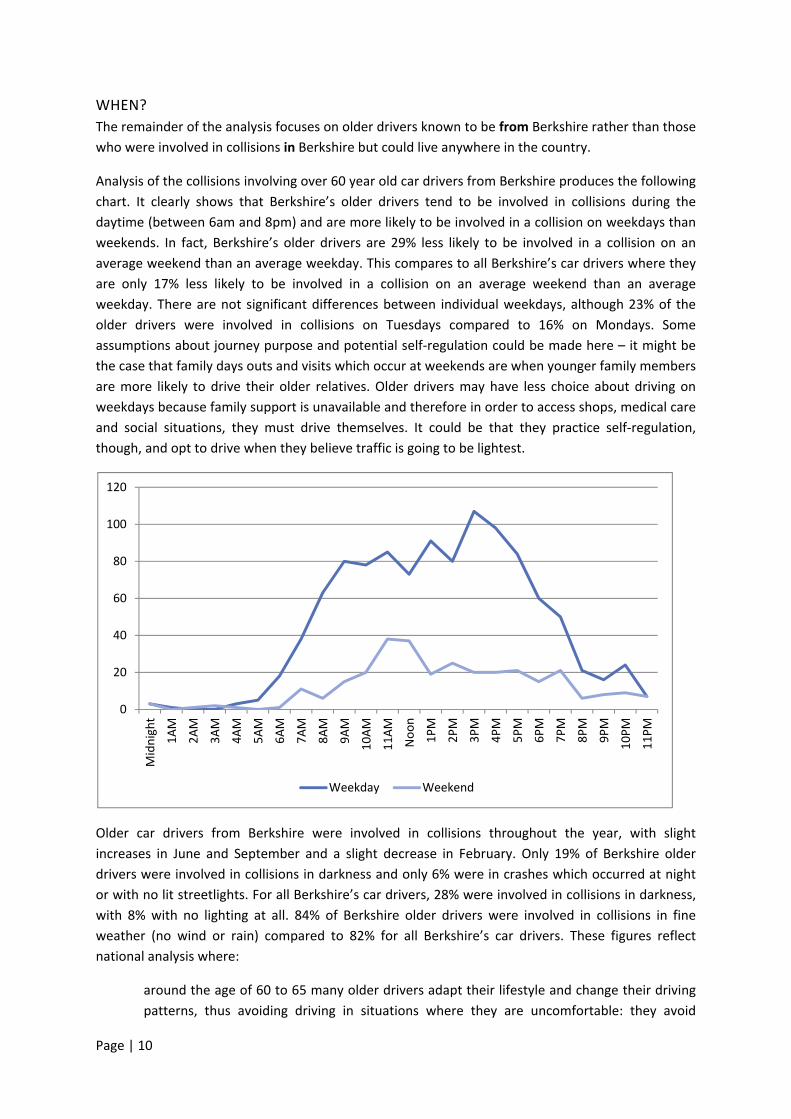
Analysis of the collisions involving over 60 year old car drivers from Berkshire produces the following
chart. It clearly shows that Berkshire’s older drivers tend to be involved in collisions during the
daytime (between 6am and 8pm) and are more likely to be involved in a collision on weekdays than
weekends. In fact, Berkshire’s older drivers are 29% less likely to be involved in a collision on an
average weekend than an average weekday. This compares to all Berkshire’s car drivers where they
are only 17% less likely to be involved in a collision on an average weekend than an average
weekday. There are not significant differences between individual weekdays, although 23% of the
older drivers were involved in collisions on Tuesdays compared to 16% on Mondays. Some
assumptions about journey purpose and potential self‐regulation could be made here – it might be
the case that family days outs and visits which occur at weekends are when younger family members
are more likely to drive their older relatives. Older drivers may have less choice about driving on
weekdays because family support is unavailable and therefore in order to access shops, medical care
and social situations, they must drive themselves. It could be that they practice self‐regulation,
though, and opt to drive when they believe traffic is going to be lightest.
Older car drivers from Berkshire were involved in collisions throughout the year, with slight
increases in June and September and a slight decrease in February. Only 19% of Berkshire older
drivers were involved in collisions in darkness and only 6% were in crashes which occurred at night
or with no lit streetlights. For all Berkshire’s car drivers, 28% were involved in collisions in darkness,
with 8% with no lighting at all. 84% of Berkshire older drivers were involved in collisions in fine
weather (no wind or rain) compared to 82% for all Berkshire’s car drivers. These figures reflect
national analysis where:
around the age of 60 to 65 many older drivers adapt their lifestyle and change their driving
patterns, thus avoiding driving in situations where they are uncomfortable: they avoid
0
20
40
60
80
100
120
Midnight
1AM
2AM
3AM
4AM
5AM
6AM
7AM
8AM
9AM
10AM
11AM
Noon
1PM
2PM
3PM
4PM
5PM
6PM
7PM
8PM
9PM
10PM
11PM
Weekday Weekend
Page | 11
driving in the rain so they have fewer accidents when it is wet and more in dry weather, they
avoid peak hour traffic periods but have more accidents between 10am and 4pm and they
drive less at night so have fewer accidents in the dark but more in daylight.vi
WHERE?
Analysis of the locations in which older car drivers from Berkshire were involved in collisions shows
that 69% of the drivers crashed on 30mph or 40mph roads. Fifty‐four percent of the older drivers
crashed on urban roads and they were most likely to be involved in a collision on A roads or
unclassified roads (46% and 33% respectively).
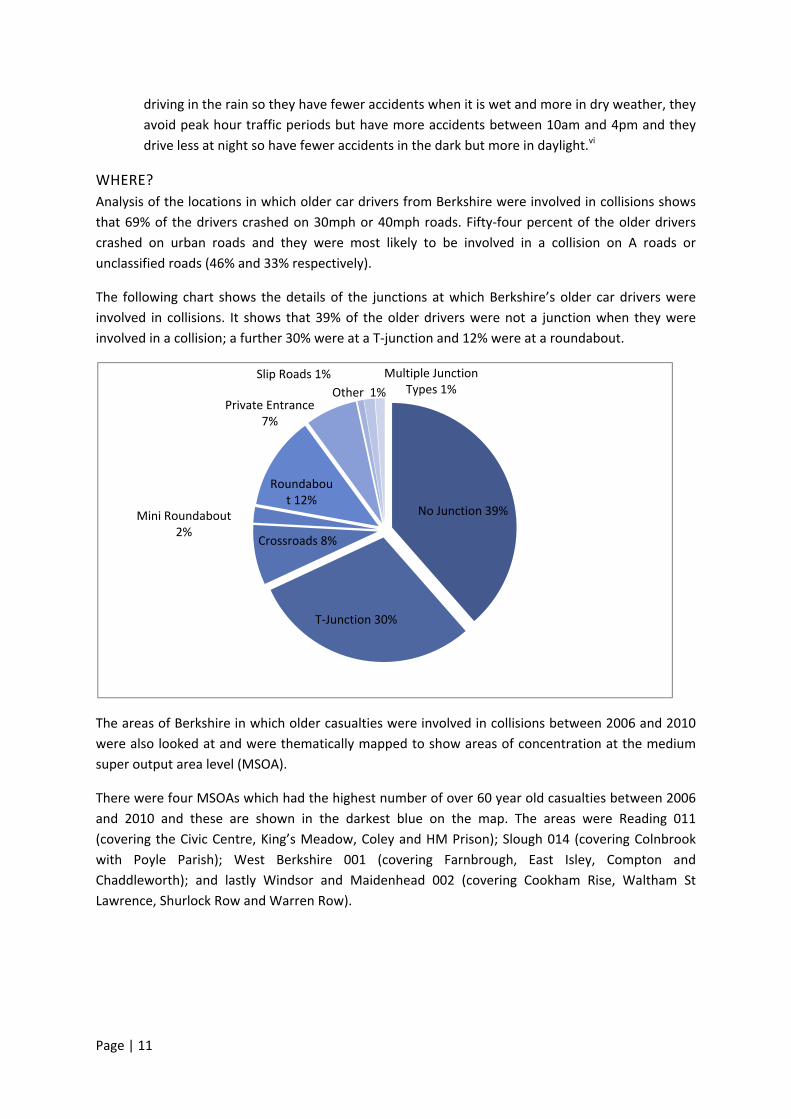
The following chart shows the details of the junctions at which Berkshire’s older car drivers were
involved in collisions. It shows that 39% of the older drivers were not a junction when they were
involved in a collision; a further 30% were at a T‐junction and 12% were at a roundabout.
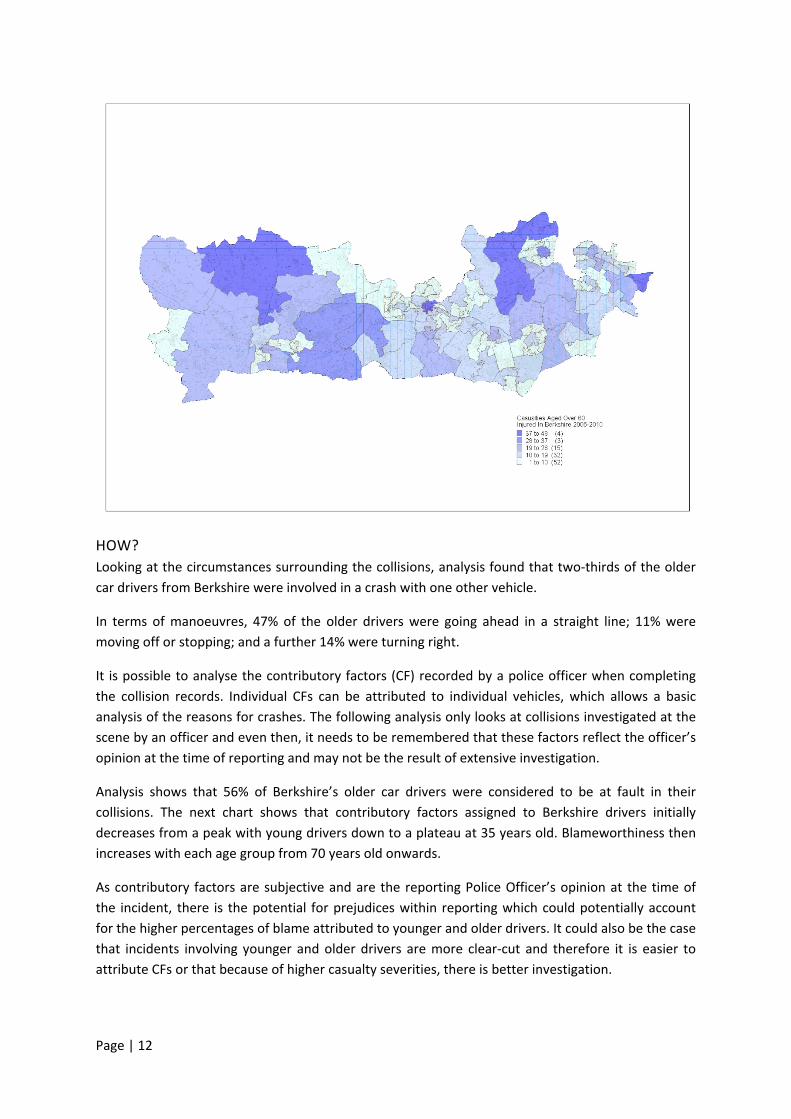
The areas of Berkshire in which older casualties were involved in collisions between 2006 and 2010
were also looked at and were thematically mapped to show areas of concentration at the medium
super output area level (MSOA).
There were four MSOAs which had the highest number of over 60 year old casualties between 2006
and 2010 and these are shown in the darkest blue on the map. The areas were Reading 011
(covering the Civic Centre, King’s Meadow, Coley and HM Prison); Slough 014 (covering Colnbrook
with Poyle Parish); West Berkshire 001 (covering Farnbrough, East Isley, Compton and
Chaddleworth); and lastly Windsor and Maidenhead 002 (covering Cookham Rise, Waltham St
Lawrence, Shurlock Row and Warren Row).
No Junction 39%
T‐Junction 30%
Crossroads 8%
Mini Roundabout 2%
Roundabout 12%
Private Entrance 7%
Multiple Junction Types 1%Other 1%
Slip Roads 1%
Page | 12
HOW?
Looking at the circumstances surrounding the collisions, analysis found that two‐thirds of the older
car drivers from Berkshire were involved in a crash with one other vehicle.
In terms of manoeuvres, 47% of the older drivers were going ahead in a straight line; 11% were
moving off or stopping; and a further 14% were turning right.
It is possible to analyse the contributory factors (CF) recorded by a police officer when completing
the collision records. Individual CFs can be attributed to individual vehicles, which allows a basic
analysis of the reasons for crashes. The following analysis only looks at collisions investigated at the
scene by an officer and even then, it needs to be remembered that these factors reflect the officer’s
opinion at the time of reporting and may not be the result of extensive investigation.
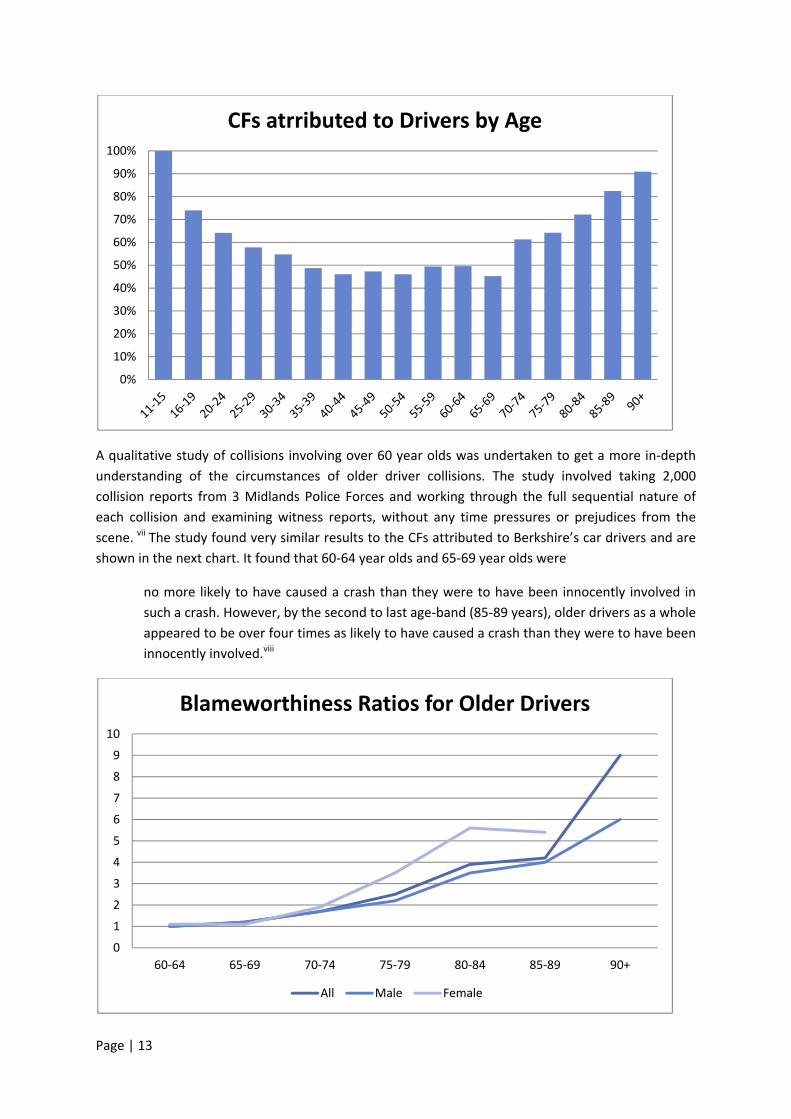
Analysis shows that 56% of Berkshire’s older car drivers were considered to be at fault in their
collisions. The next chart shows that contributory factors assigned to Berkshire drivers initially
decreases from a peak with young drivers down to a plateau at 35 years old. Blameworthiness then
increases with each age group from 70 years old onwards.
As contributory factors are subjective and are the reporting Police Officer’s opinion at the time of
the incident, there is the potential for prejudices within reporting which could potentially account
for the higher percentages of blame attributed to younger and older drivers. It could also be the case
that incidents involving younger and older drivers are more clear‐cut and therefore it is easier to
attribute CFs or that because of higher casualty severities, there is better investigation.
Page | 13
A qualitative study of collisions involving over 60 year olds was undertaken to get a more in‐depth
understanding of the circumstances of older driver collisions. The study involved taking 2,000
collision reports from 3 Midlands Police Forces and working through the full sequential nature of
each collision and examining witness reports, without any time pressures or prejudices from the
scene. vii The study found very similar results to the CFs attributed to Berkshire’s car drivers and are
shown in the next chart. It found that 60‐64 year olds and 65‐69 year olds were
no more likely to have caused a crash than they were to have been innocently involved in
such a crash. However, by the second to last age‐band (85‐89 years), older drivers as a whole
appeared to be over four times as likely to have caused a crash than they were to have been
innocently involved.viii
0%
10%
20%
30%
40%
50%
60%
70%
80%
90%
100%
CFs atrributed to Drivers by Age
0
1
2
3
4
5
6
7
8
9
10
60‐64 65‐69 70‐74 75‐79 80‐84 85‐89 90+
Blameworthiness Ratios for Older Drivers
All Male Female
Page | 14
The most common CFs attributed to older drivers were ‘Failed to look properly’ – 27%, ‘Failed to
judge other person’s path or speed’ – 12% and ‘Poor turn or manoeuvre’ – 7%.
These percentages do not differ significantly when compared to all Berkshire car drivers (21%, 12%
and 6% respectively) and therefore apart from ‘Failed to look properly’; older drivers are not
behaving particularly differently to drivers of all ages.
Two CFs which are commonly associated with older drivers are ‘Illness or disability, mental or
physical’ and ‘Uncorrected, defective eyesight’. The illness CF was assigned to 4% of older drivers
(compared to 1% of all ages of car drivers) and the eyesight CF was assigned to 1% of older drivers
(compared to 0% of all car drivers). It could be due to better reporting that these CFs are attributed
more to older drivers in that police officers are giving consideration to these factors for older drivers
and undertaking more investigation.
OLDER CAR DRIVER PROFILES
Moving away from the ‘when, where and how’ questions, we can now explore the ‘who’ question. It
is essential to understand more about the people involved in the collisions, including information
about their everyday lives, as well as demographics.
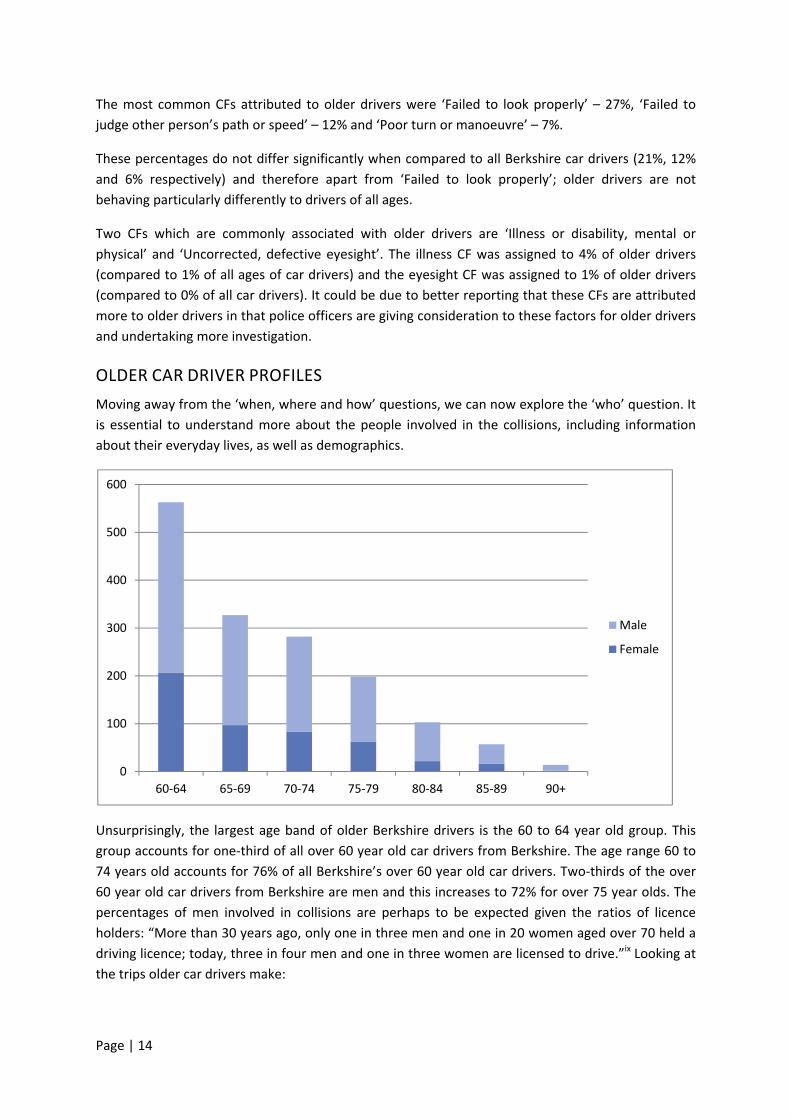
Unsurprisingly, the largest age band of older Berkshire drivers is the 60 to 64 year old group. This
group accounts for one‐third of all over 60 year old car drivers from Berkshire. The age range 60 to
74 years old accounts for 76% of all Berkshire’s over 60 year old car drivers. Two‐thirds of the over
60 year old car drivers from Berkshire are men and this increases to 72% for over 75 year olds. The
percentages of men involved in collisions are perhaps to be expected given the ratios of licence
holders: “More than 30 years ago, only one in three men and one in 20 women aged over 70 held a
driving licence; today, three in four men and one in three women are licensed to drive.”ix Looking at
the trips older car drivers make:
0
100
200
300
400
500
600
60‐64 65‐69 70‐74 75‐79 80‐84 85‐89 90+
Male
Female
Page | 15
“Men in their 60s drive for almost as many trips annually as men in their 40s and 50s;
men in their 70s make more trips as drivers than do men in their late teens and 20s
Older people rely heavily on their cars. Two thirds of trips made by men and one third by
women in their 60s are as car drivers. In their 70s, more than half of trips by men and a
fifth by women are as car drivers.
Women make far fewer trips as car drivers than men as fewer of them have a driving
licence, and men, tend to be the main car driver”x
Using the residency of Berkshire older car drivers can put the issue into context. It is a known fact
that there is an ageing population – a combination of lower birth rates and reductions in mortality
have led to a situation where there is a greater proportion of older people in the population than
younger people. “Currently in the UK around one in six of the population is aged 65 or over, and it is
predicted that by 2050 one in five will be.”xi It therefore makes sense to put collision involvement
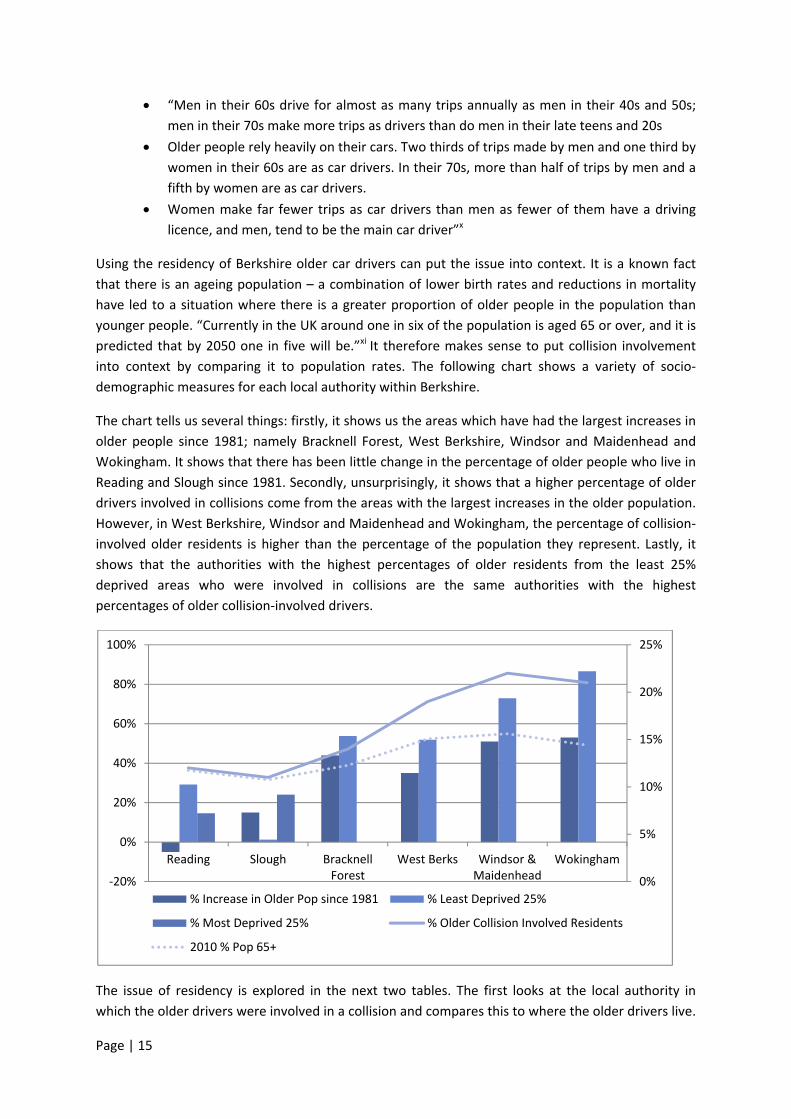
into context by comparing it to population rates. The following chart shows a variety of socio‐
demographic measures for each local authority within Berkshire.
The chart tells us several things: firstly, it shows us the areas which have had the largest increases in
older people since 1981; namely Bracknell Forest, West Berkshire, Windsor and Maidenhead and
Wokingham. It shows that there has been little change in the percentage of older people who live in
Reading and Slough since 1981. Secondly, unsurprisingly, it shows that a higher percentage of older
drivers involved in collisions come from the areas with the largest increases in the older population.
However, in West Berkshire, Windsor and Maidenhead and Wokingham, the percentage of collision‐
involved older residents is higher than the percentage of the population they represent. Lastly, it
shows that the authorities with the highest percentages of older residents from the least 25%
deprived areas who were involved in collisions are the same authorities with the highest
percentages of older collision‐involved drivers.
The issue of residency is explored in the next two tables. The first looks at the local authority in
which the older drivers were involved in a collision and compares this to where the older drivers live.
0%
5%
10%
15%
20%
25%
‐20%
0%
20%
40%
60%
80%
100%
Reading Slough BracknellForest
West Berks Windsor &Maidenhead
Wokingham
% Increase in Older Pop since 1981 % Least Deprived 25%
% Most Deprived 25% % Older Collision Involved Residents
2010 % Pop 65+
Page | 16
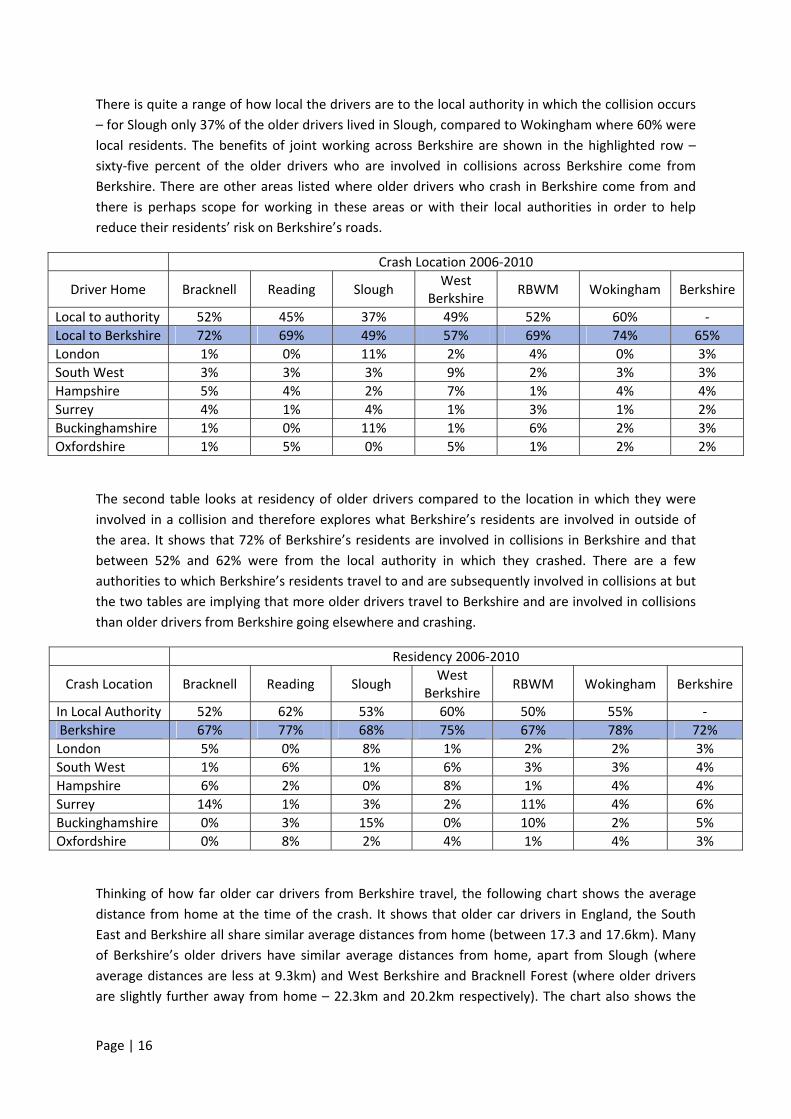
There is quite a range of how local the drivers are to the local authority in which the collision occurs
– for Slough only 37% of the older drivers lived in Slough, compared to Wokingham where 60% were
local residents. The benefits of joint working across Berkshire are shown in the highlighted row –
sixty‐five percent of the older drivers who are involved in collisions across Berkshire come from
Berkshire. There are other areas listed where older drivers who crash in Berkshire come from and
there is perhaps scope for working in these areas or with their local authorities in order to help
reduce their residents’ risk on Berkshire’s roads.
Crash Location 2006‐2010
Driver Home Bracknell Reading Slough West
Berkshire RBWM Wokingham Berkshire
Local to authority 52% 45% 37% 49% 52% 60% ‐
Local to Berkshire 72% 69% 49% 57% 69% 74% 65%
London 1% 0% 11% 2% 4% 0% 3%
South West 3% 3% 3% 9% 2% 3% 3%
Hampshire 5% 4% 2% 7% 1% 4% 4%
Surrey 4% 1% 4% 1% 3% 1% 2%
Buckinghamshire 1% 0% 11% 1% 6% 2% 3%
Oxfordshire 1% 5% 0% 5% 1% 2% 2%
The second table looks at residency of older drivers compared to the location in which they were
involved in a collision and therefore explores what Berkshire’s residents are involved in outside of
the area. It shows that 72% of Berkshire’s residents are involved in collisions in Berkshire and that
between 52% and 62% were from the local authority in which they crashed. There are a few
authorities to which Berkshire’s residents travel to and are subsequently involved in collisions at but
the two tables are implying that more older drivers travel to Berkshire and are involved in collisions
than older drivers from Berkshire going elsewhere and crashing.
Residency 2006‐2010
Crash Location Bracknell Reading Slough West
Berkshire RBWM Wokingham Berkshire
In Local Authority 52% 62% 53% 60% 50% 55% ‐
Berkshire 67% 77% 68% 75% 67% 78% 72%
London 5% 0% 8% 1% 2% 2% 3%
South West 1% 6% 1% 6% 3% 3% 4%
Hampshire 6% 2% 0% 8% 1% 4% 4%
Surrey 14% 1% 3% 2% 11% 4% 6%
Buckinghamshire 0% 3% 15% 0% 10% 2% 5%
Oxfordshire 0% 8% 2% 4% 1% 4% 3%
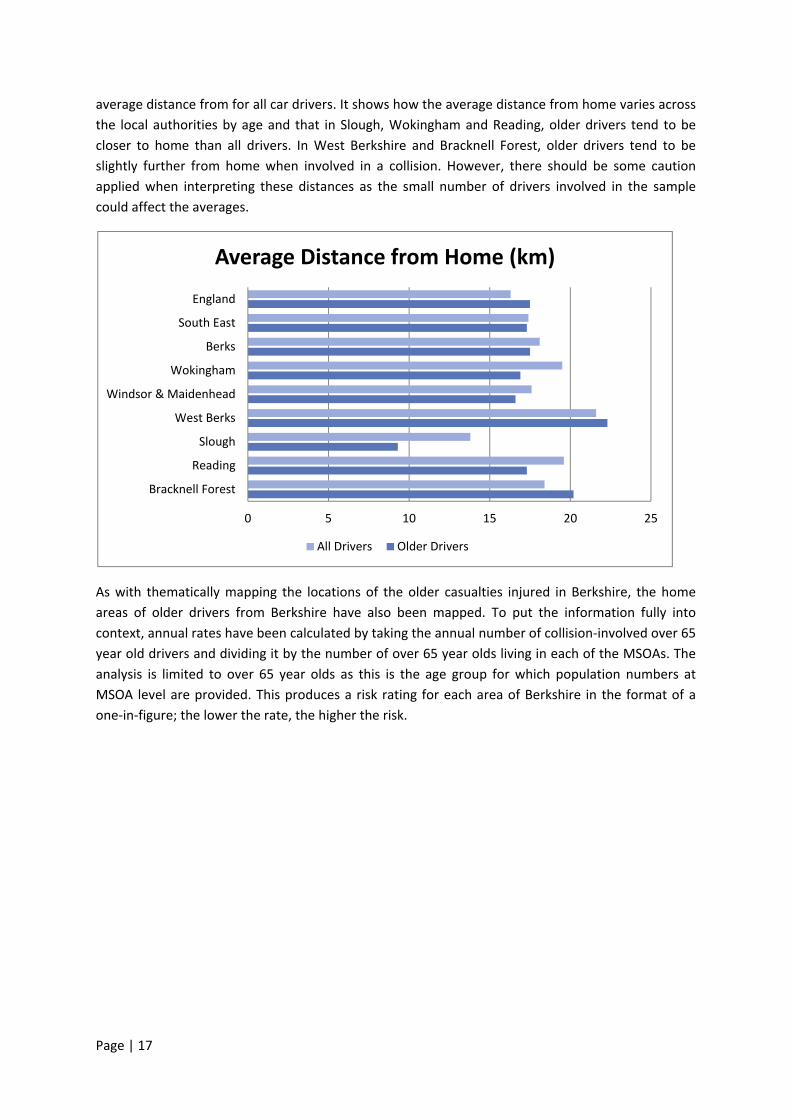
Thinking of how far older car drivers from Berkshire travel, the following chart shows the average
distance from home at the time of the crash. It shows that older car drivers in England, the South
East and Berkshire all share similar average distances from home (between 17.3 and 17.6km). Many
of Berkshire’s older drivers have similar average distances from home, apart from Slough (where
average distances are less at 9.3km) and West Berkshire and Bracknell Forest (where older drivers
are slightly further away from home – 22.3km and 20.2km respectively). The chart also shows the
Page | 17
average distance from for all car drivers. It shows how the average distance from home varies across
the local authorities by age and that in Slough, Wokingham and Reading, older drivers tend to be
closer to home than all drivers. In West Berkshire and Bracknell Forest, older drivers tend to be
slightly further from home when involved in a collision. However, there should be some caution
applied when interpreting these distances as the small number of drivers involved in the sample
could affect the averages.
As with thematically mapping the locations of the older casualties injured in Berkshire, the home
areas of older drivers from Berkshire have also been mapped. To put the information fully into
context, annual rates have been calculated by taking the annual number of collision‐involved over 65
year old drivers and dividing it by the number of over 65 year olds living in each of the MSOAs. The
analysis is limited to over 65 year olds as this is the age group for which population numbers at
MSOA level are provided. This produces a risk rating for each area of Berkshire in the format of a
one‐in‐figure; the lower the rate, the higher the risk.
0 5 10 15 20 25
Bracknell Forest
Reading
Slough
West Berks
Windsor & Maidenhead
Wokingham
Berks
South East
England
Average Distance from Home (km)
All Drivers Older Drivers

Page | 18
The areas with the highest risk are shown in the darkest green. The four areas with the lowest
annual rates, and thus the highest risks, are Wokingham 018 (covering Carter’s Hill, Arborfield and
Long Moor); Bracknell Forest 009 (covering Easthampstead Park area); Windsor and Maidenhead
001 (covering Pinkneys Green); and Wokingham 014 (covering Dowlesgreen and the south‐eastern
area of Wokingham).
Page | 19
MOSAIC ANALYSIS
As well as demographic and spatial analysis of older car drivers, we can also undertake socio‐
demographic analysis using Mosaic. Mosaic is intended to provide an accurate and comprehensive
view of citizens and their needs by describing them in terms of demographics, lifestyle, culture and
behaviour. By matching postcodes we can segment the older driver community into one of 15
groups and analyse their relative representation in the statistics based on population figures.
Mosaic analysis by age band is less accurate than looking at all ages because it uses the entire
population of a postcode for the index value, rather than the population of the same age band
within a postcode. Nevertheless it gives a good idea of relative under‐ and over‐representation.
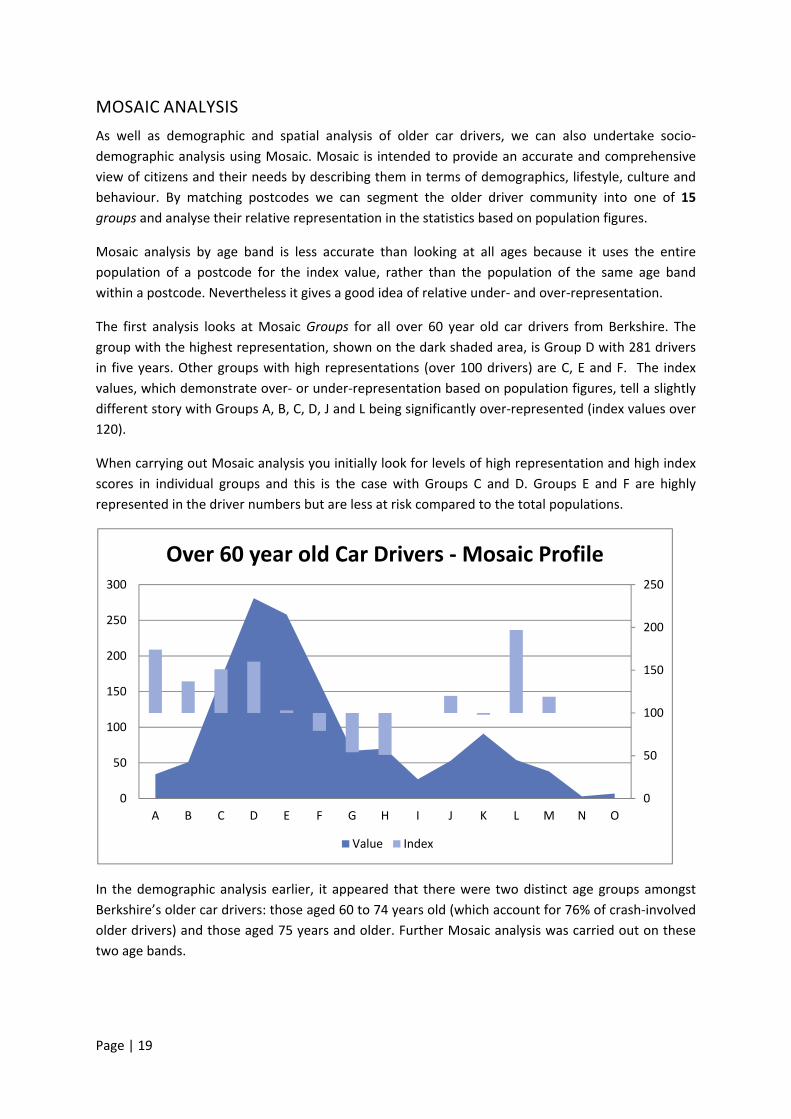
The first analysis looks at Mosaic Groups for all over 60 year old car drivers from Berkshire. The
group with the highest representation, shown on the dark shaded area, is Group D with 281 drivers
in five years. Other groups with high representations (over 100 drivers) are C, E and F. The index
values, which demonstrate over‐ or under‐representation based on population figures, tell a slightly
different story with Groups A, B, C, D, J and L being significantly over‐represented (index values over
120).
When carrying out Mosaic analysis you initially look for levels of high representation and high index
scores in individual groups and this is the case with Groups C and D. Groups E and F are highly
represented in the driver numbers but are less at risk compared to the total populations.
In the demographic analysis earlier, it appeared that there were two distinct age groups amongst
Berkshire’s older car drivers: those aged 60 to 74 years old (which account for 76% of crash‐involved
older drivers) and those aged 75 years and older. Further Mosaic analysis was carried out on these
two age bands.
0
50
100
150
200
250
0
50
100
150
200
250
300
A B C D E F G H I J K L M N O
Over 60 year old Car Drivers ‐Mosaic Profile
Value Index
Page | 20
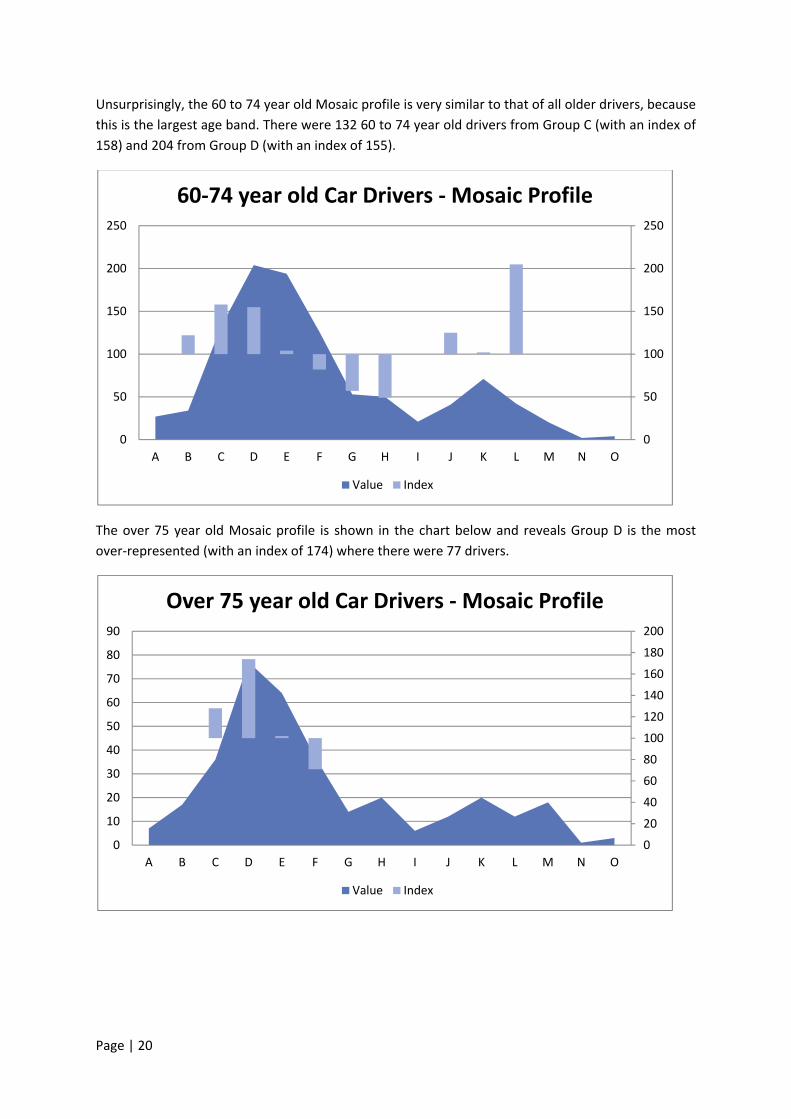
Unsurprisingly, the 60 to 74 year old Mosaic profile is very similar to that of all older drivers, because
this is the largest age band. There were 132 60 to 74 year old drivers from Group C (with an index of
158) and 204 from Group D (with an index of 155).
The over 75 year old Mosaic profile is shown in the chart below and reveals Group D is the most
over‐represented (with an index of 174) where there were 77 drivers.
0
50
100
150
200
250
0
50
100
150
200
250
A B C D E F G H I J K L M N O
60‐74 year old Car Drivers ‐Mosaic Profile
Value Index
0
20
40
60
80
100
120
140
160
180
200
0
10
20
30
40
50
60
70
80
90
A B C D E F G H I J K L M N O
Over 75 year old Car Drivers ‐Mosaic Profile
Value Index
Page | 21
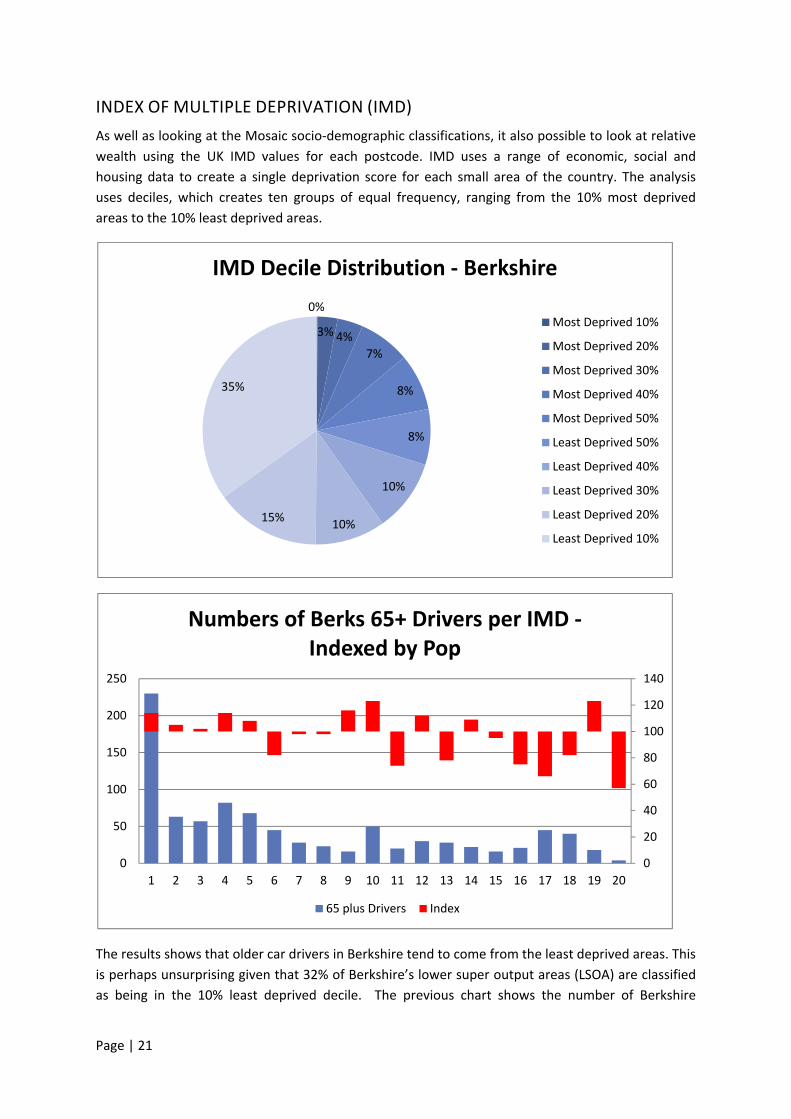
INDEX OF MULTIPLE DEPRIVATION (IMD)
As well as looking at the Mosaic socio‐demographic classifications, it also possible to look at relative
wealth using the UK IMD values for each postcode. IMD uses a range of economic, social and
housing data to create a single deprivation score for each small area of the country. The analysis
uses deciles, which creates ten groups of equal frequency, ranging from the 10% most deprived
areas to the 10% least deprived areas.
The results shows that older car drivers in Berkshire tend to come from the least deprived areas. This
is perhaps unsurprising given that 32% of Berkshire’s lower super output areas (LSOA) are classified
as being in the 10% least deprived decile. The previous chart shows the number of Berkshire
0%
3% 4%
7%
8%
8%
10%
10%15%
35%
IMD Decile Distribution ‐ Berkshire
Most Deprived 10%
Most Deprived 20%
Most Deprived 30%
Most Deprived 40%
Most Deprived 50%
Least Deprived 50%
Least Deprived 40%
Least Deprived 30%
Least Deprived 20%
Least Deprived 10%
0
20
40
60
80
100
120
140
0
50
100
150
200
250
1 2 3 4 5 6 7 8 9 10 11 12 13 14 15 16 17 18 19 20
Numbers of Berks 65+ Drivers per IMD ‐Indexed by Pop
65 plus Drivers Index

Page | 22
collision involved drivers who live in each IMD vigintile, indexed against the number of 65 plus
residents of each vigintile. These indexes are the red bars and as with Mosaic, an index of 100 shows
an over‐representation. There are more indexes of over 100 in the least deprived vigintiles than in
the most deprived ones.
A useful tool created by the Office of National Statistics is the Atlas of the Indices of Deprivation
2010 for England which maps to LSOA level the various indices of deprivation. Areas such as West
Berkshire, Wokingham and Windsor and Maidenhead are mostly shown as light blue in the Index of
Multiple Deprivation maps (as being least deprived) but when the Barriers to Services indicator is
applied, these areas have LSOAs in the most deprived quintile. This indicator includes road distances
to a GP surgery, post office, primary school and general store or supermarket and suggests a reason
for the higher collision involvement of older drivers from these local authority areas; namely being
forced to drive longer distances to access services. Screen shots of Wokingham are shown below to
demonstrate the differences between overall IMD and the Barriers to Services indicator.

Page | 23
PERSONAS
Following the analysis of risk, it is necessary to combine the elements of casualty and collision
profiling to create a person or personas which capture the key characteristics of those communities
or groups most at risk. Although a persona will not typify all, or perhaps even a majority of those
involved in collisions, it should represent a significant proportion of those who are most vulnerable.
The analysis of the socio‐demographic data as well as the collision information has allowed a picture
to be built up about the kinds of older car drivers from Berkshire who are involved in collisions. We
know that they mostly live in urban areas and are potentially self‐regulating their driving by avoiding
bad weather, darkness and higher speed limits. They may be experiencing deprivation in the form of
barriers to services. The data show that they are predominantly male. Older car drivers are often
carrying older passengers with them and therefore by targeting the drivers, there could potentially
be benefits to be gained in passenger casualty rates.
The Mosaic data has shown that there are three Groups which are over‐represented in the collision
statistics, with Group D, ‘Successful professionals living in suburban or semi‐rural homes’,
representing the largest number of drivers and a high index. It also covers both age groups of 60 to
74 years old and 75 years and older. Group C, ‘Wealthy people living in the most sought after
neighborhoods’ is over‐represented and has a high index.
Page | 24
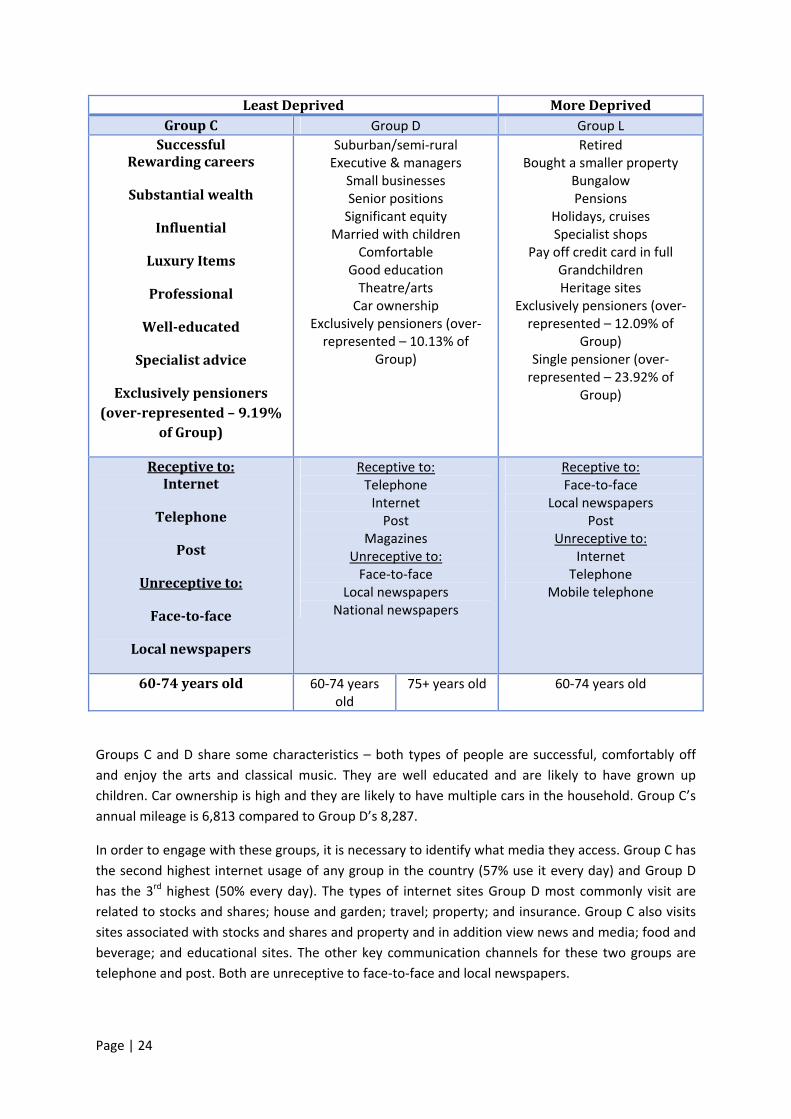
LeastDeprived MoreDeprivedGroupC Group D Group L
SuccessfulRewardingcareers
Substantialwealth
Influential
LuxuryItems
Professional
Well‐educated
Specialistadvice
Exclusivelypensioners(over‐represented–9.19%
ofGroup)
Suburban/semi‐rural Executive & managers
Small businesses Senior positions Significant equity
Married with children Comfortable
Good education Theatre/arts Car ownership
Exclusively pensioners (over‐represented – 10.13% of
Group)
Retired Bought a smaller property
Bungalow Pensions
Holidays, cruises Specialist shops
Pay off credit card in full Grandchildren Heritage sites
Exclusively pensioners (over‐represented – 12.09% of
Group) Single pensioner (over‐represented – 23.92% of
Group)
Receptiveto:Internet
Telephone
Post
Unreceptiveto:
Face‐to‐face
Localnewspapers
Receptive to: Telephone Internet Post
Magazines Unreceptive to: Face‐to‐face
Local newspapers National newspapers
Receptive to: Face‐to‐face
Local newspapers Post
Unreceptive to: Internet Telephone
Mobile telephone
60‐74yearsold 60‐74 years old
75+ years old 60‐74 years old
Groups C and D share some characteristics – both types of people are successful, comfortably off
and enjoy the arts and classical music. They are well educated and are likely to have grown up
children. Car ownership is high and they are likely to have multiple cars in the household. Group C’s
annual mileage is 6,813 compared to Group D’s 8,287.
In order to engage with these groups, it is necessary to identify what media they access. Group C has
the second highest internet usage of any group in the country (57% use it every day) and Group D
has the 3rd highest (50% every day). The types of internet sites Group D most commonly visit are
related to stocks and shares; house and garden; travel; property; and insurance. Group C also visits
sites associated with stocks and shares and property and in addition view news and media; food and
beverage; and educational sites. The other key communication channels for these two groups are
telephone and post. Both are unreceptive to face‐to‐face and local newspapers.
Page | 25
Both Groups have similar shopping patterns and both tend to shop at Sainsbury’s and Marks and
Spencer.
Group L, ‘Active elderly people living in pleasant retirement locations’, is also shown in the table.
This Group is over‐represented in the younger age group but does not represent as many drivers in
the collision statistics. However, the analysis did identify that there were some less affluent older
drivers that need to be accounted for. This group tends to be aged 60 to 74 years old and they are
less well educated or comfortably off than Groups C and D.
This Group is only likely to have one car and has an annual mileage of 5,527. They enjoy classical
music and reading books. This Group has the second lowest internet usage, with 24% using the
internet every day. Their communication preferences are face‐to‐face engagement, local
newspapers and post. They are unreceptive to the internet, telephone and mobile telephones and
so have opposite communication preferences to the other Groups.
In essence, there are 3 personas (shown in order of number of drivers they represent):
1. ‘David’ – is in his mid to late sixties and is a recently retired professional. He was successful
in his career and is wealthy. He has grown up children and the first change to his lifestyle
after retirement is spending more time caring for his grandchildren. He has multiple cars and
drives high mileage, perhaps due to habit but also to access services. He enjoys the arts and
classical music and tends to shop at Sainsbury’s and Marks and Spencer. An important
engagement tool for him is the internet and his website interests could allow the use of the
language of ‘investment and return’. There are initial post‐retirement changes to his lifestyle
and driving patterns and he will start to self‐regulate the times he drives as he gets older. He
is no more likely to have caused the collision in which he was involved than been an
innocent participant. As an educated individual, he may well be receptive to an intervention
that improves his driving awareness and his practical skills. However, as a successful person,
he will not be receptive to be lectured and as he is not more likely to have caused a crash
than people of other ages, he may question ‘what’s in it for him?’ Driver cessation is unlikely
to be a topic with him. (Between 2006 and 2010, there were 336 drivers from Berkshire
involved in collisions that fit this persona).
2. ‘Peter’ – is aged in his late seventies and is an older version of David. He specifically belongs
to Mosaic Group D. He has similar interests to David but spends less time caring for his
grandchildren as he gets older. The self‐regulation of his driving has continued but skills
errors are creeping in, possibly due to medical conditions. As his age increases, so does his
blameworthiness. He will still retain the characteristics of a successful professional and may
find the idea of ceasing driving difficult to cope with. It may be necessary to engage the
assistance of his spouse, children or doctor to persuade his to evaluate his driving skills.
(Between 2006 and 2010, there were 77 drivers from Berkshire involved in collisions that fit
this persona).
3. ‘John’ – is in his mid to late sixties and he has recently retired and bought a smaller property,
possibly a bungalow. He is likely to spend quite some time looking after his grandchildren.
He is less wealthy than David and drives fewer miles. It may be that he would be receptive to
information on alternative forms of transport (buses and cycling) for the financial benefits.
As David, he is not more likely to have been caused a collision than been innocently involved

Page | 26
and so would need to see the benefits of an intervention. He, too, will have changed his
driving patterns after retirement but may also be subject to ‘barriers to services’ deprivation
and be forced to drive. He is not receptive to the internet and instead prefers face‐to‐face
interaction: there could be a place for road safety officers to directly engage with him.
(Between 2006 and 2010, there were 42 drivers from Berkshire involved in collisions that fit
this persona).
Page | 27
ENGAGEMENT PLAN
It is important that the intervention design is regarded as offering positive support for the older
driving community and that it chimes with the lifestyle choices of the more mature driving
population.
‘Flourish’ seeks to convey a positive unfurling of the future with imagery that will chime with an
audience who have invested time and energy into home and garden.
SELF ASSESSMENT
Research shows that Self‐Assessment in older drivers encourages the process of self‐regulationxii, a
key element of the engagement plan will therefore be the development of a self‐assessment tool for
older drivers. Drawing on the work of the Royal Automobile Association of Queensland and the AAA
Foundation for Traffic Safety, the questionnaire will be delivered online and provide instant
structured feedback on areas of risk prevention and mitigation.
MANUAL FOR OLDER DRIVERS
The flourish manual will provide a distillation of advice on the issues raised by the self‐assessment
tool and that are pertinent to the older driving population in general.
The manual will be available for distribution by local authorities with a digital version presented
online.
FLOURISH COURSE
Adopting a similar approach to the DriveStart model of unified branding for a portfolio of courses
and events working alongside projects that are already underway elsewhere, Flourish branding and
exhibition materials will be made available for local authority use.
A proposed curriculum will also be developed that draws on the insights from this study and
research into other courses available elsewhere.
DRIVING ASSESSMENTS
Adopting a model similar to the ‘Be a Better Driver’ scheme in Buckinghamshire would allow driving
assessments to be carried out by Advanced Driving Instructors who have received extra training to
support older drivers.
The cost for these courses would be borne by the individual, though there would need to be a
process of training and vetting appropriate ADIs to undertake the training.
WEBSITE & APPS

Page | 28
The elements above would be underpinned by website information and possibly a smartphone
application which has been highlighted as a potential access point to informationxiii.
MESSAGES
KEY THEME
Assessment and self‐regulation is the key to safer mobility in later life
MEDIA MESSAGES
You have planned for and invested in your retirement – look after yourself to make sure it
counts
Older Drivers do a great job keeping themselves safe; we can help them even more by
training and assessment
Ill‐health & impairment increase risks; but these can be managed to keep you mobile and
active
FACTS
WHEN?
76% of all the drivers were involved in collisions between 8 am and 5pm
84% of the drivers were involved in collisions in daylight or with lighting present
WHERE?
61% were at junctions, crossroads or roundabouts
69% were on 30mph or 40mph roads
HOW?
56% of the older drivers were considered to be at fault
The most common reason was ‘Failed to look properly’
‘Poor turn or manoeuvre’ was another common contributory factor, as was ‘Failed
to judge other person’s path or speed’
MEASURES
Number of self‐assessment questionnaires completed
Number of Flourish Manuals distributed
Number of flourish courses attended
Numbers or driving assessments booked
Website traffic
Page | 29
Inputs Staff
Partners
Research
Time
Funding
Outputs # of engagement
events
# of mature drivers spoken to at events
# of Flourish manuals distributed
# of self‐assessments completed
# of courses booked
# of driving assessments booked
Short Term
Outcomes Mature drivers
spoken to at events and provided with information on safer mobility
Mature drivers encouraged to visit the Flourish website and gain more information
Mature drivers receive Flourish manual with information on safer mobility
Med
ium Term Outcomes Mature drivers undergo self‐assessment
Mature drivers attend Flourish course to discuss safer mobility
Long Term
Outcomes Mature drivers
reflect on their driving and make choices surrounding self‐regulation and skills assessing
Mature drivers undertake driving assessments
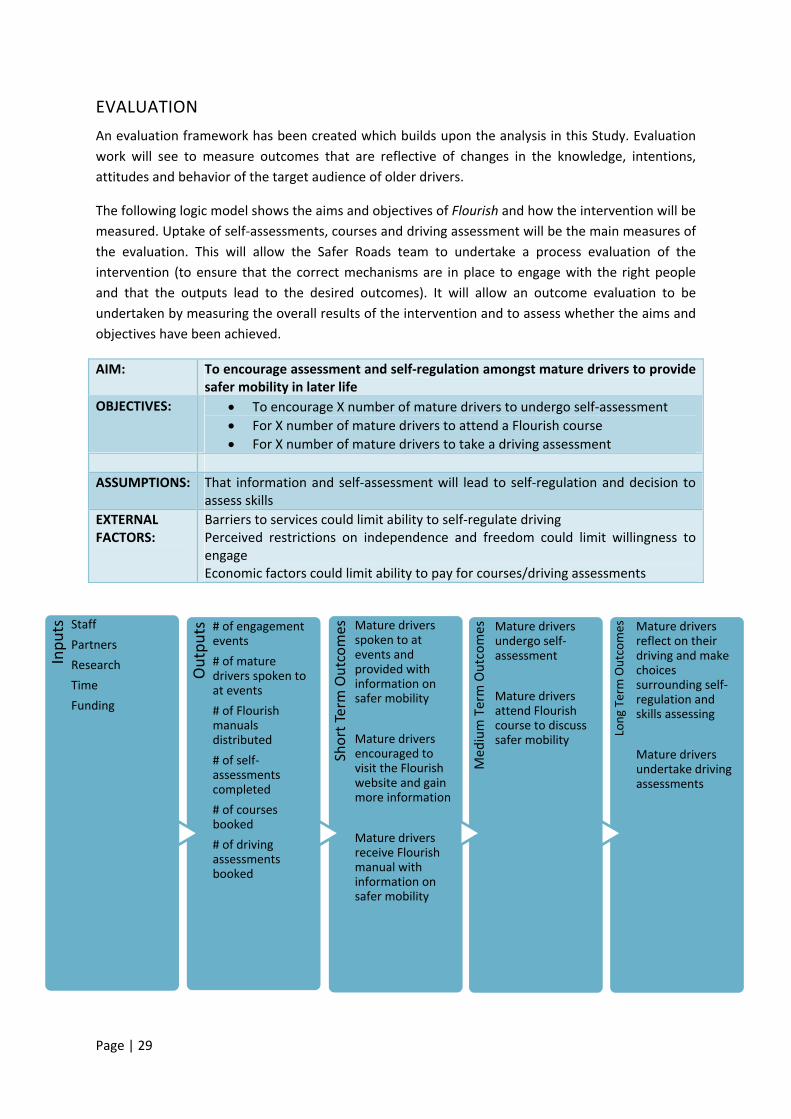
EVALUATION
An evaluation framework has been created which builds upon the analysis in this Study. Evaluation
work will see to measure outcomes that are reflective of changes in the knowledge, intentions,
attitudes and behavior of the target audience of older drivers.
The following logic model shows the aims and objectives of Flourish and how the intervention will be
measured. Uptake of self‐assessments, courses and driving assessment will be the main measures of
the evaluation. This will allow the Safer Roads team to undertake a process evaluation of the
intervention (to ensure that the correct mechanisms are in place to engage with the right people
and that the outputs lead to the desired outcomes). It will allow an outcome evaluation to be
undertaken by measuring the overall results of the intervention and to assess whether the aims and
objectives have been achieved.
AIM: To encourage assessment and self‐regulation amongst mature drivers to provide safer mobility in later life
OBJECTIVES: To encourage X number of mature drivers to undergo self‐assessment
For X number of mature drivers to attend a Flourish course
For X number of mature drivers to take a driving assessment
ASSUMPTIONS: That information and self‐assessment will lead to self‐regulation and decision to assess skills
EXTERNAL FACTORS:
Barriers to services could limit ability to self‐regulate driving Perceived restrictions on independence and freedom could limit willingness to engage Economic factors could limit ability to pay for courses/driving assessments
Page | 30
CURRENT LOCAL SCHEMES
In Berkshire, only West Berkshire Council has a current programme of engagement with older
drivers. The ‘O’ Drivers course has been promoted through a number of locations where the ‘retired
but mobile’ populous are likely to congregate; places such as garden centres. Whilst the information
has been well received and a number of bookings received attendance at the most recent course
was quite poor.
SUMMARY OF OTHER EVIDENCE AND SUCCESSFUL SCHEMES
Devon County Council’s Knowledge Transfer Partnership project with the University of Plymouth
conducted a literature review of older driving training interventions. The research found that
training interventions have focused on addressing the needs of older drivers, for example
identifying particular impairments, changing driver behaviour and knowledge and promoting
behavioural strategies to compensate for age decline. Increasing knowledge and behaviours
that will lead to safe driving is assumed to lead to a reduction in collisions. Research has
shown that the combination of on‐road training and in‐class education results in increased
awareness, driver knowledge and skills specific to driving. Older drivers have been shown to
be good candidates for in‐class education training due to their motivation to continue
driving, time to attend class and ability to acquire information in an interactive
environment.xiv
The research also found that training interventions need to be tailored to specific needs as it was
identified that women require information on driving skills and encouragement to continue driving.
Men, on the other hand, often find the idea of stopping driving harder to accept and need
information on health and age‐related limitations.xv
Driving is often seen as the most obvious choice for maintaining mobility as it gives individuals the
freedom to go where they please when they want and benefits those who can’t walk long distances
or carry shopping. Interventions should be aimed at making driving as safe as possible for as long as
possible.
The car’s status and role in modern day life can make it particularly difficult to give up
driving. This will be even harder for the younger old who are more likely to have driven all
their lives. In addition, as a result of urban planning, it is more common for them to drive to
the out of town supermarket than walk to the high street... However, although there are
many advantages to owning a car, there are also disadvantages, and many people choose
not to or simply cannot. Three quarters of single people over the age of 65 do not have a
car.xvi
As giving up driving has been linked to an increase in depression and lonelinessxvii and that mobility is
important to life satisfaction and quality of life, any intervention which might lead to the cessation of
driving should aim to make the process as easy and painless as possible.
PACTS recommends the development of a national information pack to inform and raise
awareness amongst older drivers, promote mobility, and encourage conversations and
reflections which may not have otherwise happened. Producing this content nationally

Page | 31
would ensure a research‐based approach and consistency across local authorities, and
would benefit from economies in scale….
Following on from awareness‐raising and information providing, the next stage would be
formal assessment and training. PACTS recommends the development of a national standard
course for older drivers, in line with best practice and academic research. xviii
Information which could be covered in the national information pack could be:
How to renew the driving licence and information on self‐declaration;
The potential difficulties older drivers may face and possible self‐regulation;
How vehicles can be made safer by adapting the vehicle or adding active safety devices;
Awareness of the cost of owning and driving a car;
Advice on vision and fitness to drive, particularly for those on medication or suffering from
dementia;
A self‐assessmentxix
In addition, local information could be added that includes:
Local information on transport provision/prices
Cycle map and information on bike storage facilities
A bus journey voucher – information on timetables and fares
Information on taxis with prices of example trips
EXISTING SCHEMES
The Driving Standards Agency (DSA) launched a scheme in 2002 entitled Arrive Alive Classic which
provides presentations for people aged over 50 years on topics such as complex road systems, rising
traffic volumes, effects of medication, eyesight and licensing requirements at 70 years old. The
presentation is free of charge and is conducted by an experienced, current, DSA driving examiner. It
last approximately an hour and includes a short DVD.
http://webarchive.nationalarchives.gov.uk/+/www.direct.gov.uk/en/Motoring/DriverSafety/DG_402
2428
In 2008, Norfolk County Council launched a scheme in partnership with the Department for
Transport for drivers who by age, ill health or mobility reasons would benefit from guidance and
advice via a scheme called GOLD – Guidance for the Older Driver.
The scheme coordinator visits the client in their own home and carries out an informal screening
process centred on driving and health/medical questions and eyesight screening. The client is
subsequently contacted to arrange a drive with a specialist appointed trainer, who will take the
client out in the client’s own vehicle and on roads they are familiar with. Further drivers are
arranged if necessary and advice on future mobility decisions provided if the client decides to cease
driving or they have been advised to refrain from driving, following the assessment. Discussions on
future mobility sometimes involve the client and family.
http://www.think.norfolk.gov.uk/Older‐Driver/Training‐and‐Campaigns
Page | 32
SAGE (Safer Driving with Age) is a program established by Gloucestershire County Council in 2000.
In a similar format to Norfolk’s scheme, a medication and health review is undertaken but involves
the client’s GP or practice nurse. The client must have had an eye examination in the last 12 months
and a ‘field test’ should be undertaken by their GP if the client has a medical condition which has
affected their field of view. A driving assessment is undertaken in the client’s own car, on roads they
are familiar with, with an experienced driving assessor. A written report is produced at the end of
the drive. The program is a three‐stage process and needs the buy‐in of the client’s GP or practice
nurse to complete the medical assessment. The current fee is £30 for a one hour assessment.
http://roadsafety‐gloucestershire.org.uk/wp‐content/uploads/2011/04/SAGE‐fact‐sheet.pdf
Dorset County Council provides the Dorset Driver course, which involves two elements: the first part
is a Driver Refresher Course us two hours long and is aimed at helping drivers update their
knowledge and skills through group discussions about observation, distractions, safety margins, dual
carriageways/motorways and roundabouts. The session costs £5. The optional Practical Refresher
Course lasts 90 minutes and involves the client driving their own car with an experienced driving
professional. The route usually includes town and country driving and costs £37.50.
http://www.boroughofpoole.com/transport‐and‐streets/public‐transport/drive‐55‐plus‐road‐safety‐
information/
Buckinghamshire run a similar scheme to SAGE called Be a Better Driver. It includes a driving
assessment for the cost of £35 and allows individuals to make referrals to the program, so
concerned family, friends and professionals can recommend an older driver attend.
http://www.buckscc.gov.uk/bcc/news/older_driver.page
Devon Road Casualty Reduction Partnership launched its Driving Safer for Longer (DSFL) program in
2007. An information pack and website provides information on mobility, fitness, medication,
driving tips and other travel options. The program also includes a two hour workshop and a practical
driving skills assessment. More information on the success of the scheme can be found on page 25
of Poppy Husband’s report ‘A literature review of older driving interventions: implications for the
delivery programmes by Devon County Council and Devon Road Casualty Reduction Partnership’.
http://www.devon.gov.uk/drivingsaferforlonger
Sussex Safer Roads Partnership has produced a brochure called Safer for Older Drivers which
provides extensive but clear information on eyesight, hearing, mobility and medication. It also
provides information on the law, provides suggestions for alternative modes of transport and how to
calculate the yearly cost of motoring. The brochure provides information on their Experienced Driver
Assessment, which involves the client undertaking a 45 minute driving assessment in their own car,
in a similar format to other schemes.
http://www.sussexsaferroads.gov.uk/safer‐for‐older‐drivers.html
Page | 33
i Baster, N., It’s my choice – Safer mobility for an ageing population, Parliamentary Advisory Council for Transport Safety, 2012, p.3 ii http://www.roadsafetyevaluation.com iii Box, Gandolfi and Mitchell, Maintaining safe mobility for the ageing population, RAC Foundation, April 2010, p. 15 iv Baster, N., , p.3 v Examples of older pedestrians (or disabled people) injured by older drivers are included below: http://www.thisishullandeastriding.co.uk/Beverley‐woman‐87‐dies‐hit‐elderly‐neighbour‐s‐car/story‐11955459‐detail/story.html http://www.telegraph.co.uk/news/uknews/crime/7951296/Elderly‐driver‐who‐killed‐disabled‐woman‐walks‐free‐from‐court.html http://www.stornowaygazette.co.uk/news/elderly‐driver‐being‐questioned‐after‐suspected‐hit‐and‐run‐1‐2140959 http://www.dailyrecord.co.uk/news/scottish‐news/2012/03/25/driver‐who‐ran‐over‐and‐killed‐fisherman‐hits‐pedestrian‐on‐skye‐s‐only‐zebra‐crossing‐86908‐23801187/ vi Hopkin, J., Older Drivers – Safe or unsafe?, IAM Motoring Trust, 2010, P.3 vii Clarke, D., Ward, P., Truman, W., and Bartle, C., Collisions Involving Older Drivers: An In‐depth Study, Department for Transport, September 2009, p. 11 viii ibid., p. 16 ix Hopkin, p. 4 x ibid., p. 5 xi Baster, N., p.3 xii Berry, ‘Can Older Drivers be Nudged?’ 2011, Pg 38 xiii ibid., p.39 xiv Husband, P., A literature review of older driving training interventions: implications for the delivery programmes by Devon County Council and Devon Road Casualty Reduction Partnership, 2010, p. 5 xv Baster, N., p.30 xvi ibid., p. 34 xvii ibid., p.35 xviii ibid., p.45 xix ibid., p.45