oklahoma state university biosystems and agricultural engineering department hydrology 101 oklahoma...
TRANSCRIPT
OKLAHOMA STATE UNIVERSITYBiosystems and Agricultural Engineering Department
Hydrology 101
Hydrology 101
OKLAHOMA STATE UNIVERSITYBiosystems and Agricultural Engineering Department
Hydrology 101
Jason R. Vogel, Ph.D., P.E.
Biosystems and Agricultural Engineering
Oklahoma State University

OKLAHOMA STATE UNIVERSITYBiosystems and Agricultural Engineering Department
Hydrology 101
Where is the water?
Oceans and Saline Ground Water
97%
Polar Ice69%
Ground Water30%
Just 0.01% is in All Rivers, Lakes, and Wetlands
OKLAHOMA STATE UNIVERSITYBiosystems and Agricultural Engineering Department
Hydrology 101
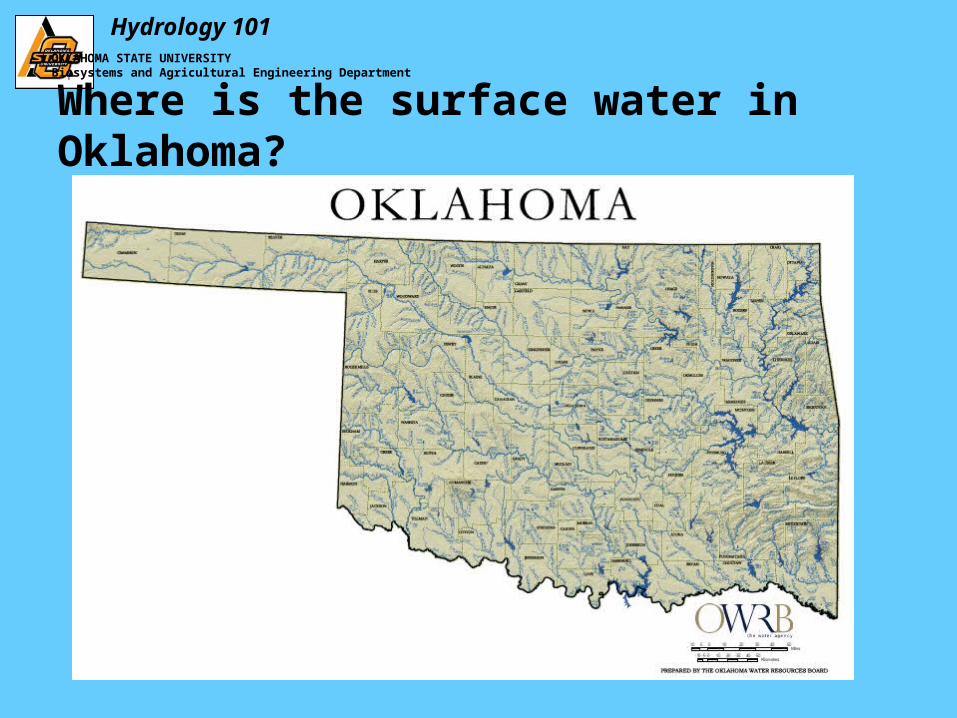
Where is the surface water in Oklahoma?
OKLAHOMA STATE UNIVERSITYBiosystems and Agricultural Engineering Department
Hydrology 101
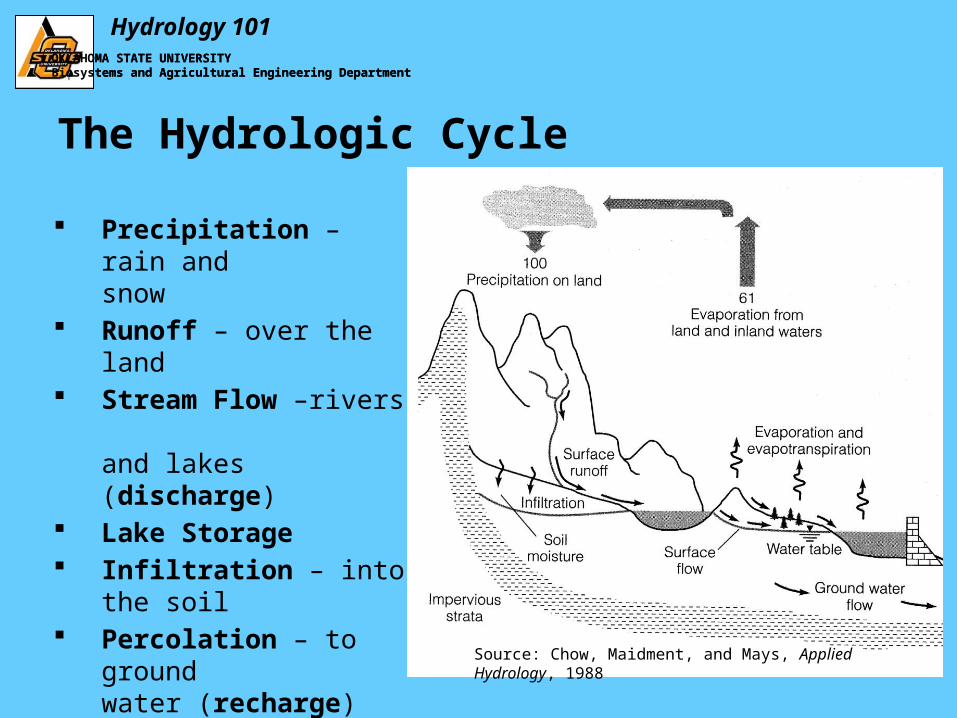
The Hydrologic Cycle
Precipitation – rain and snow
Runoff – over the land Stream Flow –rivers
and lakes (discharge) Lake Storage Infiltration – into the soil Percolation – to ground
water (recharge) Evaporation and
Evapotranspiration
OKLAHOMA STATE UNIVERSITYBiosystems and Agricultural Engineering Department
Source: Chow, Maidment, and Mays, Applied Hydrology, 1988

OKLAHOMA STATE UNIVERSITYBiosystems and Agricultural Engineering Department
Hydrology 101
A Watershed is all the land that drains to one point on the landscape.
If rain falls inside the watershed boundary, it flows toward thewatershed outlet.
P is precipitation
OKLAHOMA STATE UNIVERSITYBiosystems and Agricultural Engineering Department
Hydrology 101
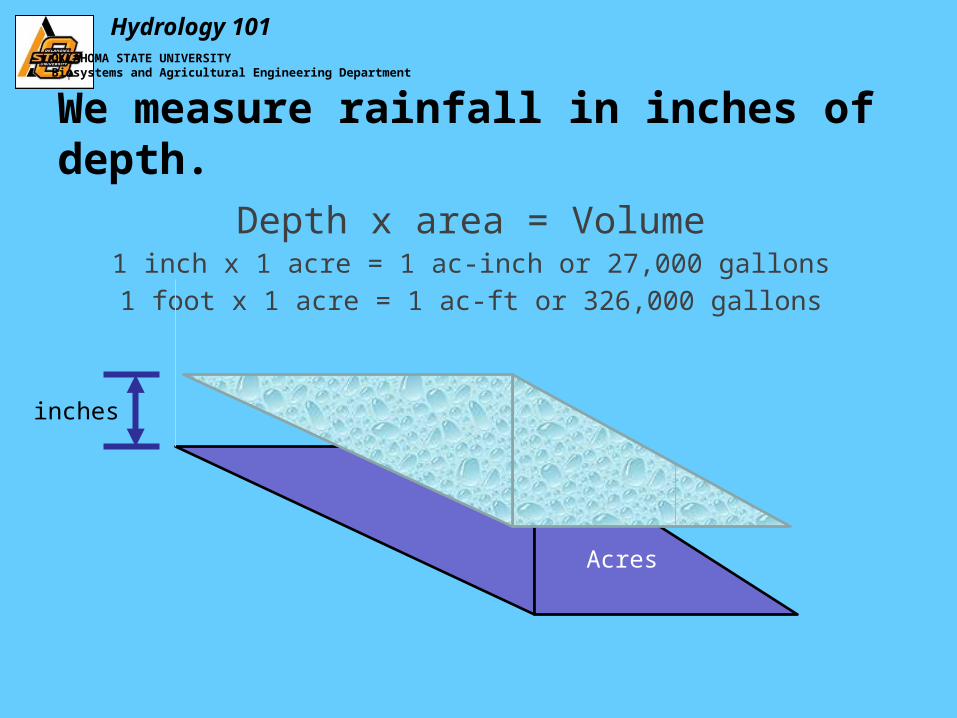
We measure rainfall in inches of depth.
Depth x area = Volume1 inch x 1 acre = 1 ac-inch or 27,000 gallons
1 foot x 1 acre = 1 ac-ft or 326,000 gallons
Acres
inches

OKLAHOMA STATE UNIVERSITYBiosystems and Agricultural Engineering Department
Hydrology 101
Precipitation in Oklahoma in 2008
62 inches
12.5 inches

OKLAHOMA STATE UNIVERSITYBiosystems and Agricultural Engineering Department
Hydrology 101
Evapotranspiration (ET) is evaporation plus transpiration
ET is water that goes back to the atmosphere.
Evapotranspiration

OKLAHOMA STATE UNIVERSITYBiosystems and Agricultural Engineering Department
Hydrology 101
• Evapotranspiration – – Evaporation from rivers, lakes, bare soil, and
vegetative surfaces– Evapotranspiration pumps water out of the
ground through plant roots and leaves.
• The largest part of thehydrologic cycle (globallyabout 62% of rainfallreturns directly to the atmosphere).
OKLAHOMA STATE UNIVERSITYBiosystems and Agricultural Engineering Department
Introduction to Hydrology
Evaporation/Evapotranspiration
OKLAHOMA STATE UNIVERSITYBiosystems and Agricultural Engineering Department
Hydrology 101
Potential ET and Actual ET• Lake Evaporation – close to Potential ET• Potential ET (PET) – ET for a well-watered
reference crop (turf grass or alfalfa)• PET depends on the evaporative demand
of the atmosphere• air temperature, relative humidity, solar
radiation, wind speed
• PET always exceeds Actual ET
OKLAHOMA STATE UNIVERSITYBiosystems and Agricultural Engineering Department
Introduction to Hydrology

OKLAHOMA STATE UNIVERSITYBiosystems and Agricultural Engineering Department
Hydrology 101
Actual ET• Actual ET depends on how much water
there is and what plants are involved.
OKLAHOMA STATE UNIVERSITYBiosystems and Agricultural Engineering Department
Introduction to Hydrology

OKLAHOMA STATE UNIVERSITYBiosystems and Agricultural Engineering Department
Hydrology 101
Annual Average PET

OKLAHOMA STATE UNIVERSITYBiosystems and Agricultural Engineering Department
Hydrology 101
Surface Water and Watersheds
A Watershed is all the land that drains to one point on the landscape.
OKLAHOMA STATE UNIVERSITYBiosystems and Agricultural Engineering Department
Watershed Divide or Boundary
Watershed Outlet

OKLAHOMA STATE UNIVERSITYBiosystems and Agricultural Engineering Department
Hydrology 101
Runoff and Stream Flow (Q)
Runoff and Stream Flow
Discharge, Q, is measured in cubic feet/second (cfs)
OKLAHOMA STATE UNIVERSITYBiosystems and Agricultural Engineering Department
Hydrology 101
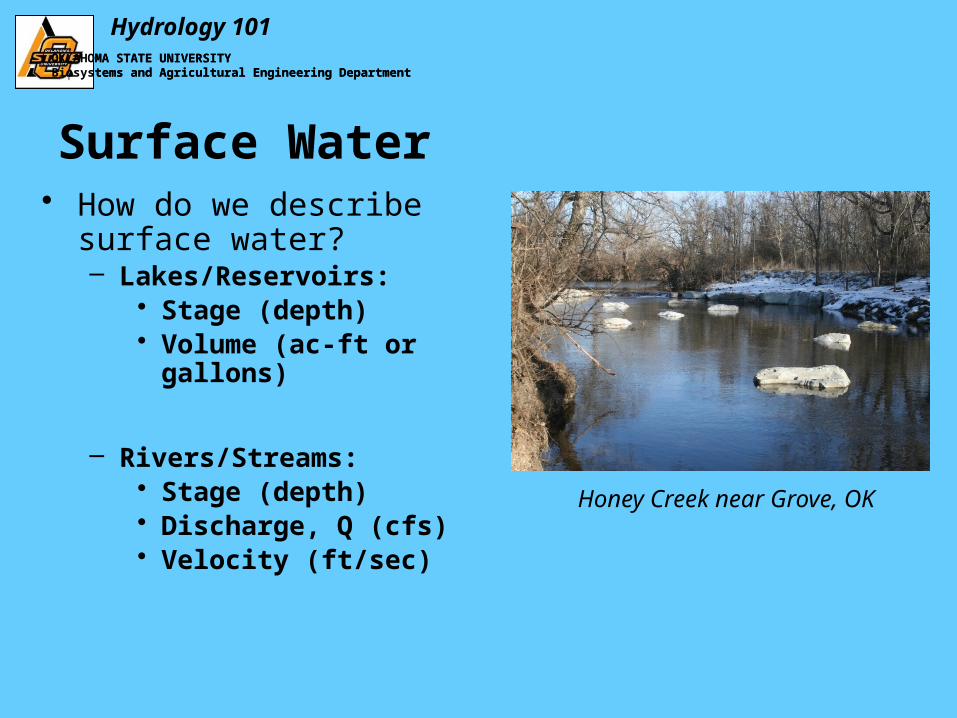
Surface Water• How do we describe surface
water?– Lakes/Reservoirs:
• Stage (depth)• Volume (ac-ft or gallons)
– Rivers/Streams:• Stage (depth)• Discharge, Q (cfs)• Velocity (ft/sec)
OKLAHOMA STATE UNIVERSITYBiosystems and Agricultural Engineering Department
Honey Creek near Grove, OK

OKLAHOMA STATE UNIVERSITYBiosystems and Agricultural Engineering Department
Hydrology 101OKLAHOMA STATE UNIVERSITYBiosystems and Agricultural Engineering Department
Hydrograph – stream stage (ft)
11.0 ft of Stage
4.0 ft of Stage
http://waterdata.usgs.gov/nwis
OKLAHOMA STATE UNIVERSITYBiosystems and Agricultural Engineering Department
Hydrology 101
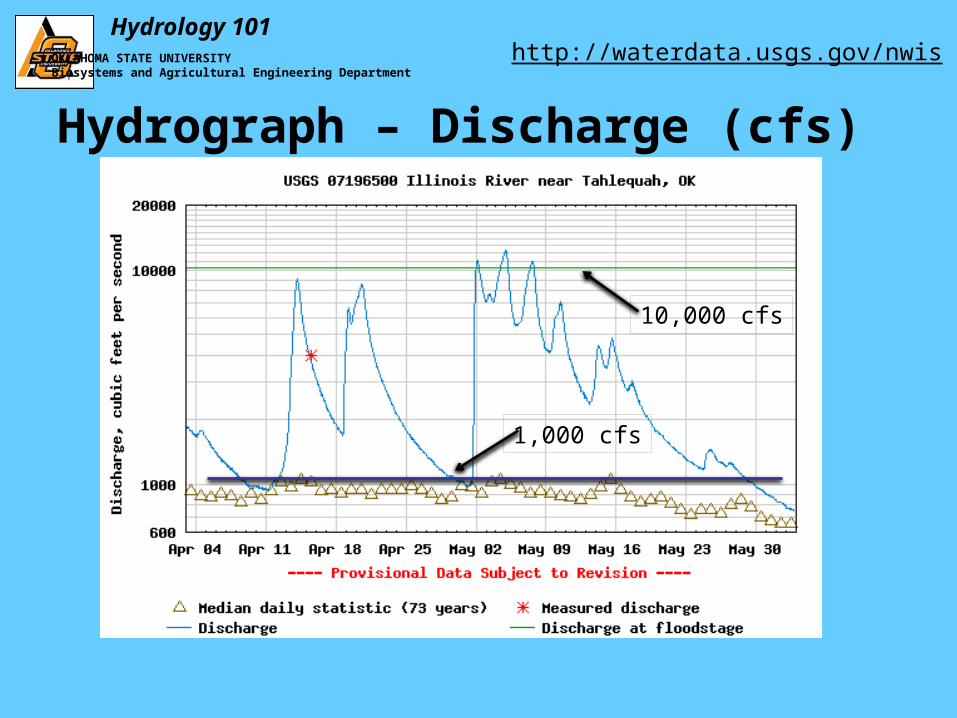
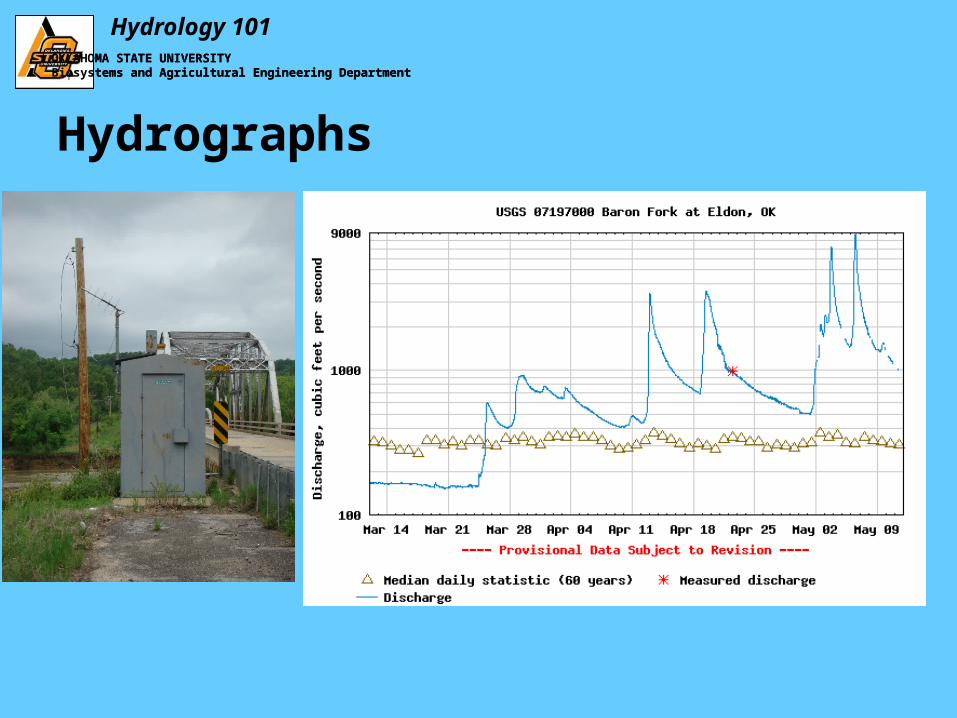
Hydrograph – Discharge (cfs)
10,000 cfs
1,000 cfs
http://waterdata.usgs.gov/nwis

OKLAHOMA STATE UNIVERSITYBiosystems and Agricultural Engineering Department
Hydrology 101OKLAHOMA STATE UNIVERSITYBiosystems and Agricultural Engineering Department
Hydrograph and Rainfall
http://waterdata.usgs.gov/nwis
4 inch Rain
OKLAHOMA STATE UNIVERSITYBiosystems and Agricultural Engineering Department
Hydrology 101
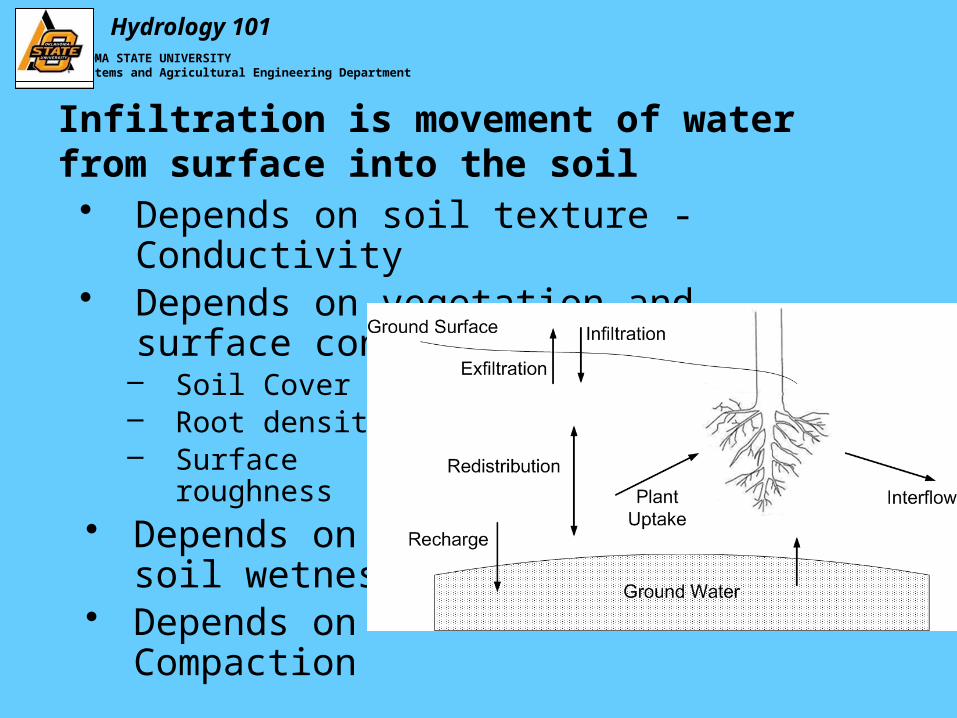
• Depends on soil texture - Conductivity• Depends on vegetation and surface
conditions– Soil Cover – Root density– Surface
roughness• Depends on
soil wetness• Depends on
Compaction
Infiltration is movement of water from surface into the soil
OKLAHOMA STATE UNIVERSITYBiosystems and Agricultural Engineering Department
Hydrology 101
Infiltration
OKLAHOMA STATE UNIVERSITYBiosystems and Agricultural Engineering Department
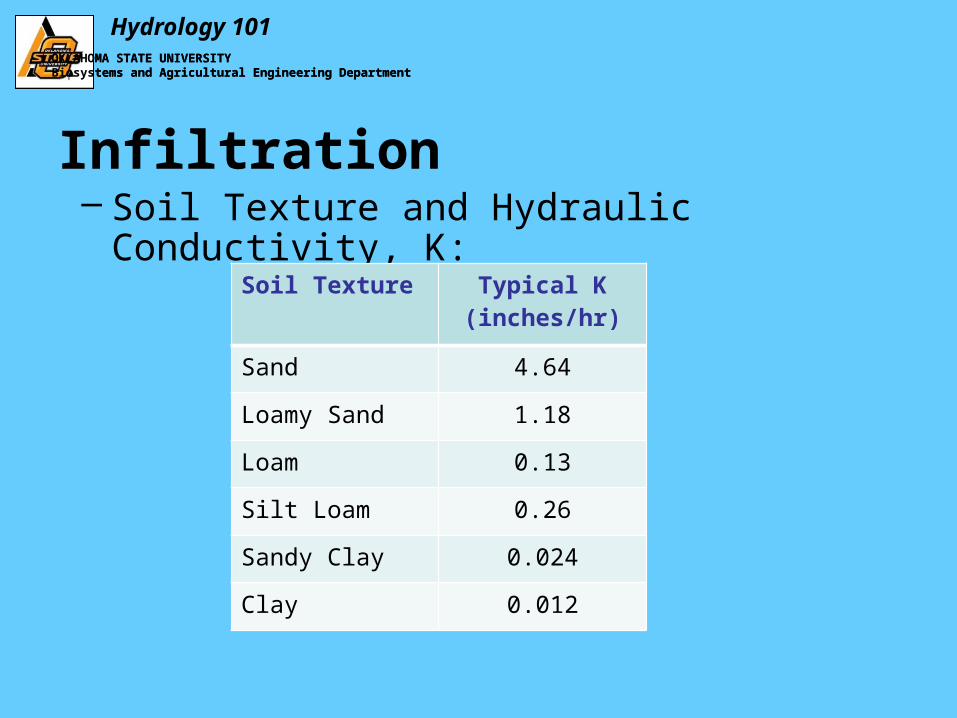
– Soil Texture and Hydraulic Conductivity, K:
Soil Texture Typical K (inches/hr)
Sand 4.64
Loamy Sand 1.18
Loam 0.13
Silt Loam 0.26
Sandy Clay 0.024
Clay 0.012
OKLAHOMA STATE UNIVERSITYBiosystems and Agricultural Engineering Department
Hydrology 101
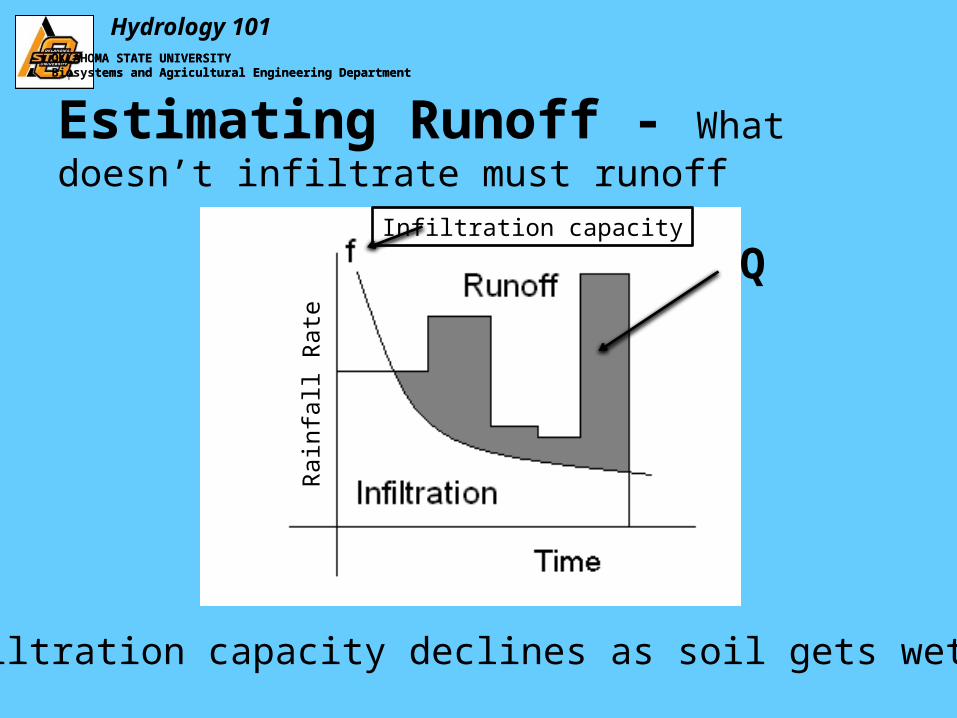
Estimating Runoff - What doesn’t infiltrate must runoff
OKLAHOMA STATE UNIVERSITYBiosystems and Agricultural Engineering Department
Q
Infiltration capacity declines as soil gets wetter
Infiltration capacity
Rai
nfal
l Rat
e

OKLAHOMA STATE UNIVERSITYBiosystems and Agricultural Engineering Department
Hydrology 101
– Amount of runoff depends on land cover• Can be quantified through runoff coefficient…
Runoff
OKLAHOMA STATE UNIVERSITYBiosystems and Agricultural Engineering Department
Description Runoff Coefficient
Pavement:Asphalt, Concrete 0.70-0.95
Lawns, sand soil:2% (Flat)>7% (Steep)
0.05-0.100.15-0.20
Residential:Single FamilyApartments
0.30-0.500.50-0.70

OKLAHOMA STATE UNIVERSITYBiosystems and Agricultural Engineering Department
Hydrology 101
Hydrographs
OKLAHOMA STATE UNIVERSITYBiosystems and Agricultural Engineering Department
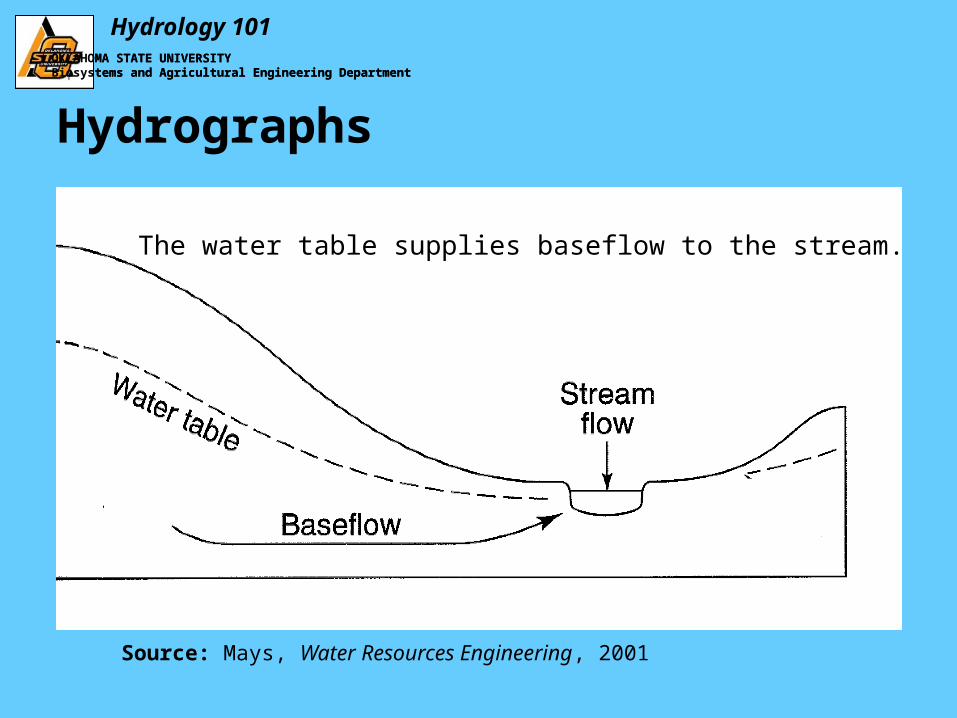
Source: Mays, Water Resources Engineering, 2001
Peak runoff rate
Surface Runoffnoff
OKLAHOMA STATE UNIVERSITYBiosystems and Agricultural Engineering Department
Hydrology 101
Hydrographs
OKLAHOMA STATE UNIVERSITYBiosystems and Agricultural Engineering Department
Source: Mays, Water Resources Engineering, 2001
The water table supplies baseflow to the stream.
OKLAHOMA STATE UNIVERSITYBiosystems and Agricultural Engineering Department
Hydrology 101OKLAHOMA STATE UNIVERSITYBiosystems and Agricultural Engineering Department
Hydrographs

OKLAHOMA STATE UNIVERSITYBiosystems and Agricultural Engineering Department
Hydrology 101
Shape of the hydrograph also depends on…
OKLAHOMA STATE UNIVERSITYBiosystems and Agricultural Engineering Department
• Temporal distribution of rainfall• Impervious areas of the watershed• Ponds, diversions, and flood control structures
Source: Mays, Water Resources Engineering, 2001

OKLAHOMA STATE UNIVERSITYBiosystems and Agricultural Engineering Department
Hydrology 101
Shape of the hydrograph depends on construction, compaction, and impervious area.
OKLAHOMA STATE UNIVERSITYBiosystems and Agricultural Engineering Department
Source: Mays, Water Resources Engineering, 2001
Before
Impervious Area After construction

OKLAHOMA STATE UNIVERSITYBiosystems and Agricultural Engineering Department
Hydrology 101
Loads and Concentrations
• Concentration is measured as parts per million or mg/L.
• Load is the quantity of material per unit time – it is measured in Pounds/Day, Tons/Year, Kilograms/hour, grams/second.
• To measure load, you need both a concentration and flow rate:
Load = Concentration x Discharge
OKLAHOMA STATE UNIVERSITYBiosystems and Agricultural Engineering Department
Hydrology 101
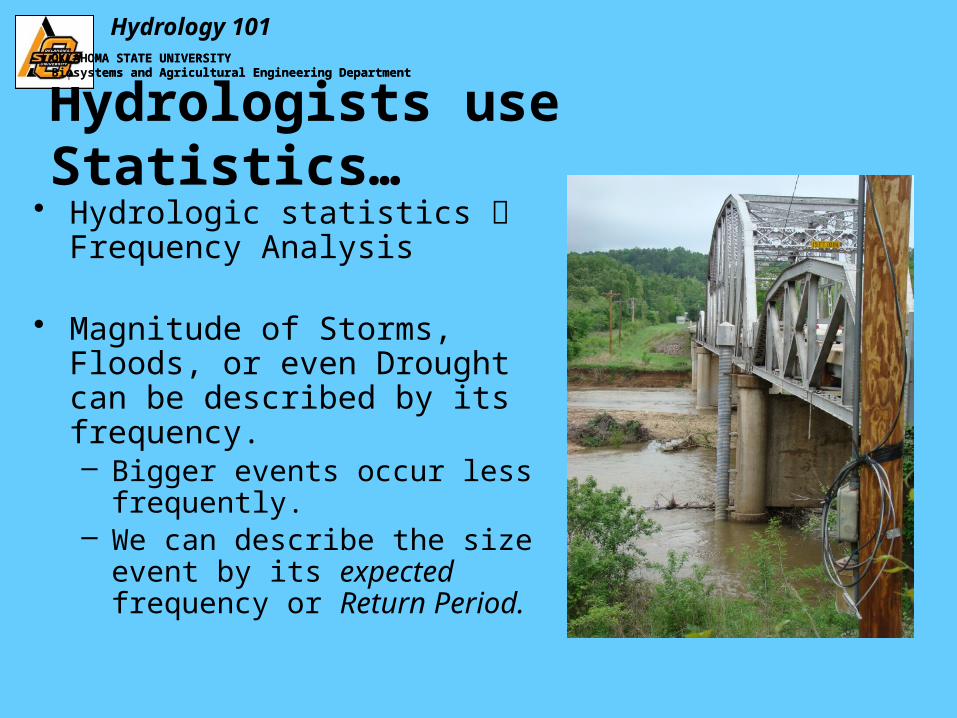
Hydrologists use Statistics…• Hydrologic statistics Frequency
Analysis
• Magnitude of Storms, Floods, or even Drought can be described by its frequency.– Bigger events occur less
frequently.– We can describe the size event
by its expected frequency or Return Period.
OKLAHOMA STATE UNIVERSITYBiosystems and Agricultural Engineering Department
OKLAHOMA STATE UNIVERSITYBiosystems and Agricultural Engineering Department
Hydrology 101
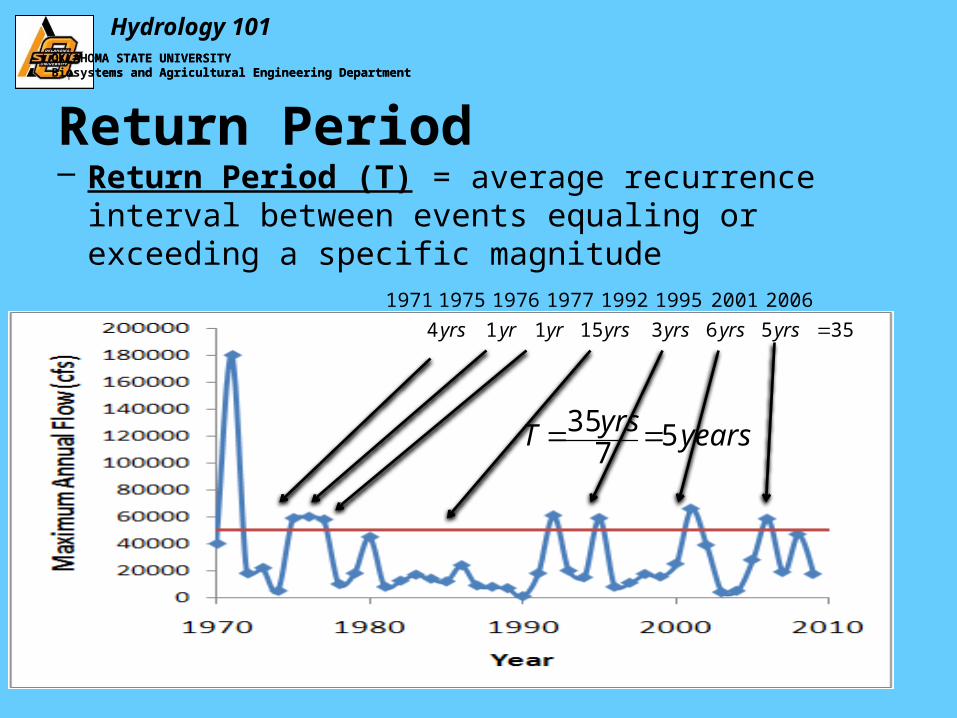
Return Period– Return Period (T) = average recurrence interval between
events equaling or exceeding a specific magnitude
OKLAHOMA STATE UNIVERSITYBiosystems and Agricultural Engineering Department
yearsyrsT
yrsyrsyrsyrsyryryrs
57
35
3556315114
20062001199519921977197619751971

OKLAHOMA STATE UNIVERSITYBiosystems and Agricultural Engineering Department
Hydrology 101
Return Period – another way to look at it
The probability of an event is the inverse of its return period.
• A10-yr storm has 1/10 or 10% chance of occurring in any given year.
• A 100-yr storm has 1% chance.
Note: a 500-yr storm is bigger than a 100-yr storm, but it may not be much bigger.
…and return period is estimated from the period of record – but we do not know the future.

OKLAHOMA STATE UNIVERSITYBiosystems and Agricultural Engineering Department
Hydrology 101
Hydrologic Considerations for Water Quality
• Everything in the watershed affects water quality, but not everything is equally effective.– Most pollutants travel with water – how much water determines
when and how much the pollutants arrive.– Some water infiltrates the soil – and takes pollutants with it.– Some pollutants break down or become stabilized before they
reach the water body.– Some pollutants originate near or in the stream (these are the
first concern).
OKLAHOMA STATE UNIVERSITYBiosystems and Agricultural Engineering Department
Hydrology 101
Hydrologic Considerations for Water Quality
• Nonpoint pollution is dependent on rainfall frequency (probability)– Does not occur every day– Magnitude of rainfall varies– Consider the return period or probability of occurrence
• Impervious areas transmit pollutants more effectively than areas where infiltration occurs.
• Roads make very efficient channels –carry water and pollutants.