oil spill rse2005
TRANSCRIPT
8/6/2019 Oil Spill RSE2005
http://slidepdf.com/reader/full/oil-spill-rse2005 1/13
Review
Oil spill detection by satellite remote sensing
Camilla Brekkea,b,*, Anne H.S. Solberg b
a Norwegian Defence Research Establishment, Postboks 25, 2027 Kjeller, Norway b Department of Informatics, University of Oslo, Postboks 1080 Blindern, 0316 Oslo, Norway
Received 3 September 2004; received in revised form 11 November 2004; accepted 17 November 2004
Abstract
This paper presents the state of the art for oil spill detection in the world oceans. We discuss different satellite sensors and oil spill
detectability under varying conditions. In particular, we concentrate on the use of manual and automatic approaches to discriminate between
oil slicks and look-alikes based on pattern recognition. We conclude with a discussion of suggestions for further research with respect to oil
spill detection systems.
D 2004 Elsevier Inc. All rights reserved.
Keywords: Synthetic aperture radar; Oil spill; Detectability; Manual detection; Automatic algorithms; Dark spot detection; Feature extraction; Classification
Contents
1. Introduction. . . . . . . . . . . . . . . . . . . . . . . . . . . . . . . . . . . . . . . . . . . . . . . . . . . . . . . . . . . . . 1
2. Satellite sensors for oil spill detection . . . . . . . . . . . . . . . . . . . . . . . . . . . . . . . . . . . . . . . . . . . . . . . 2
3. Detectability of oil spills in SAR images . . . . . . . . . . . . . . . . . . . . . . . . . . . . . . . . . . . . . . . . . . . . . . 43.1. Discrimination between oil spills and look-alikes. . . . . . . . . . . . . . . . . . . . . . . . . . . . . . . . . . . . . . 4
3.2. The wind vector. . . . . . . . . . . . . . . . . . . . . . . . . . . . . . . . . . . . . . . . . . . . . . . . . . . . . . . 5
3.3. Satellite configurations for oil spill detection . . . . . . . . . . . . . . . . . . . . . . . . . . . . . . . . . . . . . . . . 6
3.4. Speckle noise . . . . . . . . . . . . . . . . . . . . . . . . . . . . . . . . . . . . . . . . . . . . . . . . . . . . . . . . 7
4. Methodology for oil spill detection in SAR images . . . . . . . . . . . . . . . . . . . . . . . . . . . . . . . . . . . . . . . . 7
4.1. Manual inspection. . . . . . . . . . . . . . . . . . . . . . . . . . . . . . . . . . . . . . . . . . . . . . . . . . . . . . 7
4.2. Manual detection compared to automatic detection . . . . . . . . . . . . . . . . . . . . . . . . . . . . . . . . . . . . . 7
4.3. Design issues for automatic detection systems . . . . . . . . . . . . . . . . . . . . . . . . . . . . . . . . . . . . . . . 8
5. Automatic techniques for oil spill detection in SAR images . . . . . . . . . . . . . . . . . . . . . . . . . . . . . . . . . . . . 8
5.1. Segmentation techniques . . . . . . . . . . . . . . . . . . . . . . . . . . . . . . . . . . . . . . . . . . . . . . . . . . 8
5.2. Slick feature extraction . . . . . . . . . . . . . . . . . . . . . . . . . . . . . . . . . . . . . . . . . . . . . . . . . . . 9
5.3. Classification methods . . . . . . . . . . . . . . . . . . . . . . . . . . . . . . . . . . . . . . . . . . . . . . . . . . . 10
6. Conclusion and suggestions for further work. . . . . . . . . . . . . . . . . . . . . . . . . . . . . . . . . . . . . . . . . . . . 11
Acknowledgements . . . . . . . . . . . . . . . . . . . . . . . . . . . . . . . . . . . . . . . . . . . . . . . . . . . . . . . . . . . 11References . . . . . . . . . . . . . . . . . . . . . . . . . . . . . . . . . . . . . . . . . . . . . . . . . . . . . . . . . . . . . . . . 12
1. Introduction
Oil spills on the sea surface are seen relatively often.
Observed oil spills correlate very well with the major
shipping routes (e.g. in the Southeast Asian Waters (Lu,
0034-4257/$ - see front matter D 2004 Elsevier Inc. All rights reserved.
doi:10.1016/j.rse.2004.11.015
* Corresponding author. Norwegian Defence Research Establishment,
Postboks 25, 2027 Kjeller, Norway. Tel.: +47 63 80 72 31; fax: +47 63 80
72 12.
E-mail address: [email protected] (C. Brekke).
Remote Sensing of Environment 95 (2005) 1–13
www.elsevier.com/locate/rse
8/6/2019 Oil Spill RSE2005
http://slidepdf.com/reader/full/oil-spill-rse2005 2/13
2003; Lu et al., 1999), and in the Yellow and East China Sea
(Ivanov et al., 2002) and commonly appear in connection
with offshore installations (e.g. in the North Sea (Espedal &
Johannessen, 2000). Annually, 48% of the oil pollution in
the oceans are fuels and 29% are crude oil. Tanker accidents
contribute wit h only 5% of all pollution entering into the sea
(Fingas, 2001). After analysing 190 ERS-11 SAR images of the Mediterranean Sea, Pavlakis et al. (1996) found that
bdeliberate Q oil spills appear with considerably higher
frequency than oil spills corresponding to reported ship
accidents. According to the European Space Agency (1998),
45% of the oil pollution comes from operative discharges
from ships. When taking into account how frequent such
spillages occur, controlled regular oil spills can be a much
greater threat to the marine environment and the ecosystem
than larger oil spill accidents like the Prestige tanker
(carrying N77,000 ton of fuel oil (Oceanides Web-site,
2004) accident at Galice, northwest coast of Spain in 2002.
The impact of not monitoring oil spills is presentlyunknown, but the main environmental impact is assumed
to be seabirds mistakenly landing on them and the damage
to the coastal ecology as spills hit the beach (Shepherd,
2004). Simecek-Beatty and Clemente-Colon (2004) de-
scribes how oiled birds lead to the use of SAR for locating
a sunken vessel leaking oil.
Active microwave sensors like Synthetic Aperture
Radar (SAR) capture two-dimensional images. The image
brightness is a reflection of the microwave backscattering
properties of the surface. SAR deployed on satellites is
today an important tool in oil spill monitoring due to its
wide area coverage and day and night all-weather
capabilities.
Satellite-based oil pollution monitoring capabilities in the
Norwegian waters were demonstrated in the early 1990s by
using images from the ERS-1 satellite (e.g. Bern et al.,
1992b; Skøelv & Wahl, 1993; Wahl et al., 1994b). A
demonstrator system based on ERS for the Spanish coast
was presented by Martinez and Moreno (1996). Today,
RADARSAT-1 and ENVISAT are the two main providers of
satellite SAR images for oil spill monitoring.
Access to an increased amount of SAR images means a
growing workload on the operators at analysis centres. In
addition, recent research shows that even if the operators go
through extensive training to learn manual oil spill detectionthey can detect different slicks and give them different
confidence levels (Indregard et al., 2004). Algorithms for
automatic detection that can help in screening the images
and prioritising the alarms will be of great benefit. Research
on this field has been ongoing for more than a decade, and
this paper reviews various methods for satellite-based oil
spill detection in the marine environment.
As SAR is just one of many remote sensing sensors
available an evaluation of the applicability of other satellite
sensors for oil spill monitoring is included as well. Most
studies done on airborne remote sensing techniques are
excluded. For a review of airborne sensor technology for oil
spill observation see Goodman (1994). The detectability of
oil spills in SAR images are discussed, in terms of wind
conditions, sensor characteristics and ambiguities caused by
other phenomena than oil spills. Finally, our emphasis is onmethodology and algorithms for oil spill detection in
spaceborne SAR imagery.
2. Satellite sensors for oil spill detection
Microwaves are commonly used for ocean pollution
monitoring by remote sensing. They are often preferred to
optical sensors due to the all-weather and all-day capabil-
ities, and examples of SAR-equipped satellites are presented
in Table 1. Mainly spaceborne instruments are covered here,
but airborne Side-Looking Airborne Radar (SLAR) isanother possibility. SLAR is an older but less expensive
technology than SAR, but SAR has greater range and
resolution (Fingas & Brown, 1997). Airborne surveillance is
limited by the high costs and is less efficient for wide area
surveillance due to its limited coverage. While spaceborne
SAR can be used for a first warning, aircrafts are more
suitable to be brought into action to identify the polluter, the
extent, and the type of spill. An example is the German
aerial surveillance, which locates oil discharges by SLAR,
infrared/ultraviolet (IR/UV) scanning is used to quantify the
extent of the film, a microwave radiometer (MWR) is used
to quantify the thickness and a laser-fluoro-sensor (LFS) is
used for oil type classification (Trieschmann et al., 2003).
In addition to SAR, there are other spaceborne remote
sensing devices that have some potential for oil spill
monitoring. Friedman et al. (2002) compare a RADAR-
SAT-1 SAR image with a corresponding Sea-viewing Wide
Field-of-view Sensor (SeaWiFS, visible sensor) image.
SeaWiFS measures high levels of chlorophyll for areas
with algal bloom, while the SAR images have low back-
scatter levels in these regions. It is concluded that multiple
data sets can be used to discriminate between, for example,
1 ERS-1: the First European Remote Sensing Satellite.
Table 1
Some satellites carrying SAR instruments
Satell ite (sensor) Operative Owner Characteristics
SEASAT 1978–off same year NASA L-band, HH-pol
ALMAZ-1 1991–1992 Russian
Space Agency
S-band, HH-pol
ERS-1 1991–1996 ESA C-band, VV-pol
ERS-2 1995–operating ESA C-band, VV-pol
RADARSAT-1 1995–operating CSA C band, HH pol
ENVISAT
(ASAR)
2002–operating ESA C-band, HH and
VV, alt. pol., and
crosspol. modes
C-band 4–8 GHz, k 3.75–7.5 cm, L-band 1–2 GHz, k 15–30 cm and S-
band 2–4 GHz, k 7.5–15 cm.
C. Brekke, A.H.S. Solberg / Remote Sensing of Environment 95 (2005) 1–132
8/6/2019 Oil Spill RSE2005
http://slidepdf.com/reader/full/oil-spill-rse2005 3/13
algal blooms and man-made slicks. Indregard et al. (2004)
point out that additional information (in addition to SAR)
about algal bloom is desirable, particularly in the Baltic Sea.
This could be taken from optical imagery, from alga maps or
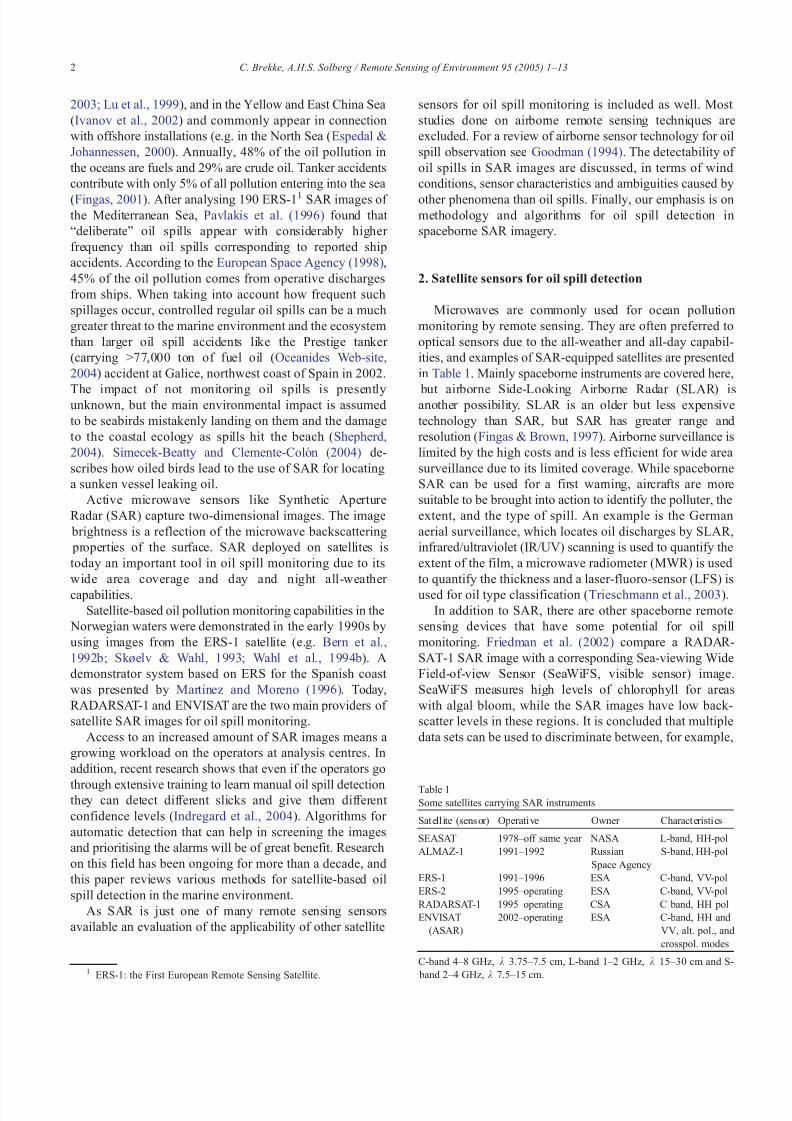
other related information. Fig. 1 shows two examples of
algal bloom imaged by SAR.
A drawback of the SeaWiFS sensor is its coarse spatialresolution of ~1 km. Hu et al. (2003) demonstrate the
possibility of oil spill monitoring by the Moderate-Reso-
lution Imaging Spectroradiometer (MODIS) instrument,
carried onboard the NASA satellites Terra and Aqua, by
an example from Lake Maracaibo, Venezuela. The MODIS
instrument has moderate resolution bands of 250 m and 500
m and a wide spectral range. This allows the MODIS
instrument to provide images of daylight-reflected solar
radiation and day/night time thermal emissions. The
MODIS instrument was originally designed for land
imaging, and with medium resolution it also shows potential
for daily monitoring of the coastal zones looking for oilspills. Cloud cover and the lack of sun light limits the use of
optical sensors. On the other hand, multiple wavelengths
can give additional information to distinguish slicks
produced by algal blooms from oil spills. Yet it is difficult
to establish automated feature recognition systems that
identify oil spills as external knowledge about the region,
environment and current events is needed in the visual
analysis of the satellite images to discriminate between
various events.
Hyperspectral sensors used for oil spill monitoring have a
potential for detailed identification of materials and better
estimation of their abundance.
With more than 200 wavelengths provided by a hyper-
spectral sensor, the spectral signature of oil can be exploited
and used to distinguish between different oil types (crude or
light oil). This can also eliminate the false alarm rate of
ocean features that have the same colour and appearance as
oil. Salem and Kafatos (2001) found that a signature
matching method based on airborne hyperspectral imaging
(looking at chemical composition) is more accurate than the
conventional techniques, where analysis is based on visual
interpretation of the oils colour and its appearance in thesatellite image. There is currently no commercial space-
borne hyperspectral sensor in orbit. The NASA EO-1
Hyperion hyperspectral sensor is an example of a space-
borne technology demonstrator that was launched in 2000.
However, its major drawback is its small swath width of
only 7.5Â100 km.
Oil absorbs solar radiation and re-emits a portion of this
energy as thermal energy. IR sensors observe thick oil
slicks as hot, intermediate thickness of oil as cool, while
thin oil is not possible to detect (Fingas & Brown, 1997).
At night a thick spill can appear cooler than the water
since it releases heat quicker than its surrounding water (Tseng & Chiu, 1994). Tseng and Chiu examined the use
and capability of the visible and IR sensors of NOAA
Advanced Very High Resolution Radiometer (AVHRR) for
early detection and monitoring of oil spills. Oil spills from
the 1991 Persian Gulf war were studied. Thick and thin oil
layers and the boundary between water and oil were
possible to detect by the IR channel, but the oil spills may
not have a significant different temperature signature from
the surrounding water at night. Oil spills could be detected
in the visible images only under highly favourable lighting
and sea conditions.
UV technology can be used to detect oil spills as the spill
displays high reflectivity of UV radiation even at thin layers.
The UV instrument is not usable at night, and wind slicks,
sun glints and biogenic material can cause false alarms in
Fig. 1. Two subscenes of an ENVISAT ASAR Wide Swath Mode (WSM) image from the German Baltic Sea (7th of August 2003). Left: The two slicks,
indicated by yellow arrows, were classified as algae by a German surveillance aircraft. Several other phenomena (possible low wind) causing low
backscattering are visible in the scene. The size of the subscene is 346 Â405 pixels. Right: The slick was classified as alga by a German surveillance aircraft.
The size of the subscene is 236Â241 pixels. nESA/KSAT 2004.
C. Brekke, A.H.S. Solberg / Remote Sensing of Environment 95 (2005) 1–13 3

8/6/2019 Oil Spill RSE2005
http://slidepdf.com/reader/full/oil-spill-rse2005 4/13
the UV data. These interferences are often different from
those for IR, and a combination of IR and UV can provide a
more reliable indication of oil and can be used for
estimating oil thickness (Fingas & Brown, 1997).
A MWR is another passive sensor. The instrument looks
at the microwave radiation in the wavelength cm to mm
range that the ocean emits, and therefore is almost weather-independent (Trieschmann et al., 2003). Oil slicks emit
stronger microwave radiation than the water and appear as
bright objects on a darker sea. According to Robinson
(1994), oil slicks can have strong surface-emissivity
signatures, but as a spatial resolution of tens to hundreds
of meters is desirable for the determination of oil slicks, this
type of sensors for oil spill thickness monitoring is most
appropriately pursued by aircraft sensor. Zhifu et al. (2002)
did some experiments using airborne (AMR-OS) and a ship
borne (K-band) MWRs looking at various oil types and
thickness. They found that MWRs are useful tools for
measuring the thickness and estimating the volume of thespills, but the resolution is not fine enough to give accurate
results. Fingas and Brown (1997) summarize studies done
on this field and conclude that the potential of radiometers
as a reliable device for measuring slick thickness is
uncertain.
RADARSAT-1 and Landsat-5/Thematic Mapper (TM)
were used to capture images of the Guanabara Bay, Brazil,
after an oil spill emergency where a pipeline ruptured (Bentz
& de Miranda, 2001). Bentz and de Miranda found that
RADARSAT-1 provided suitable temporal coverage, while
cloud cover, haze and the 8-day revisit schedule (using both
Landsat-5 and -7) prevented Landsat from being used
systematically for oil spill monitoring. However, many sea
surface temperature and ocean colour sensors have a large
swath width and can provide daily coverage of the earth
surface (e.g. the revisit time for MODIS is 2 days and for
SeaWiFS 1 day).
In summary, SAR is still the most efficient and superior
satellite sensor for oil spills detection, though it does not
have capabilities for oil spill thickness estimation and oil
type recognition. SAR is useful particularly for searching
large areas and observing oceans at night and at cloudy
weather conditions. Usually even small volumes of oil cover
large areas (several hundred meters) and thus the need for
very high spatial resolution in SAR images is not crucial.Bern et al. (1992a), Wahl et al. (1994a, 1996) found Low
Resolution ERS-1 SAR images with a spatial resolution of
100 m sufficient for oil spill detection. The original ERS
images were filtered using a 5Â5 mean filter, which gave
better noise characteristics than the full resolution images,
and they were therefore easier to analyse. SAR also has
some limitations, as a number of natural phenomena can
give false oil spill detections. In addition, SAR is only
applicable for oil spill monitoring in a certain range of wind
speeds. The usefulness of SAR in terms of responding to oil
spills at various conditions is covered in more detail in the
next section.
3. Detectability of oil spills in SAR images
Oil slicks dampen the Bragg waves (wavelength of a few
cm) on the ocean surface and reduce the radar backscatter
coefficient.2 This results in dark regions or spots in a
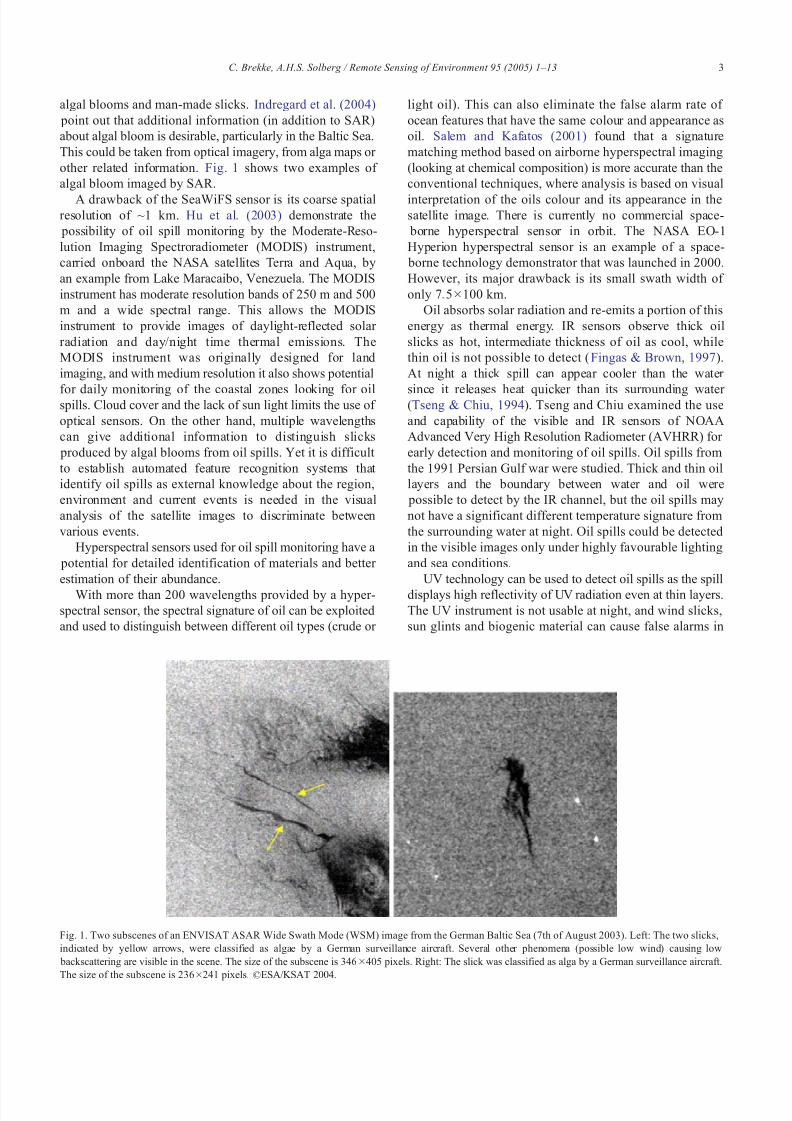
satellite SAR images. Fig. 2 gives two examples.
Kotova et al. (1998) emphasises the importance of weathering processes,3 as they influence oil spills phys-
icochemical properties and detectability in SAR images.
The processes that play the most important role for oil spill
detection are evaporation, emulsification and dispersion.
Lighter components of the oil will evaporate to the
atmosphere. The rate of evaporation is dependent on oil
type, thickness of the spill, wind speed and sea temperature.
Emulsification is estimated based on water uptake as a
function of the wind exposure of the actual oil type.
Dispersion is an important factor in deciding the lifetime of
an oil spill and it is strongly dependent on the sea state.
3.1. Discrimination between oil spills and look-alikes
A part of the oil spill detection problem is to distinguish-
ing oil slicks from other natural phenomena that dampen the
short waves and create dark patches on the surface. Natural
dark patches are termed oil slick look-alikes . Oil slicks may
include all oil related surface films caused by oil spills from
oilrigs, leaking pipelines, passing vessels as well as bottom
seepages, while look-alikes do include natural films/slicks,4
grease ice, threshold wind speed areas (wind speed b3 m/s),
wind shelter ing by land, rain cells, shear zones, internal
waves, etc. (Espedal, 1998). Oil spills in a narrow sense are
only man-made slicks associated with crude petroleum and its
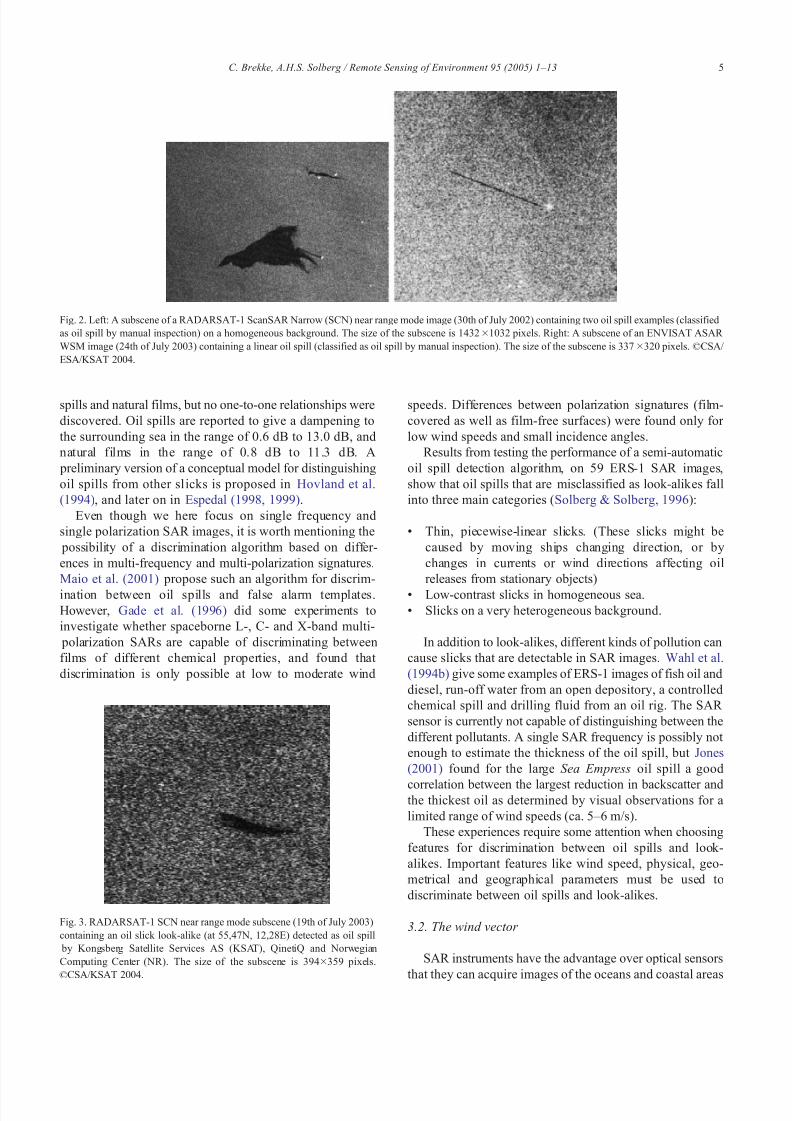
products, heavy and light fuel. Fig. 3 shows an example of a
dark spot detected as oil spill by three different satellite-based
analysis systems while verified as look-alike by aircraft.
The fact that the radar cross-section values for oil spills
are not unique poses a problem in the development of an oil
spill detection and monitoring system (Hovland & Johan-
nessen, 1994). Natural films can be very difficult to
distinguish from oil spills. Examples are presented in
Hovland and Johannessen (1994). Due to a higher viscosity
than natural films, oil spills tend to remain more concen-
trated and in turn provide larger dampening. In Espedal
(1998), some trends in slick properties were found for oil
2 Normalized Radar Cross Section (NRCS) (r0): The normalised
measure of the radar return from, e.g. the ocean is called the radar
backscatter coefficient, or sigma nought. It is defined as the reflective
strength of the radar target, r, per unit area on the ground, A: r0=r/ A
(Curlander & McDonough, 1991). (How to derive the r0 value from the
RADARSAT-1, ERS-1 and -2 SAR products is described in Laur et al.
(2002) and Shepherd (2000)).
4 Natural film: microlayer of organic substances secreted by fish and
several planctonic species (Hovland et al., 1994).
3 Weathering processes include: spreading, drift, evaporation, dissolu-
tion, disper sion, emulsification, sedimentation, biodegradation and photo-
oxidation (Kotova et al., 1998).
C. Brekke, A.H.S. Solberg / Remote Sensing of Environment 95 (2005) 1–134
8/6/2019 Oil Spill RSE2005
http://slidepdf.com/reader/full/oil-spill-rse2005 5/13
spills and natural films, but no one-to-one relationships were
discovered. Oil spills are reported to give a dampening to
the surrounding sea in the range of 0.6 dB to 13.0 dB, and
natural films in the range of 0.8 dB to 11.3 dB. A
preliminary version of a conceptual model for distinguishing
oil spills from other slicks is proposed in Hovland et al.
(1994), and later on in Espedal (1998, 1999).
Even though we here focus on single frequency and
single polarization SAR images, it is worth mentioning the
possibility of a discrimination algorithm based on differ-
ences in multi-frequency and multi-polarization signatures.
Maio et al. (2001) propose such an algorithm for discrim-
ination between oil spills and false alarm templates.
However, Gade et al. (1996) did some experiments to
investigate whether spaceborne L-, C- and X-band multi-
polarization SARs are capable of discriminating between
films of different chemical properties, and found that
discrimination is only possible at low to moderate wind
speeds. Differences between polarization signatures (film-
covered as well as film-free surfaces) were found only for
low wind speeds and small incidence angles.
Results from testing the performance of a semi-automatic
oil spill detection algorithm, on 59 ERS-1 SAR images,
show that oil spills that are misclassified as look-alik es fall
into three main categories (Solberg & Solberg, 1996):
! Thin, piecewise-linear slicks. (These slicks might be
caused by moving ships changing direction, or by
changes in currents or wind directions affecting oil
releases from stationary objects)
! Low-contrast slicks in homogeneous sea.
! Slicks on a very heterogeneous background.
In addition to look-alikes, different kinds of pollution can
cause slicks that are detectable in SAR images. Wahl et al.
(1994b) give some examples of ERS-1 images of fish oil and
diesel, run-off water from an open depository, a controlled
chemical spill and drilling fluid from an oil rig. The SAR
sensor is currently not capable of distinguishing between the
different pollutants. A single SAR frequency is possibly not
enough to estimate the thickness of the oil spill, but Jones
(2001) found for the large Sea Empress oil spill a good
correlation between the largest reduction in backscatter andthe thickest oil as determined by visual observations for a
limited range of wind speeds (ca. 5–6 m/s).
These experiences require some attention when choosing
features for discrimination between oil spills and look-
alikes. Important features like wind speed, physical, geo-
metrical and geographical parameters must be used to
discriminate between oil spills and look-alikes.
3.2. The wind vector
SAR instruments have the advantage over optical sensors
that they can acquire images of the oceans and coastal areas
Fig. 3. RADARSAT-1 SCN near range mode subscene (19th of July 2003)
containing an oil slick look-alike (at 55,47N, 12,28E) detected as oil spill
by Kongsberg Satellite Services AS (KSAT), QinetiQ and Norwegian
Computing Center (NR). The size of the subscene is 394Â359 pixels.
nCSA/KSAT 2004.
Fig. 2. Left: A subscene of a RADARSAT-1 ScanSAR Narrow (SCN) near range mode image (30th of July 2002) containing two oil spill examples (classified
as oil spill by manual inspection) on a homogeneous background. The size of the subscene is 1432Â1032 pixels. Right: A subscene of an ENVISAT ASAR
WSM image (24th of July 2003) containing a linear oil spill (classified as oil spill by manual inspection). The size of the subscene is 337 Â320 pixels. nCSA/
ESA/KSAT 2004.
C. Brekke, A.H.S. Solberg / Remote Sensing of Environment 95 (2005) 1–13 5
8/6/2019 Oil Spill RSE2005
http://slidepdf.com/reader/full/oil-spill-rse2005 6/13
day and night and despite any weather conditions. However,
the wind level influences the backscatter level and the
visibility of slicks on the sea surface. Oil slicks ar e visible
only for a limited range of wind speeds. Table 2 gives an
overview for ERS SAR images. Gade et al. (2000) studied
oil spill pollution in the Baltic Sea, the North Sea and the
northwestern Mediterranean (700 ERS images). They foundthat with high wind speed (N10 m/s) few oil spills were
detected in the SAR images, which is in agreement with
Table 2. They also compared data from airborne surveil-
lance with ERS SAR data. For both sensors they found that
the maximum number of detected pollutions was found
during summer time, April to September. A reason for this
could possibly be that the average wind speed is higher at
wintertime at all test sights (e.g. mean wind speed in the
North Sea is above 10 m/s). A wind speed between 12 m/s
and 14 m/s should possibly be considered as the upper limit
for all spaceborne SAR imagery of oil spills (Litovchenko et
al., 1999), but the maximum wind speed for slick detectiondepends on oil type and the age (i.e. time since release) of
the spill (Bern et al., 1992a). Thus, an estimate of the wind
speed is valuable information for oil spill detection.
For the oil spill detection algorithm described by Solberg
et al. (1999), the wind level is set manually based on
inspecting the image visually and it is used as input to a
threshold procedure. Other possibilities are to incorporate
wind information delivered by an external source (e.g. a
forecasting centre) or to use automatic methods. With
automatic methods for wind estimation, the wind speed
can be derived directly from the SAR image. Salvatori et al.
(2003) estimate the wind speed from the SAR image by
applying an inverted CMOD45 model. The wind vector
appeared useful in knowing the evolution of the spill and to
obtain correct classification.
3.3. Satellite configurations for oil spill detection
It is well understood that the radar image is a
representation of the backscatter return and mainly propor-
tional to the surface roughness at the scale of the radar
wavelength (a phenomenon known as bBragg scattering Q )
(Elachi, 1987). The radar backscatter coefficient is also a
function of the viewing geometry of the SAR, and the
backscatter coefficient decreases with increasing incidenceangle. The scattering properties of a material depend on the
polarization of the incoming radar signal, and according to
Girard-Ardhuin et al. (2003) is the most suitable SAR
configuration for slick detection C-band single-polarized
VV SAR at incidence angles in the range of 208 to 458.
Dokken (1995) writes that oil spill detection is possible
under suitable meteorological conditions when roceanNnoise
floor+4 dB. Oil spill detection is possible for incidence
angles in the range of 208 (lower limit) to the intersection
between the rocean and the noise floor+4 dB (upper limit).
Because little multiple reflection of the signal occurs over
the ocean, there is little effect on the polarization. It is
therefore not much to gain by using cross-polarization (HVor VH) (Robinson, 1994). Fortuny-Guasch (2003) discusses
the potential of polarimetric SAR for improved oil spill
detection and classification. Its use might extend the validity
ranges of wind speed and incidence angles.
For RADARSAT-1, Vachon et al. (1998) recommend the
SCN near range mode (see Table 3) for slick detection.
ScanSAR Wide (SCW) can cause limitations because of the
poor resolution of 100 m. RADARSAT-1 is not particularly
suited for oil spill detection because of its HH polarization,
as predictions show that oil spill detection will not be
possible for the largest incident angles especially at low wind
speeds (Wahl et al., 1994a). However, it is successfully used
in operating oil spill monitoring. No significant difference in
practical performance between the detection capabilities of
RADARSAT-1 versus ENVISAT has yet been reported for
operational use; however, the experience might still be
limited (see also Shepherd et al., 2004). ENVISAT’s ASAR
WSM covers a much wider swath than its predecessors ERS-
1 and -2, but the resolution is significantly lower. From Table
3 we can see that there is a trade-off between image
resolution and swath coverage. Generally, for efficient oil
spill monitoring larger swath widths should be chosen on the
expense of somewhat lower resolution.
Since the SAR satellites usually have polar orbits, the
coverage depends on the latitude. Coverage is good in the polar regions and decreases with the distance from the poles.
For the Mediterranean Sea the number of satellites passes
per day is 0.04 for ERS, 0.27 for RADARSAT-1 (SCN near
range) and 0.36 for ENVISAT (Wide Swath Mode) (Perez-
Marrodan, 1998). As the visibility of oil spills reduces with
time (e.g. the rate of natural dispersion at moderate wind
speed conditions is about 0.5–2% of the oil volume/hour
(Kotova et al., 1998)) and an early warning is wanted, a high
number of passes per day is favourable. With steerable
antennas, like the one planned for the RADARSAT-2 SAR,
we get more flexible observation possibilities and thus less
dependent, e.g. on the repeat cycles of the satellites.
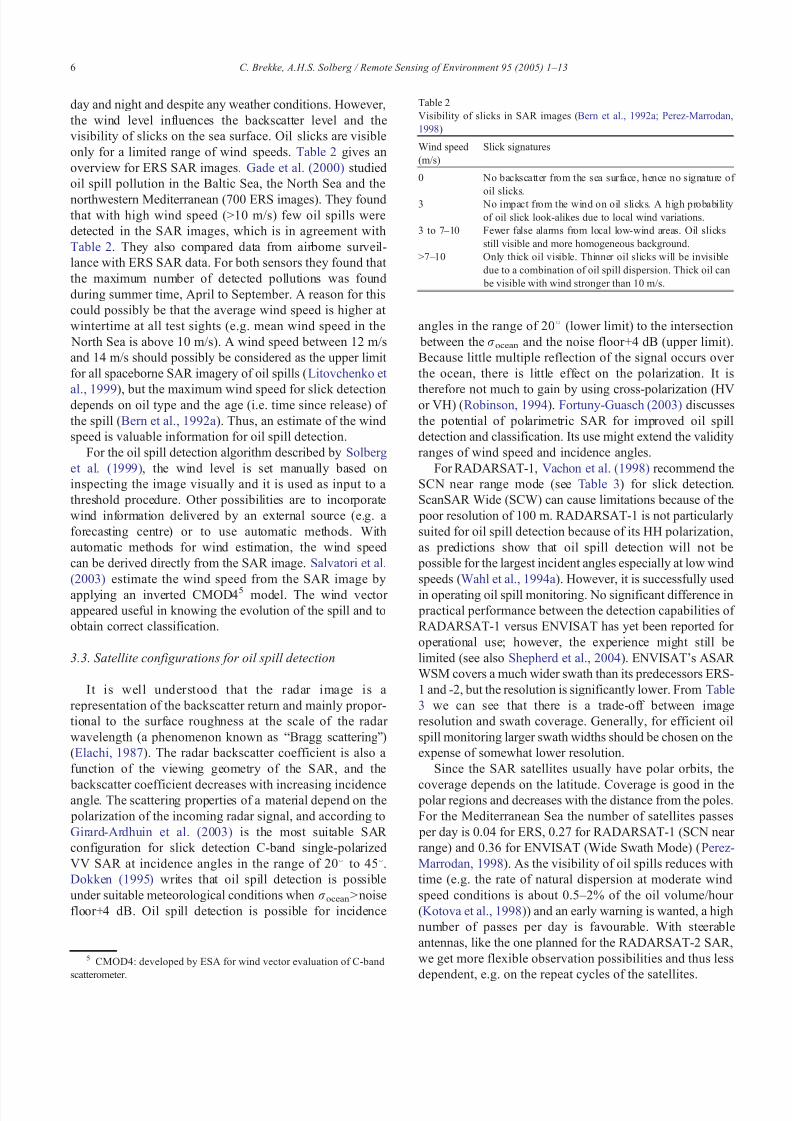
Table 2
Visibility of slicks in SAR images (Bern et al., 1992a; Perez-Marrodan,
1998)
Wind speed
(m/s)
Slick signatures
0 No backscatter from the sea surface, hence no signature of
oil slicks.3 No impact from the wind on oil slicks. A high probability
of oil slick look-alikes due to local wind variations.
3 to 7–10 Fewer false alarms from local low-wind areas. Oil slicks
still visible and more homogeneous background.
N7–10 Only thick oil visible. Thinner oil slicks will be invisible
due to a combination of oil spill dispersion. Thick oil can
be visible with wind stronger than 10 m/s.
5 CMOD4: developed by ESA for wind vector evaluation of C-band
scatterometer.
C. Brekke, A.H.S. Solberg / Remote Sensing of Environment 95 (2005) 1–136
8/6/2019 Oil Spill RSE2005
http://slidepdf.com/reader/full/oil-spill-rse2005 7/13
These are all important factors in estimating the useful-
ness and efficiency of the SAR, and in designing future
satellite missions for pollution monitoring.
3.4. Speckle noise
Speckle arises because the resolution of the sensor is not
sufficient to resolve individual scatters within a resolution
cell. Speckle is a large problem in SAR images since even ahomogeneous area has a statistical distribution with large
standard deviation. Incoherent averaging multiple looks
may reduce speckle6 (Leberl, 1990). Another possibility is
to smooth the speckles after the image has been formed.
Barni et al. (1995) tested two types of filters, general noise-
reducing filters that do not assume any a priori speckle
model and adaptive filters assuming a multiplicative speckle
model (speckle noise by a multiplicative model is described
by Lee (1981)). Better results were reported for the latter
type in their oil spill detection algorithm.
For oil spill applications, a filter should suppress speckle
noise, but still preserve small and thin oil spills.
4. Methodology for oil spill detection in SAR images
We distinguish between manual approaches and auto-
matic algorithms for oil spill detection. Detection of oil
spills can be divided in (Indregard et al., 2004):
! Detection of suspected slicks.
! Manual verification of the slicks (oil/look-alike) and
assignment of confidence levels.
This section addresses issues regarding the design of oilspill detection systems.
4.1. Manual inspection
Since 1994 KSAT in Norway has provided a manual oil
spill detection service. Here operators are trained to analyse
SAR images for the detection of oil pollution. The KSAT
approach is described by Indregard et al. (2004). External
information about wind speed and direction, location of
oilrigs and pipelines, national territory borders and coast-
lines are used as support during the analysis. The operator
uses an image viewer that can calculate some spot attributes,
but he/she still has to go through the whole image manually.
This is time consuming. Possible oil spills found are
assigned either high, medium or low confidence levels.The assignment is based on the following features: the
contrast level to the surroundings, homogeneity of the
surroundings, wind speed, nearby oilrigs and ships, natural
slicks near by, and edge and shape characteristics of the
spot. The determination of a confidence level is not exact
science and there will always be an uncertainty connected to
the results from manual inspection.
4.2. Manual detection compared to automatic detection
During manual inspection, contextual information is an
important factor in classifying oil spills and look-alikes. A
challenge is to somehow incorporate the bexpert knowl-
edge Q into the automatic algorithm. In Solberg and Volden
(1997), a set of rules and knowledge about external
conditions (e.g. wind speed) are used to adjust prior
probabilities of oil slicks in the scene. This information is
incorporated into a classifier based on a multivariate
probability distribution function.
Fiscella et al. (2000) found that a human image
interpreter and a classification algorithm have similar ability
to discriminate oil spills from look-alikes, but the image set
used contained only 21 oil spill candidates.
A study of best practise, based on a comparison of
KSAT’s manual approach, NR’s automatic algorithm(described in Bjerde et al., 1993; Solberg & Solberg,
1996; Solberg & Volden, 1997 and lately in Solberg et al.,
1999, 2003) and QinetiQ’s semi-automatic oil spill detection
approach, has been performed by the ongoing Oceanides
project (Indregard et al., 2004). QinetiQ’s semi-automatic
approach covers only the first step of an automatic
algorithm, dark spot detection, and therefore the output
targets must be classified visually by an operator. In this
study the three satellite-based approaches were compared to
airborne verifications in a satellite-airborne campaign. The
study was done without the operators or the algorithms
knowing of the aircraft verifications. (The benchmark set
6 The bandwidth of the SAR system is divided into N discrete
contiguous segments, each segment generating a single-look lower
resolution image. The intensities of the N single-look images ar e
incoherently averaged to form a multiple-look image ( Ulaby et al., 1986).
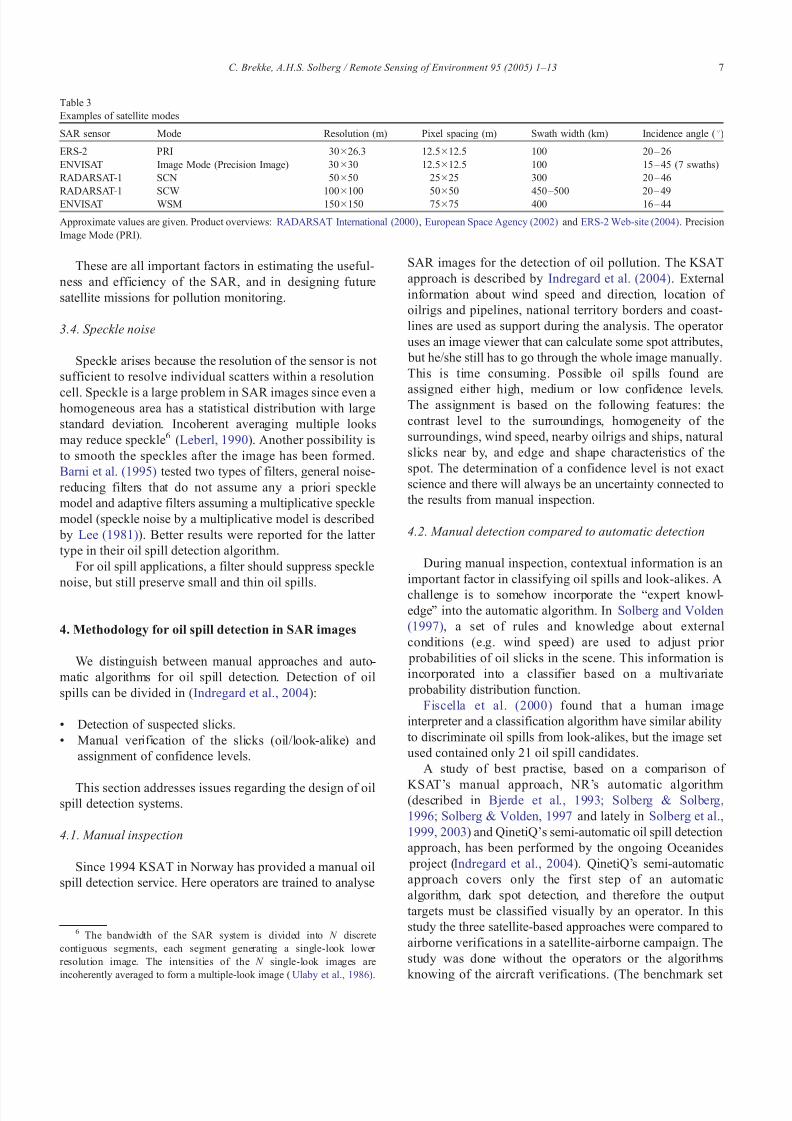
Table 3
Examples of satellite modes
SAR sensor Mode Resolution (m) Pixel spacing (m) Swath width (km) Incidence angle (8)
ERS-2 PRI 30Â26.3 12.5Â12.5 100 20 – 26
ENVISAT Image Mode (Precision Image) 30Â30 12.5Â12.5 100 15 – 45 (7 swaths)
RADARSAT-1 SCN 50Â50 25Â25 300 20 – 46
RADARSAT-1 SCW 100Â
100 50Â
50 450 –500 20 – 49ENVISAT WSM 150Â150 75Â75 400 16 – 44
Approximate values are given. Product overviews: RADARSAT International (2000), European Space Agency (2002) and ERS-2 Web-site (2004). Precision
Image Mode (PRI).
C. Brekke, A.H.S. Solberg / Remote Sensing of Environment 95 (2005) 1–13 7
8/6/2019 Oil Spill RSE2005
http://slidepdf.com/reader/full/oil-spill-rse2005 8/13
consisted of 32 RADARSAT-1 images.) This data set
contained 17 verified oil spills. KSAT detected 15 of these
slicks, NR’s algorithm detected 14, and QinetiQ detected
12. The results show that a challenge is to have all operators
pick out the same spots and assign the same confidence
levels. NR’s algorithm is objective (with one exception of
manual wind level assignment, see Section 3.2) and produces the same result repeatedly. Good agreement was
found for high-contrast slicks among the various methods,
but there were some differences on low-contrast slicks. The
operators at KSAT use 3–25 min to analyse a scene (on
average 9 min), the NR’s algorithm used about 3 min and
QinetiQ’s algorithm used 20 min per scene in average. This
shows that automatic approaches are more feasible as the
volume of SAR data grows.
4.3. Design issues for automatic detection systems
Kubat et al. (1998) identified a number of issues duringtheir development of a machine learning component for an
oil spill detection system. The first issue is the scarcity of
data, as most satellite SAR images acquired contain no oil
spills. The second is the imbalanced training set . Oil spill
detection is an application where the classifier should detect
a rare but important event (look-alikes appear much more
frequent). Oil spills happen to appear in batches, where
examples drawn from the same image constitute a single
batch. A similarity within batches and dissimilarity between
batches can be present, which can influence the classifier
training. And finally, the performance of the classifier
relates to the users’ possibility to decrease the number of
alarms at the expense of missing genuine oil spills
(specificity). Indregard et al. (2004) also point out that
automatic algorithms should be tuned in order to be certain
that no suspicious oil spills that would be detected by an
operator are missed.
The significant differences in mode characteristics for
different SAR sensors, as presented by Table 3, suggest a
development of sensor specific modules.
All of these are considerations to be taken into account
when designing an automatic system for oil spill detection.
5. Automatic techniques for oil spill detection in SAR images
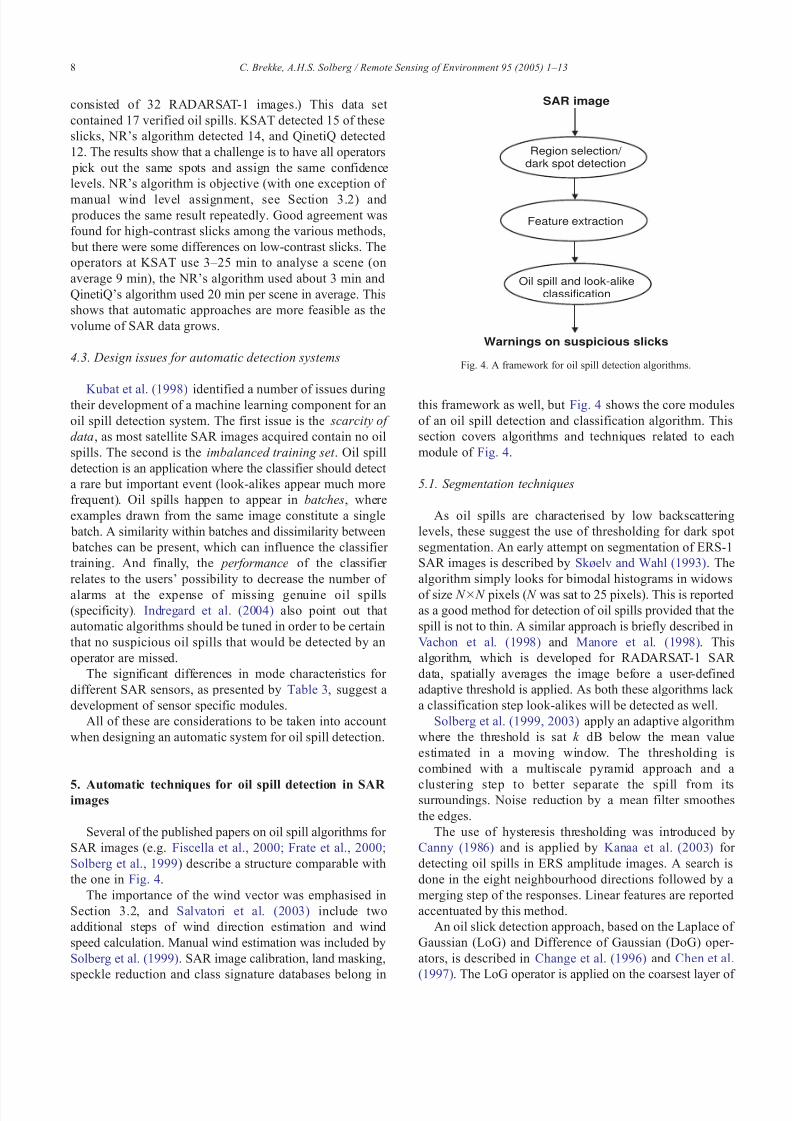
Several of the published papers on oil spill algorithms for
SAR images (e.g. Fiscella et al., 2000; Frate et al., 2000;
Solberg et al., 1999) describe a structure comparable with
the one in Fig. 4.
The importance of the wind vector was emphasised in
Section 3.2, and Salvatori et al. (2003) include two
additional steps of wind direction estimation and wind
speed calculation. Manual wind estimation was included by
Solberg et al. (1999). SAR image calibration, land masking,
speckle reduction and class signature databases belong in
this framework as well, but Fig. 4 shows the core modules
of an oil spill detection and classification algorithm. This
section covers algorithms and techniques related to each
module of Fig. 4.
5.1. Segmentation techniques
As oil spills are characterised by low backscattering
levels, these suggest the use of thresholding for dark spot
segmentation. An early attempt on segmentation of ERS-1
SAR images is described by Skøelv and Wahl (1993). The
algorithm simply looks for bimodal histograms in widows
of size N Â N pixels ( N was sat to 25 pixels). This is reported
as a good method for detection of oil spills provided that the
spill is not to thin. A similar approach is briefly described in
Vachon et al. (1998) and Manore et al. (1998). This
algorithm, which is developed for RADARSAT-1 SAR
data, spatially averages the image before a user-defined
adaptive threshold is applied. As both these algorithms lack
a classification step look-alikes will be detected as well.
Solberg et al. (1999, 2003) apply an adaptive algorithm
where the threshold is sat k dB below the mean value
estimated in a moving window. The thresholding is
combined with a multiscale pyramid approach and a
clustering step to better separate the spill from itssurroundings. Noise reduction by a mean filter smoothes
the edges.
The use of hysteresis thresholding was introduced by
Canny (1986) and is applied by Kanaa et al. (2003) for
detecting oil spills in ERS amplitude images. A search is
done in the eight neighbourhood directions followed by a
merging step of the responses. Linear features are reported
accentuated by this method.
An oil slick detection approach, based on the Laplace of
Gaussian (LoG) and Difference of Gaussian (DoG) oper-
ators, is described in Change et al. (1996) and Chen et al.
(1997). The LoG operator is applied on the coarsest layer of
SAR image
Warnings on suspicious slicks
Region selection/ dark spot detection
Feature extraction
Oil spill and look-alikeclassification
Fig. 4. A framework for oil spill detection algorithms.
C. Brekke, A.H.S. Solberg / Remote Sensing of Environment 95 (2005) 1–138
8/6/2019 Oil Spill RSE2005
http://slidepdf.com/reader/full/oil-spill-rse2005 9/13
a 2Â2 pixel reduced pyramid with three layers. The concave
areas of the grey level surface are selected. The DoG is used
to locate those areas with more than half of the slick
boundary pixels greater than l+1.75r (as selected for ERS-
1, where l and r are mean and standard deviation over all
image pixels, respectively). To improve the result the finer
layers of the pyramid are processed.The use of wavelets in ocean feature det ection (including
oil spills) is described by Liu et al. (1997) and Wu and Liu
(2003). In the general linear feature detection scheme, the
analysing wavelet is defined as the LoG. Regions with
multiple histogram peaks are selected for the wavelet
transform. The wavelet is applied as an edge detector as
the contours of the zero crossing indicates the feature edges
(see Canny, 1986).
As oil spills dampens the capillary waves, Mercier et al.
(2003) suggest a segmentation method based on detecting
local variations of the wave spectra. First a multi-resolution
analysis is achieved by a wavelet packet transform then aHidden Markov Chain (HMC) model is applied to the
wavelet coefficients. The technique is tested on an ERS PRI
image.
QinetiQ’s dark spot algorithm uses a Constant False
Alarm Rate (CFAR) algorithm to locate dark regions. The
dark spots are merged according to a clustering radius and a
threshold, and the Hough transform is used specially to
identify linear targets (Indregard et al., 2004).
To allow dealing with mixed surface-cover classes and
unsharp boundaries among regions, Barni et al. (1995)
propose an algorithm based on fuzzy clustering. A member-
ship function uA( x) is assigned to each pixel x, which
measures how much the pixel belongs to a set A. The Fuzzy
C-means (FCM) algorithm is applied, and a pyramid
structure is used in finding the membership values.
Uncertain pixels are tested in the lower pyramid level.
Neighbouring regions are identified, and a Sobel operator is
used to enhance the main edges of the original filtered
image. Regions, whose common border does not have a
high enough percentage of large gradient points, are merged
together. One difficulty with fuzzy clustering is to find the
optimum number of clusters.
A method using mathematical morphology for oil spill
segmentation is presented by Gasull et al. (2002). Combi-
nations of opening and closing7
operations are used for oilspill filtering and thresholding. The algorithm aims at
detecting spills from sailing tankers, and some features
used are the elongatedness and dampening of the spill.
Even though a variety of methods are applied, the
common goal is to detect all suspicious slicks and to
preserve the slick shapes. The latter is of most importance
for the success of discriminating oil spills from look-alikes
in the following steps.
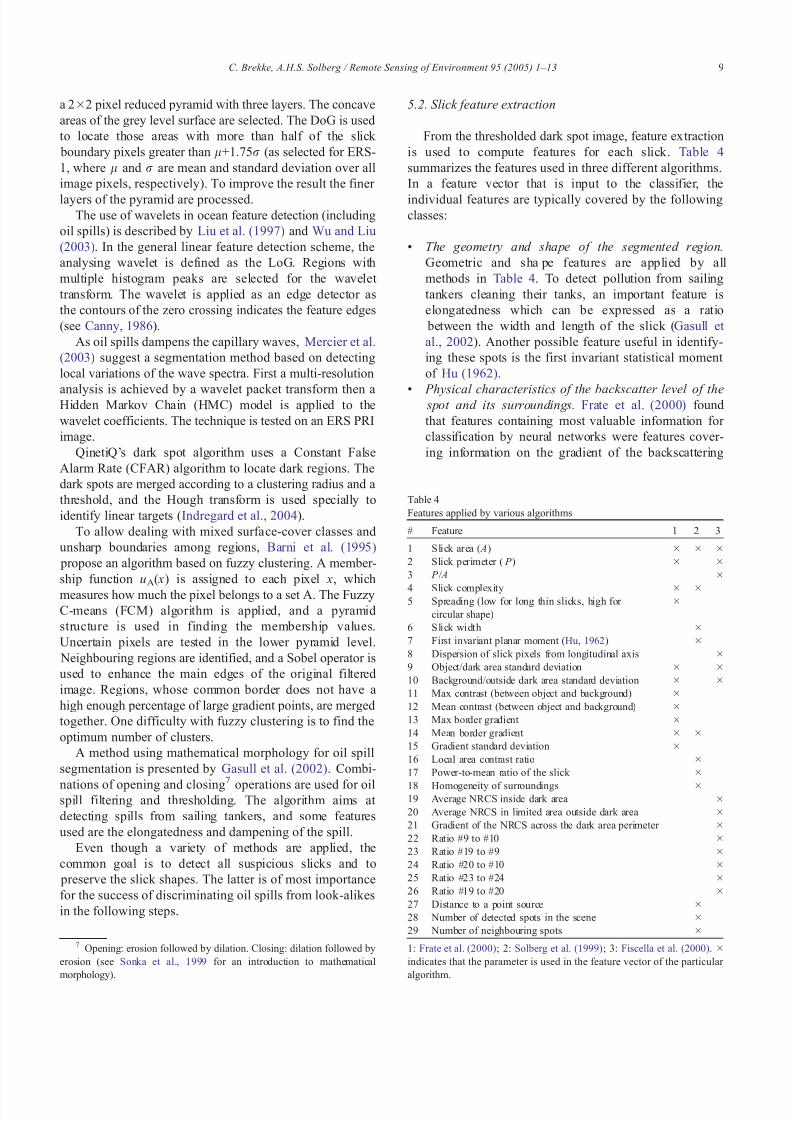
5.2. Slick feature extraction
From the thresholded dark spot image, feature extraction
is used to compute features for each slick. Table 4
summarizes the features used in three different algorithms.
In a feature vector that is input to the classifier, the
individual features are typically covered by the followingclasses:
! The geometry and shape of the segmented region.
Geometric and sha pe features are applied by all
methods in Table 4. To detect pollution from sailing
tankers cleaning their tanks, an important feature is
elongatedness which can be expressed as a ratio
between the width and length of the slick (Gasull et
al., 2002). Another possible feature useful in identify-
ing these spot s is the first invariant statistical moment
of Hu (1962).
!Physical characteristics of the backscatter level of the
spot and its surroundings. Frate et al. (2000) found
that features containing most valuable information for
classification by neural networks were features cover-
ing information on the gradient of the backscattering
Table 4
Features applied by various algorithms
# Feature 1 2 3
1 Slick area ( A) Â Â Â
2 Slick perimeter ( P ) Â Â
3 P / A Â
4 Slick complexity  Â
5 Spreading (low for long thin slicks, high for
circular shape)
Â
6 Slick width Â
7 First invariant planar moment (Hu, 1962) Â
8 Dispersion of slick pixels from longitudinal axis Â
9 Object/dark area standard deviation  Â
10 Background/outside dark area standard deviation  Â
11 Max contrast (between object and background) Â
12 Mean contrast (between object and background) Â
13 Max border gradient Â
14 Mean border gradient  Â
15 Gradient standard deviation Â
16 Local area contrast ratio Â
17 Power-to-mean ratio of the slick Â
18 Homogeneity of surroundings Â
19 Average NRCS inside dark area Â
20 Average NRCS in limited area outside dark area Â
21 Gradient of the NRCS across the dark area perimeter Â
22 Ratio #9 to #10 Â
23 Ratio #19 to #9 Â
24 Ratio #20 to #10 Â
25 Ratio #23 to #24 Â
26 Ratio #19 to #20 Â
27 Distance to a point source Â
28 Number of detected spots in the scene Â
29 Number of neighbouring spots Â
1: Frate et al. (2000); 2: Solberg et al. (1999); 3: Fiscella et al. (2000). Â
indicates that the parameter is used in the feature vector of the particular
algorithm.
7 Opening: erosion followed by dilation. Closing: dilation followed by
erosion (see Sonka et al., 1999 for an introduction to mathematical
morphology).
C. Brekke, A.H.S. Solberg / Remote Sensing of Environment 95 (2005) 1–13 9
8/6/2019 Oil Spill RSE2005
http://slidepdf.com/reader/full/oil-spill-rse2005 10/13
value when passing from background to spill (#13,
#14 and #15). In addition, the background standard
deviation (#10) was found important which is a
parameter highly affected by the wind level and is
generally high for nat ural sea slicks. Similarly in
Fiscella et al. (2000), features connected to the
background surrounding the slick were found to beimportant due to the wind speed dependence of oil
spill observations (these features could also be
classified as contextual features).
! Spot contextual features. Examples are slick location
relative to the shore and distance to ships and oilrigs. In
the contextual analysis of the supervised discrimination
algorithm described by Espedal (1999) is a bhot-spot Q
pollution source database used. Improved classification
results were found by Solberg and Volden (1997) when
the dark spots are classified in the context of their
surroundings and weather information is incorporated.
Espedal and Wahl (1999) suggest using wind historyinformation for slick classification and slick age estima-
tion. Wind history can also be looked at as an indirect
spot feature.
! Texture. In contradiction to the pixel intensity itself,
texture provides information about the spatial correlation
among neighbouring pixels. Assilzadeh and Mansor
(2001) describe an early warning system where texture
features based on grey level co-occurrence matrixes
(GLCM)8 are used. Homogeneity and angular second
moment were found effective in separation of oil spills
from other objects. Power-to-mean ratio of the slick and
the surroundings is used by Solberg et al. (1999) as a
measure of homogeneity.
Even though the different methods in Table 4 do not
apply the exact same features, several of the features are
different measures of the same characteristic.
Fractal texture description can be used to describe natural
surfaces (Pentland, 1984). The use of fractal dimension9 as a
feature for classifying observed ocean radar signatures is
suggested in Gade and Redondo (1999). A box-counting
algorithm (the method is described in Keller et al., 1989) is
used to find the fractal dimension D. A difference in D of oil
spills compared to other oceanic phenomena is reported. In
another paper on fractal dimension by Benelli and Garzelli(1999) was a steady fractal dimension value of D=2.45
found for the sea surface, while an average value of D=2.15
was found for oil spills. A smaller D indicates less
roughness.
Good features are important, but the lack of good
guidelines on how to acquire them has been pointed out
by Kubat et al. (1998).
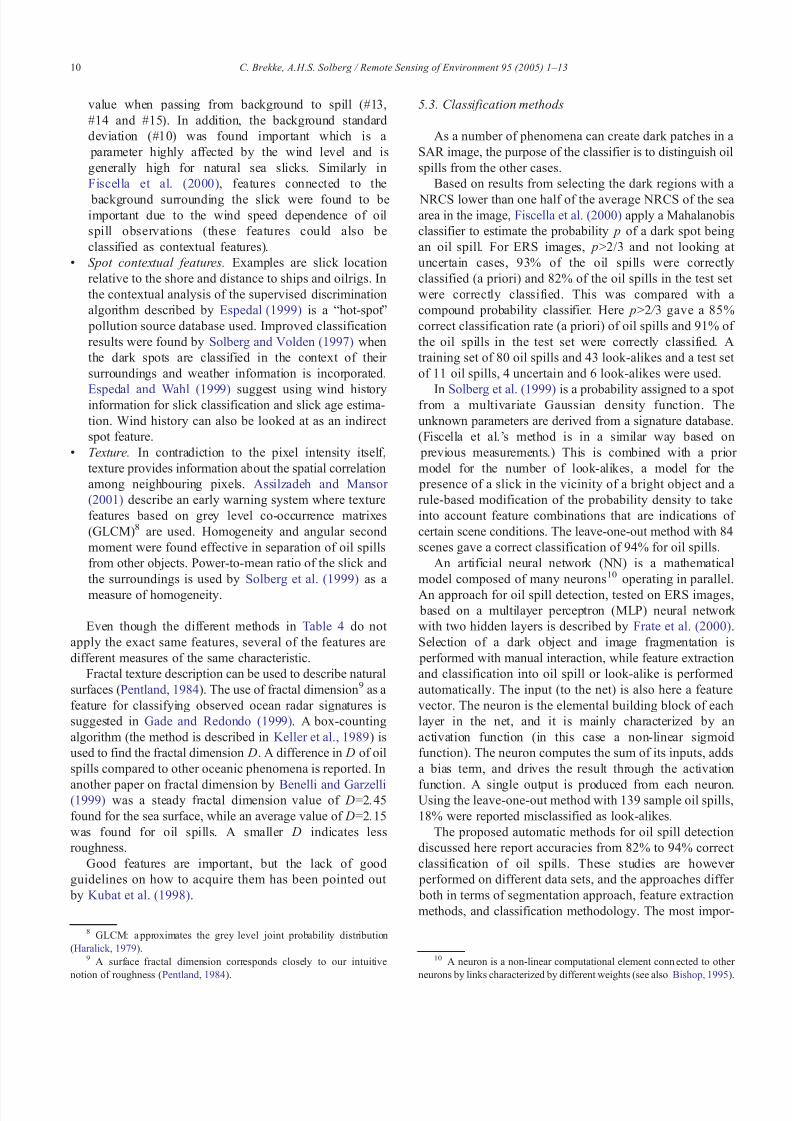
5.3. Classification methods
As a number of phenomena can create dark patches in a
SAR image, the purpose of the classifier is to distinguish oil
spills from the other cases.
Based on results from selecting the dark regions with a
NRCS lower than one half of the average NRCS of the seaarea in the image, Fiscella et al. (2000) apply a Mahalanobis
classifier to estimate the probability p of a dark spot being
an oil spill. For ERS images, pN2/3 and not looking at
uncertain cases, 93% of the oil spills were correctly
classified (a priori) and 82% of the oil spills in the test set
were correctly classified. This was compared with a
compound probability classifier. Here pN2 / 3 gave a 85%
correct classification rate (a priori) of oil spills and 91% of
the oil spills in the test set were correctly classified. A
training set of 80 oil spills and 43 look-alikes and a test set
of 11 oil spills, 4 uncertain and 6 look-alikes were used.
In Solberg et al. (1999) is a probability assigned to a spot from a multivariate Gaussian density function. The
unknown parameters are derived from a signature database.
(Fiscella et al.’s method is in a similar way based on
previous measurements.) This is combined with a prior
model for the number of look-alikes, a model for the
presence of a slick in the vicinity of a bright object and a
rule-based modification of the probability density to take
into account feature combinations that are indications of
certain scene conditions. The leave-one-out method with 84
scenes gave a correct classification of 94% for oil spills.
An artificial neural network (NN) is a mathematical
model composed of many neurons10 operating in parallel.
An approach for oil spill detection, tested on ERS images,
based on a multilayer perceptron (MLP) neural network
with two hidden layers is described by Frate et al. (2000).
Selection of a dark object and image fragmentation is
performed with manual interaction, while feature extraction
and classification into oil spill or look-alike is performed
automatically. The input (to the net) is also here a feature
vector. The neuron is the elemental building block of each
layer in the net, and it is mainly characterized by an
activation function (in this case a non-linear sigmoid
function). The neuron computes the sum of its inputs, adds
a bias term, and drives the result through the activation
function. A single output is produced from each neuron.Using the leave-one-out method with 139 sample oil spills,
18% were reported misclassified as look-alikes.
The proposed automatic methods for oil spill detection
discussed here report accuracies from 82% to 94% correct
classification of oil spills. These studies are however
performed on different data sets, and the approaches differ
both in terms of segmentation approach, feature extraction
methods, and classification methodology. The most impor-
8 GLCM: a pproximates the grey level joint probability distribution
(Haralick, 1979).9 A surface fractal dimension corresponds closely to our intuitive
notion of roughness (Pentland, 1984).
10 A neuron is a non-linear computational element connected to other
neurons by links characterized by different weights (see also Bishop, 1995).
C. Brekke, A.H.S. Solberg / Remote Sensing of Environment 95 (2005) 1–1310
8/6/2019 Oil Spill RSE2005
http://slidepdf.com/reader/full/oil-spill-rse2005 11/13
tant steps in this process are segmentation and feature
extraction. If a slick is not detected during segmentation, it
cannot be classified correctly. If the features have good
discriminatory power, the classification problem will be
easier and several classifiers will work. We believe that the
variance in shape, contrast, and surroundings of oil slicks
and look-alikes is so large that it is necessary to subdividethe problem into subclasses, and to guide the classifier by
using as much prior information about the problem as
possible. This was done in the approach presented in
Solberg et al. (1999), which is the approach with the highest
accuracy reported so far.
6. Conclusion and suggestions for further work
Synthetic aperture radar is the most applicable space-
borne sensor for operational oil spill detection, mostly
because of its all-weather/all-day detection capabilities andwide coverage. It can operate from light wind to wind
speeds up to 12–14 m/s, but the maximum wind speed for
oil slick detection depends on oil type and age. Sensors
operating in wide swath mode with a spatial resolution of
50–150 m are found to be sufficient and allow covering
large ocean areas efficiently.
The largest challenge in detection of oil spills in SAR
images is accurate discrimination between oil spills and
look-alikes. Most low wind situations can be handled by
analysing the surroundings of a slick, but natural films
cannot always be properly distinguished from oil spills
based on a SAR image alone. Additional information about
algal blooms is desired, particularly for the Baltic Sea,
where alga is common during the summer. Such information
can be derived from optical sensors. Future oil spill systems
should incorporate alga information either from multisensor
studies, or by using prior knowledge about the likelihood of
observing alga in a given area at a certain time of the year.
For operational purposes, there is a need for coordination
between satellite overpasses and aerial surveillance flights.
Presently, aerial surveillance is needed for collecting
evidence to prosecute the polluters. The combination of
coordinated satellite image acquisitions and aerial surveil-
lance flights is presently used operationally by many
countries in Northern Europe. Many of these services usethe KSAT manual approach to identify oil spills from the
satellite images.
Future SAR missions are crucial for sustainable opera-
tional oil spill detection services. There is a number of
commercial SAR missions planned; the Japanese Advanced
Land-Observing Satellite (ALOS) and the European Terra-
SAR-L are both satellites with L-band SAR, which means
an increased wavelength (24 cm) compared to, e.g. ERS and
ENVISAT. TerraSAR-X and COSMO/SkyMed (dual use)
are German and Italian X-band satellites. TerraSAR-X will
have a best resolution of 1 m, but will also provide a
ScanSAR mode with 16 m resolution and 100 km swath
width. Concerning oil spill detection, the most promising of
the coming missions is RADARSAT-2 with its C-band
SAR. RADARSAT-2 is planned launched in 2005, and will
provide improved resolution and flexibility in selection of
polarization options (both single and full polarization modes
will be available). A future spaceborne C-band SAR to
replace ENVISAT ASAR would be needed to sustain thequality of the oil spill detection services. This is acknowl-
edge by ESA, as many other ocean applications use C-band
SAR images regularly.
A study of best practice of manual versus automatic oil
spill systems showed that operators show some variance in
detecting spills, particularly in assigning an oil spill
confidence estimate. An automatic algorithm with a reliable
and objective oil spill confidence estimate would be highly
desirable. The need for automatic algorithms depend on the
number of images to be analysed, but for monitoring large
ocean areas it is a cost-effective alternative to manual
inspection.More work on the direct comparison of the performance
of manual versus automatic methods for oil spill detection is
needed. Up to now, the automatic systems have been tested
off-line, thus, additional spills reported by the automatic
systems cannot be verified. We still believe that the slicks
classified as oil by automatic algorithms should go through
a manual inspection prior to sending out aircrafts. In that
case, inspection of a couple of slicks per scene would be
much more efficient than inspection of the complete scene
as currently done. As part of the ESA project Northern
View, NR’s automatic algorithm will be deployed in
KSAT’s operational environment.
Automatic oil spill detection algorithms are normally
divided into three steps, dark spot detection, dark spot feature
extraction, and dark spot classification. Few papers are
published on automatic algorithms for classification of oil
spills and its look-alikes as most authors focus on the
detection step. Large-scale classification studies with accept-
able classification performance are reported based on
statistical classification (Fiscella et al., 2000; Solberg et al.,
1999), and neural nets (Frate et al., 2000). An extensive
comparison of the classifiers used by the different
approaches, based on the same data set of features, would
be desirable.
To increase the performance further, incorporation of more knowledge is needed. We believe that the future oil
spill system should be an integrated system, including
automatic algorithms, a database of bhotspots Q (e.g. oilrigs,
sunken ships and seepages), ship lanes, alga information,
and more extensive use of wind information.
Acknowledgements
This work is performed as a part of a PhD study funded
by the Norwegian Research Council and the Norwegian
Defence Research Establishment. The authors would like to
C. Brekke, A.H.S. Solberg / Remote Sensing of Environment 95 (2005) 1–13 11
8/6/2019 Oil Spill RSE2005
http://slidepdf.com/reader/full/oil-spill-rse2005 12/13
thank the Oceanides project, in particular KSAT, for the
SAR scenes used for illustration purposes.
References
Assilzadeh, H., & Mansor, S. B. (2001). Early warning system for oil spillusing SAR images. Proc. ACRS 2001—22nd Asian Conference on
Remote Sensing, 5–9 November 2001, Singapore, vol. 1 (pp. 460– 465).
Barni, M., Betti, M., & Mecocci, A. (1995). A fuzzy approach to oil spill
detection on SAR images. Proc. IGARSS ’95, vol. 1 (pp. 157–159).
Benelli, G., & Garzelli, A. (1999). Oil-spills detection in SAR images by
fractal dimension estimation. Proc. IGARSS’99, vol. 1 (pp. 218–220).
Bentz, C., & de Miranda, F. P. (2001). Application of remote sensing data
for oil spill monitoring in the Guanabara Bay, Rio de Janeiro, Brazil.
Proc. IGARSS’01, vol. 1 (pp. 333–335).
Bern, T. -I., Moen, S., Wahl, T., Anderssen, T., Olsen, R., & Johannessen, J.
A., (1992a). Oil spill detection using satellite based SAR. Completion
report for Phase 0 and 1. Tech. rep., OCEANOR report no. OCN-
R92071, Trondheim.
Bern, T. -I., Wahl, T., Anderssen, T., & Olsen, R. (1992b, 4–6 November).
Oil spill detection using satellite based SAR: Experience from afield experiment. Proc. 1st ERS-1 Symposium, Cannes, France
(pp. 829–834).
Bishop, C. M. (1995). Neural networks for pattern recognition . Oxford
University Press.
Bjerde, K. W., Solberg, A. H. S., & Solberg, R. (1993). Oil spill detection in
SAR imagery. Proc. IGARSS’93, vol. 3 (pp. 943–945).
Canny, J. (1986). A computational approach to edge detection. IEEE
Transactions on Pattern Analysis and Machine Intelligence, PAMI , 8(6),
679–698.
Change, L. Y., Chen, K., Chen, C., & Chen, A. (1996). A multiplayer-
multiresolution approach to detection of oil slicks using ERS SAR
image. Proc. ACRS 1996—17th Asian Conference of Remote Sensing,
Sri Lanka.
Chen, C. F., Chen, K. S., Chang, L. Y., & Chen, A. J. (1997). The use of
satellite imagery for monitoring coastal environment in Taiwan. Proc. IGARSS’97 , vol. 3. (pp. 1424–1426).
Curlander, J. C., & McDonough, R. N. (1991). Synthetic aperture radar,
systems and signal processing. Wiley series in remote sensing . John
Wiley & Sons.
Dokken, S. T. (1995). Optimal bruk av avanserte radarsatellitter. Master’s
thesis, Institutt for Tekniske Fag, Norges Landbrukshbgskole.
Elachi, C. (1987). Introduction to the physics and techniques of remote
sensing . John Wiley & Sons.
ERS-2 Web-site. (2004). http://earth.esa.int/services/pg/pgerssarpri.xml,
accessed 20 October 2004.
Espedal, H. (1999). Detection of oil spill and natural film in the
marine environment by spaceborne SAR. Proc. IGARSS’99, vol. 3
(pp. 1478– 1480).
Espedal, H. A. (1998). Detection of oil spill and natural film in the marine
environment by spaceborne synthetic aperture radar. PhD thesis,Department of Physics University of Bergen and Nansen Environment
and Remote Sensing Center, Norway.
Espedal, H. A., & Johannessen, O. M. (2000). Detection of oil spills near
offshore installations using synthetic aperture radar (SAR). Interna-
tional Journal of Remote Sensing , 21(11), 2141 –2144.
Espedal, H. A., & Wahl, T. (1999). Satellite SAR oil spill detection using
wind history information. International Journal of Remote Sensing ,
20(1), 49– 65.
European Space Agency. (1998). Oil pollution monitoring. ESA brochure:
ERS and its applications—Marine, BR-128, 1.
European Space Agency. (2002). ASAR product handbook. Tech. rep.,
European Space Agancy-ENVISAT Product Handbook, Issue 1.1, 1
December 2002.
Fingas, M. (2001). The basics of oil spill cleanup. Lewis Publishers.
Fingas, M. F., & Brown, C. E. (1997). Review of oil spill remote sensing.
Spill Science and Technology Bulletin, 4, 199–208.
Fiscella, B., Giancaspro, A., Nirchio, F., Pavese, P., & Trivero, P. (2000).
Oil spill detection using marine SAR images. International Journal of
Remote Sensing , 21(18), 3561 –3566.
Fortuny-Guasch, J. (2003). Improved oil spill detection and classification
with polarimetric SAR. Proc. workshop on Application of SAR
Polarimery and Polarimetric Interferomet ry, ESA-ESRIN Frascati, Italy, January 14–16 2004, available at http://earth.esa.int/polinsar/
pr.html, accessed 1 September 2004.
Frate, F. D., Petrocchi, A., Lichtenegger, J., & Calabresi, G. (2000). Neural
networks for oil spill detection using ERS-SAR data. IEEE Transactions
on Geoscience and Remote Sensing , 38(5), 2282–2287.
Friedman, K. S., Pichel, W. G., Clemente-Colon, P., & Li, X. (2002).
GoMEx—an experimental GIS system for the Gulf of Mexico Region
using SAR and additional satellite and ancillary data. Proc. IGARSS’02,
vol. 6 (pp. 3343– 3346).
Gade, M., Alpers, W., & Bao, M. (1996). Measurements of the radar
backscattering over different oceanic surface films during the SIR-C/X-
SAR campaigns. Proc. IGARSS’96 (pp. 860–862).
Gade, M., & Redondo, J. (1999). Marine pollution in European coastal
waters monitored by the ERS-2 SAR: a comprehensive statistical
analysis. OCEANS ’99 MTS/IEEE Riding the Crest into the 21st century, vol. 3 (pp. 1239– 1243).
Gade, M., Scholz, J., & von Viebahn, C. (2000). On the detectability of
marine oil pollution in European marginal waters by means of ERS
SAR imagery. Proc. IGARSS 2000, vol. 6 (pp. 2510– 2512).
Gasull, A., Fabregas, X., Jimenez, J., Marques, F., Moreno, V., & Herrero,
M. (2002, September). Oil spills detection in SAR images using
mathematical morphology. Proc. EUSIPCO’2002, Toulouse, France,
vol. 1 (pp. 25–28).
Girard-Ardhuin, F., Mercier, G., & Garello, R. (2003). Oil slick detection
by SAR imagery: potential and limitation. Proc. OCEANS 2003, vol. 1
(pp. 164–169).
Goodman, R. (1994). Overview and future trends in oil spill remote
sensing. Spill Science and Technology Bulletin, 1(1), 11–21.
Haralick, R. M. (1979). Statistical and structural approaches to texture.
Proceedings of the IEEE , 67 , 786– 804.Hovland, H. A., Johannessen, J. A. (1994). Norwegian surface slick report,
Final report to Norwegian Defence Research Establishment and
Norwegian Space Centre. Tech. rep., Nansen Environmental and
Remote Sensing Center.
Hovland, H. A., Johannessen, J. A., & Digranes, G. (1994). Slick detection
in SAR images. Proc. IGARSS’94, vol. 4 (pp. 2038– 2040).
Hu, C., Mqller-Krager,F. E.,Taylor, C. J., Myhre,D., Murch, B.,Odriozola,A.
L., et al. (2003). MODIS detects oil spills in Lake Maracaibo, Venezuela.
EOS, Transactions, American Geophysical Union, 84(33), 313, 319.
Hu, M. -K. (1962). Visual pattern recognition by moment invariants. IEEE
Transactions on Information Theory, 8, 179–187.
Indregard, M., Solberg, A., Clayton, P. (2004). D2-report on benchmarking
oil spill recognition approaches and best practice. Tech. rep., Oceanides
project, European Commission, Archive No. 04-10225-A-Doc, Con-
tract No: EVK2-CT-2003-00177.Ivanov, A., He, M. -X., Fang, M. -Q. (2002). Oil spill detection with the
RADARSAT SAR in the waters of the Yellow and East China Sea: A
case study. Proc. ACRS 2002—23rd Asian Conference on Remote
Sensing, November 25–29, 2002, Kathmandu, Nepal .
Jones, B. (2001). A comparison of visual observations of surface oil with
synthetic aperture radar imagery of the Sea Empress oil spill. Interna-
tional Journal of Remote Sensing , 22(9), 1619–1638.
Kanaa, T. F. N., Tonye, E., Mercier, G., Onana, V., Ngono, J., Frison, P.,
et al. (2003). Detection of oil slick signatures in SAR images by
fusion of hysteresis thresholding responses. Proc. IGARSS’03, vol. 4
(pp. 2750–2752).
Keller, J. M., Chen, S., & Crownover, R. M. (1989). Texture description
and segmentation through fractal geometry. Computer Vision, Graphics,
and Image Processing , 45, 150–166.
C. Brekke, A.H.S. Solberg / Remote Sensing of Environment 95 (2005) 1–1312

8/6/2019 Oil Spill RSE2005
http://slidepdf.com/reader/full/oil-spill-rse2005 13/13
Kotova, L. A., Espedal, H. A., & Johannessen, O. M. (1998). Oil spill
detection using spaceborne SAR; a brief review. Proc. 27th ISRSE,
Tromsb, Norway.
Kubat, M., Holte, R. C., & Matwin, S. (1998). Machine learning for the
detection of oil spills in satellite radar images. Machine Learning , 30,
195–215.
Laur, H., Bally, P., Meadows, P., Sanchez, J., Schaettler, B., Lopinto, E.,
et al. (2002). Derivation of the backscattering coefficient (0 in ESAERS SAR PRI products. Tech. rep., Document No.: ES-TN-RS-PM-
HL09, Issue 2, Rev. 5d, 17. September, European Space Agency
(ESA).
Leberl, F. W. (1990). Radargrammetric image processing . Artech House.
Lee, J. -S. (1981). Speckle analysis and smoothing of synthetic aperture
radar images. Computer Graphics and Image Processing , 17 , 24– 32.
Litovchenko, K., Ivanov, A., & Ermakov, S. (1999). Detection of oil slicks
parameters from ALMAZ-1 and ERS-1 SAR imagery. Proc.
IGARSS’99, vol. 3 (pp. 1484– 1486).
Liu, A. K., Peng, C. Y., & Chang, S. Y. -S. (1997). Wavelet analysis of
satellite images for coastal watch. IEEE Journal of Oceanic Engineer-
ing , 22(1), 9–17.
Lu, J. (2003). Marine oil spill detection, statistics and mapping with ERS
SAR imagery in south-east Asia. International Journal of Remote
Sensing , 24(15), 3013– 3032.Lu, J., Lim, H., Liew, S. C., Bao, M., & Kwoh, L. K. (1999). Ocean oil
pollution mapping with ERS synthetic aperture radar imagery. Proc.
IGARSS’99, vol. 1 (pp. 212–214).
Maio, A. D., Ricci, G., & Tesauro, M. (2001). On CFAR detection of oil
slicks on the ocean surface by multifrequency and/or multipolariza-
tion SAR. In Radar conference, 2001. Proceedings of the 2001 IEEE
(pp. 351–356).
Manore, M. J., Vachon, P. W., Bjerkelund, C., Edel, H. R., & Ramsay, B.
(1998). Operational use of RADARSAT SAR in the coastal zone: The
Canadian experience. 27th International Symposium on Remote Sensing
of the Environment, Tromsø, Norway, June 8–12 (pp. 115– 118).
Martinez, A., & Moreno, V. (1996). An oil spill monitoring system based
on SAR images. Spill Science and Technology Bulletin, 3(1/2), 65–71.
Mercier, G., Derrode, S., Pieczynski, W., Caillec, J. -M. L., & Garello, R.
(2003). Multiscale oil slick segmentation with Markov Chain Model. Proc. IGARSS’03, vol. 6 (p p. 3501–3503).
Oceanides Web-site. (2004). http://oceanides.jrc.cec.eu.int/prestige.html,
accessed 13 August 2004.
Pavlakis, P., Sieber, A., & Alexandry, S. (1996, June). Monitoring oil-spill
pollution in the Mediterranean with ERS SAR. ESA Earth Observation
Quarterly (52).
Pentland, A. P. (1984). Fractal-based description of natural scenes. IEEE
Transactions on Pattern Analysis and Machine Intelligence, PAMI , 6 (6),
661–674.
Perez-Marrodan, M. (1998). ENVISYS—environmental monitoring warn-
ing and emergency management system. Proc. of the AFCEA Kiev
Seminar, 28–29 May (pp. 122–132).
RADARSAT International. (2000). D4, RADARSAT, data products
specification. Tech. rep., Doc. No: RSI-GS-026, RADARSAT
International.Robinson, I. S. (1994). Satellite oceanography. An introduction for
oceanographers and remote-sensing scientists. Wiley–Praxis series in
remote sensing.
Salem, F., & Kafatos, P. M. (2001). Hyperspectral image analysis for oil
spill mitigation. Proc. ACRS 2001—22nd Asian Conference on Remote
Sensing, 5–9 November 2001, Singapore, vol. 1 (pp. 748–753).
Salvatori, L., Bouchaib, S., Frate, F. D., Lichtenneger, J., & Samara, Y.
(2003). Estimating the wind vector from radar SAR images when
applied to the detection of oil spill pollution. Fifth International
Symposium on GIS and Computer Catography for Coastal Zone
Management, CoastGIS’03.
Shepherd, I. (2004). Developing an operational oil-spill service in GMES.
Version 2, OC EANIDES workshop, 25 May, 2004, EEA, Copenhagen,
available at: http://intelligence.jrc.it/marine/oceanides/oceanides.html,
accessed 23 August 2004.
Shepherd, I., Bauna, T., Chesworth, J., Kourti, N., Lemoine, G., &
Indregard, M. (2004). Use of ENVISAT at JRC for marine monitoring
in 2003. JRC TechnicalNote, (available at: http://pta.jrc.cec.eu.int/entity.
gx/entity.object/SEC–000000000002CB39/entity.name/envisatreport-7.pdf , accessed 23 August 2004).
Shepherd, N. (2000). Extraction of beta nought and sigma nought from
RADARSAT CDPF products. Tech. rep., Report No.: AS97-5001, Rev.
4–28 April, Altrix Systems.
Simecek-Beatty, D., & Clemente-Colon, P. (2004). Locating a sunken
vessel using SAR imagery: Detection of oil spilled from the SS
Jacob Luckenbach. International Journal of Remote Sensing , 25(11),
2233–2241.
Sk belv, 2., Wahl, T. (1993). Oil spill detection using satellite based SAR,
Phase 1B competition report. Tech. rep., Norwegian Defence Research
Establishment.
Solberg, A. H. S., Dokken, S. T., & Solberg, R. (2003). Automatic detection
of oil spills in Envisat, Radarsat and ERS SAR images. Proc.
IGARSS’03, vol. 4 (pp. 2747– 2749).
Solberg, A. H. S., & Solberg, R. (1996). A large-scale evaluation of featuresfor automatic detection of oil spills in ERS SAR images. Proc.
IGARSS’96 , vol. 3 (pp. 1484– 1486).
Solberg, A. H. S., Storvik, G., Solberg, R., & Volden, E. (1999). Automatic
detection of oil spills in ERS SAR images. IEEE Transactions on
Geoscience and Remote Sensing , 37 (4), 1916–1924.
Solberg, A. H. S., & Volden, E. (1997). Incorporation of prior knowledge in
automatic classification of oil spills in ERS SAR images. Proc.
IGARSS’97 , vol. 1 (pp. 157–159).
Sonka, M., Hlavac, V., & Boyle, R. (1999). Image processing, analysis, and
machine vision. Brooks/Cole Publishing.
Trieschmann, O., Huns7 nger, T., Tufte, L., & Barjenbruch, U. (2003). Data
assimilation of an airborne multiple remote sensor system and of
satellite images for the North- and Baltic sea. Proceedings of the SPIE
10th int. symposium on remote sensing, conference bremote sensing of
the ocean and sea ice 2003 Q (pp. 51–60).Tseng, W. Y., & Chiu, L. S. (1994). AVHRR observations of Persian Gulf
oil spills. Proc. IGARSS’94, vol. 2 (pp. 779–782).
Ulaby, F. T., Moore, R. K., & Fung, A. K. (1986). Microwave remote
sensing: Active and passive. Vol. 3: From Theory to Applications.
Artech house.
Vachon, P. W., Thomas, S. J., Cranton, J. A., Bjerkelund, C., Dobson,
F. W., & Olsen, R. B. (1998). Monitoring the coastal zone with
the RADARSAT satellite. Oceanology International 98, UK, March
10–13, 10 pages.
Wahl, T., Anderssen, T., Sk belv, 2. (1994a). Oil spill detection using
satellite based SAR, Pilot Operation Phase, final report. Tech. rep.,
Norwegian Defence Research Establishment.
Wahl, T., Sk belv, 2., & Andersen, J. H. S. (1994b). Practical use of
ERS-1 SAR images in pollution monitoring . Proc. IGARSS’94, vol. 4
(pp. 1954–1956).Wahl, T., Sk belv, 2., Pedersen, J. P., Seljelv, L. -G., Andersen, J. H.,
Follum, O. A., et al. (1996). Radar satellites: A new tool for pollution
monitoring in coastal waters. Coastal Management , 24, 61– 71.
Wu, S. Y., & Liu, A. K. (2003). Towards an automated ocean feature
detection, extraction and classification scheme for SAR imagery.
International Journal of Remote Sensing , 24(5), 935–951.
Zhifu, S., Kai, Z., Baojiang, L., & Futao, L. (2002). Oil-spill
monitoring using microwave radiometer. Proc. IGARSS’02, vol. 5
(pp. 2980– 2982).
C. Brekke, A.H.S. Solberg / Remote Sensing of Environment 95 (2005) 1–13 13