oil recovery through deemulsification research
TRANSCRIPT
University of Arkansas, FayettevilleScholarWorks@UARKChemical Engineering Undergraduate HonorsTheses Chemical Engineering
8-2008
Oil recovery through deemulsification research :separation of water from emulsified oilAaron RussellUniversity of Arkansas, Fayetteville
Matthew S. ClayUniversity of Arkansas, Fayetteville
Christopher A. CoxUniversity of Arkansas, Fayetteville
Jessica E. NicholsUniversity of Arkansas, Fayetteville
Summer ScottUniversity of Arkansas, Fayetteville
See next page for additional authors
Follow this and additional works at: http://scholarworks.uark.edu/cheguht
This Thesis is brought to you for free and open access by the Chemical Engineering at ScholarWorks@UARK. It has been accepted for inclusion inChemical Engineering Undergraduate Honors Theses by an authorized administrator of ScholarWorks@UARK. For more information, please [email protected], [email protected].
Recommended CitationRussell, Aaron; Clay, Matthew S.; Cox, Christopher A.; Nichols, Jessica E.; Scott, Summer; and Surawanvijit, Sirikarn, "Oil recoverythrough deemulsification research : separation of water from emulsified oil" (2008). Chemical Engineering Undergraduate HonorsTheses. 56.http://scholarworks.uark.edu/cheguht/56

AuthorAaron Russell, Matthew S. Clay, Christopher A. Cox, Jessica E. Nichols, Summer Scott, and SirikarnSurawanvijit
This thesis is available at ScholarWorks@UARK: http://scholarworks.uark.edu/cheguht/56
WERC International Environmental Design Competition Responsibilities
Aaron Russell
The purpose of this project was to develop an industrial process to separate an emulsion of oil and
water that is used as a lubricant and coolant in copper rolling mills. The process developed was supposed
to be designed in such a way that the maximum amount of each component could be recovered in an
environmentally friendly way and subsequently recycled. Once a process was developed, the teams were
required to construct a working, bench scale model of the process, as well as formulate a full scale design.
I was one of six team members and I served as the research coordinator for the team. As the research
coordinator, my main responsibilities included planning and conducting laboratory experiments and
developing and demonstrating the bench scale apparatus.
I was also involved initially in the research that was done regarding known emulsion separation
techniques. Through our research we were able to determine six separation techniques that we would be
able to both test in the laboratory and adapt into a full scale design. The separation techniques we decided
to test were thermal separation, centrifugation, acidification, hydrophobic ultrafiltration, hydrophilic
ultrafiltration, and evaporation. The majority of the work that I did involved coordinating and performing
the experiments to test the effectiveness of each of these technologies when applied to samples of the
emulsion. The testing showed thermal separation, centrifugation, and hydrophobic ultrafiltration to be
unable to achieve a significant degree of separation of the oil and water. Acidification, evaporation, and
hydrophilic ultrafiltration each achieved excellent separation and, considering the environmental and
economic implications of each technology, we ultimately decided to use a combination of hydrophilic
ultrafiltration followed by evaporation. Also, after discovering the contaminants present in the water
phase, we decided to treat the resulting water phase with a reverse osmosis system.
The next major responsibility that I had was the development and optimization of the bench scale
system. Fortunately for us, most of the equipment that we need to put our system together was readily
available within the department. Once the system was put together, many optimization tests had to be
performed. These tests allowed us to determine the conditions at which we needed to run the system to
ensure that we were able to meet the quality requirements of the competition while also staying within the
time limit.
When it finally came time for the competition, my final responsibility came in the form of the
presentation of our results. I was one of four people responsible for writing and giving a section of our
presentation before a panel of 12-15 judges. I also helped in the development and presentation of a poster
that summarized our process. My final responsibility was to demonstrate our bench scale system to
produce samples of our products for judging. After three days of competition against seven other teams,
our team took home first place.
WERC TASK 5 SPRING 2008
Oil Recovery through DeEmulsification Research
Ralph E. Martin Department of Chemical Engineering
University of Arkansas Fayetteville, AR 72701
Separation of Water from Emulsified Oil
WERC Task 5
Ralph E. Martin Department of Chemical Engineering
University of Arkansas
Fayetteville, AR 72701
PROJECT O.R.D.E.R.
Oil Recovery through De-Emulsification Research
Team Members:
Matthew S. Clay
Christopher A. Cox
Jessica E. Nichols
Aaron G. Russell
Summer N. Scott
Sirikarn Surawanvijit
Advisors:
Dr. W. Roy Penney
Dr. Gregory J. Thoma
Page | 1 Task 5 – University of Arkansas
TABLE OF CONTENTS
TABLE OF CONTENTS ................................................................................................................ 2
EXECUTIVE SUMMARY ............................................................................................................ 3
INTRODUCTION .......................................................................................................................... 5
SITE SELECTION ......................................................................................................................... 6
PROCESS SELECTION ................................................................................................................ 7
De-emulsification Techniques .................................................................................................... 7
Water Recovery .......................................................................................................................... 8
Oil Recovery ............................................................................................................................... 9
Copper Recovery ........................................................................................................................ 9
BENCH-SCALE TESTING AND DESIGN .................................................................................. 9
Lab Testing ................................................................................................................................. 9
Bench-Scale Design .................................................................................................................. 11
PROCESS OPTIMIZATION........................................................................................................ 13
RO Optimization ....................................................................................................................... 13
FULL-SCALE DESIGN ............................................................................................................... 14
ECONOMIC ANALYSIS AND BUSINESS PLAN ................................................................... 18
Economy of Scale ..................................................................................................................... 19
REGULATORY CONSIDERATIONS ........................................................................................ 21
Environmental ........................................................................................................................... 22
Health and Safety ...................................................................................................................... 23
Community Right-to-Know ...................................................................................................... 23
CONCLUSIONS AND RECOMMENDATIONS ....................................................................... 24
REFERENCES ............................................................................................................................. 25
AUDITS ........................................................................................................................................ 26
Page | 2 Task 5 – University of Arkansas
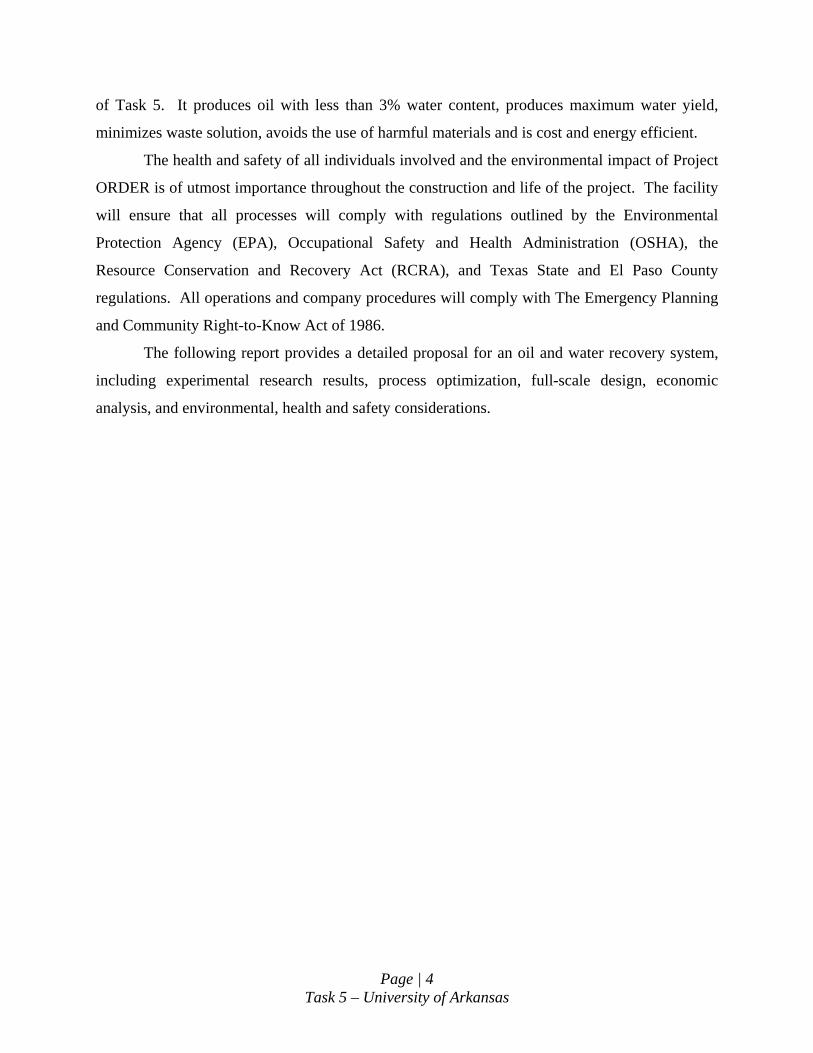
EXECUTIVE SUMMARY
In an effort to improve the environment, there is a need to recover and reuse the oil and
water components of lubricating emulsions used in copper drawing and rolling processes. The
Freeport-McMoRan Copper and Gold Inc. copper rod mill located in El Paso, TX was chosen as
the site location for this project. It is one of the largest rolling and drawing operation facilities in
the world, and it meets the established criteria set by Project ORDER. A large facility generates
an average of 8,400 gallons of spent lubricant per day. The WERC emulsion sample contains 98
v% water and 2 v% lubricating oil and contains metal debris that would negatively impact water
quality if it were discharged into surface waters. Oil and water are valuable resources and their
maximum recoveries are desired. Project ORDER successfully recovers more than 90 v% of the
water and essentially all of the oil. The recovered water could be recycled for fresh lubricant
production within the facility, eliminating almost all water discharge and reducing water intake.
The recovered oil will be sent to oil recyclers, lowering discharge expenses.
Project ORDER has carefully evaluated several water recovery, oil recovery, and metal
recovery technologies to design the commercial process. The first processing step of Project
ORDER is an ultrafiltration (UF) membrane that recovers 90 v% of the water in the spent
emulsion sample. As water permeates the membrane, the concentration of oil in the emulsion
increases from about 2 v% to 30 v%. The second processing step removes essentially all of the
water from the UF concentrate using an evaporator, which operates by passing low pressure
steam through a jacketed, agitated vessel. The third processing step removes metal debris from
the oil using a depth filter. The fourth processing step utilizes a reverse osmosis (RO) membrane
to purify the UF permeate water for recycle. The fifth processing step reduces the amount of
waste from the RO reject using an evaporator, which also operates by passing low pressure steam
through a jacketed, agitated vessel. The evaporator removes essentially all of the water in the
RO reject and the remaining waste is sent for disposal. The evaporated water from both
evaporation units is condensed and combined with the RO permeate to be recycled.
Based on a spent emulsion production rate of 8,400 gal/day, it costs $793, 000 per year
for current disposal by incineration. For Project ORDER the fixed capital investment is
$899,000, the yearly operating cost is $528,000, and the net present worth is $413,000 with a
24% discounted rate of return. After the initial investment is recovered, Project ORDER results
in a net savings of $265,000 per year. This project is a promising process to achieve all the goals
Page | 3 Task 5 – University of Arkansas
of Task 5. It produces oil with less than 3% water content, produces maximum water yield,
minimizes waste solution, avoids the use of harmful materials and is cost and energy efficient.
The health and safety of all individuals involved and the environmental impact of Project
ORDER is of utmost importance throughout the construction and life of the project. The facility
will ensure that all processes will comply with regulations outlined by the Environmental
Protection Agency (EPA), Occupational Safety and Health Administration (OSHA), the
Resource Conservation and Recovery Act (RCRA), and Texas State and El Paso County
regulations. All operations and company procedures will comply with The Emergency Planning
and Community Right-to-Know Act of 1986.
The following report provides a detailed proposal for an oil and water recovery system,
including experimental research results, process optimization, full-scale design, economic
analysis, and environmental, health and safety considerations.
Page | 4 Task 5 – University of Arkansas
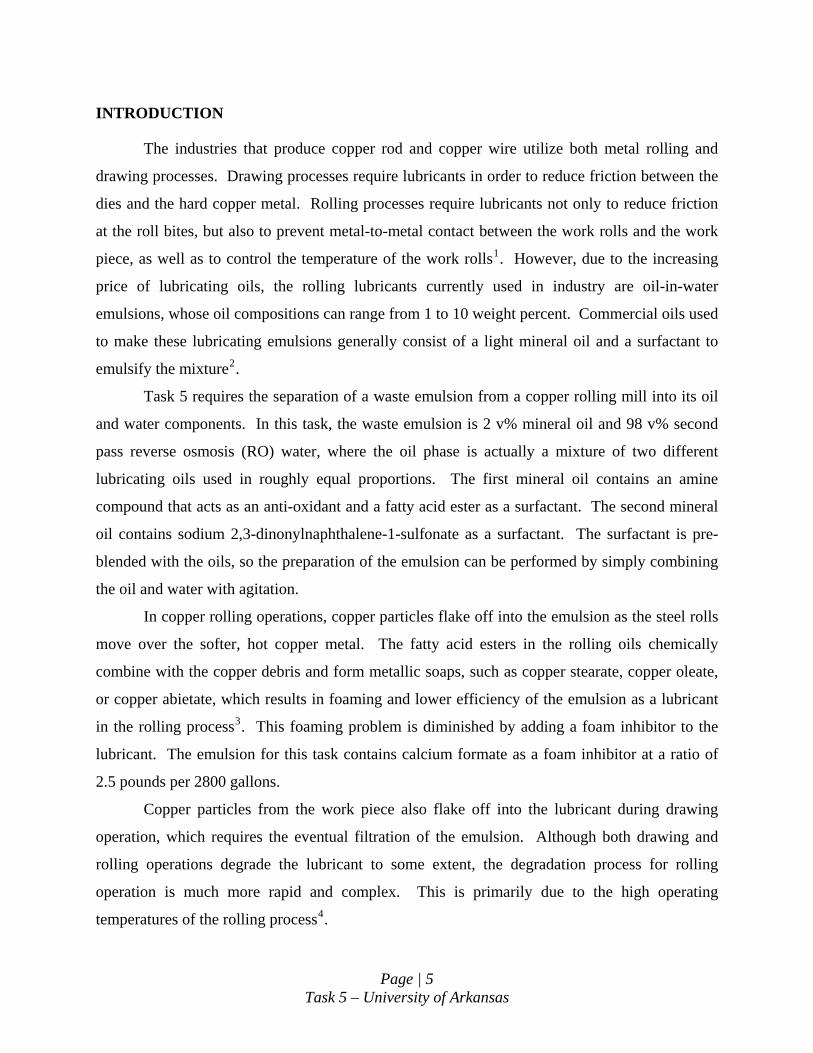
INTRODUCTION
The industries that produce copper rod and copper wire utilize both metal rolling and
drawing processes. Drawing processes require lubricants in order to reduce friction between the
dies and the hard copper metal. Rolling processes require lubricants not only to reduce friction
at the roll bites, but also to prevent metal-to-metal contact between the work rolls and the work
piece, as well as to control the temperature of the work rolls1. However, due to the increasing
price of lubricating oils, the rolling lubricants currently used in industry are oil-in-water
emulsions, whose oil compositions can range from 1 to 10 weight percent. Commercial oils used
to make these lubricating emulsions generally consist of a light mineral oil and a surfactant to
emulsify the mixture2.
Task 5 requires the separation of a waste emulsion from a copper rolling mill into its oil
and water components. In this task, the waste emulsion is 2 v% mineral oil and 98 v% second
pass reverse osmosis (RO) water, where the oil phase is actually a mixture of two different
lubricating oils used in roughly equal proportions. The first mineral oil contains an amine
compound that acts as an anti-oxidant and a fatty acid ester as a surfactant. The second mineral
oil contains sodium 2,3-dinonylnaphthalene-1-sulfonate as a surfactant. The surfactant is pre-
blended with the oils, so the preparation of the emulsion can be performed by simply combining
the oil and water with agitation.
In copper rolling operations, copper particles flake off into the emulsion as the steel rolls
move over the softer, hot copper metal. The fatty acid esters in the rolling oils chemically
combine with the copper debris and form metallic soaps, such as copper stearate, copper oleate,
or copper abietate, which results in foaming and lower efficiency of the emulsion as a lubricant
in the rolling process3. This foaming problem is diminished by adding a foam inhibitor to the
lubricant. The emulsion for this task contains calcium formate as a foam inhibitor at a ratio of
2.5 pounds per 2800 gallons.
Copper particles from the work piece also flake off into the lubricant during drawing
operation, which requires the eventual filtration of the emulsion. Although both drawing and
rolling operations degrade the lubricant to some extent, the degradation process for rolling
operation is much more rapid and complex. This is primarily due to the high operating
temperatures of the rolling process4.
Page | 5 Task 5 – University of Arkansas
As the lubricating emulsion is applied to the rollers, it is exposed to high surface
temperatures, ranging between 1,570 to 1,620 degrees Fahrenheit, in addition to the high friction
loads of the rolling operation. This causes the oil to thermally and mechanically degrade,
lowering the lubricity and effectiveness of the emulsion. This degradation is similar to the
breakdown that occurs with motor oil in an engine. Moreover, in addition to metal flakes, the
emulsion also collects copper oxides during the rolling process. The copper exposed to the air
becomes oxidized, forming an undesired copper oxide film on the surface of the metal5. This
film grows thicker due to the elevated diffusion of oxygen and continuous reactivity with metal
in the open atmosphere. The emulsion reduces this effect by cleaning debris, mostly metal fines
and oxides, from the surface.
As the emulsion collects copper oxides and other metal particles, it can be filtered and
recycled until it is degraded to a point where it can no longer be used. Although most copper
oxides can be easily filtered, there are some of the particles which are so fine that they collect at
the interface between the oil droplets and the water phase, making them almost impossible to
remove by filtration. The smallest particles accumulate in the emulsion over time and bridge
between the steel rolls and the copper work piece, reducing the lubricating effectiveness. An
obvious indication that the emulsion is no longer usable is the buildup of copper debris on the
steel rolls. This debris buildup, along with oil degradation, eventually reduces the lubricating
effectiveness to the extent that the emulsion must be replaced.
The emulsion cannot be discharged to the sewer; consequently other disposal methods are
used. The conventional disposal method is incineration7. Incineration is not economical or
environmentally friendly: the energy costs are high and the oil and water components are
wasted. There is a need for a disposal method that recovers and recycles these valuable
resources.
SITE SELECTION
Project ORDER was designed as a battery limits addition to an existing copper rolling
and/or drawing process. The primary criteria used to determine a logical location for this process
addition were: (1) The use of an emulsion lubricant in a copper rolling and/or drawing process
and (2) the need for the recovery and reuse of valuable resources from the spent emulsion
discharge.
Page | 6 Task 5 – University of Arkansas
Freeport-McMoRan Copper and Gold Inc., the world’s largest publicly traded copper
company, uses a similar emulsion as the lubricant in their copper drawing and rolling processes.
This company’s operation nearest to the University of Arkansas is located in El Paso, Texas6.
The El Paso copper rod mill was chosen as the site location for this project, as it is one of the
largest rolling and drawing operation facilities and meets the established criteria.
PROCESS SELECTION
De-emulsification Techniques
After losing its effectiveness, lubricating emulsions used in copper drawing and rolling
operations must be separated to recover the oil and water components. While several methods of
separation were considered, the most common techniques for separating oil-in-water emulsions
are listed in Table 1.
Hydrophobic ultrafiltration, heating, and solvent dilution techniques proved ineffective in
lab tests when used alone, largely due to the surfactants in the emulsion. While acidification will
successfully separate the emulsion, it results in the production of undesired by-products, such as
metal salts, and involves higher health and environmental risks. Also, established by lab testing,
acidification results in the formation of a third, emulsified phase that would require additional
separation. Although no single, viable method for complete separation was presented,
hydrophilic ultrafiltration followed by another technique was determined to be a promising
option.
A hydrophilic ultrafiltration (UF) membrane exhibits an affinity to water. Due to its
selectivity, water in the feed emulsion can be forced by pressure to permeate the membrane. The
remaining water, oil, and metal fines can be re-circulated to pass through the membrane loop
again. The emulsion can then be concentrated to approximately 30 v% oil and 70 v% water.
This composition allows more than 90% of the water from the feed emulsion to be recovered in
the UF permeate. The remaining emulsion concentrate can then be separated more easily due to
its reduced water content. Ultrafiltration is also an economical option due to its low operating
pressures.
Page | 7 Task 5 – University of Arkansas
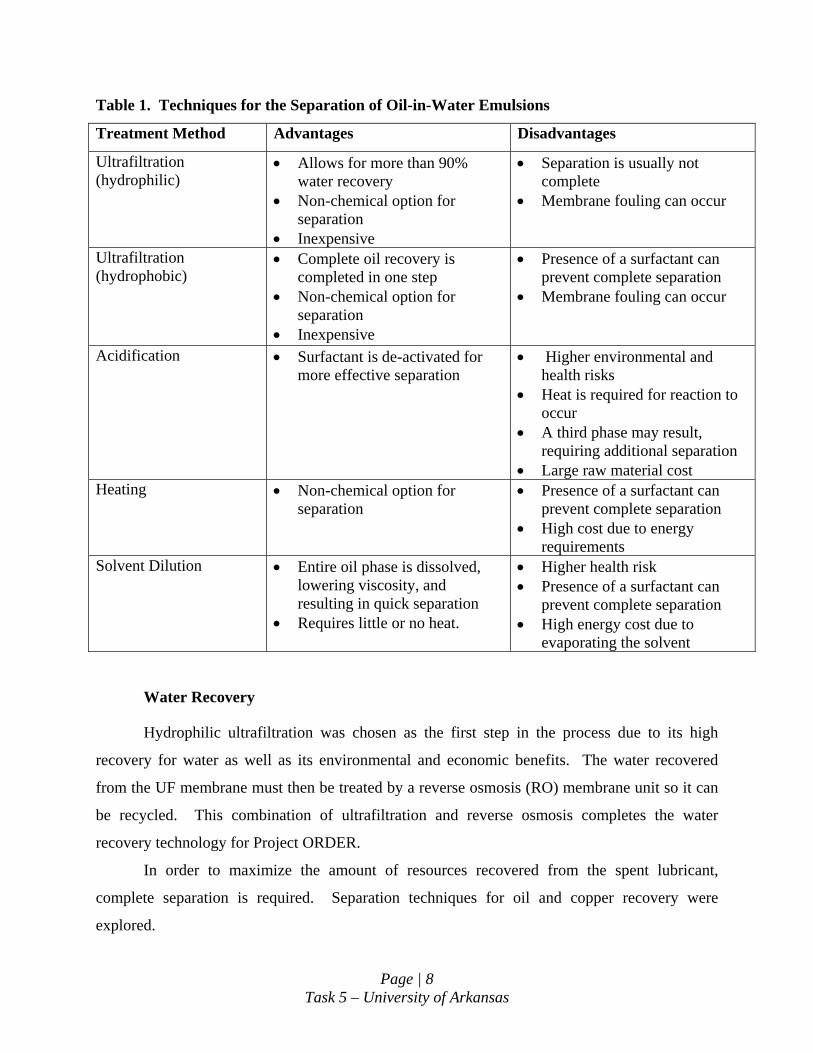
Table 1. Techniques for the Separation of Oil-in-Water Emulsions
Treatment Method Advantages Disadvantages
Ultrafiltration (hydrophilic)
• Allows for more than 90% water recovery
• Non-chemical option for separation
• Inexpensive
• Separation is usually not complete
• Membrane fouling can occur
Ultrafiltration (hydrophobic)
• Complete oil recovery is completed in one step
• Non-chemical option for separation
• Inexpensive
• Presence of a surfactant can prevent complete separation
• Membrane fouling can occur
Acidification • Surfactant is de-activated for more effective separation
• Higher environmental and health risks
• Heat is required for reaction to occur
• A third phase may result, requiring additional separation
• Large raw material cost Heating • Non-chemical option for
separation • Presence of a surfactant can
prevent complete separation • High cost due to energy
requirements Solvent Dilution • Entire oil phase is dissolved,
lowering viscosity, and resulting in quick separation
• Requires little or no heat.
• Higher health risk • Presence of a surfactant can
prevent complete separation • High energy cost due to
evaporating the solvent
Water Recovery
Hydrophilic ultrafiltration was chosen as the first step in the process due to its high
recovery for water as well as its environmental and economic benefits. The water recovered
from the UF membrane must then be treated by a reverse osmosis (RO) membrane unit so it can
be recycled. This combination of ultrafiltration and reverse osmosis completes the water
recovery technology for Project ORDER.
In order to maximize the amount of resources recovered from the spent lubricant,
complete separation is required. Separation techniques for oil and copper recovery were
explored.
Page | 8 Task 5 – University of Arkansas
Oil Recovery
While the oil may have undergone degradation, if it can be reduced to less than 3 v%
water, oil recyclers may purchase the oil for its remaining energy content. Several technologies
were evaluated to achieve the water content goal, including acidification, evaporation,
hydrophobic ultrafiltration, and the use of coalescers.
The use of coalescers and hydrophobic ultrafiltration were unsuccessful in breaking both
the original spent emulsion and the concentrated emulsion in lab tests. This failure is most likely
due to the highly effective surfactants present in the oils. Acidification was proved in lab tests to
successfully separate the emulsion, however, as mentioned previously, it entails higher
environmental and health risks. Evaporation with agitation proved to be effective in lab testing,
removing essentially all of the water from the ultrafiltration concentrate. Due to small
concentrate volumes, energy costs are relatively low for evaporation and it is an economical
option. For these reasons, evaporation was selected as the oil recovery method for Project
ORDER.
Copper Recovery
Copper is an economically valuable material and should be recovered from the spent
lubricant. Most of this debris is left in the recovered oil stream. In lab tests, depth filtration was
shown to be a successful method for removing copper from the oil recovered by evaporation.
Copper cementation was also considered; however, this method can only be used after
acid addition. Due to environmental and health concerns, this option was discarded.
BENCH-SCALE TESTING AND DESIGN
Lab Testing
The experiments performed by Project ORDER tested the effectiveness of six different
emulsion separation technologies, while evaluating their viability on the industrial scale. The
experimental results of each technology option are discussed below. The ultimate decision was
based on four main considerations: separation effectiveness, total recovery, economic feasibility,
and environmental ramifications.
1) Thermal Separation - The first experiment conducted tested heat as a possible means of
separating the emulsion. This involved heating a sample of the spent emulsion to 200 oF
Page | 9 Task 5 – University of Arkansas
for 20 minutes. A thin, reddish-brown, liquid layer formed at the top of the emulsion,
which indicated that some separation occurred. However, the bottom layer maintained
the same consistency throughout the experiment which indicated that heat, alone, does
not allow a complete separation.
2) Gravity Separation - This experiment tested the effects of gravity on emulsion separation.
A sample was centrifuged from 5 to 20 minutes at 14,336 G’s. This resulted in the
appearance of three phases: an oily phase, the emulsion, and a small solid phase. While it
was apparent that a small amount of separation had occurred, the emulsion layer
remained unchanged in consistency and appearance indicating that gravity separation
would not be sufficient.
3) Acid Separation - This experiment utilized acid to break the spent emulsion. The
emulsion was treated with HCl to a concentration of 0.3 w% and then heated to 200 oF
for approximately 40 minutes. The sample was then allowed to cool and settle for several
hours. This technique was tested on both the original emulsion and the concentrate from
the hydrophilic UF membrane (discussed below). This procedure appeared to result in a
clean separation of the oil and aqueous layers. However, as the sample was decanted, it
became apparent that a third, “rag” layer had formed in between the oil and water layers.
The rag layer made complete separation extremely difficult. Several different methods
were tested to handle this layer including gravity, coalescers of varying types, and solvent
extraction. None of them were completely effective. The acid itself presented an
additional problem with this technique. The aqueous stream from either sample would
have to be neutralized and treated further before it could be recycled or disposed, creating
more waste.
4) Hydrophobic UF Membrane - This experiment involved the use of a flat sheet
polytetrafluoroethylene (PTFE) hydrophobic membrane to allow only the oil phase to
permeate the membrane and, in turn, concentrate the water phase and any contaminants.
This method was tested on three different samples: the original spent emulsion; the
concentrate from the hydrophilic membrane (discussed below), and the oil and rag layers
from an acidified sample. This technique failed to complete the desired separation for all
three samples.
Page | 10 Task 5 – University of Arkansas
5) Hydrophilic UF Membrane - The method that produced the best results was the use of a
flat sheet hydrophilic membrane to allow only the water phase to permeate and to
concentrate the oil phase and contaminants. Using this membrane, over 90% of the
volume of the original emulsion could be removed as permeate, leaving a concentrate that
was approximately 30 v% oil. The aqueous permeate was then treated with an RO
system to purify it to the point that it could be recycled.
6) Evaporation – Simply evaporating the water from the spent emulsion in its original state
would not be economically feasible. However, once the emulsion was processed through
the hydrophilic membrane, evaporation proved to be the most effective method for
separating the remaining water from the concentrate. This process results in steam that
can be immediately condensed and recycled directly, and an oil stream that can simply be
filtered to remove solid copper contaminants and sent to oil recyclers.
Bench-Scale Design
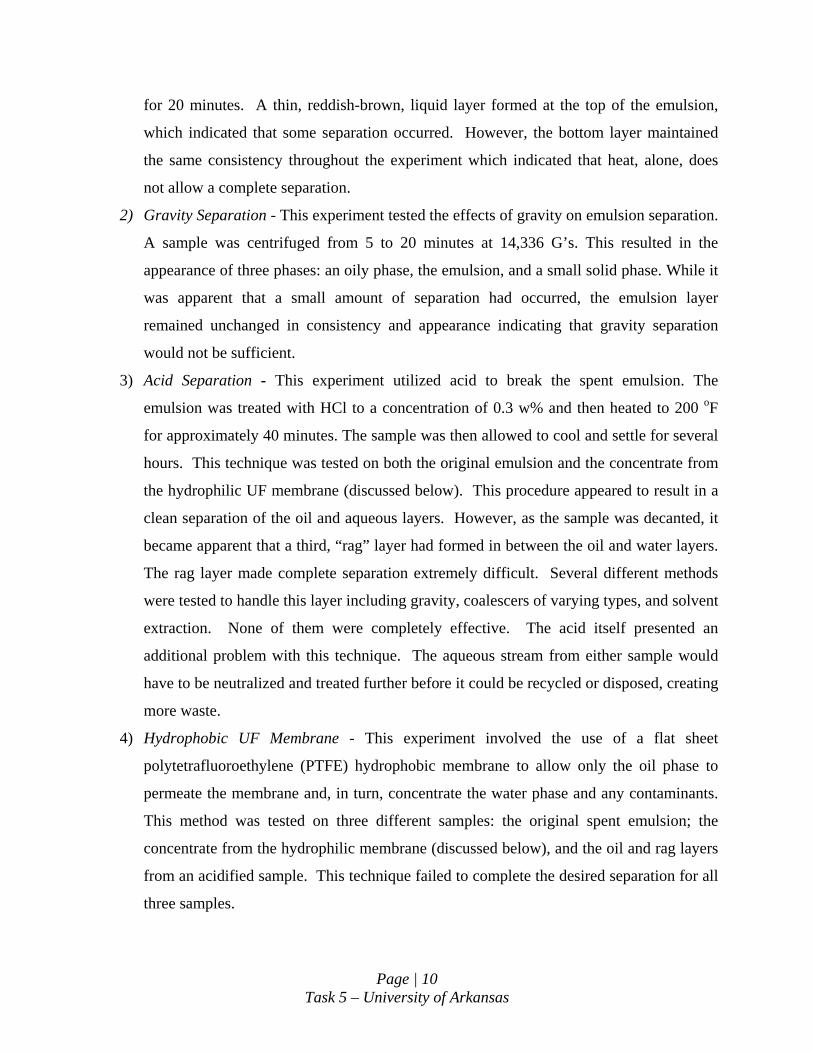
The bench-scale process uses a hydrophilic UF membrane (1) to recover approximately
90 v% of the water from the original spent emulsion. The specific membrane for this unit is a
flat sheet, 10,000 molecular weight cut-off, polyethersulfone membrane with an active area of
33.7 in2. The UF unit is a commercially available bench top system with an operating pressure
range of 0-75 psi and a recirculation flow rate of up to 12 liters per minute (LPM). The UF
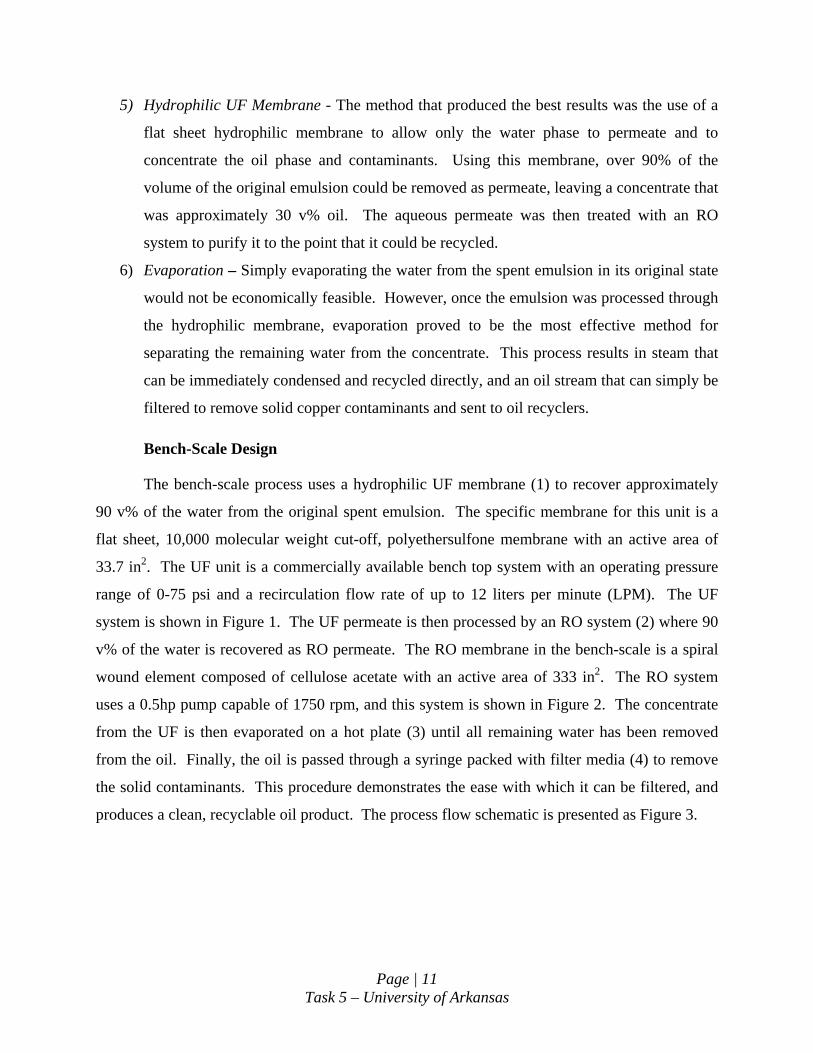
system is shown in Figure 1. The UF permeate is then processed by an RO system (2) where 90
v% of the water is recovered as RO permeate. The RO membrane in the bench-scale is a spiral
wound element composed of cellulose acetate with an active area of 333 in2. The RO system
uses a 0.5hp pump capable of 1750 rpm, and this system is shown in Figure 2. The concentrate
from the UF is then evaporated on a hot plate (3) until all remaining water has been removed
from the oil. Finally, the oil is passed through a syringe packed with filter media (4) to remove
the solid contaminants. This procedure demonstrates the ease with which it can be filtered, and
produces a clean, recyclable oil product. The process flow schematic is presented as Figure 3.
Page | 11 Task 5 – University of Arkansas
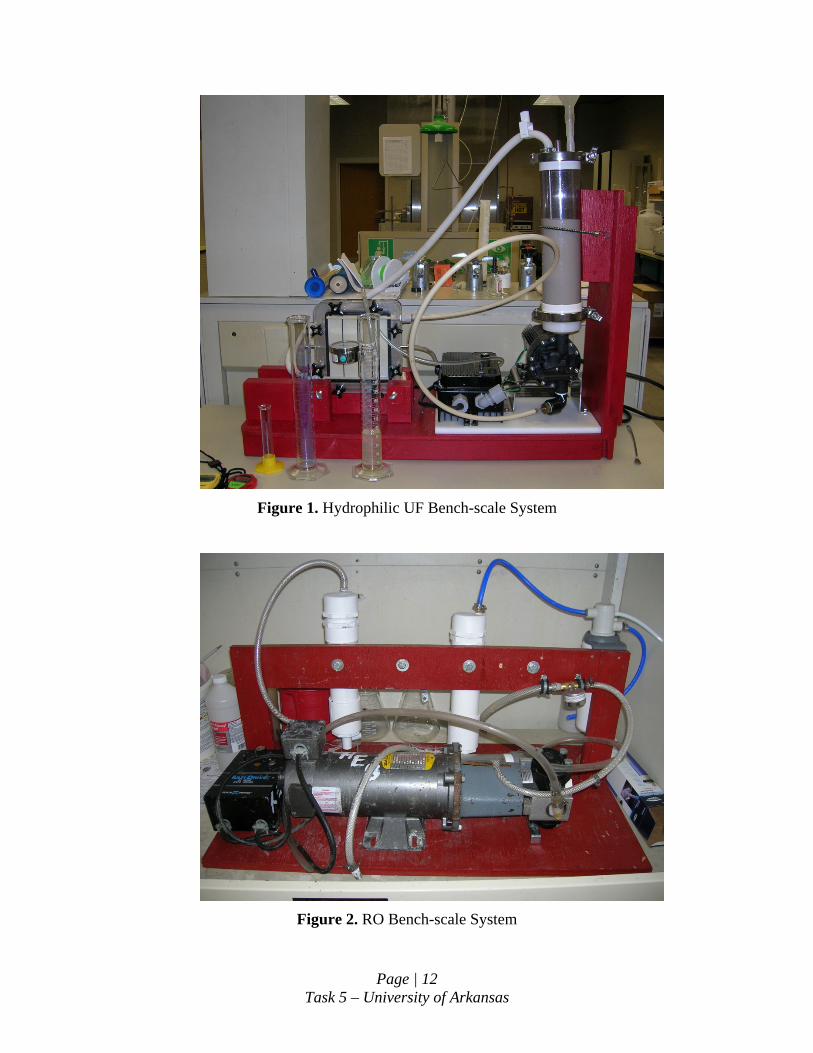
Figure 1. Hydrophilic UF Bench-scale System
Figure 2. RO Bench-scale System
Page | 12 Task 5 – University of Arkansas
UF Feed Pump
UF Membrane
UnitUF Feed Tank RO
UnitRO
Reservoir
Recycle RO Water
BeakerConcentrate to Waste Storage
6
1 2
3
4
Hot Plate
5
7
9
10
8
Hot Oil
Solids Filter
Beaker with
Clean Oil
11
12
Emulsion Sample
Input
Spent Filter
Figure 3. Process Flow Schematic for Project ORDER Bench-Scale Process
PROCESS OPTIMIZATION
RO Optimization
Major considerations affecting the design of the RO unit are the final copper and chlorine
concentrations in the permeate stream. Thin-film composite (TFC) polyamide spiral elements
with high rejection are the only viable membranes able to deliver ultra low concentrations of
both copper and chlorine. For this small system, 4” diameter, 40” long elements provided the
most economical and effective solution. Selection of the RO bank array was based on number of
elements, membrane flux, permeate concentrations, and pump requirements. RO simulation
software, Fluid systems ROPRO 6.0, was used to determine the optimal membrane
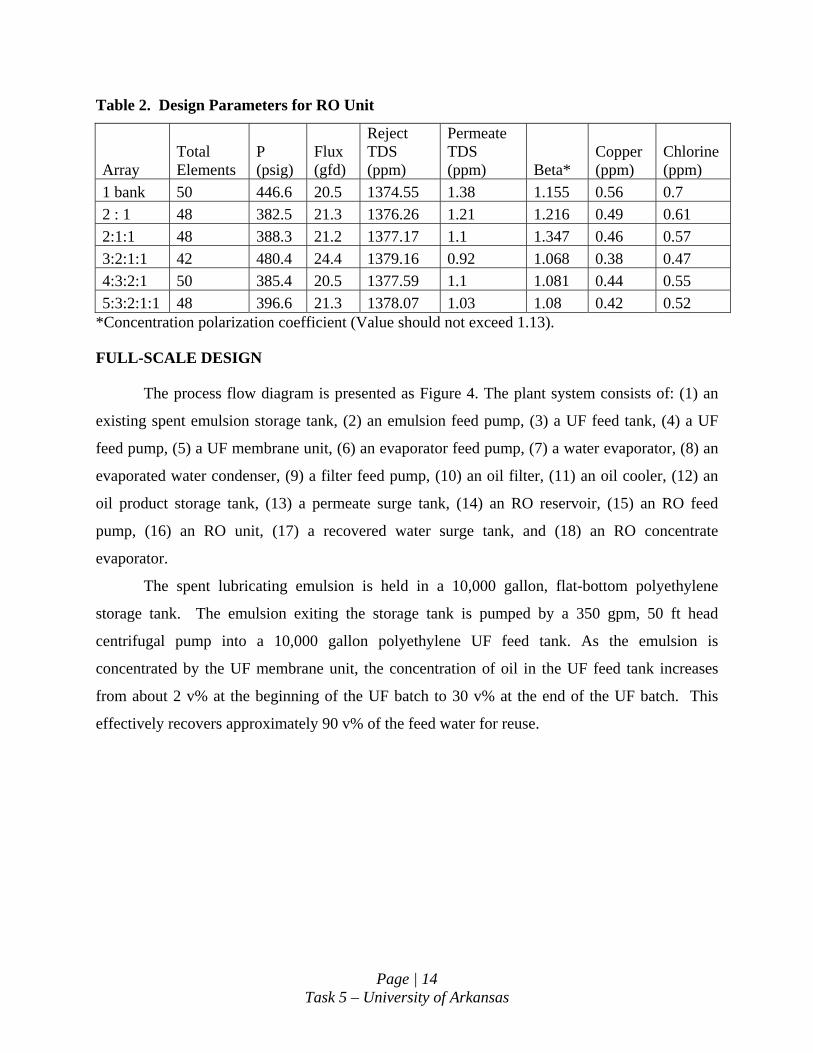
configuration. Table 2 presents design parameters calculated by the simulation software for
several potential configurations. The 4:3:2:1 case provides the most favorable operating
conditions even though it does not contain the fewest number of elements. It is the optimal case
due to the lower pressure and pumping requirements and thus was the chosen configuration for
the Project ORDER RO unit.
Page | 13 Task 5 – University of Arkansas
Page | 14 Task 5 – University of Arkansas
Table 2. Design Parameters for RO Unit
Array Total Elements
P (psig)
Flux (gfd)
Reject TDS (ppm)
Permeate TDS (ppm) Beta*
Copper (ppm)
Chlorine (ppm)
1 bank 50 446.6 20.5 1374.55 1.38 1.155 0.56 0.7 2 : 1 48 382.5 21.3 1376.26 1.21 1.216 0.49 0.61 2:1:1 48 388.3 21.2 1377.17 1.1 1.347 0.46 0.57 3:2:1:1 42 480.4 24.4 1379.16 0.92 1.068 0.38 0.47 4:3:2:1 50 385.4 20.5 1377.59 1.1 1.081 0.44 0.55 5:3:2:1:1 48 396.6 21.3 1378.07 1.03 1.08 0.42 0.52
*Concentration polarization coefficient (Value should not exceed 1.13).
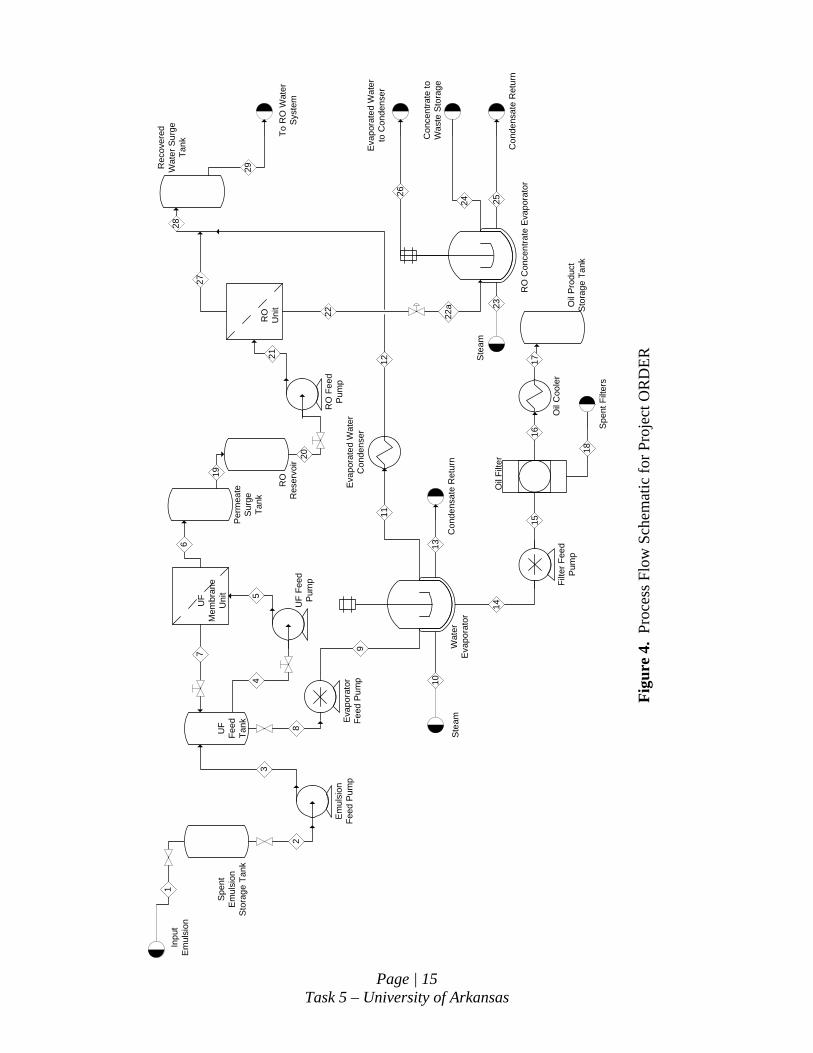
FULL-SCALE DESIGN
The process flow diagram is presented as Figure 4. The plant system consists of: (1) an
existing spent emulsion storage tank, (2) an emulsion feed pump, (3) a UF feed tank, (4) a UF
feed pump, (5) a UF membrane unit, (6) an evaporator feed pump, (7) a water evaporator, (8) an
evaporated water condenser, (9) a filter feed pump, (10) an oil filter, (11) an oil cooler, (12) an
oil product storage tank, (13) a permeate surge tank, (14) an RO reservoir, (15) an RO feed
pump, (16) an RO unit, (17) a recovered water surge tank, and (18) an RO concentrate
evaporator.
The spent lubricating emulsion is held in a 10,000 gallon, flat-bottom polyethylene
storage tank. The emulsion exiting the storage tank is pumped by a 350 gpm, 50 ft head
centrifugal pump into a 10,000 gallon polyethylene UF feed tank. As the emulsion is
concentrated by the UF membrane unit, the concentration of oil in the UF feed tank increases
from about 2 v% at the beginning of the UF batch to 30 v% at the end of the UF batch. This
effectively recovers approximately 90 v% of the feed water for reuse.
Page | 15 Task 5 – University of Arkansas
Spe
nt
Em
ulsi
on
Sto
rage
Tan
k
UF
Feed
P
ump
UF
Mem
bran
e U
nit 5
Inpu
t E
mul
sion
4
Eva
pora
tor
Feed
Pum
p
7
Em
ulsi
on
Feed
Pum
p
UF
Feed
Ta
nk
9
Oil
Pro
duct
S
tora
ge T
ank
Oil
Filte
r
Stea
mC
onde
nsat
e R
etur
n
RO
U
nit
RO
R
eser
voir
RO
Fee
d P
ump
Filte
r Fee
d P
ump
To R
O W
ater
Sy
stem
15
Wat
er
Evap
orat
or
Spen
t Filt
ers
Eva
pora
ted
Wat
er
Con
dens
er
Per
mea
te
Surg
e Ta
nk
Con
cent
rate
to
Was
te S
tora
ge
21
8
6
19
10
14
12
18
202
3
11
1617
22
24
13
Ste
am
23
Con
dens
ate
Ret
urn
25
Rec
over
ed
Wat
er S
urge
Ta
nk Eva
pora
ted
Wat
er
to C
onde
nser
RO
Con
cent
rate
Eva
pora
tor
Oil
Coo
ler
29
27
26
281
22a
Figu
re 4
. Pr
oces
s Flo
w S
chem
atic
for P
roje
ct O
RD
ER
Page | 16 Task 5 – University of Arkansas
Water is removed batch-wise, over a 12-hour cycle, from the spent emulsion by
circulating the emulsion through the membrane loop. A batch process was selected over a
continuous feed-and-bleed process due to varying production volumes with a maximum of 8,400
gal/day. In the event that the production volume for a day is less than 8,400 gallons, the
emulsion will be stored until it reaches this volume. The emulsion is pumped by the UF feed
pump at a pressure of 35 psig and 350 gpm. The UF membrane is a 10,000 molecular weight
cutoff polyethersulfone spiral-wound membrane with a required area of 1,100 ft2. The 8”
diameter by 4’ long selected elements each have 200 ft2 of active area, so six elements are
required. This hydrophilic membrane allows water, calcium formate, and dissolved salts to
permeate the membrane.
At the end of a UF batch, the UF feed tank contains 280 gallons of concentrated
emulsion. This emulsion is pumped at 23 gpm by the evaporator feed pump into the water
evaporator.
The water evaporator is an agitated, jacketed, steam-heated (50 psig steam), 400 gallon
vessel. Water is evaporated from the UF concentrate over a 12-hour period at which time the
batch temperature starts rising above 212 F. When the batch temperature reaches about 275 F,
all the water has been removed and the evaporator batch is finished. Because the remaining oil
contains large amounts of metal debris, the heated batch is then pumped through the oil filter.
The filter feed pump is a positive displacement gear pump with a pressure capability of 100 psig.
The polyester depth filter element is 4.5” diameter by 50” long with a pore size of 1
micron. At 7 gpm, the pressure drop in a fresh filter is approximately 1.5 psig. As solids are
collected, the pressure drop will rise and the element will be changed when the pressure drop
exceeds 25 psig. The spent filter and collected solids will be sent to waste disposal.
For safety reasons, the hot filtered oil is cooled by the oil cooler to below 150 F prior to
being sent to the storage tank. The oil cooler is a shell-and-tube heat exchanger with a required
area of 52 ft2 with a duty of 267,968 BTU/hr. It operates at an approximate feed rate of 60 lb/day
and over a 20-minute period.
After leaving the cooler, the oil is sent to the oil product storage tank, which collects 170
gallons of oil each day. The oil product storage tank is a carbon steel tank with a capacity of
3,500 gallons. Because an oil recycling truck can transport up to 3,200 gallons of oil, the
Page | 17 Task 5 – University of Arkansas
recovered oil from each service is stored in the storage tank until the volume reaches nearly
3,200 gallons. A pickup will be scheduled every two weeks or as needed.
The evaporated water is condensed by a shell-and-tube heat exchanger with a
required area of 16 ft2 and a duty of 272,113 BTU/hr using 54 gpm of cooling water. The
condenser reduces the temperature of the water to about 100 F. After being condensed, the
liquid water combines with the water permeate from the RO unit and is recycled to produce fresh
emulsion.
The water permeate from the UF membrane is stored in the 9,000 gallon polyethylene
tank and later enters the 9,000 gallon polyethylene RO reservoir, which allows the water to be
continuously pumped through the RO unit. The purpose of the RO unit is to increase the purity
of the UF permeate water by removing salts. The water is pumped by the RO feed pump at 50
gpm, 1155 ft head, and 380 psig. The RO membrane is a proprietary TFC polyamide spiral-
wound membrane with a fiberglass outer wrap. This system requires 50 elements with 64 ft2 of
active membrane area and provides a chloride rejection of 99.6% as well as a copper rejection of
99.5%.
The RO permeate combines with the condensed water from the evaporator and is stored
in the 9,000 gal polyethylene water surge tank. Ten percent of the UF permeate, consisting of
water, copper chloride, and other salts, enters the RO concentrate evaporator where 99% of the
concentrate is evaporated.
The RO concentrate evaporator is an agitated, jacketed, steam-heated (50 psig steam),
1,000 gallon vessel. It is operated with a 600 gal heel to insure that a proper amount of heat
transfer area is maintained. Only 50 gallons of fresh feed is added every hour to the evaporator
and the temperature rises above 212 F as the water is evaporated. When the batch temperature
reaches 275 F, all the water is removed and the evaporator batch is finished. The remaining
concentrate is purged at a rate of 50 gallons per hour and can be sent to disposal.
ECONOMIC ANALYSIS AND BUSINESS PLAN
As mentioned previously, incineration is the current disposal method for the spent
lubricant. Based on a spent emulsion production rate of 8,400 gal/day and a batch time of 12
hours, the energy required to incinerate the emulsion is 5.8 million BTU per hour. Therefore,
utilizing incineration, disposal costs are $792,000 per year7. In addition to being uneconomical,
Page | 18 Task 5 – University of Arkansas
incineration wastes the valuable water and oil components of the emulsion. After the initial
investment is recovered, Project ORDER results in a net savings of $265,000 per year.
Project ORDER recovers 90% of the water from the spent emulsion, which amounts to
7,448 gallons per day. The cost of water in El Paso after the first 2,000 gallons is
$0.0061/gallon8. Therefore, recovering 90% of the water saves $45 per day, or $17,000 per year.
The majority of the lubricating oil is recovered from the emulsion, which is
approximately 170 gallons per day. Used oil can be sold to oil recyclers for about $0.10 per
pound9. This results in $51,000 additional revenue per year. Total revenue for Project ORDER
is $861,000 per year including the avoided incineration and water costs.
Equipment prices were obtained through manufacturer and literature estimates and total
$217,000. Utility costs are $18,000 per year. Operating cost is $528,000 per year, with
$200,000 of the cost for operating labor. Fixed capital investment is $899,000 and working
capital is $47,000.
Several assumptions were made in order to complete the economic analysis. The tax
bracket for a company is determined by overall profit, thus it can vary widely. A tax rate of
35%, a project life of 20 years, and a plant startup period of 2 years10 were assumed. It was also
assumed that 60% of the fixed capital investment will be spent in the first year of startup, with
the additional 40% used in the second year. The 6-year MACRS depreciation method and a
discount rate of 15% were used for the analysis.
The cost of the project will be recovered in 5.5 years according to the discounted payback
period calculated. Furthermore, the net present value of the entire project is $413,000. Through
this economic analysis, it has been determined that this project is economical and environmental
friendly. All costs for Project ORDER are summarized in Table 4.
Economy of Scale
In addition to evaluating economic costs for a spent emulsion production rate of 8,400
gal/day, Project ORDER also determined the minimum operating scale for this process.
Minimum operating costs for this process are approximately $500,000 per year. At a production
rate of less than 5,400 gal/day, it is more economical to incinerate the spent emulsion.
Page | 19 Task 5 – University of Arkansas
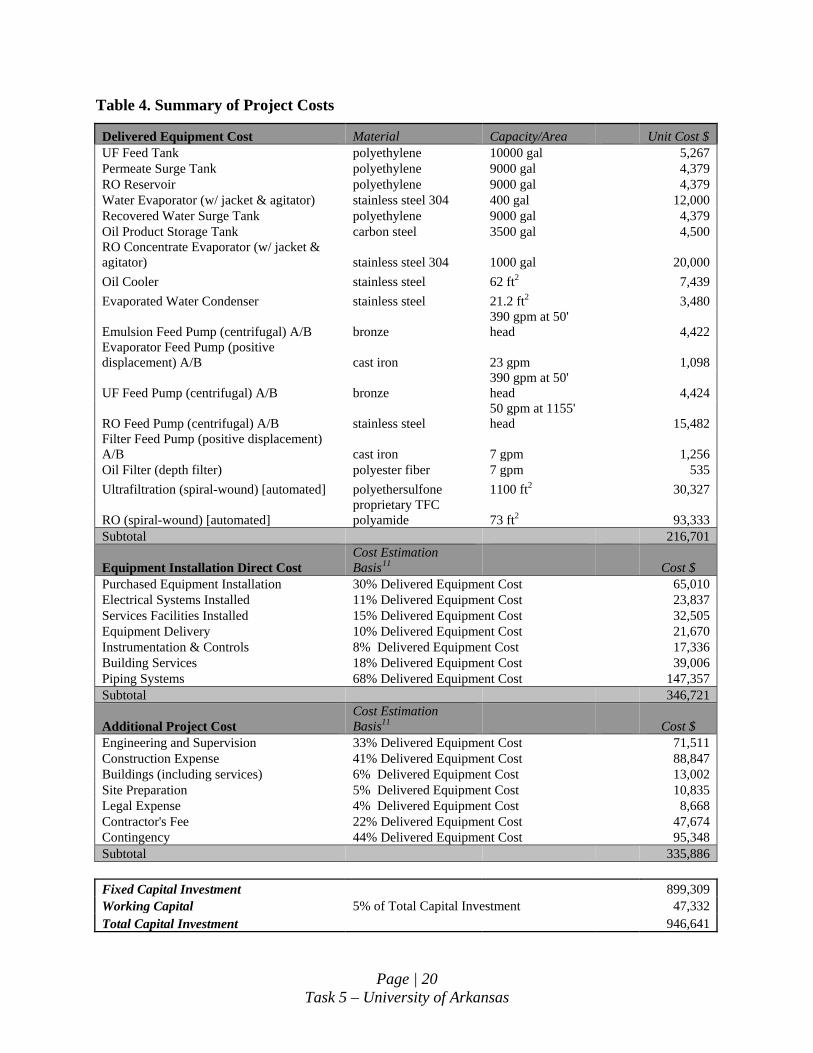
Table 4. Summary of Project Costs
Delivered Equipment Cost Material Capacity/Area Unit Cost $ UF Feed Tank polyethylene 10000 gal 5,267 Permeate Surge Tank polyethylene 9000 gal 4,379 RO Reservoir polyethylene 9000 gal 4,379 Water Evaporator (w/ jacket & agitator) stainless steel 304 400 gal 12,000 Recovered Water Surge Tank polyethylene 9000 gal 4,379 Oil Product Storage Tank carbon steel 3500 gal 4,500 RO Concentrate Evaporator (w/ jacket & agitator) stainless steel 304 1000 gal 20,000 Oil Cooler stainless steel 62 ft2 7,439 Evaporated Water Condenser stainless steel 21.2 ft2 3,480
Emulsion Feed Pump (centrifugal) A/B bronze 390 gpm at 50' head 4,422
Evaporator Feed Pump (positive displacement) A/B cast iron 23 gpm 1,098
UF Feed Pump (centrifugal) A/B bronze 390 gpm at 50' head 4,424
RO Feed Pump (centrifugal) A/B stainless steel 50 gpm at 1155' head 15,482
Filter Feed Pump (positive displacement) A/B cast iron 7 gpm 1,256 Oil Filter (depth filter) polyester fiber 7 gpm 535 Ultrafiltration (spiral-wound) [automated] polyethersulfone 1100 ft2 30,327
RO (spiral-wound) [automated] proprietary TFC polyamide 73 ft2 93,333
Subtotal 216,701
Equipment Installation Direct Cost Cost Estimation Basis11 Cost $
Purchased Equipment Installation 30% Delivered Equipment Cost 65,010 Electrical Systems Installed 11% Delivered Equipment Cost 23,837 Services Facilities Installed 15% Delivered Equipment Cost 32,505 Equipment Delivery 10% Delivered Equipment Cost 21,670 Instrumentation & Controls 8% Delivered Equipment Cost 17,336 Building Services 18% Delivered Equipment Cost 39,006 Piping Systems 68% Delivered Equipment Cost 147,357 Subtotal 346,721
Additional Project Cost Cost Estimation Basis11 Cost $
Engineering and Supervision 33% Delivered Equipment Cost 71,511 Construction Expense 41% Delivered Equipment Cost 88,847 Buildings (including services) 6% Delivered Equipment Cost 13,002 Site Preparation 5% Delivered Equipment Cost 10,835 Legal Expense 4% Delivered Equipment Cost 8,668 Contractor's Fee 22% Delivered Equipment Cost 47,674 Contingency 44% Delivered Equipment Cost 95,348 Subtotal 335,886 Fixed Capital Investment 899,309Working Capital 5% of Total Capital Investment 47,332Total Capital Investment 946,641
Page | 20 Task 5 – University of Arkansas
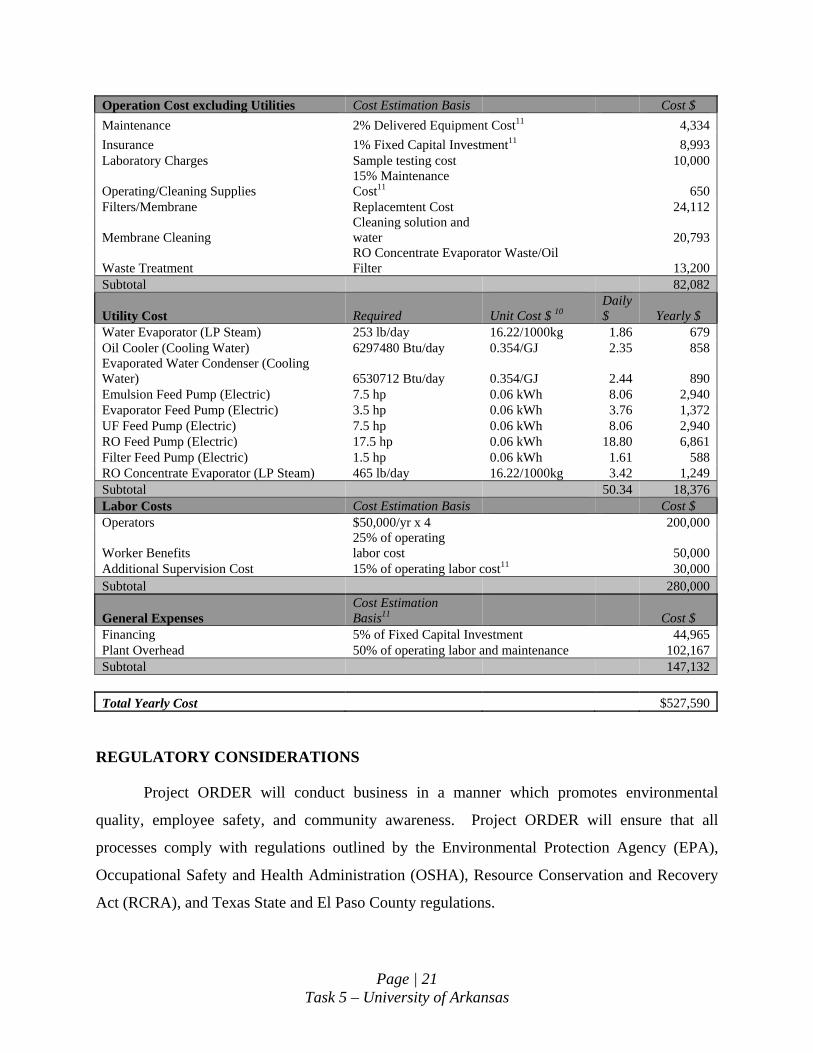
Operation Cost excluding Utilities Cost Estimation Basis Cost $ Maintenance 2% Delivered Equipment Cost11 4,334 Insurance 1% Fixed Capital Investment11 8,993 Laboratory Charges Sample testing cost 10,000
Operating/Cleaning Supplies 15% Maintenance Cost11 650
Filters/Membrane Replacemtent Cost 24,112
Membrane Cleaning Cleaning solution and water 20,793
Waste Treatment RO Concentrate Evaporator Waste/Oil Filter 13,200
Subtotal 82,082
Utility Cost Required Unit Cost $ 10 Daily $ Yearly $
Water Evaporator (LP Steam) 253 lb/day 16.22/1000kg 1.86 679 Oil Cooler (Cooling Water) 6297480 Btu/day 0.354/GJ 2.35 858 Evaporated Water Condenser (Cooling Water) 6530712 Btu/day 0.354/GJ 2.44 890 Emulsion Feed Pump (Electric) 7.5 hp 0.06 kWh 8.06 2,940 Evaporator Feed Pump (Electric) 3.5 hp 0.06 kWh 3.76 1,372 UF Feed Pump (Electric) 7.5 hp 0.06 kWh 8.06 2,940 RO Feed Pump (Electric) 17.5 hp 0.06 kWh 18.80 6,861 Filter Feed Pump (Electric) 1.5 hp 0.06 kWh 1.61 588 RO Concentrate Evaporator (LP Steam) 465 lb/day 16.22/1000kg 3.42 1,249 Subtotal 50.34 18,376 Labor Costs Cost Estimation Basis Cost $ Operators $50,000/yr x 4 200,000
Worker Benefits 25% of operating labor cost 50,000
Additional Supervision Cost 15% of operating labor cost11 30,000 Subtotal 280,000
General Expenses Cost Estimation Basis11 Cost $
Financing 5% of Fixed Capital Investment 44,965 Plant Overhead 50% of operating labor and maintenance 102,167 Subtotal 147,132 Total Yearly Cost $527,590
REGULATORY CONSIDERATIONS
Project ORDER will conduct business in a manner which promotes environmental
quality, employee safety, and community awareness. Project ORDER will ensure that all
processes comply with regulations outlined by the Environmental Protection Agency (EPA),
Occupational Safety and Health Administration (OSHA), Resource Conservation and Recovery
Act (RCRA), and Texas State and El Paso County regulations.
Page | 21 Task 5 – University of Arkansas
Environmental After an environmental review is conducted by the EPA, the plant will either: (1) be
required to submit an Environmental Impact Statement (EIS) or (2) be issued an FNSI (Findings
of No Significant Impact) in the case that this project has no significant impact on the
environment. As Project ORDER does not present a significant environmental impact, an EIS
will not be required.
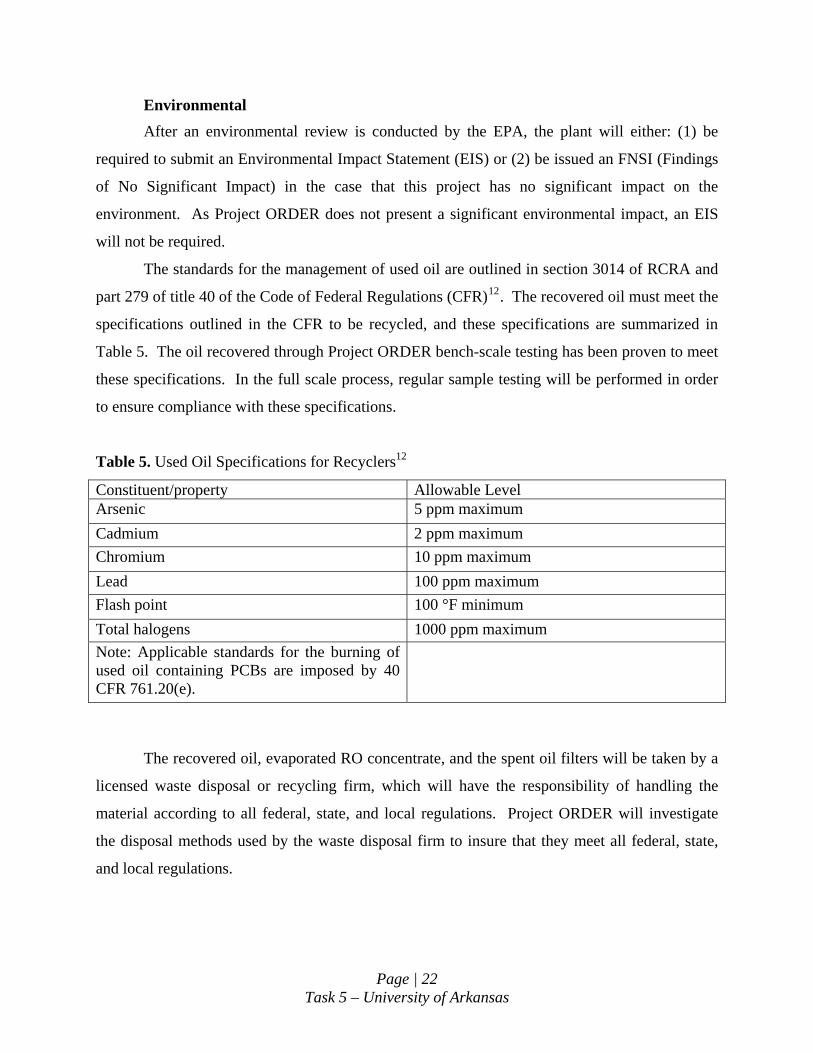
The standards for the management of used oil are outlined in section 3014 of RCRA and
part 279 of title 40 of the Code of Federal Regulations (CFR)12. The recovered oil must meet the
specifications outlined in the CFR to be recycled, and these specifications are summarized in
Table 5. The oil recovered through Project ORDER bench-scale testing has been proven to meet
these specifications. In the full scale process, regular sample testing will be performed in order
to ensure compliance with these specifications.
Table 5. Used Oil Specifications for Recyclers12
Constituent/property Allowable Level Arsenic 5 ppm maximum Cadmium 2 ppm maximum Chromium 10 ppm maximum Lead 100 ppm maximum Flash point 100 °F minimum Total halogens 1000 ppm maximum Note: Applicable standards for the burning of used oil containing PCBs are imposed by 40 CFR 761.20(e).
The recovered oil, evaporated RO concentrate, and the spent oil filters will be taken by a
licensed waste disposal or recycling firm, which will have the responsibility of handling the
material according to all federal, state, and local regulations. Project ORDER will investigate
the disposal methods used by the waste disposal firm to insure that they meet all federal, state,
and local regulations.
Page | 22 Task 5 – University of Arkansas
Health and Safety Regulations set by the OSHA Department of Labor in Title 29 of the CFR will be
followed. Employees will be required to complete all safety training relevant to their position in
early employment. Workers will also be required to repeat safety training on an annual basis or
as required, since procedures may change. The most valuable resource is the personnel, so safety
and health programs are considered an investment. It is also recognized that compliance with
regulations alone will not ensure the highest attainable safety standards. Safety and health
considerations will be integrated into all other functions of the organization.
OSHA requires that all personnel be trained on chemical safety, emergency procedures,
and OSHA guidelines. In addition, OSHA requires that Material Safety Data Sheets (MSDS) for
each chemical must be on site and available at all times. The facility is required to provide
personal protective equipment (PPE) for all operators and maintainers, as outlined by 29 CFR
191013. Employees will be required to wear appropriate PPE in all operating areas, and it will be
made readily available at all times and kept in sanitary condition. All equipment will be properly
isolated and grounded to remove electricity hazards. Proper safety techniques will be provided
through instruction and followed by all personnel.
Community Right-to-Know Congress passed the Emergency Planning and Community Right-to-Know Act of 1986
(EPCRA) in order to provide United States citizens with information regarding exposure to
hazardous chemicals. Regulations regarding the management of toxic substances are outlined in
title 40 of the CFR and under section 302 of the EPCRA and the subsequent reporting
requirements of sections 304 and 311-313.
Chapter 116 under title 40 of the U.S. code for Community Right-to-Know will be
satisfied. MSDS’s and other appropriate forms for any hazardous chemicals listed under the
OSHA Act of 1970 [29 U.S.C. 651 et seq.] used in the process will be submitted to the
appropriate local emergency planning committee, the state emergency response commission, and
the designated fire department. This information will also be made available for anyone, public
or private, who requests the information. There are currently no hazardous chemicals used in
Project ORDER, but these guidelines will be followed if any future chemical additions are made.
At the completion of the process addition, the fire department will conduct an inspection of the
site and be directed to the specific locations of hazardous chemicals (if present) at the facility.
Page | 23 Task 5 – University of Arkansas
CONCLUSIONS AND RECOMMENDATIONS
1) Project ORDER has determined that ultra-filtration followed by evaporation is the
most cost effective and environmentally conscious method of separating the
emulsion.
2) This specific process recycles essentially all of the water and virtually all of the oil.
3) The opportunity also exists for recovery of the copper that is filtered from the oil
following evaporation of the water.
4) The Project ORDER process can be constructed as an addition to an existing mill
without impairing the current established processes.
5) The recovered oil meets the specifications outlined in part 279.11 of title 40 of the
CFR; therefore, the oil is acceptable for recycling.
Page | 24 Task 5 – University of Arkansas
Page | 25 Task 5 – University of Arkansas
REFERENCES
1 Howard, Frank L., and McDoll, Ewell. “Dispersion for Hot Rolling Aluminum Products.” United States Patent 3855136. 8 January 2008. <http://www.freepatentsonline.com/3855136.html>. 2 "Process for Control of Lubricants in an Aluminum Rolling Mill." United States Patent 3783664. 9 January 2008. <http://www.freepatentsonline.com/3783664.html>. 3 Copper Development Association Inc. 12 February 2008. <http://www.copper.org/homepage.html>. 4 Ilya I. Kudish. “Effect of Lubricant Degradation on Contact Fatigue.” Tribology Transactions. Vol. 48, Issue 2 (January 2005): 100-107. 5 Sukirno, Masabumi Masuko. “Oxidative Degradation of Mineral Oil under Tribocontact and Ineffectiveness of Inhibitors.” Tribology Transactions. Vol. 42, Issue 2 (April 1999): 324-330. 6 Freeport-McMoRan Copper & Gold Inc. 18 February 2008. http://www.fcx.com/ 7 “Energy Conservation Program for Consumer Products: Representative Average Unit Costs of Energy.” Federal Register. Vol.72, No. 54 (March 2007): 13269. Office of Energy Efficiency and Renewable Energy, Department of Energy. 8 El Paso City Water & Sewer Department. 1 March 2008. http://www.elpasoil.org/WaterandSewer/ 9 Hall, Bert from Therma Cycle, El Paso, TX. Telephone Interview. 20 February 2008. 10 Bailie, Richard C.; Shaeiwitz, Joseph A.; Turton, Richard; Whiting, Wallace B. Analysis, Synthesis, and Design of Chemical Processes. 2nd ed. New Jersey: Prentice Hall, 2003. 11 Peters, Max S.; Timmerhaus, Klaus D.; West, Ronald E. Plant Design and Economics for Chemical Engineers. 5th ed. New York: McGraw-Hill, 2003. 12 Code of Federal Regulations, Title 40, Parts 260, 261, 266, 271 and 279. 3 March 2008. http://www.epa.gov/epaoswer/hazwaste/usedoil/fr/fr091092.txt 13 U.S. Department of Labor-Occupational Safety & Health Administration. 27 February 2008. http://www.osha.gov/pls/oshaweb/searchresults.category?p_text=29%20cfr%201910&p_title=&p_status=CURRENT Cross, Robert. Personal Interview. 06 March 2008. Hestekin, Jamie. Personal Interview. 21 February 2008
University of Colorado, BoulderUniversity of Colorado, Boulder Department of Civil, Environmental, and Architectural Engineering
College of Engineering and Applied Science Telephone: 303.735.2631 428 UCB, Engineering Center Fax: 303.492.7317 Boulder, CO 80309-0428 e-mail: [email protected] March 15, 2008 Ms. Jessica Nichols University of Arkansas Department of Chemical Engineering Fayetteville, AR 72701 email: [email protected] Re: WERC Audit: Oil recovery through de-emulsification research (aka Project ORDER) Dear Ms. Nichols,
Your report is well-written and easy to follow. There are some grammatical faux-pas, which I'm sure you'll find in a final editing. Your overall work presents a degree of process engineering sophistication that is unusual in undergraduate students. I commend you and your team on the accomplishment. In general, the process design seems workable...is someone planning on piloting it?
You requested that I review your draft report with special attention to economic, health, and legal issues. I am not an expert in any of the three areas you mentioned, what follows are my stream of thoughts as I read through the report.
The summary contains some hyperbole. One should always be mindful of the uncertainty involved and express your numerical assessments without adjectives such as maximum and minimum, which imply absolutes. Be consistent referring to Task 5 or Task five in your text. You refer to sodium sulfonate as a surfactant, do you actually mean sodium lauryl sulfate, or some generic alkyl aryl sodium sulfonate? Did your lab tests include emulsion samples with metal particulates (it was uncertain from the discussion)? Particulates (especially metal fines) could cause material damage to membranes in crossflow filtration. It is likely that these particles would need to be removed if present. Tests of centrifugation requires the radius dimension in order to actually calculate the force exerted on the colloidal particles, the centrifuge's rpm alone is insufficient to determine whether this processing approach is viable.
In the Process optimization section you should identify what RO simulation software you used. What is " " in Table 2? Did you include an allowance for membrane flux decline and cleaning?
In Full-scale design section, what about the cooling duty for the water condenser and the oil cooler? Both of those could be new pieces of equipment. Why choose a batch process, versus a continuous, feed-and-bleed? Will the overhead from the evaporation processes contain volatile organics? If so, the condensed water would need a further polishing.
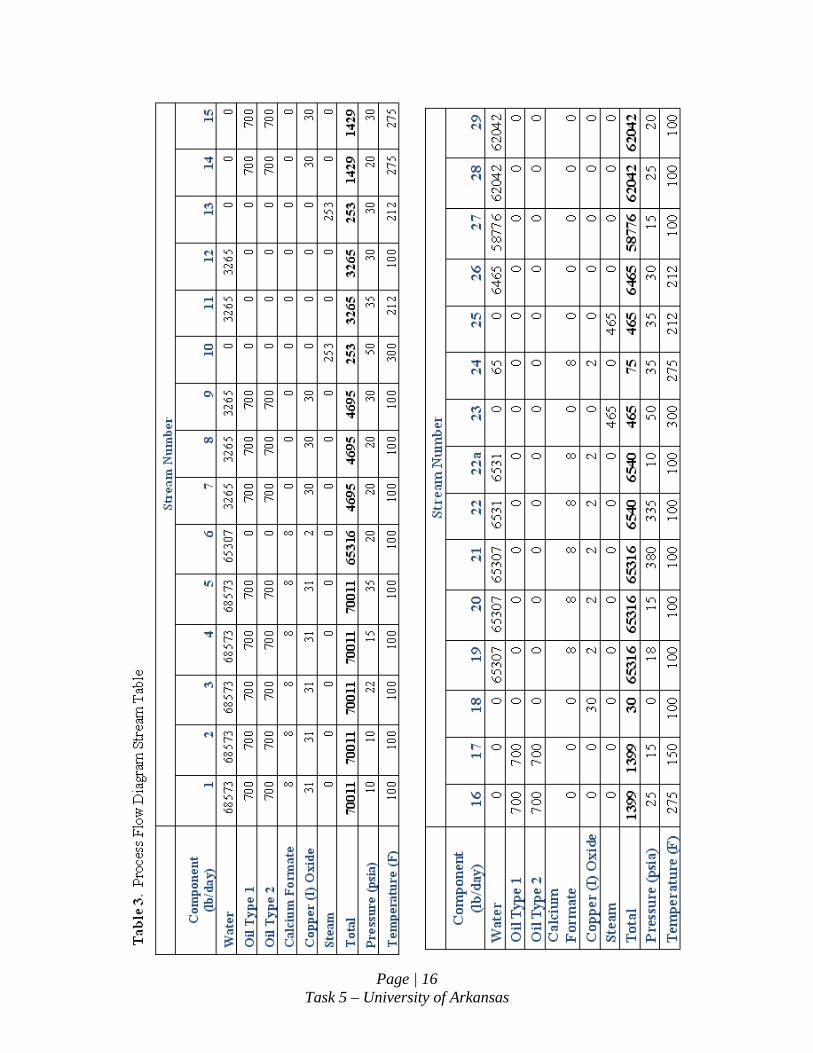
You should provide an estimated material and energy balance including the temperatures and pressures on your process flow diagram.
I know that there is some debate on this issue but, most of the rest of the world is metric, and the US government requires metric units, so intellectual rigor suggests that you should present your results in metric units (with English in parenthesis if you so desire).
In the Economic analysis and business plan, isn't the water for creating the emulsion supposed to be RO-permeate quality, not out-of-the-tap, so the value of recovered water may be higher. The total revenue quoted doesn't follow from the two inputs discussed, so the reader becomes confused. You should provide a separate graphic that plots the cumulative costs and credits over time, that makes it easier to identify the economic payback and cash flow.
Referring to the items in Table 3: i) one usually puts in spares of key pieces of equipment with moving parts (like pumps); ii) utility costs should be part of a separate section on operating costs (note: kWh, not KWh) and are these the yearly or per batch costs, or?; iii) is that membrane replacement cost per year?...seems high...membranes are usually cleaned and would have at least a 5 year lifetime, or 3 years in harsh duty; iv) shouldn't the operators be getting benefits, that is, indirect costs (retirement, medical, vacation and sick leave) besides supervision; and v) costs of laboratory analysis seem low, unless the lab equipment and facility already exists at that location.
You really need to include a table of your key assumptions both process design-based, and economic analysis, and provide some rationale as to why you used it. For example, why a 15% discount rate?
In the Environmental, Table 3 is 4, etc. How does Project ORDER present greater community health risks (that is what you said)? It would seem that it presents less than existing practices (air polution due to incineration).
Your Conclusions state that 99% of the water is internally recycled, but the Summary said 90% is recovered?
References: When citing online sources it is customary to include the date accessed because internet content is ephemeral. Given a date, it is possible to retrieve sources from content archival services.
Please contact me if you need any clarification on the points I've mentioned above. Good luck to you and your team.
Best regards,
Res. Assoc./Adj. Prof.
Southwire Company, One Southwire Drive, Carrollton, Georgia 30119, USA
Jessica,
Since March 11th, I only had a chance to briefly scan your report. The deadline of 3/17 is not something by which I can generate a written review/audit in the example format.
The following, however, are some random suggestions:
1) The El Paso facility has a relatively very high use of lubricant, reported at 8400 gal/day. One might conclude this is the result of the size (annual capacity) of the El Paso operation. Other rod mills may not use 8400 gal/day. Consequently, you might consider further evaluating the treatment rate capacity vs project economics. For example, what would the project economics be at a use rate of, say, 200 gals of the 2% emulsion per day? Would a perceived wider facility need for Project O.R.D.E.R. diminish?
2) At the El Paso facility there might be uses for the UF produced water {i.e., as is} without the need for the RO. Such might bear investigating to reduce needed capital and emulsion treatment operating expenses.
3) The 2 to 6 months reported as the time for an emulsion solution to degrade may perhaps be rapid relative to experience at some other copper rod mills.
4) The oil surge tank's capacity in relationship to the recycling truck's transport capacity should be evaluated. Perhaps several extra days' 170 gal/day collection rate should be added to the size of the oil surge tank. Under the conditions specified, the transport truck must make a pick up within one day of 3000 gallons being produced, else the treatment must cease because the oil surge tank will be overfilled.
5) I suggest not reporting "All of the lubricating oil is recovered from the emulsion"
For example, there will be some residual oil in the spent filters
6) I suggest a minor rearrangement in the Summary of Project Costs by moving the section listing Utility Cost after Working Capital and Total Capital Investment sections. The Utility Cost is a figure in the summed Total Yearly Cost. This was somewhat difficult for me to follow until I examined the figures and their approximate sums closely.
7) I have concern the necessary "regular" sampling to assure compliance with the specifications of 40 CFR 279.11 will exceed the laboratory charges listed as $600 yearly. A stated sampling frequency that will be necessary might help alleviate my concern. However, should sampling be necessary for each truck shipment $600 may vastly under state the annual cost of testing.
Good luck with the competition and the career you pursue.
David Hutcheson
Seth W. Snyder, Ph.D. Section Leader Process Technology Chemical and Biological Technology Energy Systems Argonne National Laboratory 9700 South Cass Avenue, Bldg. 362 Argonne, IL 60439 1-630-252-7939 P 1-630-252-1342 F [email protected]
18 March 2008 WERC Task 5 Team Ralph E Martin Department of Chemical Engineering University of Arkansas Fayetteville, AR 72701 Dear Team Jessica Nichols requested that I audit the report: “PROJECT O.R.D.E.R. - Oil Recovery through De-Emulsification Research”. The project is focused on developing a commercially viable process to recover lubricating oils, water, and metals in the copper processing industry. Water management is industrial processes is growing as an economic and environmental concern. The type of issues addressed in this report will emerge in many other settings.
The critical technical challenge is to achieve a highly efficient process for handling and separating the emulsions. The team considered several potential systems including a range of membrane processes, gravity driven, chemical and temperature treatments. In the analysis the team considered overall recovery efficiency, capital and operating costs, energy use, physical space, and environmental and societal impacts.
Taken together the team did a very thorough job considering technological solutions. The work included initial laboratory testing where they evaluated comparative advantages and disadvantages of the proposed processes. After considering the experimental results, the team developed a preliminary plant design optimized for efficient oil, water, and metals recovery. To the best of my knowledge, the systems were selected based on meeting all environmental requirements whiles maximizing economic return. I was very impressed with the ability of the students to carry the project from a process optimization through process flow schematic, and economic analysis and business plan. As the move from the academic setting into their graduate educations or professional careers they will be well prepared to join teams and become immediate contributors.
I include a few pointers to improve the report and the analysis.
Suggested modifications to the report:
All reports are limited in space. The information presented in the Full Scale Design section should be presented in a spreadsheet or table format. The narrative should focus on the important issues in the design.
The author should not assume that the reader knows all terms. Process terms were defined but others such as “TFC polyamide spiral elements” were not. In general the authors should reference materials or provide names of vendors.
A U.S. Department of Energy laboratory managed by UChicago Argonne, LLC
2
The never defined the role of “Task 5” in terms of a whole project. The auditor was not clear if there were other Tasks that had to coordinate with Task 5 or if the other tasks were focused on different projects.
Suggested modifications to the analysis:
The experimental section does not specific if the work was done on actual process samples or on synthetic samples.
The number of runs, uncertainties, and ranges were not provided for any of the experimental runs.
Time and costs for piloting the technologies weren’t considered.
The economic impact for a single plant was provided. There was no information provided on the potential for similar installations at other plants.
Membrane fouling was identified as a potential challenge. Frequency of membrane cleaning cycles was not provided. A cost of 15 % was considered for membrane replacements. This suggests membrane lifetimes of 6 – 7 years. That might be too long.
Summary:
The Task 5 team presented a strong report surveying potential solutions to an important environmental issue in the metal processing industry. The team considered the merits and challenges to several technology solutions, and based on limited experimental results, designed a process that should meet the environmental and society requirements while providing maximum economic return.
About the auditor:
Seth Snyder received a B.A. from the University of Pennsylvania and a Ph.D. from the University of Virginia. After a postdoctoral fellowship, he worked in the pharmaceutical industry. He joined Argonne in 1998 and after three years in administration took over leadership of the Chemical and Biological Technology Section in the Energy Systems Division. After a consolidation in 2008 he also took over leadership of the Process Technology Section. His work focuses on scaling process engineering systems from the bench through the demonstration scale. The work incorporates fermentation, enzymatic conversion, and membrane processes into water treatment, biofuels, and CO2 management.
Sincerely,
Seth W. Snyder, Ph.D.