oil ind_mar_11
TRANSCRIPT

7/29/2019 OIL IND_Mar_11
http://slidepdf.com/reader/full/oil-indmar11 1/7
MINISTRY OF PETROLEUM & NATURAL GASECONOMIC DIVISION
BRIEF NOTE ON THE PRODUCTION PERFORMANCE OF OIL & NATURAL
GAS SECTOR FOR THE MONTH OF March, 2011 & CUMULATIVELYFOR THE PERIOD April-March, 2011 VIS-À-VIS 2010
I. A. CRUDE OIL PRODUCTION – PERFORMANCEMonth / Period Planned
Target(MMT)
ActualProduction
(MMT)
%ageachievement
Surplus(+)Shortfall(-) Vis
à-vis target(%age)
Surplus(+)Shortfall(-)
over last year(%age)
March, 2011* 3.346 3.315 99.1 -0.9 12.1April-March, 2011* 37.955 37.712 99.4 -0.6 11.9
April-March, 2010 33.690
MMT: Million Metric Tonnes. *: Provisional.
B. COMPANY-WISE ACHIEVEMENTCompany / State Planned
Target(MMT)
ActualProduction
(MMT)
%ageachievement
Surplus(+)Shortfall(-)
(%age)ONGC 2.2070 2.0730 93.9 -6.1Gujarat 0.4960 0.4930 99.4
Andhra Pradesh 0.0220 0.0290 131.8
Tamil Nadu 0.0210 0.0210 100.0
Assam 0.1200 0.1080 90.0
Mumbai Region (incl Mumbai
High)
1.5480 1.4220 91.9
OIL 0.3173 0.3239 102.1 2.1
Assam 0.3155 0.3215 101.9Arunachal Pradesh 0.0018 0.0024 131.1
PRIVATE/JVC 0.8220 0.9179 111.7 11.7TOTAL 3.3463 3.3147 99.1 -0.9
C. REASONS FOR SHORTFALLCompany / State Reasons for shortfallONGC (Gujarat) · Poor Influx.
ONGC (Assam) · Environmental Problems.ONGC (Mumbai High
Offshore)
·Less base potential. Production loss due to conversion of 2 No. of
producers to water injectors. Closure of well to maintain HUT line
pressure due to leakage in MUT oil line (crude despatch to Uran
transferred from MUT line to HUT line).
A h i C d Oil d i d i h 2011 d l i l f h i d A il

7/29/2019 OIL IND_Mar_11
http://slidepdf.com/reader/full/oil-indmar11 2/7
II. A. REFINERY PRODUCTION(IN TERMS OF CRUDE THROUGHPUT)
Month / Period PlannedTarget
(MMT)
ActualProduction
(MMT)
%ageachievement
Surplus(+)Shortfall(-) Vis
à-vis target(in %age)
Surplus(+)Shortfall(-)
over last year(in %age)
March, 2011* 13.92 15.00 107.8 7.8 8.5
April- March, 2011* 158.61 164.85 103.9 3.9 3.0
April- March, 2010 160.03
*: Provisional.
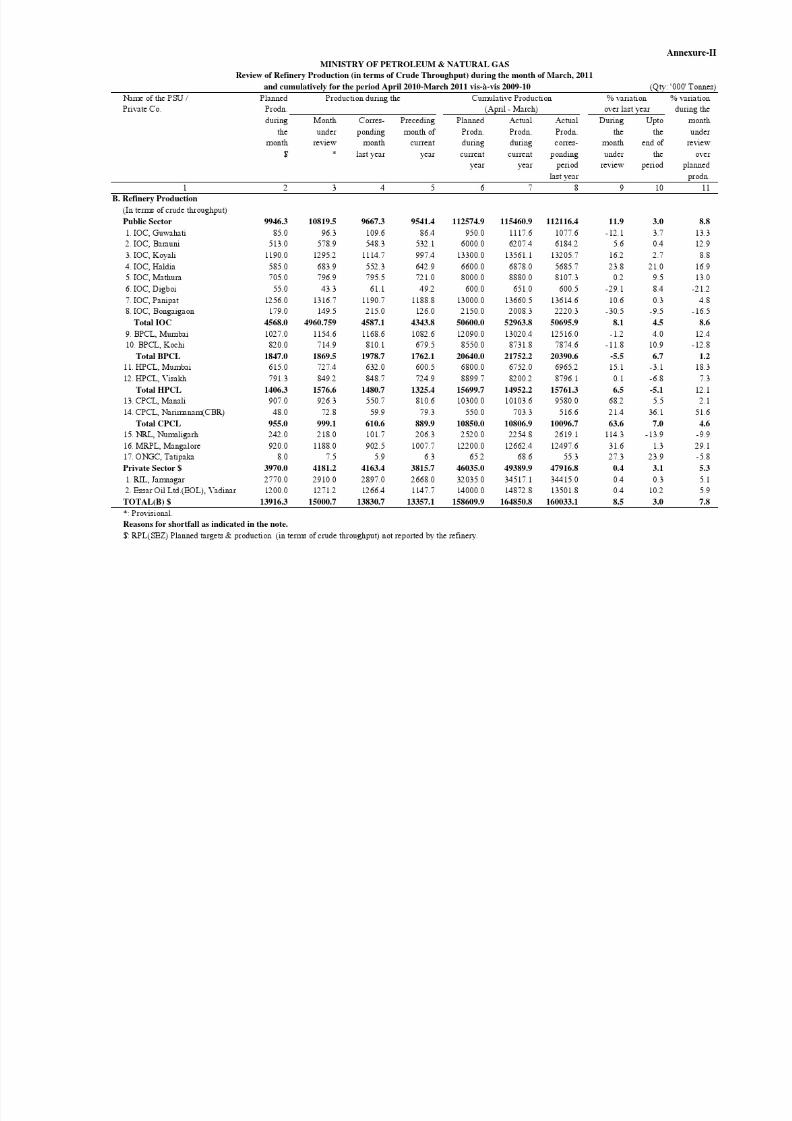
The crude throughput in IOC (Guwahati, Panipat, Barauni, Haldia, Koyali & Mathura), BPCL(Mumbai), HPCL (Mumbai & Visakh), RPL( Jamnagar), CPCL (Narimanam-CBR & Manali), EOL,
(Vadinar) & MRPL (Mangalore) refineries have exceeded their planned target.
The crude throughput in IOC (Digboi & Bongaigaon), BPCL (Kochi), NRL (Numaligarh) & ONGC
(Tatipaka) refineries was less than their planned target.
B. REASONS FOR SHORTFALL :
Company / State Reasons for shortfallIOCL, Digboi ● Throughput is less due to planned M&I shutdown of major units; which was
originally planned in Nov-Dec'10.
IOCL, Bongaigaon ● In-Line with Assam crude availability.
A statement showing refinery-wise production during the month of March, 2011 and cumulatively for
the period April- March, 2011 vis-à-vis planned target is at Annexure-II.
III. REFINERY CAPACITY UTILISATION [excluding RPL(SEZ)]
Month Utilisation (%) Period Utilisation (%)
March, 2011* 113.7 April- March, 2011 106.1
March, 2010 109.3 April- March, 2010 107.4
The refinery-wise details of the capacity utilisation during March, 2011 and cumulatively for the
period April- March, 2011 vis-a-vis 2010 are given in Annexure-III.
Cont’d…

7/29/2019 OIL IND_Mar_11
http://slidepdf.com/reader/full/oil-indmar11 3/7
IV. A. NATURAL GAS PRODUCTION
Month / Period PlannedTarget(MCM)
ActualProduction
(MCM)
%age achieve-ment
Surplus(+)Shortfall(-) Vis
à-vis target(%age)
Surplus(+)Shortfall(-)
over last year(%age)
March, 2011* 4425.7 4281.6 96.7 -3.3 -10.6
April- March, 2011* 53588.7 52222.1 97.4 -2.6 10.0
April- March, 2010 47496.2
MCM: Million Cubic Metres. *: Provisional.
B. COMPANY-WISE ACHIEVEMENT
Company / State PlannedTarget(MCM)
ActualProduction
(MCM)
%ageachievement
Surplus(+)Shortfall(-)
(%age)ONGC 1900.7 1972.3 103.8 3.8Gujarat 146.2 161.5 110.5
Rajasthan 1.3 0.7 51.6Andhra Pradesh 106.0 111.6 105.2
Tamil Nadu 114.2 96.1 84.2
Assam 43.6 42.2 96.9
Tripura 47.9 54.2 113.3
Mumbai High Offshore 1441.5 1506.0 104.5
OIL 221.0 209.8 94.9 -5.1Assam 191.0 196.8 103.0
Arunachal Pradesh 1.9 1.4 75.1
Rajasthan 28.1 11.6 41.4
PRIVATE/JVC 2304.0 2099.5 91.1 -8.9Onshore $ 38.6 56.0 145.2
Offshore 2265.4 2043.5 90.2
TOTAL 4425.7 4281.6 96.7 -3.3$: Including Coal Bed Methane production.
C. REASONS FOR SHORTFALL
Company / State Reasons for shortfallONGC(Rajasthan)
· Less off take by M/s RRVUNL.
ONGC (TamilNadu)
· Less off-take by consumers M/s. TNEB.
OIL (Rajasthan) · Low Gas uplift by RRVNUL.

7/29/2019 OIL IND_Mar_11
http://slidepdf.com/reader/full/oil-indmar11 4/7
Annexure-I
(Qty: '000' Tonnes)
Name of the Undertaking / Unit Planned % variation
Prodn. during the
during Month Corres- Preceding Planned Actual Actual During Upto month
the under ponding month of Prodn. Prodn. Prodn. the the under
month review month current during during corres- month end of review
* last year year current current ponding under the over
year year period review period planned
last year prodn.
1 2 3 4 5 6 7 8 9 10 11
A. Production of Crude Oil1. Oil & Natural Gas Corp. Ltd. 2207.0 2073.0 2148.0 1861.0 25425.0 24448.0 24855.0 -3.5 -1.6 -6.1
Onshore 659.0 651.0 645.0 580.0 7757.0 7446.0 7515.0 0.9 -0.9 -1.2
Gujarat 496.0 493.0 500.0 443.0 5883.0 5757.0 5783.0 -1.4 -0.4 -0.6
Andhra Pradesh $ 22.0 29.0 27.0 25.0 281.0 305.0 304.0 7.4 0.3 31.8
Tamil Nadu 21.0 21.0 19.0 20.0 244.0 234.0 239.0 10.5 -2.1 0.0
Assam 120.0 108.0 99.0 92.0 1349.0 1150.0 1189.0 9.1 -3.3 -10.0
Mumbai High Offshore 1548.0 1422.0 1503.0 1281.0 17668.0 17002.0 17340.0 -5.4 -1.9 -8.1
Oil 1388.0 1254.0 1320.0 1133.0 15589.0 15079.0 15270.0 -5.0 -1.3 -9.7
Condensates 160.0 168.0 183.0 148.0 2079.0 1923.0 2070.0 -8.2 -7.1 5.0
2. Oil India Ltd. (OIL) 317.3 323.9 309.1 290.8 3700.0 3581.7 3572.3 4.9 0.3 2.1
Assam 315.5 321.5 307.0 289.1 3676.8 3558.5 3539.6 4.7 0.5 1.9
Arunachal Pradesh 1.8 2.4 2.2 1.7 23.2 23.2 32.7 8.8 -29.0 31.1
3. DGH (Private / JVC) 822.0 917.865 500.5 834.2 8829.8 9682.0 5262.5 83.4 84.0 11.7
Onshore 454.3 560.645 102.8 505.8 4317.3 5400.0 733.7 445.2 636.0 23.6
Arunachal Pradesh 8.4 7.7 9.1 6.5 99.4 92.8 98.0 -15.5 -5.3 -8.8
Assam 1.5 0.0 1.8 0.0 17.0 10.3 11.5 -98.9 -10.5 -98.7
Gujarat 11.4 11.6 14.1 10.4 142.2 147.8 176.8 -17.4 -16.4 2.0
Rajasthan 433.0 541.3 77.9 488.9 4058.7 5149.1 447.4 595.0 1050.9 25.0
Offshore 367.7 357.2 397.6 328.4 4512.5 4282.0 4528.8 -10.2 -5.4 -2.9
GRAND TOTAL (1+2+3) 3346.3 3314.7 2957.6 2986.1 37954.766 37711.7 33689.8 12.1 11.9 -0.9
Onshore 1430.6 1535.5 1057.0 1376.7 17065.4 17804.4 12755.6 45.3 39.6 7.3
Offshore 1915.7 1779.2 1900.6 1609.4 23893.3 22893.3 23595.0 -6.4 -3.0 -7.1
*: Provisional. $: Includes production from offshore east coast.
Reasons for shortfall as indicated in the note.
Production during the Cumulative Production % variation
MINISTRY OF PETROLEUM & NATURAL GAS
Review of Crude Oil Production during the month of March, 2011 and cumulatively for the period April'10-March'11 vis-à-vis 2009-10
(April -March) over last year
7/29/2019 OIL IND_Mar_11
http://slidepdf.com/reader/full/oil-indmar11 5/7

7/29/2019 OIL IND_Mar_11
http://slidepdf.com/reader/full/oil-indmar11 6/7

7/29/2019 OIL IND_Mar_11
http://slidepdf.com/reader/full/oil-indmar11 7/7
Annexure-IV
(Qty: Million Cubic Metres)
Name of the Undertaking / Unit Planned % variationProdn. during the
during Month Corres- Preceding Planned Actual Actual During Upto month
the under ponding month of Prodn. Prodn. Prodn. the the under
month review month current during during corres- month end of review
* last year year current current ponding under the over
year year period review period planned
last year prodn.
1 2 3 4 5 6 7 8 9 10 11
D. Natural Gas Production
1. Oil & Natural Gas Corp. Ltd. 1900.7 1972.3 1955.4 1776.4 22773.6 23098.1 23095.5 0.9 0.0 3.7
Onshore 459.2 466.3 469.4 425.9 5482.6 5507.5 5633.9 -0.6 -2.3 1.5Gujarat 146.2 161.5 163.5 148.2 1817.0 1919.1 1933.2 -1.2 -0.7 10.5
Rajasthan 1.3 0.7 1.3 0.7 15.0 10.7 13.9 -48.5 -23.0 -48.4
Andhra Pradesh 106.0 111.6 122.4 102.4 1356.0 1384.5 1479.3 -8.8 -6.4 5.2
Tamil Nadu 114.2 96.1 95.8 89.4 1274.0 1119.2 1177.8 0.3 -5.0 -15.8
Assam 43.6 42.2 38.4 36.3 469.6 464.2 466.0 10.0 -0.4 -3.1
Tripura 47.9 54.2 48.1 49.0 551.0 609.9 563.8 12.9 8.2 13.3
Offshore 1441.5 1506.0 1486.0 1350.5 17290.9 17590.6 17461.6 1.3 0.7 4.5
Mumbai High Offshore 1441.5 1506.0 1486.0 1350.5 17290.9 17590.6 17461.6 1.3 0.7 4.5
2. Oil India Ltd. (OIL) 221.0 209.8 199.9 184.9 2620.0 2349.4 2415.6 5.0 -2.8 -5.1Assam 191.0 196.8 180.7 172.1 2317.0 2174.5 2188.9 8.9 -0.7 3.0
Arunachal Pradesh 1.9 1.4 1.4 1.2 22.0 17.5 21.4 -1.6 -18.2 -24.9
Rajasthan 28.1 11.6 17.9 11.6 281.0 157.4 205.3 -34.9 -23.3 -58.6
3. DGH (Private / JVC) 2304.0 2099.5 2634.0 1946.1 28195.2 26774.6 21985.1 -20.3 21.8 -8.9
Onshore 38.6 56.0 46.4 51.4 531.3 720.1 635.4 21.7 13.4 43.6
Arunachal Pradesh 1.5 1.9 2.6 1.8 20.4 26.9 18.2 -26.6 47.5 27.5
Assam 5.0 1.7 5.0 1.2 58.7 43.0 48.0 -65.4 -10.5 -65.6
Gujarat 21.8 23.7 32.8 22.1 321.8 344.3 511.0 -27.6 -32.6 8.7
Rajasthan 7.5 23.5 3.2 22.6 97.1 264.5 19.7 636.0 1239.5 213.0
West Bengal $ (CBM) 2.8 5.2 2.8 3.8 33.3 41.4 38.4 84.6 7.8 88.0
Offshore 2265.4 2043.5 2587.7 1894.7 27663.9 26054.5 21349.8 -21.0 22.0 -9.8
TOTAL (1+2+3) 4425.7 4281.6 4789.3 3907.5 53588.7 52222.1 47496.2 -10.6 10.0 -3.3
Onshore 718.8 732.1 715.7 662.2 9285.0 9239.2 9337.6 2.3 -1.1 1.9
Offshore 3706.9 3549.4 4073.6 3245.3 48474.9 46890.3 42374.9 -12.9 10.7 -4.2
*: Provisional. $: Coal Bed Methane production.
Reasons for shortfall as indicated in the note.
(April - March) over last year
Review of Natural Gas Production during the month of March, 2011 and cumulatively for the period April'10-March, 2011 vis-à-vis 2009-10
MINISTRY OF PETROLEUM & NATURAL GAS
Production during the Cumulative Production % variation