oil india investor presentation – h1 fy2010€¦ · oil india investor presentation – h1 fy2010...
TRANSCRIPT

OIL INDIA LIMITED
Investor Presentation
November 2009
Oil India Investor Presentation – H1 FY2010
2
Disclaimer
This presentation contains certain forward looking statements concerning OIL India’s future business prospects and business
profitability, which are subject to a number of risks and uncertainties and the actual results could materially differ from those in
such forward looking statements. The risks and uncertainties relating to these statements include, but not limited to, risks and
uncertainties, regarding fluctuations in earnings, our ability to manage growth, competition (both domestic and international),
economic growth in India, ability to attract and retain highly skilled professionals, time and cost over runs on projects, our ability to
manage our international operations, government policies and actions with respect to investments, fiscal deficits, regulations, etc.,
interest and other fiscal costs generally prevailing in the economy. The company does not undertake to make any announcement
in case any of these forward looking statements become materially incorrect in future or update any forward looking statements
made from time to time by or on behalf of the company.

Oil India Investor Presentation – H1 FY2009Oil India Investor Presentation – H1 FY2010
Sector outlook and opportunities
OIL India – An overview
Business structure, performance and strategy
Financial performance
Oil India Investor Presentation – H1 FY2009Oil India Investor Presentation – H1 FY2010
Sector outlook and opportunities
OIL India – An overview
Business structure, performance and strategy
Financial performance
5
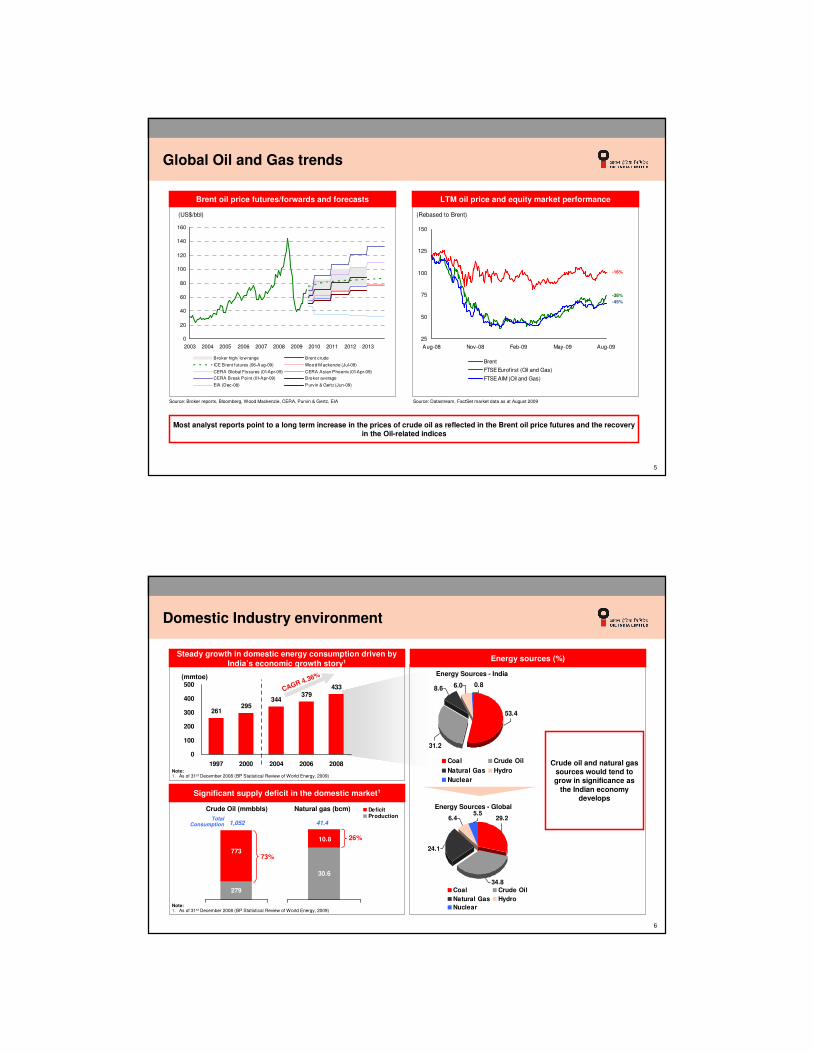
Global Oil and Gas trends
Source: Broker reports, Bloomberg, Wood Mackenzie, CERA, Purvin & Gertz, EIA
(Rebased to Brent)
25
50
75
100
125
150
Aug-08 Nov-08 Feb-09 May-09 Aug-09
Brent
FTSE Eurof irst (Oil and Gas)
FTSE AIM (Oil and Gas)
-16%
-45%
-38%
(US$/bbl)
0
20
40
60
80
100
120
140
160
2003 2004 2005 2006 2007 2008 2009 2010 2011 2012 2013
Broker high/ low range Brent crude
ICE Brent futures (06-Aug-09) Wood M ackenzie (Jul-09)
CERA Global Fissures (01-Apr-09) CERA Asian Phoenix (01-Apr-09)
CERA Break Point (01-Apr-09) Broker average
EIA (Dec-08) Purvin & Gertz (Jun-09)
Source: Datastream, FactSet market data as at August 2009
Most analyst reports point to a long term increase in the prices of crude oil as reflected in the Brent oil price futures and the recovery in the Oil-related indices
Brent oil price futures/forwards and forecasts LTM oil price and equity market performance
6
31.2
0.8
53.4
8.6 6.0
Coal Crude Oil
Natural Gas Hydro
Nuclear
CAGR 4.36%
Note:1. As of 31st December 2008 (BP Statistical Review of World Energy, 2009)
279
773
1,052
73%
30.6
10.8
41.4
26%
Crude Oil (mmbbls) Natural gas (bcm) DeficitProduction
TotalConsumption
Note:1. As of 31st December 2008 (BP Statistical Review of World Energy, 2009)
(mmtoe) Energy Sources - India
Domestic Industry environment
Steady growth in domestic energy consumption driven by India’s economic growth story1
261295
344379
433
0
100
200
300
400
500
1997 2000 2004 2006 2008
Significant supply deficit in the domestic market1
34.8
5.529.2
24.1
6.4
Coal Crude Oil
Natural Gas Hydro
Nuclear
Energy Sources - Global
Energy sources (%)
Crude oil and natural gas sources would tend to grow in significance as
the Indian economy develops

7
India: Energy scenario
Primary Energy Consumption (MTOE) Crude Oil Consumption (MTOE)
• 53% of primary energy consumed by 5 countries• India is the 5th largest consumer of Primary Energy
− India CAGR (1998-2008): 4.8% vs. Global CAGR: 2.4%
• World oil consumption (2008): 3,928 MTOE• India is the 4th largest consumer of Oil comprising 3.4% of total
− India CAGR (1998-2008): 3.9% vs. Global CAGR: 1.3%
Note: (1) Annualized crude oil production rate of 26.24 mmboe in Q2 FY2010(2) Annualized crude oil delivery rate of 26.90 mmboe in Q2 FY2010
Note: (1) 1 BCM of Natural Gas = 6.2898 MMBOE
2,299
2,003
685
508
330
311
258
240
212
433
0 500 1,000 1,500 2,000 2,500
USA
China
Russia
Japan
India
Canada
Germany
France
South Korea
UK
3.8% of total 3.4% of total
885
376
222
118
103
102
135
130
0 200 400 600 800 1,000
USA
China
Japan
India
Russia
Germany
S. Korea
Canada
8
OIL at a glance
India’s premier Oil & Gas company engaged in the exploration, development, production and transportation of crude oil and natural gas in India
Professionally managed company with experienced management with a proven track recordManagement
ICRA has assigned an A1+ (A one plus) rating to Rs. 5 billion short-term debt programme of OIL
indicating highest safetyCredit rating
Revenue: USD 1,677 m (FY09) and USD 929 m (1H2010)PAT : USD 460m (FY 09) and USD 301m (1H2010)Market cap : USD 5,852 mn2
Size
A corporate citizen committed towards corporate social responsibility, environment protection, implementation of safety measures & conservation of natural resources
Est. independent proved plus probable crude oil reserves: 575 mmboe
Est. independent proved plus probable natural gas reserves: 399 mmboeReserves
Domestic acreage: 117,6221 square kilometers; International acreage: 41,273 square kilometersAcreage
Note:1. Excluding blocks provisionally awarded in NELP VIII2. As of 29rd October 2009

Oil India Investor Presentation – H1 FY2009Oil India Investor Presentation – H1 FY2010
Sector outlook and opportunities
OIL India – An overview
Business structure, performance and strategy
Financial performance
10
Rich heritage of building a company
• Independent India’s first commercial oil discoveries were made
by Assam Oil Company
– Nahorkatiya, Assam – 1953
– Moran, Assam – 1956
• Incorporated as Joint Sector Company on 18 February, 1959
– 2/3rd Owned by Assam Oil Company / Burmah Oil Company
– 1/3rd Owned by Government of India
• Became a Public Sector Undertaking, GOI on 14 October, 1981
• Five decades of experience in Exploration & Production
• Second largest national oil and gas company in India
• Achieved overwhelming response in its maiden public issue on
30 September 2009

11
Select highlights for H1 FY2010
OIL’s shares listed on September 2009 at a 8% premium to its issue price on the NSE and
continues to trade above issue price
Highest ever crude oil production at 3.58 mtpa - a 2.2 % increase over Q2, 2008-09
Highest ever crude oil delivery at 3.67 mtpa - a 3.9 % increase over Q2, 2008-09
1 hydrocarbon discovery in August, 2009 in Well, Umatara -1 in Barail formation adjacent
to Sapkaint structure in Dibrugarh district in Q2
Achieved a cumulative increase in drilling activity upto 1H FY2010 by over 24%
Drilling commenced in Libya on 31st October,2009
OIL as Operator spuds the first well, LOC: AMG-1, in NELP-VI Block: AA-ONN-2004/1,
Amguri, under NEF Project on 25th October'2009
12
Shareholding pattern
78.4%
2.4%3.2%
4.0%
11.6%
0.3%
Promoters (GOI) Bodies Corporate
Public & Others FII
MF FI / Banks
2.23%Hindustan Petroleum Corporation
1.35%ICICI Prudential Life Insurance
0.41%SBI Life Insurance
2.23%Bharat Petroleum Corporation
0.27%HDFC Standard Life Insurance
0.34%Prudential India Equity (FII)
4.45%Indian Oil Corporation
% ShareholdingKey shareholders
• Listing: Listed on the BSE and NSE on 30th Sept 2009
• Number of shares outstanding: 240.45 mn
• Dividend: FY09 dividend per share of Rs. 305
• Share price as on 29th Oct 2009: Rs. 1,132 (NSE/BSE)

Oil India Investor Presentation – H1 FY2009Oil India Investor Presentation – H1 FY2010
Sector outlook and opportunities
OIL India – An overview
Business structure, performance and strategy
Financial performance
14
Key lines of business
• Domestic: 23 exploration blocks through NELP1
• International: Egypt, Gabon, Iran, Libya, Nigeria, Timor Leste and Yemen2
• Reserves (2P): Total reserves – est. 974 mmboe; Crude Oil – est. 575 mmboe3; Natural Gas – est. 399 mmboe4
• Discoveries: 11 Small to Medium5 size discoveries from Fiscal 2007 to Fiscal 2009 and three-month period ending 30th June 2009
• Refining and marketing petroleum products: 26% equity stake in NRL1
• Gas cracker project: 10% equity stake in BCPL2
• Acquiring, transporting and distributing natural gas -23% equity stake in DNPL3
• City gas business - Signed MOU with GAIL, IOCL and BPCL
• 50 years of experience in Oil & Gas production
• Crude oil: 40 installations and est. 1,315 km of internal crude oil pipelines grid; H1 FY10 production of 13.1 mmboe
• Natural gas: 29 installations and est. 571 km of internal gas network pipelines grid; H1 FY10 production of 7.6 mmboe
• Advanced Recovery Techniques - Artificial Lifting, Enhanced Oil Recovery and horizontal drilling
Exploration DownstreamProduction Transportation
• Crude Oil: 1,157 km crude oil pipeline with an annual capacity of over 44 mn barrels
• Multi-Product: 660 km pipeline from NRL1 to Siliguriwith an estimated capacity of 2.13 million kiloliters of refined petroleum products
• Overseas pipeline: 10% equity stake in a 741 km pipeline in Sudan
• Natural Gas: 23% stake in the 192 km DNPL3, which proposes to lay a 192 km pipeline project to transport natural gas from Duliajan to Numaligarh
Note:1. NRL – Numaligarh Refinery Limited2. BCPL – Brahmaputra Cracker and Polymer
Limited3. DNPL – Duliajan-Numaligarh Pipeline Limited
Note:1. 27 blocks acquired in 7 rounds of NELP and 4 relinquished. 9 blocks have been provisionally awarded under NELP VIII.2. Participating interests in exploration and development blocks3. Oil Reserves exclude participatory interest in Kharsang; Based on our unaudited independent proved plus probable crude oil reserves as of 31st March 2009; Include
certain reserves attributable to condensate from non-associated gas reservoirs4. Based on our unaudited independent proved plus probable natural gas reserves as of 31st March 2009; Includes certain reserves attributable to fuel gas consumption5. Small to Medium size discoveries: Estimated proved plus probable reserves size of less than 30 million barrels of oil and oil equivalent gas6. MMBOE – Million Barrels of Oil Equivalent

15
1,542
1,511
1,471
1,450
1,500
1,550
2007 2008 2009
Reserves Overview (3P)
Total Reserves (mmboe)
1,5421,5111,471Overall (O+OEG)
543472471Natural Gas
9991,0391,000Crude Oil
200920082007Total reserves (mmboe)
Reserv
es CAGR: 2
.4%
Note:1. OEG – Oil Equivalent Gas
16
Note:NO – Non-operatorPI – Participatory Interests1. Includes a 40% PI in the Kharsang fields of area 11 sq. km.
Strong presence in prospective East Coast
RJ-ONN
KG-DWN
KG-DWNMN-DWN
AA-ONN
AA-ONN
AA-ONN
AA-ONN
AA-ONN
AAP-ON
MZ-ONN
KG-DWN
AN-DWN
�
�
�
�
�
�
�
�
AA-ONN
AA-ONN
�
CY-DWN
WB-ONN
RJ-ONN
RJ-ONN
30%
90%
85%
16%
15%
10%
75%
25%
10%
RJ-ONN60%
75%
60%
60%
10%
20%
15%20%
KG-DWN 10%
20%
85%
20%
15%
20%
�KG-ONN 90%
GK-OSJ-3 MN-OSN
Exploration Blocks : National Presence
Total Area – 158,895 Sq. Km
Summary of Acreage (sq. km.)
1
OIL as Operator
NELP I-VII
Nomination ML(s)/PEL(s)
JVC Blocks
�
Map Not to Scale
2
4,811
41,273
82,175
5,368
6,041
19,227
PEL Nomination PML Nomination
JV/PSC (NO) NELP (Operator)
NELP (NO) Overseas (PI)
RJ-ONN� 60%
�
ASSAM +AP

17
3,735
616 460
Assam Arunachal
Pradesh
Rajasthan
4,852
516
Assam Arunachal
Pradesh
15 2 2 11 5
PML Areas 19 4,811 Pre-NELP – JV/PSC (Non Operator) 3 6,041
305
5,725
11
Assam & AP Kutch
Offshore
Kharsang
1 1 1
Operator Blocks (NELP) 11 19,227
899
8,885
275
7,650
1,518
II IV V VI VII
1 1 12 6
Non-Operator Blocks (NELP) 12 82,175
4,970
37,066
110 1,060
22,829
16,140
I II III IV VI VII
1 1 24 1 3
All Onshore 4 Onshore, 1 Offshore & 7 Deepwater
Block category Blocks Area (Sq.km.)
Petro. Mining License (PML) Petro. Exploration License (PEL) JV/Production Sharing Contract (PSC)
Area (Sq.km.)
Blocks
PEL Areas 16 5,368
1
Map Not to Scale
Exploration Acreages
18
NELP VIII: Blocks provisionally awarded
APGIC-10%
NTPC-10%
ONGC-50%
30835Shallow OffshoreKrishna-Godavari BasinONGCKG-OSN-2009/4
GAIL-10%
ONGC-60%304,040Deep WaterAndaman BasinONGCAN-DWN-2009/18
ONGC-60%403,992Deep WaterAndaman BasinONGC & OIL (Joint)
AN-DWN-2009/3
ONGC-60%403,995Deep WaterAndaman BasinONGCAN-DWN-2009/2
ONGC-70%304,981Deep WaterAndaman BasinONGCAN-DWN-2009/1
APGIC-10%
ONGC-45%
BGEPIL-30%
151,800Deep WaterKrishna-Godavari BasinBGEPILKG-DWN-2009/1
ONGC-50%5084OnlandAssamONGCAA-ONN-2009/3
ONGC-50%501,621Shallow OffshoreCauvery BasinOILCY-OSN-2009/2
ONGC-50%5084OnlandAssamOILAA-ONN-2009/4
Consortium Partners (PI)
OIL’sP. I. (%)
Area (sq. km.)TypeAreaOperatorName of the Block
�
�
�
OIL as Operator�

19
Overseas Exploration and Development Blocks
Area – 41,273 sq.km.17 Blocks1
Total
OIL also holds a 10% equity stake in 741 km crude oil pipeline in Sudan
Note:1. Participating Interest in exploration and development blocks
* Government approval is awaited
Operator
Area (Sq. Km)
OIL’s Participating Interest (%)
LIBYAArea 86Area 102/4Area 95/96
GABON Shakti
NIGERIA OPL 205
TIMOR LESTE*Block K
YEMENBlock 82 Block 83
EGYPT*Block 3Block 4
IRAN Farsi Offshore
3,500 20 (OVL)
8,2872,600
25 (GSPC)
2,09417.5
(Suntera)
3,76145
1,857364
15 (Medco)
2,38412.5
(Reliance)
7,0872,7106,629
50 50 25
(Sonatrach)
20
Exploration and Development Growth Mapping (Acreage)
0
20000
40000
60000
80000
100000
120000
140000
160000
180000
Nomination Including Pre-NELP JVs (Till 1998)
Very limited Scope for Growth
NELP (1999 onwards)
+Overseas
(2005 onwards)
Competition Level Playing Field
Operation Area – NE, RJ, UP, Uttarakhand Operation Area – Pan India + Overseas
Acreage (Sq. Km)
Growth
~ 11 Times Growth1
Current Acreage
Domestic = 117,622 sq.km
Overseas = 41,273 sq.km

21
Proved Proved & Probable Proved, Probable & Possible
Crude Oil and Natural Gas Reserves
Crude Oil Reserves (mmboe) Natural Gas Reserves (mmboe)
283 296 285
540588 575
1,0001,039
999
0
300
600
900
1,200
1,500
1,800
2007 2008 2009
169233 247
289345
399471 472
543
0
300
600
900
1,200
1,500
1,800
2007 2008 2009
Overall Reserves (mmboe)
452529 532
829
933974
1,4711,511 1,542
0
300
600
900
1,200
1,500
1,800
2007 2008 2009
Has improved the overall reserves available consistently over the past 3 years through enhanced oil recovery methods and aggressive exploration
22
22.17 22.38
24.95
12.92 13.16
0
5
10
15
20
25
30
2006-07 2007-08 2008-09 H1 2008-
09
H1 2009-
10
14.24 14.72 14.27
7.27 7.59
0
5
10
15
20
25
30
2006-07 2007-08 2008-09 H1 2008-
09
H1 2009-
10
Crude Oil and Natural Gas Production
Crude Oil Production (mmboe) Natural Gas Production (mmboe)
• Crude oil production in H1 FY2010 increased by 1.9% over H1 FY2009 to 13.16 mmboe1
• Natural gas production in H1 FY2010 increased by 4.4% over H1 FY2009
Note: (1) 1 BCM of Natural Gas = 6.2898 MMBOE

23
6.576.25 6.22 6.38
6.79
0.00
1.00
2.00
3.00
4.00
5.00
6.00
7.00
8.00
Q2 09 Q3 09 Q4 09 Q1 10 Q2 10
2.86 2.792.53
2.96 2.89
0
1
2
3
4
5
Q2 09 Q3 09 Q4 09 Q1 10 Q2 10
Crude Oil and Natural Gas Sales
Crude Oil Quarter on quarter sales (mmboe) Natural Gas Sales (mmboe)
24
5.23
4.80
7.10
6.81
0 2 4 6 8
FY2006
FY2007
FY2008
FY2009
1.80
1.81
1.83
2.99
0 1 2 3 4
FY2006
FY2007
FY2008
FY2009
Low Lifting and Finding costs
Lifting Costs (US$/boe) Finding Costs (US$/boe)
Note: (1) BOE: Barrels of Oil Equivalent
Production Cost NG (US$/MMBTU)
0.96
0.77
1.11
1.17
0.00 0.20 0.40 0.60 0.80 1.00 1.20 1.40
FY2006
FY2007
FY2008
FY2009

25
Healthy reserve replacement ratio
176
159
204
204
169
0 50 100 150 200 250
FY2005
FY2006
FY2007
FY2008
FY2009
Crude Oil and Natural Gas (O+OEG)
Adequate reserve replenishment
26
64.96
83.22 81.69
117.74
62.6
45.68
58.13 55.56
73.51
56.32
29.55
38.47 41.22
53.46
40.11
0
20
40
60
80
100
120
140
FY2007 FY2008 FY2009 HI FY2009 H1 FY2010
Gross Realized Price Realized Price after Subsidy/Discount Net Realized Price
CAGR (FY07 – 09) = 13.0%
1
Realized Price
Realized Price ($/barrel)
Current subsidy burden only on auto fuels
27
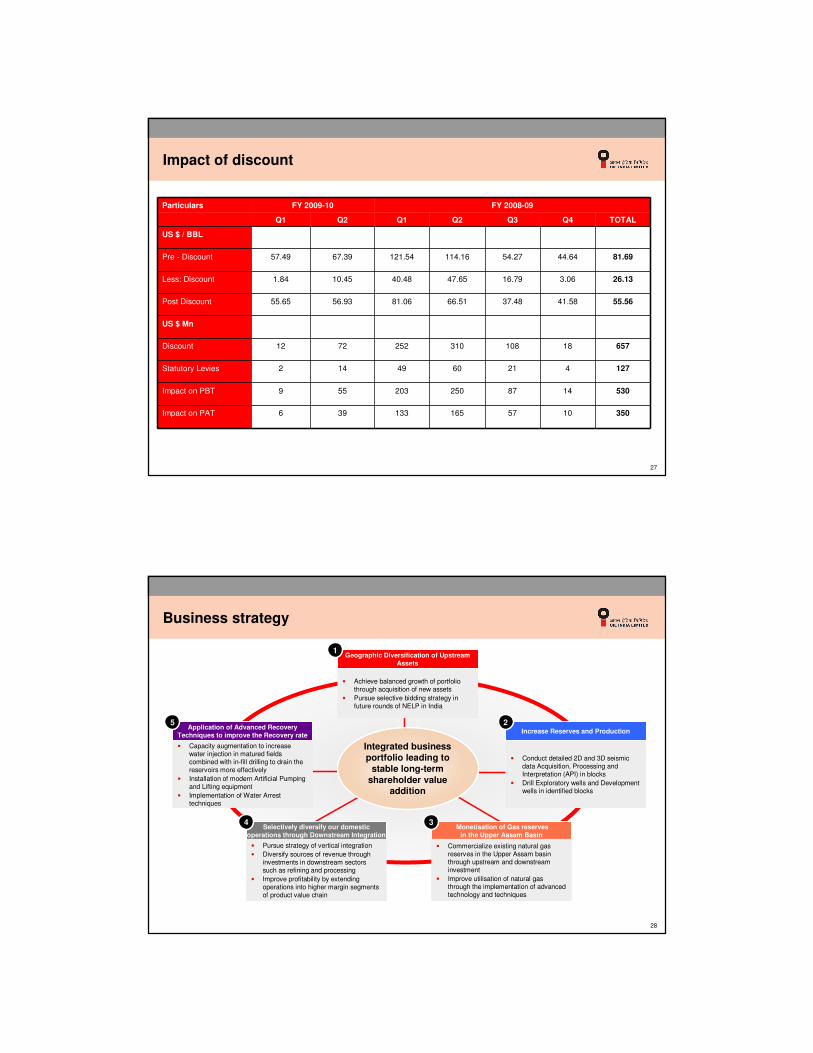
Impact of discount
Particulars FY 2009-10 FY 2008-09
Q1 Q2 Q1 Q2 Q3 Q4 TOTAL
US $ / BBL
Pre - Discount 57.49 67.39 121.54 114.16 54.27 44.64 81.69
Less: Discount 1.84 10.45 40.48 47.65 16.79 3.06 26.13
Post Discount 55.65 56.93 81.06 66.51 37.48 41.58 55.56
US $ Mn
Discount 12 72 252 310 108 18 657
Statutory Levies 2 14 49 60 21 4 127
Impact on PBT 9 55 203 250 87 14 530
Impact on PAT 6 39 133 165 57 10 350
28
Business strategy
Geographic Diversification of Upstream Assets
Integrated business portfolio leading to
stable long-term shareholder value
addition
• Achieve balanced growth of portfolio through acquisition of new assets
• Pursue selective bidding strategy in future rounds of NELP in India
1
Increase Reserves and Production
• Conduct detailed 2D and 3D seismic data Acquisition, Processing and Interpretation (API) in blocks
• Drill Exploratory wells and Development wells in identified blocks
2
Monetisation of Gas reserves in the Upper Assam Basin
• Commercialize existing natural gas reserves in the Upper Assam basin through upstream and downstream investment
• Improve utilisation of natural gas through the implementation of advanced technology and techniques
3Selectively diversify our domestic
operations through Downstream Integration
• Pursue strategy of vertical integration
• Diversify sources of revenue through investments in downstream sectors such as refining and processing
• Improve profitability by extending operations into higher margin segments of product value chain
4
Application of Advanced Recovery Techniques to improve the Recovery rate
• Capacity augmentation to increase water injection in matured fields combined with in-fill drilling to drain the reservoirs more effectively
• Installation of modern Artificial Pumping and Lifting equipment
• Implementation of Water Arrest techniques
5

Oil India Investor Presentation – H1 FY2009Oil India Investor Presentation – H1 FY2010
Sector outlook and opportunities
OIL India – An overview
Business structure, performance and strategy
Financial performance
30
Revenue and profitability analysis (USD mn)
Revenue CAGR: 10.5%
Revenue and profitability
1,242 1,239
1,401
1,677
1155
929
379317
367460
353301
0
400
800
1,200
1,600
2,000
FY2006 FY2007 FY2008 FY2009 H1 FY2009 H1 FY2010
Income PAT
Note: Exchange rate 1 USD = 48.52 INR used for figures upto FY2009; for H1FY2009 and H1FY2010, actual exchange rates have been used.

31
1,220
1,406
1,629
1,935 1,992
12.8
9.39.0
7.66.65.7
0
500
1,000
1,500
2,000
2,500
FY2006 FY2007 FY2008 FY2009 H1 FY2009 H1 FY2010
0
5
10
15
20
Networth (LHS)Book Value (RHS)
Networth and Book Value
Networth (USD mn) and Book Value Analysis (USD)
Networth CAGR: 16.6%2,788
32
Cash Flow (USD mn) EBITDA (USD mn) and EBITDA MARGIN (%)
Consistent and Attractive Cash Flow EBITDA EBITDA MARGIN
Cash Flow and EBITDA Margin
275
344
391
353
269
0
50
100
150
200
250
300
350
400
450
FY2007 FY2008 FY2009 H1FY0809 H1FY0910
533586
734
550501
44%
53% 54%
43% 42%
0
100
200
300
400
500
600
700
800
FY2007 FY2008 FY2009 H1FY0809 H1FY0910
0%
10%
20%
30%
40%
50%
60%

33
33.5633.93
32.9
30.19
305
275
265260
28
29
30
31
32
33
34
35
FY2006 FY2007 FY2008 FY2009
220
240
260
280
300
320
Dividend Payout (%) - LHS Dividends (%) - RHS
Dividends distribution Earnings per share and Debt-Equity ratio
The dividend per share has shown a consistent uptrend Steady increase in EPS and minimal debt on the balance sheet
86
72
83
104
67
0.004x0.006x
0.02x
0.06x
0.12x
0
20
40
60
80
100
120
FY2006 FY2007 FY2008 FY2009 H1 FY2010
0
0.02
0.04
0.06
0.08
0.1
0.12
0.14
Earnings per share (INR) Debt/Equity
Dividends distribution and Earnings per share highlights
34
Investment PlansIN
R M
illi
on
24638131066584US$ Million
110821365794796426278Grand Total INR Million
24507270225631673Acquisition & Diversification
8285387819032504Overseas Projects
78029324312349822101Total INR Million
10286342326934170Capital Equipments & Facilities
20344988855274929Development Activities
47400191201527813002Exploration & appraisal activities
Total2011-122010-112009-10

35
THANK YOUTHANK YOU