h1 09 presentation final
TRANSCRIPT

1
Datatec GroupUnaudited results for the six months ended 31 August 2008
2
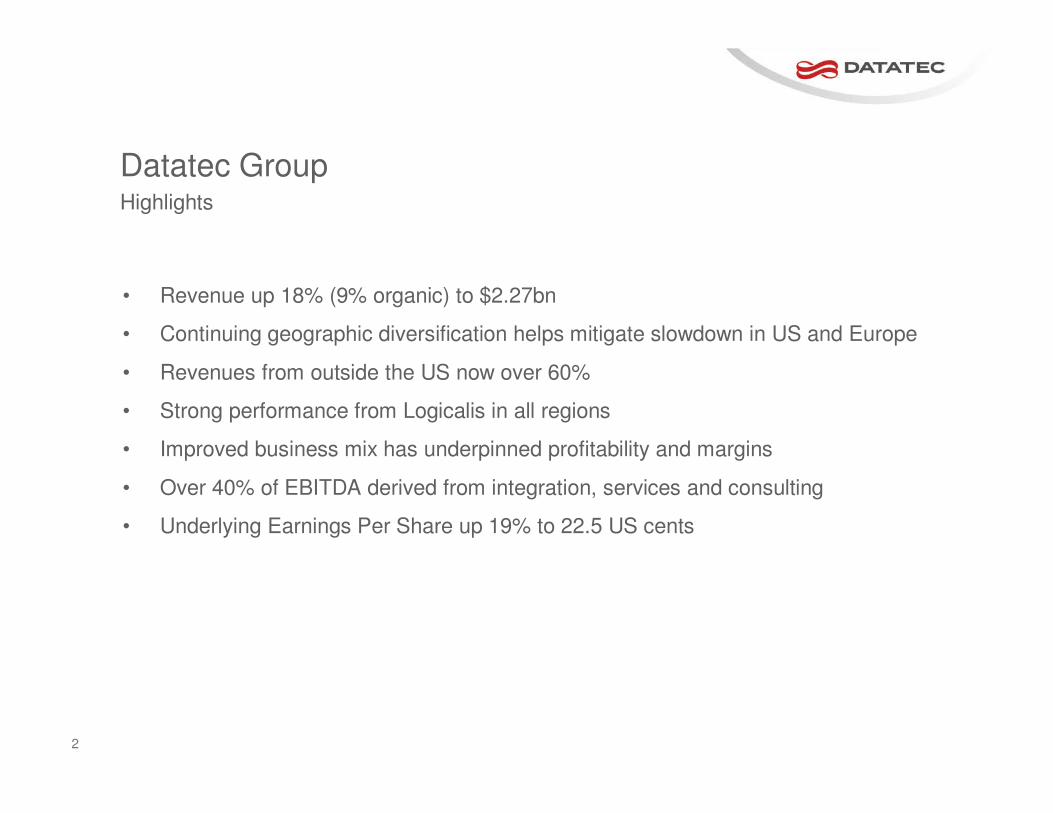
Datatec Group
• Revenue up 18% (9% organic) to $2.27bn
• Continuing geographic diversification helps mitigate slowdown in US and Europe
• Revenues from outside the US now over 60%
• Strong performance from Logicalis in all regions
• Improved business mix has underpinned profitability and margins
• Over 40% of EBITDA derived from integration, services and consulting
• Underlying Earnings Per Share up 19% to 22.5 US cents
Highlights

3
Datatec Group
• Financial crisis has created a deterioration in confidence
• Challenging conditions in US and Europe
• South America, the Middle East and Asia are less impacted
• Growth segments are SMB, managed services, virtualization & security
• Consolidation opportunities are growing as weaker competitors fair worse
Market conditions

4
Datatec Group
• Revenue growth of 18% (9% organic) to $2.27 billion
• Gross margin percentage improved to 13.4% from 12.9%
• Underlying* EBITDA up 25% to $76 million
• Underlying* earnings per share up 19% to 22,5 US cents
• $66 million cash generated from operations (2007: $3 million)
Financial performance summary
* excluding goodwill impairment, amortisation of intangible fixed assets, profit or loss on sale of assets and businesses, fair value movements on put/call arrangements and unrealised foreign exchange movements

5
Datatec GroupBusiness stream analysis
Distribution
ICT Solutions
Consulting & Prof Services
H1 2009 H1 2009
Revenues grew by 18% (9% organic)
Revenue Gross profit
Gross profit grew by 22%
$471m
21%
$145m
6%
$1,650m
73%
$90m
30%$48m
16%
$165m
54%

6
Datatec GroupRevenue % by geography
Increase in non-US and non-European revenues
43
42
6
7 2
North America
Europe
Asia Pac
Africa Middle East
South America
35
42
6
8
9
H1 2008 H1 2009

7
Datatec GroupGross profit contribution % by geography
Increased gross profit contribution from South America
43
5
7 2
43
North America
Europe
Asia Pac
Africa Middle East
South America
40
6
7
13
34
H1 2008 H1 2009

8
Datatec GroupFinancial performance
($m) H1 2007 H1 2008 H1 2009
Sales 1,520.3 1,921.7 2,266.0
Gross margin 191.0 247.8 303.4
Gross margin % 12.6% 12.9% 13.4%
Operating costs 138.9 187.4 232.0
Operating cost margin % 9.1% 9.7% 10.2%
EBITDA 52.0 60.4 71.4
EBITDA% 3.4% 3.1% 3.2%
Depreciation 7.1 7.5 8.3
Amortisation of acquired intangible assets 1.7 4.5 8.8
Operating profit 43.3 48.5 54.3
Operating profit % 2.8 2.5% 2.4%
+26 %
+30 %
+16 %
+18 %
+18 %
+22 %

9
Datatec GroupFinancial performance (continued)
173163147Weighted average number of shares (million)
175169147Issued number of shares (million)
($m) H1 2007 H1 2008 H1 2009
Operating profit 43.3 48.5 54.3
Net finance costs 4.7 8.0 7.4
Profit before tax 38.5 40.5 47.2
Underlying * EPS (US cents) 14.0 18.9 21.4
HEPS (US cents) 15.6 16.8 17.6
* excluding goodwill impairment, amortisation of intangible fixed assets, profit or loss on sale of assets and businesses, fair value movements on put/call arrangements and unrealised foreign exchange movements
+12 % +12 %
+35 % +19 %

10
Datatec GroupCash flow ($m)
H1 2008 H1 2009
EBITDA 60.4 71.4
Working capital changes (58.3) (0.6)
Non-cash items 0.6 (4.5)
Cash generated from operations 2.7 66.3
Net finance costs paid (8.0) (7.4)
Taxation paid (16.6) (19.4)
Net cash inflow / (outflow) from operating activities (21.9) 39.5
Net cash outflow from investing in subsidiaries (153.8) (49.5)
Net cash outflow from other investing activities (7.1) (7.8)
Net cash inflow from financing activities 76.1 20.9
Capital distribution to shareholders (16.8) (20.5)
Decrease in cash and cash equivalents (123.5) (17.4)
Translation difference on opening cash position 4.6 5.5 Cash and cash equivalents at beginning of period 141.4 34.2
Cash and cash equivalents at end of period 22.6 22.3

11
Datatec GroupBalance sheet summary ($m)
FY 2008 H1 2009
Equity and Liabilities
Shareholders funds 654.7 632.4
Outside shareholders 23.6 54.6
Long term liabilities 83.3 95.0
Amounts due to vendors 2.0 78.9
Current liabilities 1,120.8 1,229.3
1,884.3 2,090.1
Assets
Non current assets
Goodwill 284.3 354.5
Other intangible assets 55.0 82.9
Other non-current assets 81.8 80.1
Current assets 1,463.2 1,572.6
1,884.3 2,090.1

12
Westcon Group

13
Westcon GroupHighlights
• H1 revenues increase 9% to $1.5 billion
• Revenue increases in Europe and Asia Pacific offset by static revenues in Americas
• Gross margin increases to 10.1% with increases in the Americas and Asia Pacific
• Effective working capital management drives 26% reduction in interest expense
• New COO, Dean Douglas, joined in July

14
Westcon GroupFinancial performance summary
($m) H1 2008 H1 2009 Growth %
Sales 1,385,2 1,509,6 9%
Gross margin 136.4 151.9 11%
Gross margin % 9.8% 10.1%
Operating costs 88.7 107.8 21%
Operating cost margin % 6.4% 7.1%
EBITDA 47.7 44.1 (7%)
EBITDA% 3.4% 2.9%
Operating profit 41.2 36.9 (11%)
As a % of revenue 3.0% 2.4%
Net interest 9.2 6.8 (26%)
Pre-tax income 32.0 30.3

15
Westcon GroupRevenue % by geography
Americas
Europe
Asia Pac
46
45
9
Growth in European business
41
49
10
H1 2008 H1 2009

16
Westcon GroupRevenue % by vendor
57
11
10
8
14
Reduced reliance on Cisco; growth in Security
55
10
10
15
10
Cisco
Nortel
Avaya
Security
Other
H1 2008 H1 2009

17
Westcon GroupRevenue % by customer Reseller
System Integrator
Service Provider
65
27
9
Customer groups remain constant
66
21
13
H1 2008 H1 2009

18
Westcon GroupGross Margin %
9.310.1
10.9
9.89.610.2
11.6
10.1
0
2
4
6
8
10
12
14
Americas Europe Asia Pac Total
H1 2008
H1 2009

19
Westcon GroupEBITDA ($ millions)
Note: Central costs include infrastructure, systems and other non-operating group costs
H1 2008
H1 2009
35
17
6
48
31
16
8
44
-11 -12
-20
-10
0
10
20
30
40
50
60
Americas Europe Asia Pac Central
Costs
Total

20
Westcon GroupConsolidated balance sheet – working capital – US GAAP
Note: Amounts are stated before intercompany elimination and ratios based on trailing 90 day averages
1,6911,6341,556Total Headcount
179192177Net Debt (including Datatec loan)
1.3
65
514
9.3x
311
66
581
H1 2009($m) H1 2008 FY 2008
Accounts receivable 504 567
DSO (days) 61 69
Inventory 262 279
Inventory turns 10.4x 9.7x
Accounts payable 436 484
DPO (days) 59 66
Current ratio 1.3 1.3

21
Westcon GroupNet cash / debt trend ($m)
Note: Including Datatec loan
Mar
-
02
Jul
-
02
Nov
-
02
Mar
-
03
Jul
-
03
Nov
-
03
Mar
-
04
Jul
-
04
Nov
-
04
Mar
-
05
Jul
-
05
Nov
-
05
Mar
-
06
Jul
-
06
Nov
-
06
Mar
-
07
Jul
-
07
Nov
-
07
Mar
-
08
Jul
-
08
-$350
-$300
-$250
-$200
-$150
-$100
-$50
$0
$50
Mar-
02
Jul-02
No
v-0
2
Mar-
03
Jul-03
No
v-0
3
Mar-
04
Jul-04
No
v-0
4
Mar-
05
Jul-05
No
v-0
5
Mar-
06
Jul-06
No
v-0
6
Mar-
07
Jul-07
No
v-0
7
Mar-
08
Jul-08
Net Cash

22
Westcon GroupFuture outlook
• Economic outlook uncertain
• Weakness in US market extends to Europe
• Cost cutting initiatives underway to reduce operating expenses
• Leverage international reach and global scale for vendors and customers
• Consolidation opportunities in mature markets
• Improved cash generation

23
Logicalis Group

24
Logicalis Group
• Revenues up 39% to $550.7 million (11% organic)
• Annuity service revenues up 36%
• Strong Cisco growth
• All regions produced top and bottom line growth with operating costs well managed
• Significant improvement in EBITDA to $32.0 million (H1 08: $8.1 million)
• Gross margins expand to 22% and EBITDA margins to 5.8%
• Continued improvement in US profitability post last year’s restructuring
• Very strong performance by Brazil acquisition (completed 2 May 2008)
Highlights

25
Logicalis GroupFinancial performance summary
($m) H1 2008 H1 2009 Growth %
Sales 395.5 550.7 39%
Gross margin 85.3 121.3 42%
Gross margin % 21.6% 22.0%
Operating costs 77.2 89.2 16%
Operating cost % 19.5% 16.2%
EBITDA 8.1 32.0 295%
EBITDA% 2.0% 5.8%
Operating profit 3.3 23.2 608%
As a % of revenue 0.8% 4.2%

26
Logicalis GroupRevenue % geographic split North America
South America
UK
Germany
50
6
43
1
41
25
33
1
H1 2008 H1 2009
Improved geographic mix

27
Logicalis GroupRevenue segmental split
81
9
10
81
8
11
Product
Professional Services
Maintenance & Managed Services
H1 2008 H1 2009
Sales mix remained steady

28
Logicalis GroupRevenue product vendor mix %
39
26
24
92
27
44
18
92
IBM
Cisco
HP
Others
EMC
H1 2008 H1 2009
Cisco largest vendor partner

29
Logicalis GroupGross margin %
21.2
25.9
21.523.6
21.6
28.5
22.021.823.1
20.7
0
5
10
15
20
25
30
UK Germany North
America
South
America
Total
H1 2008
H1 2009
Overall margin up 0.4%

30
Logicalis GroupEBITDA ($m)
7.8
-0.5
3.21.4
-3.8
8.19.8
-0.5
11.9
16.1
-5.3
32.0
-10
-5
0
5
10
15
20
25
30
35
UK Germany North
America
South
America
Central
Costs
Total
H1 2008
H1 2009
Continued recovery in US profitability and strong Brazil performance

31
Logicalis GroupKey financial measures
44.3
72
116.5
44
133.9
18
28.0
19.3
FY2008($m) H1 2008 H1 2009
Deferred revenue 20.1 20.7
Inventory 12.3 51.7
Inventory days (excluding spares stock) 6 23
Accounts receivable 145.8 184.8
DSO days 48 40
Accounts payable 100.2 171.1
DPO days 69 58
Net cash 7.6 67.0
Significant cash generation
32
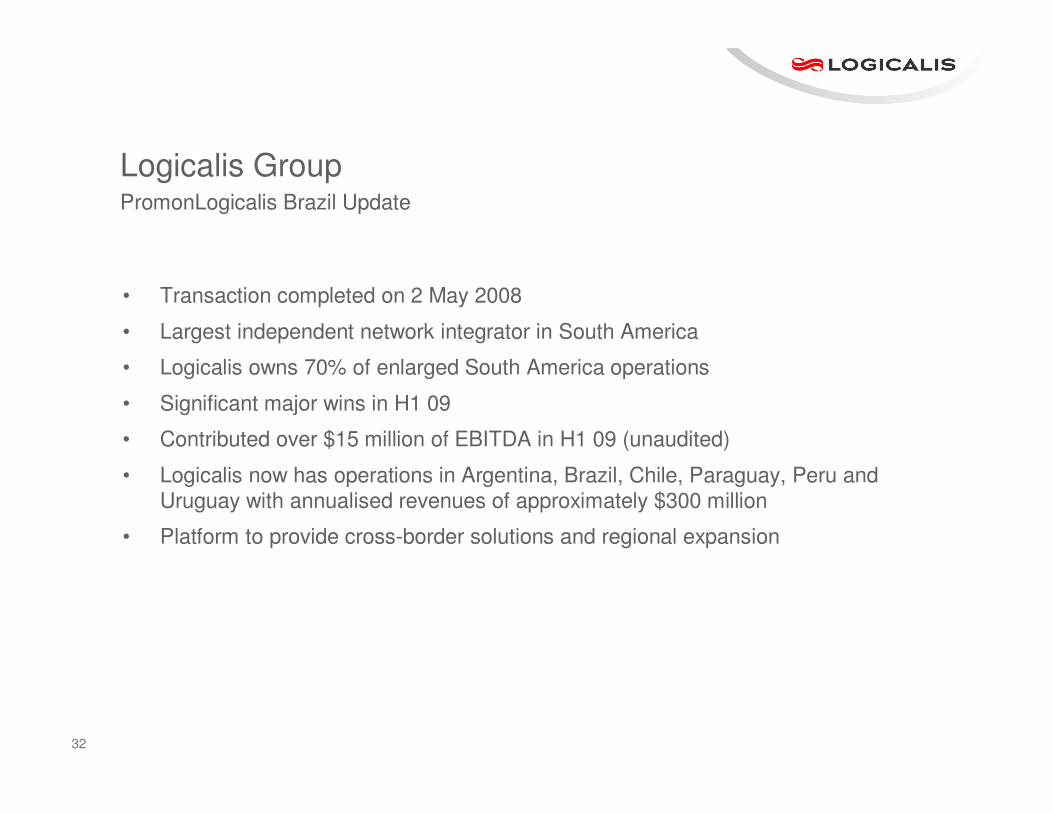
Logicalis GroupPromonLogicalis Brazil Update
• Transaction completed on 2 May 2008
• Largest independent network integrator in South America
• Logicalis owns 70% of enlarged South America operations
• Significant major wins in H1 09
• Contributed over $15 million of EBITDA in H1 09 (unaudited)
• Logicalis now has operations in Argentina, Brazil, Chile, Paraguay, Peru and Uruguay with annualised revenues of approximately $300 million
• Platform to provide cross-border solutions and regional expansion

33
Logicalis GroupFuture outlook
• Step change in the scale, business mix and positioning of the group
• Solid financial performance in tough market conditions
• Annuity based services revenues will continue to grow in proportion
• Macroeconomic conditions have deteriorated everywhere
• Continuing to rein in operating expenses
• Opportunities to exploit consolidation

34
Analysys Mason

35
Analysys Mason Highlights
• Revenues decline modestly on back of dollar strength
• Non-UK client base now generates 61% of total revenues (50% in H1 08)
• Strong start after opening of Dubai office for MENA region
• Completed the acquisition of Boston based OSS Observer on 26th June 2008
• Strategy business now represents 53% of total revenues (up 8% over H1 08)
• Research revenues have grown 22% year over year
• Move to a single brand Analysys Mason, completed in April 2008
• Steps taken to reduce fixed cost base in response to slowing market conditions

36
Analysys MasonFinancial performance summary
($ millions) H1 2008 H1 2009 Growth %
Revenue 31.5 30.4 (3.5%)
Gross margin 12.3 11.2 (9.0%)
Gross margin % 39.2% 36.8%
Operating costs 9.3 8.9 (4.3%)
Operating cost margin % 29.5% 29.3%
EBITDA 3.0 2.4 (23.3%)
EBITDA% 9.6% 7.9%
Operating profit 2.7 1.9 (29.6%)
As a % of revenue 8.9% 5.6%

37
Analysys MasonRevenue % geographical split
50
17
21
111
39
22
26
94
UK
Europe
MENA
Asia
USA
H1 2008 H1 2009

38
• Deepening our client relationships by increasing our support for operational activities
• Internationalising existing propositions
• Investing in our intellectual capital, high-profile and behind-the-scenes successes
• Managing our fixed cost base
Analysys MasonStrategy

39
• Mobile user growth in Emerging Markets
• Content delivery over broadband wireless (HSPA)
• Government and regulator engagements in next generation digital broadcast
• Exploiting broader ICT market
• Focused on improving diversification to drive growth
• Expecting to remain relatively defensive in downturn
Analysys MasonFuture Outlook

40
Other Emerging Market Operations
41
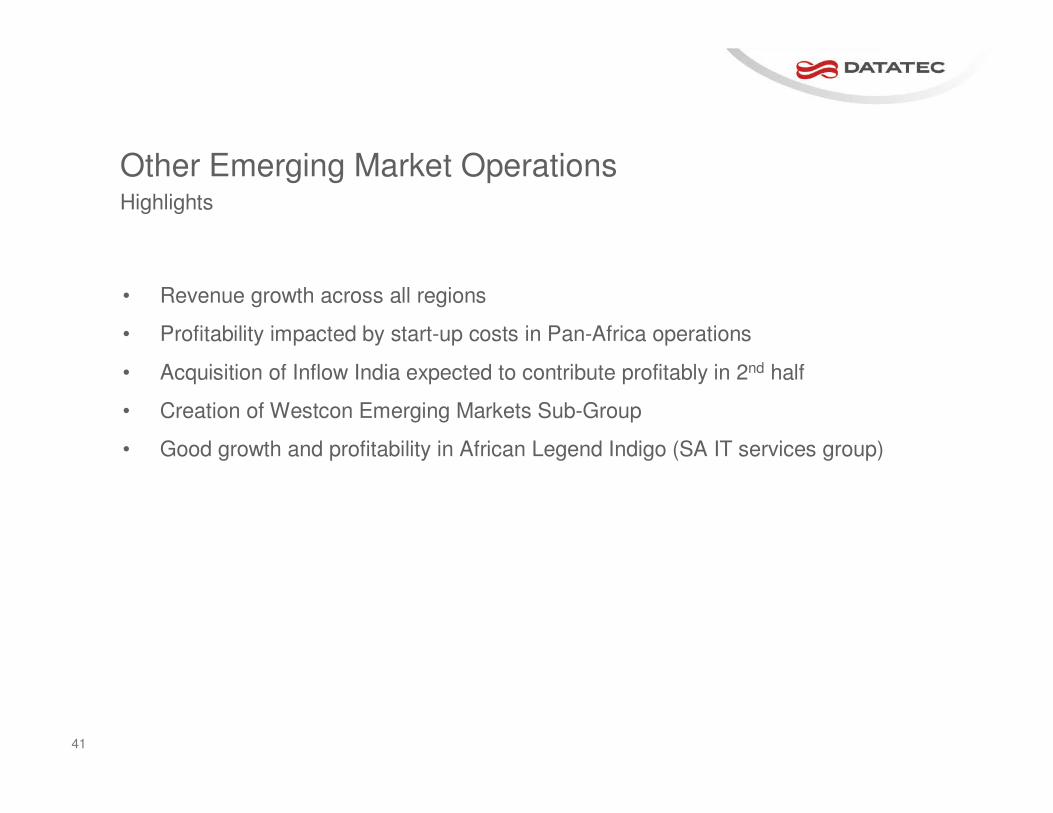
Other Emerging Market OperationsHighlights
• Revenue growth across all regions
• Profitability impacted by start-up costs in Pan-Africa operations
• Acquisition of Inflow India expected to contribute profitably in 2nd half
• Creation of Westcon Emerging Markets Sub-Group
• Good growth and profitability in African Legend Indigo (SA IT services group)

42
Other Emerging Market OperationsFinancial performance summary
($m) H1 2008 H1 2009 Growth
Sales 109.5 175.3 60%
Gross margin 13.8 19.1 38%
Gross margin % 12.6% 10.9%
Operating costs 11.4 17.5 54%
Operating cost margin % 10.4% 10.0%
EBITDA 2.4 1.5 (38%)
EBITDA% 2.2% 0.9%
Operating profit 2.1 0.9 (56%)
As a % of revenue 1.9% 0.5%
Net interest 0.4 1.6 321%
Pre-tax income 1.7 (0.7) (139%)

43
Other Emerging Market OperationsRevenue % by geography
5727
16
38
26
36
South Africa
Middle East & North Africa
Sub Saharan Africa
H1 2008 H1 2009

44
Other Emerging Market OperationsStrategic focus and outlook
• Drive synergies and operating leverage with Westcon Emerging Markets group
• India transaction offers excellent platform to grow rapidly and profitably
• Other untapped markets under review
• Aiming for $400 million + revenues and improving profitability for next year

45
Datatec Group

46
Datatec GroupMarket outlook
• US and European weakness likely to spread to the rest of the world
• Financial crisis likely to impact global growth for some time
• Wall Street and London financial firms will be hard hit and need to downsize
• Advancing user base in emerging markets should still relatively out perform
• Certain technologies will be vital for future productivity and growth

47
Datatec GroupStrategy
• Remain lightly exposed to the financial sector
• Accelerate activities in more dynamic and growth potential markets
• Focus on essential product and services segments
• Lower operating costs in all areas
• Increase cash flow and reduce debt

48
Datatec GroupCurrent trading and prospects
• Despite the recent financial crisis we continue to trade in line with our expectations
• US remains soft and similarly Europe
• Impact in the rest of the world unclear, Middle East and Asia still holding up
• Recent expansion in Brazil and now India is expected to contribute strongly
• Expect 2nd half to be similar to or beat 1st half financial performance
• Focused on controlling operating costs and generating cash
• Opportunistic acquisition consolidation targets may become available

49
Questions