oil in water fluorescence and backscattering relationships
TRANSCRIPT

Oil in Water Fluorescence and Backscattering Relationships
Ian WalshSea-Bird Scientific Ocean Research
Brian RobinsonFisheries and Oceans Canada, Bedford Institute of Oceanography
John KoeglerSea-Bird Scientific Ocean Research
Robyn Conmy3USEPA/NRMRL/LRPCD
February, 2016

© Copyright 2016. Confidential and Proprietary.
Experimental ConsiderationsThe particle size distribution impacts:
FluorescenceBackscatteringForward Scattering
Backscattering and forward scattering demonstrate coherent responses
Fluorescence and backscattering signals can be used to: Measure dispersant effectivenessQuantify changes in the particle distribution

© Copyright 2016. Confidential and Proprietary.
DWH Profiles - Pelican
Site 332.5 nm SW
Site 341.25 nm SW
Diercks et al., 2010

© Copyright 2016. Confidential and Proprietary.
Situational Outline UV A fluorometers: relatively weak LEDs
Wide band filters on the detector (90 nm) Higher gain (amplification) on the detector Time average (not ECO)
Signal to noise is low relative to other sensors Fluorometers worked ok for the DWH because the spill was so
large
Lots of room for improvement, so we designed a new instrument

© Copyright 2016. Confidential and Proprietary.
Higher Resolution : Better Signal to NoiseImproved ElectronicsDesign
Materials (FDOM)Optics
Wider Range: One size fits allRetain high resolutionDecrease chance of saturation
Multiple sensors in one instrumentCo-locating oil discrimination factorsEase of useEconomy
New Instrument – SeaOWL UV-A

© Copyright 2016. Confidential and Proprietary.
ECOSensing Volume:
Intersecting conical volumesEnergy return: Approximately
1 cm³ , 1 cm face
SeaOWL UV-A v ECO Optics
SeaOWL UV-ASensing Volume: Illumination conical volume inside
wide angle detector volume:Greater depth of field
© Copyright 2016. Confidential and Proprietary.
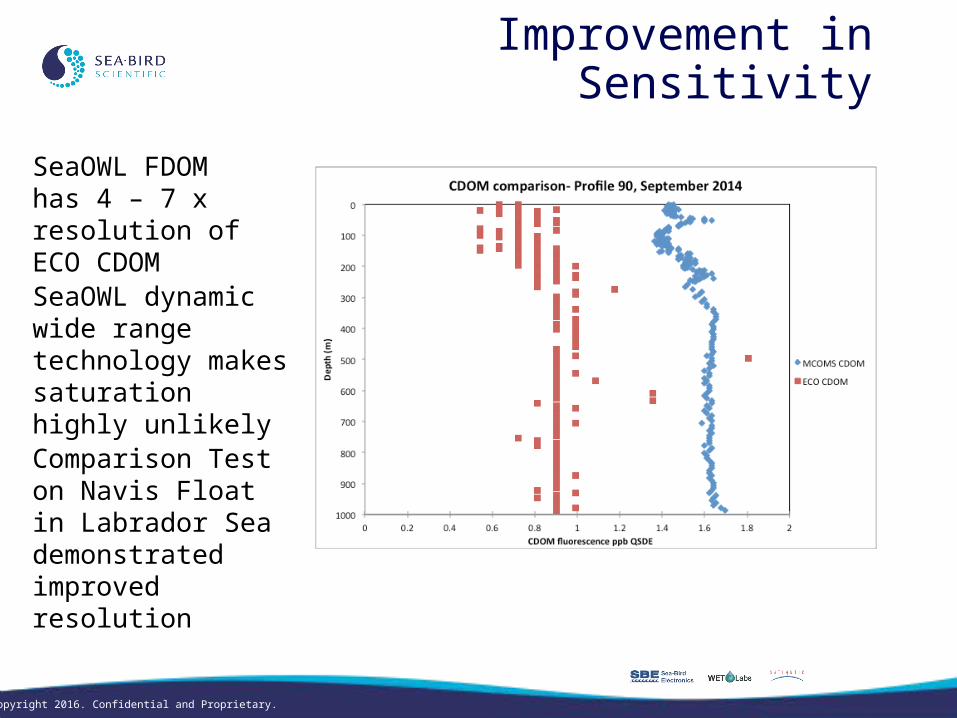
SeaOWL FDOM has 4 – 7 x resolution of ECO CDOM
SeaOWL dynamic wide range technology makes saturation highly unlikely
Improvement in Sensitivity
Comparison Test on Navis Float in Labrador Sea demonstrated improved resolution

© Copyright 2016. Confidential and Proprietary.
Fluorescence: The emission of light by a substance that has absorbed light or
other electromagnetic radiation.– Fluorometers excite at a specific wavelength – Target emits light at a longer wavelength, lower energy, than
the absorbed radiation – Signal is a function of concentration– Signal is Isotropic– Signal is a function of the dispersion of the target in the
volume
Detecting Oil: Fluorescence

© Copyright 2016. Confidential and Proprietary.
Backscattering: The portion of light scattered in the backward direction at a particular angle to the detector
– Backscattering sensors illuminate particles in the water at a specific wavelength
– Signal is a function of the angle– Signal is a function of concentration (ESD) and particle
size (PSD)
Detecting Oil Droplets

© Copyright 2016. Confidential and Proprietary.
Testing at COOGER
AOS #1
AOS #3
7/17/15SeaOWL UV-A

© Copyright 2016. Confidential and Proprietary.
Advanced Oil Sensor TestingSeaOWL UV-A v ECO
ANS DOR 1:200
ANS DOR 1:100
© Copyright 2016. Confidential and Proprietary.
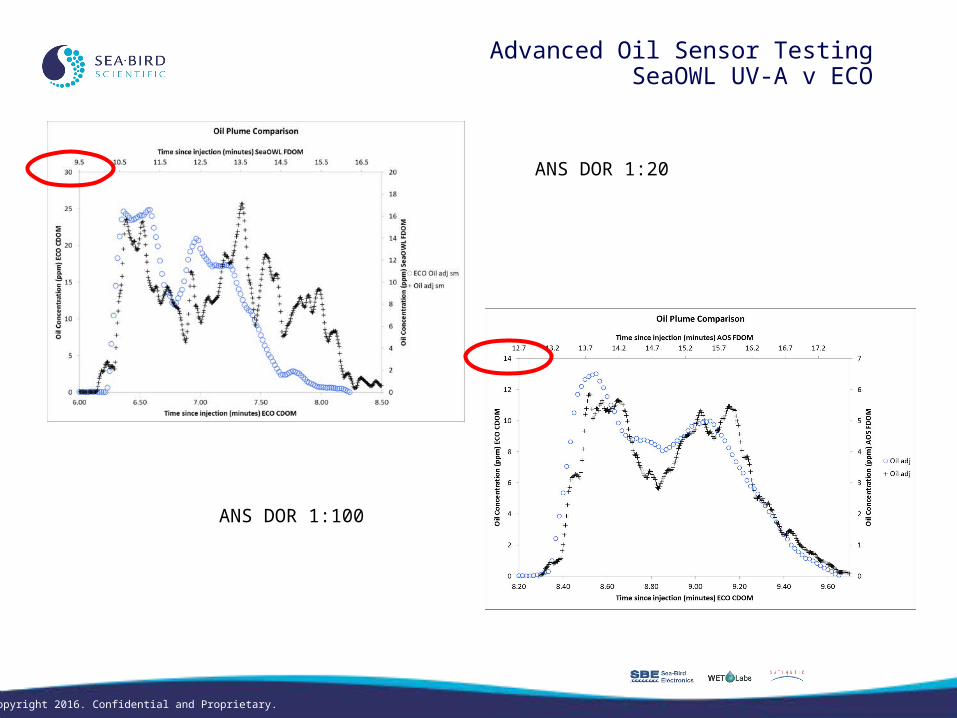
Advanced Oil Sensor TestingSeaOWL UV-A v ECO
ANS DOR 1:20
ANS DOR 1:100
© Copyright 2016. Confidential and Proprietary.
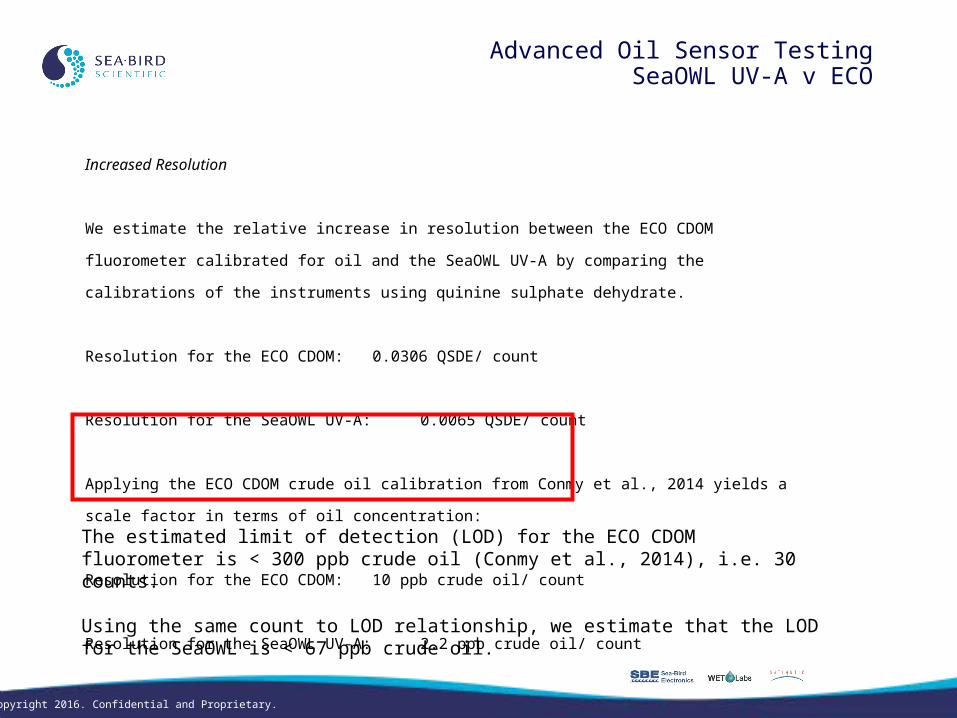
Advanced Oil Sensor TestingSeaOWL UV-A v ECO
Increased Resolution
We estimate the relative increase in resolution between the ECO CDOM fluorometer calibrated for oil and the
SeaOWL UV-A by comparing the calibrations of the instruments using quinine sulphate dehydrate.
Resolution for the ECO CDOM: 0.0306 QSDE/ count
Resolution for the SeaOWL UV-A: 0.0065 QSDE/ count
Applying the ECO CDOM crude oil calibration from Conmy et al., 2014 yields a scale factor in terms of oil
concentration:
Resolution for the ECO CDOM: 10 ppb crude oil/ count
Resolution for the SeaOWL UV-A: 2.2 ppb crude oil/ count
The estimated limit of detection (LOD) for the ECO CDOM fluorometer is < 300 ppb crude oil (Conmy et al., 2014), i.e. 30 counts.
Using the same count to LOD relationship, we estimate that the LOD for the SeaOWL is < 67 ppb crude oil.

© Copyright 2016. Confidential and Proprietary.
Advanced Oil Sensor TestingSeaOWL UV-A v backscattering
ANS DOR 1:200
ANS DOR 1:100

© Copyright 2016. Confidential and Proprietary.
Advanced Oil Sensor TestingSeaOWL UV-A v backscattering
ANS DOR 1:20
ANS DOR 1:100

© Copyright 2016. Confidential and Proprietary.
Advanced Oil Sensor TestingSeaOWL UV-A v backscattering
ANS DOR 1:20
ANS DOR 1:100
ANS DOR 1:200

© Copyright 2016. Confidential and Proprietary.
Response By DORIncreased dispersant:Increases fluorescence and backscattering signals with a critical point < 100 DOR
Increased dispersant:Decreases variability in particle size distribution and dissolved to droplet ratio with a critical point < 200 DOR

© Copyright 2016. Confidential and Proprietary.
Advanced Oil Sensor TestingLISST TPV v backscattering
ANS DOR 1:200
ANS DOR 1:100

© Copyright 2016. Confidential and Proprietary.
Advanced Oil Sensor TestingLISST TPV v backscattering
ANS DOR 1:20
ANS DOR 1:100

© Copyright 2016. Confidential and Proprietary.
Response By DOR
Increased dispersant:Increases apparent concentration with a critical point < 100 DOR
Increased dispersant:Increases apparent concentration Decreases volume median diameter with critical point < 100 DOR

© Copyright 2016. Confidential and Proprietary.
ConclusionsThe dispersant ratio modifies the particle size distribution, which impacts:
FluorescenceBackscatteringForward Scattering
Backscattering and forward scattering demonstrate coherent responses, but with different critical points
If mass concentration is constrained, fluorescence and backscattering signals can demonstrate dispersant effectiveness