oil and politics: the venezuelan experience- francisco monaldi
TRANSCRIPT

Francisco J. MonaldiBaker Institute Fellow and Adjunct Professor, Rice University
Belfer Center Associate, Kennedy School of Government, Harvard UniversityFounding Director, Center on Energy and the Environment, IESA, Venezuela
[email protected]@fmonaldi
Kuwait, November 2015
Venezuela: After the Party, the Collapse
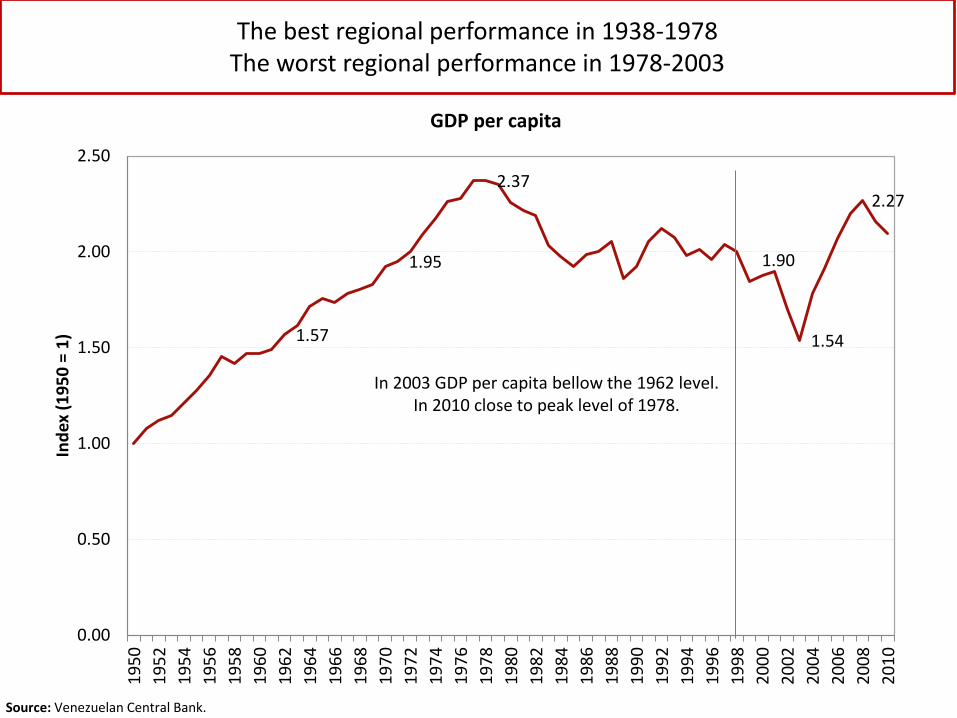
The best regional performance in 1938-1978The worst regional performance in 1978-2003
1.57
1.95
2.37
1.90
1.54
2.27
0.00
0.50
1.00
1.50
2.00
2.5019
5019
5219
5419
5619
5819
6019
6219
6419
6619
6819
7019
7219
7419
7619
7819
8019
8219
8419
8619
8819
9019
9219
9419
9619
9820
0020
0220
0420
0620
0820
10
Inde
x (1
950
= 1)
In 2003 GDP per capita bellow the 1962 level. In 2010 close to peak level of 1978.
GDP per capita
Source: Venezuelan Central Bank.

Source: Own calculations based on ONAPRE (several years).
-100%
-50%
0%
50%
100%
150%
200%
250%
Perc
enta
ge v
aria
tion
Oil fiscal income and spending growthPublic Spending Oil Fiscal Revenue
Venezuela has never implemented an effective stabilization policy

Poor overall economic performance even during peak oil prices…
…but a large consumption boom


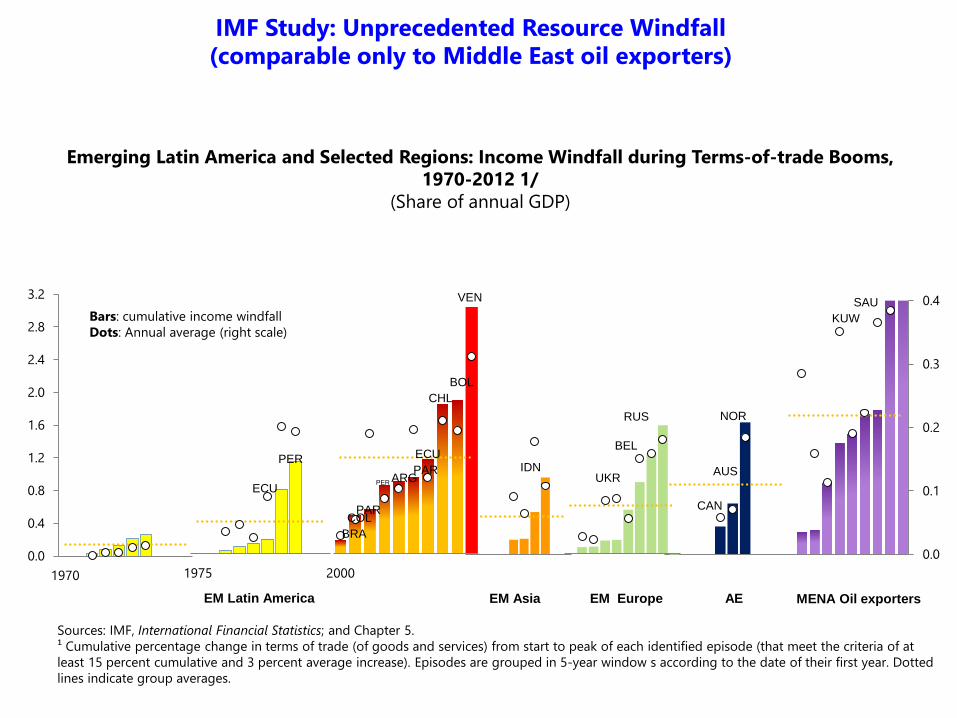
IMF Study: Unprecedented Resource Windfall(comparable only to Middle East oil exporters)
Emerging Latin America and Selected Regions: Income Windfall during Terms-of-trade Booms, 1970-2012 1/
(Share of annual GDP)
1975
PER
ECU
200 0
NOR
AUS
CAN
EM Latin America
200 0
RUS
UKR
BEL
200 0
IDN
0.0
0.1
0.2
0.3
0.4
200 0
SAUKUW
0.0
0.4
0.8
1.2
1.6
2.0
2.4
2.8
3.2
1970 2000
VEN
BOLCHL
ARGPER
PARCOL
ECU
BRA
PAR
Sources: IMF, International Financial Statistics; and Chapter 5.¹ Cumulative percentage change in terms of trade (of goods and services) from start to peak of each identified episode (that meet the criteria of at least 15 percent cumulative and 3 percent average increase). Episodes are grouped in 5-year window s according to the date of their first year. Dotted lines indicate group averages.
EM Europe AE MENA Oil exporters EM Asia
Bars: cumulative income windfallDots: Annual average (right scale)

Second worse growth performance, behind Libya, among major oil producers and second worse inflation rate behind Angola.

Collapsing exports, booming importsReal
Imports
RealExports
50
10
015
020
025
0
1985 1990 1995 2000 2005year
Venezuela
Chile

Higher oil dependence, with declining net oil exports
10

-
2,000,000
4,000,000
6,000,000
8,000,000
10,000,000
12,000,000
14,000,000
16,000,000
1997 1998 1999 2000 2001 2002 2003 2004 2005 2006 2007 2008 2009 2010 2011 2012
Poverty Evolution in Venezuela (1997-2012)
Poverty
ExtremePovertyN
umbe
r of p
eopl
ePoverty and the Boom: 2004-2008
Source: INE and Miguel A. Santos
>5 million out of poverty

0.35
0.4
0.45
0.5
0.550.60
0.80
1.00
1.20
1.40
1.60
1.80
1995 1996 1997 1998 1999 2000 2001 2002 2003 2004 2005 2006 2007 2008 2009 2010 2011 2012
GDP and Consumption per Capita (1998=100) andGini Coefficient (1980-2012)
GDP PC 1998=100 CON PC 1998=100 Gini
Growth and Inequality or Consumption and Inequality?
14.3%CAGR:0.8%
60.0%CAGR:3.2%
Source: INE and Miguel A. Santos
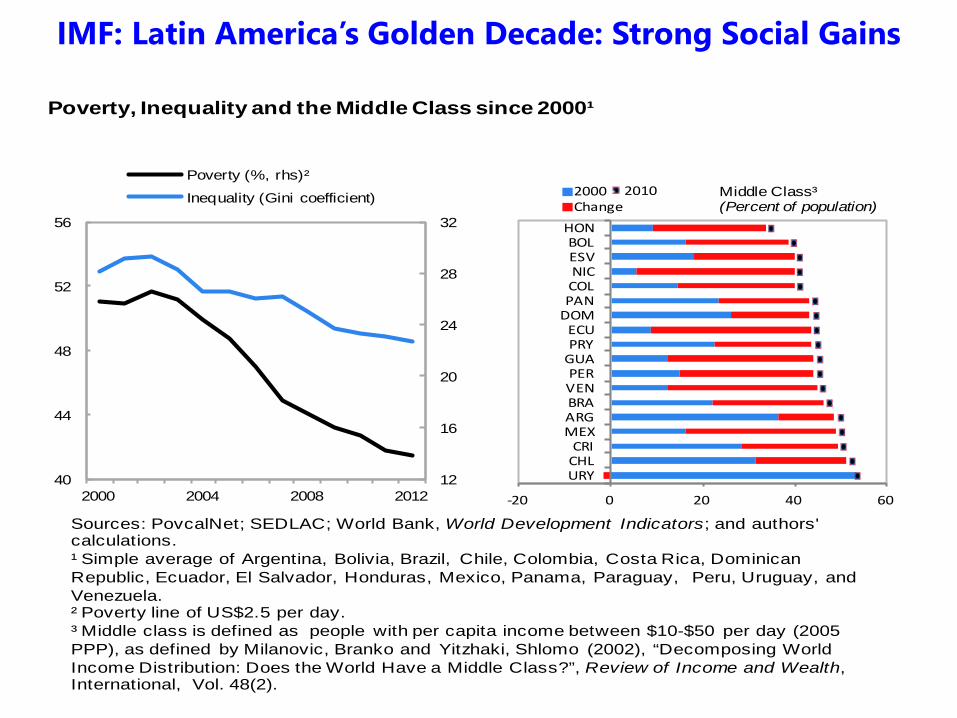
IMF: Latin America’s Golden Decade: Strong Social Gains
40
44
48
52
56
2000 2004 2008 201212
16
20
24
28
32
Poverty (%, rhs)²
Inequality (Gini coefficient)
Poverty, Inequality and the Middle Class since 2000¹
Sources: PovcalNet; SEDLAC; World Bank, World Development Indicators; and authors' calculations.¹ Simple average of Argentina, Bolivia, Brazil, Chile, Colombia, Costa Rica, Dominican Republic, Ecuador, El Salvador, Honduras, Mexico, Panama, Paraguay, Peru, Uruguay, and Venezuela.² Poverty line of US$2.5 per day.³ Middle class is defined as people with per capita income between $10-$50 per day (2005 PPP), as defined by Milanovic, Branko and Yitzhaki, Shlomo (2002), “Decomposing World Income Distribution: Does the World Have a Middle Class?”, Review of Income and Wealth,International, Vol. 48(2).
-20 0 20 40 60
URYCHLCRI
MEXARGBRAVENPER
GUAPRYECU
DOMPANCOLNICESVBOL
HON
2000Change
2010 Middle Class³(Percent of population)

Boom in public expenditure and imports exceeded the oil bonanza
28.7
05
28.4
55
29.0
67
26.1
04
25.9
42
27.7
02
28.8
53
28.1
38
30.5
34
26.5
98
38.6
81
50.9
09
67.4
49 85.3
04
98.0
11
105.7
79
106.0
48
0
20.000
40.000
60.000
80.000
100.000
120.000
1997 1998 1999 2000 2001 2002 2003 2004 2005 2006 2007 2008 2009 2010 2011 2012 2013-II
Deuda Pública Externa(USD Millones)
Fuente: BCV
Foreign Public Debt(US$ Million)

Venezuela: The highest level of public expenditures (% GDP) in the region
Gasto Público Consolidado (% del PIB)
18.2 19.122.1 23.3
28.732.5
34.638.8 40.0
41.9
47.250.6
26.2
0.0
10.0
20.0
30.0
40.0
50.0
60.0
Argenti
naBoli
viaBraz
ilChil
e
Colombia
Costa
Rica
Ecuad
or
Mexico
Paragu
ayPeru
Urugua
y
Venez
uela
2011
vene
zuela
2012
51.3
Fuente: Ministerio de Finanzas, CEPAL, Miguel A. Santos

Unsustainable path even before the oil price collapse
16

GDP Growth 2015: OPEC members
-10%
-6%
-1%
0.03%1%
1%
3% 3%3% 3%
4%5%
Venezuela Libia Ecuador Irak Iran Kuwait EmiratosÁrabesUnidos
Argelia ArabiaSaudita
Angola Nigeria Catar
GDP Growth Forecast 2015
Source: IMF

Inflation 2015: OPEC members
190%
14% 14% 12% 11%4% 3% 3% 3% 2% 2% 2%
Venezuela Iran Angola Libia Nigeria Ecuador EmiratosÁrabesUnidos
Kuwait Irak ArabiaSaudita
Argelia Catar
Forecasted Rate of Inflation 2015
Source: IMF

The Politics:electoral cycles on steroids

World Governance Indicators
0
10
20
30
40
50
60
1996
1998
2000
2002
2003
2004
2005
2006
2007
2008
2009
2010
Perc
entil
e R
ank
(0 -
100)
Venezuela 1996 - 2010
Voice and Accountability Political StabilityGovernment Effectiveness Regulatory QualityRule of Law Control of Corruption
26.1
11.3
18.6
3.8 2.8
8.1
51.4
35.9
44.447.6
33.8
43.5
0
10
20
30
40
50
60
Inde
x
2009
Venezuela Latin American Average
Institutional Collapse

An electoral budget cycle on steroids...
ElectionsElections

The public sector deficit in the year to the election at historical high of close to 19% of GDP, with total public expenditures also at a historical high of around 51% of GDP. This when the price of oil is also at a historical peak.
Source: BCV and Barclays
ElectionsElections


Ven
Ven
Ven
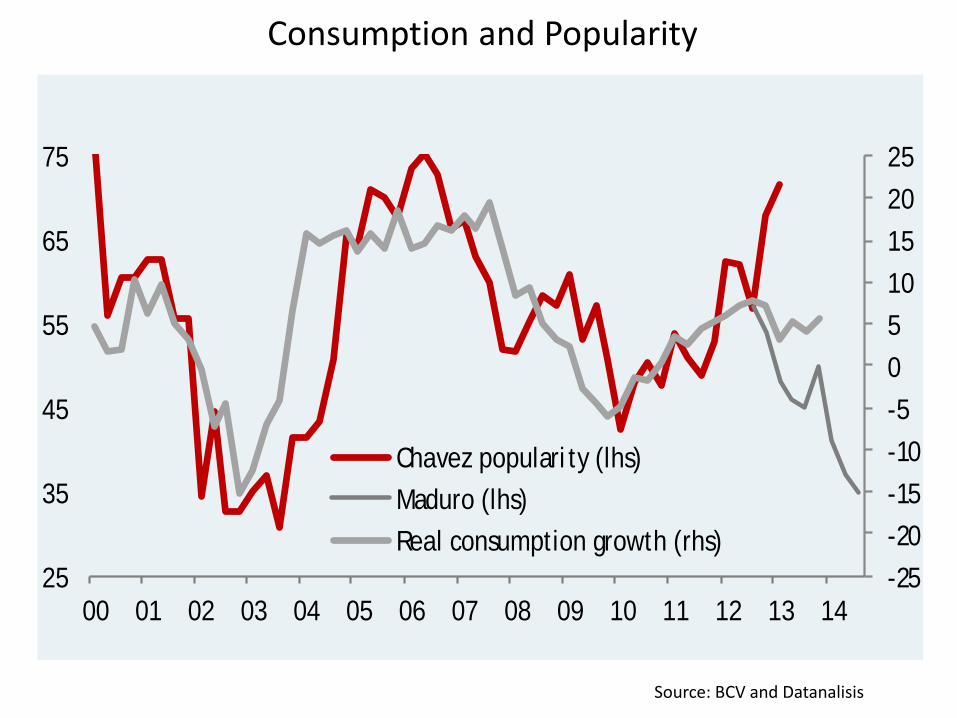
Consumption and Popularity
-25-20-15-10-50510152025
25
35
45
55
65
75
00 01 02 03 04 05 06 07 08 09 10 11 12 13 14
Chavez popularity (lhs)Maduro (lhs)Real consumption growth (rhs)
Source: BCV and Datanalisis


Source: Keller y Asociados

Source: Datanalisis, July 2015
Public Opinion: How is the country doing?
28

Source: Datanalisis, July 2015
Public Opinion: Maduro’s Approval
29

The Oil Industry: another wasted opportunity

31
Venezuela will continue to produce oil… until the world demands itVenezuela’s official proved oil reserves are 298 billion barrels (using a 20% recovery rate on the Orinoco Belt, for 257 billion barrels). The USGS estimates that510 billion barrels would be ultimately recoverable in the Orinoco Belt (using a 45% recovery rate). Even using a 10% recovery rate Venezuela would have thesecond largest reserves after Saudi Arabia, at around 190 billion barrels (close to Canada’s).
0 50 100 150 200 250 300
US
Venezuela
Russian Federation
Iran
Kuwait
Saudi Arabia
United Arab Emirates
Nigeria
OPEC
Non.OPEC
Years of production
Reserves/production (years)
Source: BP Statistical Review of World Energy (2013)
Canada including oil sands 110 years
Venezuela low estimate 190 years

The Rise and Fall…and Rise again and Fall again… of the Venezuelan Oil Industry
32

• Significant contributions to FONDEN & social programs, compared to investment.
• Financial Debt has increased to more than US$ 45 bn. Debt with suppliers and partners above $15 bn. Debt with Central Bank above Bs. 800 bn. Arbitrations $7-8 bn. (estimate)
Cash Flow availability – PDVSA

Venezuela Domestic Oil Consumption
Gasoline price: $0.07 per gallon or $0.002 at black market exchange rate. 1 cent per barrel versus $21 in Saudi ArabiaDomestic subsidies: $24 billion in 2013. $13 bn. in 2015 34

• Texas 5• Qatar 33• United Arab Emirates 39• Colombia 48• Alberta 51• Trinidad and Tobago 58• Brazil 66• Alaska 83• Angola 118• Nigeria 124 • Algeria 126• Russia 127• Libya 128• Iraq 129• Kazakhstan 131• Iran 132• Bolivia 133• Ecuador 134• Venezuela 135
Fraser Institute Global Petroleum Survey 2011: Jurisdictional rankings according to the extent of investment barriers
(based on All-Inclusive Composite Index values) 135 jurisdictions ranked
The Reputational Legacy
Ranking sobre barreras a la inversión Fraser Institute 2009 2010 2011 2012 2013 2014
Ranking Venezuela 141 132 135 146 157 156Jurisdicciones Consideradas 141 133 135 147 157 156
35
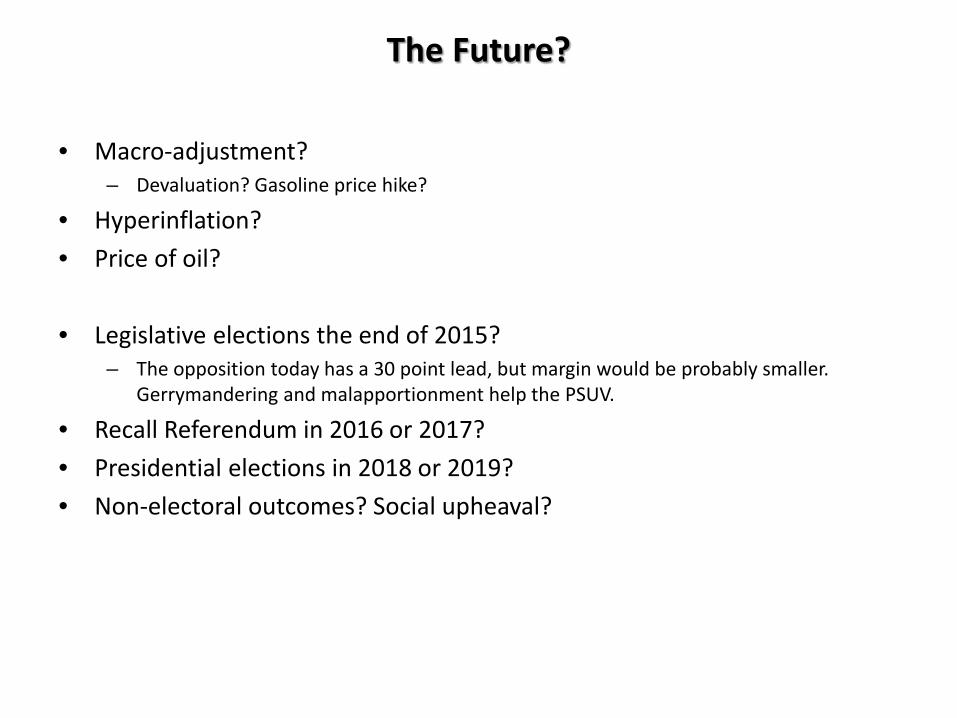
The Future?
• Macro-adjustment? – Devaluation? Gasoline price hike?
• Hyperinflation?• Price of oil?
• Legislative elections the end of 2015?– The opposition today has a 30 point lead, but margin would be probably smaller.
Gerrymandering and malapportionment help the PSUV.
• Recall Referendum in 2016 or 2017?• Presidential elections in 2018 or 2019?• Non-electoral outcomes? Social upheaval?