ohio imports 2017 - ohio development services … · ohio imports 2017 . state of destination...
TRANSCRIPT

Office of Research A State Affiliate of the U.S. Census Bureau
John R. Kasich, Governor of Ohio
David Goodman, Director
Ohio Imports 2017 March 2018

Ohio Imports 2017 State of Destination Series
March 2018 Ed Simmons, Analyst Office of Research, Ohio Development Services Agency P.O. Box 1001, Columbus, Ohio 43216-1001 Telephone (614) 466-2116

Ohio Imports 2017 Executive Summary Ohio merchandise imports were valued at nearly $68 billion in 2017, an increase of 5.2 percent from 2016. By comparison, the United States experienced a 7.1 percent decrease in imports since 2016. According to this report, in 2017:
• Ohio was the 11th largest importing state.
• 189 countries and territories were points of origination.
• 14 countries shipped over $1 billion in merchandise to Ohio.
• 47 of the 98 commodity groups recorded imports exceeding $100 million with 15 surpassing $1 billion.
Leading Origins:
• China was the leading country of origination with a total of $12.9 billion, 19 percent of the state figure. By comparison, U.S. imports from China were 22 percent of the national total. Asia, as a region, accounted for 32 percent of Ohio imports with Japan contributing $4.4 billion and India $1.4 billion.
• Canada was the second largest source of imports at $12.2 billion, 18 percent of the state figure. Shipments from Mexico, Ohio’s third largest origin, totaled $8.2 billion, an increase of 4 percent from 2016.
• European countries shipped 24 percent of Ohio’s imports. The three largest sources of imports were Germany ($4.7 billion), Ireland ($3.6 billion), and France ($1.7 billion). Total shipments from the region were up 9 percent compared to 2016.
• Imports from Southeast Asia accounted for 9 percent ($6.2 billion) of the state figure, an increase of 5 percent over the year. Shipments from South America and the Caribbean/Central America account for a 2.2 percent and a 1.2 percent share respectively.
Top Products:
• Machinery was Ohio’s leading import ($12.8 billion). Ohio accounted for 3.8 percent of industrial machinery imports for the U.S.
• The top six categories (industrial machinery, electrical machinery, pharmaceutical products, vehicles, iron/steel and optics/medical instruments) accounted for 52 percent ($34.9 billion) of the state total.
• Six of the top 10 imports saw an increase from 2016. Iron/steel increased 51 percent and organic chemicals increased 26 percent. Both apparel categories saw a decrease.

Ohio Imports
Ohio's Top 20 Imported Commodities: 2017Harmonized
Schedule Code2015 2016 2017 % Chng.
16 to 17Total All Commodities $68,910,877,351 $64,263,908,511 $67,618,425,070 5.2%
84 Industrial Machinery, Including Computers $13,341,130,806 $12,207,216,081 $12,848,447,482 5.3%85 Electric Machinery; Sound Equip.; TV Equip. $6,254,713,627 $5,955,172,279 $6,419,656,405 7.8%30 Pharmaceutical Products $4,686,544,186 $4,688,389,160 $4,668,113,505 -0.4%87 Vehicles and Parts $6,197,741,331 $5,169,677,674 $4,657,104,157 -9.9%72 Iron and Steel $2,523,011,248 $2,169,977,645 $3,267,781,115 50.6%90 Optic, Photo; Medical Instruments $2,691,620,372 $2,962,674,418 $3,082,301,579 4.0%39 Plastics and Articles Thereof $2,468,256,382 $2,490,307,651 $2,702,647,292 8.5%61 Apparel Articles, etc, Knit or Crochet $3,040,820,883 $3,022,345,990 $2,616,983,408 -13.4%62 Apparel Articles, etc, Not Knit or Crochet $2,879,021,619 $2,744,174,942 $2,597,092,081 -5.4%29 Organic Chemicals $1,521,587,813 $1,661,712,596 $2,100,245,775 26.4%94 Furniture and Bedding $1,583,128,901 $1,671,829,643 $1,739,200,677 4.0%40 Rubber and Articles Thereof $1,706,813,128 $1,480,651,720 $1,563,825,387 5.6%73 Iron and Steel Products $1,705,761,163 $1,418,294,110 $1,528,786,484 7.8%76 Aluminum and Articles Thereof $838,964,618 $791,369,461 $1,128,886,265 42.6%27 Mineral Fuel, Oil, etc $2,120,393,512 $684,785,624 $1,031,493,938 50.6%88 Aircraft; Spacecraft and Parts $1,614,978,718 $1,412,351,931 $863,379,242 -38.9%42 Leather Articles; Saddlery etc; Handbags etc $398,619,880 $440,549,963 $656,789,913 49.1%38 Miscellaneous Chemical Products $490,932,369 $499,410,262 $540,153,819 8.2%83 Miscellaneous Articles of Base Metal $530,520,645 $479,295,281 $531,040,937 10.8%82 Tools, Implements, Cutlry of Base Metals $720,162,579 $576,871,687 $527,061,914 -8.6%
Multi Remaining commodities $11,596,153,571 $11,736,850,393 $12,547,433,695 6.9%
$0
$10
$20
$30
$40
$50
$60
$70
$80
$90
2009 2010 2011 2012 2013 2014 2015 2016 2017
Bill
ions
Value of Ohio Imports
0.0%
0.5%
1.0%
1.5%
2.0%
2.5%
3.0%
3.5%
4.0%
2009 2010 2011 2012 2013 2014 2015 2016 2017
Share of Total US Imports
-30%-25%-20%-15%-10%-5%0%5%
10%15%20%25%30%
2009 2010 2011 2012 2013 2014 2015 2016 2017
Annual Change In Value
Industrial Machinery
$38.40
Electric Machinery
$18.63
Vehicles & parts
$16.02
Pharma. Products$14.04Optic, Med.
Instruments$8.74
Apparel Articles, Knit
$8.68
Apparel Articles, Not
Knit$8.22
Iron and Steel$7.96
Other$80.10
Top Imports 2015-17 (billions)

Ohio ImportsImported Products Over $2 Billion Value: 2017
Harmonized Schedule Code 2017 Value
% ofAll Imports
84 Industrial Machinery, Incl. Computers $12,848,447,482 19.0%85 Electric Machinery; Sound/TV Equip. $6,419,656,405 9.5%30 Pharmaceutical Products $4,668,113,505 6.9%87 Vehicles and Parts $4,657,104,157 6.9%72 Iron and Steel $3,267,781,115 4.8%90 Optic, Photo; Medical Instruments $3,082,301,579 4.6%39 Plastics and Articles Thereof $2,702,647,292 4.0%61 Apparel Articles, etc, Knit/Crochet $2,616,983,408 3.9%62 Apparel Articles, Not Knit/Crochet $2,597,092,081 3.8%29 Organic Chemicals $2,100,245,775 3.1%
Multi Remaining commodities $24,758,298,046 36.6%
Top 10 Trading Partners - 2017 Top 10 Trading Partners - 2015 to 2017
2017 Pct of 2015 to 2017 Pct ofValue Total Value 3-yr Total
Total $67,618,425,070 Total $200,793,210,932China $12,896,394,874 19.1% China $38,483,428,750 19.2%Canada $12,189,936,129 18.0% Canada $37,548,536,041 18.7%Mexico $8,249,081,615 12.2% Mexico $24,412,510,469 12.2%Germany $4,676,867,583 6.9% Germany $15,447,880,305 7.7%Japan $4,448,321,278 6.6% Japan $14,492,913,247 7.2%Ireland $3,565,377,702 5.3% Ireland $8,182,419,916 4.1%Vietnam $1,973,983,341 2.9% Vietnam $5,377,445,557 2.7%France $1,679,319,649 2.5% France $5,269,653,279 2.6%India $1,416,687,708 2.1% India $4,243,447,335 2.1%Italy $1,319,293,978 2.0% Italy $3,553,823,390 1.8%Others $15,203,161,213 22.5% Others $43,781,152,643 21.8%
$0
$10
$20
$30
$40
$50
$60
$70
$80
2009 2010 2011 2012 2013 2014 2015 2016 2017
Billio
ns

Machinery, Including Computers (HS 84)
Harmonized Tariff Schedule
2015 2016 2017 % Chng.16 to 17
TOTAL $13,341,130,806 $12,207,216,081 $12,848,447,482 5.3%
8411 Turbojets and Other Gas Turbines, Parts $1,960,610,171 $1,828,161,876 $1,928,611,722 5.5%8409 Parts for Engines of Heading 8407 or 8408 $951,701,796 $1,018,545,561 $1,048,620,463 3.0%8483 Transmission Products $604,022,206 $724,038,868 $748,177,083 3.3%8471 Automatic Data Process Machines $616,584,578 $480,517,141 $718,463,136 49.5%8414 Air Related Pumps/Compressors $591,811,014 $594,758,896 $679,630,531 14.3%8481 Taps, Cocks, Valves for Pipes, Tanks $726,954,165 $646,665,737 $668,025,113 3.3%8413 Liquid Pumps/Elevators $721,623,267 $612,035,188 $602,558,822 -1.5%8443 Printing Machinery Nesoi $734,637,518 $709,101,489 $500,966,519 -29.4%8421 Centrifuges/Filters for Liquid or Gases $323,440,146 $430,659,164 $474,447,108 10.2%8479 Machines Having Individual Functions Nesoi $343,677,872 $422,241,014 $441,680,035 4.6%8431 Parts for Machinery of Headings 8425 to 8430 $379,631,849 $365,007,581 $380,954,630 4.4%8482 Ball or Roller Bearings $329,018,989 $303,171,037 $321,304,632 6.0%8480 Molding Boxes For Metal Foundry; Mold Bases $262,284,610 $243,335,614 $292,370,910 20.2%8415 Air Conditioning Machines $240,608,055 $254,649,819 $283,013,993 11.1%8408 Compression-Ignition Intrnl. Comb. Piston Eng. $180,683,000 $172,733,143 $266,282,336 54.2%8407 Spark Ignition; Piston Engines $542,407,056 $328,479,530 $263,942,776 -19.6%8418 Refrigerators, Freezers Etc; Heat Pumps Nesoi $283,104,173 $234,630,919 $236,111,959 0.6%8419 Machinery to Treat Materials With Heat $243,079,545 $209,289,030 $213,719,279 2.1%8477 Machinery for Working Rubber & Plastic Nesoi $215,301,351 $208,584,598 $198,401,787 -4.9%Multi Remaining commodities $3,089,949,445 $2,420,609,876 $2,581,164,648 6.6%
Top 5 Trading Partners - 2017 Top 5 Trading Partners - 2015 to 2017
2017 Pct of 2015 to 2017 Pct ofValue Total Value 3-yr Total
Total $12,848,447,482 Total $38,396,794,369China $2,358,479,872 18.4% China $7,016,263,964 18.3%Mexico $2,299,941,713 17.9% Mexico $6,381,272,449 16.6%Canada $1,429,953,860 11.1% Japan $4,482,445,986 11.7%Japan $1,400,642,355 10.9% Canada $4,205,879,747 11.0%Germany $1,115,179,164 8.7% France $3,132,293,524 8.2%Others $4,244,250,518 33.0% Others $13,178,638,699 34.3%Nesoi - Not elsewhere specified or indicated
$0
$2
$4
$6
$8
$10
$12
$14
$16
2009 2010 2011 2012 2013 2014 2015 2016 2017
Bill
ions
Value of Machinery
HS 8411 HS 8409 HS 8483 HS 8471
HS 8414 HS 8481 Other
0%
5%
10%
15%
20%
25%
2009 2010 2011 2012 2013 2014 2015 2016 2017
Percent of All Ohio Imports

Electrical Machinery (HS 85)
Harmonized Tariff Schedule
2015 2016 2017 % Chng.16 to 17
TOTAL $6,254,713,627 $5,955,172,279 $6,419,656,405 7.8%
8544 Insulated Wire, Cable, Optical Fiber Cables $830,074,781 $753,634,729 $817,333,096 8.5%8537 Boards, Panels, Consoles, Electrical Switches $537,926,699 $486,292,839 $547,965,536 12.7%8501 Electric Motors And Generators $352,801,705 $332,769,966 $354,301,883 6.5%8536 Apparatus for Switching (fuses,relays,plugs) $327,149,861 $322,639,157 $333,696,169 3.4%8508 Vacuum Cleaners; Parts Thereof $238,206,079 $128,784,379 $319,151,499 147.8%8525 Transmission Apparatus for Radio/Television $179,518,033 $389,022,610 $309,619,640 -20.4%8511 Electric Ignition Equipment $355,275,586 $312,839,041 $279,836,324 -10.5%8504 Electrical Transformers, Converters, Inductors $352,277,957 $345,381,738 $278,157,077 -19.5%8529 Parts For Television, Radio And Radar Apparatus $110,773,713 $195,158,299 $226,636,420 16.1%8515 Electric, Laser or Other Light or Photon Beam $169,135,183 $210,504,799 $218,365,929 3.7%8517 Apparatus for Telephony (wired or wireless) $173,724,722 $152,107,050 $217,042,011 42.7%8512 Light Equip./Wipers/Defrosters for Vehicles $273,507,019 $181,738,704 $203,771,198 12.1%8526 Radar Appar./Radio Navig. Aid/Remote Control $138,882,946 $160,006,026 $193,759,153 21.1%8528 TV Receivers, Incl. Video Monitors/Projectors $284,541,519 $214,128,252 $172,219,927 -19.6%8516 Elec. Water/Space Heaters;Hair Dryers;Toasters $142,941,148 $139,425,088 $158,612,999 13.8%8527 Reception Apparatus For Radiotelephony Etc $147,573,523 $118,382,234 $156,462,203 32.2%8509 Electro-Mechanical Domestic Appliances $144,114,693 $123,347,574 $152,779,484 23.9%8543 Elec. machines with Individual Functions Nesoi $199,505,399 $170,871,664 $141,408,980 -17.2%8510 Elec. Shavers, Hair Clipper/Remover Appliances $136,483,284 $120,185,677 $129,912,018 8.1%Multi Remaining commodities $1,160,299,777 $1,097,952,453 $1,208,624,859 10.1%
Top 5 Trading Partners - 2017 Top 5 Trading Partners - 2015 to 2017
2017 Pct of 2015 to 2017 Pct ofValue Total Value 3-yr Total
Total $6,419,656,405 Total $18,629,542,311China $2,216,652,560 34.5% China $6,489,222,786 34.8%Mexico $1,228,421,091 19.1% Mexico $3,652,864,951 19.6%Japan $652,999,219 10.2% Japan $2,196,380,606 11.8%Thailand $414,360,983 6.5% Thailand $927,998,372 5.0%Vietnam $324,261,357 5.1% Vietnam $776,192,871 4.2%Others $1,582,961,195 24.7% Others $4,586,882,725 24.6%Nesoi - Not elsewhere specified or indicated
$0
$1
$2
$3
$4
$5
$6
$7
$8
2009 2010 2011 2012 2013 2014 2015 2016 2017
Bill
ions
Value of Electrical Machinery
HS 8544 HS 8537 HS 8501 HS 8536HS 8508 HS 8525 Other
0%
2%
4%
6%
8%
10%
12%
2009 2010 2011 2012 2013 2014 2015 2016 2017
Percent of All Ohio Imports

Pharmaceutical Products (HS 30)
Harmonized Tariff Schedule
2015 2016 2017 % Chng.16 to 17
TOTAL $4,686,544,186 $4,688,389,160 $4,668,113,505 -0.4%
3004 Medicaments Nesoi, In Measured Doses $4,541,861,152 $4,540,005,749 $4,416,377,405 -2.7%3002 Human Blood; Animal Blood; Vaccines Etc $40,437,672 $35,752,588 $140,192,601 292.1%3001 Glands/Organs & Extracts; For Organtherapy $35,744,439 $43,852,724 $68,666,510 56.6%3006 Other Pharmaceutical Goods $60,248,652 $59,212,928 $25,731,420 -56.5%3005 Wadding, Gauze, Bandages Etc $4,432,845 $5,583,017 $14,933,021 167.5%3003 Medicaments Nesoi, Not Measured Doses $3,819,426 $3,982,154 $2,212,548 -44.4%
Top 5 Trading Partners - 2017 Top 5 Trading Partners - 2015 to 2017
2017 Pct of 2015 to 2017 Pct ofValue Total Value 3-yr Total
Total $4,668,113,505 Total $14,043,046,851Ireland $2,479,904,999 53.1% Germany $6,643,015,426 47.3%Germany $1,638,949,499 35.1% Ireland $5,719,012,865 40.7%India $314,088,884 6.7% India $1,021,484,171 7.3%China $74,847,910 1.6% China $155,434,798 1.1%U.K. $26,507,071 0.6% Spain $109,007,020 0.8%Others $133,815,142 2.9% Others $395,092,571 2.8%Nesoi - Not elsewhere specified or indicated
$0.0
$0.5
$1.0
$1.5
$2.0
$2.5
$3.0
$3.5
$4.0
$4.5
$5.0
2009 2010 2011 2012 2013 2014 2015 2016 2017
Bill
ions
Value of Phamaceuticals
HS 3004 Other
0%
1%
2%
3%
4%
5%
6%
7%
8%
2009 2010 2011 2012 2013 2014 2015 2016 2017
Percent of All Ohio Imports

Vehicles and Parts (HS 87)
Harmonized Tariff Schedule
2015 2016 2017 % Chng.16 to 17
TOTAL $6,197,741,331 $5,169,677,674 $4,657,104,157 -9.9%
8708 Parts & Accessories for Headings 8701-8705 $5,166,371,837 $4,531,987,231 $4,031,458,496 -11.0%8701 Tractors $287,284,302 $138,764,579 $148,773,621 7.2%8704 Motor Vehicles For Transport Of Goods $140,048,689 $129,979,733 $132,188,813 1.7%8703 Passenger Cars & Vehicles $63,717,450 $56,666,447 $98,377,608 73.6%8714 Parts & Accessories for Motorcycles $92,047,625 $88,525,701 $89,273,838 0.8%8716 Trailers; Non-Mechanical $74,374,842 $62,909,026 $68,743,041 9.3%8713 Carriages For Disabled Persons $30,614,563 $22,408,298 $25,961,667 15.9%8707 Bodies for Specif Motor Vehicles $10,309,033 $15,827,706 $20,707,317 30.8%8710 Tank & Other Armored Fight Vehicles $16,620,276 $12,004,505 $13,658,585 13.8%8712 Bicycles & Other Cycles with No Motor $63,236,283 $16,533,815 $7,473,689 -54.8%8705 Special Purpose Motor Vehicles Nesoi $11,498,863 $13,915,609 $6,550,354 -52.9%8709 Various Work-Related Vehicles $8,409,213 $4,054,655 $5,162,778 27.3%8715 Baby Carriages/Strollers $1,290,532 $1,965,697 $3,833,491 95.0%8702 Transport Vehicles for > Ten Persons $6,085,811 $5,648,962 $2,592,903 -54.1%8711 Motorcycles $225,435,563 $68,220,679 $2,183,487 -96.8%8706 Chassis With Engine $396,449 $265,031 $164,469 -37.9%
Top 5 Trading Partners - 2017 Top 5 Trading Partners - 2015 to 2017
2017 Pct of 2015 to 2017 Pct ofValue Total Value 3-yr Total
Total $4,657,104,157 Total $16,024,523,162Mexico $1,804,021,829 38.7% Mexico $5,456,558,701 34.1%Canada $1,115,039,959 23.9% Canada $4,120,827,802 25.7%Japan $791,930,558 17.0% Japan $2,930,759,807 18.3%China $383,486,239 8.2% China $1,206,643,167 7.5%Germany $101,292,394 2.2% Germany $464,329,595 2.9%Others $461,333,178 9.9% Others $1,845,404,090 11.5%Nesoi - Not elsewhere specified or indicated
$0
$1
$2
$3
$4
$5
$6
$7
2009 2010 2011 2012 2013 2014 2015 2016 2017
Bill
ions
Value of Vehicles and Parts
HS 8708 HS 8701 HS 8704 HS 8703
HS 8714 HS 8716 Other
0%
2%
4%
6%
8%
10%
12%
2009 2010 2011 2012 2013 2014 2015 2016 2017
Percent of All Ohio Imports

Iron And Steel (HS 72)
Harmonized Tariff Schedule
2015 2016 2017 % Chng.16 to 17
TOTAL $2,523,011,248 $2,169,977,645 $3,267,781,115 50.6%
7201 Pig Iron & Spiegeleisen In Pigs, Blocks Etc. $490,259,232 $382,769,088 $813,164,701 112.4%7203 Spongy Ferrous Products & Iron 99.94% Pure $444,735,241 $313,924,259 $531,366,449 69.3%7204 Ferrous Waste & Scrap; Remelt Scrap Iron/Steel $245,547,825 $281,466,530 $444,032,565 57.8%7210 Flat-roll Iron/Nonalloy Steel, 600+mm wd, clad $176,061,997 $223,487,392 $243,593,906 9.0%7202 Ferroalloys $157,092,876 $183,097,053 $220,740,199 20.6%7225 Flat-rolled Alloy Steel Nesoi 600+mm wide $204,051,908 $131,756,371 $178,606,393 35.6%7208 Flat-roll Iron/NA Steel,600+mm Hot-roll, not clad $104,642,041 $105,902,524 $152,572,762 44.1%7209 Flat-roll Iron/NA Steel <600mm Cold-roll,not clad $81,102,407 $65,361,261 $88,790,448 35.8%7228 Alloy Steel Nesoi Bars, Angles, Hollow Bars etc $91,148,496 $76,354,628 $85,221,945 11.6%7227 Bars/Rods Alloy Steel Nesoi, Hot-roll irreg coils $87,541,595 $73,177,145 $79,436,368 8.6%7213 Bars/Rods, Iron/NA Steel, Hot-roll irregular coils $127,144,322 $71,064,414 $70,936,572 -0.2%7222 Bars/Rods, Stainless Steel Nesoi; Angles, Shapes $25,282,028 $20,837,233 $37,590,904 80.4%7219 Flat-roll Stainless Steel Products, 600+mm wide $34,933,414 $36,928,551 $37,313,729 1.0%7207 Semifinished Products of Iron or Nonalloy Steel $1,769,988 $1,115,003 $34,596,010 3002.8%7226 Flat-rolled Alloy Steel Nesoi <600mm wide $25,152,004 $34,711,722 $34,298,736 -1.2%7217 Wire of Iron & Nonalloy Steel $62,749,801 $30,253,190 $32,021,101 5.8%7215 Bars & Rods of Iron & Nonalloy Steel Nesoi $30,085,176 $25,956,793 $29,391,498 13.2%7211 Flat-roll Iron/Nonalloy Steel, <600mm wd, nt clad $19,285,767 $25,384,338 $26,471,935 4.3%7216 Angles/Shapes/Sections of Iron & Nonalloy Steel $10,777,603 $13,734,377 $25,530,748 85.9%Multi Remaining commodities $103,647,527 $72,695,773 $102,104,146 40.5%
Top 5 Trading Partners - 2017 Top 5 Trading Partners - 2015 to 2017
2017 Pct of 2015 to 2017 Pct ofValue Total Value 3-yr Total
Total $3,267,781,115 Total $7,960,770,008Canada $861,219,204 26.4% Canada $2,274,896,753 28.6%Russia $589,497,272 18.0% Russia $1,283,799,762 16.1%Trin./Tbago $500,785,951 15.3% Trinidad/Tobago $1,232,208,928 15.5%Ukraine $255,981,458 7.8% Ukraine $444,921,808 5.6%Netherlands $200,925,876 6.1% Netherlands $385,837,945 4.8%Others $859,371,354 26.3% Others $2,339,104,812 29.4%Nesoi - Not elsewhere specified or indicated
$0.0
$0.5
$1.0
$1.5
$2.0
$2.5
$3.0
$3.5
2009 2010 2011 2012 2013 2014 2015 2016 2017
Bill
ions
Value of Iron & Steel
HS 7201 HS 7203 HS 7204 HS 7210
HS 7202 HS 7225 Other
0.0%
0.5%
1.0%
1.5%
2.0%
2.5%
3.0%
3.5%
4.0%
4.5%
5.0%
2009 2010 2011 2012 2013 2014 2015 2016 2017
Percent of All Ohio Imports

Optic, Photo; Medical Instruments (HS 90)
Harmonized Tariff Schedule
2015 2016 2017 % Chng.16 to 17
TOTAL $2,691,620,372 $2,962,674,418 $3,082,301,579 4.0%
9018 Medical, Surgical, Dental or Vet Instruments $979,249,383 $1,060,404,023 $1,056,790,277 -0.3%9029 Revolution/Production Counters, Odometers etc $217,980,023 $304,840,778 $307,786,881 1.0%9004 Spectacles, Goggles etc, Corrective/Protective $129,291,610 $155,121,600 $213,299,854 37.5%9031 Automatic Regulating or Control Instruments $155,384,749 $158,525,840 $194,821,386 22.9%9026 Instruments for Measuring Liquids and Gases $102,285,000 $125,450,408 $159,833,356 27.4%9001 Optic Fibers; Polarizing Sheets; Optic Elements $125,633,703 $124,064,174 $147,630,131 19.0%9027 Instru./Apparatus for Physical/Chemical Analysis $122,092,830 $123,807,545 $142,642,677 15.2%9022 X-Ray Etc Apparatus; Tubes, Panels, Screen etc $178,270,119 $174,871,214 $133,461,488 -23.7%9032 Automatic Regulating Or Control Instruments $170,113,812 $114,101,358 $106,375,041 -6.8%9003 Frames & Mountings For Spectacles, Etc $51,909,737 $55,929,554 $90,251,234 61.4%9002 Optical Elements, Mounted; Parts & Accessories $62,227,968 $142,234,257 $88,903,324 -37.5%9015 Survey/Hydro./ Meteorological Instruments $77,527,984 $74,527,306 $88,486,589 18.7%9013 Liquid Crystal Devices Nesoi; Lasers $40,722,814 $50,031,781 $61,840,628 23.6%9030 Oscilloscopes, Spectrum Analyzers etc $58,783,399 $51,096,715 $50,629,119 -0.9%9021 Orthopedic Appliances; Artificial Body Parts; etc $45,737,040 $60,899,032 $49,268,671 -19.1%9016 Balances With Sensitivity >=5 Cg $41,134,627 $42,032,018 $45,333,442 7.9%9019 Mechanical, Respiration Therapy Appliances $33,643,303 $27,270,739 $34,491,457 26.5%9025 Hydrometers, Thermometers, Pyrometers etc $34,177,997 $30,545,006 $28,776,318 -5.8%9005 Optical Telescopes & Astronomical Instruments $10,478,043 $22,253,745 $18,471,837 -17.0%Multi Remaining commodities $54,976,231 $64,667,325 $63,207,869 -2.3%
Top 5 Trading Partners - 2017 Top 5 Trading Partners - 2015 to 2017
2017 Pct of 2015 to 2017 Pct ofValue Total Value 3-yr Total
Total $3,082,301,579 Total $8,736,596,369Mexico $1,096,271,953 35.6% Mexico $3,080,848,161 35.3%China $423,596,715 13.7% China $1,209,760,309 13.8%Japan $240,550,961 7.8% Germany $734,457,035 8.4%Germany $232,978,093 7.6% Japan $724,749,724 8.3%Italy $229,384,332 7.4% Italy $478,366,517 5.5%Others $859,519,525 27.9% Others $2,508,414,623 28.7%Nesoi - Not elsewhere specified or indicated
$0.0
$0.5
$1.0
$1.5
$2.0
$2.5
$3.0
$3.5
2009 2010 2011 2012 2013 2014 2015 2016 2017
Bill
ions
Value of Optic/Photo/Med. Instruments
HS 9018 HS 9029 HS 9004 HS 9031HS 9026 HS 9001 Other
0.0%
0.5%
1.0%
1.5%
2.0%
2.5%
3.0%
3.5%
4.0%
4.5%
5.0%
2009 2010 2011 2012 2013 2014 2015 2016 2017
Percent of All Ohio Imports

Plastics & Articles Thereof (HS 39)
Harmonized Tariff Schedule
2015 2016 2017 % Chng.16 to 17
TOTAL $2,468,256,382 $2,490,307,651 $2,702,647,292 8.5%
3901 Polymers Of Ethylene in primary form $415,922,274 $409,344,372 $444,381,369 8.6%3926 Articles Of Plastics (Inc Polymers & Resins) Nesoi $449,675,161 $426,601,970 $421,679,176 -1.2%3923 Containers (Boxes, Bags Etc), Closurers $221,175,640 $229,462,310 $245,108,280 6.8%3907 Polyethers/Expoxides/Polyesters in primary forms $170,408,049 $188,173,664 $223,701,555 18.9%3920 Plates, Sheets, Film Not Supported/Combined $164,575,304 $159,428,804 $187,872,580 17.8%3917 Tubes, Pipes & Hoses & Their Fittings $131,307,594 $136,755,221 $170,112,054 24.4%3924 Tableware & Other Household Articles Etc $159,405,228 $156,187,653 $163,735,097 4.8%3906 Acrylic Polymers in primary form $65,621,866 $79,407,986 $88,134,035 11.0%3925 Builders Ware (doors, shutters, blinds), Nesoi $93,804,608 $85,495,472 $85,180,710 -0.4%3910 Silicones, In Primary Forms $82,085,277 $74,343,049 $83,325,983 12.1%3911 Petro Resins, Polysulfides Nesoi in primary form $39,959,361 $63,930,334 $75,077,879 17.4%3921 Plates, Sheets, Film, Foil & Strip Nesoi $71,952,273 $76,144,040 $70,003,175 -8.1%3909 Amino-Resins/Phenolics/Polyurethanes, prim form $45,082,252 $57,277,979 $60,080,709 4.9%3919 Self-Adhesive Plates, Sheets, Film Etc $66,053,333 $64,376,901 $58,330,383 -9.4%3903 Polymers Of Styrene in primary form $65,190,819 $50,438,180 $54,408,001 7.9%3916 Monofilament, Cross-Section +1mm, Rods, Sticks $31,473,596 $36,852,327 $49,063,949 33.1%3908 Polyamides in Primary Forms $12,926,110 $18,204,383 $42,746,679 134.8%3918 Floor Coverings (Rolls/Tiles) & Wall/Ceiling Cover $37,170,010 $33,364,881 $42,405,075 27.1%3902 Polymers Of Propylene/Olefins in primary form $55,472,909 $49,413,368 $37,760,138 -23.6%Multi Remaining commodities $88,994,718 $95,104,757 $99,540,465 4.7%
Top 5 Trading Partners - 2017 Top 5 Trading Partners - 2015 to 2017
2017 Pct of 2015 to 2017 Pct ofValue Total Value 3-yr Total
Total $2,702,647,292 Total $7,661,211,325Canada $880,527,998 32.6% Canada $2,542,754,019 33.2%China $590,548,766 21.9% China $1,644,806,449 21.5%Japan $261,525,110 9.7% Japan $771,846,371 10.1%Mexico $183,270,187 6.8% Mexico $476,592,264 6.2%Germany $141,104,543 5.2% Germany $385,177,605 5.0%Others $645,670,688 23.9% Others $1,840,034,617 24.0%Nesoi - Not elsewhere specified or indicated
$0.0
$0.5
$1.0
$1.5
$2.0
$2.5
$3.0
2009 2010 2011 2012 2013 2014 2015 2016 2017
Bill
ions
Value of Plastics
HS 3901 HS 3926 HS 3923 HS 3907
HS 3920 HS 3917 Other
0.0%
0.5%
1.0%
1.5%
2.0%
2.5%
3.0%
3.5%
4.0%
4.5%
5.0%
2009 2010 2011 2012 2013 2014 2015 2016 2017
Percent of All Ohio Imports

Knit & Crocheted Apparel and Accessories (HS 61)
Harmonized Tariff Schedule
2015 2016 2017 % Chng.16 to 17
TOTAL $3,040,820,883 $3,022,345,990 $2,616,983,408 -13.4%
6110 Sweaters, Pullovers, Vests Etc $1,076,746,888 $988,511,586 $849,565,124 -14.1%6108 Womens or Girls Slips, Pajamas, Etc $627,228,193 $657,032,074 $591,134,053 -10.0%6104 Womens or Girls Suits, Ensembles Etc $531,020,097 $549,881,646 $455,174,166 -17.2%6109 T-Shirts, Singlets, Tank Tops Etc $158,402,133 $191,330,988 $189,588,076 -0.9%6102 Womens or Girls Overcoats Etc $73,829,701 $77,681,127 $77,470,388 -0.3%6105 Mens or Boys Shirts $77,743,087 $82,532,972 $71,288,412 -13.6%6116 Gloves, Mittens and Mitts $72,840,401 $62,747,465 $66,230,055 5.6%6114 Garments Nesoi $45,300,722 $67,125,739 $60,056,181 -10.5%6112 Track Suits, Ski-Suits & Swimwear $159,958,683 $134,218,535 $54,154,729 -59.7%6103 Mens or Boys Suits, Ensembles Etc $39,563,016 $43,109,205 $44,376,926 2.9%6106 Womens Or Girls Blouses & Shirts $40,521,363 $48,460,852 $39,990,439 -17.5%6115 Pantyhose, Socks & Other Hosiery $34,655,051 $29,734,573 $33,917,314 14.1%6101 Mens or Boys Overcoats Etc $44,735,679 $34,257,889 $33,490,598 -2.2%6107 Mens or Boys Underpants, Pajamas, Etc $17,148,775 $19,064,441 $19,222,472 0.8%6117 Made-Up Clothing Accessories Nesoi, Parts Etc $21,579,594 $21,358,835 $16,447,267 -23.0%6111 Babies Garments & Accessories $14,691,831 $11,019,850 $11,605,042 5.3%6113 Garments, Etc, Coated With Rubber, Plastic Etc $4,855,669 $4,278,213 $3,272,166 -23.5%
Top 5 Trading Partners - 2017 Top 5 Trading Partners - 2015 to 2017
2017 Pct of 2015 to 2017 Pct ofValue Total Value 3-yr Total
Total $2,616,983,408 Total $8,680,150,281China $739,033,090 28.2% China $2,634,731,065 30.4%Vietnam $675,430,839 25.8% Vietnam $2,089,870,498 24.1%Sri Lanka $459,259,993 17.5% Sri Lanka $1,462,833,301 16.9%Indonesia $186,103,479 7.1% Indonesia $741,457,147 8.5%India $113,903,435 4.4% India $331,970,380 3.8%Others $443,252,572 16.9% Others $1,419,287,890 16.4%Nesoi - Not elsewhere specified or indicated
$0.0
$0.5
$1.0
$1.5
$2.0
$2.5
$3.0
$3.5
2009 2010 2011 2012 2013 2014 2015 2016 2017
Bill
ions
Value of Knit Apparel
HS 6110 HS 6108 HS 6104 HS 6109
HS 6102 HS 6105 Other
0.0%
0.5%
1.0%
1.5%
2.0%
2.5%
3.0%
3.5%
4.0%
4.5%
5.0%
5.5%
6.0%
2009 2010 2011 2012 2013 2014 2015 2016 2017
Percent of All Ohio Imports

Apparel and Accessories, Not Knit or Crocheted (HS 62)
Harmonized Tariff Schedule
2015 2016 2017 % Chng.16 to 17
TOTAL $2,879,021,619 $2,744,174,942 $2,597,092,081 -5.4%
6212 Bras, Girdles, Garters Etc. $743,170,485 $789,514,505 $790,262,271 0.1%6204 Womens or Girls Suits, Ensembles Etc $757,993,209 $732,018,066 $640,774,799 -12.5%6203 Mens or Boys Suits, Ensembles Etc $361,168,091 $317,491,364 $292,533,921 -7.9%6205 Mens or Boys Shirts $223,149,603 $197,737,550 $189,949,430 -3.9%6206 Womens or Girls Blouses, Shirts Etc $233,343,666 $215,152,681 $185,827,492 -13.6%6202 Womens or Girls Overcoats Etc $155,913,136 $115,770,467 $127,815,611 10.4%6211 Track Suits, Ski-Suits & Swimwear $142,437,830 $146,193,857 $120,088,464 -17.9%6208 Womens or Girls Slips, Panties, Pajamas, Etc $83,357,666 $77,673,292 $78,838,136 1.5%6201 Mens or Boys Overcoats, Etc $84,545,140 $68,303,283 $76,545,990 12.1%6210 Garments, Etc, Coated With Rubber, Plastic Etc $51,838,259 $48,758,562 $58,188,753 19.3%6216 Gloves, Mittens And Mitts $11,029,369 $11,304,054 $12,339,817 9.2%6214 Shawls, Scarves, Mufflers, Mantillas, Veils Etc. $15,138,544 $10,732,840 $10,519,927 -2.0%6207 Mens or Boys Undershirts, Briefs, Pajamas, Etc $3,706,506 $4,265,469 $5,121,230 20.1%6209 Babies Garments & Accessories $7,820,066 $4,424,707 $4,426,778 0.0%6217 Made-Up Clothing Accessories Nesoi, Parts Etc $3,746,379 $4,044,996 $3,129,275 -22.6%6215 Ties, Bow Ties & Cravats $502,669 $563,065 $513,500 -8.8%6213 Handkerchiefs $161,001 $226,184 $216,687 -4.2%
Top 5 Trading Partners - 2017 Top 5 Trading Partners - 2015 to 2017
2017 Pct of 2015 to 2017 Pct ofValue Total Value 3-yr Total
Total $2,597,092,081 Total $8,220,288,642China $887,478,437 34.2% China $3,000,625,323 36.5%Vietnam $556,113,271 21.4% Vietnam $1,509,347,109 18.4%Sri Lanka $236,171,887 9.1% Indonesia $784,902,669 9.5%Indonesia $222,699,880 8.6% Sri Lanka $737,615,730 9.0%India $207,700,038 8.0% India $616,888,330 7.5%Others $486,928,568 18.7% Others $1,570,909,481 19.1%Nesoi - Not elsewhere specified or indicated
$0.0
$0.5
$1.0
$1.5
$2.0
$2.5
$3.0
$3.5
2009 2010 2011 2012 2013 2014 2015 2016 2017
Bill
ions
Apparel, Not Knit/Crocheted
HS 6212 HS 6204 HS 6203 HS 6205
HS 6206 HS 6202 Other
0.0%
0.5%
1.0%
1.5%
2.0%
2.5%
3.0%
3.5%
4.0%
4.5%
5.0%
2009 2010 2011 2012 2013 2014 2015 2016 2017
Percent of All Ohio Imports

Organic Chemicals (HS 29)
Harmonized Tariff Schedule
2015 2016 2017 % Chng.16 to 17
TOTAL $1,521,587,813 $1,661,712,596 $2,100,245,775 26.4%
2934 Nucleic Acids/Salts, Heterocyclic comp. Nesoi $536,555,241 $669,985,313 $1,046,243,610 56.2%2933 Heterocyclic comp. nitrogen hetero-atoms only $157,882,311 $234,474,563 $203,171,238 -13.4%2902 Cyclic Hydrocarbons $51,190,917 $47,415,266 $71,166,554 50.1%2905 Acyclic Alcohols and their derivatives $66,263,329 $57,137,200 $68,346,788 19.6%2939 Alkaloids, natural/synthetic; salts, ethers, etc. $76,674,790 $18,000,046 $63,188,736 251.0%2915 Saturated acyclic nonocarboxylic acid & deriv. $57,558,520 $69,143,995 $62,384,151 -9.8%2901 Acyclic Hydrocarbons $57,201,726 $48,347,263 $57,095,775 18.1%2921 Amine-Function Compounds $40,854,598 $39,011,931 $53,488,400 37.1%2917 Polycarboxylic Acids & their derivatives $39,902,710 $45,909,500 $41,997,296 -8.5%2922 Oxygen-Function Amino-Compounds $30,768,506 $30,363,113 $36,282,324 19.5%2918 Carboxylic acid, added oxygen, derivatives $38,768,767 $68,658,799 $35,552,661 -48.2%2909 Ethers, Ether-Alcohols, Alcohol Peroxides Etc. $28,733,226 $34,206,722 $32,604,752 -4.7%2931 Organo-Inorganic Compounds Nesoi $50,037,563 $41,405,018 $32,289,907 -22.0%2936 Provitamins and Vitamins; derivatives/intermix. $16,452,608 $29,233,422 $30,327,565 3.7%2930 Organo-Sulfur Compounds $27,567,414 $22,648,454 $29,534,458 30.4%2916 Unsaturated acyclic/cyclic monocarboxylic acid $24,925,304 $22,845,535 $25,753,878 12.7%2941 Antibiotics $3,004,313 $1,485,662 $25,491,064 1615.8%2929 Nitrogen Function Compounds Nesoi $19,687,430 $17,023,231 $19,543,675 14.8%2924 Carboxyamide-func. comp.; amide-func. comp. $16,251,256 $11,942,811 $18,090,427 51.5%Multi Remaining commodities $181,307,284 $152,474,752 $147,692,516 -3.1%
Top 5 Trading Partners - 2017 Top 5 Trading Partners - 2015 to 2017
2017 Pct of 2015 to 2017 Pct ofValue Total Value 3-yr Total
Total $2,100,245,775 Total $5,283,546,184Ireland $997,258,286 47.5% Ireland $2,162,077,848 40.9%China $242,580,305 11.6% China $680,269,489 12.9%Germany $189,190,198 9.0% Germany $513,909,396 9.7%Canada $126,598,872 6.0% Canada $350,546,865 6.6%France $70,033,877 3.3% Japan $203,703,837 3.9%Others $474,584,237 22.6% Others $1,373,038,749 26.0%Nesoi - Not elsewhere specified or indicated
$0.0
$0.5
$1.0
$1.5
$2.0
$2.5
2009 2010 2011 2012 2013 2014 2015 2016 2017
Bill
ions
Value of Organic Chemicals
HS 2934 HS 2933 HS 2902 HS 2905HS 2939 HS 2915 Other
0.0%
0.5%
1.0%
1.5%
2.0%
2.5%
3.0%
3.5%
4.0%
2009 2010 2011 2012 2013 2014 2015 2016 2017
Percent of All Ohio Imports

Ohio ImportsRegional Originations: 2017
2015 2016 2017% of 2017Imports
% Chng.16 to 17
Asia $22,633,801,385 $20,667,620,355 $21,371,408,608 31.6% 3.4%North America $22,038,582,466 $19,483,603,747 $20,439,085,362 30.2% 4.9%Europe $15,920,285,316 $15,147,642,601 $16,438,255,392 24.3% 8.5%Southeast Asia $5,566,513,206 $5,916,569,966 $6,215,873,483 9.2% 5.1%South America $1,108,929,687 $1,565,824,224 $1,494,603,614 2.2% -4.5%Caribbean/Central America $738,711,917 $644,253,220 $806,462,437 1.2% 25.2%Middle East $493,930,801 $516,489,977 $578,921,596 0.9% 12.1%Africa $246,607,834 $162,465,563 $158,913,104 0.2% -2.2%Oceania $159,772,112 $154,877,196 $109,787,333 0.2% -29.1%Unidentified/Other $3,742,627 $4,561,662 $5,114,141 0.0% 12.1%
$0
$10
$20
$30
$40
$50
$60
$70
$80
2009 2010 2011 2012 2013 2014 2015 2016 2017
Billio
ns
Value of Imports by Region

Ohio Import OriginationsTop 8 Countries: 2017
Origination 2017 Value% of
All Imports% Change16 to 17
China $12,896,394,874 19.1% 5.6%Canada $12,189,936,129 18.0% 5.7%Mexico $8,249,081,615 12.2% 3.8%
Germany $4,676,867,583 6.9% -4.9%Japan $4,448,321,278 6.6% -7.8%Ireland $3,565,377,702 5.3% 32.4%
Vietnam $1,973,983,341 2.9% 10.5%France $1,679,319,649 2.5% 2.9%
Remainder $17,939,142,899 26.5% 7.4%
$0
$10
$20
$30
$40
$50
$60
$70
$80
2009 2010 2011 2012 2013 2014 2015 2016 2017
Billio
ns
Value of Imports
0%
10%
20%
30%
40%
50%
60%
70%
80%
90%
100%
2009 2010 2011 2012 2013 2014 2015 2016 2017
Distribution of Imports

China
Harmonized Tariff Schedule
2015 2016 2017 % Chng.16 to 17
TOTAL $13,370,498,919 $12,216,534,957 $12,896,394,874 5.6%
84 Industrial Machinery, Including Computers $2,550,363,167 $2,107,420,925 $2,358,479,872 11.9%85 Electric Machinery; Sound Equip.; TV Equip. $2,241,835,579 $2,030,734,647 $2,216,652,560 9.2%62 Apparel Articles, etc, Not Knit or Crochet $1,094,009,861 $1,019,137,025 $887,478,437 -12.9%94 Furniture and Bedding $737,149,473 $796,346,840 $829,367,218 4.1%61 Apparel Articles, etc, Knit or Crochet $993,798,594 $901,899,381 $739,033,090 -18.1%39 Plastics and Articles Thereof $523,005,483 $531,252,200 $590,548,766 11.2%42 Leather Articles; Saddlery etc; Handbags etc $344,491,176 $359,078,150 $502,698,938 40.0%73 Iron and Steel Products $599,466,692 $461,400,073 $466,757,071 1.2%90 Optic, Photo; Medical Instruments $367,523,497 $418,640,097 $423,596,715 1.2%95 Toys, Games & Sport Equipment; Parts $367,962,961 $373,619,387 $390,457,753 4.5%87 Vehicles and Parts $442,945,486 $380,211,442 $383,486,239 0.9%64 Footwear, Gaiters etc. and Parts Thereof $342,451,834 $271,637,209 $323,737,169 19.2%29 Organic Chemicals $213,673,023 $224,016,161 $242,580,305 8.3%83 Miscellaneous Articles of Base Metal $233,883,783 $223,592,242 $237,929,927 6.4%40 Rubber and Articles Thereof $367,104,781 $275,142,467 $228,840,533 -16.8%
Multi Remaining commodities $1,950,833,529 $1,842,406,711 $2,074,750,281 12.6%
$0
$1
$2
$3
$4
$5
$6
2009 2010 2011 2012 2013 2014 2015 2016 2017
Bill
ions
Value of Top Imports
HS 84 HS 85 HS 62 HS 94
HS 61 HS 39 Other
0%
3%
6%
9%
12%
15%
18%
21%
24%
2009 2010 2011 2012 2013 2014 2015 2016 2017
Percent of All Ohio Imports
0%
10%
20%
30%
40%
50%
60%
70%
80%
90%
100%
2009 2010 2011 2012 2013 2014 2015 2016 2017
Distribution of Top Imports
HS 84 HS 85 HS 62 HS 94
HS 61 HS 39 Other
$0
$2
$4
$6
$8
$10
$12
$14
$16
2009 2010 2011 2012 2013 2014 2015 2016 2017
Bill
ions
Total Imports from China

Canada
Harmonized Tariff Schedule
2015 2016 2017 % Chng.16 to 17
TOTAL $13,825,788,618 $11,532,811,294 $12,189,936,129 5.7%
84 Industrial Machinery, Including Computers $1,421,697,033 $1,354,228,854 $1,429,953,860 5.6%87 Vehicles and Parts $1,685,344,297 $1,320,443,546 $1,115,039,959 -15.6%27 Mineral Fuel, Oil, etc $2,097,006,831 $656,689,833 $1,006,552,785 53.3%39 Plastics and Articles Thereof $842,247,547 $819,978,474 $880,527,998 7.4%72 Iron and Steel $768,386,268 $645,291,281 $861,219,204 33.5%76 Aluminum and Articles Thereof $577,256,468 $541,129,427 $803,543,690 48.5%88 Aircraft; Spacecraft and Parts $1,308,440,601 $1,184,851,543 $647,806,431 -45.3%44 Wood and Articles of Wood; Wood Charcoal $296,474,630 $331,441,040 $345,266,650 4.2%96 Miscellaneous Manufactured Articles $4,729,855 $290,569,202 $344,322,067 18.5%74 Copper and Articles Thereof $239,391,525 $204,074,308 $275,417,252 35.0%73 Iron and Steel Products $214,385,011 $194,206,095 $265,924,486 36.9%85 Electric Machinery; Sound Equip.; TV Equip. $274,373,508 $240,079,246 $253,314,372 5.5%48 Paper, Paperboard, Articles of Paper Pulp $242,287,129 $215,380,362 $213,884,206 -0.7%94 Furniture and Bedding $176,150,607 $199,684,678 $192,370,516 -3.7%79 Zinc and Articles Thereof $153,550,028 $171,205,293 $175,840,473 2.7%
Multi Remaining commodities $3,524,067,280 $3,163,558,112 $3,378,952,180 6.8%
$0
$1
$2
$3
$4
$5
$6
$7
2009 2010 2011 2012 2013 2014 2015 2016 2017
Bill
ions
Value of Top Imports
HS 84 HS 87 HS 27 HS 39
HS 72 HS 76 Other
0%
5%
10%
15%
20%
25%
30%
35%
2009 2010 2011 2012 2013 2014 2015 2016 2017
Percent of All Ohio Imports
0%
10%
20%
30%
40%
50%
60%
70%
80%
90%
100%
2009 2010 2011 2012 2013 2014 2015 2016 2017
Distribution of Top Imports
HS 84 HS 87 HS 27 HS 39
HS 72 HS 76 Other
$0
$2
$4
$6
$8
$10
$12
$14
$16
$18
$20
2009 2010 2011 2012 2013 2014 2015 2016 2017
Bill
ions
Total Imports from Canada

Mexico
Harmonized Tariff Schedule
2015 2016 2017 % Chng.16 to 17
TOTAL $8,212,678,092 $7,950,750,762 $8,249,081,615 3.8%
84 Industrial Machinery, Including Computers $2,003,705,379 $2,077,625,357 $2,299,941,713 10.7%87 Vehicles and Parts $1,855,800,788 $1,796,736,084 $1,804,021,829 0.4%85 Electric Machinery; Sound Equip.; TV Equip. $1,299,026,103 $1,125,417,757 $1,228,421,091 9.2%90 Optic, Photo; Medical Instruments $893,888,643 $1,090,687,565 $1,096,271,953 0.5%94 Furniture and Bedding $374,075,560 $367,330,241 $387,651,927 5.5%39 Plastics and Articles Thereof $153,137,530 $140,184,547 $183,270,187 30.7%73 Iron and Steel Products $112,805,930 $131,839,448 $142,639,852 8.2%24 Tobacco/Manufactured Tobacco Substitutes $117,233,796 $114,502,843 $105,291,608 -8.0%62 Apparel Articles, etc, Not Knit or Crochet $131,011,257 $100,138,381 $94,014,696 -6.1%61 Apparel Articles, etc, Knit or Crochet $89,766,813 $87,693,473 $92,572,722 5.6%69 Ceramic Products $152,962,769 $82,674,733 $76,508,699 -7.5%40 Rubber and Articles Thereof $113,159,672 $93,004,924 $67,813,797 -27.1%70 Glass and Glassware $65,027,809 $57,304,297 $53,936,047 -5.9%83 Miscellaneous Articles of Base Metal $27,621,245 $29,047,397 $43,042,584 48.2%76 Aluminum and Articles Thereof $22,782,998 $23,996,267 $42,286,836 76.2%
Multi Remaining commodities $800,671,800 $632,567,448 $531,396,074 -16.0%
$0.0
$0.5
$1.0
$1.5
$2.0
$2.5
2009 2010 2011 2012 2013 2014 2015 2016 2017
Bill
ions
Value of Top Imports
HS 84 HS 87 HS 85 HS 90
HS 94 HS 39 Other
0%
2%
4%
6%
8%
10%
12%
14%
2009 2010 2011 2012 2013 2014 2015 2016 2017
Percent of All Ohio Imports
0%
10%
20%
30%
40%
50%
60%
70%
80%
90%
100%
2009 2010 2011 2012 2013 2014 2015 2016 2017
Distribution of Top Imports
HS 84 HS 87 HS 85 HS 90
HS 94 HS 39 Other
$0
$1
$2
$3
$4
$5
$6
$7
$8
$9
$10
2009 2010 2011 2012 2013 2014 2015 2016 2017
Bill
ions
Total Imports from Mexico

Germany
Harmonized Tariff Schedule
2015 2016 2017 % Chng.16 to 17
TOTAL $5,852,114,393 $4,918,898,329 $4,676,867,583 -4.9%
30 Pharmaceutical Products $2,844,994,221 $2,159,071,706 $1,638,949,499 -24.1%84 Industrial Machinery, Including Computers $1,000,329,535 $987,742,603 $1,115,179,164 12.9%85 Electric Machinery; Sound Equip.; TV Equip. $211,447,317 $197,903,158 $289,313,039 46.2%90 Optic, Photo; Medical Instruments $283,872,582 $217,606,360 $232,978,093 7.1%29 Organic Chemicals $189,310,794 $135,408,404 $189,190,198 39.7%39 Plastics and Articles Thereof $110,034,536 $134,038,526 $141,104,543 5.3%72 Iron and Steel $113,351,643 $103,721,210 $104,586,094 0.8%87 Vehicles and Parts $190,129,177 $172,908,024 $101,292,394 -41.4%82 Tools, Implements, Cutlry of Base Metals $163,781,096 $121,078,499 $97,300,098 -19.6%32 Tanning, Dye, Paint, Putty $59,631,883 $69,702,491 $86,938,332 24.7%73 Iron and Steel Products $70,316,283 $64,718,250 $76,682,245 18.5%38 Miscellaneous Chemical Products $49,346,469 $51,122,235 $54,755,886 7.1%28 Inorganic Chemicals; Rare-Earths $65,721,908 $40,476,800 $46,494,448 14.9%40 Rubber and Articles Thereof $79,783,160 $53,573,400 $45,551,304 -15.0%76 Aluminum and Articles Thereof $22,585,648 $24,050,999 $38,882,555 61.7%
Multi Remaining commodities $397,478,141 $385,775,664 $417,669,691 8.3%
$0.0
$0.5
$1.0
$1.5
$2.0
$2.5
$3.0
2009 2010 2011 2012 2013 2014 2015 2016 2017
Bill
ions
Value of Top Imports
HS 30 HS 84 HS 85 HS 90
HS 29 HS 39 Other
0%
1%
2%
3%
4%
5%
6%
7%
8%
9%
10%
2009 2010 2011 2012 2013 2014 2015 2016 2017
Percent of All Ohio Imports
0%
10%
20%
30%
40%
50%
60%
70%
80%
90%
100%
2009 2010 2011 2012 2013 2014 2015 2016 2017
Distribution of Top Imports
HS 30 HS 84 HS 85 HS 90
HS 29 HS 39 Other
$0
$1
$2
$3
$4
$5
$6
$7
2009 2010 2011 2012 2013 2014 2015 2016 2017
Bill
ions
Total Imports from Germany

Japan
Harmonized Tariff Schedule
2015 2016 2017 % Chng.16 to 17
TOTAL $5,221,420,016 $4,823,171,953 $4,448,321,278 -7.8%
84 Industrial Machinery, Including Computers $1,587,194,177 $1,494,609,454 $1,400,642,355 -6.3%87 Vehicles and Parts $1,198,607,002 $940,222,247 $791,930,558 -15.8%85 Electric Machinery; Sound Equip.; TV Equip. $785,363,188 $758,018,199 $652,999,219 -13.9%39 Plastics and Articles Thereof $254,052,421 $256,268,840 $261,525,110 2.1%90 Optic, Photo; Medical Instruments $239,096,542 $245,102,221 $240,550,961 -1.9%40 Rubber and Articles Thereof $197,313,749 $162,817,878 $183,780,213 12.9%73 Iron and Steel Products $187,354,877 $168,825,311 $165,126,645 -2.2%82 Tools, Implements, Cutlry of Base Metals $77,749,262 $123,893,905 $102,139,574 -17.6%72 Iron and Steel $107,047,701 $83,756,425 $76,133,566 -9.1%81 Base Metals Nesoi; Cermets; Articles Thereof $65,853,619 $60,857,072 $63,995,809 5.2%83 Miscellaneous Articles of Base Metal $47,655,226 $50,453,155 $61,566,191 22.0%29 Organic Chemicals $74,434,107 $68,708,602 $60,561,128 -11.9%33 Perfumery, Cosmetic, etc $25,859,890 $36,021,860 $48,578,927 34.9%38 Miscellaneous Chemical Products $60,647,748 $61,403,303 $48,506,946 -21.0%94 Furniture and Bedding $27,666,969 $33,418,493 $36,841,162 10.2%
Multi Remaining commodities $285,523,538 $278,794,988 $253,442,914 -9.1%
$0.0
$0.5
$1.0
$1.5
$2.0
$2.5
2009 2010 2011 2012 2013 2014 2015 2016 2017
Bill
ions
Value of Top Imports
HS 84 HS 87 HS 85 HS 39
HS 90 HS 40 Other
0%
1%
2%
3%
4%
5%
6%
7%
8%
9%
10%
11%
2009 2010 2011 2012 2013 2014 2015 2016 2017
Percent of All Ohio Imports
0%
10%
20%
30%
40%
50%
60%
70%
80%
90%
100%
2009 2010 2011 2012 2013 2014 2015 2016 2017
Distribution of Top Imports
HS 84 HS 87 HS 85 HS 39HS 90 HS 40 Other
$0
$1
$2
$3
$4
$5
$6
$7
2009 2010 2011 2012 2013 2014 2015 2016 2017
Bill
ions
Total Imports from Japan

Ireland
Harmonized Tariff Schedule
2015 2016 2017 % Chng.16 to 17
TOTAL $1,923,200,907 $2,693,841,307 $3,565,377,702 32.4%
30 Pharmaceutical Products $1,297,616,081 $1,941,491,785 $2,479,904,999 27.7%29 Organic Chemicals $500,914,429 $663,905,133 $997,258,286 50.2%35 Albuminoidal Substances; Mod. Starch; Glue $25,699,930 $18,722,370 $14,354,845 -23.3%90 Optic, Photo; Medical Instruments $11,426,097 $11,927,210 $13,226,443 10.9%84 Industrial Machinery, Including Computers $51,114,385 $21,404,097 $12,383,606 -42.1%22 Beverages, Spirits and Vinegar $8,643,541 $9,052,749 $11,535,846 27.4%23 Food Industry Residues; Prep. Animal Feed $6,565,343 $6,979,849 $8,582,422 23.0%19 Prep. of Cereal, Flour, Starch; Bakers Wares $0 $1,302,764 $5,745,685 341.0%33 Perfumery, Cosmetic, etc $4,234,858 $30,992 $3,214,304 10271.4%71 Precious Stones/Metals;Jewelry $2,472,238 $1,068,889 $2,044,045 91.2%32 Tanning, Dye, Paint, Putty $346,462 $1,989,017 $1,516,337 -23.8%81 Base Metals Nesoi; Cermets; Articles Thereof $0 $75,748 $1,236,607 1532.5%85 Electric Machinery; Sound Equip.; TV Equip. $4,736,868 $4,913,826 $1,108,372 -77.4%39 Plastics and Articles Thereof $401,187 $203,439 $889,722 337.3%73 Iron and Steel Products $286,512 $398,259 $635,647 59.6%
Multi Remaining commodities $8,742,976 $10,375,180 $11,740,536 13.2%
$0.00
$0.50
$1.00
$1.50
$2.00
$2.50
$3.00
2009 2010 2011 2012 2013 2014 2015 2016 2017
Bill
ions
Value of Top Imports
HS 30 HS 29 HS 35 HS 90
HS 84 HS 22 Other
0%
1%
2%
3%
4%
5%
6%
2009 2010 2011 2012 2013 2014 2015 2016 2017
Percent of All Ohio Imports
0%
10%
20%
30%
40%
50%
60%
70%
80%
90%
100%
2009 2010 2011 2012 2013 2014 2015 2016 2017
Distribution of Top Imports
HS 30 HS 29 HS 35 HS 90HS 84 HS 22 Other
$0.0
$0.5
$1.0
$1.5
$2.0
$2.5
$3.0
$3.5
$4.0
2009 2010 2011 2012 2013 2014 2015 2016 2017
Bill
ions
Total Imports from Ireland

Vietnam
Harmonized Tariff Schedule
2015 2016 2017 % Chng.16 to 17
TOTAL $1,617,294,142 $1,786,168,074 $1,973,983,341 10.5%
61 Apparel Articles, etc, Knit or Crochet $700,116,384 $714,323,275 $675,430,839 -5.4%62 Apparel Articles, etc, Not Knit or Crochet $446,212,411 $507,021,427 $556,113,271 9.7%85 Electric Machinery; Sound Equip.; TV Equip. $198,638,337 $253,293,177 $324,261,357 28.0%42 Leather Articles; Saddlery etc; Handbags etc $15,470,790 $30,608,212 $78,998,610 158.1%84 Industrial Machinery, Including Computers $49,327,200 $38,056,282 $72,992,379 91.8%64 Footwear, Gaiters etc. and Parts Thereof $63,573,930 $74,157,294 $65,663,248 -11.5%94 Furniture and Bedding $54,165,331 $62,483,285 $64,682,614 3.5%87 Vehicles and Parts $21,050,365 $17,657,924 $21,304,871 20.7%40 Rubber and Articles Thereof $5,389,094 $13,763,855 $17,268,954 25.5%70 Glass and Glassware $3,575,673 $4,446,746 $15,639,147 251.7%65 Headgear and Parts Thereof $3,808,853 $4,770,523 $7,675,073 60.9%39 Plastics and Articles Thereof $4,890,495 $6,569,476 $7,439,225 13.2%73 Iron and Steel Products $4,784,502 $8,801,554 $7,433,607 -15.5%69 Ceramic Products $1,246,651 $2,227,124 $7,298,420 227.7%90 Optic, Photo; Medical Instruments $3,081,098 $6,127,420 $6,849,113 11.8%
Multi Remaining commodities $41,963,028 $41,860,500 $44,932,613 7.3%
$0.0
$0.1
$0.2
$0.3
$0.4
$0.5
$0.6
$0.7
$0.8
2009 2010 2011 2012 2013 2014 2015 2016 2017
Bill
ions
Value of Top Imports
HS 61 HS 62 HS 85 HS 42
HS 84 HS 64 Other
0.0%
0.5%
1.0%
1.5%
2.0%
2.5%
3.0%
3.5%
2009 2010 2011 2012 2013 2014 2015 2016 2017
Percent of All Ohio Imports
0%
10%
20%
30%
40%
50%
60%
70%
80%
90%
100%
2009 2010 2011 2012 2013 2014 2015 2016 2017
Distribution of Top Imports
HS 61 HS 62 HS 85 HS 42
HS 84 HS 64 Other
$0.00
$0.25
$0.50
$0.75
$1.00
$1.25
$1.50
$1.75
$2.00
$2.25
2009 2010 2011 2012 2013 2014 2015 2016 2017
Bill
ions
Total Imports from Vietnam

France
Harmonized Tariff Schedule
2015 2016 2017 % Chng.16 to 17
TOTAL $1,958,074,571 $1,632,259,059 $1,679,319,649 2.9%
84 Industrial Machinery, Including Computers $1,195,956,849 $951,449,138 $984,887,537 3.5%29 Organic Chemicals $50,367,329 $79,809,712 $70,033,877 -12.2%90 Optic, Photo; Medical Instruments $36,377,503 $42,856,569 $54,503,999 27.2%33 Perfumery, Cosmetic, etc $36,090,029 $61,028,626 $51,356,863 -15.8%81 Base Metals Nesoi; Cermets; Articles Thereof $29,750,697 $33,358,223 $40,649,720 21.9%85 Electric Machinery; Sound Equip.; TV Equip. $39,047,771 $28,474,743 $30,822,288 8.2%39 Plastics and Articles Thereof $43,147,812 $36,546,887 $29,882,960 -18.2%76 Aluminum and Articles Thereof $18,778,419 $16,802,607 $19,641,046 16.9%30 Pharmaceutical Products $10,578,273 $4,849,713 $18,160,831 274.5%38 Miscellaneous Chemical Products $15,326,052 $13,993,264 $14,845,447 6.1%28 Inorganic Chemicals; Rare-Earths $15,548,409 $19,885,106 $14,176,864 -28.7%75 Nickel and Articles Thereof $7,786,034 $7,974,473 $13,418,890 68.3%22 Beverages, Spirits and Vinegar $12,183,252 $10,989,979 $11,227,825 2.2%73 Iron and Steel Products $12,937,585 $13,429,606 $10,714,536 -20.2%86 Railway Stock Etc; Traffic Signal Equipment $10,733,464 $10,009,656 $10,646,356 6.4%
Multi Remaining commodities $423,465,093 $300,800,757 $304,350,610 1.2%
$0.0
$0.2
$0.4
$0.6
$0.8
$1.0
$1.2
$1.4
2009 2010 2011 2012 2013 2014 2015 2016 2017
Bill
ions
Value of Top Imports
HS 84 HS 29 HS 33 HS 90
HS 39 HS 81 Other
0.0%
0.5%
1.0%
1.5%
2.0%
2.5%
3.0%
3.5%
2009 2010 2011 2012 2013 2014 2015 2016 2017
Percent of All Ohio Imports
0%
10%
20%
30%
40%
50%
60%
70%
80%
90%
100%
2009 2010 2011 2012 2013 2014 2015 2016 2017
Distribution of Top Imports
HS 84 HS 29 HS 33 HS 90HS 39 HS 81 Other
$0.00
$0.25
$0.50
$0.75
$1.00
$1.25
$1.50
$1.75
$2.00
$2.25
2009 2010 2011 2012 2013 2014 2015 2016 2017
Bill
ions
Total Imports from France

US Imports
US Top 25 Imported Commodities: 2017Harmonized
Schedule Code2015 2016 2017 % Chng.
16 to 17Total All Commodities $2,248,183,239,936 $2,187,804,863,917 $2,342,905,114,674 7.1%
85 Electric Machinery; Sound/TV Equip. $328,204,327,857 $330,875,166,700 $351,400,158,037 6.2%84 Industrial Machinery, Incl. Computers $322,918,307,682 $308,888,555,867 $341,768,259,374 10.6%87 Vehicles and Parts $279,882,878,553 $280,691,510,540 $289,934,166,866 3.3%27 Mineral Fuel, Oil, etc $190,723,682,424 $153,891,839,091 $195,029,667,594 26.7%30 Pharmaceutical Products $85,529,865,056 $92,040,861,106 $95,898,904,487 4.2%90 Optic, Photo; Medical Instruments $77,436,640,565 $79,710,737,403 $85,046,142,987 6.7%94 Furniture and Bedding $56,948,137,232 $59,089,761,619 $62,710,211,378 6.1%71 Precious Stones/Metals;Jewelry $59,309,681,586 $66,321,494,541 $59,121,038,783 -10.9%39 Plastics and Articles Thereof $47,861,738,078 $48,059,383,509 $52,328,104,039 8.9%29 Organic Chemicals $50,943,495,889 $48,763,671,309 $45,067,714,594 -7.6%61 Apparel Articles, etc, Knit/Crochet $46,867,995,279 $43,968,906,181 $44,249,789,463 0.6%73 Iron and Steel Products $36,577,908,556 $31,765,325,913 $37,053,193,233 16.6%62 Apparel Articles, Not Knit/Crochet $39,236,952,369 $37,372,703,669 $36,604,000,316 -2.1%95 Toys, Games & Sport Equipment $29,849,924,588 $29,141,673,374 $31,308,669,014 7.4%88 Aircraft; Spacecraft and Parts $35,149,484,649 $30,906,759,589 $30,761,882,004 -0.5%72 Iron and Steel $26,288,816,706 $21,177,432,167 $27,468,158,396 29.7%40 Rubber and Articles Thereof $26,437,498,716 $24,861,014,073 $26,543,933,046 6.8%64 Footwear, etc. and Parts Thereof $27,649,956,547 $25,633,913,271 $25,654,368,302 0.1%22 Beverages, Spirits and Vinegar $21,260,086,243 $22,340,741,299 $23,655,625,747 5.9%76 Aluminum and Articles Thereof $17,379,066,938 $18,133,459,343 $22,670,267,355 25.0%44 Wood and Articles of Wood $16,970,908,359 $18,611,534,060 $20,004,983,976 7.5%03 Fish & Crustaceans $14,603,685,776 $15,480,245,057 $16,965,523,763 9.6%08 Edible Fruit and Nuts $14,020,938,166 $15,261,638,357 $16,575,008,107 8.6%48 Paper, Paperboard, etc $15,763,373,971 $15,353,346,647 $15,516,540,703 1.1%63 Textile Articles Nesoi $14,165,125,595 $13,953,312,432 $14,731,873,101 5.6%
Multi Remaining commodities $366,202,762,556 $355,509,876,800 $374,836,930,009 5.4%
$0.0
$0.5
$1.0
$1.5
$2.0
$2.5
$3.0
2009 2010 2011 2012 2013 2014 2015 2016 2017
Trill
ions
Value of US Imports
-30%
-25%
-20%
-15%
-10%
-5%
0%
5%
10%
15%
20%
25%
2009 2010 2011 2012 2013 2014 2015 2016 2017
Annual Change In Value

US ImportsTop 8 Imported Products: 2017
Harmonized Schedule Code 2017 Value% of
All ImportsTotal All Commodities $2,342,905,114,674
85 Electric Machinery $351,400,158,037 15.0%84 Industrial Machinery $341,768,259,374 14.6%87 Vehicles and Parts $289,934,166,866 12.4%27 Mineral Fuel, Oil, etc $195,029,667,594 8.3%30 Pharmaceutical Products $95,898,904,487 4.1%90 Optic, Med. Instruments $85,046,142,987 3.6%94 Furniture and Bedding $62,710,211,378 2.7%71 Precious Stones/Metals;Jewelry $59,121,038,783 2.5%
Multi Remaining commodities $861,996,565,168 36.8%
Top 10 Trading Partners - 2017 Top 10 Trading Partners - 2015 to 2017
2017 Pct of 2015 to 2017 Pct ofValue Total Value 3-yr Total
Total $2,342,905,114,674 Total $6,778,893,218,527China $505,597,064,950 21.6% China $1,451,403,868,029 21.4%Mexico $314,045,194,983 13.4% Mexico $904,502,235,658 13.3%Canada $299,975,229,784 12.8% Canada $873,961,425,612 12.9%Japan $136,543,590,175 5.8% Japan $399,972,808,129 5.9%Germany $117,744,752,792 5.0% Germany $356,662,803,956 5.3%Korea $71,164,068,380 3.0% Korea $212,802,821,195 3.1%United Kingdom $53,074,868,018 2.3% United Kingdom $165,339,646,131 2.4%Italy $49,963,204,277 2.1% France $143,349,309,365 2.1%France $48,887,771,535 2.1% India $139,453,666,856 2.1%Ireland $48,843,830,823 2.1% Italy $139,399,420,908 2.1%Others $697,065,538,957 29.8% Others $1,992,045,212,688 29.4%
$0.0
$0.5
$1.0
$1.5
$2.0
$2.5
2009 2010 2011 2012 2013 2014 2015 2016 2017
Trilli
ons

State / Regional ImportsTop Importing States: 2017
2015 2016 2017% Share
2017% Chng.16 to 17
U.S. $2,248,183,239,936 $2,187,804,863,917 $2,342,905,114,674 100.0% 7.1%
California $408,247,063,787 $410,182,754,436 $440,714,857,157 18.8% 7.4%Texas $252,111,067,041 $229,294,257,001 $263,288,948,918 11.2% 14.8%Michigan $124,223,613,148 $134,946,978,072 $140,273,573,249 6.0% 3.9%Illinois $121,292,727,487 $121,529,416,487 $135,994,870,946 5.8% 11.9%New York $133,091,063,146 $130,072,195,891 $126,930,495,205 5.4% -2.4%New Jersey $119,571,470,381 $108,133,134,626 $112,666,419,609 4.8% 4.2%Georgia $88,692,314,544 $86,185,412,359 $91,412,574,593 3.9% 6.1%Pennsylvania $79,755,833,409 $77,163,821,321 $83,312,865,833 3.6% 8.0%Tennessee $76,979,527,383 $75,285,035,074 $79,010,259,979 3.4% 4.9%Florida $73,409,781,607 $73,625,970,549 $75,382,049,312 3.2% 2.4%Ohio $68,910,877,351 $64,263,908,511 $67,618,425,070 2.9% 5.2%Remaining states $701,897,900,652 $677,121,979,590 $726,299,774,803 31.0% 7.3%
Value and Share of US Imports by Region: 2017
$0
$100
$200
$300
$400
$500
$600
2009 2010 2011 2012 2013 2014 2015 2016 2017
Bill
ions
Value of Imports by Region

Ohio / US ComparisonOhio's Top 8 Originations: 2017
Origination
Value ofOhio Imports
(billions)
% ofOhio
Imports% Chng16 to 17
USRank
Value ofUS Imports
(billions)
% ofUS
Imports% Chng16 to 17
Total Imports $67.62 100.0% 5.2% $2,342.91 100.0% 7.1%China $12.90 19.1% 5.6% 1st $505.60 21.6% 9.3%Canada $12.19 18.0% 5.7% 3rd $299.98 12.8% 8.0%Mexico $8.25 12.2% 3.8% 2nd $314.05 13.4% 6.8%Germany $4.68 6.9% -4.9% 5th $117.74 5.0% 3.2%Japan $4.45 6.6% -7.8% 4th $136.54 5.8% 3.4%Ireland $3.57 5.3% 32.4% 10th $48.84 2.1% 7.3%Vietnam $1.97 2.9% 10.5% 12th $46.48 2.0% 10.4%France $1.68 2.5% 2.9% 9th $48.89 2.1% 4.7%Remainder $17.94 26.5% 7.4% $824.78 35.2% 6.7%
Ohio's Top 8 Imported Products: 2017Harmonized
Schedule Code Commodity
Value ofOhio Imports
(billions)
% ofOhio
Imports% Chng16 to 17
USRank
Value ofUS Imports
(billions)
% ofUS
Imports% Chng16 to 17
Total Imports $67.62 100.0% 5.2% $2,342.91 100.0% 7.1%84 Industrial Machinery $12.85 19.0% 5.3% 2nd $341.77 14.6% 10.6%85 Electric Machinery $6.42 9.5% 7.8% 1st $351.40 15.0% 6.2%30 Pharma. Products $4.67 6.9% -0.4% 5th $95.90 4.1% 4.2%87 Vehicles and Parts $4.66 6.9% -9.9% 3rd $289.93 12.4% 3.3%72 Iron and Steel $3.27 4.8% 50.6% 16th $27.47 1.2% 29.7%90 Optic, Med. Instruments $3.08 4.6% 4.0% 6th $85.05 3.6% 6.7%39 Plastics $2.70 4.0% 8.5% 13th $52.33 2.2% 8.9%61 Apparel, Knit/Crochet $2.62 3.9% -13.4% 9th $44.25 1.9% 0.6%
Multi Remaining commodities $27.36 40.5% 6.9% $1,054.81 45.0% 7.4%
0%1%2%3%4%5%6%7%8%
2009 2010 2011 2012 2013 2014 2015 2016 2017
Ohio Country Value as Percentage of US Country Value
0%
2%
4%
6%
8%
10%
12%
14%
2009 2010 2011 2012 2013 2014 2015 2016 2017
Ohio Commodity Value as Percentage of US Commodity Value

Ohio and U.S. Imports by CountryValue in Millions
2017Total
2015-17Change
16-17
Ohio'sShareof U.S. 2017
Total2015-17
Change16-17
Total $67,618.43 $200,793.21 5.2% 2.9% $2,342,905.11 $6,778,893.22 7.1%China $12,896.39 $38,483.43 5.6% 2.6% $505,597.06 $1,451,403.87 9.3%Canada $12,189.94 $37,548.54 5.7% 4.1% $299,975.23 $873,961.43 8.0%Mexico $8,249.08 $24,412.51 3.8% 2.6% $314,045.19 $904,502.24 6.8%Germany $4,676.87 $15,447.88 -4.9% 4.0% $117,744.75 $356,662.80 3.2%Japan $4,448.32 $14,492.91 -7.8% 3.3% $136,543.59 $399,972.81 3.4%Ireland $3,565.38 $8,182.42 32.4% 7.3% $48,843.83 $133,707.60 7.3%Vietnam $1,973.98 $5,377.45 10.5% 4.2% $46,483.47 $126,598.35 10.4%France $1,679.32 $5,269.65 2.9% 3.4% $48,887.77 $143,349.31 4.7%India $1,416.69 $4,243.45 -0.8% 2.9% $48,631.29 $139,453.67 5.6%Italy $1,319.29 $3,553.82 19.9% 2.6% $49,963.20 $139,399.42 10.4%Brazil $1,270.70 $2,700.41 50.2% 4.3% $29,427.32 $82,922.61 12.9%Taiwan $1,216.28 $3,534.07 9.2% 2.9% $42,491.68 $122,644.69 8.3%United Kingdom $1,205.05 $3,225.53 14.6% 2.3% $53,074.87 $165,339.65 -2.2%Thailand $1,129.29 $2,866.29 12.6% 3.6% $31,189.77 $89,285.85 5.8%Indonesia $918.83 $2,752.83 -3.4% 4.5% $20,208.86 $59,003.43 5.3%Korea $863.09 $2,765.32 13.6% 1.2% $71,164.07 $212,802.82 1.8%Sri Lanka $757.84 $2,368.09 -8.0% 26.5% $2,858.35 $8,532.07 2.7%Netherlands $672.19 $1,764.78 10.3% 3.8% $17,743.28 $50,698.24 10.1%Russia $633.41 $1,398.17 92.8% 3.7% $17,003.32 $47,905.19 17.0%Trinidad And Tobago $500.98 $1,233.06 64.7% 15.1% $3,314.48 $10,585.23 12.1%Switzerland $469.50 $1,340.53 9.3% 1.3% $36,001.99 $103,751.30 -1.0%Sweden $464.65 $1,350.94 13.1% 4.3% $10,740.49 $30,346.05 10.7%Spain $385.77 $1,263.67 -19.6% 2.5% $15,660.65 $43,214.29 16.7%Poland $322.66 $909.21 17.1% 4.5% $7,110.46 $18,691.40 19.3%Belgium $306.29 $839.26 7.5% 2.0% $15,094.58 $51,593.04 -11.3%Malaysia $286.36 $1,059.97 -21.3% 0.8% $37,408.94 $108,010.94 2.1%Philippines $283.56 $889.21 -8.0% 2.4% $11,626.60 $31,903.07 15.8%Ukraine $264.98 $476.98 132.8% 26.0% $1,017.33 $2,446.36 75.9%Singapore $212.91 $673.40 -0.9% 1.1% $19,396.84 $55,497.48 8.8%Turkey $208.45 $578.69 9.6% 2.2% $9,421.27 $25,345.20 17.1%Israel $199.15 $585.47 3.8% 0.9% $21,946.60 $68,628.06 -1.2%Bangladesh $186.18 $558.35 2.7% 3.3% $5,688.14 $17,589.80 -3.8%Denmark $171.78 $446.35 18.7% 2.2% $7,692.02 $23,393.54 -3.1%Austria $162.33 $857.40 -27.6% 1.4% $11,721.66 $33,903.54 7.8%Finland $161.58 $437.77 27.9% 2.7% $5,893.23 $14,971.08 28.9%Czech Republic $137.56 $438.16 2.7% 3.0% $4,595.04 $13,486.82 4.4%Hungary $106.60 $414.27 -10.6% 2.1% $5,088.99 $16,148.46 -4.7%Pakistan $102.50 $231.89 75.2% 2.9% $3,574.08 $10,718.66 3.8%United Arab Emirates $100.74 $180.45 113.8% 2.3% $4,323.33 $10,162.77 28.3%South Africa $99.24 $306.64 28.3% 1.3% $7,759.36 $21,839.41 14.7%Cambodia $97.45 $294.74 -8.1% 3.2% $3,064.15 $8,903.85 8.9%Colombia $93.51 $950.08 -82.6% 0.7% $13,556.05 $41,424.44 -1.7%Hong Kong $90.41 $226.17 51.3% 1.2% $7,554.07 $21,754.47 2.0%Norway $75.01 $223.30 33.3% 1.5% $5,029.89 $14,198.62 14.1%Australia $74.80 $312.22 -36.7% 0.7% $10,051.34 $30,444.77 5.7%
continued
Ohio US

Ohio and U.S. Imports by CountryValue in Millions
2017Total
2015-17Change
16-17
Ohio'sShareof U.S. 2017
Total2015-17
Change16-17
Guatemala $72.25 $195.52 7.2% 1.8% $4,016.38 $12,074.81 2.0%Romania $68.62 $287.34 -35.9% 3.1% $2,201.31 $6,313.42 12.1%Costa Rica $66.33 $229.86 -28.5% 1.5% $4,562.50 $13,382.86 5.3%Kazakhstan $65.75 $124.38 46.2% 8.4% $785.44 $2,351.76 4.7%Portugal $63.66 $257.09 -22.1% 1.8% $3,503.46 $9,979.89 9.3%Chile $59.43 $189.80 -17.3% 0.6% $10,551.58 $28,120.96 19.9%Peru $51.17 $136.68 6.0% 0.7% $7,283.15 $18,588.83 16.5%Haiti $47.27 $128.99 1.5% 5.1% $922.23 $2,771.19 2.6%Dominican Republic $45.05 $125.77 6.9% 0.9% $4,747.13 $14,091.97 1.4%Jordan $40.51 $134.95 1.6% 2.4% $1,687.60 $4,733.91 8.5%Honduras $39.73 $117.19 -5.9% 0.9% $4,581.11 $13,958.39 -0.8%Slovakia $35.39 $161.21 -33.3% 1.2% $3,050.25 $7,876.63 20.7%New Zealand $31.62 $98.39 -10.3% 0.8% $4,155.56 $12,495.86 2.7%Slovenia $28.24 $85.42 7.1% 3.7% $761.22 $2,191.75 1.2%El Salvador $25.94 $69.55 -1.4% 1.0% $2,470.97 $7,498.61 -1.0%Bulgaria $23.86 $60.23 47.5% 3.6% $659.03 $1,860.42 9.2%Gabon $21.85 $106.85 -10.8% 10.9% $199.66 $644.06 86.0%Estonia $16.30 $53.53 -10.0% 2.7% $603.12 $2,107.76 -39.8%Saudi Arabia $14.50 $33.83 13.7% 0.1% $18,866.44 $57,864.73 11.5%Argentina $14.22 $60.44 40.6% 0.3% $4,765.39 $13,363.90 2.5%Luxembourg $11.65 $23.57 117.5% 2.4% $493.58 $1,631.67 -1.1%Greece $11.21 $34.58 5.8% 0.9% $1,257.68 $3,842.01 2.4%Kenya $8.82 $24.32 -39.2% 1.5% $574.03 $1,699.56 3.9%Egypt $8.19 $30.86 20.8% 0.5% $1,635.06 $4,533.79 9.5%Croatia $8.08 $34.23 116.1% 1.9% $436.68 $1,523.82 -14.4%Latvia $7.73 $25.54 -16.1% 1.7% $456.77 $1,097.59 35.2%Qatar $6.14 $39.50 -77.3% 0.5% $1,201.31 $3,715.82 3.5%Bahrain $5.54 $14.90 80.4% 0.6% $996.43 $2,667.18 29.7%Nicaragua $5.33 $79.38 -73.1% 0.2% $3,262.99 $9,745.21 -0.9%Iceland $5.10 $13.41 11.9% 1.2% $412.82 $1,100.39 11.3%Tunisia $5.00 $16.75 46.5% 1.1% $462.29 $1,400.68 17.9%Morocco $4.58 $17.99 -7.9% 0.4% $1,229.72 $3,262.79 20.4%Serbia $3.70 $9.64 28.6% 1.3% $292.75 $874.92 -5.4%Lithuania $2.96 $6.69 116.5% 0.2% $1,444.99 $3,685.90 22.3%Laos $2.69 $5.83 49.7% 2.8% $96.29 $196.57 74.8%Oman $2.56 $7.14 -16.0% 0.2% $1,068.84 $3,101.24 -5.0%Ethiopia $2.40 $9.66 -33.5% 0.8% $291.39 $837.90 23.3%Malta $2.30 $8.60 -26.9% 1.4% $162.69 $1,697.78 -87.4%Uruguay $2.26 $12.42 -31.5% 0.4% $584.84 $1,725.51 9.1%Monaco $2.24 $6.76 52.6% 2.6% $87.02 $188.35 104.7%Macau $2.22 $8.45 -24.1% 2.3% $95.47 $336.73 -20.0%Andorra $1.77 $1.78 n.a. 12.9% $13.70 $25.16 107.2%Cook Islands $1.72 $1.79 3147.8% 49.5% $3.49 $6.29 78.2%Burma (Myanmar) $1.72 $10.22 -67.8% 0.5% $366.07 $754.61 49.6%Ecuador $1.69 $4.80 79.3% 0.0% $6,378.28 $19,904.29 5.3%Madagascar $1.45 $5.57 -58.7% 0.2% $741.46 $1,506.15 66.7%
continued
Ohio US

Ohio and U.S. Imports by CountryValue in Millions
2017Total
2015-17Change
16-17
Ohio'sShareof U.S. 2017
Total2015-17
Change16-17
Bolivia $1.38 $89.18 -96.8% 0.2% $565.75 $2,547.71 -42.0%Bosnia And Herzegovina $1.36 $2.00 331.6% 1.6% $85.44 $239.25 13.1%Bahamas $1.29 $1.63 1585.6% 0.2% $522.54 $1,273.86 75.0%Belarus $1.00 $2.70 -20.2% 0.4% $277.80 $569.88 107.6%Rwanda $0.98 $0.98 38709.2% 2.2% $43.65 $114.82 71.0%Ivory Coast $0.90 $2.29 -0.8% 0.1% $1,212.99 $3,404.71 4.2%Panama $0.84 $2.30 33.4% 0.2% $442.43 $1,261.24 7.8%Macedonia $0.84 $1.85 51.2% 0.3% $255.02 $688.56 10.8%Cayman Islands $0.75 $1.66 -12.0% 1.4% $54.26 $238.54 -37.5%Swaziland $0.74 $0.97 306.8% 3.6% $20.50 $58.99 20.6%Papua New Guinea $0.72 $0.79 24291.6% 0.6% $120.77 $302.62 32.7%Lesotho $0.68 $0.91 17055.9% 0.2% $308.61 $951.16 -0.6%Kuwait $0.62 $1.83 51.2% 0.0% $2,916.25 $10,902.44 -11.7%Sierra Leone $0.58 $32.31 -97.1% 1.2% $46.53 $116.22 54.6%Nepal $0.52 $1.33 33.5% 0.6% $91.87 $267.45 3.7%Lebanon $0.52 $2.19 -51.9% 0.4% $128.55 $329.67 19.1%Zimbabwe $0.48 $0.79 122.8% 0.9% $54.58 $145.22 132.5%Guinea $0.48 $0.77 273.6% 8.1% $5.85 $94.92 -38.1%Georgia $0.46 $3.44 -82.7% 0.4% $130.65 $406.31 38.2%Western Samoa $0.35 $0.48 410.7% 7.1% $4.99 $14.47 -5.2%Malawi $0.32 $0.47 119.7% 0.5% $62.10 $197.98 -16.5%Togo $0.29 $0.29 n.a. 2.0% $14.62 $39.68 34.7%Niger $0.29 $0.35 577.6% 4.0% $7.27 $17.67 17.1%Cameroon $0.25 $1.52 -44.7% 0.2% $119.50 $402.38 -20.8%Suriname $0.21 $0.50 5035.6% 0.3% $67.39 $280.11 1.3%St.Christopher-Nevis $0.19 $0.59 -36.0% 0.4% $47.76 $153.58 -2.7%Jamaica $0.18 $1.25 -32.2% 0.1% $337.63 $946.96 11.3%Benin $0.17 $0.22 334.6% 1.0% $17.81 $29.79 153.1%Uganda $0.16 $0.38 -12.6% 0.2% $79.12 $194.73 53.7%Namibia $0.15 $0.25 1986.0% 0.1% $127.05 $304.19 38.4%Cyprus $0.15 $0.31 23.5% 0.3% $47.44 $132.77 -11.0%Nauru $0.14 $0.16 1600.5% 9.2% $1.54 $3.14 43.2%Barbados $0.13 $0.35 22.1% 0.3% $48.75 $166.52 -1.7%Tokelau Islands $0.13 $0.13 n.a. 6.6% $1.99 $5.83 -1.0%Mozambique $0.13 $0.41 -39.7% 0.1% $145.56 $347.76 37.1%Liechtenstein $0.12 $0.51 -12.9% 0.0% $290.75 $889.00 0.9%Ghana $0.12 $0.79 6.2% 0.0% $749.97 $1,380.49 133.5%Tanzania $0.12 $0.32 -30.6% 0.1% $123.68 $377.11 -16.7%Fiji $0.11 $0.33 -38.0% 0.1% $221.58 $627.67 8.9%Mauritius $0.10 $2.38 -85.9% 0.0% $284.86 $1,015.93 -15.1%Armenia $0.10 $0.12 2597.1% 0.1% $67.46 $172.51 58.4%Cocos Islands $0.09 $0.14 247.2% 6.4% $1.48 $7.40 -29.6%Montenegro $0.08 $0.12 773.3% 3.1% $2.60 $6.65 33.2%Moldova $0.08 $0.16 166.7% 0.2% $40.13 $121.96 6.0%Marshall Islands $0.08 $0.18 4.6% 0.2% $36.08 $104.50 -8.3%Azerbaijan $0.07 $0.16 -13.8% 0.0% $211.81 $860.94 49.2%
continued
Ohio US

Ohio and U.S. Imports by CountryValue in Millions
2017Total
2015-17Change
16-17
Ohio'sShareof U.S. 2017
Total2015-17
Change16-17
Brunei $0.07 $0.12 n.a. 0.3% $22.80 $55.97 65.6%Bermuda $0.07 $0.23 62.2% 0.2% $33.41 $166.55 36.7%Senegal $0.06 $0.09 n.a. 0.1% $72.40 $198.96 32.6%San Marino $0.06 $0.22 168.0% 1.3% $4.72 $18.89 -16.6%Zambia $0.06 $0.75 -2.4% 0.1% $66.05 $159.72 41.9%Gibraltar $0.06 $0.11 39.3% 9.7% $0.64 $2.81 82.0%Vatican City $0.06 $0.07 411.0% 5.7% $1.07 $2.97 56.6%Nigeria $0.06 $0.24 -26.6% 0.0% $7,050.83 $13,142.63 68.8%Faroe Islands $0.05 $0.23 n.a. 0.0% $118.62 $351.26 -11.9%Algeria $0.05 $0.06 418.0% 0.0% $3,808.00 $10,407.47 18.0%Congo, Republic Of The Congo $0.04 $0.10 69.7% 0.0% $128.26 $564.61 -2.9%Reunion $0.04 $0.06 139.5% 0.3% $14.97 $42.18 46.1%Vanuatu $0.04 $0.05 489.9% 0.8% $5.36 $14.62 -3.9%Dominica $0.04 $0.04 1695.4% 3.3% $1.27 $5.64 -52.8%Mauritania $0.04 $0.15 40.0% 0.1% $61.46 $112.98 22.1%Libya $0.04 $0.15 -19.8% 0.0% $1,372.03 $1,750.65 513.9%British Virgin Islands $0.04 $0.11 29.4% 0.6% $6.66 $54.30 -78.6%Afghanistan $0.03 $0.30 -60.9% 0.2% $14.48 $71.78 -57.0%Iran $0.03 $0.07 -11.9% 0.1% $63.17 $161.67 -28.0%Tonga $0.03 $0.03 n.a. 0.7% $3.60 $9.38 7.8%Uzbekistan $0.03 $0.65 2363.9% 0.2% $14.28 $54.62 -53.3%Martinique $0.02 $0.02 625.3% 0.4% $5.78 $59.99 -65.5%Seychelles $0.02 $0.44 -49.4% 0.2% $12.64 $24.07 125.9%Montserrat $0.02 $0.37 -81.4% 2.0% $1.02 $4.01 41.8%Maldives $0.02 $0.03 248.9% 0.1% $22.05 $64.17 8.2%Solomon Islands $0.02 $0.02 n.a. 0.5% $3.38 $9.05 57.7%Sint Maarten $0.02 $0.10 374.4% 0.0% $70.40 $214.66 -23.9%Venezuela $0.02 $23.46 -99.7% 0.0% $12,336.91 $38,794.38 13.3%Antigua And Barbuda $0.02 $0.09 -78.0% 0.1% $11.78 $35.51 -30.2%New Caledonia $0.01 $9.68 -98.7% 0.0% $65.12 $154.36 54.3%Christmas Island $0.01 $0.05 -62.4% 0.9% $1.30 $5.01 -19.0%Congo, Democratic Republic Of T $0.01 $0.18 -75.5% 0.0% $86.12 $413.59 -50.4%Curacao $0.01 $0.62 -82.6% 0.0% $150.61 $746.75 -42.3%Belize $0.01 $0.21 -89.8% 0.0% $276.83 $407.47 400.1%Heard And Mcdonald Islands $0.01 $0.01 n.a. 2.9% $0.32 $0.35 1729.8%Albania $0.01 $0.05 -70.2% 0.0% $41.60 $326.30 -66.6%Guyana $0.01 $1.35 -99.3% 0.0% $313.44 $1,176.91 -27.5%Turks And Caicos Islands $0.01 $0.23 -96.6% 0.1% $8.45 $35.57 -31.9%Tuvalu Islands $0.01 $0.13 n.a. 2.9% $0.21 $0.49 257.7%Central African Republic $0.01 $0.04 -81.1% 0.3% $2.16 $6.32 108.9%South Sudan $0.01 $0.08 -90.8% 2.0% $0.28 $0.61 110.0%French Polynesia $0.01 $0.04 n.a. 0.0% $49.17 $125.70 46.8%Sao Tome And Principe $0.00 $0.17 20.9% 0.5% $0.91 $2.15 95.9%Iraq $0.00 $10.00 n.a. 0.0% $10,745.62 $21,082.38 79.6%Kosovo $0.00 $0.00 n.a. 0.1% $2.68 $7.16 27.8%St. Helena $0.00 $0.03 -90.3% 0.0% $13.43 $44.31 -13.6%
continued
Ohio US

Ohio and U.S. Imports by CountryValue in Millions
2017Total
2015-17Change
16-17
Ohio'sShareof U.S. 2017
Total2015-17
Change16-17
Kyrgyzstan $0.00 $0.01 -75.5% 0.0% $6.46 $25.47 101.6%Greenland $0.00 $0.00 n.a. 0.0% $13.08 $22.78 121.7%St. Lucia $0.00 $0.01 n.a. 0.0% $35.17 $78.20 150.8%British Indian Ocean Terr. $0.00 $0.04 -95.7% 0.0% $8.46 $36.26 -29.4%East Timor $0.00 $0.00 n.a. 0.0% $5.49 $14.25 0.6%Mongolia $0.00 $0.74 -96.2% 0.0% $9.00 $37.42 -19.6%Cabo Verde $0.00 $0.22 -100.0% 0.0% $3.55 $9.80 -12.1%Paraguay $0.00 $0.22 -100.0% 0.0% $125.13 $436.90 -16.1%Niue $0.00 $0.03 -100.0% 0.0% $0.29 $1.80 -70.6%French Guiana $0.00 $0.03 -100.0% 0.0% $3.19 $3.58 819.5%Gambia $0.00 $0.02 -100.0% 0.0% $1.01 $2.55 57.0%Guadeloupe $0.00 $0.02 -100.0% 0.0% $1.75 $8.98 -43.5%Chad $0.00 $0.01 -100.0% 0.0% $525.55 $2,727.42 -41.5%Bhutan $0.00 $0.01 -100.0% 0.0% $1.16 $8.49 -70.5%Grenada $0.00 $0.00 -100.0% 0.0% $12.11 $33.82 -3.1%Syria $0.00 $0.01 -100.0% 0.0% $7.06 $20.28 5.8%Mali $0.00 $0.05 -100.0% 0.0% $2.92 $11.75 -32.2%Falkland Islands $0.00 $0.00 -100.0% 0.0% $11.73 $45.78 -40.7%Anguilla $0.00 $0.49 n.a. 0.0% $4.56 $14.20 12.6%Angola $0.00 $0.09 n.a. 0.0% $2,603.57 $8,265.63 -8.8%Somalia $0.00 $0.01 n.a. 0.0% $0.99 $2.87 -0.1%Eritrea $0.00 $0.01 n.a. 0.0% $0.27 $0.84 -43.2%Tajikistan $0.00 $0.01 n.a. 0.0% $0.93 $32.86 15.2%Aruba $0.00 $0.01 n.a. 0.0% $35.15 $106.37 115.5%Botswana $0.00 $0.00 n.a. 0.0% $772.36 $1,418.45 77.9%Equatorial Guinea $0.00 $0.00 n.a. 0.0% $355.92 $712.31 84.2%Liberia $0.00 $0.00 n.a. 0.0% $91.26 $200.30 42.3%Djibouti $0.00 $0.00 n.a. 0.0% $34.18 $97.66 22.0%Turkmenistan $0.00 $0.00 n.a. 0.0% $13.82 $87.63 -22.5%Sudan (Starting 2011) $0.00 $0.00 n.a. 0.0% $13.06 $36.79 -11.5%Republic Of Yemen $0.00 $0.00 n.a. 0.0% $9.54 $60.21 298.2%Burundi $0.00 $0.00 n.a. 0.0% $8.97 $24.04 34.8%West Bank Admin By Israel $0.00 $0.00 n.a. 0.0% $6.27 $18.08 -1.8%Comoros $0.00 $0.00 n.a. 0.0% $5.07 $8.96 89.6%Burkina Faso $0.00 $0.00 n.a. 0.0% $5.05 $13.68 0.4%St. Vincent $0.00 $0.00 n.a. 0.0% $4.90 $9.75 59.2%Kiribati $0.00 $0.00 n.a. 0.0% $3.69 $9.97 3.9%Federated States Of Micronesia $0.00 $0.00 n.a. 0.0% $0.92 $2.17 71.8%Palau $0.00 $0.00 n.a. 0.0% $0.57 $2.19 -46.2%St. Pierre And Miquelon $0.00 $0.00 n.a. 0.0% $0.29 $0.63 87.4%Norfolk Island $0.00 $0.00 n.a. 0.0% $0.28 $1.78 2.7%Fr.Sthern.,Antarctic Lands $0.00 $0.00 n.a. 0.0% $0.14 $0.23 80.3%Gaza Strip Admin By Israel $0.00 $0.00 n.a. 0.0% $0.08 $0.09 33033.9%Mayotte $0.00 $0.00 n.a. 0.0% $0.07 $0.19 190.8%Wallis And Futuna $0.00 $0.00 n.a. 0.0% $0.06 $0.67 -87.7%Pitcairn Island $0.00 $0.00 n.a. 0.0% $0.04 $0.06 591.1%
continued
Ohio US

Ohio and U.S. Imports by CountryValue in Millions
2017Total
2015-17Change
16-17
Ohio'sShareof U.S. 2017
Total2015-17
Change16-17
Svalbard, Jan Mayen Island $0.00 $0.00 n.a. 0.0% $0.02 $0.12 -69.8%Guinea-Bissau $0.00 $0.00 n.a. 0.0% $0.02 $0.25 -89.2%Western Sahara $0.00 $0.00 n.a. 0.0% $0.02 $0.15 -77.7%
Ohio US
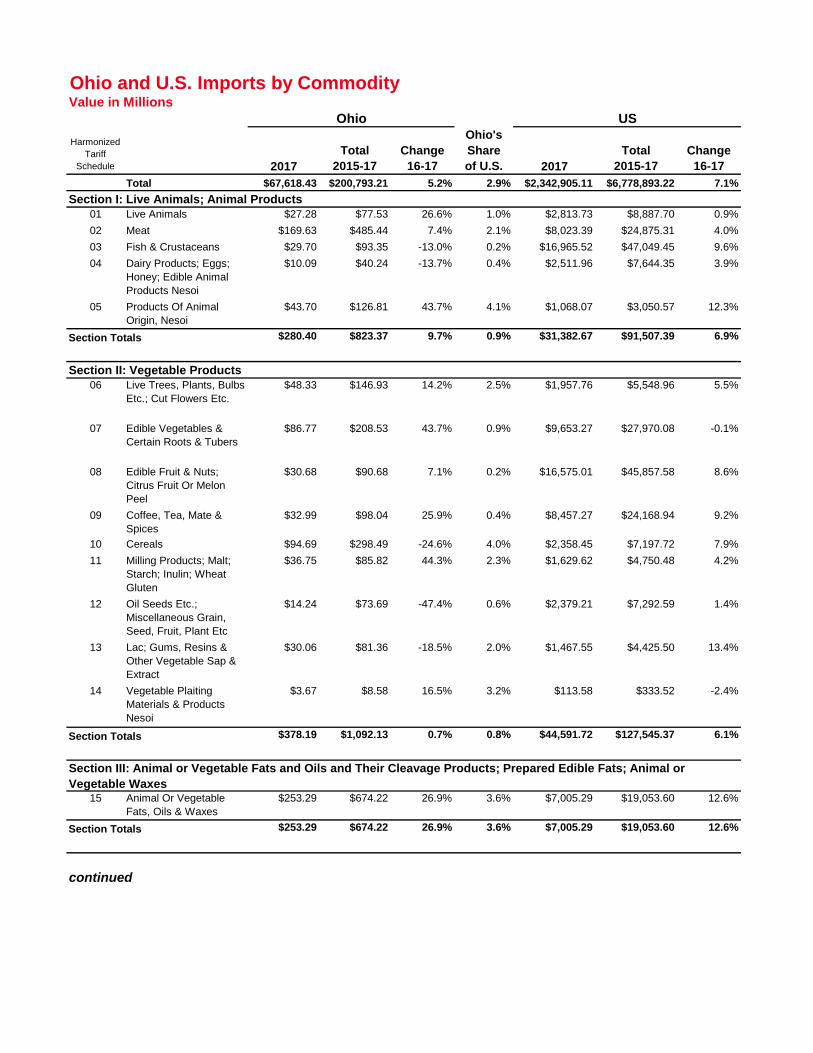
Ohio and U.S. Imports by CommodityValue in Millions
HarmonizedTariff
Schedule 2017Total
2015-17Change
16-17
Ohio'sShareof U.S. 2017
Total2015-17
Change16-17
Total $67,618.43 $200,793.21 5.2% 2.9% $2,342,905.11 $6,778,893.22 7.1%Section I: Live Animals; Animal Products
01 Live Animals $27.28 $77.53 26.6% 1.0% $2,813.73 $8,887.70 0.9%02 Meat $169.63 $485.44 7.4% 2.1% $8,023.39 $24,875.31 4.0%03 Fish & Crustaceans $29.70 $93.35 -13.0% 0.2% $16,965.52 $47,049.45 9.6%04 Dairy Products; Eggs;
Honey; Edible Animal Products Nesoi
$10.09 $40.24 -13.7% 0.4% $2,511.96 $7,644.35 3.9%
05 Products Of Animal Origin, Nesoi
$43.70 $126.81 43.7% 4.1% $1,068.07 $3,050.57 12.3%
Section Totals $280.40 $823.37 9.7% 0.9% $31,382.67 $91,507.39 6.9%
Section II: Vegetable Products06 Live Trees, Plants, Bulbs
Etc.; Cut Flowers Etc.$48.33 $146.93 14.2% 2.5% $1,957.76 $5,548.96 5.5%
07 Edible Vegetables & Certain Roots & Tubers
$86.77 $208.53 43.7% 0.9% $9,653.27 $27,970.08 -0.1%
08 Edible Fruit & Nuts; Citrus Fruit Or Melon Peel
$30.68 $90.68 7.1% 0.2% $16,575.01 $45,857.58 8.6%
09 Coffee, Tea, Mate & Spices
$32.99 $98.04 25.9% 0.4% $8,457.27 $24,168.94 9.2%
10 Cereals $94.69 $298.49 -24.6% 4.0% $2,358.45 $7,197.72 7.9%11 Milling Products; Malt;
Starch; Inulin; Wheat Gluten
$36.75 $85.82 44.3% 2.3% $1,629.62 $4,750.48 4.2%
12 Oil Seeds Etc.; Miscellaneous Grain, Seed, Fruit, Plant Etc
$14.24 $73.69 -47.4% 0.6% $2,379.21 $7,292.59 1.4%
13 Lac; Gums, Resins & Other Vegetable Sap & Extract
$30.06 $81.36 -18.5% 2.0% $1,467.55 $4,425.50 13.4%
14 Vegetable Plaiting Materials & Products Nesoi
$3.67 $8.58 16.5% 3.2% $113.58 $333.52 -2.4%
Section Totals $378.19 $1,092.13 0.7% 0.8% $44,591.72 $127,545.37 6.1%
15 Animal Or Vegetable Fats, Oils & Waxes
$253.29 $674.22 26.9% 3.6% $7,005.29 $19,053.60 12.6%
Section Totals $253.29 $674.22 26.9% 3.6% $7,005.29 $19,053.60 12.6%
continued
Ohio US
Section III: Animal or Vegetable Fats and Oils and Their Cleavage Products; Prepared Edible Fats; Animal or Vegetable Waxes

Ohio and U.S. Imports by CommodityValue in Millions
HarmonizedTariff
Schedule 2017Total
2015-17Change
16-17
Ohio'sShareof U.S. 2017
Total2015-17
Change16-17
16 Edible Preparations Of Meat, Fish, Crustaceans Etc
$34.65 $78.85 40.7% 0.7% $5,289.87 $14,795.72 13.0%
17 Sugars And Sugar Confectionary
$69.61 $195.77 0.6% 1.7% $4,093.68 $12,376.17 -3.4%
18 Cocoa And Cocoa Preparations
$75.81 $236.59 -3.0% 1.5% $5,022.32 $14,979.95 -1.4%
19 Preparations Of Cereal, Flour, Starch Or Milk; Bakers Wares
$170.06 $469.30 12.8% 2.4% $7,089.86 $19,789.91 6.7%
20 Preparations Vegetables, Fruit, Nuts Or Other Plant Parts
$96.36 $290.20 0.8% 1.2% $8,048.88 $22,736.29 7.8%
21 Miscellaneous Edible Preparations
$121.05 $316.95 20.0% 2.6% $4,624.08 $13,202.21 6.3%
22 Beverages, Spirits And Vinegar
$102.28 $300.63 0.7% 0.4% $23,655.63 $67,256.45 5.9%
23 Food Industry Residues & Waste; Prepared Animal Feed
$70.88 $223.00 2.4% 2.5% $2,817.31 $8,402.97 3.8%
24 Tobacco And Manufactured Tobacco Substitutes
$105.31 $337.10 -8.0% 4.9% $2,134.69 $6,351.38 -1.1%
Section Totals $846.01 $2,448.40 5.1% 1.3% $62,776.30 $179,891.05 5.2%
Section V: Mineral Products25 Salt; Sulfur; Earth &
Stone; Lime & Cement Plaster
$182.09 $476.26 26.8% 5.6% $3,243.48 $9,336.14 13.2%
26 Ores, Slag And Ash $203.36 $814.84 7.7% 7.7% $2,649.82 $7,520.76 23.4%27 Mineral Fuel, Oil Etc.;
Bitumin Substances; Mineral Wax
$1,031.49 $3,836.67 50.6% 0.5% $195,029.67 $539,645.19 26.7%
Section Totals $1,416.94 $5,127.78 39.3% 0.7% $200,922.96 $556,502.09 26.4%
continued
Section IV: Prepared Foodstuffs; Beverages, Spirits, and Vinegar; Tobacco and Manufactured Tobacco Substitutes
Ohio US

Ohio and U.S. Imports by CommodityValue in Millions
HarmonizedTariff
Schedule 2017Total
2015-17Change
16-17
Ohio'sShareof U.S. 2017
Total2015-17
Change16-17
Section VI: Products of the Chemical or Allied Industries28 Inorganic Chemicals;
Precious & Rare-Earth Metals & Radioactive Compounds
$434.23 $1,141.57 28.8% 3.9% $11,068.96 $34,967.93 -2.0%
29 Organic Chemicals $2,100.25 $5,283.55 26.4% 4.7% $45,067.71 $144,774.88 -7.6%30 Pharmaceutical Products $4,668.11 $14,043.05 -0.4% 4.9% $95,898.90 $273,469.63 4.2%
31 Fertilizers $103.38 $385.01 -20.9% 1.8% $5,687.81 $19,085.74 4.8%32 Tanning & Dye Extracts
Etc; Dye, Paint, Putty Etc; Inks
$358.88 $940.64 11.3% 9.0% $4,000.55 $11,552.64 6.9%
33 Essential Oils Etc; Perfumery, Cosmetic Preparations
$395.42 $1,110.09 22.3% 3.0% $13,326.98 $37,553.68 7.9%
34 Soap Etc; Waxes, Polish Etc; Candles; Dental Preparations
$129.91 $385.00 12.8% 4.0% $3,282.39 $9,483.90 5.8%
35 Albuminoidal Substances; Modified Starch; Glue; Enzymes
$65.27 $238.88 -13.8% 2.5% $2,598.58 $7,907.67 -0.4%
36 Explosives; Pyrotechnics; Matches; Pyrophoric Alloys Etc
$37.18 $100.06 3.5% 4.8% $769.78 $2,304.93 2.3%
37 Photographic Or Cinematographic Goods
$15.58 $24.14 196.3% 0.9% $1,646.15 $4,896.35 0.7%
38 Miscellaneous Chemical Products
$540.15 $1,530.50 8.2% 4.0% $13,417.11 $39,510.67 0.2%
Section Totals $8,848.36 $25,182.47 8.0% 4.5% $196,764.91 $585,508.03 0.8%
Section VII: Plastics and Articles Thereof; Rubber and Articles Thereof39 Plastics And Articles
Thereof$2,702.65 $7,661.21 8.5% 5.2% $52,328.10 $148,249.23 8.9%
40 Rubber And Articles Thereof
$1,563.83 $4,751.29 5.6% 5.9% $26,543.93 $77,842.45 6.8%
Section Totals $4,266.47 $12,412.50 7.4% 5.4% $78,872.04 $226,091.67 8.2%
continued
Ohio US

Ohio and U.S. Imports by CommodityValue in Millions
HarmonizedTariff
Schedule 2017Total
2015-17Change
16-17
Ohio'sShareof U.S. 2017
Total2015-17
Change16-17
41 Raw Hides And Skins And Leather
$16.69 $49.09 5.5% 2.3% $737.97 $2,331.65 -6.5%
42 Leather Articles; Saddlery Etc; Handbags Etc
$656.79 $1,495.96 49.1% 5.1% $12,971.52 $39,588.61 1.6%
43 Furskins And Artificial Fur; Manufactures Thereof
$2.76 $7.03 39.6% 1.0% $286.31 $1,068.33 -14.4%
Section Totals $676.24 $1,552.08 47.5% 4.8% $13,995.80 $42,988.59 0.8%
44 Wood And Articles Of Wood; Wood Charcoal
$478.89 $1,375.50 4.0% 2.4% $20,004.98 $55,587.43 7.5%
45 Cork And Articles Of Cork
$1.72 $7.25 -23.2% 0.7% $260.57 $786.30 6.9%
46 Manufactures Of Straw, Esparto Etc.; Basketware & Wickerwork
$15.09 $41.16 18.9% 2.8% $532.33 $1,573.91 4.5%
Section Totals $495.70 $1,423.91 4.3% 2.4% $20,797.88 $57,947.64 7.4%
47 Wood Pulp Etc; Recovered (Waste & Scrap) Paper & Paperboard
$11.01 $42.75 -31.1% 0.3% $3,160.72 $9,463.72 5.0%
48 Paper & Paperboard & Articles (Including Paper Pulp Articles)
$424.15 $1,320.27 -2.2% 2.7% $15,516.54 $46,633.26 1.1%
49 Printed Books, Newspapers Etc; Manuscripts Etc
$90.66 $272.01 0.7% 2.1% $4,406.05 $13,236.49 0.9%
Section Totals $525.83 $1,635.03 -2.6% 2.3% $23,083.31 $69,333.47 1.6%
continued
Section IX: Wood and Articles of Wood; Wood Charcoal; Cork and Articles of Cork; Manufacturers of Straw, Esparto
Section X: Pulp of Wood or Other Fibrous Cellulosic Material; Waste and Scrap of Paper or Paperboard; Paper an
Ohio US
Section VIII: Raw Hides and Skins, Leather, Furskins and Articles Thereof; Saddlery and Harness; Travel Goods, Handbags and Similar Containers

Ohio and U.S. Imports by CommodityValue in Millions
HarmonizedTariff
Schedule 2017Total
2015-17Change
16-17
Ohio'sShareof U.S. 2017
Total2015-17
Change16-17
Section XI: Textile and Textile Articles50 Silk, Including Yarns And
Woven Fabric Thereof$0.22 $0.77 -28.8% 0.3% $81.36 $297.48 -18.2%
51 Wool & Animal Hair, Including Yarn & Woven Fabric
$4.73 $13.27 17.9% 1.8% $266.33 $851.73 0.6%
52 Cotton, Including Yarn And Woven Fabric Thereof
$28.43 $86.53 2.4% 3.2% $900.96 $2,890.71 -3.5%
53 Other Vegetable Textile Fibers Nesoi; Paper Yarns & Woven Fabric
$13.24 $39.45 8.8% 6.1% $216.48 $675.84 -0.8%
54 Manmade Filaments $28.19 $79.55 9.3% 1.4% $2,069.69 $6,450.63 0.1%55 Manmade Staple Fibers $13.03 $49.22 -22.1% 0.8% $1,631.03 $5,187.90 -1.4%
56 Wadding, Felt Etc; Special Yarns; Twine, Ropes Etc.
$60.44 $172.21 10.7% 2.9% $2,099.23 $6,241.60 2.7%
57 Carpets And Other Textile Floor Coverings
$63.94 $183.29 2.9% 2.3% $2,768.52 $7,949.31 4.0%
58 Special Woven Fabrics; Tufted Fabrics; Lace; Tapestries Etc
$13.13 $38.38 4.3% 1.8% $725.13 $2,222.14 0.3%
59 Impregnated/Coated Textile Fabrics; Textile Articles For Industrial Use
$63.72 $259.38 -24.3% 2.5% $2,567.20 $7,444.67 4.2%
60 Knitted Or Crocheted Fabrics
$23.05 $79.21 -16.3% 2.3% $992.40 $3,129.55 -6.4%
61 Apparel Articles And Accessories, Knit Or Crochet
$2,616.98 $8,680.15 -13.4% 5.9% $44,249.79 $135,086.69 0.6%
62 Apparel Articles And Accessories, Not Knit Or Crochet
$2,597.09 $8,220.29 -5.4% 7.1% $36,604.00 $113,213.66 -2.1%
63 Textile Articles Nesoi; Needlecraft Sets; Worn Textile Articles
$389.77 $1,161.85 0.0% 2.6% $14,731.87 $42,850.31 5.6%
Section Totals $5,915.97 $19,063.55 -8.8% 5.4% $109,903.99 $334,492.23 0.4%
continued
Ohio US

Ohio and U.S. Imports by CommodityValue in Millions
HarmonizedTariff
Schedule 2017Total
2015-17Change
16-17
Ohio'sShareof U.S. 2017
Total2015-17
Change16-17
64 Footwear, Gaiters Etc. And Parts Thereof
$496.47 $1,499.67 9.2% 1.9% $25,654.37 $78,938.24 0.1%
65 Headgear And Parts Thereof
$77.11 $210.54 13.2% 3.2% $2,394.57 $7,084.46 3.0%
66 Umbrellas, Walking-Sticks, Riding-Crops Etc, Parts
$40.71 $123.83 11.4% 6.5% $623.41 $1,767.91 9.3%
67 Prepared Feathers, Down Etc; Artificial Flowers; Human Hair Articles
$34.78 $98.06 19.0% 1.6% $2,182.81 $6,275.76 6.7%
Section Totals $649.07 $1,932.09 10.3% 2.1% $30,855.16 $94,066.37 0.9%
68 Articles Of Stone, Plaster, Cement, Asbestos, Mica Etc.
$190.23 $526.35 14.5% 2.4% $7,817.35 $22,313.11 7.4%
69 Ceramic Products $195.02 $651.80 -1.3% 3.2% $6,089.16 $17,716.36 5.8%70 Glass And Glassware $309.71 $901.49 6.6% 4.2% $7,380.93 $21,996.97 1.0%
Section Totals $694.96 $2,079.64 6.2% 3.3% $21,287.43 $62,026.44 4.7%
71 Natural/Cultured Pearls, Precious Stones/Metals; Coin
$306.81 $1,840.66 -64.1% 0.5% $59,121.04 $184,752.21 -10.9%
Section Totals $306.81 $1,840.66 -64.1% 0.5% $59,121.04 $184,752.21 -10.9%
continued
SectionXIV: Natural or Cultured Pearls, Precious or Semiprecious Stones, Precious Metals, Metals Clad With Precious Metal, and Articles Thereof; Imitation Jewelry; Coin
Section XII: Footwear, Headgear, Umbrellas, Sun Umbrellas, Walking Sticks, Seasticks, Whips, Riding-Crops and Parts Thereof; Prepared Feathers and Articles Made Therewith; Artificial Flowers; Articles of Human Hair
Section XIII: Articles of Stone, Plaster, Cement, Asbestos, Mica or Similar Materials; Ceramic Products; Glass and Glassware
Ohio US

Ohio and U.S. Imports by CommodityValue in Millions
HarmonizedTariff
Schedule 2017Total
2015-17Change
16-17
Ohio'sShareof U.S. 2017
Total2015-17
Change16-17
Section XV: Base Metals and Articles of Base Metal72 Iron And Steel $3,267.78 $7,960.77 50.6% 11.9% $27,468.16 $74,934.41 29.7%73 Articles Of Iron Or Steel $1,528.79 $4,652.84 7.8% 4.1% $37,053.19 $105,396.43 16.6%
74 Copper And Articles Thereof
$460.82 $1,221.25 28.1% 4.6% $9,980.31 $25,706.06 34.2%
75 Nickel And Articles Thereof
$119.66 $320.38 17.1% 5.0% $2,405.75 $6,966.83 23.1%
76 Aluminum And Articles Thereof
$1,128.89 $2,759.22 42.6% 5.0% $22,670.27 $58,182.79 25.0%
78 Lead And Articles Thereof
$55.27 $140.17 17.5% 3.6% $1,529.15 $3,654.13 39.7%
79 Zinc And Articles Thereof
$192.85 $550.60 2.8% 8.7% $2,211.74 $5,763.69 23.1%
80 Tin And Articles Thereof $9.26 $18.22 106.1% 1.2% $780.87 $2,086.59 22.5%
81 Base Metals Nesoi; Cermets; Articles Thereof
$210.32 $576.70 12.8% 8.0% $2,632.85 $7,118.46 22.7%
82 Tools, Cutlery Etc. Of Base Metal & Parts Thereof
$527.06 $1,824.10 -8.6% 5.3% $9,852.20 $28,489.53 8.0%
83 Miscellaneous Articles Of Base Metal
$531.04 $1,540.86 10.8% 4.6% $11,671.13 $33,916.34 4.5%
Section Totals $8,031.74 $21,565.11 27.0% 6.3% $128,255.64 $352,215.25 20.5%
84 Industrial Machinery, Including Computers
$12,848.45 $38,396.79 5.3% 3.8% $341,768.26 $973,575.12 10.6%
85 Electric Machinery; Sound Equipment; TV Equipment; Parts
$6,419.66 $18,629.54 7.8% 1.8% $351,400.16 $1,010,479.65 6.2%
Section Totals $19,268.10 $57,026.34 6.1% 2.8% $693,168.42 $1,984,054.78 8.3%
Section XVII: Vehicles, Aircraft, Vessels and Associated Transport Equipment86 Railway Stock Etc;
Traffic Signal Equipment$65.92 $174.87 40.6% 4.1% $1,611.74 $5,344.03 5.0%
87 Vehicles, Except Railway And Parts Etc
$4,657.10 $16,024.52 -9.9% 1.6% $289,934.17 $850,508.56 3.3%
88 Aircraft, Spacecraft, And Parts Thereof
$863.38 $3,890.71 -38.9% 2.8% $30,761.88 $96,818.13 -0.5%
89 Ships, Boats And Floating Structures
$5.46 $15.85 17.1% 0.2% $2,505.34 $7,190.73 25.6%
Section Totals $5,591.86 $20,105.95 -15.7% 1.7% $324,813.13 $959,861.44 3.1%
continued
Section XVI: Machinery and Mechanical Appliances; Electrical Equipment; Parts Thereof; Sound Recorders and Reproducers, Television Image and Sound Recorders and Reproducers, and Parts and Accessories of Such Articles
Ohio US

Ohio and U.S. Imports by CommodityValue in Millions
HarmonizedTariff
Schedule 2017Total
2015-17Change
16-17
Ohio'sShareof U.S. 2017
Total2015-17
Change16-17
90 Optic, Photo Etc, Medical Or Surgical Instruments Etc
$3,082.30 $8,736.60 4.0% 3.6% $85,046.14 $242,193.52 6.7%
91 Clocks And Watches And Parts Thereof
$18.49 $85.97 -41.0% 0.4% $4,778.87 $15,458.99 -4.4%
92 Musical Instruments; Parts And Accessories Thereof
$17.56 $57.21 -8.6% 1.4% $1,293.69 $3,793.31 4.8%
Section Totals $3,118.35 $8,879.78 3.5% 3.4% $91,118.70 $261,445.83 6.0%
Section XIX: Arms and Ammunition; Parts and Accessories Thereof93 Arms & Ammunition;
Parts And Accessories Thereof
$22.85 $68.77 -0.1% 0.8% $2,972.45 $9,357.87 -12.1%
Section Totals $22.85 $68.77 -0.1% 0.8% $2,972.45 $9,357.87 -12.1%
Section XX: Miscellaneous Manufactured Articles94 Furniture; Bedding Etc;
Lamps Nesoi Etc; Prefabricated Buildings
$1,739.20 $4,994.16 4.0% 2.8% $62,710.21 $178,748.11 6.1%
95 Toys, Games & Sport Equipment; Parts & Accessories
$483.08 $1,405.35 4.4% 1.5% $31,308.67 $90,300.27 7.4%
96 Miscellaneous Manufactured Articles
$464.21 $1,005.57 11.8% 7.4% $6,239.30 $18,839.21 -4.0%
Section Totals $2,686.49 $7,405.08 5.4% 2.7% $100,258.18 $287,887.59 5.8%
97 Works Of Art, Collectors Pieces And Antiques
$14.66 $51.66 -33.8% 0.1% $10,348.48 $31,768.65 5.5%
Section Totals $14.66 $51.66 -33.8% 0.1% $10,348.48 $31,768.65 5.5%
98 Special Classification Provisions, Nesoi
$3,330.10 $8,402.70 25.1% 4.6% $73,152.18 $209,258.54 6.1%
99 Special Import Provisions, Nesoi
$0.00 $0.00 n.a. 0.0% $17,457.46 $51,337.12 4.3%
Section Totals $3,330.10 $8,402.70 25.1% 3.7% $90,609.64 $260,595.66 5.7%
Section XXII: Special Classification Provisions
US
Section XVIII: Optical, Photographic, Cinematographic, Measuring, Checking, Precision, Medical or Surgical Instruments and Apparatus; Clocks and Watches; Musical Instruments; Parts and Accessories Thereof
Section XXI: Works of Art, Collectors' Pieces and Antiques
Ohio

Guide to Import Data Prepared by the U.S. Department of Commerce, International Trade Administration
State of Destination (SD) Series: In the mid 1980s state data based on the import state of destination were added. However, in 1988, release of the data on import state of destination was discontinued due to quality concerns. Since then changes to the import reporting requirements along with growth of electronic reporting and a better understanding of the data’s limitations has made it possible to bring back the import state of destination series.
Effective with January 2010 statistics, this new SD series will be available. A new supplement will be added to the FT900: U.S. International Trade in Goods and Services. In addition the following data products will be produced: Import state data by 6-digit Harmonized System (HS) and Import state data 4-digit North American Industry Classification System (NAICS). An example of the data structure for these files can be found on our website. Historical data tables and products will be made available for monthly data back to January 2008.
This new series is based upon the U.S. State of Destination Code. This is defined as the U.S. state, U.S. territory or U.S. possession where the merchandise is destined, as known at the time of entry summary filing. If the contents of the shipment are destined to more than one state, territory, or possession, or if the entry summary represents a consolidated shipment, report the state of destination with the greatest aggregate value. If in either case, this information is unknown, the state of the ultimate consignee, or the state where the entry is filed, in that order, should be reported. However, before either of these alternatives is used, a good faith effort should be made by the entry filer to ascertain the state where the imported merchandise will be delivered. In all cases, the state code reported should be derived from the standard postal two-letter state or territory abbreviation. For shipments into FTZ’s, the import state represents the location of the zone.
In certain cases, the state of destination may not reflect the final location for which the imported goods are destined. Rather for these shipments, the state of destination, as known at the time the entry documentation is filed, may reflect an intermediary, storage or distribution point. From there, these shipments may later be distributed to another location in another state as the ultimate destination. For example, a consolidated shipment of many automobiles may be shipped by the importing company to a distribution point in one state with the intent of later shipping the automobiles to numerous states for final sale.
For additional information on the State of Destination series, visit the Census Bureau’s website at http://www.census.gov/foreign-trade/aip/elom.html .