offshore wind energy in finland · double degree in building services engineering name of the...
TRANSCRIPT

Aleksandra Li
T6616KA
OFFSHORE WIND ENERGY IN
FINLAND Simulation of energy consumption of a single-
family house
Bachelor’s Thesis
Building Services Engineering
January 2017

DESCRIPTION
Date of the bachelor's thesis
January 2017
Author(s)
Aleksandra Li
Degree programme and option
Double Degree in
Building Services Engineering
Name of the bachelor's thesis
Offshore wind energy in Finland
Abstract
Energy consumption is increasing worldwide harmfully affecting the environment. Greater
deployment of renewable energy sources is a solution to the problem of pollution. Although
offshore wind energy is not the most common renewable energy source, development and
application of the technology continue to grow. In Europe, offshore wind energy has a great
potential, especially in Northern conditions.
The main aim of the bachelor’s thesis is to find out if offshore wind energy can be used for
HVAC needs in single-family houses in Finland. This study is done to understand if generat-
ed offshore wind energy will be enough to cover the heating demands and what are heating
options in the studied case. Besides, environmental consequences and economical aspects are
depicted.
In this thesis, one storey single-family house located in west coast of Finland is investigated.
The total net heated area is 138 m2. Simulation of energy consumption of is performed in
IDA ICE program. The task is to compare energy consumption, energy prices, and GHGE of
studied heating modes. Possible GHGE reduction is evaluated according to obtained results.
Finally, all the examined information is analyzed to make a conclusion about current applica-
tion of offshore wind energy and future expectations.
Subject headings, (keywords)
Offshore wind energy, Wind energy, Renewable energy, Energy consumption
Pages Language URN
55 pages, 1 appendix English
Remarks, notes on appendices
Tutor
Mika Kuusela
Bachelor’s thesis assigned by

CONTENTS
1 INTRODUCTION................................................................................................... 1
1.1 Background .................................................................................................... 1
1.2 Aims ............................................................................................................... 1
1.3 Methods ......................................................................................................... 2
2 OFFSHORE WIND ENERGY ............................................................................... 4
3 OFFHORE WIND ENERGY ECONOMICS ......................................................... 6
3.1 Basic costs ..................................................................................................... 6
3.2 Offshore wind energy economics .................................................................. 7
3.3 The cost of offshore wind generated energy .................................................. 8
4 ENVIRONMENTAL IMPACT ............................................................................ 11
4.1 Visual impact ............................................................................................... 11
4.2 Noise impact ................................................................................................ 12
4.3 Electromagnetic field impact ....................................................................... 13
4.4 Impact on benthos, fish, marine mammals and sea birds ............................ 14
4.5 Ship collision ............................................................................................... 15
5 APPLICATION OVER THE WORLD ................................................................ 16
5.1 Statistics and trends ..................................................................................... 16
5.2 Northern conditions challenges ................................................................... 22
5.2.1 Technology ...................................................................................... 23
5.2.2 Cold climate experiences in Finland ................................................ 24
6 TAHKOLUOTO PROJECT ................................................................................. 26
7 ENERGY CONSUMPTION IN FINLAND ......................................................... 28
7.1 Electricity consumption in Finland .............................................................. 28
7.2 Heating energy consumption in residential buildings ................................. 30
7.3 Heating energy consumption in single-family houses ................................. 31
8 HEATING OPTIONS ........................................................................................... 35
8.1 Electric heating ............................................................................................ 35
8.2 District heating and CHP ............................................................................. 37
8.3 Heat pumps .................................................................................................. 41
9 SIMULATIONS OF ENERGY CONSUMPTION IN SINGLE-FAMILY HOUSE43

9.1 Simulation model ......................................................................................... 43
9.2 DH simulation .............................................................................................. 44
9.3 GSHP simulation ......................................................................................... 45
9.4 Electric heating simulation .......................................................................... 46
9.5 Results analysis ............................................................................................ 48
10 ENERGY COSTS AND GHGE CALCULATIONS ............................................ 49
11 DISCUSSION AND CONCLUSION ................................................................... 51
BIBLIOGRAPHY ........................................................................................................ 53
APPENDIX
1 Floor layout

1
1 INTRODUCTION
1.1 Background
Nowadays, the energy problem is a burning issue. Modern lifestyle and industry keep
energy consumption growing worldwide affecting the atmosphere with green house
gas emissions (GHGE); consequently, the need for sustainable and clean energy is
undeniable. The only possible solution of reducing ecological problems is expanding
deployment of renewable energies.
One of the most promising sources of renewable energy is wind energy. In this thesis,
offshore wind energy is discussed, as it has become one of the fastest growing renew-
able energy sources in the world.
In Finland, offshore wind power generation has a small share in energy market. How-
ever, the government of Finland is very optimistic about feasibility of offshore wind
energy in the country. The construction and commissioning of Tahkoluoto offshore
farm near Pori, west-coast of Finland is about to prove that offshore wind energy is a
great solution to reducing CO2 emissions and reaching European 2020 climate and
energy targets./1./
1.2 Aims
The main aim of the bachelor’s thesis is to find out how offshore wind energy can be
used in single-family houses in Pori. The objective is to understand if offshore wind is
a good solution of sustainable and feasible source of energy in Pori region. Will avail-
able offshore wind energy be enough to cover space heating needs in single-family
houses located in the area? How using energy generated by offshore wind turbines
influences the environment? Is it profitable source of energy in terms of money sav-
ing?
In other words, what are pros and cons of implementing offshore wind power? Even-
tually, is it reasonable from economical and environmental points of view to invest
money in offshore wind development particularly in Finland?

2
To answer these questions the following tasks are determined. Firstly, the task is to
discover general information about offshore wind energy economical aspects includ-
ing offshore wind farm installation costs, energy prices, and future expectation. Then
environmental advantages and disadvantages are depicted, as there are contradictive
opinions about offshore wind energy generation.
The next task is to give a profound overview on offshore wind energy deployment in
Europe providing with latest statistics and trends. A special emphasis is given to cold
climate conditions that are applicable for Finland. So what are Northern climate chal-
lenges and solutions?
Next task touches upon a subject of energy consumption in Finland. In this thesis,
single-family house is analyzed; hence, IDA ICE simulations are carried out to com-
pare energy consumption of commonly used energy sources in the studied building.
The last tasks are to calculate and compare energy costs per year and GHGE reduction
in case of utilizing offshore wind energy for space heating.
1.3 Methods
Research methods used in this thesis include literature study, data analysis, and soft-
ware simulation.
Firstly, in order to familiarize with the topic of offshore wind energy information from
various sources will be collected and studied. Comparison of different literature
sources will help to get reliable facts and details. In addition, current reports and sta-
tistics will be thoroughly analyzed to investigate latest news and get a clear overview
of the subject. The main source of statistical data is Statistics Finland that is the only
Finnish public authority providing with the variety of official statistics.
Energy consumption of a typical single-family house located in Pori is evaluated. En-
ergy consumption simulation will be performed by means of IDA ICE software.
Simulation part includes comparison of energy demands when different energy
sources are used: district heat, ambient energy, and electricity. E-values and energy
consumption values will be calculated by the program and then compared.

3
The next step involves annual energy costs calculations based on simulation’s results.
Prices of heating energy are provided by Statistics Finland and reflect average energy
prices in 2015. This calculation will allow comparing operational costs of studied
heating options.
Then annual green house gas emissions using conventional energy sources will be
calculated. When Tahkoluoto offshore wind farm is brought to operation electricity
generated by wind will be available in Pori region. Estimation of possible CO2 reduc-
tion if offshore wind energy is used will be performed.
Finally, all the studied material and obtained data will be properly analyzed to made a
conclusion and answer the research questions.

4
2 OFFSHORE WIND ENERGY
Offshore wind energy is a new and still developing technology. Consequently, when
offshore wind energy farm project is discussed, it is likely to happen that available
information about offshore wind energy is not enough to give very precise and de-
tailed project description.
Nowadays, the interest in application of offshore wind energy is growing; therefore,
more specific researches and studies, especially the ones concerning environmental
impact, wind resources estimation, efficiency estimation, and reduction of capital
costsare needed. The fundamental aspects of offshore wind energy remain the same,
as onshore, yet there are differences that make offshore wind energy installations
more challenging.
The first point is offshore wind energy projects sizes are typically greater than on-
shore, which leads to higher capital costs and greater economical risks. Moreover,
capital costs of offshore wind farms are generally higher than similar onshore installa-
tions. However, there are economical benefits that are usually disregarded when ener-
gy costs are estimated. Chapter 3 provides with more precise information about real
offshore wind energy costs.
Secondly, offshore wind speeds are higher and more consistent than on land. Reports
from Danish Tunø Knob offshore wind farm indicate 20–30% higher output and better
availability than estimated with mean speed prediction models./2./
Since wind energy is heavily dependent on location, estimation of wind resources is
crucial for both onshore and offshore developments. Yet operation of offshore wind
energy turbines depends on other factors. One of the most important parameters that
affect wind power is surface roughness. It can be defined as deviation of the actual
surface of the ground from the ideal smooth surface.
Generally, topographic effects do not matter much for offshore wind installations. The
surface roughness is low, and it is dependent on sea state and wave conditions that are
complicated to estimate, as the sea does not remain fixed as trees, buildings, and other

5
city elements. Low surface roughness result in low turbines’ intensity and increased
energy demand in the end./3./
Stable flow conditions are also possible to occur offshore. It happens when air flow
mixing is slow due to different airflow temperatures or airflow origins. In some un-
common and particular circumstances, wind speed even reduces with height./3./
Moreover, coastal zone conditions have an impact on wind speed, turbulence and
boundary layers profiles across wind farms. Another important parameter that affects
mean wind speed is tide level. In high tidal areas, rise and fall of the sea heavily influ-
ence on location of a turbine./3./

6
3 OFFHORE WIND ENERGY ECONOMICS
In spite of active development and growing range of application, offshore wind energy
relates only to 1% of total installed wind power capacity in the world./3./ Due to small
share and limited data most of the information given in this chapter refers to econom-
ics of wind energy in general, and only several facts are given regarding offshore wind
power generation.
3.1 Basic costs
Compared to conventional energy sources wind energy is a capital-intensive source of
energy. Approximately 75% of the total costs of wind energy relate to the construction
and installation of a wind turbine while fuel costs equal to zero. The costs structure of
a typical wind turbine is given in the Table 1 (2006 prices)./4./
TABLE 1. Cost structure of a typical 2MW wind turbine installed in Europe /4/
According to Spanish data about 60% of operational and maintenance (O&M) costs
are spent directly for operation and maintenance needs including labor costs and spare
parts. Another 40% cover the costs of insurance, land rental, and overheads. For on-
shore wind turbine O&M costs amount approximately 1.2-1.5c€ per kWh of total gen-
erated electricity over a lifetime of a turbine./4./

7
The cost per kWh of energy generated by a wind turbine is shown in Figure 1. The
costs were calculated depending on the wind regime of the chosen site. As shown in
Figure 2 the costs of wind energy fall down with higher mean wind speeds./4./
FIGURE 1. Calculated costs per kWh of wind generated power as a function of
the wind regime at the chosen site (number of full load hours) /4/
Owing to intensive development all over the world and introduction of new technolo-
gy, wind energy costs have a tendency to go down. Besides, wind farms and wind
turbines became larger improving cost-effectiveness. For example, two times bigger
wind farm leads up to 9-17% decrease of costs per kWh produced energy for a new
turbine./4./
3.2 Offshore wind energy economics
Offshore wind costs remain 50% higher than for similar onshore installations. The
main points are reasonably higher investment costs: foundations, cables, installation,
and grid connection are more expensive. O&M costs are also greater because of more
complicated service and conditions.
Nevertheless, offshore wind generation is potentially beneficial. Firstly, because of
higher mean speeds over sites. Investment costs are expected to be offset by higher
total electricity production. If the energy generation indicators are compared, onshore
sites have normally around 2,000-2,500 full load hours per year when offshore wind

8
installations reaches up to 4,000 full load hours per year, depending on the location of
the farm./4./
European Wind Energy Association developed a positive scenario for offshore wind
power market. Based on 2015 report cost-competiveness can be met by 2023 by intro-
ducing higher capacity turbines, improving supply chain optimisation and logistics,
and achieving continuous production with better pipelines./5./ Figure 2 represents the
estimated costs dynamics if offshore wind technology continues to improve and ex-
pand its share in the market.
FIGURE 2. Evolution of the levelized cost of electricity (LCoE) according to the
cumulated offshore wind capacity installed /5/
3.3 The cost of offshore wind generated energy
When energy costs are calculated the following issues are taken into account:
the annual energy production from the wind turbine installation,
the capital costs of the offshore wind farm project,
the applied discount rate to the capital costs of the project,
the terms of contract between an electricity supplier and consumer,
payback period or time of recovery of the project,

9
O& M costs, including maintenance of the wind turbines, insurance, land leas-
ing, offshore leasing etc.
The present methods of calculation energy costs do not take into consideration many
important factors, so economical benefits remain unclear. In fact, the main benefit of
wind power is reduction of economics’ reliance on fuel price volatility./4./ Although
the risk reduction from wind energy is crucial for cost calculation, it is missing in
standard methods.
Other things are cost and benefit to society that are different from consumers or sellers
points of view. Using fossil fuels and dumping combustion wastes might be cheaper
for power generation companies than using expensive renewable technologies, but it
affects society in a negative way creating extra costs for people in the form of health
problems or nature damage.
Siemens Wind Power elaborated “Society’s Cost of Electricity” (SCoE) concept that
allows to estimate real costs of wind energy demonstrating actual benefits. The addi-
tional factors that were taken into consideration include:
1. Employment effect:
Offshore wind energy market is capable of creating more job opportunities and em-
ploying more people than any other source of energy./5./
2. Geopolitical impact:
Unlike fossil fuel prices, wind energy is not volatile; it is not dependent on political
situation. Wind energy prices stay more stable and predictable or can even remain
fixed./5./
3. Subsidies:
Government’s investment aid is essential for offshore wind projects. Markets them-
selves cannot value long-term external effects of wind power generation, so it is under
government’s responsibility to support offshore wind energy sector. With govern-
ment’s contribution offshore projects’ costs can be lowered and more investment is
attracted./5./

10
The analysis of Germany’s offshore wind market conducted by Siemens reveals that
wind energy can become the most competitive electricity source in the country by
2025. Applying the same SCoE approach Siemens carried out analysis for the UK as
well. The achieved results were similar. Germany’s SCoE by 2025 shows offshore
wind competiveness in Figure 3./5./
FIGURE 3. Germany’s SCoE by 2025 /5/

11
4 ENVIRONMENTAL IMPACT
Generation of energy by wind turbines has many environmental benefits comparing to
conventional energy sources. Wind is clean and inexhaustible source of energy. In
other words, generation of energy by wind turbines does not involve:
pollutants that cause acid rain or smog;
radioactivity;
contamination of land, sea or water courses;
the consumption of water – unlike many conventional and some renewable en-
ergy sources.
The main advantage is production of zero CO2 emissions while operation of wind tur-
bines. Due to this fact, producing wind energy allows to diminish effects of fossil
fuels combustion. The problems of climate change and air pollution can be only
solved if the share of total energy produced by renewable sources dramatically in-
crease.
In 2014, Europe set 2030 goals that include up to 40% emissions reduction compared
to 1990 levels and achieving 27% use of renewable energy sources for total European
energy./5./ Offshore wind generation makes possible reaching these goals as offshore
wind seems to be the most stable and sustainable solution in Europe.
Most negative aspects and concerns are still uncertain and require more scientific
studies to make proper conclusions. The disadvantages and possible environmental
impact are depicted in more detail in this chapter.
4.1 Visual impact
Offshore wind energy installations are typically larger than onshore ones: wind farm
projects are greater, and sizes of turbines are bigger. Nevertheless, visual impact is
usually comparatively low. The reason is greater distances from a coastline and be-
tween turbines.
Although visual impact of offshore wind energy installations is not a great subject of
concern, it has a disadvantage in some cases. Coastline areas as well as sea area are

12
unique natural surroundings which attractiveness can be spoilt with massive turbines
and offshore wind farm elements like grids, platforms, substations and cables. In order
to foresee the level of visual impact of new wind energy farm special technology and
tools are used. These include ZTV maps, photomontages, and video montages. They
are the same as for onshore wind farms./3./
According to the studies, real visibility tends to be lower than worst expected photo-
montage due to weather conditions, lightning and distance./3./ The level of visual dis-
turbance depends on several factors such as distance, size of wind farm, number of
turbines, size, characteristics (material and colour) of turbines, weather conditions,
and lightning.
4.2 Noise impact
Noise impact is a subject of ongoing research. In comparison with onshore wind
farms, offshore wind farms are located far away from residential area; hence, there is
no actual disturbance because of turbines operational noise to people. At the same
time, there is controversial information about possible impact on marine fauna.
Estimation of harmful impact on marine organisms is complicated to perform because
of the lack of scientific researches. However, it is a matter of fact that high sound lev-
els are responsible for causing changes in the behavior and physiology of marine fau-
na. The behavior variations range from avoidance of noise source to panic. So far as
known fish hearing system is not damaged due to noise emissions, but high acoustic
oscillation interfere with communication of some species such as Atlantic salmon and
cod./3./
The influence of noise generated during site contraction or decommissioning and op-
erating period depends mostly on species sensibility and vicinity to the sound source.
During the construction phase, noise can be very loud, for example, the measured
peak noise during the construction of North Hoyle wind farm located in Wales
reached 262 dB at 10 m depth./3./ Such a great level of noise can possibly have an
impact on marine animals and fish behaviour even several kilometres further from the
sound source.

13
Another environmental concern is the absence of regulations and threshold values for
noise levels; therefore, more research is needed in order to present permitted values of
noise levels. As for decreasing noise effects during the construction period, there are
several solutions, which include:
Using air-bubble curtain around noise source,
Gradually increasing sound emission,
Using of acoustic devices to keep marine animals away during the noisiest
construction period,
Using sound insulation for tools.
These approaches can reduce noise levels from 5 dB to 25 dB depending on the se-
lected method./3./
The current studies about noise impact during turbines operation reveal controversial
results: some of them say that the subject is not clear enough, and more data are re-
quired. Others consider that operational time noise emissions from the turbines do not
cause significant disturbance and can be neglected. During operation the underwater
noise level does not exceed ambient noise level if noise frequency range is above 1
kHz, but when it is below 1 kHz, noise level becomes higher than ambient noise level,
and thus noise may lead to negative consequences.
4.3 Electromagnetic field impact
Electric current flowing in cables create artificial static magnetic field, which can pos-
sibly affect some marine species. Many marine organisms like mollusks, fish, and
marine mammals are sensitive to magnetic field, or they use it for orientation. The
question of potential negative influence on them is still a matter of ongoing re-
search./3./
According to the experimental studies, permanent magnetic field of 3.7 mT did not
show a significant effect on several benthic organisms and mussels./3./ As for fish
behavior, there are not enough available data to make certain conclusions and correla-
tions. In such a case, electromagnetic field impact is assumed to be neglected until
more data appear.

14
4.4 Impact on benthos, fish, marine mammals and sea birds
A group of benthos organisms, named epifauna, lives on hard surface to which they
attach. It means that, foundation structure of a turbine can possibly become a habitat
for animals like oysters, mussels, sponges, starfish, and snails. They tend to occupy it;
therefore, a new ecosystem appears. As a result, biodiversity is expanded, and benthos
population increases; for this reason, fish and birds are attracted. However, it happens
only during operational time. During construction period marine organisms avoid the
site and nearby area.
Turbine slab structure can be assumed an artificial reef. In this case, fish population
and diversity are expected to increase. Several European studies prove it, but in the
example of Horns Rev and Nysted offshore wind farms located in Denmark an impact
was barely noticeable./3./ In order to make clear analysis studies that are more specific
need to be carried out.
Mammals seem to be more affected by turbines because they rely on hearing organs in
many cases, for instance, communication, echolocation, and orientation. Even if high
level noise during construction phase or moderate operation noise do not damage
mammals hearing systems, any kind of noise may have an influence on animals be-
havior. When offshore wind farm is constructed, most animals avoid zone of disturb-
ance because constant and high level sounds vibrations cause stress and misinterpret-
ing environmental signals.
Studies, that were taken place in Danish offshore wind farms Horns Rev and Nysted,
revealed no significant impact on seals during operation period but different change of
porpoises population. In first case porpoises population slightly decreased during con-
struction but recovered afterwards. In Nysted, porpoises’ population decrease was
considerably greater, and recovery took a long time. The reasons of the phenomenon
remained obscure./3./
Construction of new offshore wind farm has mostly a negative impact on birds. As
well as marine animals, birds try to avoid offshore wind farms especially during con-
struction time. At present birds’ avoidance, do not harm to ecosystem. Yet birds’ col-
lisions with turbines may occur. If compared to onshore developments, impact is

15
higher because of larger sizes of turbines and wind farms in general. Collision statis-
tics is 0.1-1.2 birds per turbine./3./ In brief, birds’ mortality due to collisions is very
complicated subject to analyze, and it does not drastically affect on birds’ population;
hence, overall impact can be neglected.
4.5 Ship collision
Ship collision with a turbine structure is also possible. If it happens, consequences are
dire: ship is obviously destroyed, and oil is spilt in seawaters. The size of ecological
catastrophe depends on type of a foundation slab and a ship. Apparently, number of
collisions can be minimized with better navigation systems, professional crew train-
ing, and monitoring, but it cannot be equaled to zero.

16
5 APPLICATION OVER THE WORLD
5.1 Statistics and trends
Offshore wind resources in Europe are enormous, and the potential of utilizing wind
energy is impressive. With new technologies and constant development offshore wind
energy seems to be a great solution to reducing air pollution and green house gases
effect. The total share of offshore wind energy remains significantly smaller compared
to fossil fuels or other renewable sources of energy. As shown in Figure 4 wind, solar,
biomass, and geothermal power correspond to 1.4% of global final energy consump-
tion, and the total share of offshore wind energy is a small part of it./6./
FIGURE 4. Estimated renewable energy share of global final energy consump-
tion in 2014 /6/
In spite of small share, previous year wind energy was the leading growing renewable
source of energy in EU and the USA. In Europe, the dynamics of offshore sector de-
velopment is strong and positive (Figure 5). Despite high capital costs and construc-
tion challenges, many European countries have high expectations of expanding off-
shore wind energy generation. At the end of 2015,cumulative installed capacity
reached 11,027.3 MW./7./

17
FIGURE 5. Cumulative and annual offshore wind installations by 2015 /7/
The total number of offshore wind farms in Europe including sites under construction
is 84. Approximate offshore wind energy generation is about 40.6 TWh in a normal
wind year, and this amount of electricity covers 1.5% of Europe’s total electricity con-
sumption./7./ As shown in the Table 2 total offshore wind installed capacity is 11,027
MW.
TABLE 2. Offshore wind energy installations at the end of 2015 per country /7/
Country BE DE DK ES FI IE NL NO PT SE UK Total
Number
of farms 5 18 13 1 2 1 6 1 1 5 27 80
Number
of turbines 182 792 513 1 9 7 184 1 1 86 1454 3230
Capacity
installed,MW 712 3295 1271 5 26 25 427 2 2 202 5061 11027
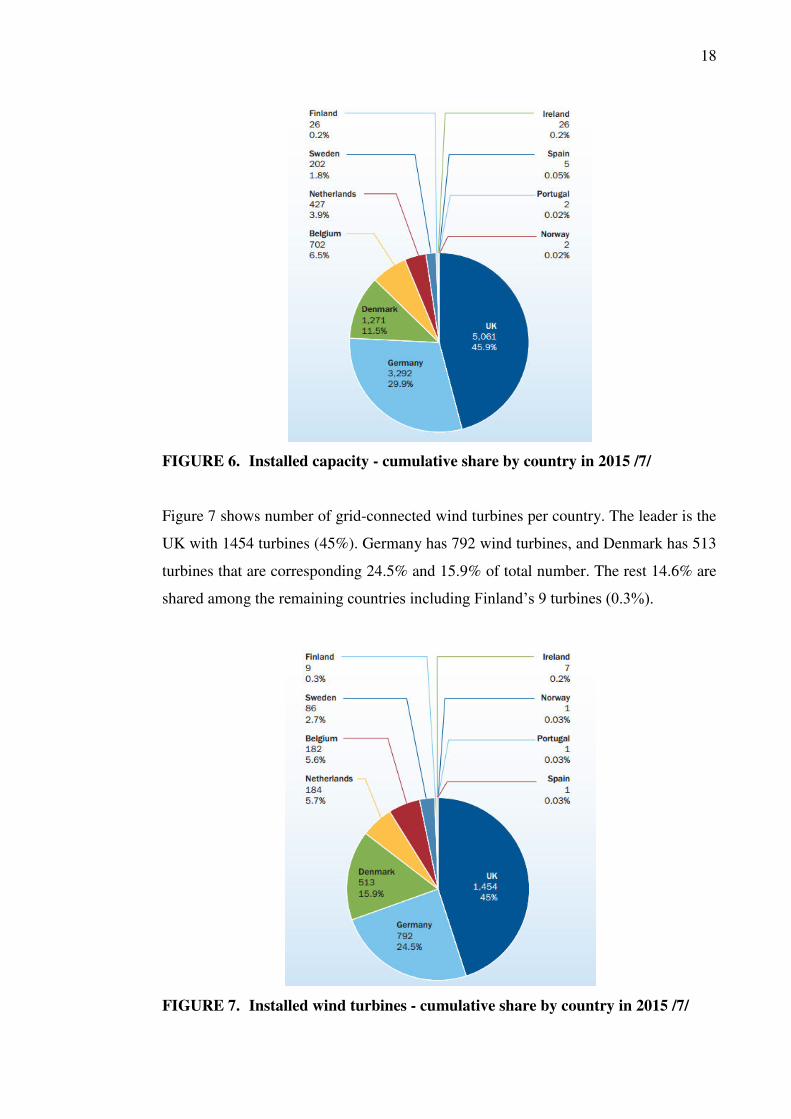
Figure 6 represents cumulative share of total installed capacity per country. The UK
has the largest share 45.9% that is almost a half of installed offshore wind capacity in
EU. Germany is the second with 29.9% of all installations. Denmark follows with
11.5%. The rest 13% of European installations are located in Belgium, the Nether-
lands, Sweden, Finland, Ireland, Spain, Norway, and Portugal. Finland’s 26 MW total
capacity represents only 0.2% of total number of installations in Europe.
18
FIGURE 6. Installed capacity - cumulative share by country in 2015 /7/
Figure 7 shows number of grid-connected wind turbines per country. The leader is the
UK with 1454 turbines (45%). Germany has 792 wind turbines, and Denmark has 513
turbines that are corresponding 24.5% and 15.9% of total number. The rest 14.6% are
shared among the remaining countries including Finland’s 9 turbines (0.3%).
FIGURE 7. Installed wind turbines - cumulative share by country in 2015 /7/

19
Cumulative share of installed capacity by sea basin is presented in Figure 8. Most of
the offshore wind farms are located in the North Sea - 69.9% or 7,656.4 MW capaci-
ties. 1,943.2 MW of installed capacity is installed in the Irish Sea, and 1,420.5 MW in
the Baltic Sea representing corresponding 17.6% and 12.9% of total share. 7 MW ca-
pacity or 0.1% belongs to the Atlantic Ocean.
FIGURE 8. Installed capacity, cumulative share by sea basin in 2015 /7/
Wind turbine capacity growth from 2010 to 2015 amounts 41.1%. From 2010 the av-
erage capacity of newly installed wind turbine was continuously growing, and it
reached 4.2 MW in 2015 (Figure 9).Overall, 754 offshore wind farms were under con-
struction in 2015. All the manufacturers deployed larger capacity offshore wind tur-
bines in comparison with previous 2014 year. Such positive development and im-
provement rates allow expecting sequential introduction of 6-8 MW turbines closer
towards 2018./7./

20
FIGURE 9. Average offshore wind turbine rated capacity in 2015 /7/
Top three of the largest operating offshore wind farms are located in the UK. At pre-
sent the largest offshore wind farm in Europe is London Array with 630MW capacity.
More detailed information about Europe’s largest offshore farms is given in the Table
3.
TABLE 3. Three largest offshore wind farms in Europe
Wind
farm
Total
(MW) Location
Number
of tur-
bines
Turbines
model
Commiss-
ioning
Date
Construction
cost, €
London
Array 630
North
Foreland,
Kent, Eng-
land, the UK
175
Siemens
SWT-3.6-
120
2012 2.2 billion
Gwynt y
Môr 576
North
Wales,
Wales, the
UK
160
Siemens
SWT-3.6-
107
2015 2.0 billion
Greater
Gabbard 504
Suffolk,
England, the
UK
140
Siemens
SWT-3.6-
107
2012 1.7 billion

21
In 2015, the average size of constructed wind farm was 337.9 MW, an 8.2% decrease
from the previous year (Figure 10)./7./ Although 576 MW Gwynt y Môr offshore
wind farm was completed, and 600 MW Gemini offshore wind farm was constructed,
the average site’s size was affected by prevailed number of small-scale288 MW off-
shore farms completed in Germany./5./
FIGURE 10. Average size of offshore wind farm projects in 2015/7/
Typically, offshore wind farms are built in shallow waters not far away from the coast
in order to minimize cables and foundation costs. The average water depth of site con-
struction was 22.4 m in 2014, and it increased to 27.2 m in 2015 (Figure 11).
The average distances from the coastline were 32.9 km and 43.3 km in corresponding
2014 and 2015 (Figure 11). An increase of the average distance from shore is ex-
plained by amount of projects carried in Germany. In Germany, offshore wind farms
are located further from the coast compared to other countries.

22
FIGURE 11. Average water depth and distance to shore of online, under con-
struction and consented wind farms in 2015 /7/
5.2 Northern conditions challenges
Cold climate conditions or Northern conditions refer to consistent lower air tempera-
tures compared to wind turbines’ normal operation temperatures and icing occurrence
possibility. In Europe several Nordic countries: Sweden, Norway, and Finland face
cold climate conditions. This chapter provides with information about Northern condi-
tions in general due to the lack of information on the subject of offshore wind.
Northern conditions are supposed to be challenging due to many reasons. Cold climate
is detrimental to wind farm effectiveness because it brings about lower energy produc-
tions, ice throw, increased noise level, and economical profit drop./8./
In addition, operation and maintenance durations increase, or in case of inaccessible
site service and maintenance can be even impossible. Down time is comparatively low
but still possible due to weather conditions. Apart from that, specific technology is
required to run a turbine at low air temperatures, so operational costs rise./8./

23
Icing events are possible to affect all wind farms located in North Europe. However,
local icing conditions vary a lot depending on topographical location. For example,
several sites located in Norway do not experience the same damaging effect as ones in
Lapland area even if they are located at the same latitude.
The Atlantic Ocean’s warm currents influence on Norwegian Sea temperature; hence,
it is comparatively warm in winters, and icing is unlikely to occur. On the contrary, in
Lapland, average air temperature drops below -13°C in winter /8/; thus, icing events
are inevitable to appear.
Icing impact depends on average height and altitude of wind farm area. The greater
average height and the altitude of a site terrain the worse icing conditions are ex-
pected. It should be noted that altitude makes a greater impact on icing conditions than
average height of a site area./9./
Despite evident disadvantages, wind farms have been built in cold climate conditions
all over the world since nineties. Furthermore, development and implementation of
Northern projects continue to grow. The main reason is plenty of sustainable wind
recourses.
Annual average wind speed reaches up to 8-10 m/s when offshore. According to O2
Vindkompaniet studies (currently OX2 - Swedish renewable energy oriented compa-
ny) 10 times more energy can be generated in cold climate conditions compared to
standard conditions. It means that if detriment due to icing events and low tempera-
tures will be neutralized, the great potential of wind resources will become unlocked.
5.2.1 Technology
In case of Northern location of a site, additional requirements must be met. Wind re-
sources estimation is an important subject in wind energy field. Therefore, measure-
ment devices: wind vanes and anemometers must be capable of performing precisely
during low temperatures, so they are typically equipped with heaters./9./
Ice prediction is highly important as well because icing events drastically affect power
performance. The current existing methods of ice estimations do not provide with

24
thorough information. Icing maps describing annual active icing time are used to ana-
lyze icing conditions./9./
Theoretical information from icing maps in combination with computer software al-
lows making better predictions of amount of icing on wind turbines’ rotor blades.
However, this is a very difficult method due to initial complexity of ice origins and
blades aerodynamics, so this solution is still under development and improvement.
In cold climate conditions, wind turbines are made of low temperature resistant mate-
rials. The most critical parts of turbine (gear box and pitch accumulator) must be en-
sured; therefore heaters are added. Special equipment such as ice detectors and anti-
icing (or de-icing) systems started to be developed.
5.2.2 Cold climate experiences in Finland
In Finland, all the existing wind farms are located in cold climate conditions although
severe icing events are typical basically for Lapland. Southern Finland has milder cli-
mate, so low temperature impact is generally lower. Yet in case of colder than average
winters installations all over the country are affected.
VTT Technical Research Centre of Finland provides with comprehensive wind energy
statistics publishing annual reports that contain information about the operation of
wind turbines and turbines down time./10./ There are available publications from 1999
to 2014 on the official website. 2015 yearly report and forthcoming reports will be
published by Finnish Wind Power Association./11./
As stated in the reports annual turbines availability decrease due to low temperatures
range from 0.2% and 2.8% since 1997 to 2010. Low temperatures in the period from
1997 to 2010 caused 1 to 27 shut down turbines per year. It is 10 turbines per year on
average. The average down time per turbine was amounted to 123 hours that refer to
1.4% of the annual operational hours./9./
The icing events during 1996 and 2010 resulted annual availability decrease per tur-
bine ranging between 0.3% and 4.1%. Average turbine’s availability was 114 hours

25
per year corresponding to 1.3% of annual operational hours. On average 16 turbines
per year (varying between 4 and 30) have been reported down time due to icing./9./

26
6 TAHKOLUOTO PROJECT
In 2007, EU set 2020 European climate and energy targets, which include
20% greenhouse gas emissions reduction (from 1990 levels),
20% generated energy from renewable sources,
20% improvement in energy efficiency. /1./
In order to reach these goals Finnish government set a strategy of developing wind
power sector. The government of Finland has high expectations about using offshore
wind energy, and as a result, Tahkoluoto (Pori 2) project was approved. In November
2014, the Ministry of the Employment and Economy of Finland contributed 20 mil-
lion euro investment aid when the total project’s cost is 120 million euro.
Tahkoluoto offshore farm is located in Gulf of Bothnia, the Baltic Sea./12./ Tahkolu-
oto offshore wind farm is the first offshore wind farm in Finland, and at the same time
it is the first offshore wind farm designed for icing conditions in the world.
The owner of offshore wind farm is Suomen Hyötytuuli Oy, Finnish company produc-
ing wind power. Siemens, a leading supplier of wind power solutions, provides with
the turbines and performs commissioning. Siemens is also responsible for service and
maintenance.
In 2010, Siemens installed one 2.3 MW capacity wind turbine to Suomen Hyötytuuli
Oy for the pilot project Pori 1 that is located 1.2 km off the Finnish coast near Pori.
Since then Pori 1 pilot project provides with information about offshore wind energy
generation in icing conditions. This pilot turbine will be surrounded by the 10 wind
turbines 4 MW capacity each of the Tahkoluoto wind farm./13./
Total offshore wind farm capacity 40 MW. Construction period starts in summer
2017, and completion is expected by autumn 2017. For the purpose of facing cold
climate conditions, resisting ice load in particular, Siemens designed gravity-based
steel foundations./13./
Tahkoluoto project is about to demonstrate that offshore wind power is a feasible so-
lution for Northern Baltic Sea region and Finnish land in particular. Toni Sulameri,

27
the Managing Director of Suomen Hyötytuuli Oy, said that conditions in Finland are
excellent for offshore wind power farm: a hard seafloor, long coastline, shallow wa-
ters, and great wind resources. The distance from the coastline is approximately 0.5-3
km, and the water depth range from 8 to 15 m./13./
An expected annual net power production exceeds 155 GWh. Owners said that off-
shore wind farm is supposed to produce enough power to supply 8,600 electrically
heated Finnish single-family houses with green energy.

28
7 ENERGY CONSUMPTION IN FINLAND
7.1 Electricity consumption in Finland
In Finland, electricity consumption drastically increased over the last 55years (Figure
12). In 1960, annual electricity consumption was about 8,800 GWh. In 2007, it
reached the greatest value of 55 years of data collecting –90,388GWh per year./14./
Although total annual electricity consumption slightly decreased to about 82,500
GWh by 2015, extreme cut-down of consumed electricity cannot be expected. Hu-
mans’ lifestyles and habits, appearance of new technologies, industry, and energy con-
sumption in general have dramatically changed since 60s. Therefore, the demand of
electricity is increasing worldwide.
FIGURE 12. Electricity supply and total consumption in Finland 1960-2015
(Source: Statistics Finland /14/)
As can be seen from the Figure 13 the greatest part of electricity consumption (45%)
belongs to industry. However, households have a significant influence on total elec-
tricity consumption as well. Firstly, because 26% of total consumed energy is used for
space heating. Secondly, because individual consumers can choose the energy source
they use.

29
FIGURE 13. Final energy consumption by sector 2014(Source: Statistics Finland
/14/)
The choice of environmentally friendly energy sources has a positive impact on total
primary energy supply. In Finland, government is concerned about increasing electric-
ity need, because it is also related to larger amount of green house gases emissions.
The curves on the Figure 14 represents relation between total energy consumption
growth and CO2 emissions.
FIGURE 14. Total energy consumption and CO2 emissions 1970-2014 (Source:
Statistics Finland /14/)

30
7.2 Heating energy consumption in residential buildings
Electricity generated by wind turbines can be effectively utilized in residential build-
ings to cover HVAC systems needs. Many elements of the HVAC systems need elec-
tricity to operate. For instance, electricity is essential for running electric heating sys-
tems, all kinds of pumps including heat pumps, or AHU. When HVAC systems are
selected equipment’s energy consumption should be carefully evaluated, because
high-energy consumption leads to greater operational costs and more expensive net
energy price to consumers.
According to Finnish guidelines and regulations, residential buildings are categorized
as detached houses, terraced houses, block of flats, and free-time residential buildings.
In residential buildings, the greatest part of heating energy consumption accrues to a
main heating system demand. The rest of consumed heating energy is divided between
additional heating systems, ventilation, domestic hot water, saunas, and heat distribu-
tion.
Statistics Finland reports that total energy consumption in residential buildings
amounted 55,576 GWh in 2014. Detached houses corresponded to 32,083 GWh, and
5,508 GWh of energy was consumed in terraced houses. Hereof, single-family house-
holds account for 37.591 GWh per year. 15,318 GWh accrues to block of flats, and
free-time buildings consumed 2,667 GWh in 2014. Total consumption of heating en-
ergy in residential buildings by source of energy is shown in Figure 15.
FIGURE 15. Consumption of heating energy in residential buildings 2014
(Source: Statistics Finland /14/)
31
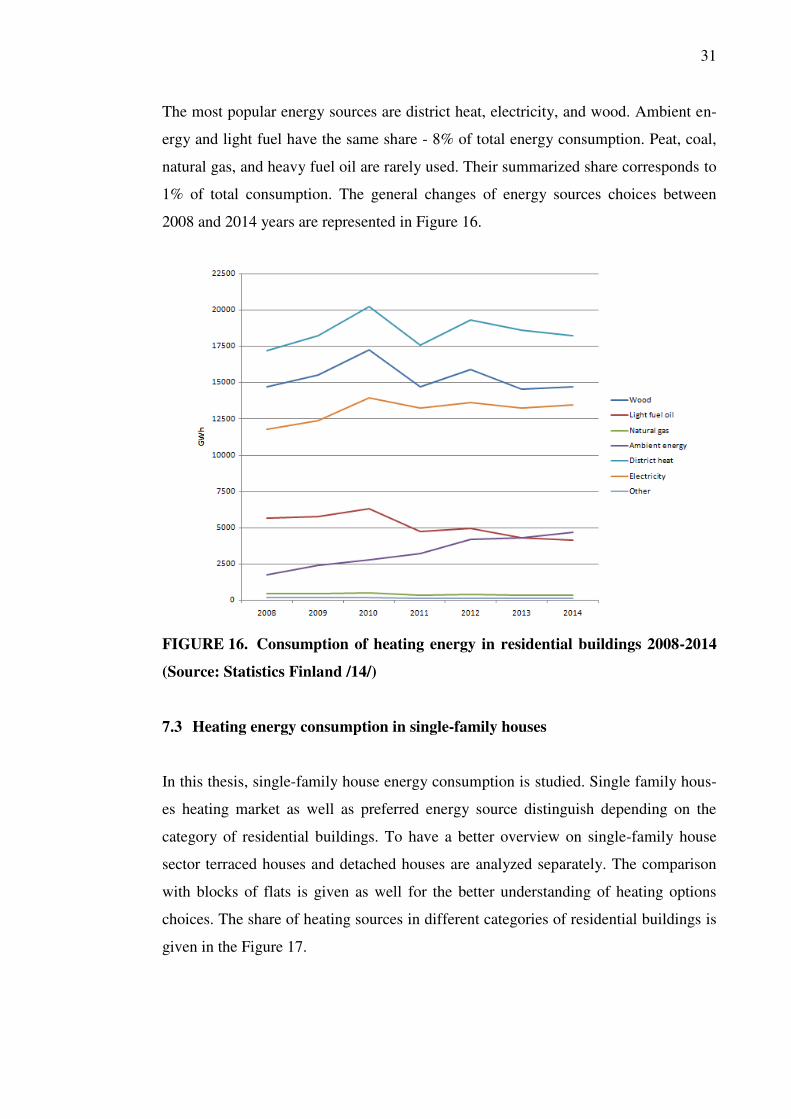
The most popular energy sources are district heat, electricity, and wood. Ambient en-
ergy and light fuel have the same share - 8% of total energy consumption. Peat, coal,
natural gas, and heavy fuel oil are rarely used. Their summarized share corresponds to
1% of total consumption. The general changes of energy sources choices between
2008 and 2014 years are represented in Figure 16.
FIGURE 16. Consumption of heating energy in residential buildings 2008-2014
(Source: Statistics Finland /14/)
7.3 Heating energy consumption in single-family houses
In this thesis, single-family house energy consumption is studied. Single family hous-
es heating market as well as preferred energy source distinguish depending on the
category of residential buildings. To have a better overview on single-family house
sector terraced houses and detached houses are analyzed separately. The comparison
with blocks of flats is given as well for the better understanding of heating options
choices. The share of heating sources in different categories of residential buildings is
given in the Figure 17.

32
FIGURE 17. Energy consumption in by source in 2014 (Source: Statistics Fin-
land /14/)
According to the latest statistics /14/, the most common heating source in residential
buildings is district heat, which represents 33% of total heating energy consumption
(Figure). However, the share is not equal for different categories. District heat is pre-
vailed energy source in blocks of flats (86%) and terraced houses (52%). On the con-
trast, it is accounted for only 6.6% of total heating energy consumption in detached
houses.
The second choice of heating energy source in residential buildings is wood (27%).
Again, the share is completely dissimilar if compared between different categories.
Unlike detached houses where wood is primary source of heating energy (nearly
40%), wood is scarcely ever in multistory residential buildings or blocks of flats (1%)
and terraced houses (3%).

33
The share of 24% corresponds to using electricity as heating energy in residential
buildings in general. Electricity is mostly consumed in detached and terraced houses
with corresponding shares of 39.8% and 32% of total heating energy consumption. In
blocks of flats, electricity is uncommon solution representing only 8%.
Electric heating of residential buildings includes direct electric heating, electric stor-
age heating, under floor heating, electric heating of domestic hot water and saunas.
Heat pumps electricity consumption also is taken into account. The rest part of con-
sumed energy relates to electricity needed for operation of heating systems and heat
distribution equipment.
Light oil fuels cover 7% of total heating energy consumption. The trend is degrading
use of light oils due to increase of fuels’ prices and high dependence on suppliers.
While the share remains significant in detached houses (10.2%) it occurs to be quite
small in terraced houses and blocks of flats (4%).
Ambient energy is energy that is extracted with heat pumps from the environment
(ground, air or water) for space heating. Ambient energy is almost never used in
blocks of flats, but it is becoming more and more popular energy source in single-
family houses sector, especially in detached houses. In 2014, ambient energy share
was accounted for 12.6% of total heating energy consumption in detached houses and
8% in terraced houses.
Other sources work out only 1% of total heating energy consumption. Other sources
include peat, coal and heavy oil. The used energy sources diverse in dependence to
building’s categories. For example, in detached houses the share of other sources con-
sists of peat, coal, and natural gas; in terraced houses - peat and natural gas; in blocks
of flats – peat, heavy oil, and ambient energy.
In single-family households, heat energy is mostly used for space heating, ventilation,
and water systems. Average single-family house heat demand is about 100-120
kWh/m2. Approximately 10,000-15,000 kWh of energy is used for space heating and
domestic hot water heating annually. In low energy houses, half of that amount is
needed to cover the heat energy demand. Passive houses consume only 20-30
kWh/m2 per year./15./

34
No doubt, the bigger the area of the building the more energy is needed to satisfy the
demands. Besides, energy consumption also depends on other factors like the way of
use, weather zone, buildings’ envelope tightness, U-values of constructions, designed
heating system, equipment efficiency, etc.

35
8 HEATING OPTIONS
In this chapter, the most typical heating options for single-family houses are discussed
providing with description of district heating, ground source heat pump, and electric
heating.
8.1 Electric heating
Electric heating include under floor heating systems, ceilings, and electric radiators.
Electric heating was the most popular heating option in 60s. The popularity can be
explained with relatively low capital costs and user friendliness. Since that time, elec-
tric heating market share has significantly gone down./15./ As shown in Figure 18
electric heating market breakdown prevailed 20% between 2000 and 2008.
FIGURE 18. The market share of heating systems in new small houses 2001-
2008(Source: Rakennustutkimus RTS Oy) /16/
The main reason of negative trend is high operation expenses compared to other heat-
ing modes. The increase of electricity demand and rising electricity costs are account-
ed for drop of popularity. Besides, introduction of new energy efficient heating sys-
tems like heat pumps had an impact on single-family market.

36
Electric heating systems are still beneficial option in case of building’s low energy
demands. Electric heating is probably the best solution to small area houses or passive
houses that require little amount of heating energy to satisfy the needs.
Another reasonable disadvantage of electric heating systems is poor environmental
impact due to emissions of CO2. Environmental impact is proportional to energy gen-
eration: the more energy is consumed the worse effect using of electric eating has on
environment.
For instance, based on Motiva Ltd 2009 statistics, a single-family house with annual
heating energy consumption 10,000 kWh produces 3.5 t of CO2 emissions per year
(Figure 19)./15./ The Figure also represents the fact that electrical heating is the worst
option from environmental point of view.
FIGURE 19. Average annual CO2 emissions of different heat sources of a single-
family house that consumes 10,000 kWh heat energy in a year. (Source: Motiva
Ltd 2009) /15/
However, from 2008 to 2014 heating energy consumption for electric heating increas-
es in residential buildings probably because of overall increased energy consumption
and colder than average winters.

37
FIGURE 20. Consumption of heating energy in residential buildings 2008-2011
(Source: Statistics Finland /14/)
8.2 District heating and CHP
District heating (DH) is centralized heating system, which provides large areas like
cities, quarters, or groups of buildings with heat. District heating system consists of
three main components (Figure 21):
1. Heat plant where heat is generated,
2. DH network, through which heat is delivered to consumers
3. Customer connection including DH substation (4) and metering center (5)./17./
FIGURE 21. District heating components /17/

38
Heat transfer media in DH systems is water. In Finland, low-temperature DH is used
in new buildings, so on secondary side, typical dimensioning temperatures of supply
and return water are 45-30ºC. In existing buildings, that were built in 60-70s, second-
ary side supply temperature range from 60ºC to 70ºC, and return temperature is 40ºC.
Real case supply temperatures depend on outdoor climate conditions. The relation
between supply temperature and outdoor air temperature is represented in a heating
curve: the lower air temperature is outside the higher district heating supply tempera-
ture is.
Supply water temperature from a plant (primary side) range from 65 to 120ºC, alt-
hough the highest possible supply water temperature cannot exceed 115ºC due to dis-
tribution losses. Return water temperature from a consumer must be at least 25 ºC and
cannot be higher than 65ºC.
District heat can be produced in conventional power plants, combined heat and power
(cogeneration heat and power) plants CHP and boiler plants HOB. Figure 22 illus-
trates schemes of power plant (P) and combined heat and power plant (CHP).
FIGURE 22. Conventional power plant and Combined Heat and Power plant
/17/
1. Steam boiler
2. Turbine
3. Generator
4. Condenser
5. Losses in condense

39
6. DH heat exchanger
7. DH network
In convectional power plant thermal energy generated in steam boilers is turned into
mechanical energy to rotate generator’s blades, this energy is converted to electricity.
High temperature steam must be cooled down in condenser and condensed steam is
returned back to boilers. Steam is cooled down in cooling towers, rivers or lake, so
thermal energy is wasted in the environment.
Combined heat and power plant produces both electricity and heat. Thermal energy is
recovered and used for district heating. Cogeneration is commonly used in Finland.
Three quarters of thermal energy is produced in CHP./19./DH production in 2010 was
38.6 TWh and share of CHP was 27.2 TWh, representing more than 70% of total heat
production (Figure 23).
FIGURE 23. Production of district heat 1970-2015* (*preliminary) (Source:
Finnish Energy Industries) /19/
Cogeneration makes district heat a very beneficial source of heating energy. The ad-
vantages are energy efficiency, environmental friendliness, economy and reliable op-
eration. CHP achieves 80-90% efficiency when conventional power plant reaches only
35-40%. In Finland district heating is highly reliable - 99.98%, it means that CHP
operate without interruption during heating season./19./

40
Economy can be explained with high level of automation and minimised number of
staff required. Besides using less fuel in cogeneration, CHP provides saving the
amount of energy corresponding to over 20 per cent of Finland’s fossil fuel consump-
tion annually./19./
High efficiency of CHP makes possible significant reduction of consumed fuel. Less
consumption leads to green house gas emissions decrease, therefore CHP is consid-
ered to be environmentally acceptable.
District heating is the most popular form of heating in Finland. Figure 24 represents
the growth of district heat use between 1972 and 2014 years. District heating is the
most common option in urban areas or density built areas. As district heating network
is the most expensive part of the system in may not be available in remote villages or
places. So detached houses located far away from the cities may not be connected to
DH network. Although about 48 % of Finnish population are connected to DH. In
2008 only 14% of single-family houses were supplied with heating energy by DH.
FIGURE 24. District heating by consumers 1972-2014 (Source: Statistics Fin-
land /14/)

41
8.3 Heat pumps
Heat pump is a device that transfers thermal energy from low-temperature heat source
to space with higher temperature. It can operate as a heating device in winter and as a
cooling device in summer.
Heat pump’s operation is opposite to a mechanical-compression cycle of refrigeration
system. As a cooling machine heat pump, consist of compressor, condenser, evapora-
tor, and expansion valve. It takes the heat from surroundings and transfers it to
space./20./
Heat pump can take the heat from:
outdoor air,
exhaust air (from buildings),
ground heat (from rock or soil),
solar energy,
seawater (surface water or deep water),
ground water,
sewage, and
waste energy (from industrial processes)./20./
Depending on the type of heat, source heat pumps are air, ground, exhaust air, and
water source heat pumps. In this chapter ground source heat pump (GSHP) will be
discussed as it is the most popular solution for space heating in detached and terraced
houses. Application of GSHP in detached houses has grown since 2000s due to in-
creased prices of electricity and oil (Figure 25)./15./

42
FIGURE 25. Heat pumps of detached houses in Finland between 1976 and
2008/15/
GSHP is highly efficient because it takes heat from ground or groundwater that has
relatively constant temperatures during all year round. Performance of the GSHP de-
pends on the season, COPs is about 3.0 during heating season and it is little bit lower
in summer. GSHP effectiveness and performance are improved with larger areas of
houses. If area is more than 150 m2
, GSHP is probably the best solution
GSHP installation costs are mainly higher than other heat pumps due to drilling of
boreholes for vertical installation or the digging of trenches for horizontal installation.
However, GSHP is considered to be a cost-effective option because of low operational
costs. It usually pays back during whole life cycle that is about 15-20 years.
GSHP is considered to be renewable source of energy because it utilizes ambient en-
ergy. At the same time, GSHP requires electricity to run a compressor, so operational
costs are in direct relation with electricity costs. Environmental impact depended on
method of electricity generation.
If the COP of GSHP is 3 it CO2 emissions can be roughly estimated. For instance, a
house consuming 10,000 kWh for heating creates 0.7 to 1.3 tons of CO2 depending on
the multipliers used./16./

43
9 SIMULATIONS OF ENERGY CONSUMPTION IN SINGLE-FAMILY
HOUSE
9.1 Simulation model
Studied building is one-storey single-family house with the net heated area 138 m2.
The floor layout is given in the Appendix 1. Volume of the house is 414.2 m3. The
facade of the building is oriented to North. The building is located in Pori, weather
zone I. The assumed climate data is Helsinki – Vantaa 2012 reference weather data,
because Pori is located in the same weather zone as Helsinki. Figure 26 shows simula-
tion model.
FIGURE 26. Single-family house
The chosen structures of the building are typical for wooden single-family house in
Finland. Building’s structures: walls, roof, floor, doors, and windows are taken in ac-
cordance with Finnish National Building Code D3 in such way that calculated by the
program U-values don’t exceed the required values./21 p.13./ Thermal bridges are
taken from the Table 3.1 in Finnish National Building Code D5./22 p. 17./ Leakage air
is calculated in accordance with D3./21 p. 19./
Sizes of windows and doors are taken from the drawing. Shading and solar radiation is
neglected. Heating system is an under floor heating. Maximum supply water tempera-
ture is 40 °C. As stated in Table 6.2 /22 p. 40/ under floor heating efficiency η=0.85;
hence, distribution heat losses to zones amounts to 15%. There is no cooling demand
in this simulation. Heat recovery efficiency is at least 45% based on D3 guidelines./21
p. 15./

44
9.2 DH simulation
Figure 26 shows generator efficiencies used in district heating simulation.
FIGURE 27. Generator efficiencies of district heating
Following Table 4 represents delivered energy overview, and Figures 27 and 28 show
delivered and primary energy per months.
TABLE 4. Delivered energy overview of district heating
FIGURE 28. Monthly delivered energy

45
FIGURE 29. Monthly primary energy
9.3 GSHP simulation
Average temperature of the heat collection returning pipe (in bore hole) is +3°C. Gen-
erator efficiencies are shown in Figure 30.
FIGURE 30. GSHP generator efficiencies
Delivered energy overview is given in the Table 5; Figures 31 and 32 show corre-
sponding monthly delivered and primary energy.
TABLE 5. Delivered energy overview of GSHP

46
FIGURE 31. Monthly delivered energy
FIGURE 32. Monthly primary energy
9.4 Electric heating simulation
Generator efficiencies for the third simulation are shown in Figure 33.
FIGURE 33. Generator efficiencies of electric heating

47
Delivered energy overview is given in the Table 6; Figures 34 and 35 show corre-
sponding monthly delivered and primary energy.
TABLE 6. Delivered energy overview of electric heating
FIGURE 34. Monthly delivered energy
FIGURE 35. Monthly primary energy

48
9.5 Results analysis
According to Finnish National Building Code D3 /21 p.9./ E-value for a single-family
house with net heated area 138.0 m2 must not exceed 178.8 kWh/m2. Comparison of
obtained results is given in the Table 7.
TABLE 7. Comparison of different heat sources
Heating system E-value,
kWh/m2
Delivered energy,
kWh
Primary energy,
kWh
District heating 157.7 24705 21769
GSHP 137.3 11148 18953
Electric heating 289.3 23485 39924
Energy simulation shows that ground source heat pump is the most effective heat
source with lowest primary energy demand. When district heat is consumed, E-value
also meets the requirements although the amount of delivered energy is higher. Elec-
tricity, as the heating source, is the worst solution: E-value is not satisfactory, so
buildings improvements are necessary to compensate high energy consumption, and
primary energy is the greatest compared to other options.

49
10 ENERGY COSTS AND GHGE CALCULATIONS
The source of energy prices is Statistics Finland. /14./ District heating prices refer to
average price EUR/MWh for a standard detached houses (600 m3, 18 MWh/a) in
2015. The charges include energy charges and fixed charges (demand charges) with
taxes (value added tax, excise duties on fuels).
The electricity prices are tax-inclusive averages weighted by the sales volumes of lia-
ble electricity retailers. Statistics Finland provides with average prices per month
(c/kWh); however, for convenience of calculations annual average price of electricity
is used.
The electricity prices differ by consumer: in 2015 for detached house with direct elec-
tric heating (18,000 kWh/a) electricity cost 12.68 c/kWh, and for detached house,
partly accumulating electric heating (20,000 kWh/a), electricity price is 11.89 c/kWh.
Table 8 represents energy costs calculations per year.
TABLE 8. Annual energy costs (2015 prices)
Heating system Delivered energy, kWh Energy price,
EUR/kWh
Energy cost
per year, EUR
District heating 24705 0,08417 2079
GSHP 11148 0,1189 1325
Electric heating 23485 0,1268 2978
Comparison of annual costs shows that GSHP seems to be the cheapest alternative,
while electricity is about 2.2 times more expensive than GSHP. District heating is
comparatively good solution, but still costs are approximately 1.6 higher than GSHP.
Table 9 presents approximate green house gas emissions of a single-family house. It is
assumed that district heat is produced in CHP, and district heating annual efficiency
η=0.94. For GSHP and electric heating efficiencies are COP=3.1 and COP=1 respec-
tively.
Emission factor for electric heating is 400 gCO2/kWh /23/, and average emission fac-
tor for DH (combined heat and power generation) is 183 gCO2/kWh./24./ The life

50
cycle CO2 emissions from offshore wind energy turbine is very low, it is about 12
gCO2eq/kWh of generated energy./25./
TABLE 9. CO2 emissions calculations
Heating
system
Delivered
energy,
MWh
CO2 emissions,
kg CO2/MWh
CO2 emissions,
kg CO2
Offshore
wind,
kg CO2
CO2 reduc-
tion,
kg CO2
District
heating 24,705 183 4810 - -
GSHP 11,148 400 1438 134 1305
Electric
heating 23,485 400 9394 282 9112
According to the estimated values, GSHP is the most environmentally safe source of
heat. District heat is also a good option, whereas electric heating is unacceptable in
terms of CO2 emissions. Offshore wind farm generates the necessary amount of ener-
gy producing very little quantity of carbon dioxide over the whole life cycle of a tur-
bine. Theoretically, if instead of conventional electricity, energy generated by offshore
wind turbines will be used, vast amount of carbon dioxide can be reduced.

51
11 DISCUSSION AND CONCLUSION
The main aim of the thesis was to find out how offshore wind energy can be used in
single-family houses in Finland. This study was designed to analyze offshore wind
feasibility in Finland exposing all the positive and negative aspects. To answer re-
search questions different literature sources were examined; finally, social, economi-
cal, and environmental benefits were discovered that proved sustainability and great
potential of energy generated offshore.
The analysis of energy consumption of single-family houses showed that offshore
wind energy is sufficient source of energy and can be used to cover space heating
needs in Pori, Finland. Therefore, greater offshore wind energy development and de-
ployment can be expected in the near future.
Simulation part showed that the most clean and cost-efficient heat source is GSHP. So
growing application of GSHP makes sense, since it is the best solution for newly-build
detached single-family houses: it is environmentally friendly, energy-efficient, and
cost-saving heat source.
District heating can be potentially clean. An ecological aspect relies on the fuel of
district heat production. As the cogeneration is highly spread in Finland, district heat
is assumed clean and safe energy source. Obviously, district heat is the perfect option
in places where DH distribution network exists: district heat is cheap, reliable, and
safe option. The problem is that very small percentage of detached housed are con-
nected to DH network.
Electric heating is the worst choice due to all the examined factors: energy demand is
too great, costs are higher, and CO2emissions are impressive. However, there are still
many remote households that rely on electric heating.
In such a case, offshore wind energy may come in handy. Unfortunately, there was no
possibility to estimate generated electricity output of the wind farm, but relying on the
owner’s investigation Tahkoluoto offshore wind farm capacity is sufficient to cover a
significant part of energy demand and provide households near Pori with green and
inexhaustible energy.

52
In this thesis, approximate calculations of diminishing CO2 emissions were made, but
even such rough results stated that offshore wind energy makes measurable contribu-
tion to GHGE reduction.
As for possible environmental drawbacks, it is still complicated to make conclusions
about. Available data is too contradictive and unclear, so more studies must be carried
out. At present moment, disadvantages are not so drastic, so they are assumed to be
neglected.
Although offshore wind energy is more expensive than other sources of energy, it is
beneficial renewable energy source. Most of the economical advantages have a long
termed-effect that may not be evident at the start of the project. However, the ad-
vantages are worth of efforts and costs, because they include not only environmental
issues, but also touch upon social, economical, and geopolitical problems. Moreover,
offshore wind energy has a potential to become cost-competitive in near future.
Finally, greater offshore wind energy application is to be expected worldwide. In Fin-
land, offshore wind energy generation experiment has only started with construction
of Tahkoluoto offshore wind farm that seems to be promising in many ways. It is ex-
pected to not only reduce harmful impact of GHGE, but also create a sustainable
source of clean electricity in Pori region that would satisfy the heat energy demands
and keep electricity prices from rapid growth.

53
BIBLIOGRAPHY
1. European commission. 2020 climate & energy package. WWW document.
http://ec.europa.eu/clima/policies/strategies/2020/index_en.htm. Updated 19.11.2016.
Referred 25.11.2016.
2. The Open University. Can renewable energy power the world? Week 6: Wind en-
ergy. 6.8 Offshore wind energy. WWW document.
http://www.open.edu/openlearn/ocw/mod/oucontent/view.php?id=18928&printable=1
#section9. Updated 25.11.2016. Referred 25.11.2016.
3. European Wind Energy Association (EWEA). Wind Energy – The Facts: A Guide
to the Technology, Economics and Future of Wind Power. London. Routledge. 2009.
4. Krohn,Søren et. als. European Wind Energy Association. The Economics of Wind
Energy. 2009. PDF document.
http://www.ewea.org/fileadmin/ewea_documents/documents/00_POLICY_document/
Economics_of_Wind_Energy__March_2009_.pdf. Referred 25.11.2016.
5. EY. Offshore wind in Europe. Walking the tightrope to success. 2015. PDF docu-
ment.
http://www.ewea.org/fileadmin/files/library/publications/reports/EY-Offshore-Wind-
in-Europe.pdf. Referred 25.11.2016.
6. REN21. Renewables 2016 Global Status Report. 2016. PDF document.
http://www.ren21.net/wp-content/uploads/2016/06/GSR_2016_Full_Report.pdf. Re-
ferred 25.11.2016.
7. Ho, Andrew et als. European Wind Energy Association. The European offshore
wind industry key trends and statistics 2015. PDF document.
http://www.ewea.org/fileadmin/files/library/publications/statistics/EWEA-European-
Offshore-Statistics-2015.pdf. Referred 25.11.2016.
8. Finnish Meteorological Institute. Temperature and precipitation statistics from
1.961 onwards. WWW document. http://en.ilmatieteenlaitos.fi/statistics-from-1961-
onwards. Updated 25.11.2016. Referred 25.11.2016.
9. Ronsten, Göran et als. IEA Wind. IEA Wind Task 19. State-of-the-Art of Wind
Energy in Cold Climates. 2012. PDF document.
http://www.tuulivoimayhdistys.fi/filebank/197-
Task19_SotA_WEinCC_2012_approved.pdf. Referred 25.11.2016.

54
10. VTT Technical Research Centre of Finland Ltd. Wind Energy Statistics in Fin-
land. WWW document. http://www.vtt.fi/proj/windenergystatistics/. Updated
25.11.2016. Referred 25.11.2016.
11. Finnish Wind Power Association. WWW document.
http://www.tuulivoimayhdistys.fi/en/. Updated 25.11.2016. Referred 25.11.2016.
12. Suomen Hyötytuuli Oy. Tahkoluoto Offshore Wind Power Project. WWW docu-
ment.http://hyotytuuli.fi/en/tuulipuistot/tahkoluoto-offshore-wind-power-project/. Up-
dated 25.11.2016. Referred 25.11.2016.
13. Siemens. Siemens to supply wind turbines to first Finnish offshore wind
farm.WWW document. https://www.siemens.com/press/PR2016010144WPEN.
Updated 27.01.2016. Referred 25.11.2016.
14. Statistics Finland. WWW document . http://www.stat.fi/index_en.html. Updated
25.11.2016. Referred 25.11.2016.
15. Pippuri, Paula. Heating mode choices of Finnish households and the Energy Par-
adox. Master’s Thesis. Aalto University School of Economics. 2012. PDF document.
http://epub.lib.aalto.fi/en/ethesis/pdf/12750/hse_ethesis_12750.pdf. Referred
25.11.2016.
16. Motiva Ltd. Choice of Heating System. WWW document.
http://www.motiva.fi/en/building/choice_of_heating_system. Updated 25.11.2016.
Referred 25.11.2016.
17. Tuunanen, Jarmo. District Heating. 2014. PDF document.
https://moodle.xamk.fi/pluginfile.php/459443/mod_resource/content/1/District%20He
ating%20_%202014_Eng_2.pdf. Referred 25.11.2016.
18. Statistics Finland. Energy supply and consumption. WWW document.
http://www.stat.fi/til/ehk/2015/04/ehk_2015_04_2016-03-23_kuv_018_en.html. Up-
dated 25.11.2016. Referred 25.11.2016.
19. Finnish Energy Industries. Combined Heat and Power Production. PDF docu-
ment. https://moodle.xamk.fi/pluginfile.php/459512/mod_resource/content/1/chp-
esite%28pdf-tiedosto%29.pdf. Referred 25.11.2016.
20. Nilsson, Per Erik. Achieving the Desired Indoor Climate: Energy Efficiency As-
pects of System Design. Sweden. Studentlitteratur (SW). 2003.
21. D3 Suomen rakentamismääräyskokoelma Ympäristöministeriö, Rakennetun
ympäristön osasto. Rakennusten energiatehokkuus Määräykset ja ohjeet 2012.

55
22. D5 Suomen rakentamismääräyskokoelma. Ympäristöministeriö, Rakennetun
ympäristön osasto. Rakennuksen energiankulutuksen ja lämmitystehontarpeen
laskenta. Ohjeet2012.
23. Climate Guide. Climate effects on heating buildings. WWW document.
http://ilmasto-opas.fi/en/ilmastonmuutos/hillinta/-/artikkeli/73fa2827-42d1-4fd7-
a757-175aca58b441. Updated 25.11.2016. Referred 8.12.2016.
24. Motiva Ltd. CO2-päästökertoimet. WWW document.
http://www.motiva.fi/taustatietoa/energiankaytto_suomessa/co2-
laskentaohje_energiankulutuksen_hiilidioksidipaastojen_laskentaan/co2-
paastokertoimet. Updated 25.11.2016. Referred 8.12.2016.
25. Thomson, Camilla. Climate exchange. Assessing the life cycle costs and carbon
emissions of wind power. WWW document.
http://www.climatexchange.org.uk/reducing-emissions/assessing-life-cycle-costs-and-
carbon-emissions-wind-power/. Updated 25.11.2016. Referred 25.11.2016.

APPENDIX 1.
Floor layout