office of continuous quality improvement james t. yoe, phd, director
TRANSCRIPT
Office of Continuous Quality Improvement
James T. Yoe, PhD, Director
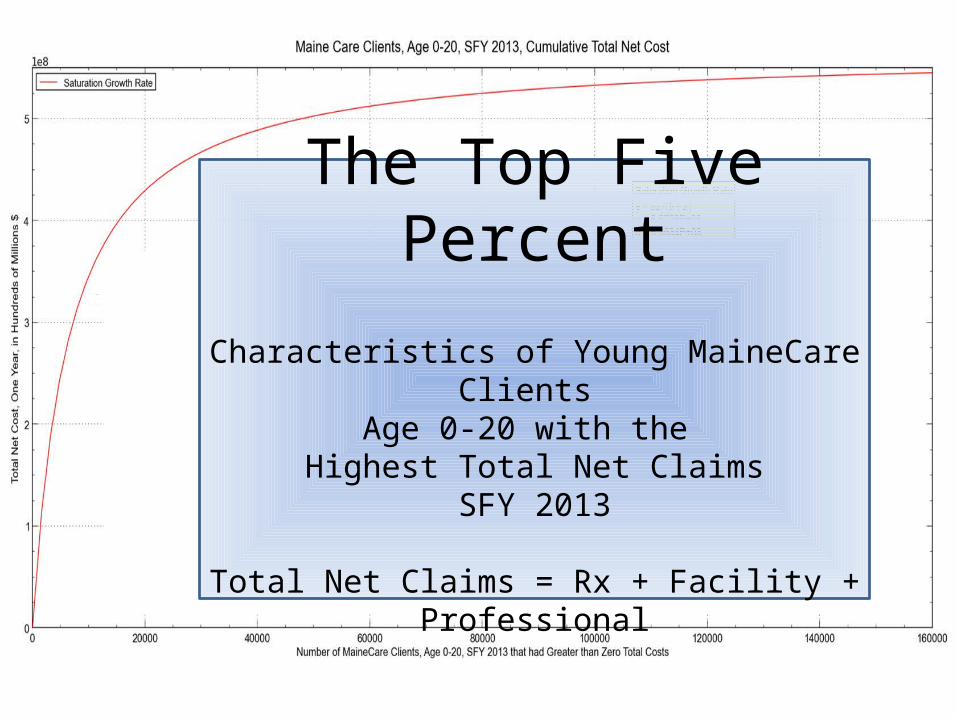
The Top Five Percent
Characteristics of Young MaineCare Clients Age 0-20 with the
Highest Total Net ClaimsSFY 2013
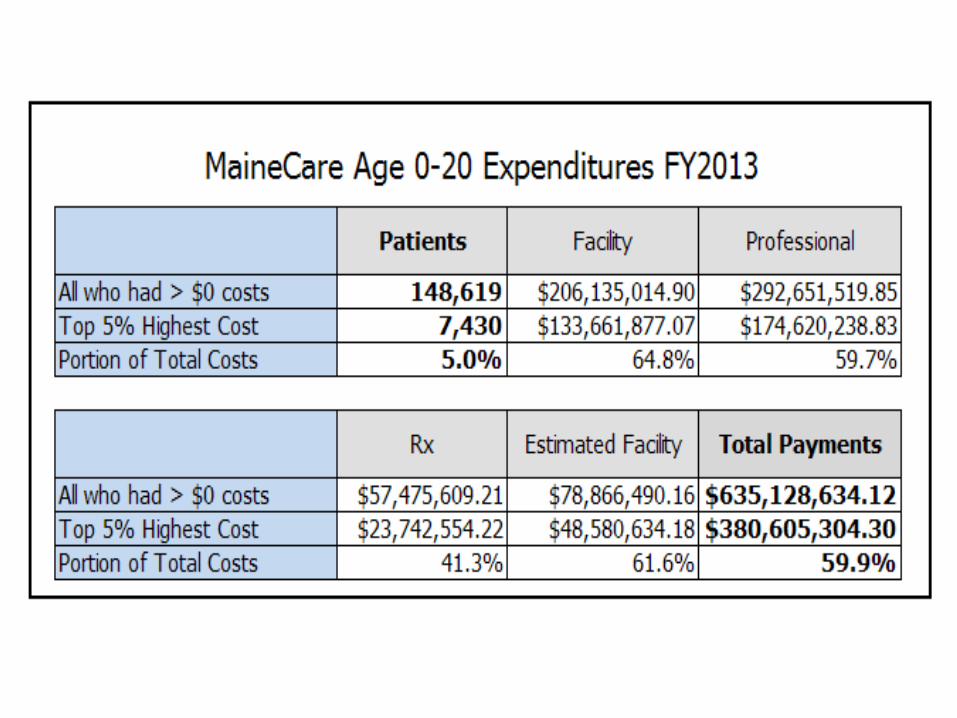
Total Net Claims = Rx + Facility + Professional
The Data Analytics GroupRaymond G. Taylor, PhD, Director
Kirk B. Duplessis, MSJerrold Melville, MSW, MPA
Ming Rawstron, MD, PhD
Patients Claims
5%
59%
95%
41%
Everybody Else Top 5%
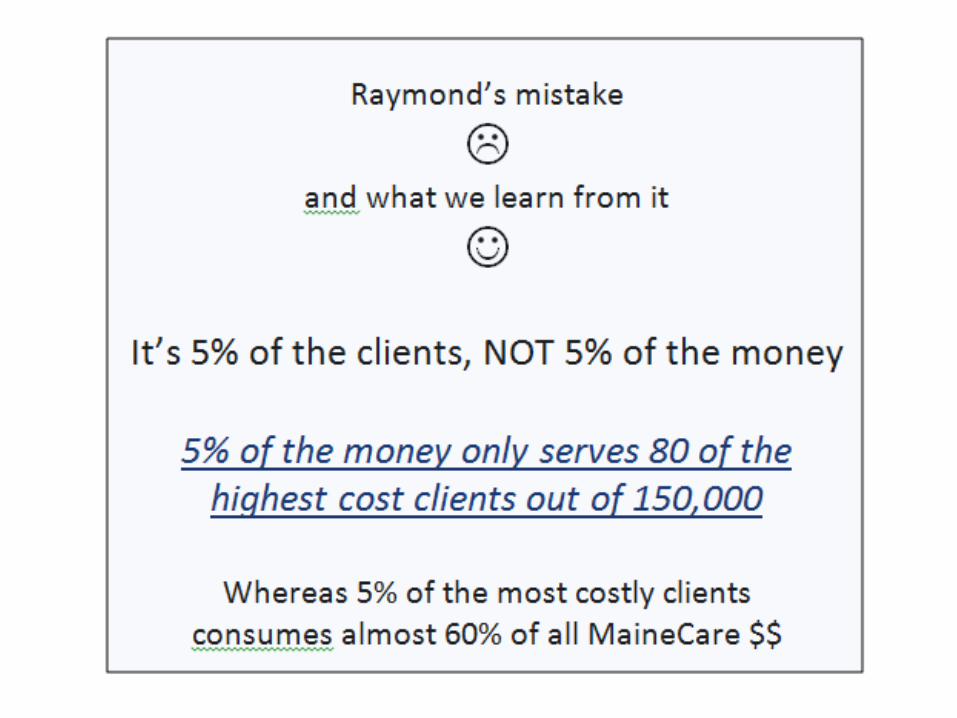
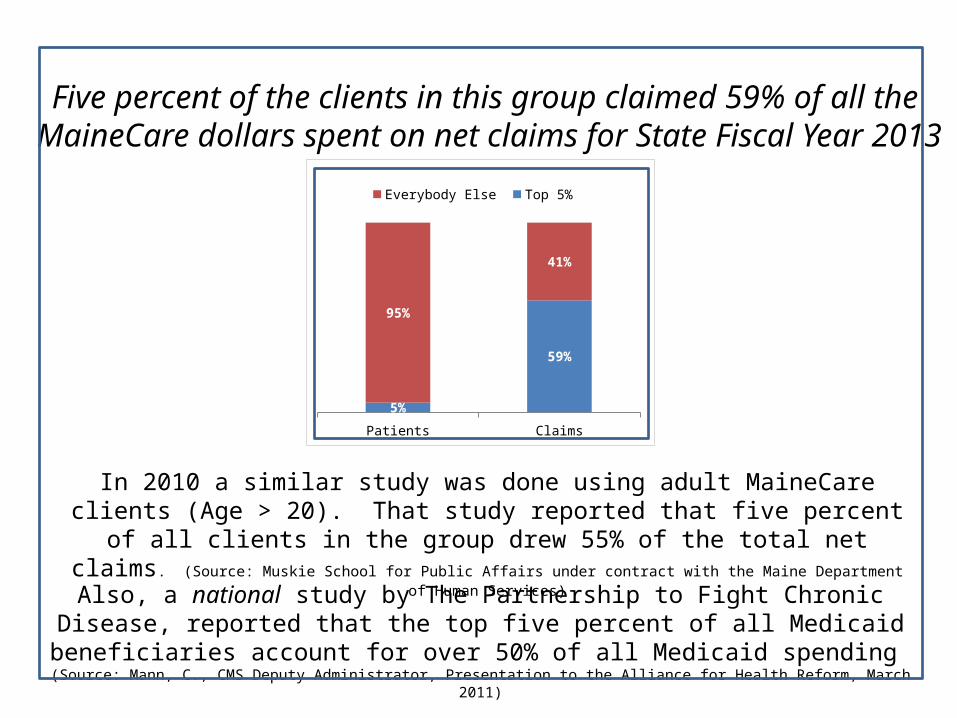
Five percent of the clients in this group claimed 59% of all the MaineCare dollars spent on net claims for State Fiscal Year 2013
In 2010 a similar study was done using adult MaineCare clients (Age > 20). That study reported that five percent of all clients in the group drew 55% of the total net claims.
(Source: Muskie School for Public Affairs under contract with the Maine Department of Human Services)
Also, a national study by The Partnership to Fight Chronic Disease, reported that the top five percent of all Medicaid beneficiaries account for over 50% of all Medicaid spending
(Source: Mann, C., CMS Deputy Administrator, Presentation to the Alliance for Health Reform, March 2011)
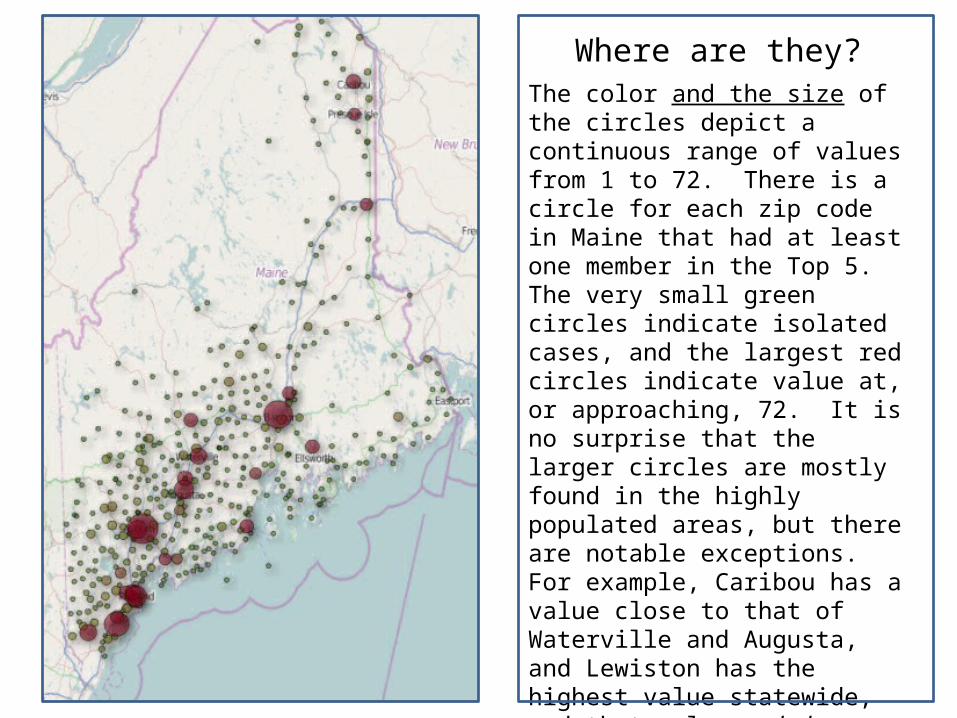
The color and the size of the circles depict a continuous range of values from 1 to 72. There is a circle for each zip code in Maine that had at least one member in the Top 5. The very small green circles indicate isolated cases, and the largest red circles indicate value at, or approaching, 72. It is no surprise that the larger circles are mostly found in the highly populated areas, but there are notable exceptions. For example, Caribou has a value close to that of Waterville and Augusta, and Lewiston has the highest value statewide, and that value excludes Auburn which can be seen inside the Lewiston circle. Note also that the values for Houlton, Presque Isle, Ellsworth, Skowhegan, Old Town, Machias, Saco, Biddeford, among others, are high.
Where are they?
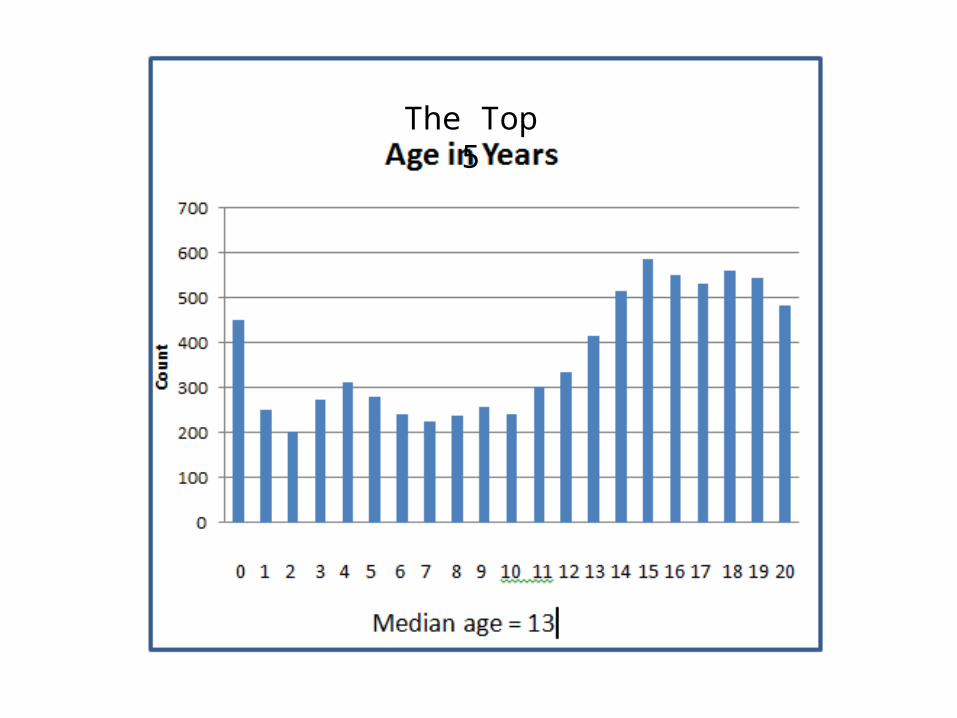
The Top 5
F 49% M 51%
GENDER Male and Female almost exactly equal in terms of
the number of clients in The Top 5
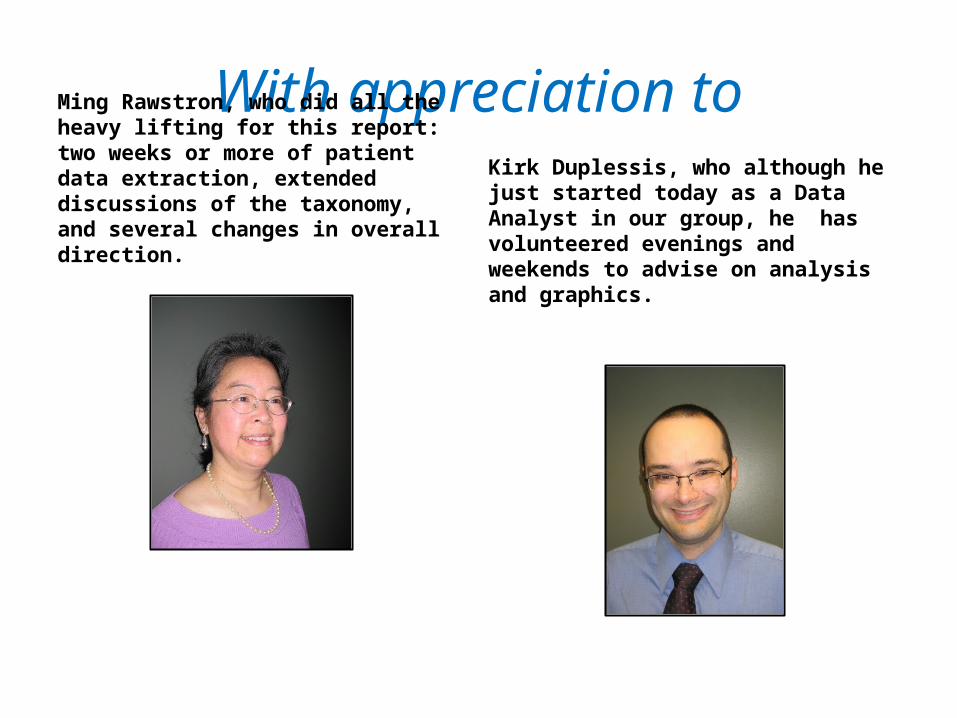
With appreciation toMing Rawstron, who did all the heavy lifting for this report: two weeks or more of patient data extraction, extended discussions of the taxonomy, and several changes in overall direction.
Kirk Duplessis, who although he just started today as a Data Analyst in our group, he has volunteered evenings and weekends to advise on analysis and graphics.
raymond.g.taylor@ maine.gov
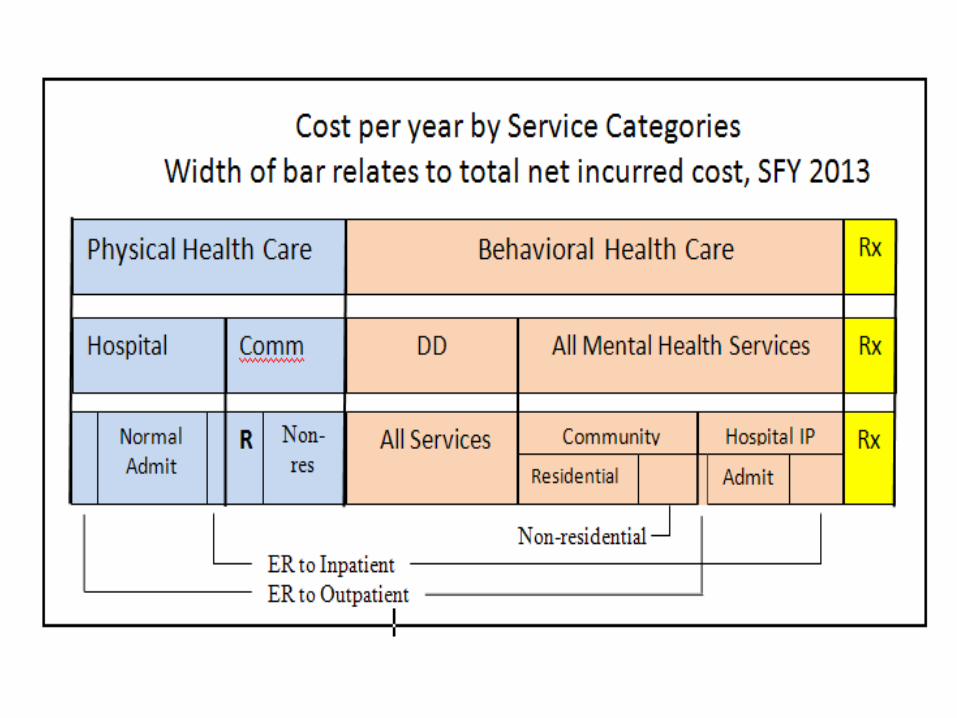
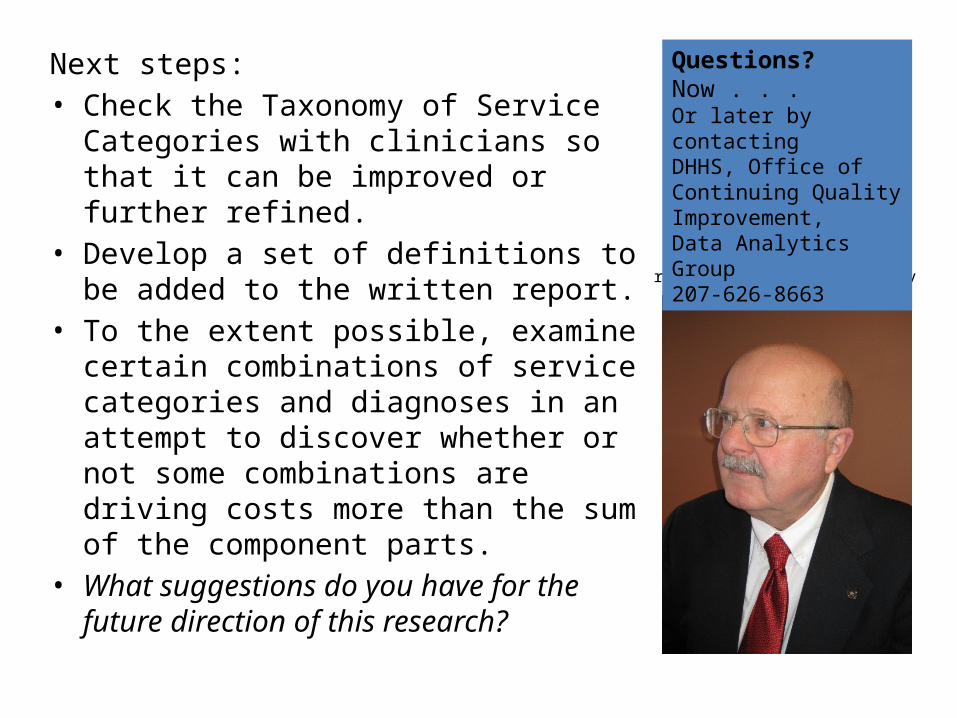
Next steps:• Check the Taxonomy of Service Categories
with clinicians so that it can be improved or further refined.
• Develop a set of definitions to be added to the written report.
• To the extent possible, examine certain combinations of service categories and diagnoses in an attempt to discover whether or not some combinations are driving costs more than the sum of the component parts.
• What suggestions do you have for the future direction of this research?
Questions?Now . . .Or later by contactingDHHS, Office of Continuing Quality Improvement,Data Analytics Group207-626-8663