office market report - q1 2010
DESCRIPTION
The Cleveland office market gained momentum and enjoyed its first vacancy decrease since 2008 reaching 11.91%, although high in comparison to 2009 when rates stood at 11.55%, but low in comparison to 2008 levels, when rates stood at 11.98%. Northeast Ohio’s vacancy rate stood below the national average of 15.80% in quarter four by 389 bps according to Colliers International. Demand for office space slightly picked up, represented by more than 87,000 square feet (sf) demanded back by the market, first positive since 2008. Asking rental rates closed at a three-year high at $17.14 per square foot (psf).TRANSCRIPT
The Cleveland office market gained momentumand enjoyed its first vacancy decrease since 2008reaching 11.91%, although high in comparisonto 2009 when rates stood at 11.55%, but low incomparison to 2008 levels, when rates stood at11.98%. Northeast Ohio’s vacancy rate stoodbelow the national average of 15.80% in quarterfour by 389 bps according to ColliersInternational. Demand for office space slightlypicked up, represented by more than 87,000square feet (sf) demanded back by the market,first positive since 2008. Asking rental ratesclosed at a three-year high at $17.14 per squarefoot (psf).
Investment Markets - The investment sectorfundamentals mirrored similar trends with adecrease in its vacancy rate to register 13.75%, 6bps lower than year-end 2009 and 54 bps higherthan this time last year. Overall demand was pos-itive, with a net of more than 53,000 sf demand-ed by the market.
Rental Rates - At the closing of the quarter,regional rental rates increased to register $17.14psf, up 57 bps from this time last year. Theregion’s investment subset rates slightly increasedto register $17.09 psf, up 50 bps from this timelast year. Most of the office classes recorded anincrease in the asking rental rates from the previ-
ous quarters: Class A space increased to register$21.19 psf, Class B increased to register $16.62psf, and Class C stood at $13.54 psf.
Downtown and Prime Space – Downtownvacancy rates declined 41 bps from quarter fourto register 15.83%, largely attributed to RosettaMarketing Group lease of 80,000 sf. The askingrental rates increased to register $17.85, markinga three-year high. Class A downtown space stabi-lized to register 13.47%. More than 1 million sf ofprime office space is available at an average ask-ing rate of $20.67 psf.
Construction and Development – The currenteconomic environment combined with a declinein construction inquiries and difficulties inobtaining financing for projects continue tointerfere and slow down the commercial con-struction and development activity in the region.
There were no completions in the first quarter.Office construction activity continued to declinewith approximately 16,000 sf currently in thepipeline; ongoing construction is still fully basedin the suburbs. According to the Fourth DistrictBeige Book Report dated 03/03/2010, most of therespondents expect commercial and industrialconstruction activity to be very weak through2010.
MARKET INDICATORS
VACANCY
NET ABSORPTION
RENTAL RATE
UPDATEAVG. DIRECT ASKING RATES BYBUILDING CLASS (FULL SERVICE)
COLLIERS OSTENDORF-MORRIS 1
M A R K E T R E S E A R C H | F I R S T Q UA RT E R | 2 0 1 0
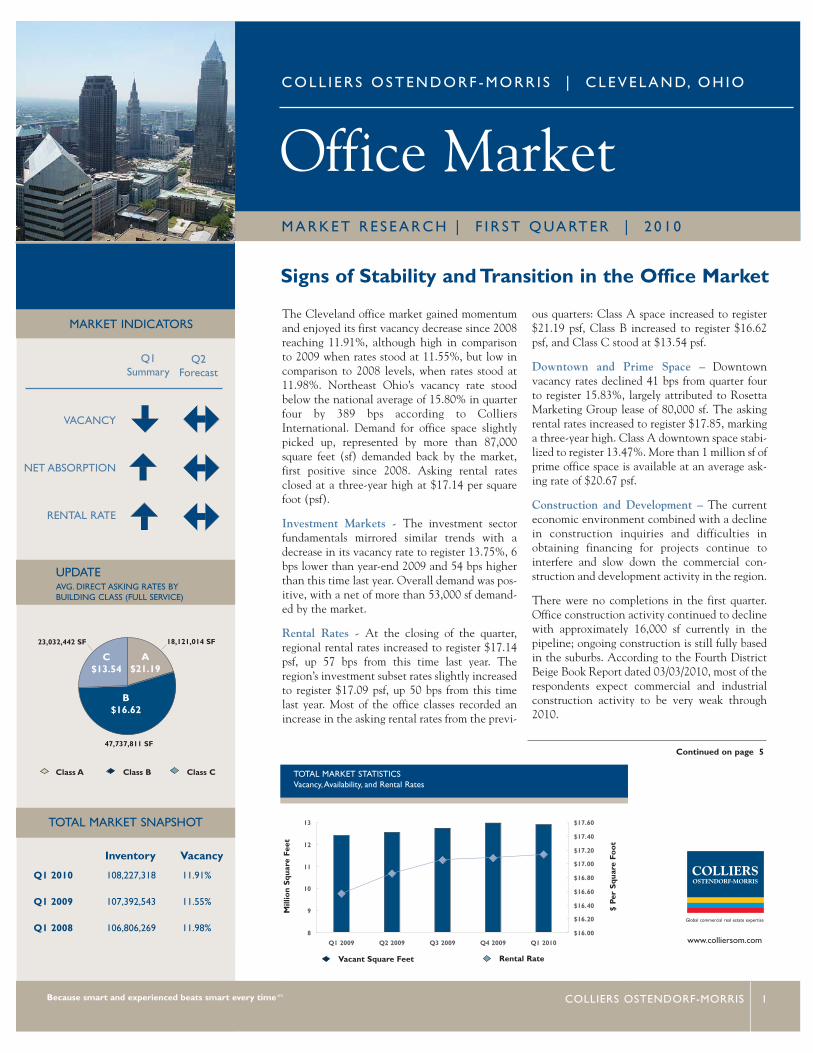
Office MarketC O L L I E R S O S T E N D O R F - M O R R I S | C L E V E L A N D, O H I O
Class B Class CClass A TOTAL MARKET STATISTICSVacancy,Availability, and Rental Rates
Because smart and experienced beats smart every time
TOTAL MARKET SNAPSHOT
8
9
10
11
12
13
Q1 2009 Q2 2009 Q3 2009 Q4 2009 Q1 2010$16.00
$16.20
$16.40
$16.60
$16.80
$17.00
$17.20
$17.40
$17.60
Q1 2010 108,227,318 11.91%
Q1 2009 107,392,543 11.55%
Q1 2008 106,806,269 11.98%
A$21.19
C$13.54
B$16.62
Q1Summary
Inventory Vacancy
Q2Forecast
Continued on page 5
COLLIERSOSTENDORF-MORRIS
www.colliersom.com
Global commercial real estate expertise
sm
47,737,811 SF
23,032,442 SF 18,121,014 SF
Rental RateVacant Square Feet
Mill
ion
Squ
are
Feet
$ Pe
r S
quar
e Fo
ot
Signs of Stability and Transition in the Office Market
OFFICE FIRST QUARTER | 2010CLEVELAND, OHIO
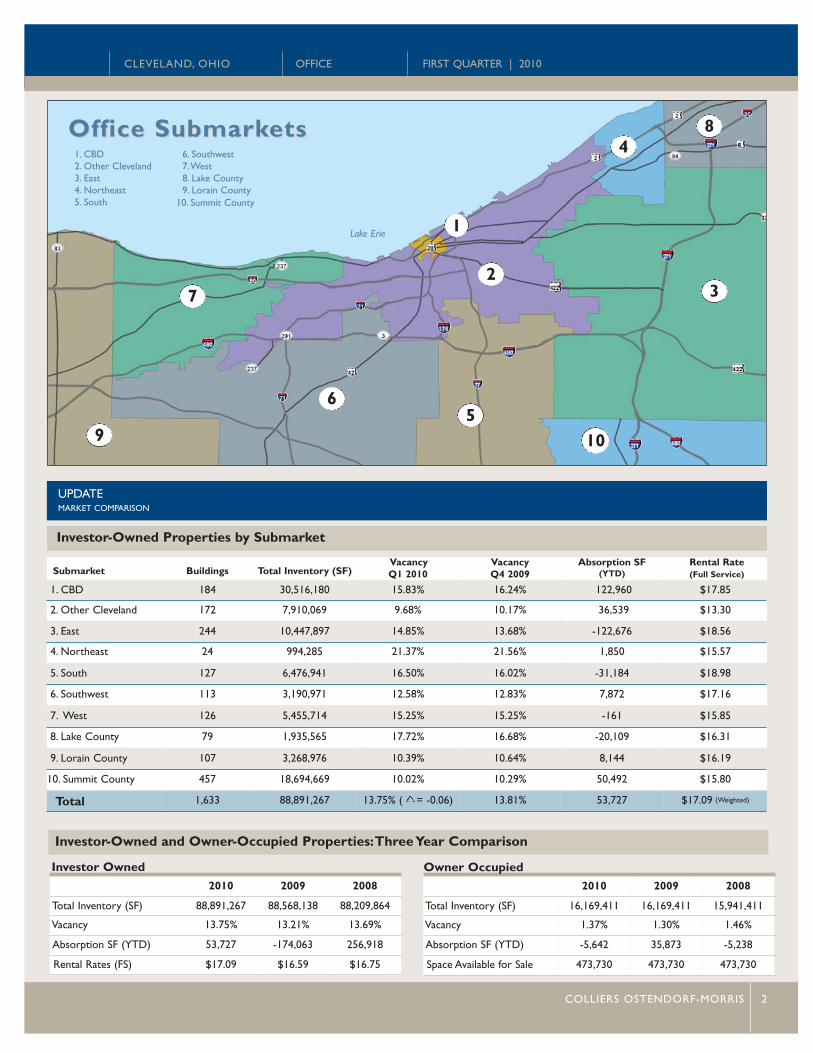
Investor-Owned Properties by Submarket
UPDATEMARKET COMPARISON
Submarket Buildings Total Inventory (SF)VacancyQ1 2010
VacancyQ4 2009
Absorption SF (YTD)
Rental Rate (Full Service)
1. CBD 184 30,516,180 15.83% 16.24% 122,960 $17.85
2. Other Cleveland 172 7,910,069 9.68% 10.17% 36,539 $13.30
3. East 244 10,447,897 14.85% 13.68% -122,676 $18.56
4. Northeast 24 994,285 21.37% 21.56% 1,850 $15.57
5. South 127 6,476,941 16.50% 16.02% -31,184 $18.98
6. Southwest 113 3,190,971 12.58% 12.83% 7,872 $17.16
7. West 126 5,455,714 15.25% 15.25% -161 $15.85
8. Lake County 79 1,935,565 17.72% 16.68% -20,109 $16.31
9. Lorain County 107 3,268,976 10.39% 10.64% 8,144 $16.19
10. Summit County 457 18,694,669 10.02% 10.29% 50,492 $15.80
Total 1,633 88,891,267 13.75% ( = -0.06) 13.81% 53,727 $17.09 (Weighted)
Office SubmarkOffice Submarketsets
COLLIERS OSTENDORF-MORRIS 2
Investor-Owned and Owner-Occupied Properties:Three Year Comparison
2010 2009 2008
Total Inventory (SF) 88,891,267 88,568,138 88,209,864
Vacancy 13.75% 13.21% 13.69%
Absorption SF (YTD) 53,727 -174,063 256,918
Rental Rates (FS) $17.09 $16.59 $16.75
2010 2009 2008
Total Inventory (SF) 16,169,411 16,169,411 15,941,411
Vacancy 1.37% 1.30% 1.46%
Absorption SF (YTD) -5,642 35,873 -5,238
Space Available for Sale 473,730 473,730 473,730
Owner OccupiedInvestor Owned
4
3
1
9 10
8
5
7
6
2
1. CBD2. Other Cleveland3. East4. Northeast5. South
6. Southwest7.West8. Lake County9. Lorain County
10. Summit County
Lake Erie
OFFICE FIRST QUARTER | 2010CLEVELAND, OHIO
MARKET COMPARISONBUILDING CLASS STATISTICS, INVESTOR-OWNED PROPERTIES
$20.67
$18.77
$22.06
$21.33
$26.11
$20.89
$26.18
$20.26
0
3
6
9
CBD O. Cle East South SW West Lorain Summit
$16.96
$13.85
$18.88
$15.58
$17.78
$17.24
$15.33$17.82 $14.49
$15.03
0
4
8
12
16
CBD O. Cle East NE South SW West Lake Lorain Summit
$16.16 $12.31
$13.78
$15.39
$9.96
$12.72
$13.61
$14.38
$9.28
$14.31
0
3
6
CBD O. Cle East NE South SW West Lake Lorain Summit
Submarket Buildings Inventory (SF) Rental Rate Vacancy Rate
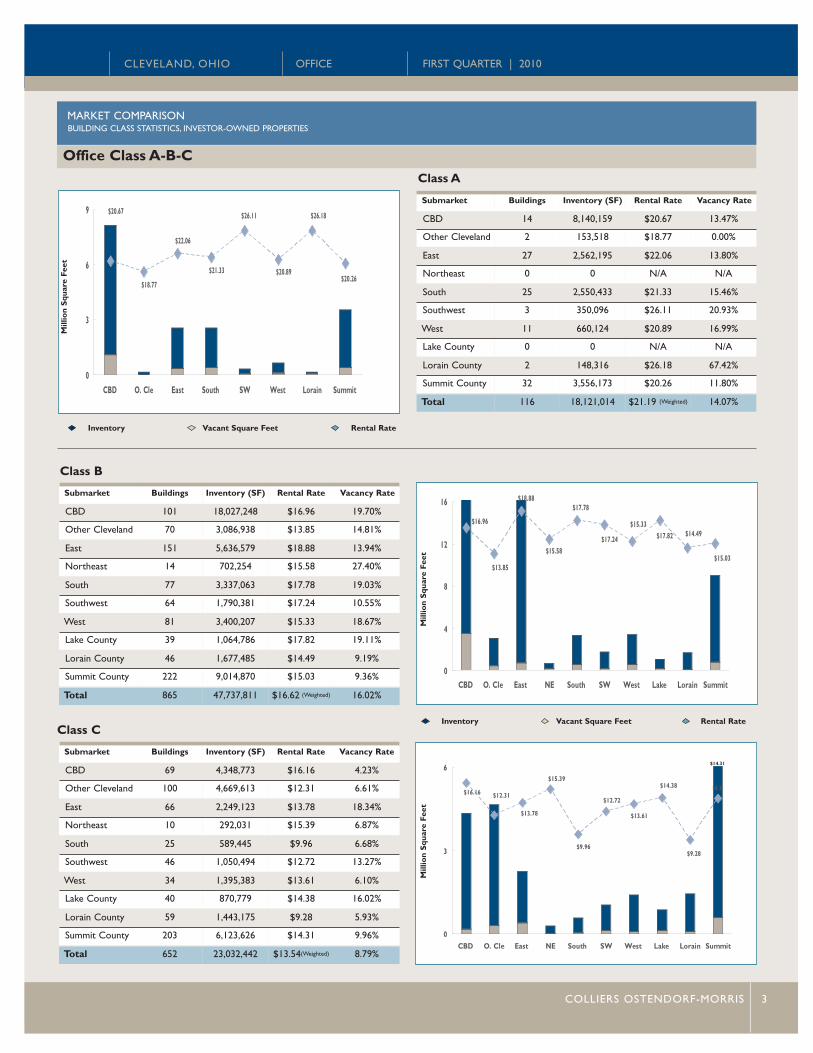
CBD 14 8,140,159 $20.67 13.47%
Other Cleveland 2 153,518 $18.77 0.00%
East 27 2,562,195 $22.06 13.80%
Northeast 0 0 N/A N/A
South 25 2,550,433 $21.33 15.46%
Southwest 3 350,096 $26.11 20.93%
West 11 660,124 $20.89 16.99%
Lake County 0 0 N/A N/A
Lorain County 2 148,316 $26.18 67.42%
Summit County 32 3,556,173 $20.26 11.80%
Total 116 18,121,014 $21.19 (Weighted) 14.07%
Class A
Submarket Buildings Inventory (SF) Rental Rate Vacancy Rate
CBD 101 18,027,248 $16.96 19.70%
Other Cleveland 70 3,086,938 $13.85 14.81%
East 151 5,636,579 $18.88 13.94%
Northeast 14 702,254 $15.58 27.40%
South 77 3,337,063 $17.78 19.03%
Southwest 64 1,790,381 $17.24 10.55%
West 81 3,400,207 $15.33 18.67%
Lake County 39 1,064,786 $17.82 19.11%
Lorain County 46 1,677,485 $14.49 9.19%
Summit County 222 9,014,870 $15.03 9.36%
Total 865 47,737,811 $16.62 (Weighted) 16.02%
Submarket Buildings Inventory (SF) Rental Rate Vacancy Rate
CBD 69 4,348,773 $16.16 4.23%
Other Cleveland 100 4,669,613 $12.31 6.61%
East 66 2,249,123 $13.78 18.34%
Northeast 10 292,031 $15.39 6.87%
South 25 589,445 $9.96 6.68%
Southwest 46 1,050,494 $12.72 13.27%
West 34 1,395,383 $13.61 6.10%
Lake County 40 870,779 $14.38 16.02%
Lorain County 59 1,443,175 $9.28 5.93%
Summit County 203 6,123,626 $14.31 9.96%
Total 652 23,032,442 $13.54(Weighted) 8.79%
Class B
Class C
Rental RateInventory Vacant Square Feet
Rental RateInventory Vacant Square Feet
Office Class A-B-C
Mill
ion
Squ
are
Feet
Mill
ion
Squ
are
Feet
Mill
ion
Squ
are
Feet
COLLIERS OSTENDORF-MORRIS 3
$14.31
COLLIERS OSTENDORF-MORRIS TRANSACTIONS
OFFICE FIRST QUARTER | 2010CLEVELAND, OHIO
COLLIERS OSTENDORF-MORRIS 4
LEASING ACTIVITY
PROPERTY ADDRESS SUBMARKET COLLIERS OM ROLE SIZE (SQ FT) TENANT REAL ESTATE PROFESSIONAL
3634 Euclid Ave Other Cleveland Landlord Rep 15,043 Cleveland Center for Arts & Technology Conor Coakley
2500 E Enterprise Pkwy Summit Tenant Rep 26,128 Experient, Inc. Bennett Morrison
200 Public Sq CBD Tenant Rep 10,720 Robert W. Baird & Co. Inc. Conor Coakley
4141 Rockside Rd South Tenant Rep 7,448 EZ Energy USA, Inc. Geoff Coyle & Daniel Schiau
SALES ACTIVITY
PROPERTY ADDRESS SUBMARKET SALE PRICE SIZE (SQ FT) BUYER REAL ESTATE PROFESSIONAL
6200 Rockside Woods Blvd South $2,600,000 36,000 Gold Building Partners, LLC Thomas Gustafson, Dan Schiau, & Cliff West
In the mid 1970s and early 1980s, Ostendorf-Morris excelled in the national and international real estate arenas and, in 1998, joined forces with ColliersInternational to form the entity now known as Colliers Ostendorf-Morris.This entity is Ohio's largest privately-held, full service commercial real estatecompany specializing in brokerage, property management, corporate services and appraisal. It is an independently owned firm within the global realestate services association of Colliers International, a company with more than 12,700 employees in 294 offices in 61 countries.
COMPREHENSIVE REAL ESTATE SERVICES
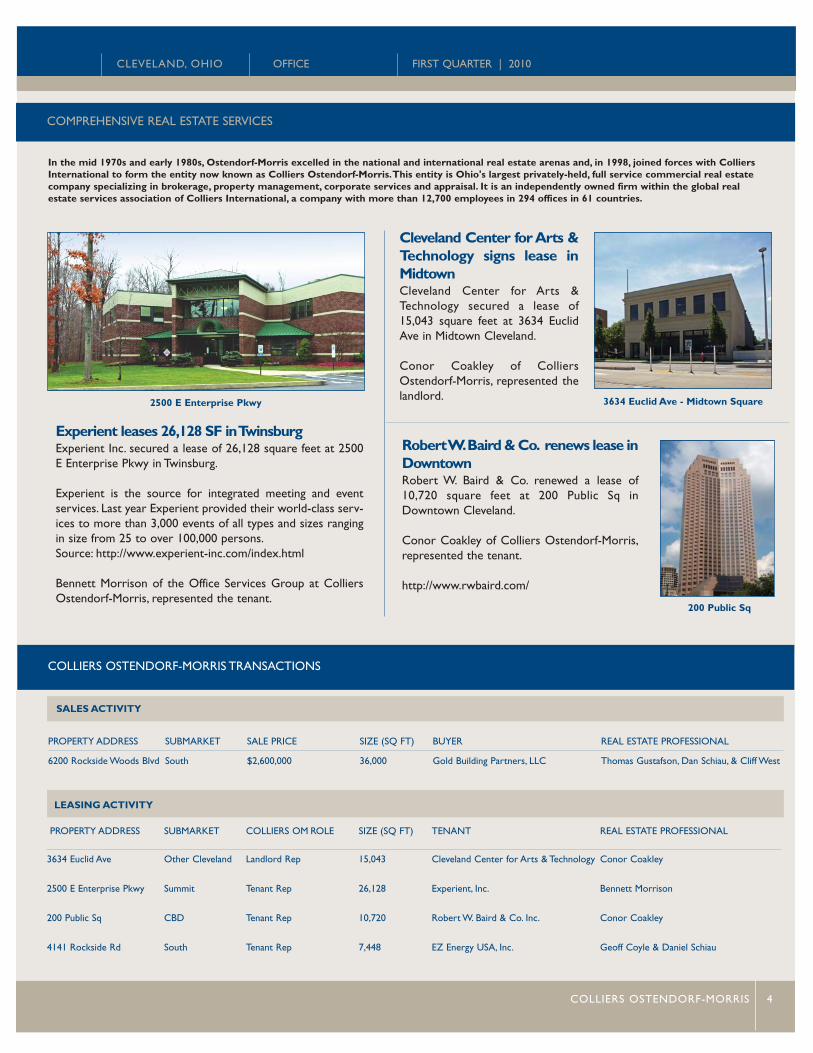
Experient leases 26,128 SF in TwinsburgExperient Inc. secured a lease of 26,128 square feet at 2500E Enterprise Pkwy in Twinsburg.
Experient is the source for integrated meeting and eventservices. Last year Experient provided their world-class serv-ices to more than 3,000 events of all types and sizes rangingin size from 25 to over 100,000 persons.Source: http://www.experient-inc.com/index.html
Bennett Morrison of the Office Services Group at ColliersOstendorf-Morris, represented the tenant.
2500 E Enterprise Pkwy
Cleveland Center for Arts &Technology signs lease inMidtown Cleveland Center for Arts &Technology secured a lease of15,043 square feet at 3634 EuclidAve in Midtown Cleveland.
Conor Coakley of ColliersOstendorf-Morris, represented thelandlord. 3634 Euclid Ave - Midtown Square
Robert W.Baird & Co. renews lease inDowntown Robert W. Baird & Co. renewed a lease of10,720 square feet at 200 Public Sq inDowntown Cleveland.
Conor Coakley of Colliers Ostendorf-Morris,represented the tenant.
http://www.rwbaird.com/
200 Public Sq
OFFICE FIRST QUARTER | 2010CLEVELAND, OHIO
COLLIERS OSTENDORF-MORRIS
1100 Superior Ave. E, Suite 800Cleveland, Ohio 44114Tel: 216-861-7200Fax: 216-861-4672
This report and other research materials may be found onour website at www.colliers.com.This report is a researchdocument of Colliers Ostendorf-Morris in Cleveland, Ohio.Questions related to information herein should be directedto the Research Department at 216-861-7200. Informationcontained herein has been obtained from sources deemedreliable and no representation is made as to the accuracythereof. Colliers Ostendorf-Morris is an independentlyowned and operated business and a member firm ofColliers International Property Consultants, an affiliation ofindependent companies with over 294 offices throughoutmore than 61 countries worldwide.
294 OFFICES IN 61 COUNTRIES ON 6CONTINENTS
USA 94Canada 22Latin America 17Asia Pacific 64EMEA 97
$1.6 billion in revenue1.1 billion square feet under management 12,700 Professionals
Recent Transactions – Lease transactions signedduring the quarter included Cleveland Center forArts and Technology’s 15,043-sf deal at 3634 EuclidAve in Cleveland; and TOA Technologies’ 12,763-sf deal at 3333 Richmond Rd in Beachwood (East).
Notable sale transactions included ChildrenHospitals Medical Centers’ acquisition of a 2 prop-erty portfolio along Cedar St in Akron for$3,442,000; Chicago-based Brauvin Net LeaseLLC’s acquisition of 6020 Enterprise Pkwy in Solon(East) for $1,335,000; and Interchez PropertiesLLC’s purchase of 600 Alpha Pkwy in Stow(Summit) for $1,250,000.
Troubled Assets – It wasn’t all good news for theNortheast Ohio office market, as we continue toslowly and cautiously approach the 2010 activities,there are still more than 10 office buildings current-ly classified as troubled assets, according to RealCapital Analytics. Loses from commercial real estateloans will continue to be a problem for the country,according to Treasury Secretary Timothy Geithner.
Although the economy showed signs of stability dur-ing the first quarter of 2010, there are signs pushingfor a slow transition, especially with jobs, the primarydriver of office leasing activity still not becoming partof the strength equation. Unemployment rates arestill stubbornly hovering around the 9.70% mark.
Total Market Inventory: Existingoffice space greater than or equal to10,000 square feet, including owneroccupied, multi-tenant, and single-ten-ant leased properties. Excludes spacecurrently under construction or renova-tion.
Absorption (YTD): Net change inoccupancy over a given period of time.
Rental Rate: Average asking weight-ed rent payable to landlord, quoted onfull service basis.
Vacancy: A percentage expressed bydividing total vacant space by total inven-tory. Includes direct and sublet space.
Available Space: Vacant space cur-rently being marketed for occupancy.
Investor-Owned: Subset of the totalmarket inventory, inclusive of allinvestor-owned properties 10,000square feet and above.
Owner-Occupied: Subset of the totalmarket inventory, inclusive of all prop-erties that are at least 75% occupied bytheir respective owners.
CONTACT INFORMATION
COLLIERS OSTENDORF-MORRIS 5
DEFINITIONS
Continued from page 1
On the horizon...Northeast Ohio news
Ohio wins its 4th Consecutive Governor’sCup - Site Selection’s annual Governor’s Cupaward recognizes the state with the most new orexpanded private-sector capital projects withinvestments of $1 million or more; creation of 50+jobs and/or new floor space of at least 20,000 SF.For the 4th consecutive year, Ohio placed firstbeating out runners-up Texas, Michigan &Pennsylvania with 381 capital investment projectsin 2009.
New Downtown Cleveland Lease Brings400 High-Tech Jobs - Rosetta, the nation’slargest independent interactive marketing agencybased in Hamilton, NJ, has signed a 10-year leaseat 629 Euclid Avenue.The company will be consol-idating its local Beachwood, and Independenceoffices into the 80,000 SF former National Citybuilding in Fall 2010. The privately held companyemployees approximately 715 people, approxi-mately 400 of them are employed in the Clevelandarea. The company will spend approximately $5million dollars to renovate floors 11 to 15 withplans to build a new 17th floor penthouse androoftop patio.
COLLIERSOSTENDORF-MORRIS
www.colliersom.com
Global commercial real estate expertise
ASMAAE BENMERZOUGADirector of Corporate Research