offering memorandum - loopnet · 2019-06-14 · metered for gas and electricity, and a ratio...
TRANSCRIPT

7115 MILWOOD AVE7115 Milwood Ave • Canoga Park, CA 91303
Offering Memorandum
1

N O N - E N D O R S E M E N T A N D D I S C L A I M E R N O T I C E
Confidentiality and DisclaimerThe information contained in the following Marketing Brochure is proprietary and strictly confidential. It is intended to be reviewed only by the party receiving it from Marcus & Millichap and
should not be made available to any other person or entity without the written consent of Marcus & Millichap. This Marketing Brochure has been prepared to provide summary, unverified
information to prospective purchasers, and to establish only a preliminary level of interest in the subject property. The information contained herein is not a substitute for a thorough due
diligence investigation. Marcus & Millichap has not made any investigation, and makes no warranty or representation, with respect to the income or expenses for the subject property, the
future projected financial performance of the property, the size and square footage of the property and improvements, the presence or absence of contaminating substances, PCB's or
asbestos, the compliance with State and Federal regulations, the physical condition of the improvements thereon, or the financial condition or business prospects of any tenant, or any
tenant's plans or intentions to continue its occupancy of the subject property. The information contained in this Marketing Brochure has been obtained from sources we believe to be
reliable; however, Marcus & Millichap has not verified, and will not verify, any of the information contained herein, nor has Marcus & Millichap conducted any investigation regarding these
matters and makes no warranty or representation whatsoever regarding the accuracy or completeness of the information provided. All potential buyers must take appropriate measures to
verify all of the information set forth herein. Marcus & Millichap is a service mark of Marcus & Millichap Real Estate Investment Services, Inc. © 2018 Marcus & Millichap. All rights reserved.
Non-Endorsement NoticeMarcus & Millichap is not affiliated with, sponsored by, or endorsed by any commercial tenant or lessee identified in this marketing package. The presence of any corporation's logo or
name is not intended to indicate or imply affiliation with, or sponsorship or endorsement by, said corporation of Marcus & Millichap, its affiliates or subsidiaries, or any agent, product,
service, or commercial listing of Marcus & Millichap, and is solely included for the purpose of providing tenant lessee information about this listing to prospective customers.
ALL PROPERTY SHOWINGS ARE BY APPOINTMENT ONLY.PLEASE CONSULT YOUR MARCUS & MILLICHAP AGENT FOR MORE DETAILS.
7115 MILWOOD AVE
Canoga Park, CA
ACT ID ZAA0120797
2
TABLE OF CONTENTS
SECTION
INVESTMENT OVERVIEW 01Offering Summary
Regional Map
Local Map
Aerial Photo
FINANCIAL ANALYSIS 02
Rent Roll Summary
Rent Roll Detail
Operating Statement
Notes
Pricing Detail
Acquisition Financing
MARKET COMPARABLES 03
Sales Comparables
Rent Comparables
MARKET OVERVIEW 04
Market Analysis
Demographic Analysis
7115 MILWOOD AVE
3

7115 MILWOOD AVE
4
INVESTMENT
OVERVIEW

5

6
7

8
9
10
11
12
13
14

7115 MILWOOD AVE
#
EXECUTIVE SUMMARY
OFFERING SUMMARY
MAJOR EMPLOYERS
EMPLOYER # OF EMPLOYEES
Farmers Insurance 6,169
County of Los Angeles 4,143
Lafd 72 3,300
21st Century Insurance and 2,645
21st Century Insurance Company 1,800
A M I Encn-Trzana Rgnal Med Ce 1,800
Los Angeles Pierce College 1,600
Providence Tarzana Medical Ctr 1,300
Kaiser Permanente 1,200
Los Angeles Unified School Dst 1,187
Countrywide Financial Corp 1,100
Boeing 1,055
DEMOGRAPHICS
1-Miles 3-Miles 5-Miles
2018 Estimate Pop 42,530 222,558 445,713
2010 Census Pop 40,124 212,807 428,732
2018 Estimate HH 13,945 76,768 157,697
2010 Census HH 12,873 72,557 150,271
Median HH Income $53,328 $68,777 $73,105
Per Capita Income $23,170 $32,906 $38,053
Average HH Income $70,329 $94,830 $107,050
UNIT MIX
NUMBEROF UNITS
UNIT TYPEAPPROX.SQUARE FEET
2 Two-Bedroom/One-Bath
1 Two-Bedroom/Two-Bath
7 Studio/One-Bath
43 One-Bedroom/One-Bath
53 Total 29,772
VITAL DATA
Price $12,500,000 CURRENT PROFORMA
Down Payment 50% / $6,250,000 CAP Rate 4.55% 5.81%
Loan Amount $6,250,000 GRM 13.59 11.54
Loan Type Proposed NewNet Operating Income
$568,332 $726,716
Interest Rate / Amortization 4% / 30 YearsNet Cash Flow After Debt Service
3.36% / $210,271 5.90% / $368,655
Price/Unit $235,849 Total Return 5.13% / $320,336 7.73% / $483,203
Price/SF $419.86
Number of Units 53
Rentable Square Feet 29,772
Year Built 1977
Lot Size 1.2 acre(s)
15

7115 MILWOOD AVE
OFFERING SUMMARY
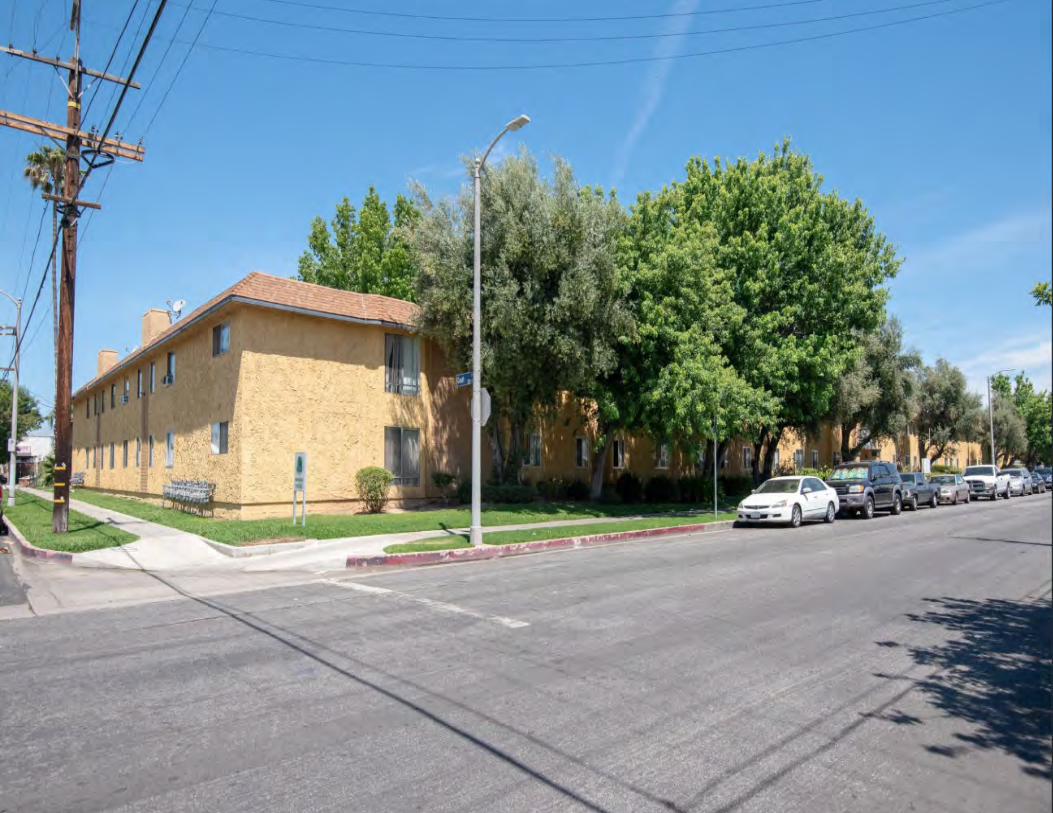
Hard-to-Find Large Asset for Sale - 53-Units in Canoga Park
No Earthquake Retrofit Required
Built in 1977 on 1.2 Acres of Land
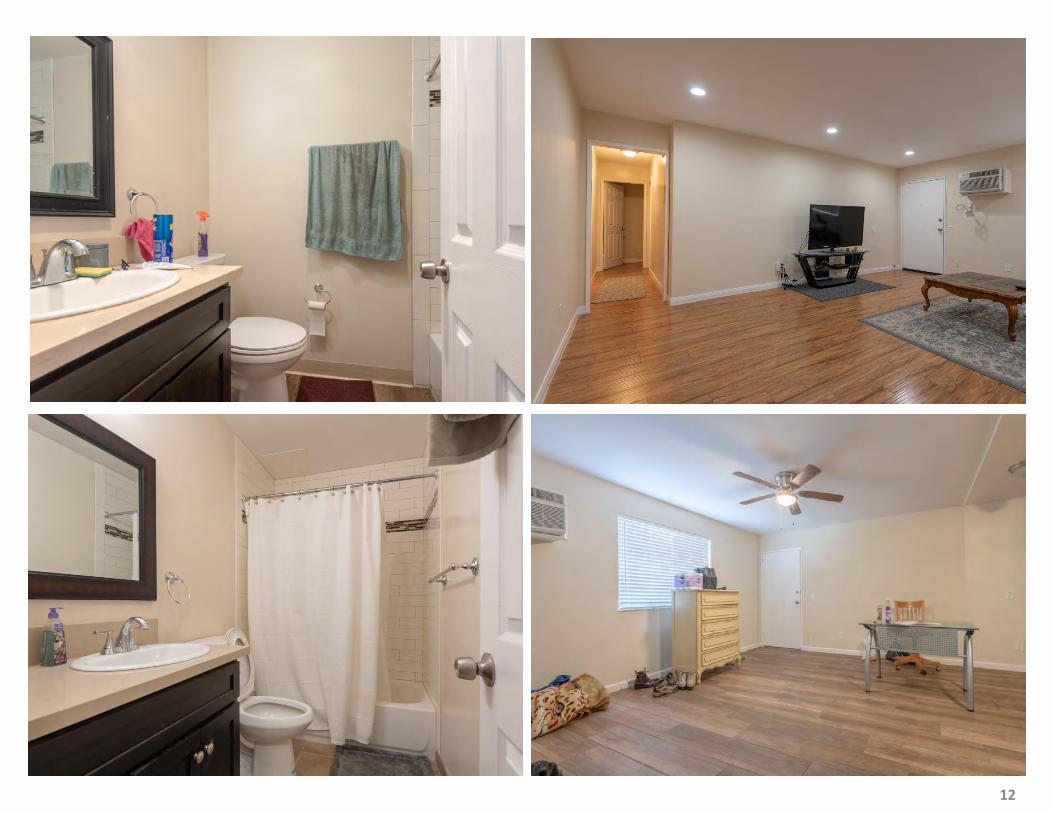
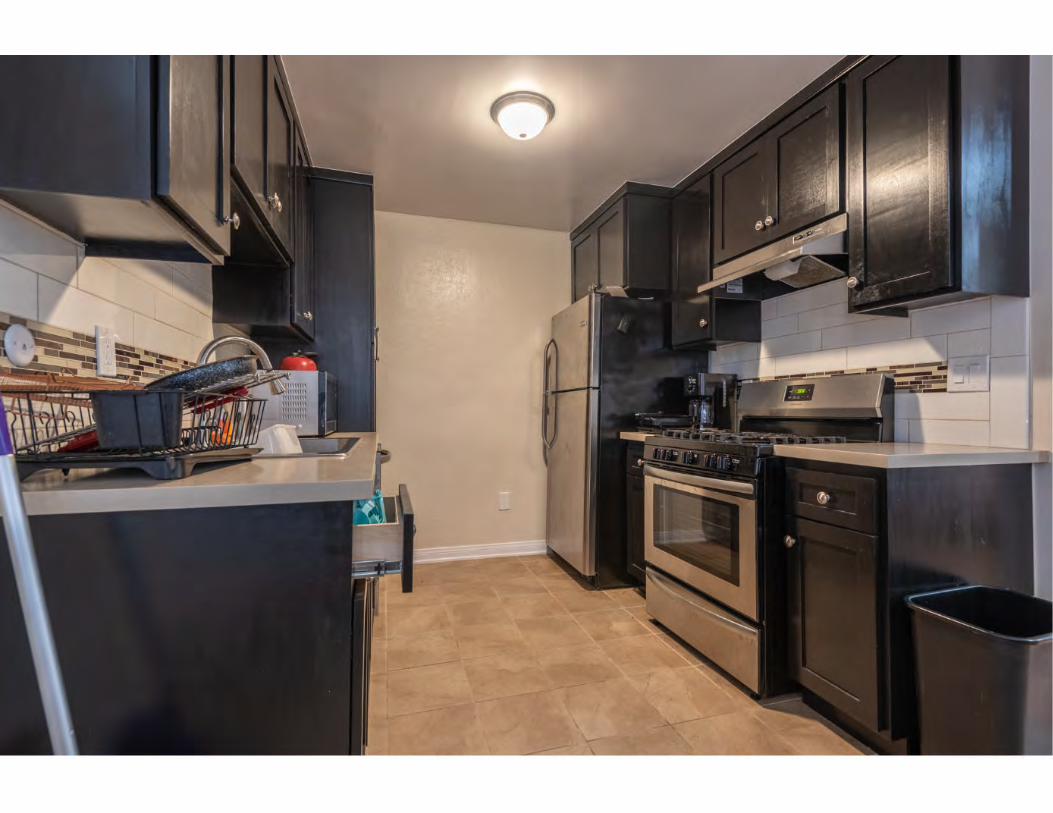
Twenty Units ( 20) Have Been Fully Remodeled in 2018
Impressive Frontage on Milwood Avenue
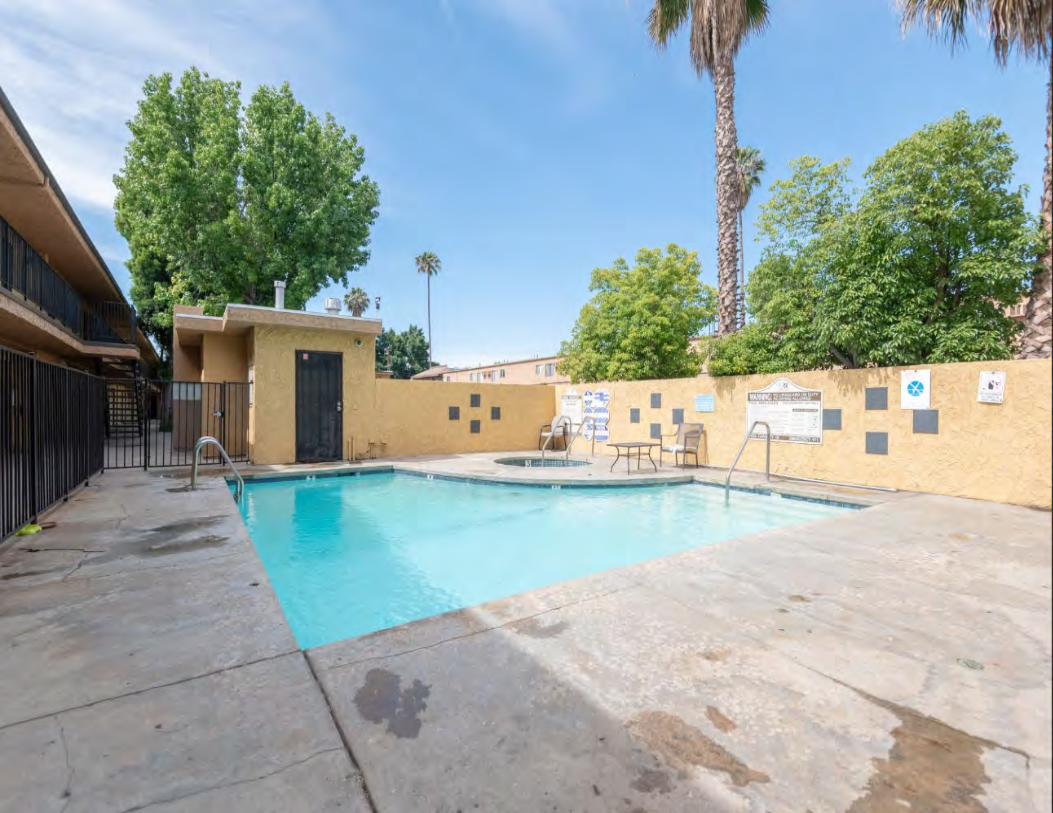
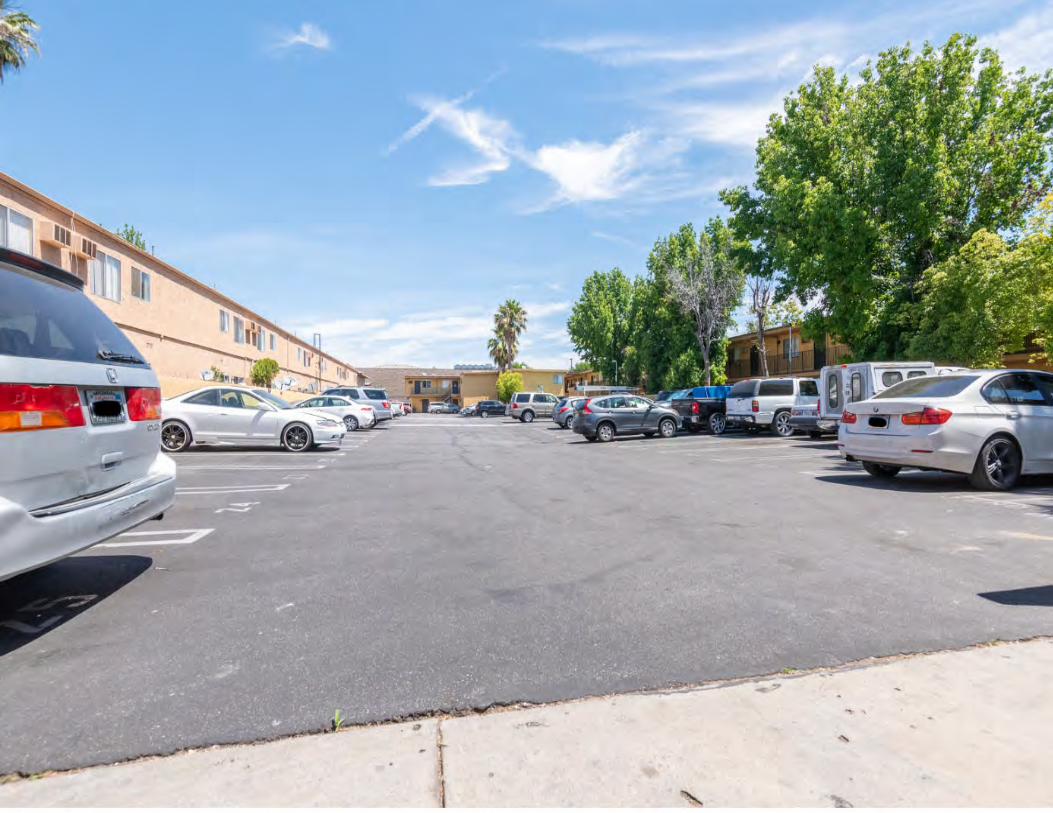
Gated and Secured Entry 78 Parking Spaces
• Walking Distance to Shopping, Dining, and Commercial Facilities of Sherman Way
• Property Maintained in Mint Condition and Professionally Managed
• Additional Income from the RUBS Utility Reimbursement Program
• Additional Income from Rental of Parking Spaces
• Desirable Unit Mix of 43 (1+1), 2 ( 2+1), 1 ( 2+2) and 7 Single Units.
• Considerable Upside in Rents
• Property Located in the Proximity of Major Commercial and Residential Developments Currently Planned for Neighboring Woodland Hills Area
INVESTMENT HIGHLIGHTS
Marcus & Millichap is proud to present exclusively for sale 53 units located at 7115 Milwood Avenue, Canoga Park, CA. The property was built in 1977 and is subject to
Los Angeles rent control regulation.
The subject property boasts an excellent unit mix comprised of 7 studios, 43 one-bedroom/one-bath units, two two-bedroom/one-bath units and one two-bedroom/two-
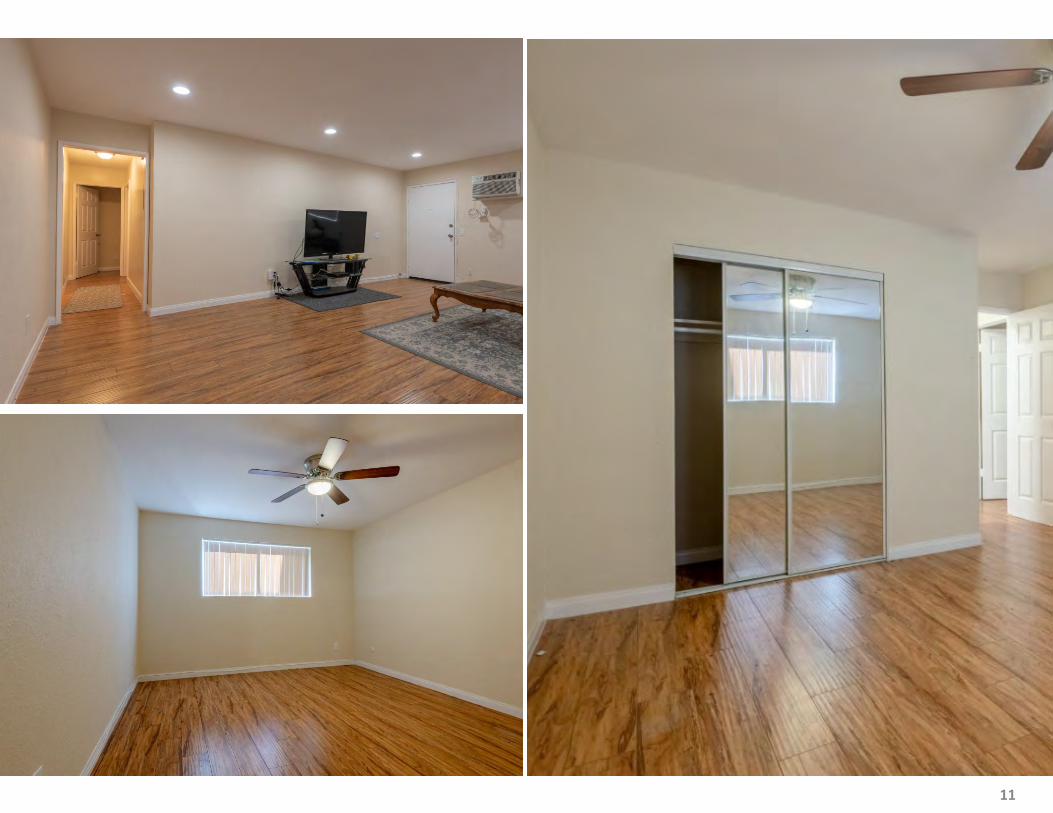
bath unit. There are two levels of apartments surrounding a central courtyard. The building consists of 29,772 square feet and is situated on a 1.2 acres of land. The
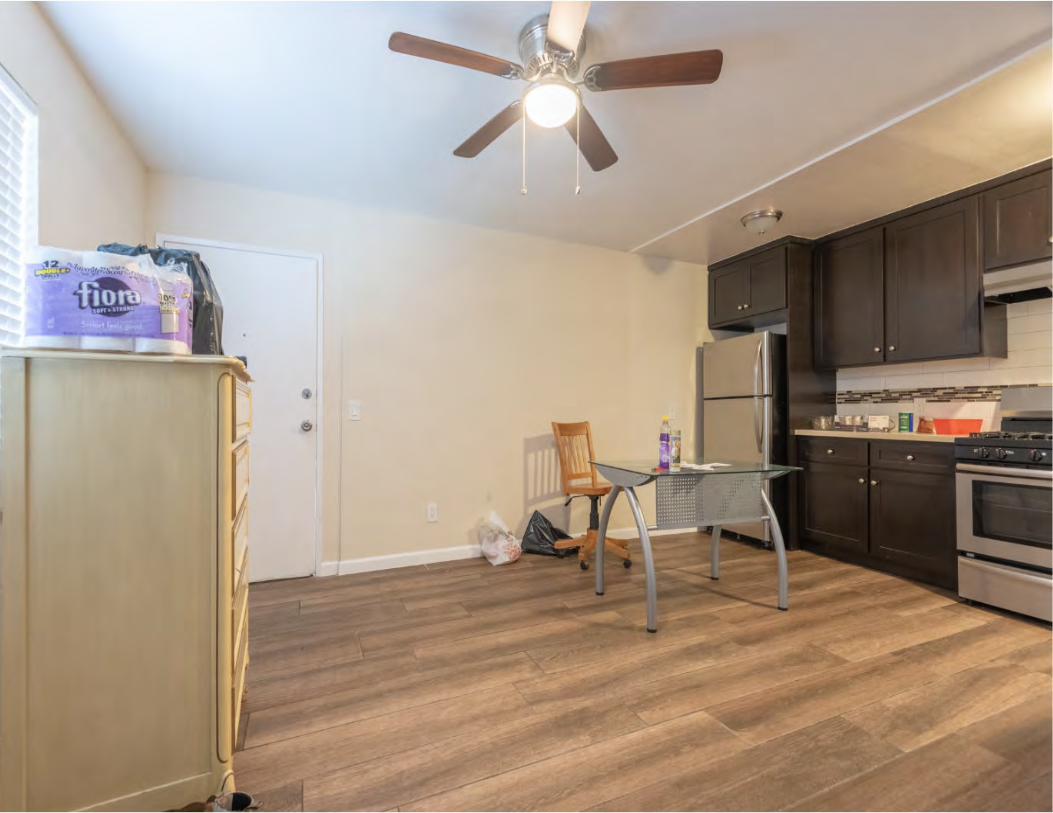
building features a pool and jacuzzi, controlled access entry, wall mounted air conditioning and heating, laundry facility and 78 gated parking spaces. Units are individually
metered for gas and electricity, and a Ratio Utility Billing System (RUBS) program.
The property is located in a strong rental market with a submarket vacancy rate of only 2.3%. Tenants are just a short distance to nearby Lanark Park, Canoga Park
Library, the Westfield Shopping Mall and Northridge Fashion Square.
Transportation conveniences include the new Metro Orange Line Extension, with a terminal located two blocks away on Canoga Avenue, offering easy access to the entire
Metro Rail system for accessible light rail commuting, the Ventura (101) Freeway 2 miles south and the 118 Freeway 3.5 miles north. Located between two major
north/south thoroughfares, the property provides easy access to Woodland Hills, Chatsworth, Simi Valley and Santa Clarita.
INVESTMENT OVERVIEW
16

LOCAL MAP
7115 MILWOOD AVE
17

AERIAL PHOTO
7115 MILWOOD AVE
18

7115 MILWOOD AVE
19
FINANCIAL
ANALYSIS

FINANCIAL ANALYSIS
7115 MILWOOD AVE
RENT ROLL SUMMARY
20
FINANCIAL ANALYSIS
7115 MILWOOD AVE
21
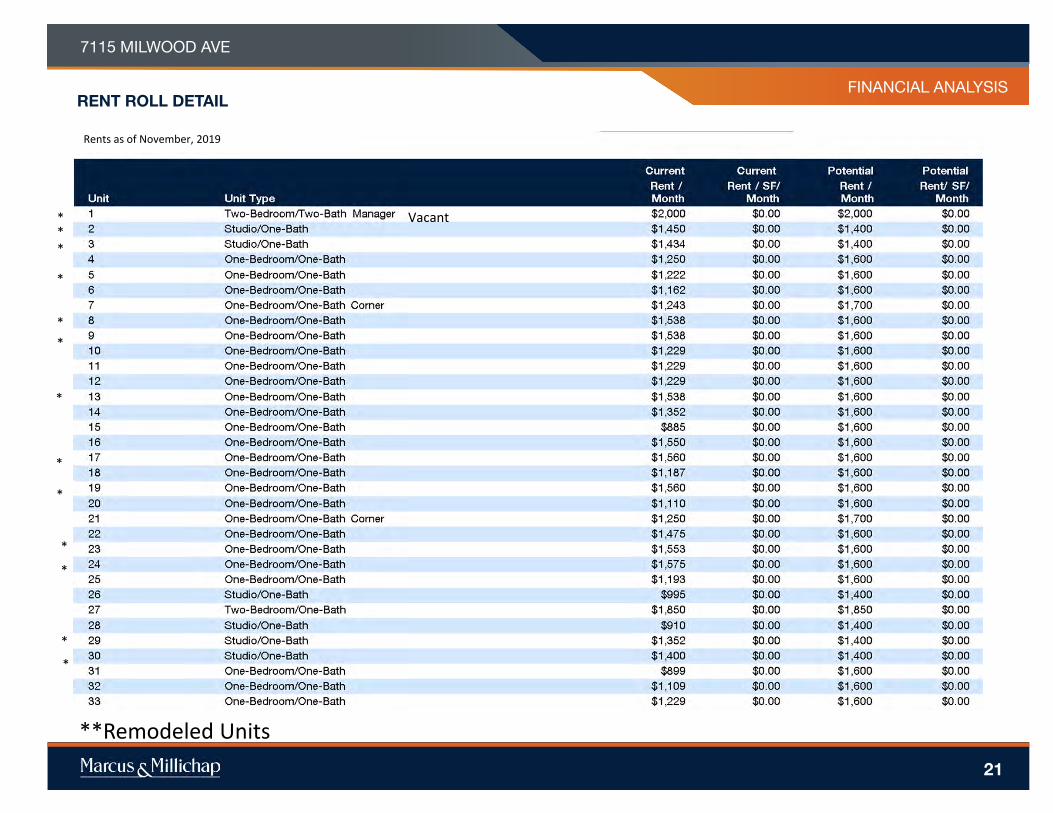
RENT ROLL DETAIL
***
*
**
*
*
*
*
*
*
*
Rents as of November, 2019
Vacant
**Remodeled Units

FINANCIAL ANALYSIS
7115 MILWOOD AVE
22
RENT ROLL DETAIL
**
***
*
** Remodeled Units

FINANCIAL ANALYSIS
7115 MILWOOD AVE
OPERATING STATEMENT
23

FINANCIAL ANALYSIS
7115 MILWOOD AVE
PRICING DETAIL
24

7115 MILWOOD AVE
25
MARKET
COMPARABLES
7115 MILWOOD AVE
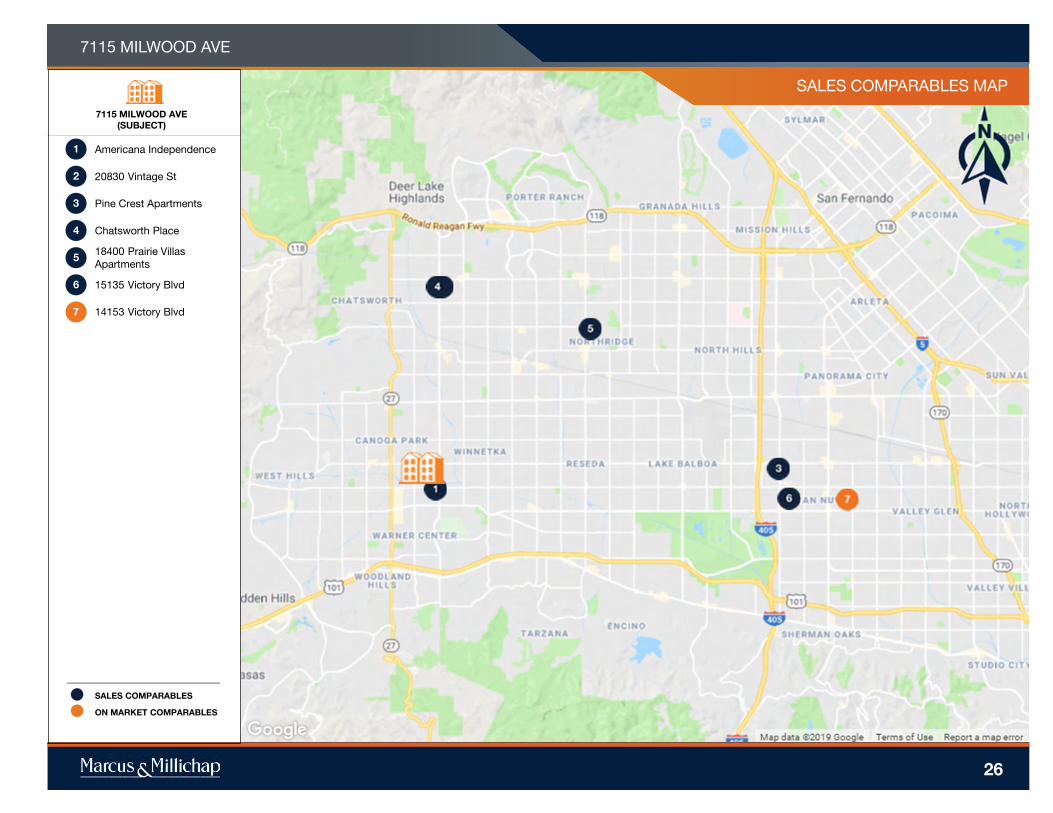
SALES COMPARABLES MAP
26
7115 MILWOOD AVE
(SUBJECT)
Americana Independence
20830 Vintage St
Pine Crest Apartments
Chatsworth Place
18400 Prairie Villas
Apartments
15135 Victory Blvd
14153 Victory Blvd
SALES COMPARABLES
ON MARKET COMPARABLES
1
2
3
4
5
7
6
27
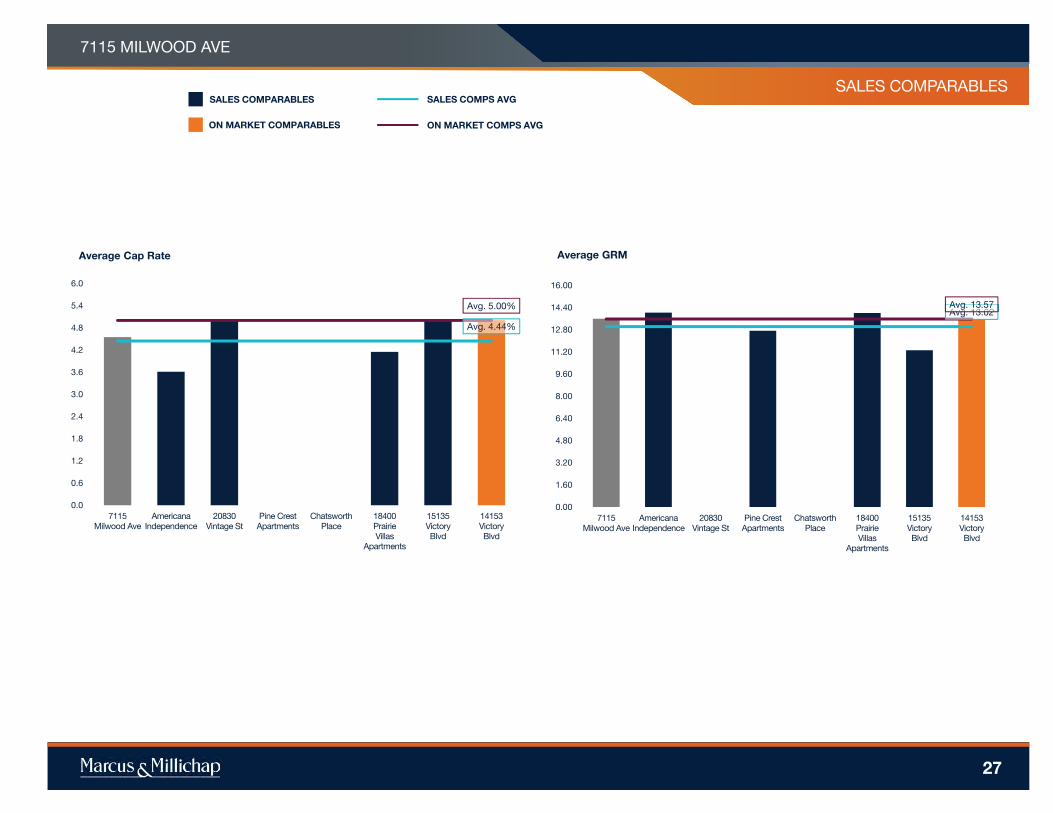
PROPERTY NAME7115 MILWOOD AVE
SALES COMPARABLES
Avg. 4.44%
Avg. 5.00%
0.0
0.6
1.2
1.8
2.4
3.0
3.6
4.2
4.8
5.4
6.0
7115
Milwood Ave
Americana
Independence
20830
Vintage St
Pine Crest
Apartments
Chatsworth
Place
18400
Prairie
Villas
Apartments
15135
Victory
Blvd
14153
Victory
Blvd
Average Cap Rate
Avg. 13.02Avg. 13.57
0.00
1.60
3.20
4.80
6.40
8.00
9.60
11.20
12.80
14.40
16.00
7115
Milwood Ave
Americana
Independence
20830
Vintage St
Pine Crest
Apartments
Chatsworth
Place
18400
Prairie
Villas
Apartments
15135
Victory
Blvd
14153
Victory
Blvd
Average GRM
SALES COMPARABLES
ON MARKET COMPARABLES
SALES COMPS AVG
ON MARKET COMPS AVG

28
PROPERTY NAME7115 MILWOOD AVE
SALES COMPARABLES
Avg. $346.41
Avg. $432.25
$0.00
$50.00
$100.00
$150.00
$200.00
$250.00
$300.00
$350.00
$400.00
$450.00
$500.00
Average Price Per Square Foot
Avg. $209,092
Avg. $287,500
$0
$30,000
$60,000
$90,000
$120,000
$150,000
$180,000
$210,000
$240,000
$270,000
$300,000
Average Price Per Unit
SALES COMPARABLES
ON MARKET COMPARABLES
SALES COMPS AVG
ON MARKET COMPS AVG
PROPERTY NAME
MARKETING TEAM
7115 MILWOOD AVE
SALES COMPARABLES
rentpropertyname1
rentpropertyaddress1
rentpropertyname1
rentpropertyaddress1
rentpropertyname1
rentpropertyaddress1
29
SALES COMPARABLES ON MARKET COMPARABLES
Units Unit Type
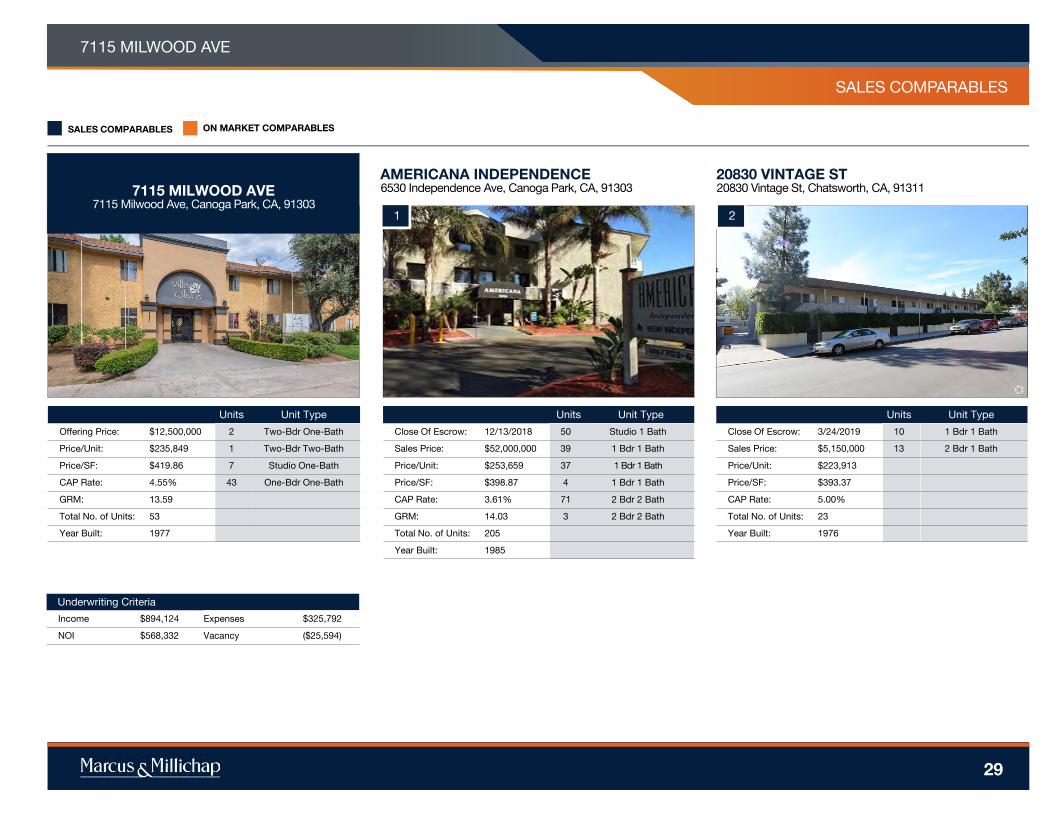
Offering Price: $12,500,000 2 Two-Bdr One-Bath
Price/Unit: $235,849 1 Two-Bdr Two-Bath
Price/SF: $419.86 7 Studio One-Bath
CAP Rate: 4.55% 43 One-Bdr One-Bath
GRM: 13.59
Total No. of Units: 53
Year Built: 1977
Underwriting Criteria
Income $894,124 Expenses $325,792
NOI $568,332 Vacancy ($25,594)
7115 MILWOOD AVE7115 Milwood Ave, Canoga Park, CA, 91303
1
Units Unit Type
Close Of Escrow: 12/13/2018 50 Studio 1 Bath
Sales Price: $52,000,000 39 1 Bdr 1 Bath
Price/Unit: $253,659 37 1 Bdr 1 Bath
Price/SF: $398.87 4 1 Bdr 1 Bath
CAP Rate: 3.61% 71 2 Bdr 2 Bath
GRM: 14.03 3 2 Bdr 2 Bath
Total No. of Units: 205
Year Built: 1985
AMERICANA INDEPENDENCE6530 Independence Ave, Canoga Park, CA, 91303
Units Unit Type
Close Of Escrow: 3/24/2019 10 1 Bdr 1 Bath
Sales Price: $5,150,000 13 2 Bdr 1 Bath
Price/Unit: $223,913
Price/SF: $393.37
CAP Rate: 5.00%
Total No. of Units: 23
Year Built: 1976
2
20830 VINTAGE ST20830 Vintage St, Chatsworth, CA, 91311
PROPERTY NAME
MARKETING TEAM
7115 MILWOOD AVE
SALES COMPARABLES
rentpropertyname1
rentpropertyaddress1
rentpropertyname1
rentpropertyaddress1
rentpropertyname1
rentpropertyaddress1
30
SALES COMPARABLES ON MARKET COMPARABLES
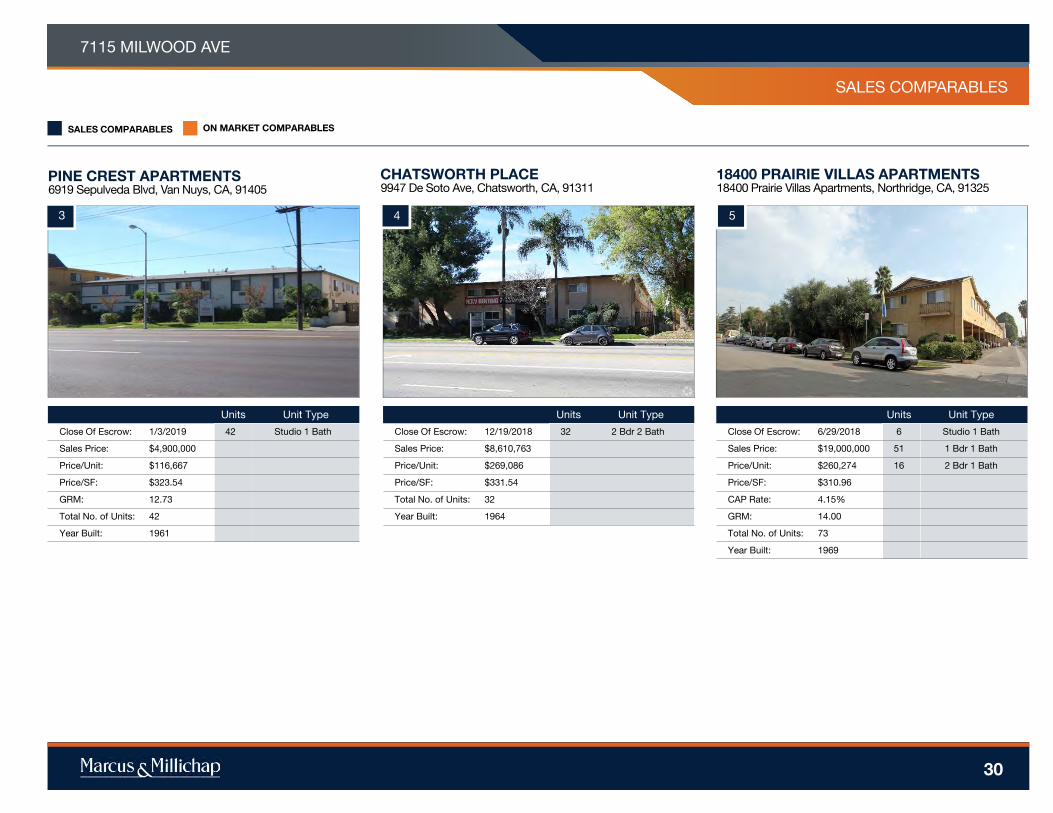
Units Unit Type
Close Of Escrow: 1/3/2019 42 Studio 1 Bath
Sales Price: $4,900,000
Price/Unit: $116,667
Price/SF: $323.54
GRM: 12.73
Total No. of Units: 42
Year Built: 1961
3
PINE CREST APARTMENTS6919 Sepulveda Blvd, Van Nuys, CA, 91405
4
Units Unit Type
Close Of Escrow: 12/19/2018 32 2 Bdr 2 Bath
Sales Price: $8,610,763
Price/Unit: $269,086
Price/SF: $331.54
Total No. of Units: 32
Year Built: 1964
CHATSWORTH PLACE9947 De Soto Ave, Chatsworth, CA, 91311
Units Unit Type
Close Of Escrow: 6/29/2018 6 Studio 1 Bath
Sales Price: $19,000,000 51 1 Bdr 1 Bath
Price/Unit: $260,274 16 2 Bdr 1 Bath
Price/SF: $310.96
CAP Rate: 4.15%
GRM: 14.00
Total No. of Units: 73
Year Built: 1969
5
18400 PRAIRIE VILLAS APARTMENTS18400 Prairie Villas Apartments, Northridge, CA, 91325

PROPERTY NAME
MARKETING TEAM
7115 MILWOOD AVE
SALES COMPARABLES
rentpropertyname1
rentpropertyaddress1
rentpropertyname1
rentpropertyaddress1
rentpropertyname1
rentpropertyaddress1
31
SALES COMPARABLES ON MARKET COMPARABLES
Units Unit Type
Close Of Escrow: 12/19/2018 20 Studio 1 Bath
Sales Price: $2,750,000 1 1 Bdr 1 Bath
Price/Unit: $130,952
Price/SF: $320.18
CAP Rate: 5.01%
GRM: 11.32
Total No. of Units: 21
Year Built: 1964
6
15135 VICTORY BLVD15135 Victory Blvd, Van Nuys, CA, 91411
7
Units Unit Type
On Market 29 1 Bdr 1 Bath
List Price: $9,200,000 2 2 Bdr Bath
Price/Unit: $287,500 1 3 Bdr Bath
Price/SF: $432.25
CAP Rate: 5.00%
GRM: 13.57
Total No. of Units: 32
Year Built: 1977
14153 VICTORY BLVD14153 Victory Blvd, Van Nuys, CA, 91401
8
7115 MILWOOD AVE
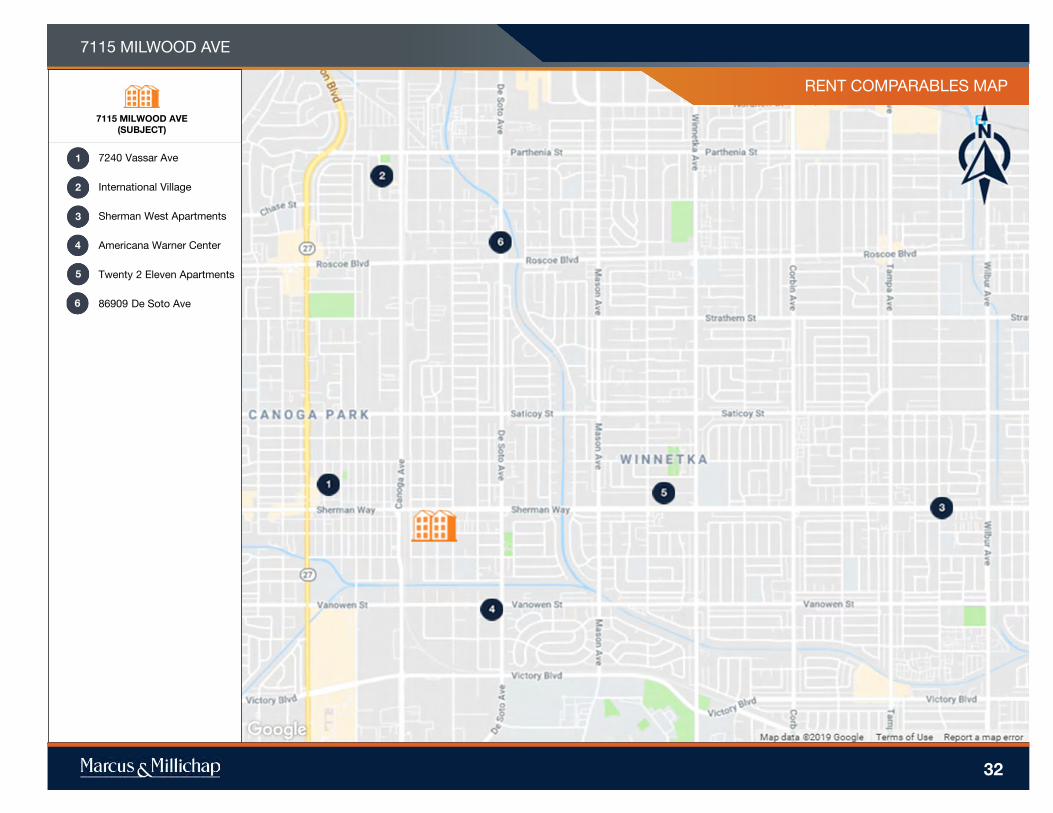
RENT COMPARABLES MAP
7115 MILWOOD AVE
(SUBJECT)
7240 Vassar Ave
International Village
Sherman West Apartments
Americana Warner Center
Twenty 2 Eleven Apartments
86909 De Soto Ave
4
7
8
9
11
20
12
14
15
16
17
13
18
10
4
1
2
3
5
6
32

PROPERTY NAME7115 MILWOOD AVE
RENT COMPARABLES
33
AVERAGE RENT - MULTIFAMILY
Avg. $2,369
$0
$300
$600
$900
$1,200
$1,500
$1,800
$2,100
$2,400
$2,700
$3,000
7115
Milwood Ave
7240
Vassar Ave
International
Village
Sherman
West
Apartments
Americana
Warner
Center
Twenty 2
Eleven
Apartments
86909 De
Soto Ave
2 Bedroom
Avg. $1,450
$0
$200
$400
$600
$800
$1,000
$1,200
$1,400
$1,600
$1,800
$2,000
7115
Milwood Ave
7240
Vassar Ave
International
Village
Sherman
West
Apartments
Americana
Warner
Center
Twenty 2
Eleven
Apartments
86909 De
Soto Ave
Studios
Avg. $1,825
$0
$200
$400
$600
$800
$1,000
$1,200
$1,400
$1,600
$1,800
$2,000
7115
Milwood Ave
7240
Vassar Ave
International
Village
Sherman
West
Apartments
Americana
Warner
Center
Twenty 2
Eleven
Apartments
86909 De
Soto Ave
1 Bedroom
PROPERTY NAME
MARKETING TEAM
7115 MILWOOD AVE
RENT COMPARABLES
rentpropertyname1
rentpropertyaddress1
rentpropertyname1
rentpropertyaddress1
rentpropertyname1
rentpropertyaddress1
34
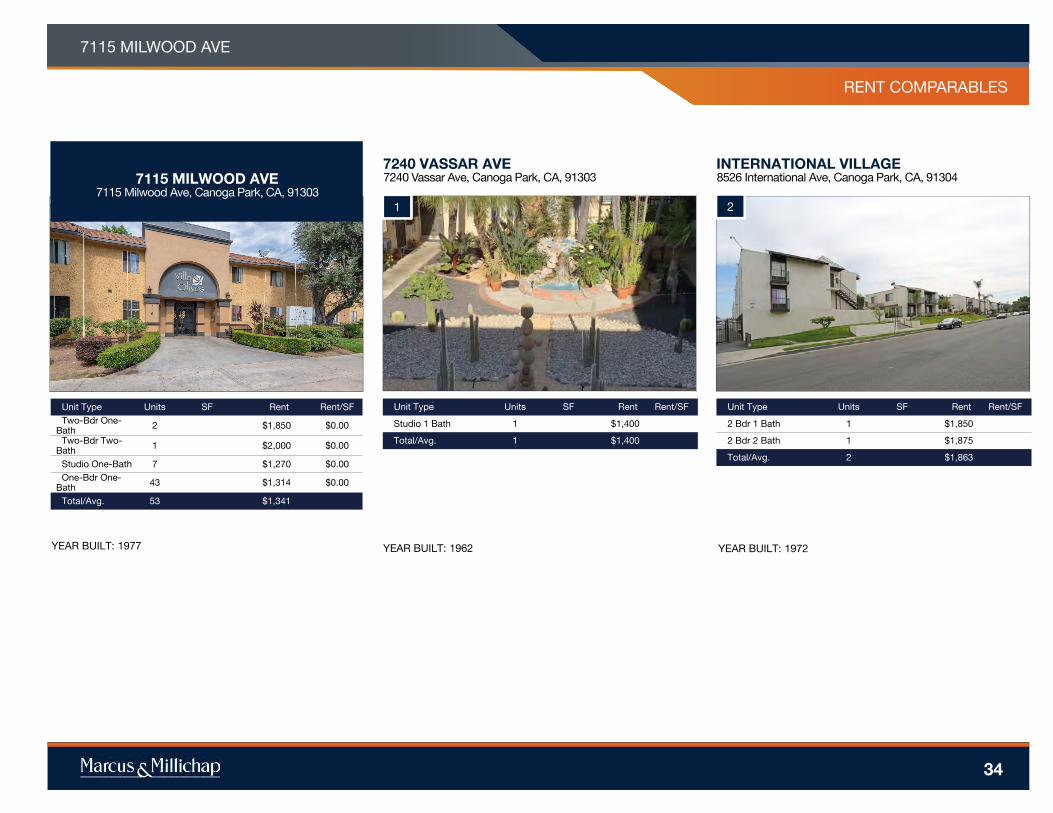
YEAR BUILT: 1977
rentpropertyname1
rentpropertyaddress1
Unit Type Units SF Rent Rent/SF
Two-Bdr One-Bath
2 $1,850 $0.00
Two-Bdr Two-Bath
1 $2,000 $0.00
Studio One-Bath 7 $1,270 $0.00
One-Bdr One-Bath
43 $1,314 $0.00
Total/Avg. 53 $1,341
7115 MILWOOD AVE7115 Milwood Ave, Canoga Park, CA, 91303
YEAR BUILT: 1962
1
Unit Type Units SF Rent Rent/SF
Studio 1 Bath 1 $1,400
Total/Avg. 1 $1,400
7240 VASSAR AVE7240 Vassar Ave, Canoga Park, CA, 91303
2
YEAR BUILT: 1972
Unit Type Units SF Rent Rent/SF
2 Bdr 1 Bath 1 $1,850
2 Bdr 2 Bath 1 $1,875
Total/Avg. 2 $1,863
INTERNATIONAL VILLAGE8526 International Ave, Canoga Park, CA, 91304
PROPERTY NAME
MARKETING TEAM
7115 MILWOOD AVE
RENT COMPARABLES
rentpropertyname1
rentpropertyaddress1
rentpropertyname1
rentpropertyaddress1
rentpropertyname1
rentpropertyaddress1
35
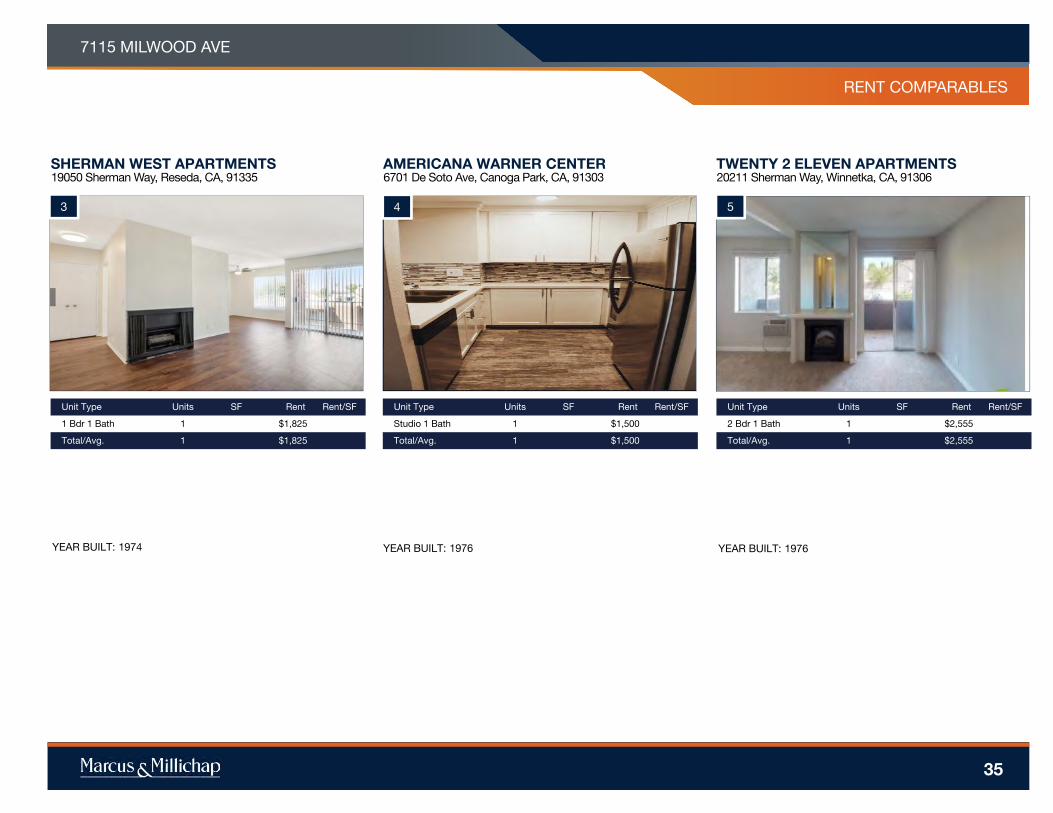
YEAR BUILT: 1974
3
Unit Type Units SF Rent Rent/SF
1 Bdr 1 Bath 1 $1,825
Total/Avg. 1 $1,825
SHERMAN WEST APARTMENTS19050 Sherman Way, Reseda, CA, 91335
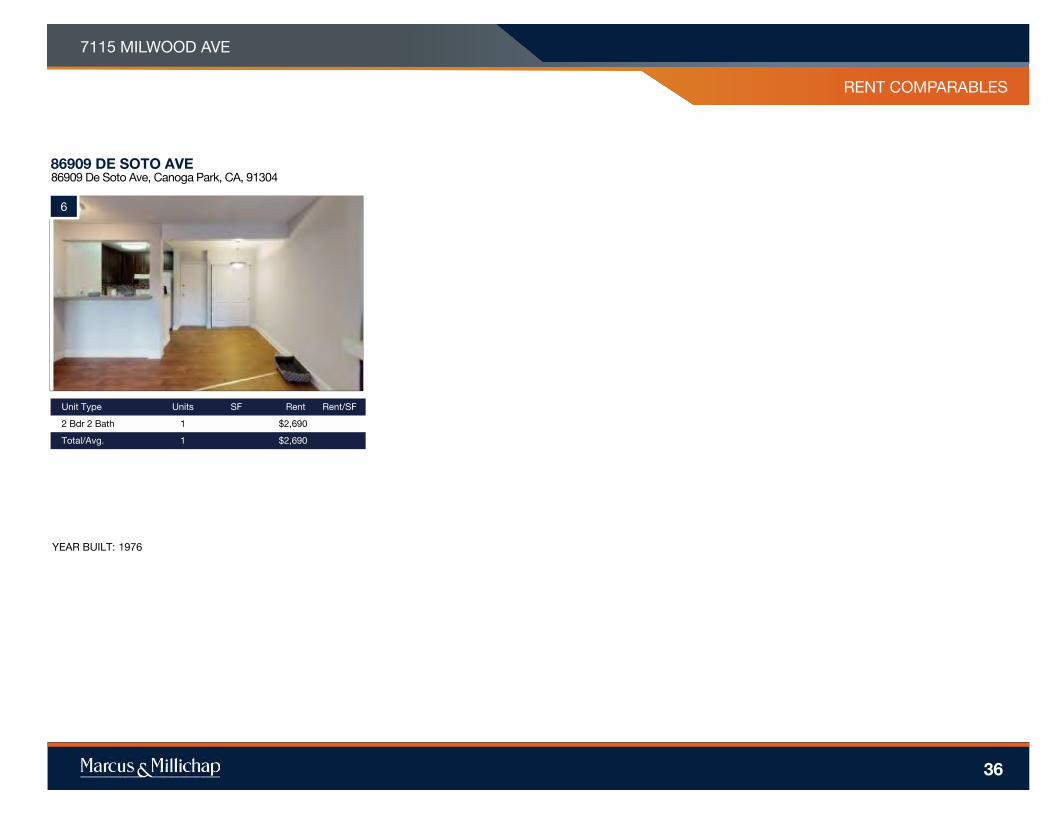
YEAR BUILT: 1976
4
Unit Type Units SF Rent Rent/SF
Studio 1 Bath 1 $1,500
Total/Avg. 1 $1,500
AMERICANA WARNER CENTER6701 De Soto Ave, Canoga Park, CA, 91303
5
YEAR BUILT: 1976
Unit Type Units SF Rent Rent/SF
2 Bdr 1 Bath 1 $2,555
Total/Avg. 1 $2,555
TWENTY 2 ELEVEN APARTMENTS20211 Sherman Way, Winnetka, CA, 91306
PROPERTY NAME
MARKETING TEAM
7115 MILWOOD AVE
RENT COMPARABLES
rentpropertyname1
rentpropertyaddress1
rentpropertyname1
rentpropertyaddress1
rentpropertyname1
rentpropertyaddress1
36
YEAR BUILT: 1976
6
Unit Type Units SF Rent Rent/SF
2 Bdr 2 Bath 1 $2,690
Total/Avg. 1 $2,690
86909 DE SOTO AVE86909 De Soto Ave, Canoga Park, CA, 91304
7115 MILWOOD AVE
37
MARKET
OVERVIEW

MARKET OVERVIEW
OVERVIEWSAN FERNANDO VALLEY
DIVERSE ECONOMY
While the entertainment industry underpins the economy, other economic drivers include aerospace, insurance and healthcare.
EDUCATED WORKFORCE
Roughly 36 percent of San Fernando Valley residents who are age 25 and older hold a bachelor’s degree and 13 percent also obtained a graduate or professional degree.
GROWTH
Population and household growth will increase faster than other large metros in Southern California, generating a demand for housing, and goods and services.
Approximately 2.5 million people reside in the San Fernando Valley,
which includes the submarkets of Northridge-Northwest San Fernando
Valley, Van Nuys-Northeast San Fernando Valley, Woodland Hills,
Burbank-Glendale-Pasadena and Sherman Oaks-North Hollywood-
Encino. The area’s population is expected to increase by 36,000
residents through 2023. Many people are attracted by the region’s more
affordable home prices.
Known for its entertainment industry, the Valley boasts more than 100 soundstages. Entertainment
giants calling the Valley home include Walt Disney Co., Universal Studios, Warner Brothers,
DreamWorks and Paramount Ranch.
Aerospace giants Boeing and Northrop Grumman as well as 21st Century Insurance generate
numerous well-paying jobs.
Healthcare is also a major source of employment and providers here include Kaiser Permanente and
Providence Health & Services. As a result of its large concentration of high salaries and successful
companies, household incomes are above the national average.
DEMOGRAPHICS
1
ECONOMY
METRO HIGHLIGHTS
* Forecast
Sources: Marcus & Millichap Research Services; BLS; Bureau of Economic Analysis; Experian; Fortune; Moody’s Analytics; U.S. Census Bureau
7115 MILWOOD AVE
2.5M
2018POPULATION:
875K
2018HOUSEHOLDS:
38.9
2018MEDIAN AGE:
$69,800
2018 MEDIAN HOUSEHOLD INCOME:
U.S. Median:
38.0U.S. Median:
$58,8002.6%
Growth2018-2023*:
1.4%
Growth2018-2023*:

PROPERTY NAME
MARKETING TEAM
7115 MILWOOD AVE
DEMOGRAPHICS
Source: © 2018 Experian
Created on June 2019
POPULATION 1 Miles 3 Miles 5 Miles
2023 Projection
Total Population 44,598 227,853 454,278
2018 Estimate
Total Population 42,530 222,558 445,713
2010 Census
Total Population 40,124 212,807 428,732
2000 Census
Total Population 35,308 198,420 404,781
Daytime Population
2018 Estimate 41,098 258,172 514,583
HOUSEHOLDS 1 Miles 3 Miles 5 Miles
2023 Projection
Total Households 14,921 79,444 162,198
2018 Estimate
Total Households 13,945 76,768 157,697
Average (Mean) Household Size 3.03 2.86 2.79
2010 Census
Total Households 12,873 72,557 150,271
2000 Census
Total Households 10,940 69,315 145,736
Growth 2015-2020 7.00% 3.49% 2.85%
HOUSING UNITS 1 Miles 3 Miles 5 Miles
Occupied Units
2023 Projection 14,921 79,444 162,198
2018 Estimate 14,911 79,840 162,967
Owner Occupied 3,693 38,345 86,025
Renter Occupied 10,252 38,423 71,673
Vacant 966 3,072 5,270
Persons In Units
2018 Estimate Total Occupied Units 13,945 76,768 157,697
1 Person Units 24.04% 23.96% 23.91%
2 Person Units 25.13% 27.73% 29.27%
3 Person Units 16.26% 17.34% 17.40%
4 Person Units 14.99% 15.49% 15.30%
5 Person Units 9.10% 7.94% 7.61%
6+ Person Units 10.48% 7.55% 6.51%
HOUSEHOLDS BY INCOME 1 Miles 3 Miles 5 Miles
2018 Estimate
$200,000 or More 3.09% 6.80% 9.84%
$150,000 - $199,000 3.93% 7.82% 8.34%
$100,000 - $149,000 12.41% 17.19% 17.59%
$75,000 - $99,999 11.72% 13.76% 12.99%
$50,000 - $74,999 21.34% 18.36% 17.01%
$35,000 - $49,999 12.65% 10.42% 9.92%
$25,000 - $34,999 12.23% 8.66% 7.74%
$15,000 - $24,999 10.59% 7.75% 7.44%
Under $15,000 12.03% 9.22% 9.14%
Average Household Income $70,329 $94,830 $107,050
Median Household Income $53,328 $68,777 $73,105
Per Capita Income $23,170 $32,906 $38,053
POPULATION PROFILE 1 Miles 3 Miles 5 Miles
Population By Age
2018 Estimate Total Population 42,530 222,558 445,713
Under 20 25.89% 23.00% 21.98%
20 to 34 Years 27.65% 22.47% 21.14%
35 to 39 Years 8.36% 7.10% 6.50%
40 to 49 Years 14.14% 14.11% 13.82%
50 to 64 Years 15.67% 19.33% 20.55%
Age 65+ 8.29% 13.99% 16.03%
Median Age 33.08 38.16 40.30
Population 25+ by Education Level
2018 Estimate Population Age 25+ 28,341 157,013 319,389
Elementary (0-8) 14.21% 7.94% 6.30%
Some High School (9-11) 11.60% 7.89% 6.80%
High School Graduate (12) 24.16% 21.72% 20.36%
Some College (13-15) 17.87% 20.74% 20.82%
Associate Degree Only 5.39% 7.31% 7.33%
Bachelors Degree Only 15.79% 21.94% 23.78%
Graduate Degree 5.81% 9.78% 12.41%
Population by Gender
2018 Estimate Total Population 42,530 222,558 445,713
Male Population 51.36% 49.53% 49.25%
Female Population 48.64% 50.47% 50.75%
39

Income
In 2018, the median household income for your selected geography is
$53,328, compare this to the US average which is currently $58,754.
The median household income for your area has changed by 41.74%
since 2000. It is estimated that the median household income in your
area will be $61,194 five years from now, which represents a change
of 14.75% from the current year.
The current year per capita income in your area is $23,170, compare
this to the US average, which is $32,356. The current year average
household income in your area is $70,329, compare this to the US
average which is $84,609.
Population
In 2018, the population in your selected geography is 42,530. The
population has changed by 20.45% since 2000. It is estimated that
the population in your area will be 44,598.00 five years from now,
which represents a change of 4.86% from the current year. The
current population is 51.36% male and 48.64% female. The median
age of the population in your area is 33.08, compare this to the US
average which is 37.95. The population density in your area is
13,535.28 people per square mile.
Households
There are currently 13,945 households in your selected geography.
The number of households has changed by 27.47% since 2000. It is
estimated that the number of households in your area will be 14,921
five years from now, which represents a change of 7.00% from the
current year. The average household size in your area is 3.03 persons.
Employment
In 2018, there are 23,670 employees in your selected area, this is also
known as the daytime population. The 2000 Census revealed that
51.67% of employees are employed in white-collar occupations in
this geography, and 47.82% are employed in blue-collar occupations.
In 2018, unemployment in this area is 5.26%. In 2000, the average
time traveled to work was 31.00 minutes.
Race and Ethnicity
The current year racial makeup of your selected area is as follows:
46.08% White, 4.60% Black, 0.14% Native American and 13.40%
Asian/Pacific Islander. Compare these to US averages which are:
70.20% White, 12.89% Black, 0.19% Native American and 5.59%
Asian/Pacific Islander. People of Hispanic origin are counted
independently of race.
People of Hispanic origin make up 60.29% of the current year
population in your selected area. Compare this to the US average of
18.01%.
PROPERTY NAME
MARKETING TEAM
7115 MILWOOD AVE
Housing
The median housing value in your area was $428,792 in 2018,
compare this to the US average of $201,842. In 2000, there were
3,627 owner occupied housing units in your area and there were
7,314 renter occupied housing units in your area. The median rent at
the time was $623.
Source: © 2018 Experian
DEMOGRAPHICS
40