of the securities exchange act of 1934 or …€¦ · x quarterly report pursuant to section 13 or...
TRANSCRIPT

United States Securities and Exchange Commission
Washington, D.C. 20549
Form 10-Q
x QUARTERLY REPORT PURSUANT TO SECTION 13 OR 15(d) OF THE SECURITIES EXCHANGE ACT OF 1934
For the quarterly period ended September 30, 2017
OR
¨ TRANSITION REPORT PURSUANT TO SECTION 13 OR 15(d)
OF THE SECURITIES EXCHANGE ACT OF 1934
For the transition period from ________ to ________
Commission file number 1-8974
Indicate by check mark whether the registrant (1) has filed all reports required to be filed by Section 13 or 15(d) of the Securities Exchange Act of 1934 during the preceding 12 months (or for such shorter period that the registrant was required to file such reports), and (2) has been subject to such filing requirements for the past 90 days. Yes x No ¨ Indicate by check mark whether the registrant has submitted electronically and posted on its corporate Web site, if any, every Interactive Data File required to be submitted and posted pursuant to Rule 405 of Regulation S-T (§232.405 of this chapter) during the preceding 12 months (or for such shorter period that the registrant was required to submit and post such files). Yes x No ¨ Indicate by check mark whether the Registrant is a large accelerated filer, an accelerated filer, a non-accelerated filer, smaller reporting company, or an emerging growth company. See definitions of “large accelerated filer,” “accelerated filer,” “smaller reporting company,” and “emerging growth company” in Rule 12b-2 of the Exchange Act. (Check one):
If an emerging growth company, indicate by check mark if the registrant has elected not to use the extended transition period for complying with any new or revised financial accounting standards pursuant to section 13(a) of the Exchange Act. ¨
Honeywell International Inc.(Exact name of registrant as specified in its charter)
Delaware 22-2640650 (State or other jurisdiction of (I.R.S. Employer incorporation or organization) Identification No.) 115 Tabor Road
Morris Plains, New Jersey
07950
(Address of principal executive offices) (Zip Code)
(973) 455-2000 (Registrant’s telephone number, including area code) Not Applicable (Former name, former address and former fiscal year, if changed since last report)
Large accelerated filer x Accelerated filer ¨Non-Accelerated filer ¨ (Do not check if a smaller reporting company) Smaller reporting company ¨ Emerging growth company ¨

Indicate by check mark whether the Registrant is a shell company (as defined in Rule 12b-2 of the Exchange Act). Yes ¨ No x There were 761,822,773 shares of Common Stock outstanding at September 30, 2017.

Honeywell International Inc. Index
Cautionary Statement about Forward-Looking Statements This report contains “forward-looking statements” within the meaning of Section 21E of the Securities Exchange Act of 1934. Forward-looking statements are those that address activities, events or developments that we or our management intends, expects, projects, believes or anticipates will or may occur in the future. They are based on management’s assumptions and assessments in the light of past experience and trends, current economic and industry conditions, expected future developments and other relevant factors. They are not guarantees of future performance, and actual results, developments and business decisions may differ from those envisaged by our forward-looking statements, including with respect to any changes in or abandonment of the proposed spin-offs. Our forward-looking statements are also subject to risks and uncertainties, which can affect our performance in both the near- and long-term. These forward-looking statements should be considered in the light of the information included in this report and our other filings with the Securities and Exchange Commission, including, without limitation, the Risk Factors, as well as the description of trends and other factors in Management’s Discussion and Analysis of Financial Condition and Results of Operations, set forth in our 2016 Annual Report on Form 10-K.
Part I. Financial Information Page No. Item 1. Financial Statements: Consolidated Statement of Operations (unaudited) –
Three and Nine Months Ended September 30, 2017 and 2016 3 Consolidated Statement of Comprehensive Income (unaudited) –
Three and Nine Months Ended September 30, 2017 and 2016 4 Consolidated Balance Sheet (unaudited) –
September 30, 2017 and December 31, 2016 5 Consolidated Statement of Cash Flows (unaudited) –
Nine Months Ended September 30, 2017 and 2016 6 Notes to Consolidated Financial Statements (unaudited) 7 Item 2. Management’s Discussion and Analysis of Financial Condition and Results of Operations 23 Item 3. Quantitative and Qualitative Disclosures About Market Risks 31 Item 4. Controls and Procedures 31 Part II. Other Information Item 1. Legal Proceedings 32 Item 1A. Risk Factors 32 Item 2. Unregistered Sales of Equity Securities and Use of Proceeds 33 Item 5. Other Information 33 Item 6. Exhibits 33 Signatures 34
2

PART I. FINANCIAL INFORMATION
The financial statements and related footnotes as of September 30, 2017 should be read in conjunction with the financial statements for the year ended December 31, 2016 contained in our 2016 Annual Report on Form 10-K.
ITEM 1. FINANCIAL STATEMENTS
Honeywell International Inc. Consolidated Statement of Operations
(Unaudited)
The Notes to Consolidated Financial Statements are an integral part of this statement.
Three Months Ended Nine Months Ended September 30, September 30, 2017 2016 2017 2016 (Dollars in millions, except per share amounts)
Product sales $ 8,052 $ 7,744 $ 23,671 $ 23,398 Service sales 2,069 2,060 6,020 5,919 Net sales 10,121 9,804 29,691 29,317 Costs, expenses and other
Cost of products sold 5,648 5,594 16,545 16,545 Cost of services sold 1,225 1,309 3,534 3,726
6,873 6,903 20,079 20,271 Selling, general and administrative expenses 1,447 1,367 4,177 3,976 Other (income) expense (63) (180) (85) (197)Interest and other financial charges 81 82 235 252
8,338 8,172 24,406 24,302 Income before taxes 1,783 1,632 5,285 5,015 Tax expense 418 384 1,188 1,214 Net income 1,365 1,248 4,097 3,801 Less: Net income attributable to the noncontrolling interest 17 8 31 26
Net income attributable to Honeywell $ 1,348 $ 1,240 $ 4,066 $ 3,775
Earnings per share of common stock - basic $ 1.77 $ 1.62 $ 5.33 $ 4.93
Earnings per share of common stock - assuming dilution $ 1.75 $ 1.60 $ 5.26 $ 4.86
Cash dividends per share of common stock $ 0.6650 $ 0.5950 $ 1.9950 $ 1.7850
3

Honeywell International Inc. Consolidated Statement of Comprehensive Income
(Unaudited)
The Notes to Consolidated Financial Statements are an integral part of this statement.
Three Months Ended Nine Months Ended September 30, September 30, 2017 2016 2017 2016 (Dollars in millions)Net income $ 1,365 $ 1,248 $ 4,097 $ 3,801
Other comprehensive income (loss), net of tax Foreign exchange translation adjustment 56 35 112 83
Prior service credit (cost) - - (46) - Actuarial (gains) losses recognized 2 4 7 11 Prior service (credit) cost recognized (17) (20) (49) (58)
Pension and other postretirement benefits adjustments (15) (16) (88) (47)Effective portion of cash flow hedges recognized in other
comprehensive income (loss) (36) (7) (98) (1)Less: Reclassification adjustment for gains (losses)
included in net income 9 (5) 52 (18)Changes in fair value of effective cash flow hedges (45) (2) (150) 17
Other comprehensive income (loss), net of tax (4) 17 (126) 53 Comprehensive income 1,361 1,265 3,971 3,854
Less: Comprehensive income attributable to the noncontrolling interest 18 8 36 23
Comprehensive income attributable to Honeywell $ 1,343 $ 1,257 $ 3,935 $ 3,831
4

Honeywell International Inc. Consolidated Balance Sheet
(Unaudited)
The Notes to Consolidated Financial Statements are an integral part of this statement.
September 30, December 31, 2017 2016 (Dollars in millions)ASSETS Current assets:
Cash and cash equivalents $ 7,389 $ 7,843 Short-term investments 2,781 1,520 Accounts receivable - net 8,587 8,177 Inventories 4,751 4,366 Other current assets 1,136 1,152
Total current assets 24,644 23,058 Investments and long-term receivables 643 587 Property, plant and equipment - net 5,757 5,793 Goodwill 18,268 17,707 Other intangible assets - net 4,587 4,634 Insurance recoveries for asbestos related liabilities 411 417 Deferred income taxes 264 347 Other assets 2,194 1,603
Total assets $ 56,768 $ 54,146
LIABILITIES Current liabilities:
Accounts payable $ 6,061 $ 5,690 Commercial paper and other short-term borrowings 3,932 3,366 Current maturities of long-term debt 1,398 227 Accrued liabilities 6,834 7,048
Total current liabilities 18,225 16,331 Long-term debt 11,453 12,182 Deferred income taxes 300 486 Postretirement benefit obligations other than pensions 530 473 Asbestos related liabilities 1,004 1,014 Other liabilities 4,025 4,110 Redeemable noncontrolling interest 3 3 SHAREOWNERS’ EQUITY Capital - common stock issued 958 958
- additional paid-in capital 6,115 5,781 Common stock held in treasury, at cost (14,406) (13,366)Accumulated other comprehensive loss (2,840) (2,714)Retained earnings 31,247 28,710
Total Honeywell shareowners’ equity 21,074 19,369 Noncontrolling interest 154 178
Total shareowners’ equity 21,228 19,547
Total liabilities, redeemable noncontrolling interest and shareowners’ equity $ 56,768 $ 54,146
5

Honeywell International Inc. Consolidated Statement of Cash Flows
(Unaudited)
The Notes to Consolidated Financial Statements are an integral part of this statement.
Nine Months Ended September 30, 2017 2016 (Dollars in millions)Cash flows from operating activities:
Net income $ 4,097 $ 3,801 Less: Net income attributable to the noncontrolling interest 31 26 Net income attributable to Honeywell 4,066 3,775 Adjustments to reconcile net income attributable to Honeywell to net cash provided by
operating activities: Depreciation 534 546 Amortization 298 227 (Gain) loss on sale of non-strategic businesses and assets - (176)Repositioning and other charges 583 567 Net payments for repositioning and other charges (394) (420)Pension and other postretirement income (562) (471)Pension and other postretirement benefit payments (71) (110)Stock compensation expense 133 145 Deferred income taxes (76) 146 Other (38) (33)Changes in assets and liabilities, net of the effects of acquisitions and divestitures:
Accounts receivable (408) (492)Inventories (400) (233)Other current assets 13 - Accounts payable 404 (18)Accrued liabilities (288) 3
Net cash provided by operating activities 3,794 3,456 Cash flows from investing activities:
Expenditures for property, plant and equipment (613) (749)Proceeds from disposals of property, plant and equipment 46 4 Increase in investments (4,149) (3,083)Decrease in investments 2,793 2,658 Cash paid for acquisitions, net of cash acquired (72) (2,568)Proceeds from sales of businesses, net of fees paid - 304 Other (196) 158
Net cash used for investing activities (2,191) (3,276) Cash flows from financing activities:
Proceeds from issuance of commercial paper and other short-term borrowings 8,808 16,149 Payments of commercial paper and other short-term borrowings (8,608) (16,574)Proceeds from issuance of common stock 463 386 Proceeds from issuance of long-term debt 39 4,510 Payments of long-term debt (69) (478)Repurchases of common stock (1,335) (1,866)Cash dividends paid (1,554) (1,410)Payments to purchase the noncontrolling interest - (238)AdvanSix pre-separation funding - 269 AdvanSix pre-spin borrowing - 38 AdvanSix cash at spin-off - (38)Other (131) (40)
Net cash (used for) provided by financing activities (2,387) 708 Effect of foreign exchange rate changes on cash and cash equivalents 330 88 Net (decrease) increase in cash and cash equivalents (454) 976 Cash and cash equivalents at beginning of period 7,843 5,455
Cash and cash equivalents at end of period 7,389 6,431
6

Honeywell International Inc. Notes to Consolidated Financial Statements
(Unaudited) (Dollars in millions, except per share amounts)
Note 1. Basis of Presentation
In the opinion of management, the accompanying unaudited consolidated financial statements reflect all adjustments, consisting only of normal recurring adjustments, necessary to present fairly the financial position of Honeywell International Inc. and its consolidated subsidiaries (Honeywell or the Company) at September 30, 2017 and 2016 and the results of operations for the three and nine months ended September 30, 2017 and 2016 and the cash flows for the nine months ended September 30, 2017 and 2016. The results of operations for the three and nine months ended September 30, 2017 and cash flows for the nine months ended September 30, 2017 should not necessarily be taken as indicative of the entire year.
We report our quarterly financial information using a calendar convention; the first, second and third quarters are consistently
reported as ending on March 31, June 30 and September 30. It has been our practice to establish actual quarterly closing dates using a predetermined fiscal calendar, which requires our businesses to close their books on a Saturday in order to minimize the potentially disruptive effects of quarterly closing on our business processes. The effects of this practice are generally not significant to reported results for any quarter and only exist within a reporting year. In the event that differences in actual closing dates are material to year-over-year comparisons of quarterly or year-to-date results, we will provide appropriate disclosures. Our actual closing dates for the three and nine months ended September 30, 2017 and 2016 were September 30, 2017 and October 1, 2016.
Certain prior year amounts have been reclassified to conform to current year presentation.
Note 2. Recent Accounting Pronouncements
We consider the applicability and impact of all Accounting Standards Updates (ASUs) issued by Financial Accounting Standards Board (FASB). ASUs not listed below were assessed and determined to be either not applicable or are expected to have minimal impact on our consolidated result of operations, financial position and cash flows (Consolidated Financial Statements).
In May 2014, and in following related amendments, the FASB issued guidance on revenue from contracts with customers that
will supersede most current revenue recognition guidance, including industry-specific guidance. The underlying principle is that an entity will recognize revenue to depict the transfer of goods or services to customers at an amount that the entity expects to be entitled to in exchange for those goods or services. The guidance provides a five-step analysis of transactions to determine when and how revenue is recognized. Other major provisions include capitalization of certain contract costs, consideration of time value of money in the transaction price, and allowing estimates of variable consideration to be recognized before contingencies are resolved in certain circumstances. The guidance also requires enhanced disclosures regarding the nature, amount, timing and uncertainty of revenue and cash flows arising from an entity’s contracts with customers.
The effective date is for interim and annual periods beginning on or after December 15, 2017. The guidance permits the use of
either a full retrospective or modified retrospective transition method. We will adopt the requirements of the new standard effective January 1, 2018 and expect to use the modified retrospective transition method with the cumulative effect to the opening balance of retained earnings recognized as of the date of initial adoption. We believe we are following an appropriate timeline to allow for proper recognition, presentation and disclosure upon adoption, including the related impacts to internal controls.
The Company’s evaluation of the new standard is substantially complete and the Company has prepared an initial assessment
of the impacts of adoption on its Consolidated Financial Statements and disclosures. The FASB has issued, and may issue in the future, interpretive guidance which may cause our evaluation to change. We will continue to evaluate the adoption impact of the new standard, including as it relates to new contracts that will be recognized following adoption. Based on the evaluation of our current contracts and revenue streams, recognition will be mostly consistent under both the current and new standard. However, we expect the guidance in certain areas, particularly in our Aerospace segment, to impact our current revenue recognition policies.
7

Honeywell International Inc. Notes to Consolidated Financial Statements
(Unaudited) (Dollars in millions, except per share amounts)
The current accounting policy for costs incurred for nonrecurring engineering and development activities of our Aerospace
products under agreements with commercial customers is generally to record the expense as incurred. Any customer funding received for such efforts is recognized when earned as a reduction of cost of sales. Following adoption of the new standard, the customer funding will generally be classified as revenue and not as a reduction of cost of sales. Such revenue will be deferred and subsequently recognized as products are delivered to the customers. Additionally, under the new guidance, expenses incurred, up to the customer agreed funded amount, will be deferred as an asset and subsequently recognized as cost of sales also when products are delivered to the customer. Hence, the new guidance will result in an increase in deferred costs (asset) and deferred revenue (liability) on our Consolidated Balance Sheet, however, we expect this to result in no net impact to income before taxes.
In addition, we expect revenues for our mechanical service programs at our Aerospace business to be impacted. Our current policy is to recognize revenue over time as costs are incurred (input method). Following adoption, we will continue to recognize revenue over time, but recognition will reflect a series of distinct services using the output method. This change will result in certain unbilled receivables or deferred revenue being eliminated through retained earnings, but we do not expect a material impact.
We do not currently expect the new standard to have a material impact on our consolidated financial position or results of
operations. We expect the new standard will have no cash impact and, as such, does not affect the economics of our underlying customer contracts. The disclosures in our notes to Consolidated Financial Statements related to revenue recognition will be significantly expanded under the new standard, specifically around the quantitative and qualitative information about performance obligations, changes in contract assets and liabilities, and disaggregation of revenue.
In February 2016, the FASB issued guidance on accounting for leases which requires lessees to recognize most leases on their
balance sheets for the rights and obligations created by those leases. The guidance requires enhanced disclosures regarding the amount, timing, and uncertainty of cash flows arising from leases that will be effective for interim and annual periods beginning after December 15, 2018, with early adoption permitted. We expect to adopt the requirements of the new standard effective January 1, 2019. The guidance requires the use of a modified retrospective approach. We are currently evaluating the impact of the guidance on our consolidated financial position, results of operations, and related notes to financial statements.
In October 2016, the FASB issued an accounting standard update which requires an entity to recognize the income tax
consequences of an intra-entity transfer of an asset, other than inventory, at the time the entity transfer occurs rather than when the asset is ultimately transferred to a third party, as required under current U.S. GAAP. The guidance is intended to reduce diversity in practice, particularly for transfers involving intellectual property. The guidance is effective for interim and annual periods beginning after December 15, 2017 with early adoption permitted. We expect to adopt the accounting standard update as of January 1, 2018. The guidance requires application on a modified retrospective basis. The impact upon adoption will result in an increase to deferred tax assets and liabilities, with the corresponding offset recorded as a cumulative-effect adjustment to retained earnings as of the beginning of the adoption period. Based on our assessment to date of historical transactions, we currently expect the impact to be up to an increase in deferred tax assets of approximately $500 million with a cumulative-effect adjustment to retained earnings of the same amount. We continue to evaluate the impact of this accounting standard update, and this estimated impact may change based on the finalization of our assessment and any new transactions prior to adoption of this guidance.
In March 2017, the FASB issued guidance on presentation of net periodic pension cost and net periodic postretirement benefit
cost. The new standard requires that an employer disaggregate the service cost component of net benefit cost. The employer will be required to report the service cost component in the same line item or items in the statement of operations as other compensation costs arising from services rendered by the pertinent employees during the period. The other components of net benefit cost will be required to be presented in the statement of operations separately from the service cost component, such as in other income and expense. The guidance is effective for fiscal years beginning after December 15, 2017. This guidance will impact the presentation of our Consolidated Financial Statements. Our current presentation of the service cost component is consistent with the requirements of the new standard. However, upon our adoption of the new standard, we expect to present the other components within Other (income) expense (we currently present the other components within Cost of products and services sold and Selling, general, and administrative expenses). All components will continue to be excluded from Segment Profit (see Note 10 Segment Financial Data).
8

Honeywell International Inc. Notes to Consolidated Financial Statements
(Unaudited) (Dollars in millions, except per share amounts)
In August 2017, the FASB issued amendments to hedge accounting guidance. These amendments are intended to better align
a company’s risk management strategies and financial reporting for hedging relationships. Under the new guidance, more hedging strategies will be eligible for hedge accounting and the application of hedge accounting is simplified. In addition, the new guidance amends presentation and disclosure requirements. The guidance is effective for fiscal years beginning after December 15, 2018 with early adoption permitted, including the interim periods within those years. The guidance requires the use of a modified retrospective approach. We are currently evaluating the impact of the guidance on our consolidated financial statements and whether we will early adopt this guidance. Note 3. Repositioning and Other Charges
A summary of repositioning and other charges follows:
The following table summarizes the pretax distribution of total net repositioning and other charges by income statement
classification:
Three Months Ended Nine Months Ended September 30, September 30, 2017 2016 2017 2016
Severance $ 75 $ 155 $ 177 $ 253 Asset impairments 22 11 57 42 Exit costs 11 36 20 41 Reserve adjustments (7) (31) (7) (92)
Total net repositioning charge 101 171 247 244 Asbestos related litigation charges, net of insurance 50 64 152 173 Probable and reasonably estimable environmental liabilities 62 49 167 132 Other 17 18 17 18
Total net repositioning and other charges $ 230 $ 302 $ 583 $ 567
Three Months Ended Nine Months Ended September 30, September 30, 2017 2016 2017 2016
Cost of products and services sold $ 193 $ 226 $ 503 $ 410 Selling, general and administrative expenses 37 53 54 110 Other - 23 26 47
$ 230 $ 302 $ 583 $ 567
9

Honeywell International Inc. Notes to Consolidated Financial Statements
(Unaudited) (Dollars in millions, except per share amounts)
The following table summarizes the pretax impact of total net repositioning and other charges by segment:
In the quarter ended September 30, 2017, we recognized repositioning charges totaling $108 million including severance costs
of $75 million related to workforce reductions of 1,700 manufacturing and administrative positions across our segments. The workforce reductions were primarily related to site transitions, mainly in Safety and Productivity Solutions and Aerospace, to more cost-effective locations and cost savings actions taken in connection with our productivity and ongoing functional transformation initiatives. The repositioning charges included asset impairments of $22 million primarily related to the write-down of a research and development facility in our Corporate segment in connection with a planned exit from such facility.
In the quarter ended September 30, 2016, we recognized repositioning charges totaling $202 million including severance costs
of $155 million related to workforce reductions of 3,017 manufacturing and administrative positions across our segments. The workforce reductions were primarily related to the separation of the former Automation and Control Solutions reporting segment into two new reporting segments (Home and Building Technologies and Safety and Productivity Solutions); factory transitions in Aerospace, Home and Building Technologies, Safety and Productivity Solutions and Performance Materials and Technologies to more cost-effective locations; and cost savings actions taken in connection with our productivity and ongoing functional transformation initiatives. The repositioning charge included exit costs of $36 million principally for expenses related to the spin-off of our AdvanSix business and closure obligations associated with factory transitions. Also, $31 million of previously established accruals for severance were returned to income as a result of higher attrition than anticipated in prior severance programs resulting in lower required severance payments, and changes in the scope of previously announced repositioning actions.
In the nine months ended September 30, 2017, we recognized repositioning charges totaling $254 million including severance costs of $177 million related to workforce reductions of 4,224 manufacturing and administrative positions across our segments. The workforce reductions were primarily related to cost savings actions taken in connection with our productivity and ongoing functional transformation initiatives and with site transitions, mainly in Aerospace and Safety and Productivity Solutions, to more cost-effective locations. The repositioning charges included asset impairments of $57 million primarily in our Corporate segment related to the write-down of a research and development facility in connection with a planned exit from such facility and legacy properties in connection with their planned sale.
In the nine months ended September 30, 2016, we recognized repositioning charges totaling $336 million including severance
costs of $253 million related to workforce reductions of 5,888 manufacturing and administrative positions across our segments. The workforce reductions were primarily related to cost savings actions taken in connection with our productivity and ongoing functional transformation initiatives; the separation of the former Automation and Control Solutions reporting segment into two new reporting segments; factory transitions in Aerospace, Home and Building Technologies, Safety and Productivity Solutions and Performance Materials and Technologies to more cost-effective locations; and achieving acquisition-related synergies. The repositioning charge included asset impairments of $42 million principally related to the write-off of certain intangible assets in connection with the sale of a Performance Materials and Technologies business. The repositioning charge included exit costs of $41 million principally for expenses related to the spin-off of our AdvanSix business and closure obligations associated with factory transitions. Also, $92 million of previously established accruals, primarily for severance, were returned to income as a result of higher attrition than anticipated in prior severance programs resulting in lower required severance payments, lower than expected severance costs in certain repositioning actions, and changes in the scope of previously announced repositioning actions.
Three Months Ended Nine Months Ended September 30, September 30, 2017 2016 2017 2016
Aerospace $ 59 $ 144 $ 216 $ 265 Home and Building Technologies 15 24 57 36 Performance Materials and Technologies 28 35 30 71 Safety and Productivity Solutions 34 10 34 4 Corporate 94 89 246 191
$ 230 $ 302 $ 583 $ 567
10

Honeywell International Inc. Notes to Consolidated Financial Statements
(Unaudited) (Dollars in millions, except per share amounts)
The following table summarizes the status of our total repositioning reserves:
Certain repositioning projects in 2017 and 2016 included exit or disposal activities, the costs related to which will be recognized
in future periods when the actual liability is incurred. Such exit and disposal costs are not expected to be significant.
Note 4. Earnings Per Share
The diluted earnings per share calculations exclude the effect of stock options when the options’ assumed proceeds exceed the
average market price of the common shares during the period. For the three and nine months ended September 30, 2017, the weighted average number of stock options excluded from the computations were 4.2 million and 3.8 million. For the three and nine months ended September 30, 2016, the weighted average number of stock options excluded from the computations were 5.5 million and 6.9 million. These stock options were outstanding at the end of each period.
Severance Asset Exit Costs Impairments Costs Total
December 31, 2016 $ 298 $ - $ 33 $ 331 Charges 177 57 20 254 Usage - cash (115) - (8) (123)Usage - noncash - (57) - (57)Foreign currency translation 16 - 2 18 Adjustments and reclassifications (4) - (10) (14)
September 30, 2017 $ 372 $ - $ 37 $ 409
Three Months Ended Nine Months Ended September 30, September 30,Basic 2017 2016 2017 2016
Net income attributable to Honeywell $ 1,348 $ 1,240 $ 4,066 $ 3,775 Weighted average shares outstanding 762.2 763.7 763.1 765.0 Earnings per share of common stock $ 1.77 $ 1.62 $ 5.33 $ 4.93
Three Months Ended Nine Months Ended September 30, September 30,Assuming Dilution 2017 2016 2017 2016
Net income attributable to Honeywell $ 1,348 $ 1,240 $ 4,066 $ 3,775 Average Shares
Weighted average shares outstanding 762.2 763.7 763.1 765.0 Dilutive securities issuable - stock plans 9.2 10.7 10.0 11.3 Total weighted average shares outstanding 771.4 774.4 773.1 776.3
Earnings per share of common stock $ 1.75 $ 1.60 $ 5.26 $ 4.86
11

Honeywell International Inc. Notes to Consolidated Financial Statements
(Unaudited) (Dollars in millions, except per share amounts)
Note 5. Accounts Receivable
Trade receivables include $1,898 million and $1,626 million of unbilled balances under long-term contracts as of September 30,
2017 and December 31, 2016. These amounts are billed in accordance with the terms of the customer contracts to which they relate.
Note 6. Inventories
September 30, December 31, 2017 2016
Trade $ 8,790 $ 8,449 Less - Allowance for doubtful accounts (203) (272)
$ 8,587 $ 8,177
September 30, December 31, 2017 2016
Raw materials $ 1,186 $ 1,104 Work in process 853 775 Finished products 2,750 2,552 4,789 4,431 Reduction to LIFO cost basis (38) (65)
$ 4,751 $ 4,366
12

Honeywell International Inc. Notes to Consolidated Financial Statements
(Unaudited) (Dollars in millions, except per share amounts)
Note 7. Long-term Debt and Credit Agreements
On April 28, 2017, the Company entered into Amendment No. 3 (Amendment) to the Amended and Restated $4 billion Credit
Agreement dated as of July 10, 2015, as amended by Amendment No. 1 dated as of September 30, 2015 and Amendment No. 2 dated as of April 29, 2016 (as so amended, the “Credit Agreement”), with a syndicate of banks. The Credit Agreement is maintained for general corporate purposes. Commitments under the Credit Agreement can be increased pursuant to the terms of the Credit Agreement to an aggregate amount not to exceed $4.5 billion. The Amendment, among other things, extends the Credit Agreement’s termination date from July 10, 2021 to April 28, 2022.
On April 28, 2017, the Company entered into a $1.5 billion 364-Day Credit Agreement (364-Day Credit Agreement) with a
syndicate of banks. The 364-Day Credit Agreement is maintained for general corporate purposes. A full description of the Amendment and 364-Day Credit Agreement can be found in the Company’s Current Report on Form 8-
K, dated April 28, 2017. There have been no borrowings under any of the credit agreements previously described.
Note 8. Financial Instruments and Fair Value Measures
Our credit, market, foreign currency and interest rate risk management policies are described in Note 14, Financial Instruments and Fair Value Measures, of Notes to Consolidated Financial Statements in our 2016 Annual Report on Form 10-K.
The following table sets forth the Company’s financial assets and liabilities that were accounted for at fair value on a recurring
basis:
September 30, December 31, 2017 2016
Floating rate Euro notes due 2018 $ 1,181 $ 1,054 1.40% notes due 2019 1,250 1,250 Floating rate notes due 2019 250 250 0.65% Euro notes due 2020 1,181 1,054 4.25% notes due 2021 800 800 1.85% notes due 2021 1,500 1,500 1.30% Euro notes due 2023 1,476 1,317 3.35% notes due 2023 300 300 2.50% notes due 2026 1,500 1,500 2.25% Euro notes due 2028 886 790 5.70% notes due 2036 550 550 5.70% notes due 2037 600 600 5.375% notes due 2041 600 600 Industrial development bond obligations, floating rate maturing at various dates through
2037 22 30 6.625% debentures due 2028 216 216 9.065% debentures due 2033 51 51 Other (including capitalized leases and debt issuance costs), 0.3% weighted average
maturing at various dates through 2023 488 547 $ 12,851 $ 12,409 Less: current portion (1,398) (227)
$ 11,453 $ 12,182
13

Honeywell International Inc. Notes to Consolidated Financial Statements
(Unaudited) (Dollars in millions, except per share amounts)
The foreign currency exchange contracts and interest rate swap agreements are valued using broker quotations or market
transactions in either the listed or over-the-counter markets. These derivative instruments are classified within level 2. The Company holds investments in certificates of deposits, time deposits and commercial paper that are designated as available for sale and are valued using published prices based on observable market data. These investments are classified within level 2. The Company also holds available for sale investments in U.S. government and corporate debt securities valued utilizing published prices based on quoted market pricing, which are classified within level 1.
The carrying value of cash and cash equivalents, accounts receivable, payables, commercial paper and short-term borrowings
contained in the Consolidated Balance Sheet approximates fair value. The following table sets forth the Company’s financial assets and liabilities that were not carried at fair value:
The Company determined the fair value of the long-term receivables by discounting based upon the terms of the receivable and
counterparty details including credit quality. As such, the fair value of these receivables is considered level 2. The Company determined the fair value of the long-term debt and related current maturities utilizing transactions in the listed markets for identical or similar liabilities. As such, the fair value of the long-term debt and related current maturities is considered level 2 as well.
Interest rate swap agreements are designated as hedge relationships with gains or losses on the derivative recognized in
Interest and other financial charges offsetting the gains and losses on the underlying debt being hedged. For the three and nine months ended September 30, 2017, we recognized $4 million and $6 million of losses in earnings on interest rate swap agreements. For the three and nine months ended September 30, 2016, we recognized $14 million of losses and $23 million of gains in earnings on interest rate swap agreements. Gains and losses are fully offset by losses and gains on the underlying debt being hedged.
We also economically hedge our exposure to changes in foreign exchange rates primarily with forward contracts. These
contracts are marked-to-market with the resulting gains and losses recognized in earnings offsetting the gains and losses on the non-functional currency denominated monetary assets and liabilities being hedged. We recognized $76 million and $194 million of expense in Other (income) expense for the three and nine months ended September 30, 2017. We recognized $24 million and $114 million of income in Other (income) expense for the three and nine months ended September 30, 2016.
September 30, December 31, 2017 2016
Assets: Foreign currency exchange contracts $ 29 $ 152 Available for sale investments 2,943 1,670 Interest rate swap agreements 58 69
Liabilities:
Foreign currency exchange contracts $ 73 $ 2 Interest rate swap agreements 43 48
September 30, 2017 December 31, 2016 Carrying Fair Carrying Fair Value Value Value Value
Assets Long-term receivables $ 271 $ 260 $ 280 $ 273
Liabilities Long-term debt and related current maturities $ 12,851 $ 13,661 $ 12,409 $ 13,008
14
Honeywell International Inc. Notes to Consolidated Financial Statements
(Unaudited) (Dollars in millions, except per share amounts)
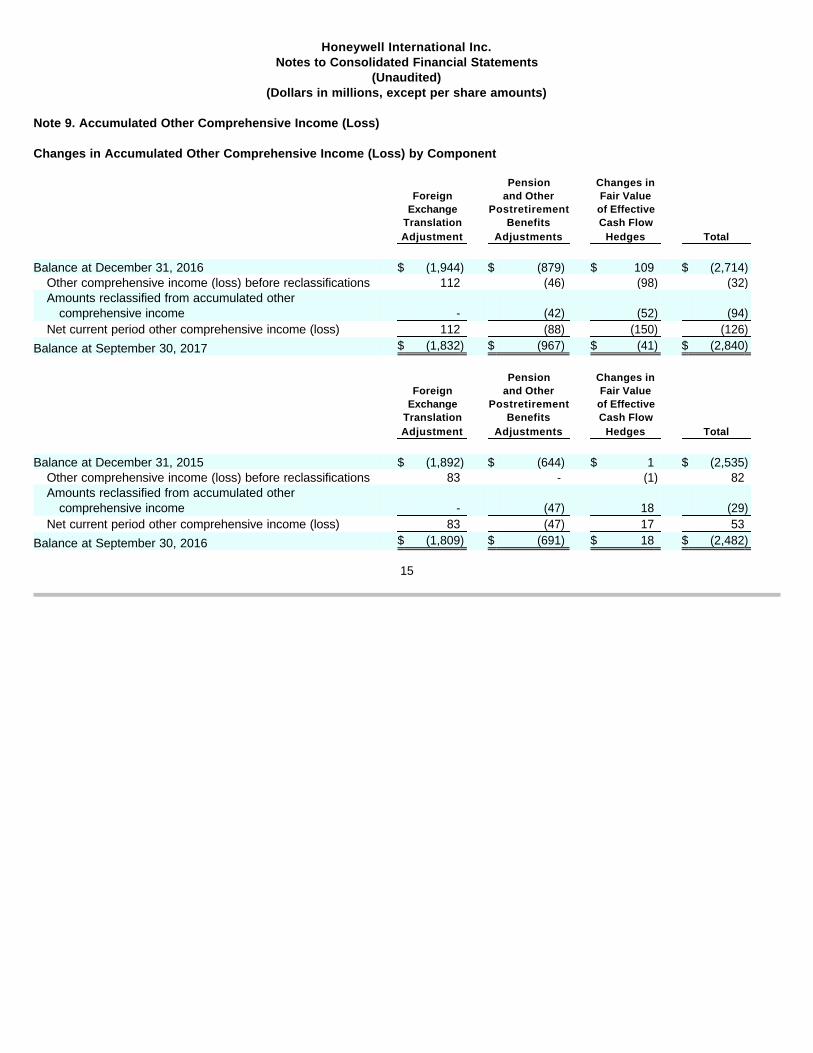
Note 9. Accumulated Other Comprehensive Income (Loss) Changes in Accumulated Other Comprehensive Income (Loss) by Component
Pension Changes in Foreign and Other Fair Value Exchange Postretirement of Effective Translation Benefits Cash Flow Adjustment Adjustments Hedges Total
Balance at December 31, 2016 $ (1,944) $ (879) $ 109 $ (2,714)
Other comprehensive income (loss) before reclassifications 112 (46) (98) (32)Amounts reclassified from accumulated other
comprehensive income - (42) (52) (94)Net current period other comprehensive income (loss) 112 (88) (150) (126)
Balance at September 30, 2017 $ (1,832) $ (967) $ (41) $ (2,840)
Pension Changes in Foreign and Other Fair Value Exchange Postretirement of Effective Translation Benefits Cash Flow Adjustment Adjustments Hedges Total
Balance at December 31, 2015 $ (1,892) $ (644) $ 1 $ (2,535)
Other comprehensive income (loss) before reclassifications 83 - (1) 82 Amounts reclassified from accumulated other
comprehensive income - (47) 18 (29)Net current period other comprehensive income (loss) 83 (47) 17 53
Balance at September 30, 2016 $ (1,809) $ (691) $ 18 $ (2,482)
15

Honeywell International Inc. Notes to Consolidated Financial Statements
(Unaudited) (Dollars in millions, except per share amounts)
Note 10. Segment Financial Data
We globally manage our business operations through four reportable operating segments. Segment information is consistent with how management reviews the businesses, makes investing and resource allocation decisions and assesses operating performance.
Honeywell’s senior management evaluates segment performance based on segment profit. Segment profit is measured as
segment income (loss) before taxes excluding general corporate unallocated expense, other income (expense), interest and other financial charges, stock compensation expense, pension and other postretirement income (expense), and repositioning and other charges.
(a) Equity income (loss) of affiliated companies is included in segment profit. (b) Amounts included in cost of products and services sold and selling, general and administrative expenses.
Three Months Ended Nine Months Ended September 30, September 30, 2017 2016 2017 2016
Net Sales Aerospace
Products $ 2,452 $ 2,358 $ 7,393 $ 7,404 Services 1,205 1,243 3,484 3,681
Total 3,657 3,601 10,877 11,085 Home and Building Technologies
Products 2,419 2,360 7,015 6,931 Services 371 341 1,064 923
Total 2,790 2,701 8,079 7,854 Performance Materials and Technologies
Products 1,846 1,924 5,320 5,822 Services 414 405 1,248 1,222
Total 2,260 2,329 6,568 7,044 Safety and Productivity Solutions
Products 1,335 1,102 3,943 3,241 Services 79 71 224 93
Total 1,414 1,173 4,167 3,334 $ 10,121 $ 9,804 $ 29,691 $ 29,317
Segment Profit Aerospace $ 780 $ 663 $ 2,395 $ 2,252 Home and Building Technologies 458 441 1,267 1,213 Performance Materials and Technologies 526 503 1,521 1,484 Safety and Productivity Solutions 213 172 621 495 Corporate (82) (59) (210) (157)
Total segment profit 1,895 1,720 5,594 5,287
Other income (expense)(a) 49 169 54 174 Interest and other financial charges (81) (82) (235) (252)Stock compensation expense(b) (39) (49) (133) (145)
Pension ongoing income(b) 183 146 546 447 Other postretirement income (expense)(b) 6 7 16 24
Repositioning and other charges (b) (230) (279) (557) (520)
Income before taxes $ 1,783 $ 1,632 $ 5,285 $ 5,015
16

Honeywell International Inc. Notes to Consolidated Financial Statements
(Unaudited) (Dollars in millions, except per share amounts)
Note 11. Pension Benefits
Net periodic pension benefit income for our significant defined benefit plans include the following components:
Note 12. Commitments and Contingencies Environmental Matters
Our environmental matters are described in Note 19 Commitments and Contingencies of Notes to Consolidated Financial
Statements in our 2016 Annual Report on Form 10-K. The following table summarizes information concerning our recorded liabilities for environmental costs:
Environmental liabilities are included in the following balance sheet accounts:
We do not currently possess sufficient information to reasonably estimate the amounts of environmental liabilities to be
recorded upon future completion of studies, litigation or settlements, and neither the timing nor the amount of the ultimate costs associated with environmental matters can be determined although they could be material to our consolidated results of operations and operating cash flows in the periods recognized or paid. However, considering our past experience and existing reserves, we do not expect that environmental matters will have a material adverse effect on our consolidated financial position.
U.S. Plans Three Months Ended Nine Months Ended September 30, September 30, 2017 2016 2017 2016 Service cost $ 43 $ 48 $ 129 $ 143 Interest cost 147 150 440 450 Expected return on plan assets (316) (306) (946) (918)Amortization of prior service (credit) (10) (11) (32) (33)
$ (136) $ (119) $ (409) $ (358)
Non-U.S. Plans Three Months Ended Nine Months Ended September 30, September 30, 2017 2016 2017 2016 Service cost $ 10 $ 11 $ 29 $ 36 Interest cost 37 43 109 137 Expected return on plan assets (104) (92) (305) (291)Amortization of prior service (credit) (1) - (1) (2)
$ (58) $ (38) $ (168) $ (120)
December 31, 2016 $ 511 Accruals for environmental matters deemed probable and
reasonably estimable 167 Environmental liability payments (116)Other 9
September 30, 2017 $ 571
September
30, December 31, 2017 2016
Accrued liabilities $ 252 $ 252 Other liabilities 319 259
$ 571 $ 511
17

Honeywell International Inc. Notes to Consolidated Financial Statements
(Unaudited) (Dollars in millions, except per share amounts)
Onondaga Lake, Syracuse, NY—In 2016, we largely completed a dredging/capping remedy of Onondaga Lake pursuant to a
consent decree approved by the United States District Court for the Northern District of New York in January 2007. Some additional long-term monitoring and maintenance activities will continue, as required by the consent decree. Honeywell is also conducting remedial investigations and activities at other sites in Syracuse. We have recorded reserves for these investigations and activities where appropriate.
Honeywell has entered into a cooperative agreement with potential natural resource trustees to assess alleged natural resource
damages relating to these sites. It is not possible to predict the outcome or duration of this assessment, or the amounts of, or responsibility for, any damages.
Asbestos Matters
Honeywell is a defendant in asbestos related personal injury actions related to two predecessor companies:
The following tables summarize information concerning NARCO and Bendix asbestos related balances:
NARCO and Bendix asbestos related balances are included in the following balance sheet accounts:
· North American Refractories Company (NARCO), which was sold in 1986, produced refractory products (bricks and cement used in high temperature applications). Claimants consist largely of individuals who allege exposure to NARCO asbestos-containing refractory products in an occupational setting.
· Bendix Friction Materials (Bendix) business, which was sold in 2014, manufactured automotive brake parts that contained chrysotile asbestos in an encapsulated form. Claimants consist largely of individuals who allege exposure to asbestos from brakes from either performing or being in the vicinity of individuals who performed brake replacements.
Asbestos Related Liabilities Bendix NARCO Total
December 31, 2016 $ 641 $ 919 $ 1,560 Accrual for update to estimated liability 148 22 170 Asbestos related liability payments (158) (21) (179)
September 30, 2017 $ 631 $ 920 $ 1,551
Insurance Recoveries for Asbestos Related Liabilities Bendix NARCO Total
December 31, 2016 $ 121 $ 319 $ 440 Probable insurance recoveries related to estimated liability 18 - 18 Insurance receipts for asbestos related liabilities (20) (4) (24)
September 30, 2017 $ 119 $ 315 $ 434
September 30, December 31, 2017 2016
Other current assets $ 23 $ 23 Insurance recoveries for asbestos related liabilities 411 417 $ 434 $ 440 Accrued liabilities $ 547 $ 546 Asbestos related liabilities 1,004 1,014 $ 1,551 $ 1,560
18

Honeywell International Inc. Notes to Consolidated Financial Statements
(Unaudited) (Dollars in millions, except per share amounts)
NARCO Products –In connection with NARCO’s emergence from bankruptcy on April 30, 2013, a federally authorized 524(g)
trust (NARCO Trust) was established for the evaluation and resolution of all existing and future NARCO asbestos claims. Both Honeywell and NARCO are protected by a permanent channeling injunction barring all present and future individual actions in state or federal courts and requiring all asbestos related claims based on exposure to NARCO asbestos-containing products to be made against the NARCO Trust. The NARCO Trust reviews submitted claims and determines award amounts in accordance with established Trust Distribution Procedures approved by the Bankruptcy Court which set forth the criteria claimants must meet to qualify for compensation including, among other things, exposure and medical criteria that determine the award amount. In addition, Honeywell provided, and continues to provide, input to the design of control procedures for processing NARCO claims, and has on-going audit rights to review and monitor the claims processor’s adherence to the established requirements of the Trust Distribution Procedures.
Honeywell is obligated to fund NARCO asbestos claims submitted to the NARCO Trust which qualify for payment under the Trust Distribution Procedures (Annual Contribution Claims), subject to annual caps of $140 million in the years 2017 and 2018 and $145 million for each year thereafter. However, the initial $100 million of claims processed through the NARCO Trust (the Initial Claims Amount) will not count against the annual cap and any unused portion of the Initial Claims Amount will roll over to subsequent years until fully utilized. In 2015, Honeywell filed suit against the NARCO Trust in Bankruptcy Court alleging breach of certain provisions of the Trust Agreement and Trust Distribution Procedures. The parties agreed to dismiss the proceeding without prejudice pursuant to an 18 month Standstill Agreement. Claims processing continued during this period subject to a defined dispute resolution process. The Standstill Agreement expired on October 12, 2017. Notwithstanding its expiration, claims processing will continue, and Honeywell will continue to negotiate and attempt to resolve remaining disputed issues. Honeywell reserves its right to seek judicial intervention should negotiations fail or prove futile. Honeywell has not made any payments to the NARCO Trust for Annual Contribution Claims and does not anticipate making any such payments for the remainder of 2017.
Honeywell is also responsible for payments due to claimants pursuant to settlement agreements reached during the pendency
of the NARCO bankruptcy proceedings that provide for the right to submit claims to the NARCO Trust subject to qualification under the terms of the settlement agreements and Trust Distribution Procedures criteria (Pre-established Unliquidated Claims), which amounts are estimated at $150 million and are expected to be paid during the initial years of trust operations ($5 million of which has been paid since the effective date of the NARCO Trust). Such payments are not subject to the annual cap described above.
Our consolidated financial statements reflect an estimated liability for Pre-established Unliquidated Claims ($145 million), as
well as unsettled claims pending as of the time NARCO filed for bankruptcy protection and operating and legal costs related to the Trust (collectively $32 million) and for the estimated value of future NARCO asbestos claims expected to be asserted against the NARCO Trust ($743 million). The estimate of future NARCO claims is based on a commonly accepted methodology used by numerous bankruptcy courts addressing 524(g) trusts and also reflects disputes concerning implementation of the Trust Distribution Procedures by the NARCO Trust, a lack of sufficient trust claims processing experience, as well as the stay of all NARCO asbestos claims which remained in place throughout NARCO’s Chapter 11 case. Some critical assumptions underlying this commonly accepted methodology include claims filing rates, disease criteria and payment values contained in the Trust Distribution Procedures, estimated approval rates of claims submitted to the NARCO Trust and epidemiological studies estimating disease instances. The estimated value of future NARCO claims was originally established at the time of the NARCO Chapter 11 filing reflecting claims expected to be asserted against NARCO over a fifteen year period. This projection resulted in a range of estimated liability of $743 million to $961 million. We believe that no amount within this range is a better estimate than any other amount, and accordingly, we have recorded the minimum amount in the range.
Our insurance receivable corresponding to the estimated liability for pending and future NARCO asbestos claims reflects
coverage which reimburses Honeywell for portions of NARCO-related indemnity and defense costs and is provided by a large number of insurance policies written by dozens of insurance companies in both the domestic insurance market and the London excess market. We conduct analyses to estimate the probable amount of insurance that is recoverable for asbestos claims. While the substantial majority of our insurance carriers are solvent, some of our individual carriers are insolvent, which has been considered in our analysis of probable recoveries. We made judgments concerning insurance coverage that we believe are reasonable and consistent with our historical dealings and our knowledge of any pertinent solvency issues surrounding insurers.
19

Honeywell International Inc. Notes to Consolidated Financial Statements
(Unaudited) (Dollars in millions, except per share amounts)
Projecting future events is subject to many uncertainties that could cause the NARCO-related asbestos liabilities or assets to
be higher or lower than those projected and recorded. Given the uncertainties, we review our estimates periodically, and update them based on our experience and other relevant factors. Similarly, we will reevaluate our projections concerning our probable insurance recoveries in light of any changes to the projected liability or other developments that may impact insurance recoveries.
Bendix Products—The following tables present information regarding Bendix related asbestos claims activity:
Honeywell has experienced average resolution values per claim excluding legal costs as follows:
It is not possible to predict whether resolution values for Bendix-related asbestos claims will increase, decrease or stabilize in
the future. Our consolidated financial statements reflect an estimated liability for resolution of pending (claims actually filed as of the
financial statement date) and future Bendix-related asbestos claims. We have valued Bendix pending and future claims using average resolution values for the previous five years. We update the resolution values used to estimate the cost of Bendix pending and future claims during the fourth quarter each year.
The liability for future claims represents the estimated value of future asbestos related bodily injury claims expected to be
asserted against Bendix over the next five years. Such estimated cost of future Bendix-related asbestos claims is based on historic claims filing experience and dismissal rates, disease classifications, and resolution values in the tort system for the previous five years. In light of the uncertainties inherent in making long-term projections, as well as certain factors unique to friction product asbestos claims, we do not believe that we have a reasonable basis for estimating asbestos claims beyond the next five years. The methodology used to estimate the liability for future claims is similar to that used to estimate the liability for future NARCO-related asbestos claims.
Our insurance receivable corresponding to the liability for settlement of pending and future Bendix asbestos claims reflects
coverage which is provided by a large number of insurance policies written by dozens of insurance companies in both the domestic insurance market and the London excess market. Based on our ongoing analysis of the probable insurance recovery, insurance receivables are recorded in the financial statements simultaneous with the recording of the estimated liability for the underlying asbestos claims. This determination is based on our analysis of the underlying insurance policies, our historical experience with our insurers, our ongoing review of the solvency of our insurers, judicial determinations relevant to our insurance programs, and our consideration of the impacts of any settlements reached with our insurers.
Nine Months Ended Years Ended September 30, December 31,Claims Activity 2017 2016 2015
Claims Unresolved at the beginning of period 7,724 7,779 9,267 Claims Filed 1,976 2,830 2,862 Claims Resolved (2,925) (2,885) (4,350)Claims Unresolved at the end of period 6,775 7,724 7,779
September 30, December 31,Disease Distribution of Unresolved Claims 2017 2016 2015
Mesothelioma and Other Cancer Claims 3,102 3,490 3,772 Nonmalignant Claims 3,673 4,234 4,007
Total Claims 6,775 7,724 7,779
Years Ended December 31, 2016 2015 2014 2013 2012 (in whole dollars)Malignant claims $ 44,000 $ 44,000 $ 53,500 $ 51,000 $ 49,000 Nonmalignant claims $ 4,485 $ 100 $ 120 $ 850 $ 1,400
20

Honeywell International Inc. Notes to Consolidated Financial Statements
(Unaudited) (Dollars in millions, except per share amounts)
Honeywell believes it has sufficient insurance coverage and reserves to cover all pending Bendix-related asbestos claims and
Bendix-related asbestos claims estimated to be filed within the next five years. Although it is impossible to predict the outcome of either pending or future Bendix-related asbestos claims, we do not believe that such claims would have a material adverse effect on our consolidated financial position in light of our insurance coverage and our prior experience in resolving such claims. If the rate and types of claims filed, the average resolution value of such claims and the period of time over which claim settlements are paid (collectively, the Variable Claims Factors) do not substantially change, Honeywell would not expect future Bendix-related asbestos claims to have a material adverse effect on our results of operations or operating cash flows in any fiscal year. No assurances can be given, however, that the Variable Claims Factors will not change.
Other Matters
We are subject to a number of other lawsuits, investigations and disputes (some of which involve substantial amounts claimed) arising out of the conduct of our business, including matters relating to commercial transactions, government contracts, product liability, prior acquisitions and divestitures, employment, employee benefit plans, intellectual property, and environmental, health and safety matters. We recognize a liability for any contingency that is probable of occurrence and reasonably estimable. We continually assess the likelihood of adverse judgments of outcomes in these matters, as well as potential ranges of possible losses (taking into consideration any insurance recoveries), based on a careful analysis of each matter with the assistance of outside legal counsel and, if applicable, other experts. Included in these other matters is the following:
Honeywell v. United Auto Workers (UAW) et. al—In September 2011, the UAW and certain Honeywell retirees filed a suit in
the Eastern District of Michigan alleging that the Master Collective Bargaining Agreements (MCBAs) between Honeywell and the UAW do not provide for limitations on Honeywell’s obligation to contribute toward healthcare coverage for former employees who retired under the MCBAs (CAPS). Honeywell subsequently answered the UAW’s complaint and asserted counterclaims.
Honeywell began enforcing the CAPS against former employees who retired after the initial inclusion of the CAPS in the 2003
MCBA (the post-2003 retirees) on January 1, 2014. The UAW and certain of the plaintiffs filed a motion for partial summary judgment with respect to the post-2003 retirees, seeking a ruling that the 2003 MCBA did not limit Honeywell’s obligation to contribute to healthcare coverage for those retirees. That motion remains pending. Honeywell is confident that the District Court will find that the 2003 MCBA does, in fact, limit Honeywell’s retiree healthcare obligation for the post-2003 retirees. In the event of an adverse ruling, however, Honeywell’s other postretirement benefits for post-2003 retirees would increase by approximately $95 million, reflecting the estimated value of these CAPS.
In the second quarter of 2014, the parties agreed to stay the proceedings with respect to former employees who retired before
the initial inclusion of the CAPS in the 2003 MCBA (the pre-2003 retirees) until the Supreme Court decided M&G Polymers USA, LLC v. Tackett. The Supreme Court decided the case on January 26, 2015 and, based on the ruling, Honeywell began enforcing the CAPS against the pre-2003 retirees as of May 1, 2015. Honeywell is confident that the CAPS will be upheld by the District Court and that its liability for healthcare coverage premiums with respect to the putative class will be limited as negotiated and expressly set forth in the applicable MCBAs. In the event of an adverse ruling, however, Honeywell’s other postretirement benefits for the pre-2003 retirees would increase by approximately $129 million, reflecting the estimated value of these CAPS.
Given the uncertainty inherent in litigation and investigations (including the specific matter referenced above), we do not believe it
is possible to develop estimates of reasonably possible loss in excess of current accruals for these matters (other than as specifically set forth above). Considering our past experience and existing accruals, we do not expect the outcome of these matters, either individually or in the aggregate, to have a material adverse effect on our consolidated financial position. Because most contingencies are resolved over long periods of time, potential liabilities are subject to change due to new developments, changes in settlement strategy or the impact of evidentiary requirements, which could cause us to pay damage awards or settlements (or become subject to equitable remedies) that could have a material adverse effect on our results of operations or operating cash flows in the periods recognized or paid.
21

Honeywell International Inc. Notes to Consolidated Financial Statements
(Unaudited) (Dollars in millions, except per share amounts)
Note 13. Subsequent Events
On October 10, 2017, the Company announced its intention to separately spin off the Homes and Global Distribution business and the Transportation Systems business into two stand-alone, publicly-traded companies. The planned separation transactions are intended to be tax-free spins to Company shareowners for U.S. federal income tax purposes and are expected to be completed by the end of 2018.
On October 10, 2017, the Company also announced that it is realigning the Smart Energy business unit from the Home and
Building Technologies segment to the Performance Materials and Technologies segment. The Company intends to report its financial performance based on this realignment effective with the reporting of results for full year 2017 in its Annual Report on Form 10-K. This realignment will have no impact on the Company’s historical consolidated financial position, results of operations or cash flows.
22

The following MD&A is intended to help the reader understand the results of operations and financial condition of Honeywell
International Inc. and its consolidated subsidiaries (Honeywell or the Company) for the three months (quarter) and nine months ended September 30, 2017. The financial information as of September 30, 2017 should be read in conjunction with the consolidated financial statements for the year ended December 31, 2016 contained in our 2016 Annual Report on Form 10-K.
On October 10, 2017, the Company announced its intention to separately spin off the Homes and Global Distribution business
and the Transportation Systems business into two stand-alone, publicly-traded companies. The planned separation transactions are intended to be tax-free spins to Honeywell shareowners for U.S. federal income tax purposes and are expected to be completed by the end of 2018. Completion of each proposed spin-off is subject to finalization of the financial statements of the spun-off business, assurance that the separation will be tax-free to Honeywell shareowners for U.S. federal income tax purposes, finalization of the capital structure of the three corporations, the effectiveness of appropriate filings with the U.S. Securities and Exchange Commission, final approval of the Honeywell Board of Directors, and other customary matters. Each proposed spin-off is complex in nature, and may be affected by unanticipated developments, credit and equity markets, or changes in market conditions.
On October 10, 2017, the Company also announced that it is realigning the Smart Energy business unit from the Home and
Building Technologies segment to the Performance Materials and Technologies segment. The Company intends to report its financial performance based on this realignment effective with the reporting of full year results for 2017 in its Annual Report on Form 10-K. This realignment will have no impact on the Company’s historical consolidated financial position, results of operations or cash flows.
The change in net sales compared to the prior year period is attributable to the following:
A discussion of net sales by segment can be found in the Review of Business Segments section of this MD&A. The foreign
currency translation impact in the quarter is primarily driven by the strengthening of the Euro and Canadian Dollar against the U.S. Dollar.
ITEM 2. MANAGEMENT’S DISCUSSION AND ANALYSIS OF FINANCIAL CONDITION AND RESULTS OF OPERATIONS (MD&A) (Dollars in millions, except per share amounts)
A. Results of Operations – three and nine months ended September 30, 2017 compared with the three and nine months ended September 30, 2016
Net Sales Three Months Ended Nine Months Ended September 30, September 30, 2017 2016 2017 2016
Net sales $ 10,121 $ 9,804 $ 29,691 $ 29,317 % change compared with prior period 3% 1%
Three Months Year to
Date
Volume 3% 2%Price 2% 1%Foreign Currency Translation 1% - Acquisitions/Divestitures (3)% (2)% 3% 1%
Cost of Products and Services Sold Three Months Ended Nine Months Ended September 30, September 30, 2017 2016 2017 2016
Cost of products and services sold $ 6,873 $ 6,903 $ 20,079 $ 20,271 % change compared with prior period - (1)% Gross Margin percentage 32.1% 29.6% 32.4% 30.9%
23

Cost of products and services sold decreased in the quarter primarily due to lower labor costs of approximately $110 million (driven primarily by divestitures, net of acquisitions), and decreased indirect material costs of approximately $90 million (driven primarily by productivity, net of inflation), and lower repositioning and other charges of approximately $30 million, partially offset by higher organic sales volumes that drove increased direct materials of approximately $220 million.
Cost of products and services sold decreased in the nine months primarily due to lower labor costs of approximately $390
million (driven primarily by divestitures, net of acquisitions), and decreased indirect material costs of approximately $180 million (driven primarily by productivity, net of inflation), partially offset by higher organic sales volumes that drove increased direct materials of approximately $350 million and increased repositioning and other charges of approximately $90 million.
Gross margin percentage increased in the quarter primarily due to higher gross margin in Aerospace and Performance Materials
and Technologies (approximately 2.5 percentage point impact collectively) and lower repositioning and other charges allocated to cost of products and services sold (approximately 0.3 percentage point impact), partially offset by lower gross margin in Home and Building Technologies and Safety and Productivity Solutions (approximately 0.4 percentage point impact collectively).
Gross margin percentage increased in the nine months primarily due to higher gross margin in Aerospace and Performance
Materials and Technologies (approximately 2.0 percentage point impact collectively), partially offset by lower gross margin in Home and Building Technologies and Safety and Productivity Solutions (approximately 0.3 percentage point impact collectively) and higher repositioning and other charges allocated to cost of products and services sold (approximately 0.3 percentage point impact).
Selling, general and administrative expenses increased in the quarter and nine months primarily driven by an increase in labor
costs (primarily attributed to acquisitions, net of divestitures, investment for growth and merit increases), partially offset by benefits from repositioning.
The effective tax rate decreased for the quarter primarily driven by increased tax benefits from foreign tax credits and the
absence of divestitures taxed at higher rates, partially offset by increased expense for reserves and decreased tax benefits for employee share-based payments.
The effective tax rate decreased for the nine months primarily driven by increased tax benefits from foreign tax credits, increased
tax benefits for employee share-based payments and the absence of divestitures taxed at higher rates, partially offset by increased expense for reserves.
The effective tax rates for the quarter and nine months ended September 30, 2017 and 2016 were lower than the U.S. federal
statutory rate of 35% resulting in part from non-U.S. earnings taxed at lower rates, the vast majority of which we intend to permanently reinvest outside the United States, and from benefits from manufacturing incentives.
The Company currently expects the effective tax rate for 2017 to be approximately 22%. The effective tax rate can vary from
quarter to quarter for unusual or infrequently occurring items, the resolution of income tax audits, changes in tax laws or other items such as pension mark-to-market adjustments and the tax impact from employee share-based payments.
Selling, General and Administrative Expenses Three Months Ended Nine Months Ended September 30, September 30, 2017 2016 2017 2016
Selling, general and administrative expense $ 1,447 $ 1,367 $ 4,177 $ 3,976 Percent of sales 14.3% 13.9% 14.1% 13.6%
Tax Expense Three Months Ended Nine Months Ended September 30, September 30, 2017 2016 2017 2016 Tax expense $ 418 $ 384 $ 1,188 $ 1,214 Effective tax rate 23.4% 23.5% 22.5% 24.2%
24

Earnings per share of common stock – assuming dilution increased in the quarter primarily driven by increased segment profit in
each of our business segments and pension income. Earnings per share of common stock – assuming dilution increased in the nine months primarily driven by increased segment
profit in each of our business segments, pension income, and lower effective tax rate.
Review of Business Segments
Net Income Attributable to Honeywell Three Months Ended Nine Months Ended September 30, September 30, 2017 2016 2017 2016
Net income attributable to Honeywell $ 1,348 $ 1,240 $ 4,066 $ 3,775 Earnings per share of common stock – assuming dilution $ 1.75 $ 1.60 $ 5.26 $ 4.86
Three Months Ended Nine Months Ended September 30, September 30, % % 2017 2016 Change 2017 2016 Change Aerospace Sales
Commercial Aviation Original Equipment $ 593 $ 538 10% $ 1,845 $ 1,915 (4)%Commercial Aviation Aftermarket 1,312 1,215 8% 3,775 3,570 6%Defense and Space 992 1,125 (12)% 2,925 3,290 (11)%Transportation Systems 760 723 5% 2,332 2,310 1%
Total Aerospace Sales 3,657 3,601 10,877 11,085 Home and Building Technologies Sales
Home and Building Products 1,554 1,499 4% 4,522 4,396 3%Home and Building Distribution 1,236 1,202 3% 3,557 3,458 3%
Total Home and Building Technologies Sales 2,790 2,701 8,079 7,854 Performance Materials and Technologies Sales
UOP 706 564 25% 1,924 1,746 10%Process Solutions 895 847 6% 2,587 2,570 1%Advanced Materials 659 918 (28)% 2,057 2,728 (25)%
Total Performance Materials and Technologies Sales 2,260 2,329 6,568 7,044
Safety and Productivity Solutions Sales
Safety 537 526 2% 1,587 1,558 2%Productivity Solutions 877 647 36% 2,580 1,776 45%
Total Safety and Productivity Solutions Sales 1,414 1,173 4,167 3,334 Net Sales $ 10,121 $ 9,804 $ 29,691 $ 29,317
25
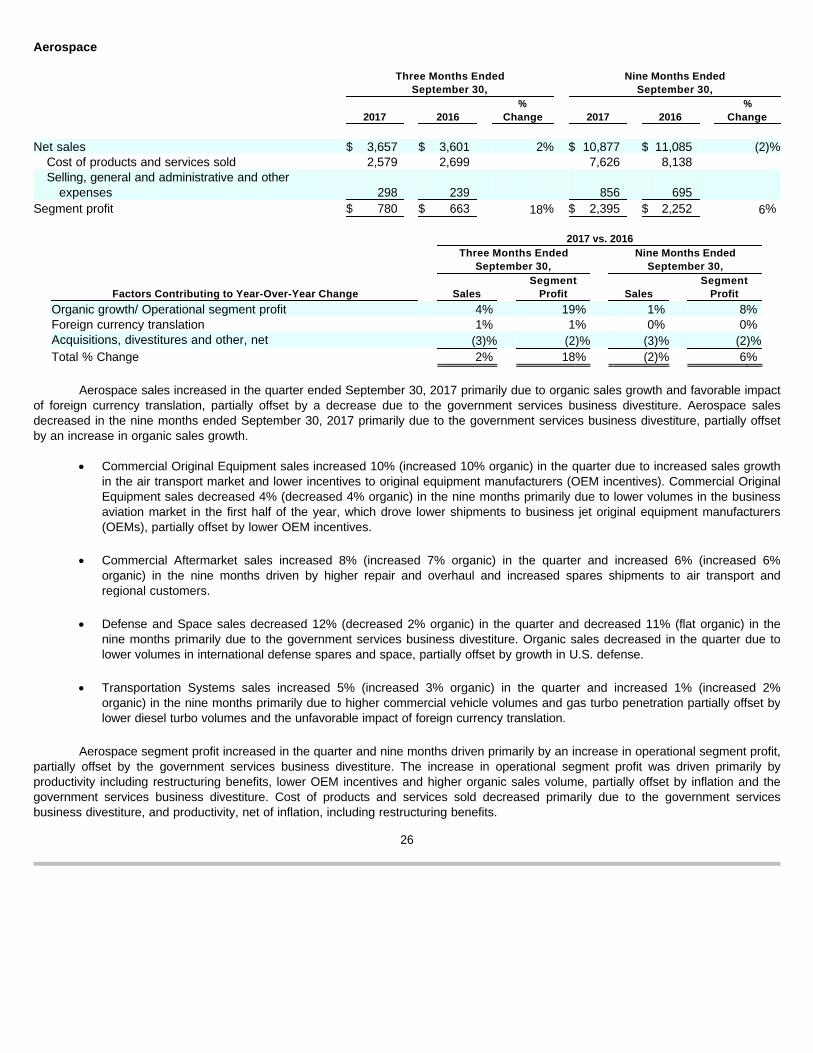
Aerospace
Aerospace sales increased in the quarter ended September 30, 2017 primarily due to organic sales growth and favorable impact
of foreign currency translation, partially offset by a decrease due to the government services business divestiture. Aerospace sales decreased in the nine months ended September 30, 2017 primarily due to the government services business divestiture, partially offset by an increase in organic sales growth.
Aerospace segment profit increased in the quarter and nine months driven primarily by an increase in operational segment profit,
partially offset by the government services business divestiture. The increase in operational segment profit was driven primarily by productivity including restructuring benefits, lower OEM incentives and higher organic sales volume, partially offset by inflation and the government services business divestiture. Cost of products and services sold decreased primarily due to the government services business divestiture, and productivity, net of inflation, including restructuring benefits.
Three Months Ended Nine Months Ended September 30, September 30,
2017 2016 %
Change 2017 2016 %
Change Net sales $ 3,657 $ 3,601 2% $ 10,877 $ 11,085 (2)%
Cost of products and services sold 2,579 2,699 7,626 8,138 Selling, general and administrative and other
expenses 298 239 856 695 Segment profit $ 780 $ 663 18% $ 2,395 $ 2,252 6%
2017 vs. 2016 Three Months Ended Nine Months Ended September 30, September 30,
Factors Contributing to Year-Over-Year Change Sales Segment
Profit Sales Segment
Profit
Organic growth/ Operational segment profit 4% 19% 1% 8%Foreign currency translation 1% 1% 0% 0%Acquisitions, divestitures and other, net (3)% (2)% (3)% (2)%Total % Change 2% 18% (2)% 6%
· Commercial Original Equipment sales increased 10% (increased 10% organic) in the quarter due to increased sales growth in the air transport market and lower incentives to original equipment manufacturers (OEM incentives). Commercial Original Equipment sales decreased 4% (decreased 4% organic) in the nine months primarily due to lower volumes in the business aviation market in the first half of the year, which drove lower shipments to business jet original equipment manufacturers (OEMs), partially offset by lower OEM incentives.
· Commercial Aftermarket sales increased 8% (increased 7% organic) in the quarter and increased 6% (increased 6% organic) in the nine months driven by higher repair and overhaul and increased spares shipments to air transport and regional customers.
· Defense and Space sales decreased 12% (decreased 2% organic) in the quarter and decreased 11% (flat organic) in the nine months primarily due to the government services business divestiture. Organic sales decreased in the quarter due to lower volumes in international defense spares and space, partially offset by growth in U.S. defense.
· Transportation Systems sales increased 5% (increased 3% organic) in the quarter and increased 1% (increased 2% organic) in the nine months primarily due to higher commercial vehicle volumes and gas turbo penetration partially offset by lower diesel turbo volumes and the unfavorable impact of foreign currency translation.
26

Home and Building Technologies
Home and Building Technologies sales increased in the quarter and nine months ended September 30, 2017 primarily driven by
organic growth.
Home and Building Technologies segment profit increased in the quarter due to higher operational segment profit and the
favorable impact of foreign currency translation, and increased in the nine months due to higher operational segment profit. The increase in operational segment profit in the quarter and the nine months is primarily due to the positive impact of productivity, net of inflation, and pricing, offset by the unfavorable impact of product mix. Cost of products and services sold increased in the quarter primarily due to higher organic sales volumes and in the nine months primarily due to higher organic sales volumes, partially offset by the favorable impact of foreign currency translation.
Three Months Ended Nine Months Ended September 30, September 30, 2017 2016 % Change 2017 2016 % Change
Net sales $ 2,790 $ 2,701 3% $ 8,079 $ 7,854 3%Cost of products and services sold 1,873 1,783 5,440 5,225 Selling, general and administrative
and other expenses 459 477 1,372 1,416 Segment profit $ 458 $ 441 4% $ 1,267 $ 1,213 4%
2017 vs. 2016 Three Months Ended Nine Months Ended September 30, September 30,
Factors Contributing to Year-Over-Year Change Sales Segment
Profit Sales Segment
Profit
Organic growth/ Operational segment profit 2% 2% 3% 4%Foreign currency translation 1% 2% (1)% - Acquisitions and divestitures, net - - 1% - Total % Change 3% 4% 3% 4%
· Sales in Home and Building Products increased 4% (increased 2% organic) in the quarter due to organic sales growth and the favorable impact of foreign currency translation. Sales increased 3% (increased 3% organic) in the nine months primarily due to organic sales growth, partially offset by the unfavorable impact of foreign currency translation. Organic sales growth in the quarter and in the nine months was primarily driven by sales growth in Smart Energy and Security and Fire.
· Sales in Home and Building Distribution increased 3% (increased 2% organic) in the quarter due to organic sales growth and the favorable impact of foreign currency translation. Sales increased 3% (increased 3% organic) in the nine months primarily due to organic sales growth. Organic sales growth in the quarter was primarily driven by growth in the global distribution business and in the nine months was due to global distribution business and Building Solutions.
27

Performance Materials and Technologies
Performance Materials and Technologies sales decreased in the quarter and nine months ended September 30, 2017 driven
primarily by divestitures, partially offset by organic sales growth.
Performance Materials and Technologies segment profit increased in the quarter and nine months driven primarily by an
increase in operational segment profit, partially offset by divestitures. The increase in operational segment profit is primarily due to productivity, net of inflation, higher organic sales volume and pricing, partially offset by unfavorable product mix and continued investments for growth. Cost of products and services sold decreased in the quarter and nine months primarily due to divestitures and productivity, net of inflation, partially offset by higher organic sales volumes.
Three Months Ended Nine Months Ended September 30, September 30,
2017 2016 %
Change 2017 2016 %
Change
Net sales $ 2,260 $ 2,329 (3)% $ 6,568 $ 7,044 (7)%Cost of products and services sold 1,414 1,542 4,150 4,683 Selling, general and administrative
and other expenses 320 284 897 877 Segment profit $ 526 $ 503 5% $ 1,521 $ 1,484 2%
2017 vs. 2016 Three Months Ended Nine Months Ended September 30, September 30,
Factors Contributing to Year-Over-Year Change Sales Segment
Profit Sales Segment
Profit Organic growth/ Operational segment profit 10% 11% 7% 12%Foreign currency translation 1% 1% (1)% (1)%Acquisitions and divestitures, net (14)% (7)% (13)% (9)%Total % Change (3%) 5% (7%) 2%
· UOP sales increased 25% (increased 25% organic) in the quarter and increased 10% (increased 11% organic) in the nine months driven primarily by higher gas processing project revenues and increased equipment sales, with catalyst volumes and licensing also increasing in the quarter.
· Process Solutions sales increased 6% (increased 5% organic) in the quarter and increased 1% (increased 1% organic) in the nine months driven primarily by higher revenue in services and software, partially offset by decreased revenues in projects and lower field product sales in the first half of the year.
· Advanced Materials sales decreased 28% (increased 6% organic) in the quarter and decreased 25% (increased 10% organic) in the nine months driven primarily by the spin-off of the former resins and chemicals business, partially offset by increased fluorine products volumes.
28

Safety and Productivity Solutions
Safety and Productivity Solutions sales increased in the quarter and nine months ended September 30, 2017 primarily due to
acquisitions and increased organic sales volume.
Safety and Productivity Solutions segment profit increased in the quarter and nine months primarily due to increase from
operational segment profit and acquisitions. The increase in operational segment profit for the quarter and nine months was driven by higher productivity, net of inflation, and sales volume. Cost of products and services sold increased primarily due to acquisitions.
Repositioning and Other Charges
Our repositioning actions are expected to generate incremental pretax savings of $350 million to $400 million in 2017 compared with 2016 primarily from planned workforce reductions. Cash spending related to our repositioning actions was $123 million in the nine months ended September 30, 2017 and was funded through operating cash flows. We expect cash spending for repositioning actions to be approximately $225 million in 2017 and to be funded through operating cash flows.
Three Months Ended Nine Months Ended September 30, September 30,
2017 2016 %
Change 2017 2016 %
Change
Net sales $ 1,414 $ 1,173 21% $ 4,167 $ 3,334 25%Cost of products and services sold 933 764 2,739 2,161 Selling, general and administrative
and other expenses 268 237 807 678 Segment profit $ 213 $ 172 24% $ 621 $ 495 25%
2017 vs. 2016 Three Months Ended Nine Months Ended September 30, September 30,
Factors Contributing to Year-Over-Year Change Sales Segment
Profit Sales Segment
Profit
Organic growth/ Operational segment profit 3% 16% 2% 16%Foreign exchange 1% 2% - (1)%Acquisitions and divestitures, net 17% 6% 23% 10%Total % Change 21% 24% 25% 25%
· Sales in Safety increased 2% (increased 1% organic) in the quarter and increased 2% (increased 2% organic) in the nine months due to increased sales volume in the Industrial Safety business and the favorable impact of foreign currency translation, partially offset by lower volume in Retail.
· Sales in Productivity Solutions increased 36% (increased 4% organic) in the quarter and increased 45% (increased 2% organic) in the nine months primarily due to growth from acquisitions (Intelligrated).
29

Cash Flow Summary
Cash provided by operating activities increased by $338 million primarily due to a $339 million lower use of cash from working
capital compared to the prior year and an increase in net income of $296 million, partially offset by increased cash tax payments of $482 million.
Cash used for investing activities decreased by $1,085 million primarily due to a decrease in cash paid for acquisitions of $2,496
million, partially offset by a net $931 million increase in investments, primarily short term marketable securities, an increase of $354 million in settlement payments of foreign currency exchange contracts used as economic hedges on certain non-functional currency denominated monetary assets and liabilities, and a decrease in proceeds from sales of businesses of $304 million.
Cash used for financing activities increased by $3,095 million primarily due to a decrease in the net proceeds from debt
issuances of $3,437 million and an increase in cash dividends paid of $144 million, partially offset by a decrease in net repurchases of common stock of $608 million.
Liquidity
The Company continues to manage its businesses to maximize operating cash flows as the primary source of liquidity. In addition to our available cash and operating cash flows, additional sources of liquidity include committed credit lines, short-term debt from the commercial paper market, long-term borrowings, as well as access to the public debt and equity markets. We continue to balance our cash and financing uses through investment in our existing core businesses, debt reduction, acquisition activity, share repurchases and dividends.
We continuously assess the relative strength of each business in our portfolio as to strategic fit, market position, profit and cash
flow contribution in order to upgrade our combined portfolio and identify business units that will most benefit from increased investment. We identify acquisition candidates that will further our strategic plan and strengthen our existing core businesses. We also identify business units that do not fit into our long-term strategic plan based on their market position, relative profitability or growth potential. These businesses are considered for potential divestiture, restructuring or other repositioning actions subject to regulatory constraints.
In 2017, we are not required to make contributions to our U.S. pension plans. We plan to make contributions of cash and/or
marketable securities of approximately $130 million ($89 million of marketable securities were contributed in January 2017) to our non-U.S. plans in 2017 to satisfy regulatory funding requirements. The timing and amount of contributions to both our U.S. and non-U.S. plans may be impacted by a number of factors, including the funded status of the plans.
In the three months ended September 30, 2017, the Company repurchased $343 million of outstanding shares. Under the
Company’s previously approved $5 billion share repurchase program, $2.7 billion remained available as of September 30, 2017 for additional share repurchases. Honeywell presently expects to repurchase outstanding shares from time to time to offset the dilutive impact over the long-term of employee stock-based compensation plans, including future option exercises, restricted unit vesting and matching contributions under our savings plans. The amount and timing of future repurchases may vary depending on market conditions and the level of operating, financing and other investing activities.
Effective with the fourth quarter 2017 dividend, we increased our quarterly dividend rate by 12% to $0.745 per share of common
stock.
B. Liquidity and Capital Resources
Nine Months Ended September 30,
2017 2016
Cash provided by (used for): Operating activities $ 3,794 $ 3,456 Investing activities (2,191) (3,276)Financing activities (2,387) 708 Effect of exchange rate changes on cash 330 88
Net (decrease) increase in cash and cash equivalents $ (454) $ 976
30

C. Other Matters Litigation
We are subject to a number of lawsuits, investigations and claims (some of which involve substantial amounts) arising out of the conduct of our business. See Note 12 Commitments and Contingencies of Notes to Consolidated Financial Statements for further discussion of environmental, asbestos and other litigation matters.
Critical Accounting Policies
The financial information as of September 30, 2017 should be read in conjunction with the consolidated financial statements for the year ended December 31, 2016 contained in our 2016 Annual Report on Form 10-K.
For a discussion of the Company’s critical accounting policies, see Item 7. Management’s Discussion and Analysis of Financial
Condition and Results of Operations in our 2016 Annual Report on Form 10-K.
Recent Accounting Pronouncements
See Note 2 Recent Accounting Pronouncements of Notes to Consolidated Financial Statements for a discussion of recent accounting pronouncements.
Item 3. Quantitative and Qualitative Disclosures About Market Risks
For a discussion of the Company’s quantitative and qualitative disclosures about market risks, see Item 7A. Quantitative and Qualitative Disclosures About Market Risks, in our 2016 Annual Report on Form 10-K. As of September 30, 2017, there has been no material change in this information.
Item 4. Controls and Procedures
Honeywell management, including the Chief Executive Officer and Chief Financial Officer, conducted an evaluation of the effectiveness of our disclosure controls and procedures (as defined in Rules 13a-15(e) or 15d-15(e) promulgated under the Securities Exchange Act of 1934, as amended (Exchange Act)) as of the end of the period covered by this Quarterly Report on Form 10-Q. Based upon that evaluation, the Chief Executive Officer and the Chief Financial Officer concluded that such disclosure controls and procedures were effective as of the end of the period covered by this Quarterly Report on Form 10-Q to ensure information required to be disclosed in the reports that Honeywell files or submits under the Exchange Act is recorded, processed, summarized, and reported within the time periods specified in the Securities and Exchange Commission rules and forms, and that it is accumulated and communicated to our management, including our Chief Executive Officer, our Chief Financial Officer, and our Controller, as appropriate, to allow timely decisions regarding required disclosure. There have been no changes that have materially affected, or are reasonably likely to materially affect, Honeywell’s internal control over financial reporting that have occurred during the period covered by this Quarterly Report on Form 10-Q.
31

Part II. Other Information Item 1. Legal Proceedings
General Legal Matters
We are subject to a number of lawsuits, investigations and claims (some of which involve substantial amounts) arising out of the conduct of our business. See Note 12 Commitments and Contingencies of Notes to Consolidated Financial Statements for a discussion of environmental, asbestos and other litigation matters.
Environmental Matters Involving Potential Monetary Sanctions in Excess of $100,000
None. Item 1A. Risk Factors
Other than the additional risk factor presented below, there have been no material changes to the disclosure presented in our 2016 Annual Report on Form 10-K under Item 1A. Risk Factors.
The proposed spin-offs of our Homes and Global Distribution business and of our Transportation Systems business into two stand-alone, publicly-traded companies are each contingent upon the satisfaction of a number of conditions, may not be completed on the currently contemplated timeline, or at all, and may not achieve the intended benefits.
On October 10, 2017, the Company announced its intention to separately spin off our Homes and Global Distribution business and our Transportation Systems business into two stand-alone, publicly-traded companies. Completion of each proposed spin-off is subject to finalization of the financial statements of the spun-off business, assurance that the separation will be tax-free to our shareowners for U.S. federal income tax purposes, finalization of the capital structure of the three corporations, the effectiveness of appropriate filings with the U.S. Securities and Exchange Commission, final approval of our Board of Directors, and other customary matters. Each proposed spin-off is complex in nature, and may be affected by unanticipated developments, credit and equity markets, or changes in market conditions. These or other unanticipated developments could delay or prevent the proposed spin-offs or cause the proposed spin-offs to occur on terms or conditions that are less favorable than anticipated, including without limitation, the failure to qualify as tax-free to our shareowners, and the inability of the two spun-off companies to incur sufficient indebtedness to allow for a distribution to Honeywell of proceeds concurrently with the consummation of the spin-offs or to make cash contributions towards the satisfaction of certain of our legacy asbestos and environmental remediation liabilities. Furthermore, if the spin-offs are completed, we cannot assure you that each will be successful in meeting its objectives. Any of these factors could have a material adverse effect on our business, financial condition, results of operations, cash flows or the price of our common stock.
32

Item 2. Unregistered Sales of Equity Securities and Use of Proceeds
Honeywell purchased 2,500,000 shares of its common stock, par value $1 per share, in the quarter ended September 30, 2017. Under the Company’s previously approved $5 billion share repurchase program, $2.7 billion remained available as of September 30, 2017 for additional share repurchases. The following table summarizes Honeywell’s purchase of its common stock for the quarter ended September 30, 2017:
Item 5. Other Information
Iran Threat Reduction and Syrian Human Rights Act of 2012 Under the Iran Threat Reduction and Syrian Human Rights Act of 2012, which added Section 13(r) of the Securities Exchange
Act of 1934, Honeywell is required to disclose in its periodic reports if it or any of its affiliates knowingly engaged in certain activities, transactions or dealings relating to Iran or with entities or individuals designated pursuant to certain Executive Orders. All of our activities in Iran during the three months ended September 30, 2017, including the activities disclosed below, were conducted by our non-U.S. subsidiaries under General License H, (ii) under General License I, or (iii) under a specific license issued by U.S. Treasury’s Office of Foreign Assets Control (OFAC), and otherwise in compliance with all applicable laws, including sanctions regulations administered by OFAC.
In the three months ended September 30, 2017, the non-U.S. subsidiaries of our UOP business, part of Performance Materials
and Technologies, engaged in the following activities related to Iran’s oil, gas and/or petrochemical sectors:
In the three months ended September 30, 2017, the non-U.S. subsidiaries of our Process Solutions business, part of
Performance Materials and Technologies, engaged in the following activities related to Iran’s oil, gas and/or petrochemical sectors:
We intend to continue doing business in Iran under General Licenses H and I or under a specific license issued by OFAC, and
otherwise in compliance with all applicable laws. Such activities may require additional disclosure pursuant to Section 13(r) of the Act. Item 6. Exhibits
Issuer Purchases of Equity Securities (a) (b) (c) (d) Total Number Approximate Dollar of Shares Value of Shares that Total Purchased as May Yet be Purchased Number of Average Part of Publicly Under Plans or Shares Price Paid Announced Plans Programs Period Purchased per Share or Programs (Dollars in millions)
August 2017 2,100,000 $137.48 2,100,000 $2,797 September 2017 400,000 $136.88 400,000 $2,742
· Delivered services to Iranian counterparties pursuant to new and existing contracts, which resulted in revenue of approximately $7.9 million (expected total value of these contracts is approximately $67.0 million).
· Sold non-U.S. origin products to non-U.S. third-parties for end-use in Iran pursuant to new and existing contracts, which resulted
in revenue of approximately $44 thousand (expected total value of these contracts is approximately $0.9 million).
· Sold non-U.S. origin products to non-U.S. third-parties for end-use in Iran pursuant to new contracts, which resulted in revenue of approximately $1.0M (expected total value of these contracts is approximately $6.9 million).
· Sold approximately $0.3 million of non-U.S. origin products to distributors (including an Iranian distributor) for use in the gas
distribution sector in Iran.
(a) See the Exhibit Index on page 35 of this Quarterly Report on Form 10-Q.
33

SIGNATURES
Pursuant to the requirements of the Securities Exchange Act of 1934, the registrant has duly caused this report to be signed on its behalf by the undersigned thereunto duly authorized.
Honeywell International Inc. Date: October 20, 2017 By: /s/ Jennifer H. Mak Jennifer H. Mak Vice President and Controller (on behalf of the Registrant and as the Registrant’s Principal Accounting Officer)
34
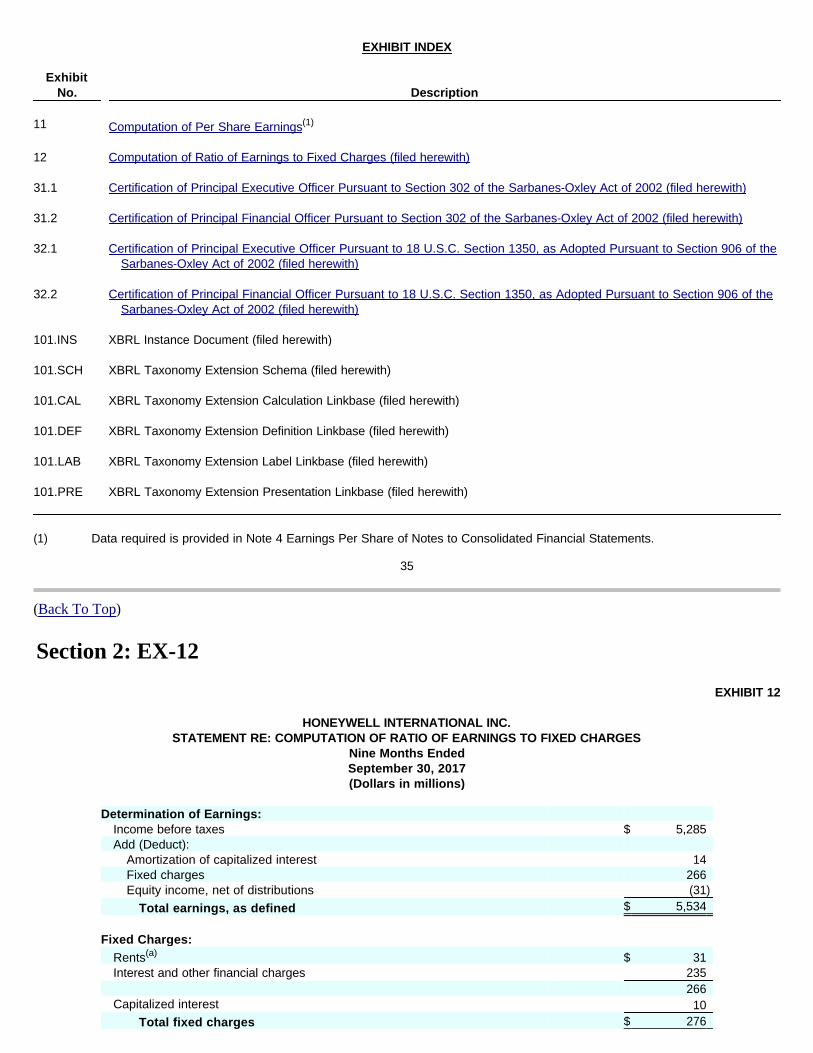
EXHIBIT INDEX
(Back To Top)
EXHIBIT 12
Exhibit No.
Description
11 Computation of Per Share Earnings(1)
12 Computation of Ratio of Earnings to Fixed Charges (filed herewith) 31.1 Certification of Principal Executive Officer Pursuant to Section 302 of the Sarbanes-Oxley Act of 2002 (filed herewith) 31.2 Certification of Principal Financial Officer Pursuant to Section 302 of the Sarbanes-Oxley Act of 2002 (filed herewith) 32.1 Certification of Principal Executive Officer Pursuant to 18 U.S.C. Section 1350, as Adopted Pursuant to Section 906 of the
Sarbanes-Oxley Act of 2002 (filed herewith) 32.2 Certification of Principal Financial Officer Pursuant to 18 U.S.C. Section 1350, as Adopted Pursuant to Section 906 of the
Sarbanes-Oxley Act of 2002 (filed herewith) 101.INS XBRL Instance Document (filed herewith) 101.SCH XBRL Taxonomy Extension Schema (filed herewith) 101.CAL XBRL Taxonomy Extension Calculation Linkbase (filed herewith) 101.DEF XBRL Taxonomy Extension Definition Linkbase (filed herewith) 101.LAB XBRL Taxonomy Extension Label Linkbase (filed herewith) 101.PRE XBRL Taxonomy Extension Presentation Linkbase (filed herewith)
(1) Data required is provided in Note 4 Earnings Per Share of Notes to Consolidated Financial Statements.
35
Section 2: EX-12
HONEYWELL INTERNATIONAL INC.STATEMENT RE: COMPUTATION OF RATIO OF EARNINGS TO FIXED CHARGES
Nine Months EndedSeptember 30, 2017(Dollars in millions)
Determination of Earnings: Income before taxes $ 5,285 Add (Deduct): Amortization of capitalized interest 14 Fixed charges 266 Equity income, net of distributions (31) Total earnings, as defined $ 5,534 Fixed Charges:
Rents(a) $ 31 Interest and other financial charges 235 266 Capitalized interest 10 Total fixed charges $ 276

(Back To Top)
EXHIBIT 31.1
CERTIFICATION PURSUANT TO SECTION 302
OF THE SARBANES-OXLEY ACT OF 2002 I, Darius Adamczyk, President and Chief Executive Officer, certify that:
Ratio of Earnings to Fixed Charges 20.05
(a) Denotes the equivalent of an appropriate portion of rentals representative of the interest factor on all rentals other than for
capitalized leases.
Section 3: EX-31.1
1. I have reviewed this Quarterly Report on Form 10-Q of Honeywell International Inc.;
2. Based on my knowledge, this report does not contain any untrue statement of a material fact or omit to state a material fact necessary to make the statements made, in light of the circumstances under which such statements were made, not misleading with respect to the period covered by this report;
3. Based on my knowledge, the financial statements, and other financial information included in this report, fairly present in all material respects the financial condition, results of operations and cash flows of the registrant as of, and for, the periods presented in this report;
4. The registrant’s other certifying officer and I are responsible for establishing and maintaining disclosure controls and procedures (as defined in Exchange Act Rules 13a-15(e) and 15d-15(e)) and internal control over financial reporting (as defined in Exchange Act Rules 13a-15(f) and 15d-15(f)) for the registrant and have:
a) designed such disclosure controls and procedures, or caused such disclosure controls and procedures to be designed under our supervision, to ensure that material information relating to the registrant, including its consolidated subsidiaries, is made known to us by others within those entities, particularly during the period in which this report is being prepared;
b) designed such internal control over financial reporting, or caused such internal control over financial reporting to be designed under our supervision, to provide reasonable assurance regarding the reliability of financial reporting and the preparation of financial statements for external purposes in accordance with generally accepted accounting principles;
c) evaluated the effectiveness of the registrant’s disclosure controls and procedures and presented in this report our conclusions about the effectiveness of the disclosure controls and procedures, as of the end of the period covered by this report based on such evaluation; and
d) disclosed in this report any change in the registrant’s internal control over financial reporting that occurred during the registrant’s most recent fiscal quarter (the registrant’s fourth fiscal quarter in the case of an annual report) that has materially affected, or is reasonably likely to materially affect, the registrant’s internal control over financial reporting;
5. The registrant’s other certifying officer and I have disclosed, based on our most recent evaluation of internal control over financial reporting, to the registrant’s auditors and the audit committee of the registrant’s board of directors (or persons performing the equivalent functions):
a) all significant deficiencies and material weaknesses in the design or operation of internal control over financial reporting which are reasonably likely to adversely affect the registrant’s ability to record, process, summarize and report financial information; and
b) any fraud, whether or not material, that involves management or other employees who have a significant role in the registrant’s internal control over financial reporting.
Date: October 20, 2017 By: /s/ Darius Adamczyk Darius Adamczyk President and Chief Executive Officer

(Back To Top)
EXHIBIT 31.2
CERTIFICATION PURSUANT TO SECTION 302
OF THE SARBANES-OXLEY ACT OF 2002 I, Thomas A. Szlosek, Senior Vice President and Chief Financial Officer, certify that:
(Back To Top)
Section 4: EX-31.2
1. I have reviewed this Quarterly Report on Form 10-Q of Honeywell International Inc.;
2. Based on my knowledge, this report does not contain any untrue statement of a material fact or omit to state a material fact necessary to make the statements made, in light of the circumstances under which such statements were made, not misleading with respect to the period covered by this report;
3. Based on my knowledge, the financial statements, and other financial information included in this report, fairly present in all material respects the financial condition, results of operations and cash flows of the registrant as of, and for, the periods presented in this report;
4. The registrant’s other certifying officer and I are responsible for establishing and maintaining disclosure controls and procedures (as defined in Exchange Act Rules 13a-15(e) and 15d-15(e)) and internal control over financial reporting (as defined in Exchange Act Rules 13a-15(f) and 15d-15(f)) for the registrant and have:
a) designed such disclosure controls and procedures, or caused such disclosure controls and procedures to be designed under our supervision, to ensure that material information relating to the registrant, including its consolidated subsidiaries, is made known to us by others within those entities, particularly during the period in which this report is being prepared;
b) designed such internal control over financial reporting, or caused such internal control over financial reporting to be designed under our supervision, to provide reasonable assurance regarding the reliability of financial reporting and the preparation of financial statements for external purposes in accordance with generally accepted accounting principles;
c) evaluated the effectiveness of the registrant’s disclosure controls and procedures and presented in this report our conclusions about the effectiveness of the disclosure controls and procedures, as of the end of the period covered by this report based on such evaluation; and
d) disclosed in this report any change in the registrant’s internal control over financial reporting that occurred during the registrant’s most recent fiscal quarter (the registrant’s fourth fiscal quarter in the case of an annual report) that has materially affected, or is reasonably likely to materially affect, the registrant’s internal control over financial reporting;
5. The registrant’s other certifying officer and I have disclosed, based on our most recent evaluation of internal control over financial reporting, to the registrant’s auditors and the audit committee of the registrant’s board of directors (or persons performing the equivalent functions):
e) all significant deficiencies and material weaknesses in the design or operation of internal control over financial reporting which are reasonably likely to adversely affect the registrant’s ability to record, process, summarize and report financial information; and
a) any fraud, whether or not material, that involves management or other employees who have a significant role in the registrant’s internal control over financial reporting.
Date: October 20, 2017 By: /s/ Thomas A. Szlosek Thomas A. Szlosek Senior Vice President and Chief Financial Officer
Section 5: EX-32.1

EXHIBIT 32.1
CERTIFICATION PURSUANT TO 18 U.S.C. SECTION 1350,
AS ADOPTED PURSUANT TO SECTION 906 OF THE SARBANES-OXLEY ACT OF 2002
In connection with the Quarterly Report of Honeywell International Inc. (the Company) on Form 10-Q for the period ended September 30, 2017 as filed with the Securities and Exchange Commission on the date hereof (the Report), I, Darius Adamczyk, President and Chief Executive Officer of the Company, certify, pursuant to 18 U.S.C. Section 1350, as adopted pursuant to Section 906 of the Sarbanes-Oxley Act of 2002, that:
(Back To Top)
EXHIBIT 32.2
CERTIFICATION PURSUANT TO 18 U.S.C. SECTION 1350,
AS ADOPTED PURSUANT TO SECTION 906 OF THE SARBANES-OXLEY ACT OF 2002
In connection with the Quarterly Report of Honeywell International Inc. (the Company) on Form 10-Q for the period ended September 30, 2017 as filed with the Securities and Exchange Commission on the date hereof (the Report), I, Thomas A. Szlosek, Senior Vice President and Chief Financial Officer of the Company, certify, pursuant to 18 U.S.C. Section 1350, as adopted pursuant to Section 906 of the Sarbanes-Oxley Act of 2002, that:
(Back To Top)
(1) The Report fully complies with the requirements of Section 13(a) or 15(d) of the Securities Exchange Act of 1934; and
(2) The information contained in the Report fairly presents, in all material respects, the financial condition and results of operations of the Company.
Date: October 20, 2017 By: /s/ Darius Adamczyk Darius Adamczyk President and Chief Executive Officer
Section 6: EX-32.2
(1) The Report fully complies with the requirements of Section 13(a) or 15(d) of the Securities Exchange Act of 1934; and
(2) The information contained in the Report fairly presents, in all material respects, the financial condition and results of operations of the Company.
Date: October 20, 2017 By: /s/ Thomas A. Szlosek Thomas A. Szlosek Senior Vice President and Chief Financial Officer