of the largest producers and distributors of gasoline, diesel, jet fuel and other major refined oil...
TRANSCRIPT

����� ������ � ��� ���� ������
����� ��������� ��������� ������������������� ������ ! "#$%$&'(&) *+,--+./0(10&) 2$3+,$4+5-$6$&) 78889:;<.
��������
��
� ���� ���������
�=>>?
�����������@�������
;,$&+-' (& -&A$,(&B-&+0CC1 D,$-&'C1 E0E-,
=>>? ������ ��� ��@ �������F����� G��� H ��� I JKKKLM N O ��� I KPMJ N HQ� I �� R


This annual repor t includes forward-looking statements. All statements, other than statements ofhistorical facts, that address activities, events or developments that the Company expects or anticipates
will or may occur in the future (including but not limited to projections, targets, and other estimates andbusiness plans) are forward-looking statements. The Company’s actual results or developments may
differ materially from those indicated by these forward-looking statements as a result of various factorsand uncertainties. The Company makes the forward-looking statements referred to herein as at 6 April2007 and undertakes no obligation to update these statements.
CONTENTS
2 Company Profile3 Principal Financial Data and
Indicators9 Changes in Share Capital and
Shareholdings of PrincipalShareholders
12 Chairman’s Statement16 Business Review and Prospects23 Health, Safety and Environment26 Management’s Discussion
and Analysis38 Significant Events47 Connected Transactions49 Corporate Governance56 Summary of Shareholders’
Meetings57 Report of the Board of Directors62 Report of the Supervisory
Board64 Directors, Supervisors, Senior
Management and Employees76 Principal Wholly-owned,
Controlling and NonWholly-owned Subsidiaries
77 Financial Statements173 Corporate Information175 Documents for Inspection176 Confirmation from the
Directors andSenior Management

CHINA PETROLEUM & CHEMICAL CORPORATIONAnnual Report 20062
CO
MP
AN
Y P
RO
FIL
E
Exploration and Production Refining Marketing and Distribution Chemicals
IMPORTANT: THE BOARD OF DIRECTORS AND THE SUPERVISORY BOARD OF CHINA PETROLEUM & CHEMICAL CORPORATION(“SINOPEC CORP.”) AND ITS DIRECTORS, SUPERVISORS AND SENIOR MANAGEMENT WARRANT THAT THERE ARE NO MATERIALOMISSIONS FROM, OR MISREPRESENTATIONS OR MISLEADING STATEMENTS CONTAINED IN THIS ANNUAL REPORT, AND JOINTLY ANDSEVERALLY ACCEPT FULL RESPONSIBILITY FOR THE AUTHENTICITY, ACCURACY AND COMPLETENESS OF THE INFORMATIONCONTAINED IN THIS ANNUAL REPORT. MR. LI DESHUI, MR. YAO ZHONGMIN AND MR. FAN YIFEI, DIRECTORS OF SINOPEC CORP., COULDNOT ATTEND THE NINETH MEETING OF THE THIRD SESSION OF THE BOARD FOR REASON OF OFFICIAL DUTIES. MR. YAO ZHONGMIN,AUTHORISED MR. CHEN. TONGHAI, CHAIRMAN OF SINOPEC CORP., MR. LI DESHUI AUTHORISED MR. LIU ZHONG LI, DIRECTOR OFSINOPEC CORP., MR. FAN YIFEI AUTHORISED MR. WANG TIANPU, DIRECTOR, PRESIDENT OF SINOPEC CORP., TO VOTE ON THEIRBEHALF IN RESPECT OF THE RESOLUTIONS PUT FORWARD IN THE MEETING OF THE BOARD. MR. CHEN TONGHAI, CHAIRMANOF THE BOARD, MR. WANG TIANPU, DIRECTORS, PRESIDENT OF SINOPEC CORP., MR. DAI HOULIANG, DIRECTOR, SENIOR VICEPRESIDENT & CHIEF FINANCIAL OFFICER OF SINOPEC CORP. AND MR. LIU YUN, HEAD OF THE CORPORATE FINANCE DEPARTMENTOF SINOPEC CORP., HEREBY WARRANT THE AUTHENTICITY AND COMPLETENESS OF THE FINANCIAL STATEMENTS CONTAINED IN THISANNUAL REPORT.
COMPANY PROFILE
Sinopec Corp. is a Chinese company listed in
Hong Kong, New York, London and Shanghai,
and is an integrated energy and chemical
company with upstream, midstream and
downstream operations. The principal
operations of Sinopec Corp. and its subsidiaries
(the “Company”) include:
� exploring for and developing, producing and
trading crude oil and natural gas
� processing crude oil into refined oil products,
producing refined oil products and trading,
transporting, distributing and marketing
refined oil products
� producing, distributing and trading
petrochemical products
Based on turnover in 2006, Sinopec Corp. is thelargest listed company in China. The Companyis also:
� The largest petroleum and petrochemicalcompanies in China and Asia
� one of the largest producers and distributorsof gasoline, diesel, jet fuel and other majorrefined oil products in China and Asia
� the second largest producer of crude oil andnatural gas in China
The Company’s competitive strengths are mainlyreflected in:
� its leading market position in the productionand sales of refined oil products in China
� its status as the largest petrochemicalproducer in China
� its strategic market position in China’s highesteconomic growth areas
� its well-established, highly efficient and costeffective sales and distribution network
� its integrated operation structure with strongresistance against industry cyclical risks
� its well-recognised brand and excellentreputation
The company intends to fully implement itsdevelopment strategies that are well balancedbetween continuous improvement in theCompany’s profitability and marketcompetitiveness and various societal factors asa good corporate citizen, including energysaving and environment protection, so that theCompany would achieve sustained, effective andharmonious growth.

CHINA PETROLEUM & CHEMICAL CORPORATION Annual Report 2006 3
PRINCIPAL FINANCIAL DATA AND INDICATORS
Pri
nci
pa
l F
ina
nci
al
Da
ta a
nd
In
dic
ato
rs
1 FINANCIAL DATA AND OPERATING DATA PREPARED IN ACCORDANCE WITH THE PRC ACCOUNTING RULES AND REGULATIONS
(1) Summary of principal financial data and operating data of the Company for the year 2006
For the year ended 31 December 2006Items RMB millionsProfit before taxation 73,252Net profit 50,664Net profit before non-operating profits/losses 48,573Profit from principal operations 136,264Profit from other operations 969Operating profit 71,296Investment income 43Subsidy income 5,000Net non-operating income/expenses 3,087 (net expense)Net cash flow from operating activities 102,587Net decrease in cash and cash equivalents 5,657
Items under non-operating profits/losses and corresponding amounts:
For the year ended 31 December 2006(Income)/Expense
Items RMB millionsGain on disposal of long-term equity investments (25)Written back of provisions for impairment losses in previous years (583)Non-operating expenses (excluding normal provisions on assets provided
in accordance with the Accounting Regulations for Business Enterprises) 2,859Of which: Loss on disposal of fixed assets 1,782
Employee reduction expenses 236Donations 95
Non-operating income (372)Subsidy income (5,000)Tax effect 1,030Total (2,091)

CHINA PETROLEUM & CHEMICAL CORPORATIONAnnual Report 20064
PRINCIPAL FINANCIAL DATA AND INDICATORS (CONTINUED)
Pri
nci
pa
l F
ina
nci
al
Da
ta a
nd
In
dic
ato
rs
(2) Principal financial data and indicators prepared in accordance with the PRC Accounting Rules and Regulations
For the years ended 31 DecemberItems Note 2006 2005 2004Income from principal operations (RMB millions) 1,044,579 799,115 590,632Net profit (RMB millions) 50,664 39,558 32,275Earnings per share (RMB)
Fully diluted (i) 0.584 0.456 0.372Weighted average (ii) 0.584 0.456 0.372
Net cash flow from operating activities per share (RMB) 1.183 0.980 0.809Return on net assets (%)
Fully diluted (iii) 19.878 18.346 17.320Weighted average (iv) 21.457 19.682 18.403
Return (before non-operating profits/losses) on net assets (%)Fully diluted 19.058 16.232 19.316Weighted average 20.572 17.414 20.524
At 31 December2006 2005 2004
Total assets (RMB millions) 594,550 520,572 460,081Shareholders’ funds (excluding minority interests) (RMB millions) 254,875 215,623 186,350Net assets per share (RMB) 2.940 2.487 2.149Adjusted net assets per share (RMB) 2.865 2.426 2.102
Notes:
i Fully diluted earnings per share = net profit forthe year/total number of shares in issue at theend of the year
ii Weighted average earnings per share = netprofit for the year/(number of shares at thebeginning of the year + number of sharesincreased due to the transfer from surplusreserves to capital or share dividenddistributed + (increase in number of sharesduring the year due to issuance of new shares
or capitalisation of debt x number of monthsfrom the month following the increase ofshares to the end of the year/number ofmonths in the year) – (number of sharesdecreased due to share repurchases orreduction in share capital x number of monthsfrom the month following the decrease ofshares to the end of the year/number ofmonths for the year))
iii Fully diluted return on net assets = (net profitfor the year/shareholders funds at the end ofthe year) x 100%
iv Weighted average return on net assets = (netprofit for the year/(shareholders’ funds at thebeginning of the year + net profit for the year/2+ (shareholders’ funds increased due toissuance of new shares or capitalisation ofdebt during the year x number of months fromthe month following the increase ofshareholders’ funds to the end of the year/number of months in the year) – (shareholders’funds decreased due to share repurchases orcash dividends during the year x number ofmonths from the month following the decreaseof shareholders’ funds to the end of the year/number of months in the year))) x 100%

CHINA PETROLEUM & CHEMICAL CORPORATION Annual Report 2006 5
Pri
nci
pa
l F
ina
nci
al
Da
ta a
nd
In
dic
ato
rs
(3) Appendix to income statement prepared in accordance with the PRC Accounting Rules and Regulations
For the years ended For the years ended31 December 2006 31 December 2005
Return on net assets(%) Return on net assets(%)Items Fully diluted Weighted average Fully diluted Weighted averageProfit from principal operations 53.46 57.71 52.74 56.58Operating profit 27.97 30.20 26.37 28.29Net profit 19.88 21.46 18.35 19.68Net profit before non-operating profits/losses 19.06 20.57 16.23 17.41
For the years ended For the years ended31 December 2006 31 December 2005Earnings per share Earnings per share
Fully diluted Weighted average Fully diluted Weighted averageItems RMB RMB RMB RMBProfit from principal operations 1.572 1.572 1.312 1.312Operating profit 0.822 0.822 0.656 0.656Net profit 0.584 0.584 0.456 0.456Net profit before non-operating profits/losses 0.560 0.560 0.404 0.404
(4) Changes to the consolidated shareholders’ funds and the reasons for changes for the year Unit: RMB millions
Statutory Statutory Discretionary Unrecognised TotalShare Capital surplus public surplus investment Retained shareholders’
Items capital reserve reserve welfare fund reserve losses profits fundsBeginning of the year 86,702 37,121 13,514 13,514 7,000 (594) 58,366 215,623Increase in the year — 486 18,580 — 20,000 (627) 50,664 89,103Decrease in the year — — — (13,514) — — (36,337) (49,851)End of the year 86,702 37,607 32,094 — 27,000 (1,221) 72,693 254,875
The reasons for the changes are asfollows:
i Capital reserve at the end of 2006was RMB 37,607 million, an increaseby 486 million compared with that atthe beginning of the year. Theincrease was due to the agreementreached between a subsidiary ofSinopec Group Company and a bankto waive loan principal borrowingsand related interest payable. The gainwas reflected as an increase ofcapital reserves;
ii Statutory surplus reserve at the endof 2006 was RMB 32,094 million, anincrease by RMB 18,580 millioncompared with that at the beginningof the year. The increase was mainlydue to the transfer by Sinopec Corp.of 10% of its consolidated net profitfor 2006 in accordance with the PRCAccounting Rules and Regulations ofRMB 50,664 million to the statutorysurplus reserve. In addition,according to NO. 167 of the PRCCompany Law, commencing from 1January 2006, Sinopec Corp. is no
longer required to make profitappropriation to the statutory publicwelfare fund. Pursuant to the “Noticeon Accounting Treatment of BusinessEnterprises in Relation to theEnactment of the Company Law ”issued by the Ministry of Finance, thebalance of this fund as at 31December 2005 of RMB 13,514million was transferred to thestatutory surplus reserve;
iii Discretionary surplus reserve at theend of 2006 was RMB 27,000million, an increase by RMB 20,000million compared with that at thebeginning of the year. The increasewas due to the proposed transfer ofRMB 20,000 million to discretionarysurplus reserve in 2006;
iv Unrecognised investment losses atthe end of 2006 was RMB 1,221million, an increase by RMB 627million compared with RMB 594million at the beginning of the year.The increase represents theunrecognised investment losses whichexceeded the carrying value of long-term equity investments;
v Consolidated retained profits at theend of 2006 was RMB 72,693million, an increase by RMB 14,327million compared with that at thebeginning of the year. The increasewas attributable to the realisation bySinopec Corp. of a consolidated netprofit for 2006 in accordance with thePRC Accounting Rules andRegulations of RMB 50,664 million,and taking into account of thededuction of RMB 5,066 million forthe appropriation of statutory surplusreserve, RMB 20,000 million for theproposed transfer to discretionarysurplus reserve and RMB 11,271million declared and paid as interimdividend for 2006 and final dividendfor 2005; and
vi Total shareholders’ funds at the endof 2006 was RMB 254,875 million,an increase by RMB 39,252 millioncompared with that at the beginningof the year.
CHINA PETROLEUM & CHEMICAL CORPORATIONAnnual Report 20066
PRINCIPAL FINANCIAL DATA AND INDICATORS (CONTINUED)
Pri
nci
pa
l F
ina
nci
al
Da
ta a
nd
In
dic
ato
rs
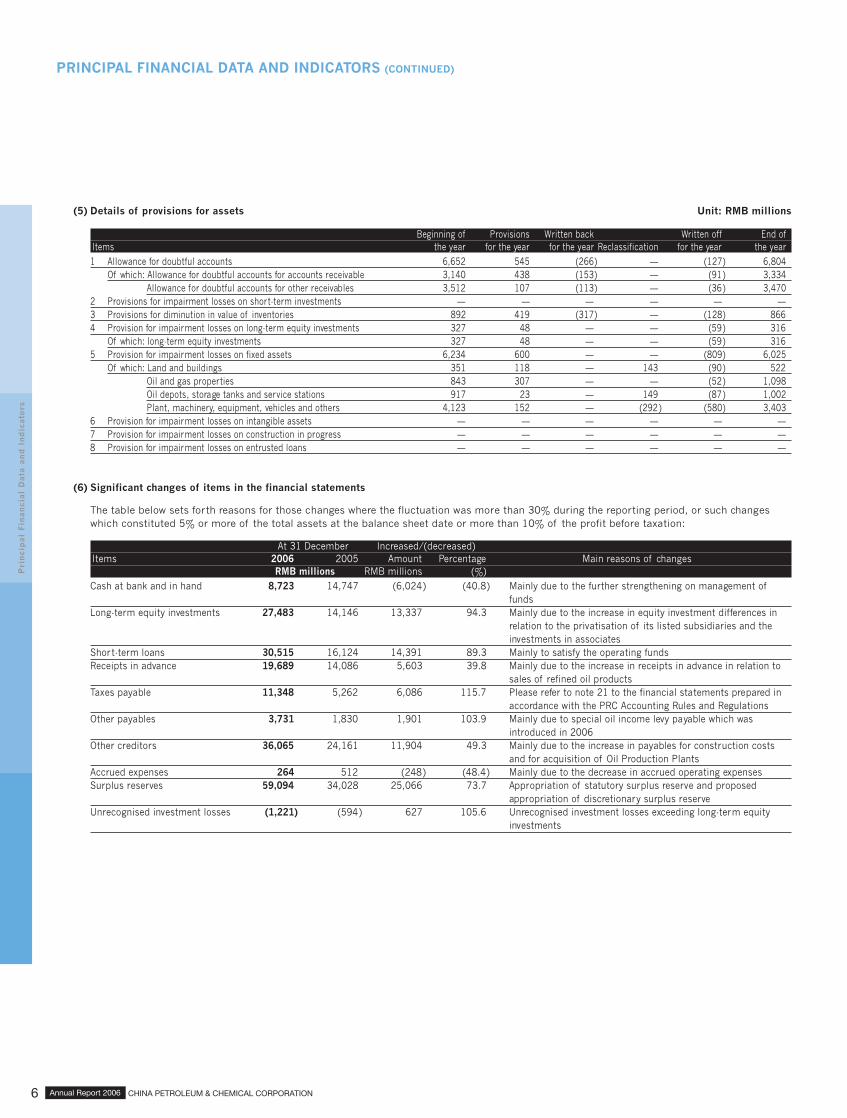
(5) Details of provisions for assets Unit: RMB millions
Beginning of Provisions Written back Written off End ofItems the year for the year for the year Reclassification for the year the year1 Allowance for doubtful accounts 6,652 545 (266) — (127) 6,804
Of which: Allowance for doubtful accounts for accounts receivable 3,140 438 (153) — (91) 3,334Allowance for doubtful accounts for other receivables 3,512 107 (113) — (36) 3,470
2 Provisions for impairment losses on short-term investments — — — — — —3 Provisions for diminution in value of inventories 892 419 (317) — (128) 8664 Provision for impairment losses on long-term equity investments 327 48 — — (59) 316
Of which: long-term equity investments 327 48 — — (59) 3165 Provision for impairment losses on fixed assets 6,234 600 — — (809) 6,025
Of which: Land and buildings 351 118 — 143 (90) 522Oil and gas properties 843 307 — — (52) 1,098Oil depots, storage tanks and service stations 917 23 — 149 (87) 1,002Plant, machinery, equipment, vehicles and others 4,123 152 — (292) (580) 3,403
6 Provision for impairment losses on intangible assets — — — — — —7 Provision for impairment losses on construction in progress — — — — — —8 Provision for impairment losses on entrusted loans — — — — — —
(6) Significant changes of items in the financial statements
The table below sets forth reasons for those changes where the fluctuation was more than 30% during the reporting period, or such changeswhich constituted 5% or more of the total assets at the balance sheet date or more than 10% of the profit before taxation:
At 31 December Increased/(decreased)Items 2006 2005 Amount Percentage Main reasons of changes
RMB millions RMB millions (%)Cash at bank and in hand 8,723 14,747 (6,024) (40.8) Mainly due to the further strengthening on management of
fundsLong-term equity investments 27,483 14,146 13,337 94.3 Mainly due to the increase in equity investment differences in
relation to the privatisation of its listed subsidiaries and theinvestments in associates
Short-term loans 30,515 16,124 14,391 89.3 Mainly to satisfy the operating fundsReceipts in advance 19,689 14,086 5,603 39.8 Mainly due to the increase in receipts in advance in relation to
sales of refined oil productsTaxes payable 11,348 5,262 6,086 115.7 Please refer to note 21 to the financial statements prepared in
accordance with the PRC Accounting Rules and RegulationsOther payables 3,731 1,830 1,901 103.9 Mainly due to special oil income levy payable which was
introduced in 2006Other creditors 36,065 24,161 11,904 49.3 Mainly due to the increase in payables for construction costs
and for acquisition of Oil Production PlantsAccrued expenses 264 512 (248) (48.4) Mainly due to the decrease in accrued operating expensesSurplus reserves 59,094 34,028 25,066 73.7 Appropriation of statutory surplus reserve and proposed
appropriation of discretionary surplus reserveUnrecognised investment losses (1,221) (594) 627 105.6 Unrecognised investment losses exceeding long-term equity
investments
CHINA PETROLEUM & CHEMICAL CORPORATION Annual Report 2006 7
Pri
nci
pa
l F
ina
nci
al
Da
ta a
nd
In
dic
ato
rs
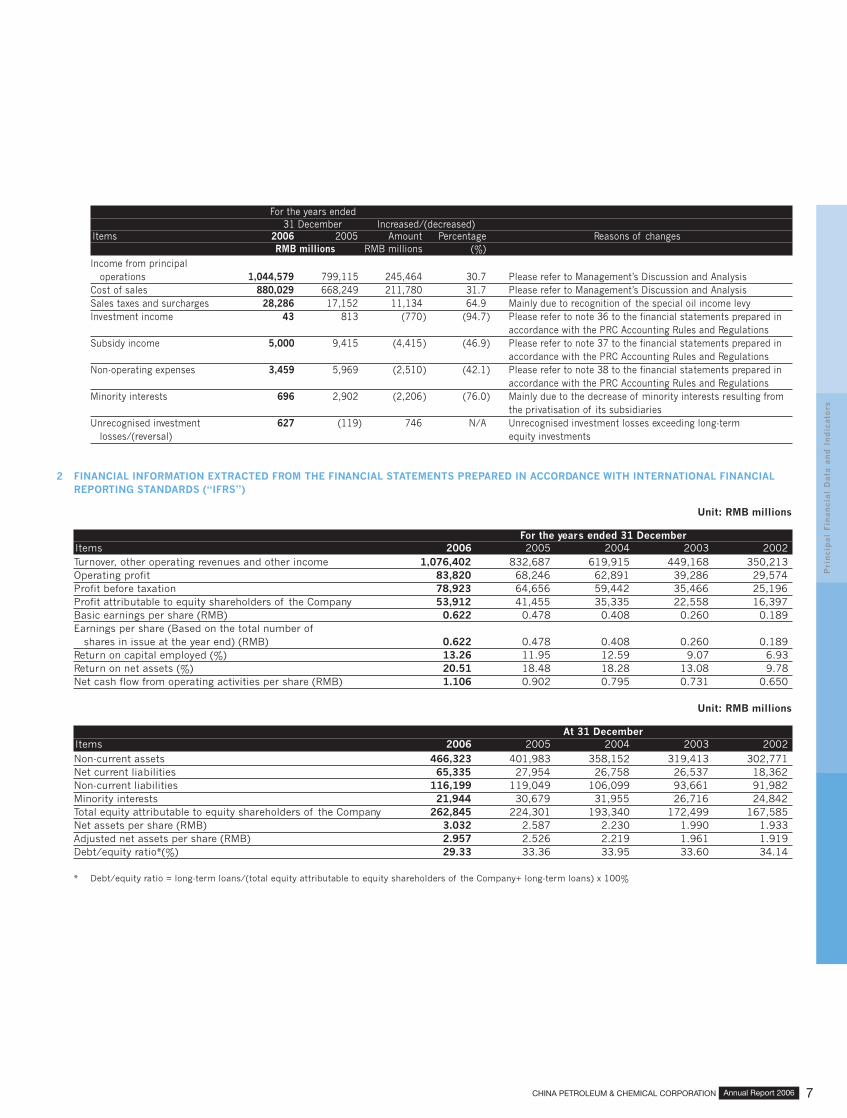
For the years ended31 December Increased/(decreased)
Items 2006 2005 Amount Percentage Reasons of changesRMB millions RMB millions (%)
Income from principaloperations 1,044,579 799,115 245,464 30.7 Please refer to Management’s Discussion and Analysis
Cost of sales 880,029 668,249 211,780 31.7 Please refer to Management’s Discussion and AnalysisSales taxes and surcharges 28,286 17,152 11,134 64.9 Mainly due to recognition of the special oil income levyInvestment income 43 813 (770) (94.7) Please refer to note 36 to the financial statements prepared in
accordance with the PRC Accounting Rules and RegulationsSubsidy income 5,000 9,415 (4,415) (46.9) Please refer to note 37 to the financial statements prepared in
accordance with the PRC Accounting Rules and RegulationsNon-operating expenses 3,459 5,969 (2,510) (42.1) Please refer to note 38 to the financial statements prepared in
accordance with the PRC Accounting Rules and RegulationsMinority interests 696 2,902 (2,206) (76.0) Mainly due to the decrease of minority interests resulting from
the privatisation of its subsidiariesUnrecognised investment 627 (119) 746 N/A Unrecognised investment losses exceeding long-term
losses/(reversal) equity investments
2 FINANCIAL INFORMATION EXTRACTED FROM THE FINANCIAL STATEMENTS PREPARED IN ACCORDANCE WITH INTERNATIONAL FINANCIALREPORTING STANDARDS (“IFRS”)
Unit: RMB millions
For the years ended 31 DecemberItems 2006 2005 2004 2003 2002Turnover, other operating revenues and other income 1,076,402 832,687 619,915 449,168 350,213Operating profit 83,820 68,246 62,891 39,286 29,574Profit before taxation 78,923 64,656 59,442 35,466 25,196Profit attributable to equity shareholders of the Company 53,912 41,455 35,335 22,558 16,397Basic earnings per share (RMB) 0.622 0.478 0.408 0.260 0.189Earnings per share (Based on the total number of
shares in issue at the year end) (RMB) 0.622 0.478 0.408 0.260 0.189Return on capital employed (%) 13.26 11.95 12.59 9.07 6.93Return on net assets (%) 20.51 18.48 18.28 13.08 9.78Net cash flow from operating activities per share (RMB) 1.106 0.902 0.795 0.731 0.650
Unit: RMB millions
At 31 DecemberItems 2006 2005 2004 2003 2002Non-current assets 466,323 401,983 358,152 319,413 302,771Net current liabilities 65,335 27,954 26,758 26,537 18,362Non-current liabilities 116,199 119,049 106,099 93,661 91,982Minority interests 21,944 30,679 31,955 26,716 24,842Total equity attributable to equity shareholders of the Company 262,845 224,301 193,340 172,499 167,585Net assets per share (RMB) 3.032 2.587 2.230 1.990 1.933Adjusted net assets per share (RMB) 2.957 2.526 2.219 1.961 1.919Debt/equity ratio*(%) 29.33 33.36 33.95 33.60 34.14
* Debt/equity ratio = long-term loans/(total equity attributable to equity shareholders of the Company+ long-term loans) x 100%

CHINA PETROLEUM & CHEMICAL CORPORATIONAnnual Report 20068
PRINCIPAL FINANCIAL DATA AND INDICATORS (CONTINUED)
Pri
nci
pa
l F
ina
nci
al
Da
ta a
nd
In
dic
ato
rs
3 MAJOR DIFFERENCES BETWEEN THE AUDITED FINANCIAL STATEMENTS PREPARED UNDER THE PRC ACCOUNTING RULES ANDREGULATIONS AND IFRS
(1) Analysis of the effects of major differences between the net profit underthe PRC Accounting Rules and Regulations and profit for the year under IFRS Unit: RMB millions
For the years ended31 December
2006 2005Net profit under the PRC Accounting Rules and Regulations 50,664 39,558Adjustments:
Equity investment differences 1,158 200Capital injection in Sinopec Hainan and acquisition of Oil Production Plants 1,013 535Acquisition of Sinopec National Star 117 117Pre-operating expenditures 703 435Depreciation of oil and gas properties 666 751Capitalisation of general borrowing costs, net of depreciation effect 524 507Gain from debt restructuring 486 —Reduced amortisation on revaluation of land use rights 26 24Reduced depreciation on government grants 12 4Impairment losses on long-lived assets (150) —Disposal of oil and gas properties, net of depreciation effect (335) (310)Unrecognised losses of subsidiaries (627) 119Effects of the above adjustments on taxation (345) (485)Minority interests 1,496 3,321
Profit for the year under IFRS 55,408 44,776
(2) Analysis of the effects of major differences between the shareholders’ funds underthe PRC Accounting Rules and Regulations and total equity under IFRS Unit: RMB millions
At 31 December2006 2005
Shareholders’ funds under the PRC Accounting Rules and Regulations 254,875 215,623Adjustments:
Equity investment differences 1,358 200Capital injection in Sinopec Hainan and acquisition of Oil Production Plants (1,628) 745Acquisition of Sinopec National Star (2,461) (2,578)Pre-operating expenditures (64) (22)Depreciation of oil and gas properties 12,749 12,233Capitalisation of general borrowing costs 2,636 2,112Revaluation of land use rights (927) (953)Government grants (576) (588)Disposal of oil and gas properties 2,725 3,060Change in fair value of available-for-sale securities 38 —Effects of the above adjustments on taxation (5,880) (5,531)Minority interests 21,944 30,679
Total equity under IFRS 284,789 254,980

CHINA PETROLEUM & CHEMICAL CORPORATION Annual Report 2006 9
CHANGES IN SHARE CAPITAL AND SHAREHOLDINGS OF PRINCIPAL SHAREHOLDERS
Ch
an
ge
s in
Sh
are
Cap
ita
l a
nd
Sh
are
ho
ldin
gs
of
Pri
nci
pa
l S
ha
reh
old
ers
1 CHANGES IN THE SHARE CAPITAL OF SINOPEC CORP.
Unit: 1,000 Shares
Pre-movement Increase/(decrease) Post-movementNew shares Bonus Conversion
Numbers Percentage % issued issued from reserves Others Sub-total Number Percentage %Shares with selling restrictions 67,121,951 77.4 — (784,000 ) — — (784,000) 66,337,951 76.511 State-owned shares 66,535,191 76.7 — (777,147 ) — — (777,147) 65,758,044 75.842 State-owned legal person shares 586,760 0.7 — (6,853) — — (6,853) 579,907 0.673 Shares held by other domestic investors — — — — — — — — —4 Shares held by foreign investors — — — — — — — — —Shares without selling restrictions 19,580,488 22.6 — 784,000 — — 784,000 20,364,488 23.491 RMB ordinary shares 2,800,000 3.2 — 784,000 — — 784,000 3,584,000 4.132 Shares traded in non-RMB
currencies and listed domestically — — — — — — — — —3 Shares listed overseas 16,780,488 19.4 — — — — — 16,780,488 19.364 Others — — — — — — — — —Total Shares 86,702,439 100.0 — — — — — 86,702,439 100.0
Note: In October 2006, Sinopec Corp. implemented A-Share Reform. Please refer to Significant Events – A-Share Reform on Non-tradable shares in this annual report.
2 DATES WHEN SHARES WITH SELLING RESTRICTIONS COULD BE TRADED THROUGH LISTING
Unit: 1,000 Shares
Additional shares tradable Balance of shares Balance of sharesthrough listing when with selling without selling
Date the restriction period expires restrictions restrictionsOctober 10, 2007 4,915,029 61,422,922 25,279,517October 10, 2008 4,335,122 57,087,800 29,614,639October 12, 2009 57,087,800 0 86,702,439
3 NUMBER OF SHARES HELD BY THE TOP TEN HOLDERS OF SHARES WITHSELLING RESTRICTIONS AND CONDITIONS FOR SALE
Unit: 1,000 Shares
Name of Number of shares Date when the shares Number of additionalShareholders with with selling could be traded shares could be traded
No. selling restrictions restrictions through listing through listing Selling restrictions1 China Petrochemical Corporation 65,758,044 October 10, 2007 4,335,122 1 year
61,422,922 October 10, 2008 4,335,122 2 years57,087,800 October 12, 2009 57,087,800 3 years
2 Guo Tai Jun An Corp. 579,907 October 10, 2007 579,907 1 year

CHINA PETROLEUM & CHEMICAL CORPORATIONAnnual Report 200610
CHANGES IN SHARE CAPITAL AND SHAREHOLDINGS OF PRINCIPAL SHAREHOLDERS
Ch
an
ge
s in
Sh
are
Cap
ita
l a
nd
Sh
are
ho
ldin
gs
of
Pri
nci
pa
l S
ha
reh
old
ers
4 NUMBER OF SHAREHOLDERS AND SHAREHOLDINGS OF PRINCIPAL SHAREHOLDERSNumber of shareholders of Sinopec Corp. as at 31 December 2006 was 143,307, including 135,372 holders of A Shares and 7,935 holders of HShares. The public float of Sinopec Corp. satisfied the requirement of the Listing Rules of Hong Kong Exchange.
(1) Top ten shareholders Unit: 1,000 Shares
As a percentageof total Number of
shares in issue shares held at Number of Number ofNature of at the end of the end of shares with pledges or
Name of Shareholders shareholders reporting period reporting period selling restrictions lock-ups%
China Petrochemical Corporation State-owned shares 75.84 65,758,044 65,758,044 0HKSCC (Nominees) Limited H shares 19.24 16,685,675 0 0Guo Tai Jun An Corp. State-owned 0.67 579,964 579,907 533,530(pledges)/
legal person shares/A Shares 38,230(lock-ups)
Southern Supreme Growth StockInvestment Fund A Shares 0.15 134,174 0 0
China Life Insurance Company Limited– Dividend – Individual Dividend –005L–FH002 Shanghai A Shares 0.15 127,369 0 0
Guangfa Strategic Selected Mixed EquityInvestment Fund A Shares 0.11 93,836 0 0
EFUND Stable Growth SecuritiesInvestment Fund A Shares 0.10 89,796 0 0
EFUND Value Selected StockSecurities Investment Fund A Shares 0.09 81,580 0 0
China Life Insurance (Group) Company– Traditional – Ordinary Insurance Product A Shares 0.09 78,913 0 0
Harvest Theme Selected MixedSecurities Investment Fund A Shares 0.08 68,676 0 0
(2) Top ten shareholders of shares without selling restrictions Unit: 1,000 shares
Number of shares without Type ofName of shareholders selling restrictions shares heldHKSCC (Nominees) Limited 16,685,675 H SharesSouthern Supreme Growth Stock Investment Fund 134,174 A SharesChina Life Insurance Company Limited – Dividend
– Individual Dividend – 005L – FH002 Shanghai 127,369 A SharesGuangfa strategic Selected Mixed Securities Investment Fund 93,836 A SharesEFUND Stable Growth Securities Investment Fund 89,796 A SharesEFUND Value Selected Stock Securities Investment Fund 81,580 A SharesChina Life Insurance (group) Company-Traditional- Ordinary Insurance Product 78,913 A SharesHarvest Theme Selected Mixed Securities Investment Fund 68,676 A SharesLion Value Growth Stock Securities Investment Fund 54,962 A SharesNational Social Security Fund 106 Portfolio 52,955 A Shares
Statement on the connection or activities in concert among the above mentioned shareholders
Except that both China Life Insurance Company Limited-Dividend -Individual Dividend-005L-FH002 Shanghai and China Life Insurance (Group)Company-Traditional- Ordinary Insurance Product belong to China Life Insurance (Group) Company, EFUND Stable Growth Securities InvestmentFund and EFUND Value Selected Stock Securities Investment Fund belong to EFUND Fund Management Company, and Harvest Theme SelectedMixed Securities Investment Fund and National Social Security Fund 106 Portfolio belong to Harvest fund company, We are not aware of anyconnection or activities in concert among or between the top ten shareholders and top ten sharesholders of shares without selling restrictions.

CHINA PETROLEUM & CHEMICAL CORPORATION Annual Report 2006 11
Ch
an
ge
s in
Sh
are
Cap
ita
l a
nd
Sh
are
ho
ldin
gs
of
Pri
nci
pa
l S
ha
reh
old
ers
(3) Information disclosed by the shareholders of H Shares according to the Securities and Futures Ordinance
Approximatepercentage of
Number of share Sinopec Corp.’sCapacity of interests held or interests
Name of shareholders interests held regarded as held (H Share) (%)JP Morgan Chases Co. Beneficial owner 125,247,826(L) 0.75(L)
Investment manager 595,543,758(L) 3.55(L)Custodian corporation 789,414,302(P)(L) 4.70(P)(L)
Templeton Asset Management Limited Investment manager 1,028,373,395(L) 6.13(L)AllianceBernstein Corporate interests 1,011,751,126(L) 6.03(L)Credit Suisse Group Corporate interests 899,532,830(L) 5.36(L)
662,145,050(S) 3.95(S)29,156,750(P) 0.17(P)
Note: (L): Long position, (S): Short position, (P): Lending pool
5 CHANGES IN THE CONTROLLINGSHAREHOLDERS AND THE EFFECTIVECONTROLLERThere was no change in the controllingshareholders or the effective controllerduring the reporting period.
(1) Controlling shareholderThe controlling shareholder of SinopecCorp. is China Petrochemical Corporation(“Sinopec Group Company”). Establishedin July 1998, Sinopec Group Company isa state authorised investmentorganisation and a state-owned company.Its registered capital is RMB 104.9billion, and the legal representative is Mr.Chen Tonghai. Through reorganisation in2000, Sinopec Group Company injectedits principal petroleum andpetrochemical operations into SinopecCorp. and retained certain petrochemicalfacilities and small-scale refineries. Itprovides well-drilling services, welllogging services, downhole operationservices, services in connection withmanufacturing and maintenance ofproduction equipment, engineeringconstruction, utility services andsocial services.
(2) Except for HKSCC (Nominees) Limited,no other legal person shareholders hold10% or more of shares of Sinopec Corp.
(3) Basic information of the effectivecontrollerChina Petrochemical Corporation is theeffective controller of Sinopec Corp.
(4) Diagram of the equity and controllingrelationship between Sinopec Corp. andits effective controller
75.84%
China PetrochemicalCorporation
China Petroleum &Chemical Corporation

CHINA PETROLEUM & CHEMICAL CORPORATIONAnnual Report 200612
CHAIRMAN’S STATEMENT
Ch
air
ma
n’s
Sta
tem
en
t
Mr. Chen Tonghai, Chairman
Dear shareholders,
On behalf of the Board of Directors of SinopecCorp., I extend my sincere gratitude for yourcontinued support for the Company.
In 2006, following the guidelines of “reform,restructuring, innovation and development”, theCompany further expanded operations,improved asset quality, enhanced profitabilityand achieved significant growth and earnings.Through our continued efforts over many yearsand the use of innovative marine faciesexploration theories, we discovered a significantnatural gas field in northeast Sichuan,solidifiying the resources foundation for thefuture growth of the Company. In 2006, theCompany increased both its reserves and
production of crude oil and natural gas, withcrude oil production exceeding 40 milliontonnes for the year. As of December 31, 2006,the Company’s refining capacity was the thirdlargest in the world and its ethylene productioncapacity was fourth. In addition, the Companyfurther improved its sales network for gasolineand diesel products, which, with approximately28,000 company-operated service stations as ofDecember 31, 2006, is the third largestgasoline and diesel retail network in the world interms of the number of service stations.Overall, the Company’s competitive advantagesas an integrated energy and chemical companyhave been further enhanced. In 2006, ourturnover and other operating revenuessurpassed RMB1,000 billion for the first timeand our Return on Capital Employed (ROCE)
was above 13%. Under PRC Accounting Rulesand Regulations, the Company’s profit for theyear after deducting the amount attributable tominority interests was RMB 50.664 billion in2006, up 28% over 2005. Under InternationalFinancial Reporting Standards (IFRS), the profitfor the year after deducting the amountattributable to minority interests wasRMB53.912 billion, up 30% over 2005. Giventhe Company’s 2006 earnings and its long-termsustainable growth, the Board of Directors hasproposed a dividend of RMB0.15 per share forthe full year 2006. After deducting the interimdividend of RMB0.04 that has been paid, thefinal dividend for 2006 is RMB0.11 per share.
At the 2006 Annual General Meeting of theCompany’ shareholders, the third session of theBoard of Directors and the Supervisory Boardwere elected. The Board of Directors appointedSenior Management and set the objectives anddefined the implementation plan for 2006 to2008. During 2006, the Company completed itsdomestic A-Share Reform in compliance withthe government’s requirements and aligned theinterests of all shareholders. Consequently, theH Shares of the Company became a Hang SengIndex constituent. In addition, the Companycontinued to implement and improve its internalcontrols to achieve standardized and systematicinternal management systems to reduceoperating risks and enhance management skills.
In 2006, the Company continued to carry outvarious reforms. In particular, the Companyconsolidated some subsidiaries, acquiredcertain oil field assets from Sinopec Group andbecame a majority owner in the Hainan Refinery.The Company deepened management reforms inrefining operations, chemicals sales, materialprocurement and international trade,centralised operation, reduced cost andreinforced its market position. Meanwhile, theCompany continued to streamline its work forceto enhance efficiency and reduced headcountby 24,000.
In 2006, the Company made further assetportfolio adjustments. In response to marketchanges, the Company increased capitalexpenditure, which reached approximatelyRMB80 billion for the year. After the majordiscovery in northeast Sichuan resulting from abreakthrough in innovative marine faciesexploration theory and technology, the Companystarted the preparation work for the “Sichuan-

CHINA PETROLEUM & CHEMICAL CORPORATION Annual Report 2006 13
Ch
air
ma
n’s
Sta
tem
en
t
to-East China Gas Project”. The Company alsostrengthened its logistics system through theconstruction of crude oil wharves and pipelinesfor crude and refined oil products. Moreover, theCompany further improved its sales network forrefined oil products and chemical products,increased its refining and production capacityfor chemical products, and improved refiningfacilities in order to process lower-qualitycrude oil.
In 2006, the Company made great efforts tofacilitate technological innovation. Theexploration areas were extended with thedevelopment of new marine facies explorationtheories and technologies for oil and gas. Afteryears of endeavors, the Company hassuccessfully developed the technology toupgrade its gasoline and diesel quality to levelsequivalent to the European IV specification. Inaddition, the Company is capable of buildingethylene facilities and refining facilities withproduction capacities of one million tonnes andten million tonnes per annum, respectively. TheCompany has implemented an array ofinformation management applications based onits ERP system, and has begun to enhance itsresearch and development efforts on alternativeenergies. In 2006, the Company applied for 842patents in China, of which 703 patents weregranted and won 9 National Science &Technology Progress Awards and NationalTechnology Invention Awards.
As the largest integrated energy and chemicalcompany in China the Company has consciouslyfulfilled its social responsibilities. In recentyears, the Company has implemented relevantgovernment control policies on certain refinedoil products and substantially contributed to thestable supply of refined oil products as well as astable CPI level in China. The Company paidspecial attention to employees’ health, safety,environmental protection and energyconservation. The Company realised stable andsafe production under high-load and complexproduction conditions to deliver high qualityproducts to its customers while increasingenergy and water savings and reducingemissions. Compared with 2005, thecomprehensive energy consumption for everyRMB10,000 of production value decreased by1.2%, and despite the growth in the Company’sproduction, total industrial water consumptiondecreased by 4.9% and total COD emission
decreased by 6.3%. The Company has also beenan active participant in philanthropic activitiescontributing to the harmonious development ofenterprise, society and environment. Suchactivities included disaster relief, financing“Spring Buds Program”, which helps drop-outgirl students return to school, and “HealthExpress”, a program that provides medicaltreatment to cataract patients in remote andpoverty-stricken areas.
All of the Company’s accomplishments wereunderpinned by the rapid development ofChina’s economy, the trust of its shareholdersand the support from the community and thegovernment as well as the effective guidance ofthe Company’s Board of Directors. I herebyexpress my heartfelt gratitude for the trust andsupport of our shareholders, the contributionsof management and of all the employees.I also want to thank the former Directorsand Supervisors for their outstandingcontribution to reforms and to the developmentof the Company.
Looking forward, the Company will havetremendous market opportunities brought bythe rapid development of China’s economy, butwill also face competition and challenges withthe opening of China’s markets. After years ofreforms, the Company has developed acorporate governance and internal managementstructure that allow it to adapt rapidly tochanging market conditions. Its operationalstrengths and overall competitiveness have beenreinforced substantially, raising the Company’soverall operational capabilities to a higher level.As the Company moves forward, the Board ofDirectors has decided to further strengthen thecentralisation of its operational management inorder to consolidate and extend theachievements of past reforms. The Board ofDirectors also decided to reaffirm theCompany’s focus on “reform, restructuring,management, innovation and development”, torealise sustainable, effective and harmoniousdevelopment for the Company by deepeningreforms, accelerating restructuring, enhancingmanagement and promoting innovation.
In 2007, the Company will continue to enhanceits management and further advance variousreforms. The Company will reinforce productionsafety, energy conservation and environmentalprotection, improve its advance warning systemfor emergencies and strengthen the supervision
and management of production safety. Inaddition, the Company will further strengthenfundamental management by focusing oninternal controls. The Company will also seek toimprove standardization and internalmanagement systems through theimplementation of various internal rules, and touphold a scientific approach to increaseoperational and managerial skills.
In 2007, in response to market demand and inorder to meet the targets of its overalldevelopment plan, the Company will increase itsinvestments in its upstream business and startthe “Sichuan-to-East China Gas Project”. TheCompany will also accelerate the constructionof a number of key oil refining and chemicalprojects and further improve its logistics systemto support the rapid growth in refined oilproducts and chemicals sales. The Companyhas budgeted RMB110 billion in capitalexpenditure for the year.
In 2007, the Company will rationalize itsoperational strategies in line with marketdynamics. In addition, the Company intends tofurther optimise its operations, expand itsmarket share, reduce costs, and further improveoperating results.
The Board of Directors and I firmly believe thatwith the continuous endeavors of ourmanagement and employees, the Company willmake further strides in delivering sound resultsto our shareholders, customers, employeesand society.
Chen TonghaiChairman
Beijing, ChinaApril 6, 2007


CHINA PETROLEUM & CHEMICAL CORPORATIONAnnual Report 200616
BUSINESS REVIEW AND PROSPECTS
Bu
sin
ess
Re
vie
w a
nd
Pro
spe
cts
Mr. Wang Tianpu, President
BUSINESS REVIEWIn 2006, the Chinese economy continued togrow at a rapid rate, with a GDP growth rate of10.7%. The international crude oil prices werefluctuating at a high level, the Chinesegovernment continued its tight control onrefined oil product prices, and thepetrochemical product prices remained at ahigh level. Confronted with such volatile marketenvironment, the Company, sticking to thescientific approach to development, managed toexpand resources and market, emphasised theimplementation of its resource strategies,responded to the market change actively,optimised its refining and chemical production,strengthened the internal management, gave fullplay to the advantage of the integration andplaced emphasis on safe operation, energyconservation, and consumption and costreduction. With the unified efforts from ouremployees, we achieved new growth in both ourproduction volume and profit.
1. Review of Market Environment
(1) Crude oil marketIn 2006, international crude oil pricesfluctuated at a high level under theinfluence of various factors. After the oilprice hit record high, it experiencedsignificant decline. The Platts’ Brent spotprice in 2006 averaged US$ 65.14 perbarrel, up by 19.5% compared with2005. The domestic crude oil pricegenerally followed the trend in theinternational market. Average realisedprice of crude oil produced by theCompany was RMB 3,194.5 per tonne in2006, up by 19.9% compared with 2005.
(2) Refined oil products marketIn 2006, domestic demand for refined oilproducts maintained a moderate growth.According to the Company’s statistics,the apparent domestic consumption ofrefined oil products (inclusive ofgasoline, diesel and kerosene includingjet fuel) in 2006 was 174.40 milliontonnes, up by 6.1% compared with 2005.Due to tight control over the domesticprices, there was a significant spreadbetween domestic and internationalprices of refined oil products. Price Trend of International Crude Oil

CHINA PETROLEUM & CHEMICAL CORPORATION Annual Report 2006 17
Bu
sin
ess
Re
vie
w a
nd
Pro
spe
cts
(3) Chemicals marketIn 2006, domestic demand for chemicalskept growing. The apparent consumptionof synthetic resins, synthetic fibers andsynthetic rubbers increased by 7.8%compared with 2005 while domesticethylene equivalent consumptionincreased by 4.3% over the previousyear. Domestic chemicals prices followeda similar trend as that of the internationalmarket, with an increase in the overallprices.
2 Production and Operation
(1) Exploration and ProductionIn 2006, the Company achieved goodresults in oil and gas exploration andproduction by intensifying its explorationactivities, and optimising its explorationand production plans.
In connection with exploration activities,the Company attached great importanceto the deep gas reserviors exploration inthe Northeast Sichuan Province and EastChina and progressive exploration ofcrude oil in existing blocks andcompleted approximately 15,175kilometers of 2D seismic andapproximately 7,582 square kilometersof 3D seismic, and drilled 495exploration wells with a total footage ofapproximately 1,438.22 kilometers in2006. New progress has been made inNortheast Sichuan Province, easternmature blocks and Tahe in the west,placing a basis for the resourcereplacement in the future.
In oil and gas development, the Companyintensified its progressive explorationand oil reserve evaluation, and effectively
Summary of Operations of the Exploration and Production Segment
Changefrom 2005
2006 2005 2004 to 2006 (%)Crude oil production (mmbbls) 285.19 278.82 274.15 2.3Natural gas production (bcf) 256.5 221.9 207.0 15.6Newly added proved reserves of crude oil (mmbbls) 286 306 284 (6.5)Newly added proved reserves of natural gas (bcf) 161.5 140.6 352.0 14.9Year-end proved reserves of crude oil (mmbbls) 3,295 3,294 3,267 0.03Year-end proved reserves of natural gas (bcf) 2,856.7 2,951.7 3,033.0 (3.2)Year-end proved reserves of crude oil and natural gas (mmboe) 3,771 3,786 3,773 (0.4)
developed proved reserves. Under thehigh oil price environment, the Companyactively developed low-yield reserves andimproved the quality and efficiency in thenew blocks to increase oil and gasproduction. The Company also put apremium on application of newprocesses and new technologies to thedevelopment in mature blocks, so as tocontinuously improve recovery rate. In2006, the Company drilled 2,649development wells with total footage of5,888.9 kilometers, with newly addedcapacity of 6.465 million tonnes perannum (tpa) for crude oil and 1.9 billioncubic meters per annum for natural gas.In 2006, the oil and gas productionachieved a steady growth, with the crudeoil production exceeding 40 million forthe first time.

CHINA PETROLEUM & CHEMICAL CORPORATIONAnnual Report 200618
BUSINESS REVIEW AND PROSPECTS (CONTINUED)
Bu
sin
ess
Re
vie
w a
nd
Pro
spe
cts
Summary of Production and Operations of Shengli Oil Field
Changefrom 2005
2006 2005 2004 to 2006 (%)Crude oil production (mmbbls) 194.65 191.31 189.88 1.7Natural gas production (bcf) 28.3 31.1 31.8 (9.0)Newly added proved reserves of crude oil (mmbbls) 185 247 225 (25.1)Newly added proved reserves of natural gas (bcf) 19.2 (3.6) 79.9 n/aYear-end proved reserves of crude oil (mmbbls) 2,352 2,362 2,306 (0.4)Year-end proved reserves of natural gas (bcf) 313.3 322.4 357.1 (2.8)Year-end proved reserves of crude oil and natural gas (mmboe) 2,404 2,415 2,366 (0.5)
Note: Crude oil volume is converted at 1 tonne to 7.1 barrels, and gas volume is converted at 1 cubic meter to 35.31 cubic feet
(2) RefiningIn 2006, the Company strengthened theoperations of its refining facilities,actively organised full-load production tomeet market demand. In addition, theCompany closely monitored the changeson the international crude oil market,adhered to diversified crude oil sourcesto reduce the procurement cost of crude
oil. The Company also sought to makefull use of storage and transportationfacilities such as newly built crude oilwharves and pipelines to reduce thestorage and transportation cost.Moveover, the Company activelyoptimised resource allocation andproduct mix, increased the processingratio of lower quality crude oil and
expanded the sales volume of highervalue-added products. As a result, themajor economic and technologicalindicators such as light yield and refiningyield further improved. The Companyprocessed 146.32 million tonnes ofcrude oil in 2006, up by 4.6% over thelast year.
Sources of Crude Oil Unit: million tonnes
Changefrom 2005
2006 2005 2004 to 2006 (%)Internal supplies 29.62 28.62 28.14 3.5PetroChina Company Ltd. 8.81 8.75 10.31 0.7CNOOC Ltd. 4.93 5.05 6.69 (2.4)Imported 101.47 99.13 89.03 2.4Total 144.83 141.55 134.17 2.3

CHINA PETROLEUM & CHEMICAL CORPORATION Annual Report 2006 19
Bu
sin
ess
Re
vie
w a
nd
Pro
spe
cts
Summary of Production of the Refining Segment
Changefrom 2005
2006 2005 2004 to 2006 (%)Refinery throughout (thousand bbls/day) 2,946.5 2,817.9 2,677.2 4.6
of which: high sulphur crude oil throughout (thousand bbls/day): 742.5 698.8 551.1 6.3Refining utilisation rate (%) 94.28 94.01 93.43 0.27
percentagepoint
Gasoline, diesel and kerosene production (million tonnes) 87.21 84.53 80.83 3.2of which: Gasoline production (million tonnes) 23.00 22.98 23.58 0.1
Diesel production (million tonnes) 57.86 54.92 50.89 5.4Kerosene production (million tonnes) 6.35 6.63 6.36 (4.2)
Light chemical feedstock production (million tonnes) 22.74 21.10 17.70 7.8Light products yield (%) 74.75 74.16 74.02 0.59
percentagepoint
Refining yield (%) 93.47 93.24 93.09 0.23percentage
point
Note: Refinery throughout is converted at 1 tonne to 7.35 barrels
(3) Marketing and distributionIn 2006, the Company endeavored toexpand the retail and direct sales ofrefined oil products and optimised themarketing structure, and as a result,retail sales volume of refined oilproducts increased significantly. Inaddition, the Company gatheredresources from multiple channels,strengthened the coordination among
different regions, optimised resourceallocation to ensure market supply.Furthermore, the Company optimised itsmarketing network and further increasedthe number of company-operated servicestations. The average pumped volume perstation was further increased. Sinopeccards were widely accepted, andcustomers can use one single card atSinopec stations across the nation. At the
same time, the Company reinforced itsnon-fuel business. “Drive Through”restaurants jointly managed by theCompany and McDonald’s have begun tooffer services in selected service stations.In 2006, the Company’s sales volume ofrefined oil products increased to 112million tonnes, up by 6.8% compared with2005, of which retail volume was 72.16million tonnes, up by 13.6% over 2005.
Summary of Operations of Marketing and Distribution Segment
Changefrom 2005
2006 2005 2004 to 2006 (%)Total domestic sales of refined oil products (million tonnes) 111.68 104.56 94.59 6.8Of which: Retail volume (million tonnes) 72.16 63.52 53.25 13.6
Direct sales volume (million tonnes) 18.95 20.38 19.65 (7.0)Wholesale volume (million tonnes) 20.57 20.66 21.69 (0.4)
Average annual throughput per service station (tonne/station) 2,577 2,321 2,003 11.0Total number of service stations under SINOPEC brand 28,801 29,647 30,063 (2.9)Of which: Number of company-operated service stations 28,001 27,367 26,581 2.3
Number of franchised service stations 800 2,280 3,482 (64.9)Retail volume/total domestic sales volume (%) 64.6 60.7 56.3 3.9
percentagepoints

CHINA PETROLEUM & CHEMICAL CORPORATIONAnnual Report 200620
BUSINESS REVIEW AND PROSPECTS (CONTINUED)
Bu
sin
ess
Re
vie
w a
nd
Pro
spe
cts
(4) ChemicalsIn 2006, the Company leveraged on theadvantage of the centralised sales ofchemical products, unified its marketingoperation, coordinated the productionand sales closely and endeavored toachieve good match between volume andprice. As a result, the sales volume of thechemical products increased at a steady
rate. The sales volume of the chemicalproducts reached 29.56 million tonnes,the sales of the chemical productsthrough centralised network reached19.58 million tonnes in 2006,representing an increase of 8.5%compared with 2005. The Companyenhanced its efforts to tap the potentialsof the chemical facilities, paid great
attention to the chemical production andensured the full-load operation of the keychemical facilities, bringing theproduction of the major chemicalproducts to a record high. In 2006, theCompany produced 6.163 million tonnesof ethylene, up by 15.9% comparedwith 2005.
Production of Major Chemicals Unit: 1,000 tonnes
Changefrom 2005
2006 2005 2004 to 2006 (%)Ethylene 6,163 5,319 4,074 15.9Synthetic resins 8,619 7,605 6,221 13.3Synthetic rubbers 668 626 561 6.7Monomers and polymers for synthetic fibres 7,242 6,725 6,021 7.7Synthetic fibre 1,502 1,570 1,654 (4.3)Urea 1,609 1,780 2,630 (9.6)
Note: The operational data for 2005 and 2006 include the production of the two joint venture ethylene facilities, Shanghai Secco and BASF-YPC
(5) Research and developmentIn 2006, the Company focused on thedevelopment needs of the core businessand strengthened research on the keytechnologies, obtaining a number ofsignificant achievements. The Companyapplied for 842 domestic patents andobtained 703 of them. “FormationMechanism for Gas Reserviors in DeepMarine Carbonate Strata, explorationtechnology and Discovery of PuguangGas Field” attained the first Prize ofNational Science & Technology ProgressAwards, and another eight technologiesobtained the Second Prize of NationalScience & Technology Progress Awardsand two technologies won the SecondPrize of National Technology InventionAwards. The Company continued thetheory and technology research of themarine facies oil and gas exploration,expanding its exploration business. The
Company is technically ready to upgradeits refined oil product specification toEuro IV. 10 million tpa refinery and 1million tpa ethylene project withproprietary technologies is underconstruction, which indicates theproprietary technologies and engineeringcapacity of the Company has alreadyreached a new level.
Information technologies were applied toimprove management. Applications ofERP and other IT systems are playingincreasingly important roles in theCompany’s business development andoperation management.
(6) Cost savingIn 2006, the Company took variousmeasures to reduce cost, such asoptimising resource allocation andleveraging on existing logistics system,
reducing transportation cost, furtherincreasing the processing volume oflower quality crude oil, reducing theprocurement cost of crude oil andconsumption of energy and materials inthe production process by optimisingoperation of the facilities. In 2006, theCompany effectively saved RMB 2.781billion in cost, which exceeded theoriginal target of RMB 2.5 billion by RMB281 million. Of the total cost saved, theexploration and production segment, therefining segment, the marketing anddistribution segment and the chemicalssegment achieved cost saving ofRMB 720 million, RMB 721 million,RMB 561 million, and RMB 779million, respectively.
CHINA PETROLEUM & CHEMICAL CORPORATION Annual Report 2006 21
Bu
sin
ess
Re
vie
w a
nd
Pro
spe
cts
(7) Capital expenditureIn 2006, the total capital expenditure ofthe Company was RMB 79.82 billion.Among which, the expenditure forexploration and production segment wasRMB 31.73 billion. With the investment, oiland gas exploration in Northeast Sichuanand the preparations of “Sichuan-to-EastChina Gas Project” were fully started, theoil and gas production and construction inTahe in the west, Shengli Chenbei Offshorein the east and Daniudi Gasfield madesmooth progress. The newly built crude oiland natural gas capability hit 6.465 milliontonnes and 1.9 billion cubic meters perannum respectively. The expenditure forrefining segment was RMB 21.97 billion.The newly added comprehensive crude oilprocessing capability reached 14.7 milliontonnes per annum. The newly built andrevamped projects such as HainanRefinery and Guangzhou Refinery havebeen completed and put into operation.Yanshan Refinery Upgrading Project hasalso been completed, and Cezi IslandWharf and Yizheng-Changling Crude OilPipeline projects have been put intooperation. Construction of QingdaoRefinery is going smoothly. Theexpenditure for marketing and distributionsegment was RMB 11.32 billion. With theinvestment, the Company has furtherimproved its refined oil products salesnetwork through construction, acquisitionand renovation of service stations. In2006, the Company had 811 servicestations newly added to its network. Theexpenditure for chemicals segment wasRMB 12.63 billion. The newly addedproduction capacity of ethylene, PTA, andstyrene-butadiene rubber was 750,000tpa, 450,000 tpa and 100,000 tparespectively. Maoming ethylene revampingproject has been completed and put intooperation and the chemical fertilizerrevamping projects in Anqing, Hubei andBaling were completed and successfullycommissioned. The Fujian IntegratedProject, Tianjin Ethylene and ZhenhaiEthylene are progressing on schedule. Theexpenditure for corporate and others wasRMB 2.17 billion, which was used for theupgrading of IT systems andconstruction of R&D infrastructures.
In addition, the capital expenditure forthe three oil production companiesacquired by the Company in 2006 wasRMB 3.36 billion. The Company’s jointventures had capital expenditures of RMB260 million in 2006.
BUSINESS PROSPECTSLooking forward for 2007, China’s economy isexpected to maintain a stable and rapid growth,which would help sustain a reasonable growthof domestic demand for oil and petrochemicalproducts. The crude oil prices are expected tocontinue to maintain at a high level and theprices of most of petrochemical products areexpected to stay at relatively high level. Inaddition, with the full opening of the domesticmarket of refined oil products, competitions indomestic refined oil products market maybe intersified.
Under such market environment, the Companywill continue to take flexible operationstrategies, further strengthen internalmanagement, and endeavor to organiseproduction and reduce energy and materialsconsumption. In particular, the Companyintends to focus on the following areas:
Exploration and production segment:In connection with the exploration andproduction, the Company will make furtherefforts to implement oil and gas resourcestrategies and accelerate the exploration andproduction of natural gas in Northeast and WestSichuan to expand the results of theexploration. In addition, the Company expects tokeep stable production in mature blocks in eastChina, accelerate the development of oil fieldsin west China and expand the natural gasbusiness, to maintain stable increase of oil andgas production. The Company plans to produce291.1 million barrels of crude oil and 282.48billion cubic feet of natural gas in 2007.
Refining segment: The Company intends to putmore efforts to optimise the operations andrealise its potentials, and it will leverage thepotentials of the facilities, optimise resourceprotfolio, increase the processing volume oflower quality crude oil to reduce the purchasecost of crude oil. In addition, by relying on thetechnological advancement, the Company willfocus on the research of specific technologies tosave energy, reduce consumption and increasethe utilisation efficiency of resource. And theCompany will optimise production scheme,adjust product structures, make efforts toincrease the production of the higher value-added products. Furthermore, it will purchasecrude oil carefully and adhere to the diversity ofthe crude oil resource, ensuring crude oilsupply. The Company plans to process 156million tonnes of crude oil in 2007.

CHINA PETROLEUM & CHEMICAL CORPORATIONAnnual Report 200622
BUSINESS REVIEW AND PROSPECTS (CONTINUED)
Bu
sin
ess
Re
vie
w a
nd
Pro
spe
cts
Marketing and distribution segment: TheCompany intends to further improve its serviceand marketing network to expand total salesand retail sales volume. The Company willmonitor the market dynamics closely, balancethe resources from an overall perspective,optimise resource allocation, enhance theoperation efficiency of the refined oil productspipelines, reduce the transportation cost andactively promote the use of cleaner fuel. TheCompany plans to have a total sales volume ofrefined oil products of 117 million tonnes,including a retail sales volume of 75million tonnes.
Chemicals segment: The Company intends tostrengthen its management to enhanceoperational level of its chemical facilities, andintends to ensure safe and full-load productionof the facilities. In addition, the Company willfurther optimise regional resources, optimiseinternal-supply of the chemical feedstock,respond to market change flexibly, activelyproduce products well received by the market,leverage the advantages of the centralisedsales, expand market steadily and increase thesales volume of the products. The Companyplans to produce 6.45 million tonnes ofethylene, 19.13 million tonnes of syntheticresins, rubbers and fibers in 2007.
Research and development: In line with theneeds of production and development, theCompany intends to further focus its R&Dstrength on key technologies, and it will placemore emphasis on developing the coretechnologies such as marine facies oil and gasexploration, increase reserve and stabiliseproduction in the oil fields in the east, lowerquality crude oil processing, utilisation of
natural gas and production of cleaner fuels andsupreme-performance synthetic materials, witha view to sharpening the Company’s competitiveedge. Moreover, the Company intends toenhance its efforts to promote the results ofmature technologies, improve the productiontechnology level, reduce the production cost,further integrate technological resource,manage to improve equipment for scientificresearch and improve development efficiency ofscientific research.
Cost saving: In 2007, the Company intends torely on scientific and technological advancementand reinforce management practices to deepenreforms and enhance operating efficiency. Itplans to achieve a cost saving of RMB 2.6billion, among which exploration and productionsegment plans to achieve a cost saving of RMB700 million, refining segment RMB 600million, chemicals segment RMB 600 million,and marketing and distribution segment RMB700 million.
Capital expenditure: The Company will continueto uphold the guideline of “Spend reasonably inlight of the income, control the totalexpenditure, make centralised decisions, adjustthe structure, optimise project and increasereturn” and endeavor to realise effectivedevelopment of the Company. According topresent macro-economy and market situation,the Company’s planned capital expenditure isRMB 110.06 billion for 2007. The projectedexpenditure for exploration and productionsegment is RMB 53.1 billion used to speed upthe construction process of “Sichuan-to-EastChina Gas Project” project and strengthen theoil and gas exploration and production inNortheast Sichuan, Ordos, Tahe Oil field and
Southern Tianshan Mountain. The projectedcapital expenditure for refining segment is RMB22.7 billion which is primarily planned forQingdao Refinery Project, Bohai Bay crude oilterminal, expansion and revamping of Gaoqiao,Yanshan Refining Project. The projected capitalexpenditure for chemicals segment is RMB19.46 billion which is planned for Fujian, Tianjinand Zhenhai’s ethylene projects and to promotethe expansion, revamping and auxiliary facilitiesconstruction for monomers of synthetic fibreand organic materials in Yangzi, Shanghai andJinling Petrochemical. The projected capitalexpenditure for marketing and distributionsegment is RMB 12 billion which is planned tooptimise and improve the marketing network ofrefined oil products and accelerate theconstruction of the pipelines and oil storage forthe refined oil products. The projected capitalexpenditure for corporate and others is RMB 2.8billion.
In 2007, the Company, in line with the operatingpolicies set forth by the Board of Directors, willdeepen reform, accelerate adjustment, intensifymanagement, make greater progress, fullyreach various production and operation targetsand strive to obtain better performance inproduction and operation, enhancing theCompany’s overall competitiveness and abilityof making sustainable profit.

CHINA PETROLEUM & CHEMICAL CORPORATION Annual Report 2006 23
HEALTH, SAFETY AND ENVIRONMENT
He
alt
h,
Sa
fety
an
d E
nvir
on
me
nt
Guided by the scientific approach todevelopment, the Company has long beendedicated to performing its socialresponsibilities and achieving a coordinateddevelopment between health, safety andenvironment (HSE) and economic growth andhas instituted a mechanism for effective long-term operations. While maintaining full load andlonger cycle production, the Company in 2006continued to focus on operational safety andimproved environmental protection and madecontinuous efforts to care for the health of itsemployees and its relations with thecommunities to achieve harmonious growth.
1 Overall steady and safe production andimproving HSE managementThe Company strictly implemented therequirements of “Improving systems,enhancing skills, laying solid foundation andholding relevant employees accountable”and endeavored to promote the quality,safety and environmental protection statusof major products, continuously reduceenergy and material consumption perproduction unit. While maintaining full-loadand longer cycle production, the Companyachieved steady and safe production andcontinuously enhance enviromental protection.
2 Continued improvement to deepen theoperation of HSE management systemSince the Company’s subsidiariesestablished HSE management system, theCompany focused on the smooth operationof the system. In 2006, the Companyorganised HSE supervision, examination andassessment at different levels, especially theevaluation of HSE system execution,therefore to further improve and perfectthis system.
3 Adherence to the principle of people-oriented to create harmonious and healthywork environmentIn 2006, the Company continued tostrengthen firm-wide HSE education andtraining to continually improve employees’operational skills and strengthen
occupational health management. Warningsigns were posted in the workplace andmonitoring and measurement results werepublicly displayed. Regular occupationalhealth checkups were arranged for relevantemployees and working conditions werecontinuously improved to ensure employees’safety and health.
4 Implementation of a prevention-basedpolicy; assessment of safety andenvironmental risks of newly built facilitiesand construction-in-progressIn 2006, the Company performed safety andenvironmental protection assessments overa number of newly-built, revamping andexpansion projects, and continued toperform risk assessments over operatingfacilities as well as utilities. Rectification ofpotentially risky areas was subject tocontinuous monitoring throughout theprocess, while dynamic monitoring wasinstituted for major facilities and key areasunder the oversight of a specially designatedperson. The Company and its subsidiariesformulated and improved its emergencyresponse plans for corresponding accidents,strengthened emergency response drills, andits capacity for confronting emergencies wascontinuously improved.
5 Active promotion of clean production torealise clean and economical developmentIn 2006, the Company standardised itsenvironmental management in line with HSEmanagement system, strengthened itscontrol of effluent sources to achieve thegoals of saving water and reducingemission. Notwithstanding significantincrease in the Company’s production, ascompared to 2005, the industrial waterconsumption was reduced by 4.9% and CODvolume in its discharged waste water wasreduced by 6.3%, respectively.


CHINA PETROLEUM & CHEMICAL CORPORATIONAnnual Report 200626
MANAGEMENT’S DISCUSSION AND ANALYSIS
Ma
na
gem
en
t’s
Dis
cuss
ion
an
d A
na
lysi
s
THE FOLLOWING DISCUSSION AND ANALYSIS SHOULD BE READ IN CONJUNCTION WITH THECOMPANY’S AUDITED FINANCIAL STATEMENTS AND THE ACCOMPANYING NOTES. PART OF THEFINANCIAL INFORMATION PRESENTED IN THIS SECTION IS DERIVED FROM THE COMPANY’S AUDITEDFINANCIAL STATEMENTS THAT HAVE BEEN PREPARED IN ACCORDANCE WITH INTERNATIONALFINANCIAL REPORTING STANDARDS (“IFRS”).
1 CONSOLIDATED RESULTS OF OPERATIONSIn 2006, the Company’s turnover, otheroperating revenues and other income wereRMB 1,076.4 billion, and the operatingprofit was RMB 83.8 billion, representing anincrease of 29.3% and 22.8%, respectively,over those in the previous year. These
increases were largely attributable to thefollowing factors: by seising theopportunities presented by the high marketprices of petroleum and chemical productsand steady growth of the domestic economy,the Company strived to implement theresource strategy, proactively expand the
market share, optimised refining andpetrochemical production, made greatefforts on safety, resource conservation,reduction of utilities comsumption and cost,all of which contributed to the comparativelygood operating results achieved in 2006.
The following table sets forth the major items in the consolidated income statement of the Company for the indicated periods.
Years Ended 31 December Rate of2006 2005 Change(RMB in millions) (%)
Turnover, other operating revenues and other income 1,076,402 832,687 29.3Of which: Turnover 1,044,652 799,259 30.7
Other operating revenues 26,750 24,013 11.4Other income 5,000 9,415 (46.9)
Operating expenses (992,582) (764,441) 29.8Of which: Purchased crude oil, products, and operating supplies and expenses (861,437) (651,201) 32.3
Selling, general and administrative expenses (37,758) (33,880) 11.4Depreciation, depletion and amortisation (34,235) (31,618) 8.3Exploration expenses (including dry holes) (7,983) (6,411) 24.5Personnel expenses (19,857) (18,649) 6.5Employee reduction expenses (236) (369) (36.0)Taxes other than income tax (28,639) (17,185) 66.7Other operating expenses, net (2,437) (5,128) (52.5)
Operating profit 83,820 68,246 22.8Net finance costs (6,100) (4,625) 31.9Investment income and share of profit less losses from associates 1,203 1,035 16.2Profit before tax 78,923 64,656 22.1Taxation (23,515) (19,880) 18.3Profit for the year 55,408 44,776 23.7Attributable to:
Equity shareholders of the Company 53,912 41,455 30.0Minority interests 1,496 3,321 (55.0)
CHINA PETROLEUM & CHEMICAL CORPORATION Annual Report 2006 27
Ma
na
gem
en
t’s
Dis
cuss
ion
an
d A
na
lysi
s
(1) Turnover, Other Operating Revenues andOther IncomeIn 2006, the Company’s turnover, otheroperating revenues and other income wereRMB 1,076.4 billion, of which, the turnoverwas RMB 1,044.7 billion, representing anincrease of 30.7% over 2005. Theseincreases were mainly attributable to theCompany’s efforts in expanding resourcesand markets as well as optimising its sales
and marketing structure in order to takeadvantage of the high international prices ofcrude oil, petroleum and chemical products.
In 2006, the Company’s other operatingrevenues was RMB 26.8 billion, representingan increase of 11.4% over 2005. Otheroperation revenue included: income fromservice fee, sales of materials, sales ofutilities, etc.
At the end of 2006, the Company receivedfrom the PRC government a one-offcompensation of RMB 5 billion.
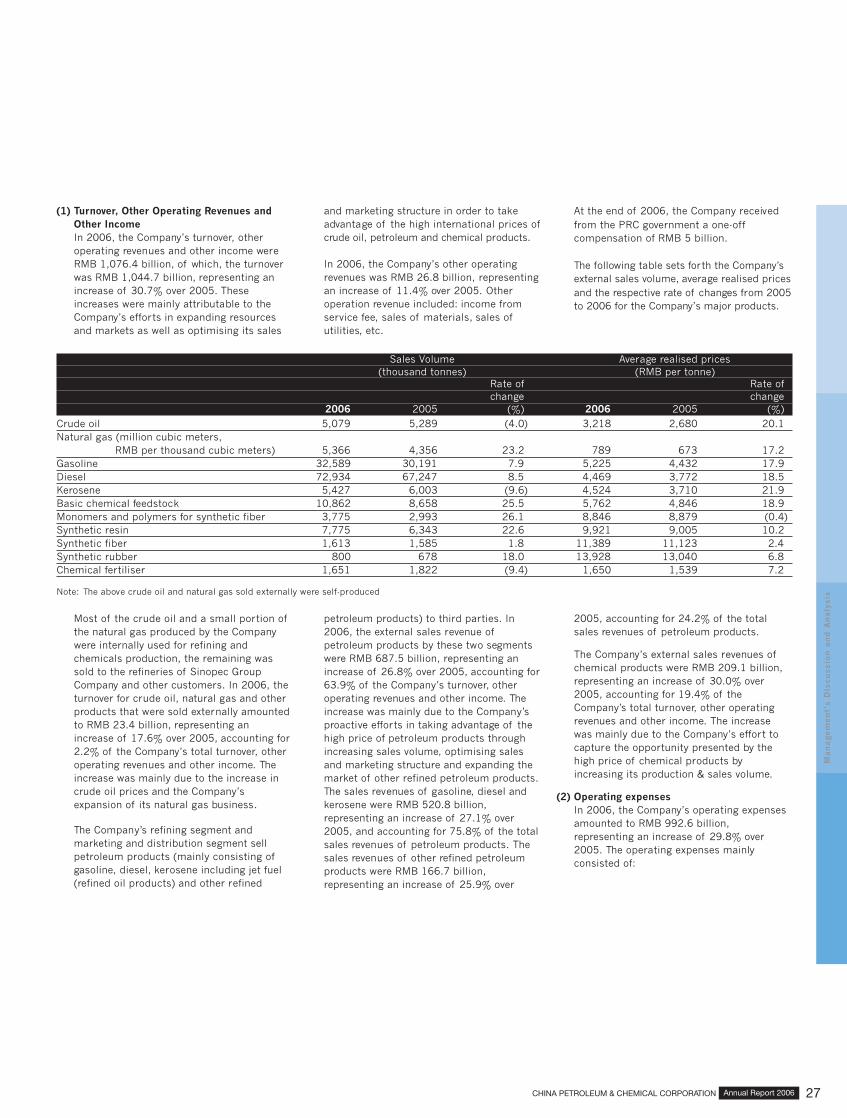
The following table sets forth the Company’sexternal sales volume, average realised pricesand the respective rate of changes from 2005to 2006 for the Company’s major products.
Sales Volume Average realised prices(thousand tonnes) (RMB per tonne)
Rate of Rate ofchange change
2006 2005 (%) 2006 2005 (%)Crude oil 5,079 5,289 (4.0) 3,218 2,680 20.1Natural gas (million cubic meters,
RMB per thousand cubic meters) 5,366 4,356 23.2 789 673 17.2Gasoline 32,589 30,191 7.9 5,225 4,432 17.9Diesel 72,934 67,247 8.5 4,469 3,772 18.5Kerosene 5,427 6,003 (9.6) 4,524 3,710 21.9Basic chemical feedstock 10,862 8,658 25.5 5,762 4,846 18.9Monomers and polymers for synthetic fiber 3,775 2,993 26.1 8,846 8,879 (0.4)Synthetic resin 7,775 6,343 22.6 9,921 9,005 10.2Synthetic fiber 1,613 1,585 1.8 11,389 11,123 2.4Synthetic rubber 800 678 18.0 13,928 13,040 6.8Chemical fertiliser 1,651 1,822 (9.4) 1,650 1,539 7.2
Note: The above crude oil and natural gas sold externally were self-produced
Most of the crude oil and a small portion ofthe natural gas produced by the Companywere internally used for refining andchemicals production, the remaining wassold to the refineries of Sinopec GroupCompany and other customers. In 2006, theturnover for crude oil, natural gas and otherproducts that were sold externally amountedto RMB 23.4 billion, representing anincrease of 17.6% over 2005, accounting for2.2% of the Company’s total turnover, otheroperating revenues and other income. Theincrease was mainly due to the increase incrude oil prices and the Company’sexpansion of its natural gas business.
The Company’s refining segment andmarketing and distribution segment sellpetroleum products (mainly consisting ofgasoline, diesel, kerosene including jet fuel(refined oil products) and other refined
petroleum products) to third parties. In2006, the external sales revenue ofpetroleum products by these two segmentswere RMB 687.5 billion, representing anincrease of 26.8% over 2005, accounting for63.9% of the Company’s turnover, otheroperating revenues and other income. Theincrease was mainly due to the Company’sproactive efforts in taking advantage of thehigh price of petroleum products throughincreasing sales volume, optimising salesand marketing structure and expanding themarket of other refined petroleum products.The sales revenues of gasoline, diesel andkerosene were RMB 520.8 billion,representing an increase of 27.1% over2005, and accounting for 75.8% of the totalsales revenues of petroleum products. Thesales revenues of other refined petroleumproducts were RMB 166.7 billion,representing an increase of 25.9% over
2005, accounting for 24.2% of the totalsales revenues of petroleum products.
The Company’s external sales revenues ofchemical products were RMB 209.1 billion,representing an increase of 30.0% over2005, accounting for 19.4% of theCompany’s total turnover, other operatingrevenues and other income. The increasewas mainly due to the Company’s effort tocapture the opportunity presented by thehigh price of chemical products byincreasing its production & sales volume.
(2) Operating expensesIn 2006, the Company’s operating expensesamounted to RMB 992.6 billion,representing an increase of 29.8% over2005. The operating expenses mainlyconsisted of:
CHINA PETROLEUM & CHEMICAL CORPORATIONAnnual Report 200628
MANAGEMENT’S DISCUSSION AND ANALYSIS (CONTINUED)
Ma
na
gem
en
t’s
Dis
cuss
ion
an
d A
na
lysi
s
Purchased crude oil, products and operatingsupplies and expenses were RMB 861.4billion, representing an increase of 32.3%over 2005, the throughput of the Company’scrude oil purchased externally was 114.31million tonnes (excluding the amountsprocessed for third parties), representing anincrease of 5.9% over 2005; the averagecost for crude oil purchased externally wasRMB3,750 /tonne (approximately US$64.09/barrel), representing an increase of19.7% over 2005; the Company’s otherpurchase expenses were RMB 432.7 billion,representing an increase of 37.4% over2005, accounting for 43.6% of the totaloperating expenses. The increase wasmainly due to the increased costs of refinedoil products and chemical feedstockpurchased externally.
Selling, general and administrative expensestotaled RMB 37.8 billion, representing anincrease of 11.4% over 2005. The increasewas largely due to: an increase of RMB 1.25billion in repairing and maintenanceexpenses as a result of the renovation andmaintenance work carried out in 2006 onservice stations; an increase of RMB 610million in operating lease expenses as aresult of the increased land rental expenses;an increase of RMB 650 million in servicefee paid to support functions due to theincreased number of service stations; anincrease of RMB 400 million in mineralresources compensatory fee as a result ofincreased sales revenue of crude oil andnatural gas.
Depreciation, depletion and amortisationwere RMB 34.2 billion, representing anincreased of 8.3% over 2005. This wasmainly due to the additions of fixed assetsinvested by the Company in recent two years.
Exploration expenses were RMB 8 billion,representing an increase of 24.5% over2005, mainly due to the Company’sincreased exploration efforts in the Southernmarine facies blocks and new areas in westChina in 2006.
Personnel expenses were RMB 19.9 billion,representing an increase of 6.5% over 2005.
Employee reduction expenses wereapproximately RMB 240 million.
Taxes other than income tax were RMB 28.6billion, representing an increase of 66.7%over 2005. The increase was largely due tothe special oil income levy amounting toRMB 8.75 billion which has been introducedby the PRC government since 26 March2006. In addition, the consumption taxincreased by RMB 1.69 billion mainly due tothe increased sales volume of gasoline anddiesel and the national policy of expandingtax scope of consumption tax.
Other operating expenses were RMB 2.4billion, representing a decrease of 52.5%over 2005. The decrease was largely due tothe decrease of RMB 450 million in losses ondisposal of fixed assets, decrease of RMB1.03 billion in impairment losses on long-lived assets over 2005, and a debtextinguishment income of RMB 490 millionfrom one of the Company’s subsidiaries.
(3) Operating profitIn 2006, the Company’s operating profit wasRMB 83.8 billion, representing an increaseof 22.8% over 2005.
(4) Net finance costsIn 2006, the Company’s net finance costswere RMB 6.1 billion, representing an
increase of 31.9% over 2005. The increasewas mainly due to an increase of RMB 1.5billion in net interest expenses as a result ofthe increase in the loan balance and theincreased interest rates.
(5) Profit before taxIn 2006, the Company’s profit before taxwas RMB 78.9 billion, representing anincrease of 22.1% over 2005.
(6) TaxationIn 2006, the Company’s taxation was RMB23.5 billion, representing an increase of18.3% over 2005.
(7) Profit attributable to minority interestsIn 2006, the Company’s profit attributable tominority interests was RMB 1.5 billion,representing a decrease of 55.0% over2005. The decrease was mainly due to theCompany’s privatisation of certain of itslisted subsidiaries and thereby reducedminority shareholdings in these subsidiaries.
(8) Profit attributable to equity shareholders ofthe CompanyIn 2006, the Company’s profit attributable toequity shareholders of the Company wasRMB 53.9 billion, representing an increaseof 30.0% over 2005.

CHINA PETROLEUM & CHEMICAL CORPORATION Annual Report 2006 29
Ma
na
gem
en
t’s
Dis
cuss
ion
an
d A
na
lysi
s
2 DISCUSSIONS ON RESULTS OF SEGMENTOPERATIONSThe Company divides its operations into fourbusiness segments (exploration andproduction segment, refining segment,marketing and distribution segment andchemicals segment) and corporate and
others. Unless otherwise specified, the inter-segment transactions have not beeneliminated in the financial data discussed inthis section. In addition, the operatingrevenue data of each segment have includedthe “other operating revenues” and “otherincome” of the segment.
The following table sets forth the operatingrevenue by each segment, the contributionof external sales and inter-segment sales asa percentage of operating revenue beforeelimination of inter-segment sales, and thecontribution of external sales as apercentage of consolidated operatingrevenues (i.e. after elimination of inter-segment sales) for the periods indicated.
As a Percentage As a Percentageof Consolidated of Consolidated
Operating Revenues Operating Revenues,Operating Revenues Before Elimination of After Elimination of
Years Ended 31 December Inter-segment Sales Inter-segment Sales2006 2005 2006 2005 2006 2005
RMB millions (%) (%)Exploration and Production Segment
External sales(1) 37,510 30,762 2.1 2.3 3.5 3.7Inter-segment sales 105,656 84,423 5.8 6.2Operating revenues 143,166 115,185 7.9 8.5
Refining SegmentExternal sales(1) 108,791 97,646 6.0 7.2 10.1 11.7Inter-segment sales 471,571 386,456 26.1 28.3Operating revenues 580,362 484,102 32.1 35.5
Marketing and Distribution SegmentExternal sales(1) 588,957 460,650 32.6 33.8 54.7 55.3Inter-segment sales 4,601 3,172 0.3 0.2Operating revenues 593,558 463,822 32.9 34.0
Chemicals SegmentExternal sales(1) 215,794 166,624 11.9 12.2 20.0 20.0Inter-segment sales 12,299 12,199 0.7 0.9Operating revenues 228,093 178,823 12.6 13.1
Corporate and othersExternal sales(1) 125,350 77,005 6.9 5.6 11.7 9.3Inter-segment sales 136,775 44,897 7.6 3.3Operating revenues 262,125 121,902 14.5 8.9
Operating revenues before eliminationof inter-segment sales 1,807,304 1,363,834 100.0 100.0
Elimination of inter-segment sales (730,902) (531,147)Consolidated operating revenues 1,076,402 832,687 100.0 100.0
Note: (1) include other operating revenues and other income.

CHINA PETROLEUM & CHEMICAL CORPORATIONAnnual Report 200630
MANAGEMENT’S DISCUSSION AND ANALYSIS (CONTINUED)
Ma
na
gem
en
t’s
Dis
cuss
ion
an
d A
na
lysi
s
The following table sets forth the operating revenues, operating expenses and operating profit/loss by each segment before elimination of the inter-segment transactions for the periods indicated, and the rate of changes from 2005 to 2006.
Years Ended 31 December Rate of2006 2005 Change
(RMB millions) (RMB millions) (%)Exploration and Production Segment
Operating revenues 143,166 115,185 24.3Operating expenses 79,984 66,851 19.6Operating profit 63,182 48,334 30.7
Refining SegmentOperating revenues 580,362 484,102 19.9Operating expenses 605,660 487,638 24.2Operating loss (25,298) (3,536) 615.4
Marketing and Distribution SegmentOperating revenues 593,558 463,822 28.0Operating expenses 563,324 453,472 24.2Operating profit 30,234 10,350 192.1
Chemicals SegmentOperating revenues 228,093 178,823 27.6Operating expenses 210,859 164,527 28.2Operating profit 17,234 14,296 20.6
Corporate and othersOperating revenues 262,125 121,902 115.0Operating expenses 263,657 123,100 114.2Operating loss (1,532) (1,198) 27.9
(1) Exploration and production segmentMost of the crude oil and a small portion ofthe natural gas produced by the explorationand production segment were used for theCompany’s refining and chemicalsproduction. Most of the natural gas and asmall portion of crude oil produced weresold to refineries owned by Sinopec GroupCompany and other customers.
In 2006, the operating revenues of thissegment were RMB 143.2 billion,representing an increase of 24.3% over2005, largely due to the increases in thesales price and volume of crude oil andnatural gas compared with those in 2005.
In 2006, this segment sold 37.94 milliontonnes of crude oil and 5.7 billion cubicmeters of natural gas, representing anincrease of 2.9% and 28.4% respectivelycompared with those in 2005. The averagerealised price of crude oil was RMB 3,195per tonne (approximately US$ 56.53 perbarrel), representing an increase of 19.9%over 2005. The average realised price ofnatural gas was RMB 794 per thousandcubic meters, representing an increase of18.0% over 2005.
In 2006, the operating expenses of thissegment were RMB 80 billion, representingan increase of 19.6% over 2005. Theincrease was mainly due to:
� The increase of approximately RMB 9.4billion in the taxes other than income taxwas largely due to the special oil incomelevy imposed by the PRC government andthe mineral resources compensation feesassociated with the increased salesrevenue of crude oil.
� The increase of approximately RMB 1.6billion in exploration expenses includingdry holes cost was mainly due to theincreased exploration efforts by theCompany in marine facies blocks in thesouth of China and newly developed areasin the west China.
� The increase of RMB 1.8 billion indepreciation, depletion and amortisationwas resulted from the continuousinvestment in fixed assets.
In 2006, in light of the high crude oil price,in order to increase its oil and gasproduction, the Company developedmarginal oil reserves, which, together with
increased water and electricity chargesassociated with oil and gas production,contributed to the increase in the lifting costof crude oil and natural gas by 6.6% fromRMB 488/tonne (US$ 8.41 per barrel) in2005 to RMB 520/tonne (US$ 9.21 perbarrel) in 2006.
In 2006, this segment’s operating profit wasRMB 63.2 billion, representing an increaseof 30.7% over 2005.
(2) Refining segmentThe business activities of the refiningsegment consist of purchasing crude oilfrom the exploration and productionsegment and third parties, processing crudeoil into petroleum products, selling gasoline,diesel and kerosene to marketing anddistribution segment, selling a portion ofchemical feedstock to chemicals segmentand selling other refined petroleum productsto domestic and foreign customers.
In 2006, this segment’s operating revenueswere approximately RMB 580.4 billion,representing an increase of 19.9% over2005. The increase was mainly due to theincreased sales price and sales volume ofvarious refined petroleum products.

CHINA PETROLEUM & CHEMICAL CORPORATION Annual Report 2006 31
Ma
na
gem
en
t’s
Dis
cuss
ion
an
d A
na
lysi
s
The following table sets forth the sales volume, average realised price and the respective rate of changes of major refined petroleum products of thesegment in 2005 and 2006.
Sales Volume Average Realised Prices(thousand tonnes) Rate of (RMB per tonne) Rate of
2006 2005 Change 2006 2005 Change(%) (%)
Gasoline 21,861 21,520 1.6 4,492 3,763 19.4Diesel 57,578 54,128 6.4 3,859 3,462 11.5Chemical feedstock 26,545 26,446 0.4 4,523 3,734 21.1Other refined petroleum products 37,015 32,724 13.1 3,521 3,121 12.8
In 2006, the sales revenues of gasoline bythe segment were RMB 98.2 billion,representing an increase of 21.2% over2005, accounting for 16.9% of thissegment’s operating revenue. The salesrevenues of diesel by the segment were RMB222.2 billion, representing an increase of18.6% over 2005, accounting for 38.3% ofthis segment’s operating revenue. The salesrevenue of chemical feedstock by thesegment were RMB 120.1 billion,representing an increase of 21.6% over2005, accounting for 20.7% of thissegment’s operating revenue. The salesrevenues of refined petroleum productsother than gasoline, diesel and chemicalfeedstock were RMB 130.3 billion,representing an increase of 27.6% over2005, accounting for 22.5% of thissegment’s operating revenues.
In 2006, the operating expenses of thesegment were RMB 605.7 billion,representing an increase of 24.2% over2005. The increase was mainly due to theincrease in crude oil price and refinerythroughput. Among which, the average crudeoil cost was RMB 3,674 per tonne(approximately US$ 62.79 per barrel),representing an increase of 19.9% over2005; Refinery throughput was 143.55million tonnes (excluding the volumeprocessed for third parties) in 2006,representing an increase of 5.5% over 2005.The total crude oil costs in 2006 were RMB527.4 billion, representing an increase of26.5% over 2005, accounting for 87.1% ofthe total operating expenses of the segment,up by 1.6 percentage points over 2005.
In 2006, although the international crude oilprice remained at a high level with volatility,the PRC government implemented tight
control over domestic price of refined oilproducts, as a result, the Company’s refiningsegment incurred significant loss, despitethat the Company strive to reduce the crudeoil cost by increasing the processing volumeof lower quality crude oil as well asexpanding the market of other refinedpetroleum products, increasing the salesvolume of refined petroleum products withhigh added value. The refining margin wasonly RMB-20/tonne (approximately US$-0.34/barrel) (sales revenue less costs ofcrude oil, refining feedstock costs and taxesother than income tax, divided bythroughput of crude oil and refiningfeedstock), representing a decrease of RMB99/tonne (approximately US$ 1.66/barrel)as compared with RMB 79/tonne(approximately US$1.32/barrel) in 2005.
In 2006, the refining cash operating cost(defined as operating expenses less thepurchase costs of crude oil and refiningfeedstock, depreciation and amortisation,taxes other than income tax, other businessexpenses and adjustments; and divided bythe throughput of crude oil and refiningfeedstock) was RMB 135/tonne (US$2.31per barrel), representing an increase ofRMB 20/tonne (US$ 0.40 per barrel), or17.4%, over 2005. This change was mainlydue to the increase of equipmentmaintenance expenses caused by increasedprocessing volume of lower quality crude oil,and increased fuel purchased externally tosubstitute the fuel for internal use, and theincrease of part of variable cost for productstructural optimisation.
In 2006, this segment incurred an operatingloss of RMB 25.3 billion, representingan increase in loss of RMB 21.8 billionover 2005.
(3) Marketing and distribution segmentThe business activities of marketing anddistribution segment include purchasingrefined oil products from the refiningsegment and third parities, and wholesale ofrefined oil products to domestic customers,direct sale and retail of the refined oilproducts through the retail networkowned by this segment and provision ofrelated services.
In 2006, the operating revenues of thissegment were RMB 593.6 billion,representing an increase of 28.0% over2005. The increase was mainly due to thecontinuous optimisation of marketingstructure to further increase the percentageof retail sales in the total sales volume ofgasoline and diesel and the increase in salesvolume and prices of gasoline, diesel andkerosene including jet fuel,
In 2006, the operating revenue from sales ofgasoline and diesel were RMB 500.1 billion,accounting for 84.3% of the operatingrevenue of this segment. The percentage ofretail in the total sales volume of gasolineand diesel increased from 59.6% in 2005 to63.4% in 2006, up by 3.8 percentage points.The percentage of sales of gasoline anddiesel by direct sales as a percentage of thetotal sales volume decreased from 19.1% in2005 to 17.0% in 2006, down by 2.1percentage points. The percentage ofwholesale sales as a percentage of the totalsales volume of gasoline and dieseldecreased from 21.3% in 2005 to 19.6% in2006, down by 1.7 percentage points.

CHINA PETROLEUM & CHEMICAL CORPORATIONAnnual Report 200632
MANAGEMENT’S DISCUSSION AND ANALYSIS (CONTINUED)
Ma
na
gem
en
t’s
Dis
cuss
ion
an
d A
na
lysi
s
The following table sets forth the sales volume, average realised prices and the respective rate of changes of the four major product categories in 2005and 2006 in different forms of sales channels for gasoline and diesel.
Sales Volume Average Realised Prices(thousand tonnes) Rate of (RMB per tonne) Rate of
2006 2005 Change 2006 2005 Change(%) (%)
Gasoline 32,718 30,319 7.9 5,224 4,430 17.9Of which: Retail 23,885 21,629 10.4 5,350 4,562 17.3
Direct sales 2,812 2,839 (1.0) 4,922 4,206 17.0Wholesale 6,021 5,851 2.9 4,867 4,050 20.2
Diesel 73,694 67,925 8.5 4,466 3,767 18.6Of which: Retail 43,528 36,896 18.0 4,527 3,885 16.5
Direct sales 15,309 15,909 (3.8) 4,599 3,786 21.5Wholesale 14,856 15,120 (1.7) 4,152 3,458 20.1
Kerosene 5,397 5,955 (9.4) 4,524 3,710 21.9Fuel oil 15,067 13,334 13.0 2,989 2,374 25.9
In 2006, the segment’s operating expenseswere RMB 563.3 billion, representing anincrease of 24.2% over 2005. The increasewas mainly due to the increase in purchaseexpenses, of which, the purchase expensesfor gasoline and diesel were RMB 443.8billion, up by 24.8% over 2005, accountingfor 78.8% of the segment’s operatingexpenses.
In 2006, purchase prices of gasoline anddiesel increased by 19.0% and 13.5%,respectively, to RMB 4,573 per tonne andRMB 3,992 per tonne compared with 2005.The purchase volume of gasoline and dieselincreased, up to 32.72 million tonnes and73.69 million tonnes by 7.9% and 8.5%,respectively, over 2005.
In 2006, the segment’s unit cash sellingexpenses (defined as the operating expensesless the purchase costs, taxes other thanincome tax, depreciation and amortisation,
and divided by the sales volume) was RMB167 per tonne, representing an increase by2.7% over 2005. This increase was primarilydue to the increase of retail volume andmaintenance expenses caused by improvingimage of service stations.
In 2006, the segment’s operating profit wasRMB 30.2 billion, representing an increaseof RMB 19.9 billion over 2005. The increasewas primarily due to the continuousoptimisation of marketing structure tofurther increase the percentage of retail intotal sales volume of gasoline and dieseland the increases in sales volume and pricesof refined oil products.
(4) Chemicals SegmentThe business activities of the chemicalssegment include purchasing chemicalfeedstock from the refining segment andthird parities, and producing, marketing anddistribution of petrochemical products.
In 2006, the segment’s operating revenueswere RMB 228.1 billion, representing anincrease of 27.6% over 2005, which wasprimarily due to the increases in theprice and sales volume of majorchemical products.
In 2006, the sales revenue of the Company’ssix major categories of chemical products(i.e. basic organic chemicals, monomers andpolymers for synthetic fiber, synthetic resin,synthetic fiber, synthetic rubber andchemical fertiliser) totaled approximatelyRMB 215.7 billion, representing anincrease of 35.2% over 2005, accountingfor 94.6% of the total operating revenuesof this segment.
The following table sets forth the salesvolume, average realised price and therespective rate of changes for each of thesesix categories of chemical products of thissegment from 2005 to 2006.
Sales Volume (thousand tonnes) Average Realised Prices (RMB/Tonne)Rate of Rate ofChange Change
2006 2005 (%) 2006 2005 (%)Basic organic chemicals 12,749 9,509 34.1 5,609 4,828 16.2Monomers and polymers for synthetic fiber 3,801 3,003 26.6 8,839 8,872 (0.4)Synthetic resin 7,892 6,366 24.0 9,870 9,007 9.6Synthetic fiber 1,614 1,585 1.8 11,390 11,123 2.4Synthetic rubber 833 703 18.5 13,885 13,000 6.8Chemical fertiliser 1,654 1,824 (9.3) 1,660 1,539 7.9

CHINA PETROLEUM & CHEMICAL CORPORATION Annual Report 2006 33
Ma
na
gem
en
t’s
Dis
cuss
ion
an
d A
na
lysi
s
In 2006, the operating expenses of thesegment were RMB 210.9 billion,representing an increase of 28.2% over2005. The increase was primarily due toincrease in the price of feedstock, as well asthe increased consumption of various rawmaterials and utilities, and the increase inother variable and fixed costs, associatedwith the increased production of thechemical products.
Of which:
� The costs of raw materials increased byRMB 44.9 billion over 2005, as a result ofthe increase in the consumption of rawmaterials and their unit prices.
� Fuel and power costs increased by RMB1.7 billion over 2005, as a result of theincreased production volume of chemicalproducts.
In 2006, the segment’s operating profit wasRMB 17.2 billion, representing an increaseof 20.6% over 2005.
(5) Corporate and othersThe business activities of corporate andothers mainly consist of the import andexport businesses of the subsidiaries,research and development activities of theCompany and administrative activities of itsheadquarters.
In 2006, the operating revenues of corporateand others from import and exportbusinesses were RMB 260.4 billion and theoperating expenses were RMB 259.4 billion.The operating profit from import and exportbusinesses was RMB 1.0 billion.
In 2006, the expenses in research anddevelopment activities of the Company andadministrative activities of its headquarterswere RMB 2.5 billion.
The segment’s operating losses were RMB1.5 billion, representing an increase in lossof RMB 300 million over 2005.
3 ASSETS, LIABILITIES, EQUITY AND CASH FLOWSThe Company’s primary sources of funding were from operating activities, short-term and long-term borrowings, and primary uses of funds were for operating expenses, capital expendituresand repayments for short-term and long-term borrowings.
(1) Assets, liabilities and equity Unit: RMB in millions
At 31 December Amount2006 2005 Changes
Total assets 611,790 549,040 62,750Current assets 145,467 147,057 (1,590)Non-current assets 466,323 401,983 64,340
Total liabilities 327,001 294,060 32,941Current liabilities 210,802 175,011 35,791Non-current liabilities 116,199 119,049 (2,850)
Equity attributable to equityshareholders of the Company 262,845 224,301 38,544Share capital 86,702 86,702 —Reserves 176,143 137,599 38,544
Minority interests 21,944 30,679 (8,735)Total equity 284,789 254,980 29,809
The Company’s total assets were RMB611.8 billion, representing an increase ofRMB 62.8 billion over 2005, of which:
� The current assets was 145.5 billion,decreased by RMB 1.6 billion over2005. The decrease was mainly due tothe centralised management on bankdeposit implemented by the Companysince the beginning of 2006 andreduced cash position, which resultedin a decrease of RMB 6.3 billion incash and cash equivalents and timedeposit at financial institutions; prepaidexpenses and other current assetsdecreased by RMB 1.7 billion, whichwas mainly due to the decrease ofprepayment for construction projectsand equipment purchases; the increaseof RMB 3.9 billion in the Company’s
inventory was the result of theincreased throughput; the increase ofRMB 2.5 billion in bills receivable andaccounts receivable was in line with thesignificant increase in the Company’sturnover.
� The non-current assets was RMB 466.3billion increased by RMB 64.3 billionover 2005. The increase was mainlydue to the net increase of RMB 49.1billion in property, plant and equipmentwhich was in line with the investmentplan and the increase of goodwill byRMB 11.6 billion as a result of theprivatisation of its subsidiaries.
The total liabilities were RMB 327.0billion, representing an increase ofRMB 32.9 billion over 2005, of which:
CHINA PETROLEUM & CHEMICAL CORPORATIONAnnual Report 200634
MANAGEMENT’S DISCUSSION AND ANALYSIS (CONTINUED)
Ma
na
gem
en
t’s
Dis
cuss
ion
an
d A
na
lysi
s
� The current liabilities increased by RMB35.8 billion over 2005 to RMB 210.8billion. The increase was mainly due tothe increase of RMB 15.5 billion inshort-term borrowings caused by theincrease of production and salevolume; the increase of RMB 19.5billion in accrued expenses and other
accounts payable which was mainly dueto the increase in receipts in advancefrom customers, accrued expendituresand amounts payable to Sinopec GroupCompany and its subsidiaries.
� The non-current liabilities decreasedby RMB 2.9 billion over 2005 toRMB 116.2 billion, primarily due to
the decrease of the Company’s long-term borrowings.
The equity attributable to theCompany’s shareholders were RMB262.8 billion, representing an increaseof RMB 38.5 billion over 2005, due tothe increase of reserves.
(2) Cash flowThe following table sets forth the major items on the consolidated cash flow statements in 2005 and 2006
Major items of cash flows Unit: RMB in millions
Years Ended 31 December2006 2005
Net cash flow from operating activities 95,875 78,214Net cash flow from investing activities (103,023) (77,523)Net cash flow from financing activities 1,192 (4,851)Net decrease in cash and cash equivalents (5,956) (4,160)
In 2006, profit before taxation was RMB78.9 billion; after adjusting the non-cashexpenses items, the adjusted cash flow fromoperating activities was RMB 124.6 billion.Major non-cash expense items included:depreciation, depletion and amortisation ofRMB 34.2 billion, interest expenses of RMB7.4 billion, dry holes costs of RMB 4.0billion, losses from disposal of properties,plant and equipment of RMB 1.6 billion.
The changes in operation-related accountsreceivable and payable items reducedcash inflow of RMB 700 million, which wasmainly due to the Company’s expandedproduction and operation resulting inincreased capital employed.
After adjusting the non-cash expense itemsand accounts receivable and payable itemswith regard to the profit before taxation, anddeducting the cash outflow for payment ofincome tax totaling RMB 20.3 billion, andthe net cash outflow of RMB 8.9 billion fornet interests paid as well as the dividendreceived totaling RMB 1.2 billion, the netcash flow from operating activities was RMB95.9 billion.
Net cash outflow for investing activities wasRMB 103.0 billion. The net cash flow forinvesting activities mainly represented cashoutflows of RMB 78.6 billion for capitalexpenditures and exploratory wells
expenses, cash outflows of RMB 3.6 billionfor purchase of investments and interests inassociated companies and subsidiaries, andRMB 22.0 billion for acquisition of minorityinterests in subsidiaries.
Net cash inflow for financing activities wasRMB 1.2 billion, mainly due to increasedbank loans.
During 2006, the Company captured theopportunity of robust market demand tosteadily increase cash flow from operatingactivities. At the same time, the Companyincreased the investment, strived to expandthe resources and the markets, developedvarious financing channels and tightened itscontrol over the scale and risk of debt toguarantee the supply of capital.
(3) Contingent liabilitiesRefer to the descriptions under MajorGuarantees and Performance in SignificantEvents of this annual report.
(4) Capital expenditureRefer to the descriptions under CapitalExpenditure in Business Review andProspects of this annual report.
(5) Research and development expenses andenvironmental expensesResearch and development expenses refer tothe expenses that have been recognised
during the period in which they incurred. In2006, the Company’s research anddevelopment expenses were RMB 2.9 billion.
Environmental expenses refer to the normalroutine effluent processing fees paid by theCompany, excluding any capitalised costs foreffluent processing facilities. In 2006, theCompany’s environmental expenses wereRMB 1.6 billion.
(6) Analysis of financial statements preparedunder the PRC Accounting Rules andRegulationsThe major differences between theCompany’s financial statements preparedunder the PRC Accounting Rules andRegulations and IFRS are set out in SectionC of the financial statements of theCompany from page 161 to page 163 ofthis report.
CHINA PETROLEUM & CHEMICAL CORPORATION Annual Report 2006 35
Ma
na
gem
en
t’s
Dis
cuss
ion
an
d A
na
lysi
s
The following table sets forth each of its segments’ income and profit from principal operations, costs of sales, taxes and surcharges, as preparedunder the PRC Accounting Rules and Regulations.
Years Ended 31 December2006 2005
RMB millions RMB millionsIncome from principal operations
Exploration and Production Segment 128,938 104,285Refining Segment 570,772 469,266Marketing and Distribution Segment 592,871 462,464Chemicals Segment 221,432 172,982Others 261,468 121,265Elimination of inter-segment sales (730,902) (531,147)Consolidated income from principal operations 1,044,579 799,115
Cost of sales, sales taxes and surchargesExploration and Production Segment 53,052 40,118Refining Segment 595,118 477,843Marketing and Distribution Segment 536,381 427,308Chemicals Segment 196,274 149,431Others 258,977 118,152Elimination of inter-segment cost of sales (731,487) (527,451)Consolidated cost of sales, sales taxes and surcharges 908,315 685,401
Profit from principal operationsExploration and Production Segment 76,022 59,732Refining Segment (23,897) (7,838)Marketing and Distribution Segment 56,490 35,156Chemicals Segment 25,158 23,551Others 2,491 3,113Consolidated profit from principal operations 136,264 113,714
Net profit 50,664 39,558
Profit from principal operations: in 2006,the Company’s realised profit from principaloperations was RMB 136.3 billion,representing an increase of RMB 22.6 billionover 2005. The increase was mainly due tothe fact that the Company implemented the
resource strategy, proactively expanded themarket share, optimised refining andpetrochemical production, and made greatefforts on safety management, resourceconservation and expense reduction.
Analysis of changes:
Total assets: By the end of 2006, the totalassets increased by RMB 74.0 billion over2005 to RMB 594.6 billion. The increasewas primarily due to a number of factors,of which, the fixed assets increased by RMB57.4 billion with the Company’simplementation of the investment plan;long-term equity investment increasedby RMB 13.3 billion mainly as a resultof the acquisition of minority interestsin subsidiaries.
in 2006, the distribution of the finaldividend of 2005 and the interim dividendfor 2006 totalling RMB 11.3 billion.
(7) Significant differences between thefinancial statements prepared under IFRSand US GAAPThe major differences between theCompany’s financial statements preparedunder IFRS and US GAAP are set out inSection E of the financial statements of theCompany from page 168 to page 170 ofthis report.
Net profit: in 2006, the net profit realised bythe Company was RMB 50.7 billion,representing an increase of RMB 11.1billion, or 28.1%, over 2005.
Financial data prepared under the PRC Accounting Rules and Regulations: Unit: RMB millions
At 31 December2006 2005 Changes
Total assets 594,550 520,572 73,978Long-term liabilities 109,860 107,774 2,086Shareholders’ funds 254,875 215,623 39,252
Long-term liabilities: By the end of 2006,the Company’s long-term liabilities wereRMB 109.9 billion, representing an increaseof RMB 2.1 billion over 2005, which wasprimarily due to the increase in long-termborrowings for funding the investment plan.
Shareholders’ funds: At the end of 2006,shareholders’ funds of the Company wasRMB 254.9 billion, representing an increaseof RMB 39.3 billion over 2005. The increasewas primarily due to: first, the realised netprofit in 2006 of RMB 50.7 billion; second,


CHINA PETROLEUM & CHEMICAL CORPORATIONAnnual Report 200638
SIGNIFICANT EVENTS
Sig
nif
ica
nt
Eve
nts
1 ELECTION OF MEMBERS OF THE THIRDSESSION OF THE BOARD OF DIRECTORSAND THE THIRD SESSION OF THESUPERVISORY BOARD AND APPOINTMENTOF SENIOR MANAGEMENTThe Second Session of the Board ofDirectors and the Second Session of theSupervisory Board of Sinopec Corp. expiredin the first half of 2006. On May 24, 2006,Sinopec Corp. held the Annual GeneralMeeting of Shareholders for 2005, at whichthe members of the Third Session of theBoard of Directors and the Third Session ofthe Supervisory Board were elected. On May24, 2006, Sinopec Corp. held the firstmeeting of the Third Board of Directors andappointed new senior management. Pleaserefer to DIRECTORS, SUPERVISORS, SENIORMANAGEMENT AND EMPLOYEES in thisannual report for a list of the membersof the Third Session of the Board ofDirectors and the Third Session of theSupervisory Board as well as the newlyappointed senior management.
2 A-SHARE REFORM ON NON-TRADABLESHARESThe A-Share Reform plan of Sinopec Corp.was approved at the shareholder’s meetingfor the A shares market held on September25, 2006. According to such plan, holders oftradable A shares of Sinopec Corp. willobtain 2.8 shares of Sinopec Corp. paid byformer holders of non-tradable shares ofSinopec Corp. for every 10 tradable A sharesof Sinopec Corp. held by them; all formerholders of the non-tradable shares ofSinopec Corp. have made the commitmentsthat they will comply with the statutoryprovisions on selling restriction for the saleof their shares. All former holders of non-tradable shares of Sinopec Corp. havealready paid up a total of 784,000,000consideration shares for the A-Share Reformto all holders of tradable A shares. Suchshares were listed for trading on October 10,2006, which was the first trading day afterimplementation of the reform plan, and theformer non-tradable shares held byshareholders of Sinopec Corp. were grantedto be listed for trading on the same day.
Commitments made by former holders of non-tradable shares in the process of A-ShareReform on non-tradable shares and theperformance of commitments.
Not applicable
Note: Commitments in this sub-section meansthose commitments other than statutorycommitments made during A-Share Reform.
Changes in number of tradable shareswithout selling restrictions held byshareholders holding more than 5% of totalshares in issue by the end of the reportingperiod, who were former holders of non-tradable shares.
Not applicable
3 PERFORMANCE OF THE COMMITMENTS BYSINOPEC GROUP COMPANYBy the end of the reporting period, themajor commitments made by Sinopec GroupCompany included:
i Complying with agreements regardingconnected transactions;
ii Solving the issues concerning the legalityof the land use rights certificates andproperty ownership rights certificateswithin a specified period of time;
iii Implementing the ReorganisationAgreement (as defined in the Prospectusfor the Issuance of H Shares);
iv Granting licenses for intellectualproperty rights;
v Refraining from involvement incompetition within the industry; and
vi Withdrawing from the businesscompetition and conflict of interests withSinopec Corp.
Details of the above commitments are setout in the Prospectus for the Issuance ofA Shares published by Sinopec Corp. inChina Securities Journal, ShanghaiSecurities News and Securities Times onJune 22, 2001.
During this reporting period, Sinopec Corp.was not aware of any breach of the aboveimportant commitments by SinopecGroup Company.
4 PROPOSAL FOR PROFIT DISTRIBUTIONFOR 2006In accordance with the provisions of SinopecCorp.’s Articles of Association, thedistribution of profit for a fiscal year shall beconducted on the basis of distributableprofit determined in accordance with thePRC Accounting Rules and Regulations orIFRS, whichever is lower. Thus, on the basisof the distributable profit of Sinopec Corp.for 2006 audited under IFRS, which wasRMB 78,493 million, after deducting thestatutory surplus reserve RMB 5,066million, the proposed discretionary surplusreserve RMB 20 billion, and deducting thefinal dividend for year 2005 and the interimdividend for 2006 distributed in 2006totaled RMB 11,271 million, the amount ofdistributable profit to shareholders ofSinopec Corp. as at 31 December 2006 wasRMB 42,156 million. On the basis of thetotal number of 86,702,439,000 shares atthe end of 2006, the Board proposed a final
dividend of RMB 0.11 per share (includingtax) in cash for year 2006 (totaled RMB9,537 million), adding the distributedinterim cash dividend of RMB 0.04 pershare (totaled RMB 3,468 million), the totalcash dividend for 2006 shall be RMB 0.15per share (RMB 13,005 million in total).The proposal for profit distribution will besubject to review and approval at theAnnual General Meeting of Shareholdersfor year 2006.
5 ISSUANCE OF CORPORATE BONDS ANDINTEREST PAYMENTOn February 24, 2004, Sinopec Corp.successfully issued 10-year term domesticcorporate bonds which amounted to RMB3.5 billion with a credit rating of AAA and afixed coupon rate of 4.61%. On September28, 2004, the aforementioned corporatebonds were listed on the Shanghai StockExchange. For further details, please refer toSinopec Corp.’s announcement published inChina Securities Journal, ShanghaiSecurities News, and Securities Times inMainland China, and South China MorningPost and Hong Kong Economic Times inHong Kong on February 24, 2004 andSeptember 28, 2004, respectively. Thebalance of the outstanding principal underthe corporate bond issuance was RMB 3.5billion as of December 31, 2006. ByFebruary 26, 2007, Sinopec Corp. had paidthe full amount of coupon interest for thethird interest payment year.
6 ISSUANCE OF SHORT-TERM COMMERCIALPAPEROn September 19, 2005, Sinopec Corp.convened the First Extraordinary GeneralMeeting of Shareholders for 2005, at whicha resolution was passed for issuance ofshort-term commercial paper. For detailsplease refer to Sinopec Corp.’sannouncements published in ChinaSecurities Journal, Shanghai SecuritiesNews, and Securities Times in MainlandChina, and Hong Kong Economic Times andSouth China Morning Post in Hong Kong onSeptember 20, 2005. The first tranche ofthe six-month commercial paper withinterest rate 2.67% was issued on May 16,2006 raising a total of RMB 10 billion andthe second tranche of the six-monthcommercial paper with interest rate 3.20%was issued on November 13, 2006, raising atotal of RMB 10 billion, The short-termcommercial paper was issued to institutionalinvestors in PRC inter-bank bond market(excluding investors prohibited by relevantPRC laws and regulations).

CHINA PETROLEUM & CHEMICAL CORPORATION Annual Report 2006 39
Sig
nif
ica
nt
Eve
nts
7 ISSURANCE OF DOMESTIC CORPORATEBONDSOn the First Extraordinary General Meetingof Shareholders of Sinopec Corp. for 2007,approval was given to the issuance ofdomestic corporate bonds which amountedup to RMB 10 billion to qualified domesticinstitutional investors and/or citizensholding legally effective identificationcertificate of PRC (excluding buyersprohibited by relevant PRC laws andregulations). Proceeds from the issuance ofthe bonds will be used to fund the onemillion tonne per annum (tpa) ethyleneproject and supporting facilities of SinopecTianjin, one million tpa ethylene project ofSinopec Zhenhai, 0.8 million tpa ethyleneexpansion project of Sinopec Guangzhou,and 0.6 million tpa PX and aromaticsproject of Sinopec Jinling.
For further details, please refer to SinopecCorp.’s announcement published in ChinaSecurities Journal, Shanghai SecuritiesNews, and Securities Times in mainlandChina, and South China Morning Post andHong Kong Economic Times in Hong Kongon December 7, 2006.
8 ISSURANCE OF CONVERTIBLE CORPORATEBONDS OVERSEASOn the First Extraordinary General Meetingof Shareholders of Sinopec Corp. for 2007,approval was given to the issuance ofcorporate bonds convertible to listedoverseas shares of Sinopec Corp. whichamounted up to USD 1.5 billion (orapproximately HKD 11.7 billion) and amandate was granted to the Board ofSinopec Corp. to allot, issue and handle newdomestic shares listed in China and newoverseas shares listed abroad (up to twentypercent of domestic shares and overseasshares of Sinopec Corp. respectively). Thefund raised from the issuance of convertiblebonds is proposed to repay the foreigncurrency debt borrowed from domesticbanks as “bridging loan” for the privatisationof the former Sinopec Beijing YanhuaPetrochemical Co., Ltd. and the formerSinopec Zhenhai Refining and ChemicalsCo., Ltd., which were listed on the HongKong Stock Exchange before theprivatisation by Sinopec Corp.
For further details, please refer to SinopecCorp.’s announcement published in ChinaSecurities Journal, Shanghai SecuritiesNews, and Securities Times in mainlandChina, and South China Morning Post andHong Kong Economic Times in Hong Kongon December 7, 2006.
9 MAJOR PROJECTS
(1) Sichuan-to-East China Gas ProjectThe project “Sichuan-to-East China GasProject” consists of two parts, namely, thedevelopment of Puguang Gas field andnatural gas pipeline from Sichuan to EastChina. As appraised by the Mineral ResourceReserve Appraisal Center of the Ministry ofLand and Resources, by the end of 2006,Puguang Gas Field’s proven recoverablereserves were 356 billion cubic meters.Accocrding to the market and resourceconditions, the company plans to transportnatural gas to markets in East Chinasupplying gas to Sichuan, Changqing, Hubei,Jiang Xi, Anhui, Jiangsu, Zhejiang andShanghai along the route to East China.
The total length of the natural gas pipelinefrom Sichuan to East China is 1,702kilometers with designed capacity of 12billion cubic meters per year.
The estimated total investment for theSichuan-to-East China Gas Project is RMB63.2 billion, and the whole project isexpected to be completed in 2010.
(2) Qingdao refinery projectOn July 22, 2004, the National Developmentand Reform Commission (“NDRC”) approvedthe Feasibility Study Report on QingdaoRefinery Project. The refinery project with 10million tpa of refining capacity wascommenced in June 2005, and it is currentlyprogressing smoothly and planned to be putinto production in 2008.
(3) Hainan refinery projectOn October 11, 2006, Sinopec Corp. and theoverseas wholly-owned subsidiary of SinopecGroup Company — Century BrightInternational Investment Co, Ltd. (CenturyBright International) signed a Joint VentureContract, under which, Sinopec Corp. andCentury Bright International agreed toincrease the registered capital of HainanRefinery & Chemicals Co., Ltd. by way ofcapital injection (Sinopec Corp. injectedRMB 2,989.5 million of capital and CenturyBright International injected RMB 996.5million of foreign currency equivalents ascapital). After completion of the capitalinjection, Sinopec Corp. and Century BrightInternational hold 75% and 25% of equityinterests in Hainan Refinery & ChemicalsCo., Ltd., respectively. The Hainan refineryproject with 8 million tpa of capacity wasput into commercial operation at the end of2006. For further detail, please refer toSinopec Corp.’s announcement published in
China Securities Journal, ShanghaiSecurities News, and Securities Times inmainland China, and South China MorningPost and Hong Kong Economic Times inHong Kong on October 12, 2006.
(4) Tianjin one million tpa ethylene projectTianjin ethylene project with investment ofabout RMB 26 billion mainly consists of theone million tpa ethylene project and 12.5million tpa refinery reconstruction &expansion and thermal power supportingfacilities. This project was commenced inJune 2006, and it is currently progressingsmoothly and planned to be completed andput into production at the end of 2009.
(5) Zhenhai one million tpa ethylene projectZhenhai ethylene project with investment ofabout RMB 21.9 billion mainly consists ofthe one million tpa ethylene project anddownstream supporting facilities andauxiliary utilities. This project commenced inNovember 2006, and it is currentlyprogressing smoothly and planned to becompleted and put into production in thefirst half of 2010.
(6) Fujian refinery & ethylene project andrefined oil products marketing projectOn February 25, 2007, Sinopec Corp., FujianProvince, Exxon Mobil and Saudi Aramcoentered into a joint venture contract for theFujian refinery & ethylene project. At thesame time, Sinopec Corp., Exxon Mobil andSaudi Aramco also entered into a jointventure contract for the Fujian refined oilproducts marketing project.
According to the Fujian refinery & ethylenejoint venture plan, the capacity of theexisting oil refinery in Quanzhou of Fujianwill be expanded from 4 million tpa to 12million tpa and in the meantime, newchemical installations will be constructed,including 800 thousand tpa ethylenecracking units, 800 thousand tpapolyethylene units, 400 thousand tpapolypropylene units and 700 thousand tpaPX and aromatics units. In addition, theproject also includes the construction ofcrude oil wharves with handling capacity of300 thousand tonnes and its auxiliaryutilities. The project will be constructed with50%, 25% and 25% of equity investmentsby Fujian Refinery & Chemicals Co., Ltd. (acompany incorporated with 50% and 50%equity investments by Sinopec Corp. andFujian Province), Exxon Mobil and SaudiAramco respectively, and it is planned to becompleted and put into production at thebeginning of 2009. With 55%, 22.5% and

CHINA PETROLEUM & CHEMICAL CORPORATIONAnnual Report 200640
SIGNIFICANT EVENTS (CONTINUED)
Sig
nif
ica
nt
Eve
nts
22.5% investments by Sinopec Corp., ExxonMobil and Saudi Aramco, respectively, theFujian refined oil product marketing jointventure is planned to manage and operateapproximately 750 service stations and anumber of oil depots.
On 15 March and 19 march 2007, theMinistry of Commerce approved the abovejoint venture contracts, and approved theestablishment of Fujian Refining andPetrochemical Company Ltd. and SinopecSenMei (Fujian) Petroleum Company Ltd..
10 THE TRANSFER OF STATE-OWNED SHARESFROM CHINA ORIENT ASSETMANAGEMENT CORPORATION, CHINACINDA ASSET MANAGEMENTCORPORATION AND CHINA DEVELOPMENTBANK TO SINOPEC GROUP COMPANYUNDER AGREEMENTSSinopec Corp.’s former shareholders ChinaOrient Asset Management Corporation,China Cinda Asset Management Corporationand China Development Bank entered intoequity transfer agreements with SinopecGroup Company on April 29, 2006, June 6,2006 and August 17, 2006, respectively,transferring 1,296,410,000 state-ownedshares (approximately 1.5% of total sharesof Sinopec Corp.), 2,848,890,000 state-owned shares (approximately 3.3% of totalshares of Sinopec Corp.) and 632,570,000state-owned shares (approximately 0.7% oftotal shares of Sinopec Corp.) of SinopecCorp. held by them to Sinopec GroupCompany, respectively. Under theagreements Sinopec Group Company shallmake payments in cash for the transfer toChina Orient Asset ManagementCorporation, China Cinda Asset ManagementCorporation and China Development Bankrespectively. The share transfer agreementsbetween the above companies/bank andSinopec Group Company have all beenapproved by the State-Owned AssetSupervision and Administration Commissionunder the State Council and the Ministry ofFinance, and the formalities for transfer ofthe shares under these agreements werecompleted on September 27, 2006.
11 RECEIPT OF ONE-OFF SUBSIDY FROM THECENTRAL GOVERNMENT DURING THEREPORTING PERIODDuring the reporting period, internationalcrude oil prices went up continuously andremained at a high level for a long time,while domestic prices of oil products weretightly controlled and deviated from crudeoil prices. Therefore, the central governmentprovided the Company with a one-offsubsidy of RMB 5 billion, which has beenadded into profit before taxation of theCompany for 2006.
12 SPECIAL OIL INCOME LEVYFrom March 26, 2006, the State started toimpose special oil income levy on a pro ratabasis on excess income from sales ofdomestic crude oil by oil productionenterprises with selling prices over certainlevel. The special oil income levy will becalculated monthly at rates for 5 levels ofaccumulated excess on ad valorem basisand will be paid quarterly; the impositionrates shall be determined according to themonthly weighted mean of crude oil pricesold by oil production enterprises; the priceof crude oil is calculated by USD per barrelwith the threshold price USD 40 per barrel.For further detail, please refer to relevantannouncements published in ChinaSecurities Journal, Shanghai SecuritiesNews, and Securities Times in mainlandChina, and South China Morning Post andHong Kong Economic Times in Hong Kongon April 4, 2006.
13 ACQUISITION OF OIL PRODUCTIONASSETS OF SHENGLI PETROLEUMADMINISTRATION BUREAU FROM SINOPECGROUP COMPANYAt the sixth meeting of the Third Session ofthe Board of Directors convened by SinopecCorp. on December 6, 2006, the Proposal onAcquisition of Oil Production Assets ofShengli Petroleum Administration Bureaufrom Sinopec Group Company was reviewedand approved. Under this proposal, theCompany acquired the oil production assetsowned by Shengli Petroleum AdministrationBureau of Sinopec Group Company fromSinopec Group Company (including 64.73%
equity in Shengli Oil Field DongshengJinggong Petroleum Development Co., Ltd.,100% equity in Petroleum DevelopmentCenter of Shengli Petroleum AdministrationBureau, 52% equity in Shengli Oil FieldZhongsheng Petroleum Development Co.,Ltd, and oil wells and relevant oil productionassets of the former Shengda Group Oil &Gas Company owned by Shengli PetroleumAdministration Bureau of Sinopec GroupCompany located at Shengli Oil Field ofShandong Province, China). Considerationfor the acquired assets was determinedat RMB 3.5 billion through negotiation byboth parties of the deal based on theevaluation result.
14 TENDER OFFER BY SINOPEC CORP. TOFOUR A SHARES SUBSIDIARIESOn February 25, 2006, the 24th meeting ofthe Second Session of the Board ofDirectors of Sinopec Corp. respectivelyapproved Sinopec Corp.’s tender offers toacquire all the tradable shares of SinopecQilu Petrochemical Co., Ltd. (QiluPetrochemical) at a price of RMB 10.18 pershare, all the tradable shares of SinopecYangzi Petrochemical Co., Ltd. (YangziPetrochemical) at a price of RMB 13.95 pershare, all the tradable shares of SinopecZhongyuan Oil & Gas Hi-tech Co., Ltd.(Zhongyuan Oil & Gas) at a price of RMB12.12 per share, all the tradable shares ofSinopec Shengli Oil Field Dynamic (Group)Co., Ltd. (Petroleum Dynamic) at a price ofRMB 10.30 per share and all the non-tradable shares of Petroleum Dynamic heldby investors other than Sinopec Corp. at aprice of RMB 5.60 per share. QiluPetrochemical has terminated listing andtrading from April 24, 2006, and YangziPetrochemical, Zhongyuan Oil & Gas andPetroleum Dynamic have terminated listingand trading from April 21, 2006. For furtherdetails, please refer to relevantannouncements published in ChinaSecurities Journal, Shanghai SecuritiesNews and Securities Times in MainlandChina on February 16 and March 6, 2006(Petroleum Dynamic’s announcement wasonly published in China Securities Journaland Securities Times).

CHINA PETROLEUM & CHEMICAL CORPORATION Annual Report 2006 41
Sig
nif
ica
nt
Eve
nts
At the extraordinary general meeting ofshareholders convened by QiluPetrochemical on February 28, 2007, theproposal on merger by absorption of QiluPetrochemical and Zibo Jisu Chemical Co.,Ltd. was approved; at the extraordinarygeneral meeting of shareholders convenedby Zhongyuan Oil & Gas on the same day,the proposal on merger by absorption ofZhongyuan Oil & Gas and Henan ZhongpuOil & Gas Technology Co., Ltd. wasapproved; at the extraordinary generalmeeting of shareholders convened by YangziPetrochemical on the same day, the proposalon merger by absorption of YangziPetrochemical and Sinopec YangziPetrochemical Co., Ltd. was approved; at theextraordinary general meeting ofshareholders convened by PetroleumDynamic on the same day, the proposal onmerger by absorption of Petroleum Dynamicand Shengli Oil Field HaoshengPetrochemical Co., Ltd. was approved. Forfurther detail, please refer to the relevantannouncements published in ShanghaiSecurities News, China Securities Journaland Securities Times respectively on March1, 2007. The above-mentioned fourcompanies paid considerations for themergers to the holders of remaining shareson March 19, 2007. For details, please referto relevant announcements published inShanghai Securities News, China SecuritiesJournal and Securities Times respectively onMarch 12, 2007.
15 MERGER BY ABSORPTION OF ZHENHAIREFINERY & CHEMICALSOn November 12, 2005, the Agreement ofMerger by Absorption was entered intobetween Sinopec Zhenhai Refinery &Chemicals Co., Ltd. (Zhenhai Refinery &Chemicals) and Ningbo YonglianPetrochemical Co., Ltd. (“Ningbo Yonglian”).For further details, please refer to therelevant announcement published in ChinaSecurities Journal, Shanghai SecuritiesNews and Securities Times in MainlandChina and South China Morning Post andHong Kong Economic Times in Hong Kongon November 14, 2005. The proposedmerger was approved on January 12, 2006at the general meeting of shareholders andthe general meeting of independentshareholders of Zhenhai Refinery &Chemicals and approved by the shareholdersof Ningbo Yonglian, as well as by domesticand overseas securities regulatoryauthorities. Zhenhai Refinery & Chemicalswas delisted on March 24, 2006.
16 REORGANIZATION OF SINOPECSHIJIAZHUANG REFINING & CHEMICAL,SHARE TRANSFER OF WUHANPETROLEUM, AND A-SHARE REFORM OFTAISHAN PETROLEUMOn January 23, 2007, Sinopec Corp. enteredinto the Asset Acquisition Agreement andShare Repurchase Agreement with SinopecCorp.’s controlled subsidiary—ShijiazhuangRefining and Chemical Co., Ltd.(Shijiazhuang & Refining Chemical).According to the Asset AcquisitionAgreement, the assets acquisition andshares repurchase are subject to theapproval by the state-owned assetadministration authority and ChinaSecurities Regulatory Commission (“CSRC”).After completion of the acquisition, SinopecCorp. will succeed existing business ofShijiazhuang Refining & Chemical. Aftercompletion of the share repurchase,Shijiazhuang Refining & Chemical willimmediately deregister shares repurchasedand, as a result, Sinopec Corp. will no longerbe a shareholder of Shijiazhuang Refining& Chemical.
On December 27, 2006, Sinopec Corp.entered into the Share Transfer Agreementwith Shengshida Investment Co., Ltd.proposing to transfer 67,912,000 state-owned corporate shares of Sinopec WuhanPetroleum Group Co., Ltd. (WuhanPetroleum) held by Sinopec Corp.(accounting for 46.248% of the total sharesof Wuhan Petroleum) to ShengshidaInvestment Co., Ltd. This share transfer issubject to the approval by the state-ownedasset administration authority and CSRC.
On March 5, 2007, Sinopec TaishanPetroleum Co., Ltd. (Taishan Petroleum)convened a shareholders’ meeting for A-Share Reform, at which the A-Share Reformplan for Taishan Petroleum was passed. Forfurther details, please refer to relevantannouncements published in the SecuritiesTimes on March 7, 2007.
17 MATERIAL LITIGATION AND ARBITRATIONEVENTSThe Company was not involved in anymaterial litigation or arbitration during thereporting period.

CHINA PETROLEUM & CHEMICAL CORPORATIONAnnual Report 200642
SIGNIFICANT EVENTS (CONTINUED)
Sig
nif
ica
nt
Eve
nts
18 MATERIAL GUARANTEE CONTRACTS AND PERFORMANCE THEREOF
Guarantees provided by the Company (excluding the guarantees provided for controlling subsidiaries)
Date ofOccurrence Whether
(Date of Guaranteed Whether for aExecution of amount Type of completed connected
Obligors the Agreement) (RMB millions) guarantee Term or not party1
Shanghai Secco Petrochemical Co, Ltd. 9 February 2002 2,764 Joint and 9 February 2002 No Yesseveral liability -20 December 2021
Shanghai Secco Petrochemical Co, Ltd. 9 February 2002 4,062 Joint and 9 February 2002 No Yesseveral liability -20 December 2013
BASF-YPC Co., Ltd. 7 March 2003 4,594 Joint and 7 March 2003 No Yesseveral liability -31 December 2008
Yueyang Sinopec Shell Coal 10 December 2003 377 Joint and 10 December 2003 No YesGasification Co. Ltd. several liability -10 December 2017
Fujian Zhangzhao Expressway 21 January 2003 10 Joint and 21 January 2003 No YesService Company Limited several liability -31 October 2007
Shanghai Gaoqiao-SK 22 September 2006 20 Joint and 22 September 2006 No YesSolvent Co., Ltd. several liability -22 September 2011
Shanghai Gaoqiao-SK 24 November 2006 35 Joint and 24 November 2006 No YesSolvent Co., Ltd. several liability -24 November 2011
Balance of Guarantee by YangziPetrochemical for its associates and joint ventures 45 No Yes
Balance of Guarantee by ShanghaiPetrochemical for its associates and joint ventures 28 No Yes
Total amount of guarantees provided during the reporting period2 RMB 100 millionTotal amount of guarantees outstanding at the end of the reporting period2 RMB 11,935 million
Guarantees by the Company to subsidiariesTotal amount of guarantee provided to subsidiaries during the reporting period RMB 170 millionTotal amount of guarantee for subsidiaries outstanding at the end of the reporting period RMB 2,674 million
Total amount of guarantees of the Company (including those provided for controlled subsidiaries)Total amount of guarantees3 RMB 14,609 millionTotal amount of guarantees as a percentage of Sinopec Corp.’s net assets 5.7%
Guarantees provided for shareholders, effective controllers and connected parties NoneAmount of debt guarantees provided directly or indirectly to the companies with liabilities to assets ratio of over 70% RMB 177 millionThe amount of guarantees in excess of 50% of the net assets NoneTotal amount of the above three guarantee items4 RMB 177 million
Note 1: As defined in the stock listing rules of Shanghai Stock Exchange.
Note 2: The amount of guarantees provided during the reporting period and the amount of guarantees outstanding at the end of the reporting period include theguarantees provided by the subsidiaries to external parties. The amount of the guarantees provided by these subsidiaries is derived by multiplying theguarantees provided by the Company’s subsidiaries by the percentage of shares held by Sinopec Corp. in such subsidiaries.
Note 3: Total amount of guarantees is the aggregate of the above “total amount of guarantees outstanding at the end of the reporting period (excluding the guaranteesprovided for subsidiaries)” and “total amount of guarantees for subsidiaries outstanding at the end of the reporting period”.
Note 4: “Total amount of the above three guarantee items” is the aggregate of “guarantees provided for shareholders, effective controllers and connected parties”,“amount of debt guarantees provided directly or indirectly to the companies with liabilities to assets ratio of over 70%” and “the amount of guarantees inexcess of 50% of the net assets”. If the above three conditions are borne in one guarantee item, they will be calculated only once in the total amount.
CHINA PETROLEUM & CHEMICAL CORPORATION Annual Report 2006 43
Sig
nif
ica
nt
Eve
nts
Material Guarantees under PerformanceAt the Fourteenth meeting of the First Sessionof the Board of Directors of Sinopec Corp.,Sinopec Corp. was approved to provideconditional guarantee in both domestic andforeign currencies for the Shanghai Seccoproject loan, and the amount of guarantee wasequivalent to RMB 6.992 billion. For furtherdetails, please refer to Sinopec Corp.’s resultsannouncement for year 2001 published in ChinaSecurities Journal, Shanghai Securities Newsand Securities Times in Mainland China andSouth China Morning Post and Hong KongEconomic Times in Hong Kong on 2 April 2002.
On March 7, 2003, Sinopec Corp. entered intoguarantee agreements with domestic andforeign banks for the completion of the BASF-YPC project, whereby it guaranteed 40% of adomestic and foreign currencies denominatedloan equivalent to around RMB 11.7 billionprovided by these banks to BASF-YPC Co., Ltd.for completion of the project.
At the Twenty-second meeting of the FirstSession of the Board of Directors of SinopecCorp., approval was given to the proposalregarding Sinopec Corp.’s provision of an equitypledge for the BASF-YPC project loan on thecondition that BASF should provide an equitypledge on the same terms.
At the Twenty-second meeting of the FirstSession of the Board of Directors of SinopecCorp., approval was also given to the proposalregarding Sinopec Corp.’s provision ofguarantee for Yueyang Sinopec Shell CoalGasification Co., Ltd., in the amount of RMB377 million.
At the Thirteenth meeting of the SecondSession of the Board of Directors of SinopecCorp., Sinopec Corp.’s, approval was given tothe provision of a credit line guaranteeequivalent to RMB 2.343 billion to ChinaInternational United Petroleum & ChemicalCo., Ltd.
Specific statement and independent opinionspresented by independent directors regardingexternal guarantees provided by Sinopec Corp.accumulated up to and during 2006
We, as independent directors of Sinopec Corp.,hereby make the following statement afterconducting a thorough checking of externalguarantees provided by Sinopec Corp.accumulated up to and during 2006 inaccordance with requirements of the ShanghaiStock Exchange:
The accumulated balance of externalguarantees provided by Sinopec Corp. for 2006was about RMB 14.609 billion, accounting forapproximately 5.7% of the Company’s netassets, representing a year-on-year decrease of1%. Guarantees provided by Sinopec Corp.
(including those provided by the Company’scontrolling subsidiaries) for 2006 wereequivalent to RMB 270 million which consistedmainly of the guarantee equivalent to RMB 170million provided by Sinopec Corp. to SinopecQingdao Refinery & Chemicals Co., Ltd., ofwhich Sinopec Corp. holds 85% shares, and theguarantee equivalent to RMB 55 millionprovided by Sinopec Corp. to Shanghai Gaoqiao-SK Solvent Co., Ltd., of which Sinopec Corp.holds 50% shares. External guarantees providedbefore 2006 have been disclosed in detail in theannual report for 2005.
We hereby present the following opinions:
Sinopec Corp. has performed examination &approval procedures for external guaranteesaccumulated up to and during 2006 inaccordance with relevant provisions of laws,regulations and the Articles of Association,disclosing relevant information truly andcompletely. Sinopec Corp. will continue toperform approval and disclosure procedures fornew external guarantees occurred thereafter instrict accordance with relevant provisions forguarantees.
19 GENERAL MEETING OF SHAREHOLDERSDuring the reporting period, Sinopec Corp.held two shareholders’ general meetings instrict compliance with the procedures ofnotification and convening of shareholders’meetings as stipulated in relevant laws, rulesand regulations and the Articles ofAssociation of Sinopec Corp. For furtherdetails, please refer to the section“Summary of Shareholders’ Meetings” ofthis report.
20 TRUSTEESHIP, SUB-CONTRACT ANDLEASEDuring this reporting period, Sinopec Corp.did not have any omission in disclosure ofsignificant trusteeship, contracting or leaseof any other company’s assets, nor placedits assets to or under any other company’strusteeship, contracting or lease that issubject to disclosure.
21 OTHER MATERIAL CONTRACTSDuring this reporting period, Sinopec Corp.did not have any omission in disclosure ofany other material contracts that are subjectto disclosure.
22 ENTRUSTED MONEY MANAGEMENTDuring this reporting period, Sinopec Corp.did not entrust or continue to entrust anyoutside party to carry out cash assetsmanagement on its behalf.
23 ASSET SECUREDDetails regarding the Company’s securedassets as at 31 December 2006 aredisclosed in Note 30 to the financialstatements prepared under IFRS in thisAnnual Report.


CHINA PETROLEUM & CHEMICAL CORPORATIONAnnual Report 200646
SIGNIFICANT EVENTS (CONTINUED)
Sig
nif
ica
nt
Eve
nts
24 INTERESTS OF DIRECTORS, SUPERVISORSAND OTHER MEMBERS OF THE SENIORMANAGEMENT IN THE SHARE CAPITALAs of December 31, 2006, none of SinopecCorp.’s directors, supervisors and othermembers of the senior management heldany share of Sinopec Corp.
During this reporting period, none of thedirectors, supervisors or other members ofthe senior management or any of theirrespective associates had any interests andshort positions (including those that aredeemed to be such, or regarded as owned inaccordance with relevant provisions of theSecurities and Futures Ordinance) in anyshares or debentures or related shares ofSinopec Corp. or its associated corporations(as defined in Part XV of the Securities andFutures Ordinance) which are required tonotify Sinopec Corp. and the Hong KongStock Exchange pursuant to Division 7 and 8of Part XV of the Securities and FuturesOrdinance or which are required pursuant tosection 352 of the Securities and FuturesOrdinance to be entered in the registerreferred to therein, or which are required tonotify Sinopec Corp. and the Hong KongStock Exchange pursuant to the Model Codefor Securities Transactions Entered by
Directors of Listed Companies as specifiedin the Listing Rules of the Hong Kong StockExchange (including those interests andshort positions that are deemed to be such,or are regarded to be owned in accordancewith the relative provisions under theSecurities and Futures Ordinance).
25 REPURCHASE, SALES AND REDEMPTIONOF SHARESDuring the reporting period, neither SinopecCorp. nor any of its subsidiariesrepurchased, sold or redeemed anysecurities of Sinopec Corp.
26 OTHER SIGNIFICANT EVENTSDuring the reporting period, neither SinopecCorp. nor the Board of Directors of SinopecCorp. and the directors thereof were subjectto any investigation by the CSRC, nor wasthere any administrative penalty or circularof criticism released by the CSRC, theSecurities and Futures Commission of HongKong and the Securities and ExchangeCommittee of the United States, nor anyreprimand published by the Shanghai StockExchange, the Hong Kong Stock Exchange,the New York Stock Exchange or the LondonStock Exchange.

CHINA PETROLEUM & CHEMICAL CORPORATION Annual Report 2006 47
CONNECTED TRANSACTIONS
Co
nn
ect
ed
Tra
nsa
ctio
ns
1 AGREEMENTS CONCERNING CONNECTEDTRANSACTIONS BETWEEN THE COMPANYAND SINOPEC GROUP COMPANYIn order to ensure the smooth continuationof normal production and of businesstransacted between the Company andSinopec Group Company, the parties enteredinto a number of agreements on connectedtransactions. Particulars of the connectedtransactions are set out below:
(1) Agreement for the mutual supply ofancillary services for products,production and construction services(“Mutual Supply Agreement”).
(2) Sinopec Group Company providestrademarks, patents and computer softwareto the Company for use free of charge.
(3) Sinopec Group Company providescultural and educational, hygienic andcommunity services to the Company.
(4) Sinopec Group Company providesleasing of land and certain propertiesto the Company.
(5) Sinopec Group Company providesconsolidated insurance to the Company.
(6) Sinopec Group Company providesshareholders’ loan to the Company.
(7) The Company provides service stationsfranchisee licenses to Sinopec GroupCompany.
2 WAIVER OF CONNECTED TRANSACTIONSBETWEEN THE COMPANY AND SINOPECGROUP COMPANY GRANTED BY THEHONG KONG STOCK EXCHANGEPursuant to the Listing Rules of the HongKong Stock Exchange, the above connectedtransactions are subject to full disclosure,reporting and, depending on their natureand the value of the transaction, with priorapprovals from independent directors andthe Hong Kong Stock Exchange. At the timeof its listing, Sinopec Corp. applied forwaivers from the Hong Kong Stock Exchangeof the requirement to fully comply with thedisclosure requirements of the Listing Rulesin respect of the transactions mentionedabove. The Hong Kong Stock Exchange
conditionally exempted Sinopec Corp.from complying with the obligations ofcontinuous disclosure.
At the end of 2006, the above waiverconditionally granted by the Hong KongStock Exchange for disclosure requirementsof the ongoing connected transactions,which had a term of three years (from 2004to 2006), expired. Sinopec Corp. andSinopec Group Company entered into aSupplementary Agreement of ConnectedTransaction on March 31, 2006, which isapplicable to the continuing connectedtransactions conducted by the Companyfrom January 1, 2007. The proposal of athree-year continuing connected transactionfrom 2007 to 2009 was approved at theAnnual General Meeting of Shareholders for2005 held on May 24, 2006. For details ofthe continuing connected transactions,please refer to relevant announcementspublished in China Securities Journal,Shanghai Securities News and SecuritiesTimes in mainland China and Hong KongEconomic Times and South China MorningPost in Hong Kong on 3rd April 2006.
3 THE PROVISIONS ON WAIVER OFDISCLOSURE AND APPROVAL OFCONNECTED TRANSACTIONS BETWEENTHE COMPANY AND SINOPEC GROUPCOMPANY UNDER THE LISTING RULES OFTHE SHANGHAI STOCK EXCHANGEIn the prospectus for the issue of A sharesof Sinopec Corp., the above connectedtransactions together with the agreementsand arrangements between the Companyand Sinopec Group Company were fullydisclosed. Sinopec Corp. and Sinopec GroupCompany entered into SupplementaryAgreement of Connected Transaction onMarch 31, 2006, whereby the terms ofvarious connected transaction weresupplemented. For details, please refer torelevant announcements published in ChinaSecurities Journal, Shanghai SecuritiesNews and Securities Times in mainlandChina and Hong Kong Economic Times andSouth China Morning Post in Hong Kong onApril 3, 2006. The accumulated amounts ofthe connected transactions for the year2006 of Sinopec Corp. are in compliancewith the relevent requirements of the ListingRules of the Shanghai Stock Exchange.
4 CONNECTED TRANSACTIONS ENTEREDINTO BY THE COMPANY DURING THE YEARAudited by the auditors of Sinopec Corp.,the aggregate amount of connectedtransactions actually occurred in relation tothe Company during the year was RMB228.837 billion, of which, incoming tradeamounted to RMB 99.504 billion, andoutgoing trade amounted to RMB 129.333billion (including, RMB129.221 billion ofsales of products and services, RMB 52million of interest earned, RMB 60 millionof income from agency fee). All of thesetransactions satisfied the conditions ofwaiver granted by the Hong Kong StockExchange. In 2006, the products andservices provided by Sinopec GroupCompany (procurement, storage,transportation, exploration and productionservices, production-related services) to theCompany were RMB 87.835 billion,representing 8.85% of the Company’soperating expenses for year 2006, adecrease of 0.69 percentage pointscompared with those in 2005, which werewithin the cap of 18% for waiver. Theauxiliary and community services providedby Sinopec Group Company to the Companywere RMB 1.710 billion, representing 0.17%of the operating expenses, with a slightdecrease compared with 0.23% in thepreceding year, which were within the cap of2% for waiver. In 2006, the product salesfrom the Company to Sinopec GroupCompany amounted to RMB 76.758 billion,representing 7.16 % of the Company’soperating revenue, which were within the capof 14% for waiver. With regard to theLeasing Agreement for Land Use Rights, theamount of rent paid by the Company as ofDecember 31, 2006 was approximately RMB3.241 billion. With regard to the premiumpayable under SPI Fund Document, theamount of fund paid by the Company in2006 shall not be less than the amountspecified in the SPI Fund Document.
Please refer to Note 36 to the financialstatements prepared under the IFRS in thisannual report for details of the connectedtansactions actually occured during the year.
The above mentioned connectedtransactions in 2006 have been approved atthe ninth meeting of the Third Session ofthe Board of Directors of Sinopec Corp..
CHINA PETROLEUM & CHEMICAL CORPORATIONAnnual Report 200648
CONNECTED TRANSACTIONS (CONTINUED)
Co
nn
ect
ed
Tra
nsa
ctio
ns
The auditors of Sinopec Corp. haveconfirmed to the Board of Directors inwriting that:
(1) The transactions have been approved bythe Board of Directors;
(2) The transactions have been entered intofor considerations consistent with thepricing policies as stated in the relevantagreements;
(3) The transactions have been entered intoin accordance with the terms of therespective agreements and documentsgoverning the respective transactions; and
(4) The relevant actual amounts have notexceeded the relevant caps.
After reviewing the above transactions, theindependent directors of Sinopec Corp. haveconfirmed that:
(1) The transactions have been entered intoby Sinopec Corp. in its ordinary courseof business;
(2) The transactions have been entered intobased on one of the following terms:
(a) on normal commercial terms;
(b) on terms not less favorable thanthose available from/to independentthird parties; or
(c) on terms that are fair and reasonableto the shareholders of Sinopec Corp.,
where there is no availablecomparison to determine whetheritem (a) or (b) is satisfied; and
(3) The total value of each category oftransactions does not exceed itsrespective cap.
5 ACQUISITION OF OIL PRODUCTIONASSETS OF SHENGLI PETROLEUMADMINISTRATION BUREAU FROM SINOPECGROUP COMPANYFor details, refer to Section SIGNIFICANTEVENTS in this annual report.
6 THE PRINCIPAL OPERATIONS CATEGORISED BY BUSINESS SEGMENTS AND THE STATUS OF THE CONNECTED TRANSACTIONSThe following data are extracted from the financial statements prepared under the PRC Accounting Rules and Regulations.
Increase/decrease
of income Increase/ Increase/from principal decrease of decrease
operations cost of principal of gross profitcompared operation margin
Income from Cost of Gross with the compared with compared withprincipal principal profit preceding the preceding the preceding
operations operations margin year year yearCategorised by business segments (RMB millions) (RMB millions) (%) (%) (%) (%)Exploration and production 128,938 42,268 58.96 23.64 9.89 1.68Refining 570,772 579,183 (4.19) 21.63 24.91 (2.52)Chemicals 221,432 195,668 11.36 28.01 31.58 (2.25)Marketing and distribution 592,871 535,463 9.53 28.20 25.48 1.93Corporate and others 261,468 258,934 0.95 115.62 119.22 (1.62)Elimination of inter-segment sales (730,902) (731,487) N/A N/A N/A N/ATotal 1,044,579 880,029 13.04 30.72 31.69 (1.19)Of which: connected transactions 112,621 103,772 6.97 40.61 39.05 1.07Connected transactions please refer to Item 4 “Connected Transactions”Principle of pricing for (1) Government-prescribed prices and government-guided prices are adopted for products or projects if such prices are available;
connected transactions (2) Where there is no government-prescribed price or government-guided price for products or projects, the market price (inclusive ofbidding price) will apply; (3) Where none of the above is applicable, the price will be decided based on the cost incurred plus areasonable profit of not more than 6% of the price.
7 FUNDS PROVIDED BETWEEN CONNECTED PARTIESUnit: RMB millions
Funds provided to Funds provided to the Companyconnected party by connected party
Connected Parties Occurrence Balance Occurrence BalanceSinopec Group Company (928) 1,560 5,154 10,572Other Connected Parties (211) 306 321 321Total (1,139) 1,866 5,475 10,893
Use of fund and repayment plan as of the end of the reporting period
Not applicable
CHINA PETROLEUM & CHEMICAL CORPORATION Annual Report 2006 49
CORPORATE GOVERNANCE
Co
rpo
rate
Go
vern
an
ce
1 IMPROVEMENT ON CORPORATEGOVERNANCE DURING THE REPORTINGPERIODDuring the reporting period, Sinopec Corp.continued to standardise its operation andimprove its corporate governance in accordancewith the requirements of domestic and foreignregulations. The members of the Third Sessionof the Board of Directors and the Third Sessionof the Supervisory Board were elected, andmembers of senior management wereappointed. The directors, supervisors andsenior management of Sinopec Corp. havesystematically studied domestic and overseassecurities rules. The documents for corporategovernance such as Rules of the Strategy andDevelopment Committee and Rules of theRemuneration and Performance EvaluationCommittee were revised and improved. Theinternal control system was fully implemented.The A-Share Reform of the Company wasaccomplished. Great improvements oninformation disclosure and investor relationswere achieved. In 2006, Sinopec Corp.continued to be well regarded in the capitalmarket and was awarded “Best InvestorRelations for State-owned Enterprises” and“Best Corporate Governance” by IR magazine.
2 THE ESTABLISHMENT ANDIMPLEMENTATION OF THE INTERNALCONTROL SYSTEMThe Sarbanes-Oxley Act was promulgated inJuly 2002 by the US Congress, placing ruleson the internal control and disclosure of USlisted companies. The PRC, Ministry ofFinance, China Securities RegulatoryCommission, Shanghai Stock Exchange andHong Kong Stock Exchange also haveestablished rules and regulations toreinforce the internal control of listedcompanies. Sinopec Corp., which is listed ondomestic and overseas stock exchanges, setup an internal control steering committee in2003 led by the chairman, CEO and chieffinancial officer to further improve itsinternal control system. The headquarters ofSinopec Corp. established a special internalcontrol office to organise and coordinate theworks relating to the implementation andimprovement of the internal control system.Each of the branches or subsidiaries ofSinopec Corp. also set up relevant internalcontrol office to carry out the dailymanagement over its internal control.
Sinopec Corp. formulated an Internal ControlHandbook according to the relevant laws andregulations, the actual circumstances of theoperation and management of the Companyas well as the Internal Control-IntegratedFramework issued by the Committee ofSponsoring Organisations of the TreadwayCommission. The internal control systemimplements control over the work flow based
on the characteristics of the business line,and regulates on the important processes,procedures, and control points. The InternalControl Handbook currently covers 15 majorcategories, including investment,procurement, sales and consolidatedstatements, and 53 business work flows. Thebranches and subsidiaries of Sinopec Corp.also formulated their corresponding“Detailed Implementing Rules”.
After improvement, trainings, testing andtrial run for more than one year, the InternalControl Handbook was approved at the 12thmeeting of the Second Session of the Boardof Directors on October 31, 2004, and wasput into effect since January 1 2005 and willbe updated every year. The Company strictlyimplemented the Internal Control Handbookand created measures and standards forevaluation of its internal control. SinopecCorp.’s branches and subsidiaries carriedout self-evaluation every half year and work-flow examination every quarter. In 2006, themanagement of Sinopec Corp. carried outself-evaluation on the implementation ofinternal control by the headquarter and 87branches and subsidiaries and ratified theproblems discovered in the relevantbranches or subsidiaries in a timely manner.The Internal Control Handbook (2007Edition) was approved at the seventhmeeting of the Third Session of the Boardof Directors on December 27, 2006.
According to the domestic and overseasregulatory requirements, the management ofSinopec Corp. performed self-evaluation onthe effectiveness of its internal control systemduring this reporting period, and concludedthat the internal control of Sinopec Corp. waseffective during this reporting period.
In 2007, Sinopec Corp. will continue toimplement the Internal Control Handbook(2007 Edition) approved by the Board ofDirectors and further improve its internalcontrol system according to the actualsituation and the regulatory requirements.
3 INDEPENDENT DIRECTORS’PERFORMANCE OF THEIR DUTIES ANDCONFIRMATION OF INDEPENDENCEDuring the reporting period, the independentdirectors were very committed to carryingout the system of independent directors andfulfilling their duties and fiduciaryobligations as specified in the relevant laws,regulations and the Articles of Associationof Sinopec Corp.. They reviewed thedocuments submitted by Sinopec Corp.,attended meetings of both the Board ofDirectors and the professional committees,(Please refer to the Section “Report of theBoard of Directors” in this annual report for
detailed information on attendance of themeetings.) gave independent opinions onconnected transactions, guarantees andappointment and dismissal of seniormanagement officers and put forth manyconstructive comments and suggestionsrelating to the Sinopec Corp.’s corporategovernance, reform and development,production and operation etc. They fullydischarged their duties of independentdirectors objectively and independentlyprotecting the interests of individualshareholders, in particular, the interests ofthe minority shareholders.
As required by the Hong Kong StockExchange, Sinopec Corp. makes the followingconfirmations concerning its independentdirectors: Sinopec Corp. has received annualconfirmations from all the independent non-executive directors acknowledging fullcompliance with the relevant requirements inrespect of their independence pursuant toRule 3.13 of the Listing Rules. Sinopec Corp.considers all independent non-executivedirectors independent.
4 SEPARATION BETWEEN SINOPEC CORP.AND ITS CONTROLLING SHAREHOLDERSinopec Corp. is independent from itscontrolling shareholder, Sinopec GroupCompany, in respect of business, personnel,asset, organisational structure and financeand has its own independent andcomprehensive business operations andmanagement capability.
5 SENIOR MANAGEMENT EVALUATION ANDINCENTIVE SCHEMESSinopec Corp. has established and iscontinuously improving the fairness andtransparency of its performance evaluation andincentive schemes for the directors, supervisorsand other senior management officers. SinopecCorp. implements various incentive schemeslike “Measures for Implementation of SeniorManagement Remuneration Packages”.
Remuneration for Sinopec Corp. directors,supervisors and other senior managementofficers consists of base salary andperformance bonus, including contributionsby Sinopec Corp. to pension plans for itsdirectors, supervisors and other seniormanagement officers.
6 COMPARISON OF NEW YORK STOCKEXCHANGE CORPORATE GOVERNANCERULES AND CHINA CORPORATEGOVERNANCE RULES FOR LISTEDCOMPANIESFor details, please refer to the website ofSinopec Corp. athttp://english.sinopec.com/en-ir/en-governance/index.shtml

CHINA PETROLEUM & CHEMICAL CORPORATIONAnnual Report 200650
CORPORATE GOVERNANCE (CONTINUED)
Co
rpo
rate
Go
vern
an
ce
7 CORPORATE GOVERNANCE REPORT (IN ACCORDANCE WITH THE LISTING RULES OF THE HONG KONG STOCK EXCHANGE)
(1) Compliance with Code on Corporate Governance PracticesSince its listing, in accordance with the relevant requirements of the domestic and foreign regulatory bodies, Sinopec Corp. has set upcompliant corporate governance structures and has continually improved its Articles of Association, Rules and Procedures for the GeneralMeeting of Shareholders, Rules and Procedures for the Meeting of Board of Directors, Rules and Procedures for the Meeting of SupervisoryBoard and other related rules. The operations of the general meeting of shareholders, the Board of Directors (including the three professionalcommittees: Strategies and Development Committee, Audit Committee, and Remuneration and Performance Evaluation Committee), theSupervisory Board and the senior management officers were in compliant with the relevant requiments and well co-ordinated. At the same time,the Company has continually improved its internal control system and actively enhanced information disclosure and investor relations. The levelof corporate governance has continually improved.
Sinopec Corp. has fully complied with the Code on Corporate Governance Practices set out in Appendix 14 of the Listing Rules of the Hong KongStock Exchange during the year ended 31st December 2006. Sinopec Corp.’s compliance with the Code on Corporate Governance Practices isprincipally as follows:
A Board of Directors
A.1Board of Directors
Principle: The Company should be headed by an effective board which should assume responsibility for leadership and control of theCompany.
WhetherCode Provisions Complied with Compliance by Sinopec Corp.Board meetings shall be held √ The Board convenes at least a meeting every quarter. In 2006,at least four times a year Sinopec Corp. convened 10 Board meetings. For the information
about attendance, please refer to the Report of the Board ofDirectors of this Annual Report.
All directors are given an opportunity to √ Pursuant to the Rules and Procedures for the Meeting of Board ofinclude matters in the agenda for regular Directors, each Board member may submit proposals for inclusion inBoard meetings the agenda for Board meetings (including regular Board meetings).Notice of at least 14 days shall be given √ For any regular meeting of the Board, a notice will be given 14 daysof any regular meeting in advance, while for other types of Board meetings, a notice will
normally be given 10 days in advance in line with the Rules andProcedures for the Meeting of Board of Directors.
All directors should have access to the advice √ Pursuant to Sinopec Corp.’s Articles of Association, the Boardand services of the Board Secretary Secretary shall assist the directors in addressing the routine tasks of
the Board, keep the directors informed and alerted about anyregulation, policy and other requirements of domestic and foreignregulators and ensure that the directors observe domestic and foreignlaws and regulations as well as the Articles of Association and otherrelated regulations when performing their duties and responsibilities.

CHINA PETROLEUM & CHEMICAL CORPORATION Annual Report 2006 51
Co
rpo
rate
Go
vern
an
ce
A.2Chairman and the Chief Executive OfficerPrinciple: Distinction of the Board of Directors from the Management
WhetherCode Provisions Complied with Compliance by Sinopec Corp.The respective roles of the Chairman and √ Mr. Chen Tonghai serves as Chairman of the Board, while Mr. Wangthe Chief Executive Officer shall be separate, Tianpu serves as the President. The Chairman is elected by aand shall be clearly established and set out simple majority vote, while the President will be nominated by thein writing Chairman and appointed by the Board. The duties and
responsibilities of the Chairman and the President are separate andthe scope of their respective duties and responsibilities are set forthin the Articles of Association.
The Chairman shall ensure that all directors √ Each of the directors will normally receive meeting information andare properly briefed on issues arising related documents 10 days before the Board meeting, as well as specialat board meetings briefing if necessary. In addition, the Board Secretary will prepare
meeting materials such as related explanations for each proposal, soas to ensure that each of the directors clearly understands thecontent of each proposal.
The Chairman shall be responsible for √ Under the Articles of Association, the President shall provideensuring that directors receive adequate necessary information and materials to each of the directors, andinformation in a timely manner each of the directors may request the President, or request, via the
President, relevant departments to provide information andexplanations necessary for a prompt, informed and prudent decision.
A.3Board CompositionPrinciple: the Board shall have a combination of appropriate skills and experience.
WhetherCode Provisions Complied with Compliance by Sinopec Corp.Board Composition √ The Board is made up of 11 members, each with extensive
professional and governance experiences (Please refer to the Section“Directors, Supervisors, Senior Management and Employees” in thisreport for detailed information.) Of the 11 members, 3 areindependent non-executive directors. Over 1/2 of the Board are non-executive directors and independent non-executive directors. SinopecCorp. has received from each independent non-executive director aletter of confirmation for 2006 regarding its qualification underrelevant independence requirements set out in rule 3.13 of theListing Rules of the Hong Kong Stock Exchange. Sinopec Corp.considers that each of the independent non-executive directorsis independent.
A.4Appointment; Re-election and RemovalPrinciple: there should be a formal, prudent and transparent procedures for appointment of directors
WhetherCode Provisions Complied with Compliance by Sinopec Corp.Non-executive directors should be appointed √ Pursuant to the Articles of Association, terms of each session of thefor a specific term Board (including non-executive directors) shall be 3 years.Each of the directors shall be subject to election √ Pursuant to the Articles of Association, all directors shall be electedand to retirement by rotation at least once every by the general meeting of shareholders, each for a term of 3 years.three years The Board is not authorised to fill casual vacancies.

CHINA PETROLEUM & CHEMICAL CORPORATIONAnnual Report 200652
CORPORATE GOVERNANCE (CONTINUED)
Co
rpo
rate
Go
vern
an
ce
A.5Responsibility of DirectorsPrinciple: Each director is required to keep abreast of his responsibilities as a director
WhetherCode Provisions Complied with Compliance by Sinopec Corp.Each newly appointed director shall be inducted √ For each new appointment, Sinopec Corp. will arrange foron the first occasion of his appointment professional consultants, including PRC and Hong Kong lawyers, to
induct the newly appointed director.Non-executive directors shall have certain √ Non-executive directors have certain authorities, including decisionauthorities making for the Board in case of abstention of executive directors to
avoid conflict of interest, and to serve on Board committees.Every director shall ensure that he can give √ Sinopec Corp. considers that each of the directors can devote enoughsufficient time and attention to the affairs time and efforts to the affairs of the Company.of the Company and should not acceptthe appointment if he cannot do soEvery director must comply with its obligations √ Upon inquiry, each of the directors confirmed that he has compliedunder the Model Code set out in Appendix 10; with the Model Code during the reporting period. Sinopec Corp.the Board of Directors shall develop written formulated “Rules for Employee Dealing in Securities” in 2005guidelines for the dealings by employees in accordance with the Code on Corporate Governance Practices.in the issuer’s securities
A.6Supply and Access to InformationPrinciple: Directors should be provided in a timely manner with appropriate information.
WhetherCode Provisions Complied with Compliance by Sinopec Corp.The agenda and accompanying board documents √ According to the Rules and Procedures for the Meeting of Board ofshall be sent at least 3 days before the intended Directors, the meeting agenda and related documents should normally bedate of the meeting sent out 10 days in advance. Each director is entitled to request other
related information.The management has an obligation to supply √ The Board Secretary is responsible for organising and preparingthe board directors with adequate information materials for Board meetings, including preparation of explanationsrelevant to the meeting for each proposed agenda to enable clear understanding by each
director. Pursuant to the “Rules and Procedures for the meeting ofthe Board of Directors”, the President of the Company shall providethe directors with necessary information and data. The director mayrequest the President, or request the President to instruct therelevant departments of the Company to provide them necessary dataand explanation so as to enable them to make scientific, prompt andcautious decisions.
All directors are entitled to have access to board √ All directors may inspect Board minutes and related data at any time.minutes and related materials
B Remuneration and related DisclosurePrinciple: The director remuneration system should be transparent.
WhetherCode Provisions Complied with Compliance by Sinopec Corp.A remuneration committee shall be set up √ A Remuneration and Performance Evaluation Committee has been setwith written scope of authorities up, its members including director Shi Wanpeng (Chairman), director
Liu Zhongli, director Li Deshui and director Dai Houliang, its mainauthorities include proposing to the Board remuneration plans fordirectors and senior management officers. Its written scope ofauthorities is available for inspection from the Board Secretary.
The Remuneration Committee shall consult √ The Remuneration and Performance Evaluation Committee has alwaysthe Chairman and/or President about proposed consulted the Chairman and the President regarding proposedremuneration for other executive directors, compensations to other executive directors.and shall have access to professional adviceif necessaryThe Remuneration Committee shall be provided √ Committee members may obtain independent professional advice.with sufficient resources to discharge its duties Costs arising from or in connection with such consultation are borneand responsibilities by the Company. The senior management officers and relevant
departments of the Company shall adopt positive and cooperativeattitude and actively cooperate with the work of the Remunerationand Performance Evaluation Committee by providing it with therelevant information.

CHINA PETROLEUM & CHEMICAL CORPORATION Annual Report 2006 53
Co
rpo
rate
Go
vern
an
ce
C Accountability and Audit
C.1Financial ReportingPrinciple: The Board should present a balanced, clear and comprehensive assessment of the Company’s performance, status and prospects.
WhetherCode Provisions Complied with Compliance by Sinopec Corp.Management should provide such explanation √ Sinopec Corp. has adopted an internal mechanism to ensure that theand information to the board as will enable management and related Sinopec Corp. departments have providedthe board to make informed assessment sufficient financial data to the Board and its Audit Committee.of the financial and other information putbefore the board for approvalThe directors should acknowledge their √ The directors are responsible for supervising the preparation ofresponsibility for preparing the accounts and accounts for every fiscal period to ensure an authentic and fairthere should be a statement by the auditors presentation of the business status, performance and cash flowsabout their reporting responsibilities for that fiscal period. When preparing the accounts for the year endedin the auditor’s report on the financial statements December 31, 2006, the directors have consistently applied
appropriate accounting policies, made reasonable and prudentjudgment and estimates and prepared the accounts on a going-concern basis.
The board should acknowledge its responsibility √ Sinopec Corp. is in compliance with the Listing Rules by publishingfor financial disclosure, reports submitted its annual, interim and quarterly results.to regulators as well as other disclosurerequired under statutory requirements Sinopec Corp. has adopted an internal mechanism for ensuring
formal disclosure of price-sensitive information.
C.2Internal ControlPrinciple: The issuer should maintain sound and effective internal controls
WhetherCode Provisions Complied with Compliance by Sinopec Corp.The directors shall at least annually conduct √ Sinopec Corp. has established an internal control system to assist thea review of the effectiveness of the system of Company in achieving all business targets and guarding the safety ofinternal control of the issuer and its affiliates its assets, ensuring that the Company maintains proper accounting
records to provide reliable financial information for internal use andpublic disclosures and ensuring compliance with related rules andregulations. Please refer to “The Establishment and Implementationof the Internal Control system” section of the “CorporateGovernance” in this Annual report.

CHINA PETROLEUM & CHEMICAL CORPORATIONAnnual Report 200654
CORPORATE GOVERNANCE (CONTINUED)
Co
rpo
rate
Go
vern
an
ce
C.3Audit CommitteePrinciple: The arrangements regarding the board and company auditors should be formal and transparent
WhetherCode Provisions Complied with Compliance by Sinopec Corp.Minutes of the committee meeting shall be kept √ The minutes of committee meeting are kept by a general office underby a duly appointed secretary of the meeting. the committee. The draft and final minutes are generally sent out toThe draft and final minutes shall be sent to each of the committee members within a reasonable period after theall members of the committee within a reasonable meeting.period after the meetingA former partner of the issuer’s current auditing √ The Audit Committee members include director Liu Zhonglifirm shall be refrained from acting as a member (Chairman), director Shi Wanpeng (commissioner) and director Liof the issuer’s audit committee Deshui (commissioner). As verified, none of the members had served
as a partner or former partner to the current auditing firm.The written terms of reference of the audit √ During this reporting period, the Audit Committee Rules was furthercommittee (including the minimum requirements improved with supplementary provisions. The main authoritiesregarding authority and duties) shall be made of the committee include: make recommendations on appointment ofavailable for inspection or be posted external auditors, review annual, interim, quarterly financialon the website statements and the internal control system of Sinopec Corp., make
recommendations on adoption of accounting policies and changes tofinancial reporting requirements. The written terms of reference areavailable for inspection at the secretariat of the board.
During the reporting period, the Audit Committee held four meetings.For details, please refer to the Report of the Board of Directors ofthis Annual Report.
Where the board disagrees with the audit √ The Board and the Audit Committee did not have any different opinioncommittee’s view on selection, appointment, in 2006.resignation or dismissal of external auditors,such disagreement shall be set out in theCorporate Governance ReportThe audit committee should be provided with √ The committee members may seek independent professional advice, thesufficient resources to discharge its duties costs of which will be borne by the Company. The senior management
officers and relevant departments of the Company shall adoptpositive and cooperative attitude and actively co-operate with thework of the Audit Committee by providing it with the relevantinformation.
D Delegation by the Board
D.1Management function of the BoardPrinciple: The scope of authorisation should be clear
WhetherCode Provisions Complied with Compliance by Sinopec Corp.The board should give clear directions √ The Board, the management and each of the Board committees haveas to the powers of management, in particular, clear terms of reference. The Articles of Association and the Rulesas to circumstances where the management and Procedures for the General Meeting of Shareholders and theshould obtain prior approval or authorisation Rules and Procedures for the Meeting of Board of Directors havefrom the board clear scope regarding the duties and authorities of the Board and the
management, which are posted on the website of Sinopec Corp. athttp://www.sinopec.com
D.2Board committeesPrinciple: Board committees should be formed with specific written terms of reference
WhetherCode Provisions Complied with Compliance by Sinopec Corp.Where board committees are established √ The Board committees have clear terms of reference.to deal with matters, the board should havesufficiently clear terms of reference to enablethe committee to properly discharge its functionsThe terms of reference of the board committees √ The rules of the Board committees require such committees to reportshould require such committees to report to the to the Board on their decisions and recommendations.board on their decisions and recommendations

CHINA PETROLEUM & CHEMICAL CORPORATION Annual Report 2006 55
Co
rpo
rate
Go
vern
an
ce
E Effective communication with shareholders
E.1 Effective communicationPrinciple: The board should endeavor to maintain an ongoing dialogue with shareholders
WhetherCode Provisions Complied with Compliance by Sinopec Corp.In respect of a substantially separate issue √ A separate resolution is always proposed for each substantiallyat a general meeting of shareholders, separate issue.a separate resolution shall be proposedby the chairman of that meetingThe chairman of the board shall attend √ The chairman of the Board attended the Annual General Meetingthe annual general meeting and shall arrange of 2005.the chairman of the audit, remuneration andnomination committees to attend (as appropriate)
E.2 Voting by pollPrinciple: The issuer should regularly inform shareholders of the procedures for demanding a poll.
WhetherCode Provisions Complied with Compliance by Sinopec Corp.Voting by poll is required under certain √ To ensure the interests of all shareholders, all resolutions at thecircumstances in the general meeting general meetings are subject to voting by poll.
(2) Nomination of DirectorsThe Board of Sinopec Corp. has notestablished a Nomination Committee.During the reporting period, thenomination of directors (includingindependent non-executive directors) wasput forward in accordance with theArticles of Association by shareholders.According to the Articles of Association,the list of director candidates issubmitted to the general meeting ofshareholders by way of proposal.
(3) AuditorsAt the Annual General Meeting ofSinopec Corp. for the year 2005 held on
May 24, 2006, KPMG Huazhen andKPMG were re-appointed as the domesticand overseas auditors of Sinopec Corp.for the year 2006, respectively, and theBoard of Directors was authorised todetermine their remunerations. Asapproved at the ninth meeting of theThird Session of the Board of Directorsof Sinopec Corp., the audit fee for 2006was HK$ 60 million. The financialstatements for year 2006 have beenaudited by KPMG Huazhen and KPMG.Wu Wei and Zhang Jingjing are ChinaRegistered Certified Public Accountantsof KPMG Huazhen.
KPMG Huazhen and KPMG have providedaudit services to Sinopec Corp. for 6.5years since the second half of 2000, andthe first audit engagement was enteredinto in March 2001.
During the reporting period, both KPMGHuazhen and KPMG did not provide anynon-audit service to the Company.
Auditors appointed KPMG Huazhen (Domestic) KPMG (Overseas)Audit fees of Sinopec Corp. HK$ 1,500,000 (unpaid) HK$34,500,000 (unpaid)
for year 2006 HK$1,500,000 (paid) HK$ 22,500,000 (paid)Audit fees of Sinopec Corp.
for year 2005 HK$ 3,000,000 (paid) HK$ 45,000,000 (paid)Audit fees of Sinopec Corp.
for year 2004 HK$ 3,000,000 (paid) HK$ 47,000,000 (paid)Travel and other expenses Borne by the firm Borne by the firm
Note: Most domestic and overseas listed subsidiaries of Sinopec Corp. appointed KPMG Huazhen and KPMG as their auditors, and a few domestic listedsubsidiaries selected other firms as their auditors. Please refer to their respective annual reports for details about such subsidiaries’ appointments anddismissals of auditing firms.
(4) Other Information about Sinopec Corp.’sCorporate GovernanceExcept their working relationships withSinopec Corp, none of the directors,supervisors and senior management hasany financial, business or familyrelationships or any relationships inother material aspects with each other.For information regarding changes in
share capital and shareholdings ofprincipal shareholders, please refer toPage 9; for information regarding generalmeetings of shareholders, please refer toPage 56; for information regardingmeetings of the Board of Directors,please refer to Page 57; for informationregarding equity interests of directors,supervisors and senior management
officers, please refer to Page 46; forinformation regarding resume andannual remuneration of directors,supervisors and senior managementofficers, please refer to Page 68; and forinformation regarding external auditors,please refer to Page 77.

CHINA PETROLEUM & CHEMICAL CORPORATIONAnnual Report 200656
SUMMARY OF SHAREHOLDERS’ MEETINGS
Su
mm
ary
of
Sh
are
ho
lde
rs’
Me
eti
ng
s
During the reporting period, Sinopec Corp.convened two general meetings of shareholdersin strict observance of relevant laws, regulationsand the provisions of the Articles of Associationregarding notification, convening and holding ofgeneral meetings, the specifics of the generalmeetings are as follows:
1 The Annual General Meeting of Shareholdersfor 2005 was held on 24th May 2006 atCrowne Plaza Beijing-Park View Wuzhou.
For further details regarding the GeneralMeeting of Shareholders for the year 2005,please refer to the announcements ofSinopec Corp. published in China SecuritiesJournal, Shanghai Securities News andSecurities Times in Mainland China andHong Kong Economic Times and SouthChina Morning Post in Hong Kong on 25thMay 2006.
2 A General Meeting of Shareholders for A-Share Reform was held on 25th September2006 at Kempinski Hotel in Beijing.
For further details regarding Sinopec Corp.’sA-Share Reform, see the relevantannouncements of Sinopec Corp. publishedin China Securities Journal, ShanghaiSecurities News and Securities Times inmainland China and Hong Kong EconomicTimes and South China Morning Post inHong Kong on 29 September 2006.

CHINA PETROLEUM & CHEMICAL CORPORATION Annual Report 2006 57
REPORT OF THE BOARD OF DIRECTORS
Rep
ort
of
the
Bo
ard
of
Dir
ect
ors
The Board of Directors of Sinopec Corp. ispleased to present their report for the yearended 31 December 2006 for review.
1 THE MEETINGS OF THE BOARD OFDIRECTORSDuring this reporting period, ten Boardmeetings were held, details of which areas follows:
(1) The twenty-fourth meeting of the SecondSession of the Board of Directors washeld on February 15, 2006 by way ofwritten resolutions.
For details of this meeting, please referto relevant announcements published inChina Securities Journal, ShanghaiSecurities News and Securities Times inmainland China and Hong KongEconomic Times and South ChinaMorning Post in Hong Kong onFebruary 16, 2006.
(2) The twenty-fifth meeting of the SecondSession of the Board of Directors washeld at Sinopec Corp.’s head office onMarch 31, 2006.
For details of this meeting, please referto relevant announcements published inChina Securities Journal, ShanghaiSecurities News and Securities Timesin mainland China and Hong KongEconomic Times and South ChinaMorning Post in Hong Kong onApril 3, 2006.
(3) The twenty-sixth meeting of the SecondSession of the Board of Directors washeld on April 27, 2006 by way of writtenresolutions, at which the First QuarterlyReport of 2006 was approved.
(4) The first meeting of the Third Sessionof the Board of Directors was heldat Sinopec Corp.’s head office onMay 24, 2006.
For details of this meeting, please referto relevant announcements published inChina Securities Journal, Shanghai
Securities News and Securities Timesin mainland China and Hong KongEconomic Times and South ChinaMorning Post in Hong Kong onMay 25, 2006.
(5) The second meeting of the Third Sessionof the Board of Directors was held onJuly 10, 2006 by way of writtenresolutions. At the meeting, twoproposals were considered and approved:Sinopec Corp’s holding subsidiary-Sinopec Kantons Holdings Limited,through its wholly owned subsidiary-Kantons International InvestmentCompany, purchased 30% equityinterests of Huizhou City Daya BayHuade Petrochemical Co,. Ltd fromSINOPEC Guangzhou Company; andSinopec Corp. purchased 100% equityinterests of Guangzhou Bonded ZoneKantons Petrol Station Investment&Management Co., Ltd from HuadePetrochemical and GuangzhouZhongguan Antai Petrochemical Co., Ltd.
(6) The third meeting of the Third Sessionof the Board of Directors was heldat Huairou, Beijing on August 24 and25, 2006.
For details of this meeting, please referto relevant announcements published inChina Securities Journal, ShanghaiSecurities News and Securities Timesin mainland China and Hong KongEconomic Times and South ChinaMorning Post in Hong Kong onAugust 28, 2006.
(7) The fourth meeting of the Third Sessionof the Board of Directors was held onOctober 10, 2006 by way of writtenresolutions.
For details of this meeting, please referto relevant announcements published inChina Securities Journal, ShanghaiSecurities News and Securities Timesin mainland China and Hong KongEconomic Times and South ChinaMorning Post in Hong Kong onOctober 11, 2006.
(8) The fifth meeting of the Third Sessionof the Board of Directors was heldon October 27, 2006 by way ofwritten resolutions.
For details of this meeting, please referto relevant resolution announcementspublished in China Securities Journal,Shanghai Securities News and SecuritiesTimes in mainland China and Hong KongEconomic Times and South ChinaMorning Post in Hong Kong onOctober 30, 2006.
(9) The sixth meeting of the Third Sessionof the Board of Directors was heldon December 6, 2006 by way ofwritten resolutions.
For details of this meeting, please referto relevant resolution announcementspublished in China Securities Journal,Shanghai Securities News andSecurities Times in mainland China andHong Kong Economic Times and SouthChina Morning Post in Hong Kong onDecember 7, 2006.
(10)The seventh meeting of the Third Sessionof the Board of Directors was held onDecember 27, 2006 by way of writtenresolution. At the meeting, the InternalControl Handbook (2007 Edition), theproposal on the modified InternalAccounting System, proposal on Unipeccrude oil Purchasing Credit LineArrangement, Preliminary Plan of 2007Investment and Preliminary Plan of 2007Budget were considered and approved.
2 IMPLEMENTATION OF RESOLUTIONSPASSED AT SHAREHOLDERS’ MEETING BYTHE BOARD OF DIRECTORSDuring the reporting period, all members ofthe Board of Directors of Sinopec Corp.carried out their duties diligently andresponsibly in accordance with the relevantlaws and regulations and the Articlesof Association, duly implemented theresolutions passed at the shareholders’meetings, and accomplished thevarious tasks entrusted to them at theshareholders’ meetings.
CHINA PETROLEUM & CHEMICAL CORPORATIONAnnual Report 200658
REPORT OF THE BOARD OF DIRECTORS (CONTINUED)
Rep
ort
of
the
Bo
ard
of
Dir
ect
ors
3 ATTENDANCE OF DIRECTORS AT THE BOARD OF DIRECTORS MEETINGSDuring this reporting period, Sinopec Corp. held ten Board meetings, three of which were of the Second Session and seven were of theThird Session.
The attendance of directors at meetings of the Second Session describes as follows
Counts of Counts ofattendance commissioned
Name by himself (times) attendance (times)Chen Tonghai 3 0Wang Jiming 3 0Mou Shuling 3 0Zhang Jiaren 3 0Cao Xianghong 3 0Liu Genyuan 3 0Gao Jian 2 1Fan Yifei 2 1Chen Qingtai (Independent Non-executive Director) 3 0Ho Tsu Kwok, Charles (Independent Non-executive Director) 2 1Shi Wanpeng (Independent Non-executive Director) 3 0Zhang Youcai (Independent Non-executive Director) 2 1Cao Yaofeng 3 0
The attendance of directors at meetings of the Third Session describes as follows
Counts of Counts ofattendance commissioned
Name by himself (times) attendance (times)Chen Tonghai 7 0Zhou Yuan 7 0Wang Tianpu 7 0Zhang Jianhua 7 0Wang Zhigang 7 0Dai Houliang 7 0Liu Zhongli (Independent Non-executive Director) 7 0Shi Wanpeng (Independent Non-executive Director) 7 0Li Deshui (Independent Non-executive Director) 7 0Yao Zhongmin 6 1Fan Yifei 6 1
4 MEETINGS OF PROFESSIONALCOMMITTEES
(1) Meetings of the Audit CommitteeDuring the reporting period, the AuditCommittee under the Second Session andthe Third Session of the Board of Directorsheld four meetings, details of which areas follows:
a. The sixth meeting of the Second Sessionof the Audit Committee was held onMarch 30, 2006 by way of writtenresolutions, whereby the Explanation onthe Operating Business and FinancialPositions of Year 2005, Explanation onAudit for Year 2005, as well as the
Financial Statements for Year 2005 asaudited by KPMG Huazhen and KPMGrespectively in accordance with PRCaccounting rules and regulations andIFRS were reviewed and the Opinionson the Reviewing of the FinancialStatements for the Year 2005was issued.
b. The seventh meeting of the SecondSession of the Audit Committee was heldon April 26, 2006 by way of writtenresolutions, whereby the First QuarterlyReport of 2006, the Opinions on theReviewing of the Financial Statementsfor the First Quarter of Year 2006was issued.
c. The first meeting of the Third Session ofthe Audit Committee was held on August24, 2006 by way of written resolutions,whereby the Explanation on theOperating Business and FinancialPositions of the First Half of Year 2006,Explanation on Audit for the First Half ofYear 2006, and the Financial Statementsfor the first half of Year 2006 as auditedby KPMG Huazhen and KPMGrespectively in accordance with PRCaccounting rules and regulations andIFRS, were reviewed and the Opinions onthe Reviewing of the FinancialStatements for the First Half of Year2006 was issued.

CHINA PETROLEUM & CHEMICAL CORPORATION Annual Report 2006 59
Rep
ort
of
the
Bo
ard
of
Dir
ect
ors
d. The second meeting of the Third Sessionof the Audit Committee was held onOctober 27, 2006 by way of writtenresolutions, whereby the Third QuarterlyReport of 2006 was considered andapproved and the Opinions on theReviewing of the Financial Statementsfor the Third Quarter of Year 2006was issued.
(2) Meetings of the Strategies andDevelopment CommitteeDuring the reporting period, the firstmeeting of the Strategies and DevelopmentCommittee under the Third Session of theBoard of Directors was held on August 24,2006, whereby the Sinopec Corp.’s ThreeYear (2006-2008) Rolling Development Planand Feasibility Study of Sichuan-to-EastChina Gas Project were reviewed, andOpinions on Reviewing Sinopec Corp.’s ThreeYear (2006-2008) Rolling Development Planand Feasibility Study of Sichuan-to-EastChina Gas Project was issued.
(3) Meetings of the Remuneration andPerformance Evaluation CommitteeDuring this reporting period, theRemuneration and Performance EvaluationCommittee under the Third Session of theBoard of Directors held the first meeting onAugust 24, 2006. At this meeting, theWorking Rules (Revised Edition) of theRemuneration and Performance EvaluationCommittee of the Board of Directors ofSinopec Corp. were reviewed and theOpinions on Reviewing of the Working Rules(Revised Edition) of the Remunerationand Performance Evaluation Committee ofthe Board of Directors of Sinopec Corpwas issued.
During the reporting period, all themembers of the Audit Committee, theStrategies and Development Committeeand the Remuneration and PerformanceEvaluation Committee attended the above-mentioned meetings of the aboveprofessional committees.
5 FINANCIAL PERFORMANCEThe financial results of the Company for theyear ended 31 December 2006 prepared inaccordance with IFRS and its financialposition as at that date and its analysis areset out from page 116 to page 160 in thisAnnual Report.
6 DIVIDENDAt the ninth meeting of the Third Session ofthe Board of Directors of Sinopec Corp., theBoard approved the proposal to declare afinal dividend of RMB 0.15 per share(including tax) in cash and thus thedividends in cash declared for 2006 totaledRMB 13.005 billion. After deducting theinterim cash dividend, the final cashdividend per share for distribution would beRMB 0.11. The distribution proposal will beimplemented upon approval by the AnnualGeneral Meeting of Shareholders for 2006.The final dividend will be distributed on orbefore June 29, 2007 (Friday) to thoseshareholders whose names appear on theregister of members of Sinopec Corp. at theclose of business on June 15, 2007 (Friday).The register of members of Sinopec Corp.’sH shares will be closed from June 11, 2007(Monday) to June 15, 2007 (Friday) (bothdates are inclusive). In order to qualify forthe final dividend for H shares, theshareholders must lodge all sharecertificates accompanied by the transferdocuments with HKSCC Nominees Limited,at Shops 1712 to 1716, 17th Floor, HopewellCentre, 183 Queen’s Road East, Hong Kongbefore 4:30 p.m. on June 8, 2007 (Friday)for registration.
The dividend will be denominated anddeclared in Renminbi, the holders ofdomestic shares will paid in Renminbi andthe holders of overseas shares will be paidin Hong Kong dollars. The exchange rate forthe dividend to be paid in Hong Kong dollarswill be the mean of the exchange rates ofHong Kong dollars to Renminbi asannounced by the People’s Bank of Chinaduring the week prior to the date ofdeclaration of dividend.
Generally, an individual shareholder of Hshares or an individual holder of AmericanDepository Shares (ADSs) who is residentand domiciled in the UK will be liable to UKincome tax on the dividend received fromSinopec Corp. (after deducting relevant pre-tax deductions and tax credit). Where anindividual shareholder of H shares receives adividend from Sinopec Corp. without anydeduction of tax, the amount included asincome for the purposes of computing his orher UK tax liability is the gross amount ofthe dividend and this is taxed at theapplicable rate (currently 10 % in the caseof a taxpayer subject to a basic rate or alower rate, and 32.5 % in the case of a
taxpayer subject to a higher rate). Where taxis withheld from the dividend, credit may beclaimed against UK income tax for any taxwithheld from the dividend up to the amountof the UK income tax liability. If such awithholding is required, Sinopec Corp. willassume responsibility for withholding thattax regarding the income with a sourcewithin the PRC. The current Chinese-UKDouble Taxation Agreement provides that themaximum withholding tax on dividendpayable by a Chinese-domiciled company toUK residents is generally limited to 10% ofthe gross dividend.
Individual holders of H Shares or holders ofADSs who are UK resident but are notdomiciled in the UK (and have submitted aclaim to that effect to the UK InlandRevenue), will generally only be liable toincome tax on any dividend received fromSinopec Corp. to the extent that it isrepatriated to the UK.
Generally, a shareholder of H shares or aholder of ADSs which is a UK tax residentand UK domiciled will be liable to UK incometax or corporation tax (as appropriate and atthe rates of tax applicable to the shareholderor holder) on any dividend received fromSinopec Corp., with double tax relief availablefor withholding tax imposed. In certain cases(not to be discussed here), a shareholder ofH shares or a holder of ADSs which is a UKtax resident may be entitled to relief for“underlying” tax paid by Sinopec Corp. orits subsidiaries.
7 MAJOR SUPPLIERS AND CUSTOMERSDuring this reporting period, the totalamount of purchase from the five largestsuppliers of the Company represented51.4% of the total amount of purchasemade by the Company, of which purchasesfrom the largest supplier represented19.08% of the total purchases made by theCompany. The total amount of sales to thefive largest customers of the Companyrepresented 8% of the total annual sales ofthe Company.
During this reporting period, except for theconnected transactions with the controllingshareholder Sinopec Group Company and itssubsidiaries, as disclosed in ConnectedTransaction Section of this Annual Report,none of the directors, supervisors ofSinopec Corp. and their associates or anyshareholders holding over 5% in SinopecCorp. had any interest in any of the above-mentioned major suppliers and customers.

CHINA PETROLEUM & CHEMICAL CORPORATIONAnnual Report 200660
REPORT OF THE BOARD OF DIRECTORS (CONTINUED)
Rep
ort
of
the
Bo
ard
of
Dir
ect
ors
8 BANK LOANS AND OTHER BORROWINGSDetails of bank loans and other borrowingsof the Company as of December 31, 2006are set out in Note 30 of the FinancialStatements prepared in accordance withIFRS in this Annual Report.
9 FIXED ASSETSDuring this reporting period, changes to thefixed assets of the Company are set out inNote 18 of the Financial Statementsprepared in accordance with IFRS in thisAnnual Report.
10 RESERVESDuring this reporting period, changes to thereserves of the Company are set out in theConsolidated Statement of Changes inEquity in the Financial Statements preparedin accordance with IFRS in this AnnualReport.
11 DONATIONSDuring the reporting period, the amount ofcharity donations made by the Companytotaled around RMB 98 million.
12 PRE-EMPTIVE RIGHTSPursuant to the Articles of Association ofSinopec Corp. and the laws of the PRC,Sinopec Corp. is not subject to any pre-emptive rights requiring it to offer new issueof its shares to its existing shareholders inproportion to their shareholdings.
13 PURCHASE, SALES AND REDEMPTION OFSHARESRefer to “Significant Events” of thisAnnual Report.
14 RISK FACTORSIn the course of its production andoperations, Sinopec Corp. will actively takevarious measures to mitigate operationalrisks. However, in practice, it may notbe possible to prevent all risksand uncertainties.
Macroeconomic Policies and GovernmentRegulation: although the government isgradually liberalising the petroleum andpetrochemicals sector, the petroleum andpetrochemical industries in China are stillsubject to some form of regulation and newmacrocontrol measures adopted by theState from time to time according to actualneeds, which include: issuing crude oilproduction license, setting of guidance retailprices of gasoline, diesel and jet fuel,provision and pricing of certain resourcesand services, modification of taxes and
standard fees, formulation of import &export quotas and procedures, formulationof safety, quality and environmentalprotection standards. Such regulations mayhave material effect over the operations andprofitability of the Company.
External Purchase of Crude Oil: asignificant amount of the Company’sdemand for crude oil is satisfied fromexternal purchases. In recent years, affectedby various factors, the international crude oilprices continued to be volatile, remained ata high level and subject to wild fluctuations.In addition, the supply of crude oil may evenbe interrupted due to major incidents.Although the Company has taken flexiblemeasures to cope with the above-mentionedcircumstances, it may not be fully shieldedfrom risks associated with any wildfluctuation of the international crude oilprices and disruption of supply of crude oil.
Industry Cycles: as an integrated energy andchemicals company, the Company is alsosubject to cyclic effects which characterisethe chemicals industry. Affected by the newproduction capacities worldwide and oilprice fluctuation, the gross profit margin inthe chemicals industry may experience wildfluctuation, and the operational performanceof the Chemicals Segment may be affectedby cyclic factors.
Open Market: in December 2006, the Statepromulgated the Administrative Measures onCrude Oil Market, and the AdministrativeMeasures on Refined Oil Products Market,thus intensifying the market competition.Although the Company has activelyadopted measures in this regard, it maystill experience some impact from fullmarket access.
Investment Risk: Petroleum and chemicalsector is a capital intensive industry.Although the Company has adopted aprudent investment strategy and conductedstringent feasibility study on eachinvestment project, certain investment risksstill exist as the expected profitability maynot be achieved due to major changes infactors such as market environment.
Uncertainties with Oil & Gas Reserves: Theoil and gas reserves disclosed in this annualreport are only estimates derived byadoption of certain appraisal methods. Thereliability of such estimates depends onmany factors including techniques used andinvolves various uncertainties, and there is arisk that the actual reserves may differsubstantially from such estimates.
Operational Risks and Natural Disasters:the process of petroleum and chemicalproduction is exposed to the risk ofinflammation, explosion and environmentalpollution and is vulnerable to naturaldisasters. Such contingencies may causeserious impact to the society, grievousinjuries to people and major financial lossesto the Company. The Company hasimplemented a strict HSE managementsystem and used its best endeavor toprevent the occurrence of various accidentsas much as possible. However, the Companycannot completely avoid potential financiallosses caused by such contingent incidents.
Exchange Rate and Interest Rate: at present,in relation to the exchange rate of RMB, thePRC government implements anadministered floating exchange rate regimebased on market supply and demand withreference to a basket of currencies.Exchange rate fluctuation may also havecertain impact on the operations of theCompany. In addition, according to themacro-economic trend in domestic market,People’s Bank of China lifted RMB depositinterest rate on March 18, 2007, and it ispossible for another lift. The rise of interestrate will directly increase the financial costsof the Company.
15 POSSIBLE CHANGES OF ACCOUNTINGPOLICIES AND ACCOUNTING ESTIMATESAND THEIR IMPACTS ON THE FINANCIALCONDITIONS AND OPERATING RESULTSOF THE COMPANY, UPON ADOPTION OFTHE NEW PRC ACCOUNTING STANDARDSFOR BUSINESS ENTERPRISES (“NEW PRCACCOUNTING STANDARDS”)
(1) Analysis of the impact on theshareholders’ funds of the Companyupon first adoption of the New PRCAccounting Standards onJanuary 1, 2007:
The Company has adopted the New PRCAccounting Standards as of January 1,2007. The impact on the shareholdersof the Company of first adoption ofthe New PRC Accounting Standardson January 1, 2007 and the existingaccounting standards are summarisedas follows:
(a) Under the Accounting Standards forBusiness Enterprises No.17Borrowing Cost, where funds areborrowed generally and used foracquiring a fixed asset that isqualified for capitalisation, their

CHINA PETROLEUM & CHEMICAL CORPORATION Annual Report 2006 61
Rep
ort
of
the
Bo
ard
of
Dir
ect
ors
borrowing cost is capitalised as partof the asset’s cost. The Companyincreased retained earnings upon itsfirst adoption of the New AccountingStandards on 1 January 2007.
(b) Under the Accounting Standards forBusiness Enterprises No.2 Long TermEquity Investment, where there is anexcess of the long term equityinvestment’s initial investment costover the investor’s interest in the netfair value of the investee’s identifiableassets, equity investment differencesare not recognised, nor are theyamortised. The Company has, uponits first adoption of the NewAccounting Standards on 1 January2007, reversed the equity investmentdifferences amortised in prior years,and raised retained earnings.
(c) Under the Accounting Standards forBusiness Enterprises No.27Production of Oil and Gas, gains andlosses on the retirement or disposalof an individual item of proved oiland gas properties are notrecognised unless the retirement ordisposal encompasses an entireproperty. The Company increasedretained earnings upon its firstadoption of the New AccountingStandards on 1 January 2007.
(d) Given that the fair value of available-for-sale financial assets is determinedin accordance with the AccountingStandards for Business EnterprisesNo.22 Recognition and Measurementof Financial Instruments, theCompany has determined theavailable-for-sale securities’ fair valueas at 1 January 2007 based on open,quoted prices in active markets. TheCompany raised shareholders’ funds.
(e) Under the New AccountingStandards, expenditures on start-upactivities are recognised as anexpense when they are incurred.The Company lowered retainedearnings upon its first adoption ofthe New Accounting Standards on1 January 2007.
(f) Under the Accounting Standards forBusiness Enterprises No.16Government Grants, the asset-relatedgovernment grants received in prior
years are recognised as deferredincome and carried evenly in theincome statement over the assets’useful lives. The Company reducedshareholders’ funds upon its firstadoption of the New AccountingStandards on 1 January 2007.
(g) In accordance with the newaccounting standards, the Companyhas changed its accounting policyrelating to presentation of minorityinterests and minority interests arepresented within consolidatedshareholders’ funds separately,leading to the increase inconsolidated shareholders’ funds.
(2) Impact on the Company’s financialposition due to the changes ofaccounting policies upon adoption of theNew PRC Accounting Standards aremainly reflected in the following aspects:
(a) Under the regulations in AccountingStandards for Business EnterprisesNo.2 Long Term Equity Investment,investment in subsidiaries accountedfor under equity method previouslywill be accounted for under costmethod, which will reduce the impactof subsidiaries’ operating result onthe investment income of currentperiod of the parent company, tosome extent.
(b) Under the regulations in AccountingStandards for Business EnterprisesNo.33 Consolidated FinancialStatements, minority interests, whichwere presented in the consolidatedbalance sheet separately underexisting accounting standards, arepresented in the consolidatedbalance sheet within equity. Thischange on accounting policy willaffect the consolidated shareholders’funds of the Company.
(c) Under the regulations in AccountingStandards for Business EnterprisesNo.27 Production of Oil and Gas, ifthe obligation for disposal ofabandoned oil and gas propertiesassumed by the Company satisfiesthe recognition condition ofprovision, it should be recognised andthe carrying amount of related assetswill increase accordingly.
This change will increase the assetsand liabilities of the Company,and affect the profits and lossesof future periods by way ofdepreciation charge.
(d) Under the regulations in AccountingStandards for Business EnterprisesNo.33 Consolidated FinancialStatements, the jointly controlledentities are accounted for underequity method, while it is no longeraccounted for in the consolidatedfinancial statements on aproportionate basis.
Due to the above change ofconsolidation scope, no impact isexpected on consolidatedshareholders’ funds and consolidatednet profit. However, it may causecertain effects on total assets, totalliabilities, operating income andso on.
(e) Under the regulations in AccountingStandards for Business EnterprisesNo. 33 Consolidated FinancialStatements, unless stipulated in theArticles of Association or Agreementsthat minority shareholders areobliged to and have the ability toafford the losses exceedingshareholders’ funds, such lossesincurred by subsidiaries ininsolvency should be affordedby the parent company.
Due to the change mentioned above,it is likely to reduce shareholders’funds of the parent companyand have an impact on theconsolidated net profit and the netprofit of the parent company forrespective periods.
By Order of the BoardChen TonghaiChairman
Beijing China6 April, 2007

CHINA PETROLEUM & CHEMICAL CORPORATIONAnnual Report 200662
REPORT OF THE SUPERVISORY BOARD
Re
po
rt o
f th
e S
up
erv
iso
ry B
oa
rd
To all shareholders:
During this reporting period, all members of theSupervisory Board observed the principle ofgood faith and duly fulfilled their supervisoryduties in accordance with the Company Law ofthe PRC and the relevant provisions of theArticles of Association of Sinopec Corp. tosafeguard the rights of the shareholders and theinterest of the Company.
During this reporting period, the SupervisoryBoard held four meetings.
At the seventh meeting of the Second Sessionof the Supervisory Board held on 31 March2006, the Supervisory Board reviewed thereport submitted by the Department of Financeon Operating Results and Financial Positions for
Year 2005 and the Explanatory notes on theaudit submitted by KPMG Huazhen and KPMG.It also considered and approved the FinancialStatements for Year 2005, Annual Report forYear 2005, the Proposal on ProfitAppropriations for Year 2005 and Report of theSupervisory Board for Year 2005; discussed andapproved the Summary Report of the SecondSession of the Supervisory Board, and alsonotified in writing investigation and inspectionof Guangzhou Branch, Guangdong PetroleumBranch and Hainan Petroleum Branchundertaken by the independent supervisorsand the relevant resolutions were passedat the meeting.
At the first meeting of the Third Session of theSupervisory Board held on 24 May of the same
year, Mr. Wang Zuoran was elected as theChairman of the Third Session of theSupervisory Board and Zhang Youcai asthe Vice Chairman.
At the second meeting of the Third Session ofthe Supervisory Board held on 25 August of thesame year, the Interim Financial Report of2006, the Interim Report of 2006 and the ProfitAppropriations Plan for the first half of 2006were reviewed and approved.
At the third meeting of the Third Session ofthe Supervisory Board held on 27 October ofthe same year, the Third Quarterly Report ofYear 2006 of the Company was reviewedand approved.
Mr. Wang Zuoran, Chairman of the Supervisory Board

CHINA PETROLEUM & CHEMICAL CORPORATION Annual Report 2006 63
Re
po
rt o
f th
e S
up
erv
iso
ry B
oa
rd
In addition, the Supervisory Board exercisedsupervision over the duty performance of thesenior management of the Company, the majordecisions of the Company and theimplementation of decisions, such asproduction operations, capital operations, assetrestructuring, major investments, connectedtransactions and dividend distribution, byattending meetings of the Board of Directorsand carrying out investigations and inspections.
Through its diligent performance of supervisoryand oversight duties, the Supervisory Boardbelieves that: in 2006, Sinopec Corp. has abidedby the principles of standardisation, precisionand integrity in its operation. Confronted withinternational oil price fluctuations, continuingmaterial losses in the refining segment, tightcontrol of domestic refined oil product prices,difficulties in production and operation andgreat pressure in ensuring sufficient supply tooil product market, Sinopec Corp. strengthenedthe implementation of resource strategy,elaborately organised the refinery production,ensured the production steadiness, safety andthe market supply, reinforced the internalmanagement and continued to deepen thereform and restructuring, firmly focused on theenergy saving and reduction of consumptionand cost, with new improvements achieved inproduction quality and economic benefits,operational cash flow further increased, andratio of assets to liabilities controlled withinreasonable level.
Firstly, the Board of Directors diligentlyperformed its obligations and exercised itsrights under the PRC Company Law and theArticles of Association of Sinopec Corp., fullyimplemented the resolutions of the generalmeetings of shareholders and the meetings ofBoard of Directors and made decisions in atimely manner over material affairs includingthe capital operations, production and operatingplans and development goals. The seniormanagement officers operated in compliant withlaws, regulations and standards, made newachievements in the oil and gas exploration andproduction. The refining segment achieved fullload operation and ensured market supply;chemical production witnessed increases ingross production and gained preponderance incentralised sale; sales volume of refined oilproducts increased steadily and the qualityfurther improved; the key construction project
proceeded successfully; the investmentstructure further optimised; the new progressmade in application of technology andinformation; reform in system and mechanismadvanced solidly; A-Share Reform completedsmoothly; the effect of the internal controlsystem further improved; and the foundation ofCompany’s corporate governance reinforced.
Secondly, the annual financial report of theCompany has been prepared in accordance withthe PRC Accounting Rules and Regulations andthe IFRS respectively. The principle ofconsistency has been adopted in preparing thefinancial reports and the reported data truly andfairly reflect the Company’s financial status andoperating performance. According to thefinancial data prepared in accordance with thePRC Accounting Rules and Regulations, theincome from the Company’s principaloperations was RMB 1,044.579 billion,representing an increase of 30.7% as comparedwith RMB 799.115 billion of last year; profitbefore taxation were RMB 73.252 billion,representing an increase of 19.1% as comparedwith RMB 61.482 billion of last year; the netprofits were RMB 50.664 billion, representingan increase of 28.1% as compared with RMB39.558 billion of last year. According to thefinancial data prepared in accordance with theIFRS, the turnover, other operating revenues andother income was RMB 1,076.402 billion,representing an increase of 29.3% comparingwith RMB 832.687 billion of last year; profitbefore tax was RMB 78.923 billion, representingan increase of 22.1% comparing with RMB64.656 billion of last year; profit attributable toshareholders was RMB 53.912 billion,representing an increase of 30.0% comparingwith RMB 41.455 billion, and those increaseswere mainly attributed to the following aspects:the production of natural gas got significantincreases; the processing volume of crude oil,the output of refined oil products and theoutput of chemical products reached ahistorical high level; the percentage of terminalsales volume of refined oil productscontinuously increased; meanwhile, thereduction of cost and improvement ofefficiency, energy saving and consumptiondecrease played a continuous important role inthe overall profitability.
Thirdly, all connected transactions werecompliant with related regulations. All
connected transactions between the Companyand the Sinopec Group Company were inconformity with the relevant rules andregulations of the Hong Kong Stock Exchangeand the Shanghai Stock Exchange. Theconnected transactions were conducted on thebasis of fair and reasonable price and abided bythe principle of “fair, just and open”. Nothing inthese transactions was found to be detrimentalto the Company’s benefits.
Fourthly, the preparation of the annual reportand approval procedures were in conformitywith the various provision of the law,regulations, Articles of Association and internalmanagement system, in compliant withprovisions of China Securities RegulatoryCommission and stock exchanges in form andsubstance, and no breach of confidentialityprovisions by any person participated in thepreparation or approval is found.
In the year ahead, the Supervisory Board willfurther develop its focus on operation, carry outbalanced development with emphasis on theimplementation of internal control systems,major capital expenditures and asset swap,application of information methods, conformityof connected transactions and implementationof new accounting principles and budget,aspects of safety and environment protectionand reduction of cost and expenses. TheCommittee will strengthen its supervision andinvestigation of the Company based on theprinciple of honesty and good faith to continueto carefully perform its supervising duties topromote the overall competitiveness andsustaining profitability of the Company, andto safeguard the interests of shareholdersand the Company.
Wang ZuoranChairman of the Supervisory Board
Beijing China,6 April 2007

CHINA PETROLEUM & CHEMICAL CORPORATIONAnnual Report 200664
DIRECTORS, SUPERVISORS, SENIOR MANAGEMENT AND EMPLOYEES
Dir
ect
ors
, S
up
erv
iso
rs,
Se
nio
r M
an
age
me
nt
an
d E
mp
loye
es
1 GENERAL INFORMATION ON DIRECTORS,SUPERVISORS AND SENIOR MANAGEMENT
(1) DirectorsChen Tonghai, 58, Chairman of theBoard of Directors of Sinopec Corp. andPresident of Sinopec Group Company.Mr. Chen graduated from NortheastPetroleum Institute in September 1976specialising in petroleum productionengineering. Mr. Chen is a professor levelsenior economist. He has extensiveexperience in petrochemical industryadministration and macro-economicmanagement. From July 1983 toDecember 1986, Mr. Chen was Vice PartySecretary and the Party Secretary ofZhenhai Petroleum and PetrochemicalPlant under the former Sinopec GroupCompany. From December 1986 to July1989, Mr. Chen served as ManagingDeputy Mayor of Ningbo City, ZhejiangProvince. From July 1989 to June 1991,Mr. Chen served as Managing DeputyDirector of the Planning and EconomicCommittee of Zhejiang Province. FromJune 1991 to February 1992, Mr. Chenserved as Acting Mayor of Ningbo City.From February 1992 to January 1994,Mr. Chen served as Mayor of Ningbo City.From January 1994 to April 1998, Mr.Chen served as Vice Minister of the StatePlanning Commission. Mr. Chen servedas Vice President of Sinopec GroupCompany from April 1998 to March2003. Mr. Chen has been President ofSinopec Group Company since March2003. Mr. Chen served as Director andVice Chairman of the First Session of theBoard of Directors of Sinopec Corp. fromFebruary 2000 to April 2003. Mr. Chenserved as Director and Chairman of theSecond Session of the Board ofDirectors of Sinopec Corp. from April2003 to May 2006; he was elected asDirector and Chairman of the ThirdSession of the Board of Directors ofSinopec Corp. in May 2006.
Zhou Yuan, 59, Vice Chairman of theBoard of Directors of Sinopec Corp. andVice President of the Sinopec GroupCompany. Mr. Zhou graduated from EastChina Petroleum Institute specialising inpetroleum geology in September 1975.He is a senior Economist. He hasextensive experience in the managementof petroleum and petrochemical andgovernment entities. From April 1986 toMarch 1989, he was the DeputySecretary of the Party Committee ofXinjiang Petroleum AdministrationBureau (Kelamayi City) as well as theSecretary of the Party Committee ofSouth Xinjiang Petroleum ExplorationCompany. From March 1989 to August1990, he was the Vice Commander,Deputy Secretary of the Party Committeeand Secretary of the DisciplinaryCommittee of Talimu Exploration andDevelopment Headquarter. From August1990 to January 1992, he was theDeputy Secretary of the Party Committeeof Xinjiang Petroleum AdministrationBureau (Kelamayi City) and the Secretaryof Politics & Law Committee. FromJanuary 1992 to December 1993, heserved as Vice Minister of OrganizationDepartment of the Party Committee ofXinjiang Autonomous Region. FromDecember 1993 to January 1998, heserved as a member of the StandingCommittee of Discipline Committee andthe Deputy Minister of the PartyCommittee of the OrganisationDepartment of Xinjiang AutonomousRegion. From January 1998 to August1999, he was a member of the StandingCommittee of the DisciplinaryCommittee of the Xinjiang AutonomousRegion and the Secretary of the PartyCommittee of Yili Autonomous District.From August 1999 to November 1999, hewas a member of the StandingCommittee of the Party Committee of
the Xinjiang Autonomous Region and theSecretary of the Party Committee of YiliAutonomous District. From November1999 to July 2004, he was a member ofStanding Committee of the PartyCommittee of Xinjiang AutonomousRegion and Minister of the OrganizationDepartment of the Party Committee ofXinjiang Autonomous Region. Since July2004, he has been the Vice President ofSinopec Group Company; Mr. Zhou waselected as Director and Vice Chairman ofthe Third Session of the Board ofDirectors of Sinopec Corp. in May 2006.
Wang Tianpu, 44, Director of the Boardof Directors and President of SinopecCorp.. Mr. Wang graduated from QingdaoChemical Institute in July 1985 majoringin basic organic chemistry. He obtainedhis MBA degree in Dalian University ofScience & Technology in July 1996 andPh.D. degree in Zhejiang University inAugust 2003 majoring in chemicalengineering. He is a professor levelsenior engineer and well-experienced inthe production and management inpetrochemical industry. From March1999 to February 2000, Mr. Wang wasVice President of Qilu PetrochemicalCompany of Sinopec Group. FromFebruary 2000 to September 2000, hewas Vice President of Sinopec Corp. QiluCompany. From September 2000 toAugust 2001, he was President ofSinopec Corp. Qilu Company. Mr. Wangwas Vice President of Sinopec Corp.from August 2001 to April 2003 and wasSenior Vice President of Sinopec Corp.from April 2003 to March 2005. Mr.Wang has been President of SinopecCorp. since March 2005; Mr. Wang waselected as Director of the Third Sessionof the Board of Directors of SinopecCorp. in May 2006 and he is President ofSinopec Corp..
Chen Tonghai Zhou Yuan Wang Tianpu

CHINA PETROLEUM & CHEMICAL CORPORATION Annual Report 2006 65
Dir
ect
ors
, S
up
erv
iso
rs,
Se
nio
r M
an
age
me
nt
an
d E
mp
loye
es
Zhang Jianhua, 42, Director of the Boardof Directors and Senior Vice President ofSinopec Corp.. Mr. Zhang graduated fromEast China Chemical Institute in July1986 majoring in petroleum refining, andobtained a master’s degree from EastChina University of Science andTechnology in December 2000 majoringin chemical engineering. He is aprofessor level senior engineer. FromApril 1999 to February 2000, Mr. Zhangwas Vice President of Shanghai GaoqiaoPetrochemical Company of SinopecGroup. From February 2000 toSeptember 2000, he was Vice Presidentof Sinopec Corp. Shanghai GaoqiaoCompany. He was President of SinopecCorp. Shanghai Gaoqiao Company fromSeptember 2000 to June 2003. Mr.Zhang served as Vice President ofSinopec Corp. from April 2003 to March2005. He was also the Director Generalof Sinopec Production & OperationManagement Dept. from November 2003to November 2005. He has been SeniorVice President of Sinopec Corp. sinceMarch 2005; Mr. Zhang was elected asDirector of the Third Session of theBoard of Directors of Sinopec Corp. inMay 2006 and has been Senior VicePresident of Sinopec Corp..
Wang Zhigang, 49, Director of the Boardof Directors of Sinopec Corp. and SeniorVice President of Sinopec Corp.. Mr.Wang graduated from East ChinaPetroleum Institute in January 1982,majoring in oil production, and thenobtained a master’s degree fromUniversity of Petroleum in June 2000,majoring in oil and gas developmentengineering. He obtained a Ph.D degreefrom Geology and Geo-physics ResearchInstitute of the China Academy ofSciences in September 2003 majoring ingeology. He is a professor level seniorengineer. From February 2000 to June2000, he was Vice President of SinopecShengli Oilfield Company Limited. FromJune 2000 to December 2001, Mr. Wangserved as Director and President ofSinopec Shengli Oilfield CompanyLimited. He was appointed as honoraryDeputy Director-General of the Economicand Trade Committee of Ningxia HuiAutonomous Region from November2001 to May 2003. He was VicePresident of Sinopec Corp. from April2003 to March 2005. He was also theDirector General of Sinopec Explorationand Production Dept. since June 2003 toNovember 2005. He has been Senior VicePresident of Sinopec Corp. since March2005; Mr. Wang was elected as Directorof the Third Session of the Board ofDirectors of Sinopec Corp. in May 2006and has been Senior Vice President ofSinopec Corp..
Dai Houliang, 43, Director of the Boardof Directors of Sinopec Corp., SeniorVice President and Chief Finance Officerof Sinopec Corp.. Mr. Dai graduated fromJiangsu Chemical Institute in July 1985,specialising in organic chemicalengineering. From September 1997 toJuly 1999, he participated in the MBAtraining program in Nanjing University.He is a professor level senior engineer.He was Deputy Manager of SinopecYangzi Petrochemical Company fromDecember 1997 to April 1998. He servedas Director and Deputy General Managerof Sinopec Yangzi Petrochemical Co.,Ltd. from April 1998 to July 2002. Hewas Vice Chairman and General Managerof Sinopec Yangzi Petrochemical Co.,Ltd. and Director of Sinopec YangziPetrochemical Company from July 2002to December 2003. He was Chairmanand President of Sinopec YangziPetrochemical Co., Ltd. and Chairman ofSinopec Yangzi Petrochemical Companyfrom December 2003 to September2005. He also served as Chairman ofBASF-YPC Company Limited fromDecember 2004 to October 2006. He hasbeen the Deputy CFO of Sinopec Corp.from September 2005 to May 2006. Mr.Dai has been Vice President of SinopecCorp. from November 2005 to May 2006.In May 2006, he was elected as Directorof the Third Session of the Board ofDirectors, Senior Vice President and CFOof Sinopec Corp..
Zhang Jianhua Wang Zhigang Dai Houliang
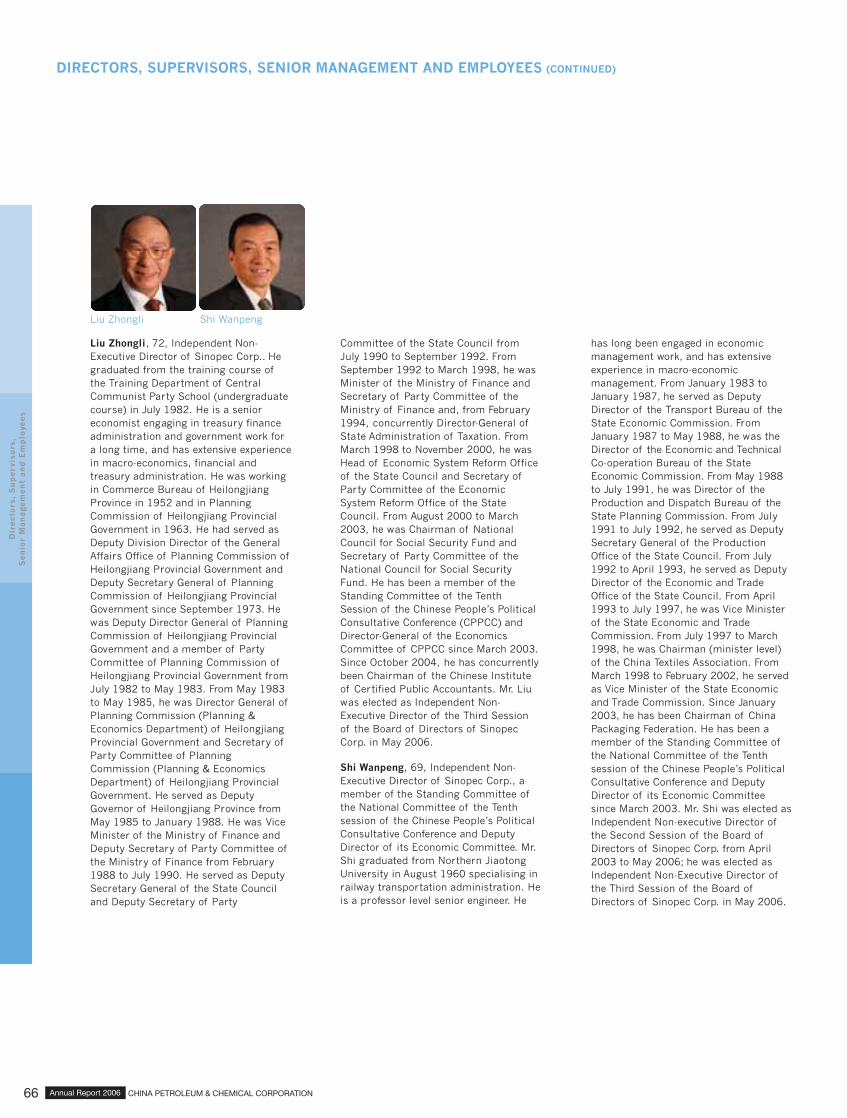
CHINA PETROLEUM & CHEMICAL CORPORATIONAnnual Report 200666
DIRECTORS, SUPERVISORS, SENIOR MANAGEMENT AND EMPLOYEES (CONTINUED)
Dir
ect
ors
, S
up
erv
iso
rs,
Se
nio
r M
an
age
me
nt
an
d E
mp
loye
es
Liu Zhongli, 72, Independent Non-Executive Director of Sinopec Corp.. Hegraduated from the training course ofthe Training Department of CentralCommunist Party School (undergraduatecourse) in July 1982. He is a senioreconomist engaging in treasury financeadministration and government work fora long time, and has extensive experiencein macro-economics, financial andtreasury administration. He was workingin Commerce Bureau of HeilongjiangProvince in 1952 and in PlanningCommission of Heilongjiang ProvincialGovernment in 1963. He had served asDeputy Division Director of the GeneralAffairs Office of Planning Commission ofHeilongjiang Provincial Government andDeputy Secretary General of PlanningCommission of Heilongjiang ProvincialGovernment since September 1973. Hewas Deputy Director General of PlanningCommission of Heilongjiang ProvincialGovernment and a member of PartyCommittee of Planning Commission ofHeilongjiang Provincial Government fromJuly 1982 to May 1983. From May 1983to May 1985, he was Director General ofPlanning Commission (Planning &Economics Department) of HeilongjiangProvincial Government and Secretary ofParty Committee of PlanningCommission (Planning & EconomicsDepartment) of Heilongjiang ProvincialGovernment. He served as DeputyGovernor of Heilongjiang Province fromMay 1985 to January 1988. He was ViceMinister of the Ministry of Finance andDeputy Secretary of Party Committee ofthe Ministry of Finance from February1988 to July 1990. He served as DeputySecretary General of the State Counciland Deputy Secretary of Party
Committee of the State Council fromJuly 1990 to September 1992. FromSeptember 1992 to March 1998, he wasMinister of the Ministry of Finance andSecretary of Party Committee of theMinistry of Finance and, from February1994, concurrently Director-General ofState Administration of Taxation. FromMarch 1998 to November 2000, he wasHead of Economic System Reform Officeof the State Council and Secretary ofParty Committee of the EconomicSystem Reform Office of the StateCouncil. From August 2000 to March2003, he was Chairman of NationalCouncil for Social Security Fund andSecretary of Party Committee of theNational Council for Social SecurityFund. He has been a member of theStanding Committee of the TenthSession of the Chinese People’s PoliticalConsultative Conference (CPPCC) andDirector-General of the EconomicsCommittee of CPPCC since March 2003.Since October 2004, he has concurrentlybeen Chairman of the Chinese Instituteof Certified Public Accountants. Mr. Liuwas elected as Independent Non-Executive Director of the Third Sessionof the Board of Directors of SinopecCorp. in May 2006.
Shi Wanpeng, 69, Independent Non-Executive Director of Sinopec Corp., amember of the Standing Committee ofthe National Committee of the Tenthsession of the Chinese People’s PoliticalConsultative Conference and DeputyDirector of its Economic Committee. Mr.Shi graduated from Northern JiaotongUniversity in August 1960 specialising inrailway transportation administration. Heis a professor level senior engineer. He
has long been engaged in economicmanagement work, and has extensiveexperience in macro-economicmanagement. From January 1983 toJanuary 1987, he served as DeputyDirector of the Transport Bureau of theState Economic Commission. FromJanuary 1987 to May 1988, he was theDirector of the Economic and TechnicalCo-operation Bureau of the StateEconomic Commission. From May 1988to July 1991, he was Director of theProduction and Dispatch Bureau of theState Planning Commission. From July1991 to July 1992, he served as DeputySecretary General of the ProductionOffice of the State Council. From July1992 to April 1993, he served as DeputyDirector of the Economic and TradeOffice of the State Council. From April1993 to July 1997, he was Vice Ministerof the State Economic and TradeCommission. From July 1997 to March1998, he was Chairman (minister level)of the China Textiles Association. FromMarch 1998 to February 2002, he servedas Vice Minister of the State Economicand Trade Commission. Since January2003, he has been Chairman of ChinaPackaging Federation. He has been amember of the Standing Committee ofthe National Committee of the Tenthsession of the Chinese People’s PoliticalConsultative Conference and DeputyDirector of its Economic Committeesince March 2003. Mr. Shi was elected asIndependent Non-executive Director ofthe Second Session of the Board ofDirectors of Sinopec Corp. from April2003 to May 2006; he was elected asIndependent Non-Executive Director ofthe Third Session of the Board ofDirectors of Sinopec Corp. in May 2006.
Liu Zhongli Shi Wanpeng

CHINA PETROLEUM & CHEMICAL CORPORATION Annual Report 2006 67
Dir
ect
ors
, S
up
erv
iso
rs,
Se
nio
r M
an
age
me
nt
an
d E
mp
loye
es
Li Deshui, 62, Independent Non-Executive Director of Sinopec Corp.. Mr.Li graduated from university in 1967. Heis a senior engineer, researcher, part-time professor of the Economics Schoolof Peking University and the EconomicsSchool of Renmin University of China.After graduating from university, he wasassigned to work at Maanshan SteelCompany and has acted as WorkshopSection Head and Dispatch Head. In1977 he worked at the Planning Instituteof the Metallurgy Department. In 1984he worked at the Raw Materials Bureauof the State Planning Commission. In1988 he acted as Deputy DivisionDirector of the First Industrial PlanningDivision of the Long-term PlanningDepartment of the State PlanningCommission. In 1989 he was DivisionDirector of the First Industrial PlanningDivision of the Long-term PlanningDepartment and Division Director of theFirst Industrial Planning Division of theLong-term Planning and Industrial PolicyDepartment. In 1992 he acted as DeputyDirector of the National EconomyComprehensive Department of the StatePlanning Commission. In May 1996 hewas Director of the National EconomyComprehensive Department of the StatePlanning Commission. In November1996, he acted as Vice Mayor ofChongqing in Sichuan Province. In March1997 he acted as Vice Mayor ofChongqing Municipality. In November1999 he worked as Deputy Director ofthe Research Office of the State Counciland a member of the Party Committee.In April 2002, he served as Secretary ofthe Party Committee and Deputy GeneralManager of China InternationalEngineering Consultancy Company. InMarch 2003 he served as Secretary ofthe Party Committee and Head of theState Statistics Bureau, a member of theMonetary Policy Committee of thePeople’s Bank of China and Chairman ofChina Statistics Institute. In March 2005,he was elected as Vice Chairman of the
Thirty-sixth Statistics Commission of theUnited Nations. In March 2005 he servedas a member of the Tenth Session of theChinese People’s Political ConsultativeConference. In April 2006 he acted as amember of the Economic Commission.In March 2006, he was the consultant ofthe State Statistics Bureau. Mr. Li waselected as Independent Non-ExecutiveDirector of the Third Session of theBoard of Directors of Sinopec Corp.in May 2006.
Yao Zhongmin, 54, Director of SinopecCorp.. Mr. Yao graduated from DongbeiUniversity of Finance & Economics inSeptember 1977 specialising inInfrastructure Finance & Credit andgraduated as postgraduate fromZhongnan University of Finance &Economics in December 1996specialising in Investment Economicswith a master’s degree. He is a seniorEconomist. Mr. Yao has worked for a longtime in financial investment managementrelated work and has extensiveexperience in finance investmentmanagement. From May 1985 to June1989, he was a member of the PartyCommittee of China Construction BankHenan Branch and its Vice-Chairman.From June 1989 to June 1992, he wasleading the work of China ConstructionBank Henan Branch, and was DeputySecretary of the Party Committee andVice Chairman of the bank. From June1992 to April 1993, he served asSecretary of the Party Committee andChairman of China Construction BankHenan Branch. He served as ViceGovernor of Henan Province from April1993 to January 1994. From January1994 to March 1998, he was a memberof the Party Committee of ChinaDevelopment Bank and its Vice Chairmanand Chairman of the DisciplinarySupervision Committee. From March1998 to June 1998, he was DeputySecretary of the Party Committee ofChina Development Bank and its Vice
Chairman and Chairman of theDisciplinary and InvestigationCommittee. From June 1998, he was theDeputy Secretary of the Party Committeeof China Development Bank and its Vice-Chairman. Mr. Yao was elected asDirector of the Third Session of theBoard of Directors of Sinopec Corp.in May 2006.
Fan Yifei, 43, Director of Sinopec Corp..Mr. Fan graduated from the treasury andfinance department of Renmin Universityof China in July 1993 and obtained adoctoral degree in economics; Heobtained a master’s degree ininternational economics from ColumbiaUniversity in 2002. He is a senioraccountant. From June 1993 toSeptember 1994, he was the Assistant tothe General Manager and Manager of thePlanning and Finance Department of theTrust Investment Company of ChinaConstruction Bank successively. FromSeptember 1994 to July 1996, he servedas Vice General Manager of the CapitalPlanning Department of ChinaConstruction Bank. He was the GeneralManager of the Finance and AccountingDepartment of China Construction Bankfrom July 1996 to January 1998. He wasthe General Manager of the Planning andFinance Department of ChinaConstruction Bank from January 1998 toFebruary 2000. Mr. Fan served as theAssistant to the Governor of ChinaConstruction Bank from February 2000to June 2005, during which he enrichedhis experience by participating in theThree Gorges project, and also acted asthe Assistant to the General Manager ofChina Changjiang Power Co., Ltd. In June2005, Mr. Fan was appointed as DeputyGovernor of China Construction Bank.Mr. Fan acted as Director of the SecondSession of the Board of Directors ofSinopec Corp. from April 2003 to May2006; he was elected as Director of theThird Session of the Board of Directorsof Sinopec Corp. in May 2006.
Li Deshui Yao Zhongmin Fan Yifei

CHINA PETROLEUM & CHEMICAL CORPORATIONAnnual Report 200668
DIRECTORS, SUPERVISORS, SENIOR MANAGEMENT AND EMPLOYEES (CONTINUED)
Dir
ect
ors
, S
up
erv
iso
rs,
Se
nio
r M
an
age
me
nt
an
d E
mp
loye
es
Directors of the Third Session of the Board of Directors
Information of Directors
Remuneration paidPosition with by the Company Whether paid Shares Held at Sinopec Corp.
Name Gender Age Sinopec Corp. Term of Office in 2006 by the holding from any shareholder(RMB) Company (at 31 December)
2006 2005Chen Tonghai M 58 Chairman 2006.5-2009.5 — YES 0 0Zhou Yuan M 59 Vice Chairman 2006.5-2009.5 — YES 0 0WangTianpu M 44 Director, President 2006.5-2009.5 616,064 NO 0 0Zhang Jianhua M 42 Director, 2006.5-2009.5 575,804 NO 0 0
Senior Vice PresidentWang Zhigang M 49 Director, 2006.5-2009.5 575,804 NO 0 0
Senior Vice PresidentDai Houliang M 43 Director, 2006.5-2009.5 446,090 NO 0 0
Senior Vice President , CFOLiu Zhongli M 72 Independent 2006.5-2009.5 109,000 (Fees) NO 0 0
Non-executive DirectorShi Wanpeng M 69 Independent 2006.5-2009.5 121,000 (Fees) NO 0 0
Non-executive DirectorLi Deshui M 62 Independent 2006.5-2009.5 109,000 (Fees) NO 0 0
Non-executive DirectorYao Zhongmin M 54 Director 2006.5-2009.5 35,000 (Fees) NO 0 0Fan Yifei M 43 Director 2006.5-2009.5 35,000 (Fees) NO 0 0
Directors of the Second Session of the Board of Directors (who are no longer the Directors of the Company)
Remuneration paidPosition with by the Company Whether paid by Shares Held at Sinopec Corp.
Name Gender Age Sinopec Corp. Term of Office in 2006 the shareholding from any shareholder(RMB) Company (at 31 December)
2006 2005Wang Jiming M 64 Vice Chairman 2003.4-2006.5 148,584 NO 0 0Mou Shuling M 62 Director 2003.4-2006.5 115,228 NO 0 0Zhang Jiaren M 62 Director, 2003.4-2006.5 122,584 NO 0 0
Chief Financial OfficerCao Xianghong M 61 Director 2003.4-2006.5 143,584 NO 0 0Liu Genyuan M 61 Director 2003.6-2006.5 — YES 0 0Gao Jian M 57 Director 2004.5-2006.5 — NO 0 0Chen Qingtai M 69 Independent 2003.4-2006.5 12,000 (Fees) NO 0 0
Non-executive DirectorHo Tsu Kwok Charles M 57 Independent 2003.4-2006.5 9,000 (Fees) NO 0 0
Non-executive DirectorZhang Youcai M 65 Independent 2003.4-2006.5 9,000 (Fees) NO 0 0
Non-executive DirectorCao Yaofeng M 53 Employee 2003.4-2006.5 113,315 NO 0 0
Representative Director

CHINA PETROLEUM & CHEMICAL CORPORATION Annual Report 2006 69
Dir
ect
ors
, S
up
erv
iso
rs,
Se
nio
r M
an
age
me
nt
an
d E
mp
loye
es
(2) SupervisorsWang Zuoran, 56, Chairman of theSupervisory Board of Sinopec Corp.. Mr.Wang graduated from ShandongEconomic Administration Institute inSeptember 1994 specialising ineconomic administration. Mr. Wang is aprofessor level senior economist and hasextensive experience in the managementof petroleum industry. From October1994 to February 2000, Mr. Wang servedas Deputy Director and Party Secretaryof Shengli Petroleum AdministrationBureau. From February 2000 to July2001, Mr. Wang was the Assistant to thePresident of Sinopec Group Company.Mr. Wang has been Director ofDisciplinary Supervision Committee ofSinopec Group Company since July2001. Mr. Wang served as Supervisor ofthe First Session of the SupervisoryBoard of Sinopec Corp. from February2000 to April 2003. From April 2003 toMay 2006, Mr. Wang served asSupervisor and Chairman of the SecondSession of the Supervisory Board ofSinopec Corp.; he was elected asSupervisor and Chairman of the ThirdSession of the Supervisory Board ofSinopec Corp. in May 2006.
Zhang Youcai, 65, IndependentSupervisor and Vice Chairman of theSupervisory Board of Sinopec Corp.. Mr.Zhang graduated from Nanjing IndustrialUniversity in August 1965 majoring ininorganic chemistry. He is a professorand has long been engaged in businessadministration, financial managementand government affairs, and hasextensive experience in industrial,economic, financial and accountingmanagement. From January 1968 toAugust 1980, he served as a technician,
Vice-President, Deputy Secretary of theParty Committee and President ofNantong Chemical Fertilizer Plant. FromAugust 1980 to January 1982, he wasDeputy Director-General and member ofthe Party Committee of the IndustrialBureau of Nantong Region. From January1982 to February 1983, he served asDeputy Director - General of PlanningCommission of Nantong Region. FromFebruary 1983 to November 1989, heserved as Deputy Mayor, DeputySecretary of the Party Committee andMayor of Nantong City. He was ViceMinister and member of the PartyCommittee of Ministry of Finance fromDecember 1989 to July 2002 (from May1994 to March 1998, he servedconcurrently as Director-General ofState-owned Assets AdministrationBureau). He has been Chairman of theChinese Institute of Chief Accountantssince November 2002. He has been amember of the Standing Committee ofthe Tenth National People’s Congress(NPC) and Deputy Director of itsFinancial and Economic Committee ofNPC from March 2003. Mr. Zhang servedas an Independent Non-ExecutiveDirector of the Second Session of Boardof Directors of Sinopec Corp. from April2003 to May 2006; he was elected asIndependent Supervisor and ViceChairman of the Third Session of theSupervisory Board of Sinopec Corp.in May 2006.
Kang Xianzhang, 58, Supervisor ofSinopec Corp.. Mr. Kang graduated fromthe Correspondence TeachingDepartment of the Party School of theBeijing Municipal Party Committee inMarch 1988 specialising in ideologypolitics (undergraduate course). He also
graduated from the CorrespondenceTeaching College of the Party School ofthe Central Committee of the CommunistParty of China in December 1992specialising in party and political affairsmanagement (bachelor course). He is asenior political engineer. From June 1995to August 1996, he was the DeputyDirector of the Organization Departmentof the Communist Party Committee ofthe Tibet Autonomous Region. FromAugust 1996 to May 1997, he was asenior researcher of the deputy directorlevel in the Cadre Allocation Bureau ofthe Organization Department of theCentral Committee of the CommunistParty of China. He acted as the DeputySecretary of the Communist PartyCommittee of the Coal ScientificResearch Institute of the Ministry of CoalIndustry from May 1997 to October1998. From October 1998 to May 1999,he was Supervisor of the deputy directorlevel in the Discipline Inspection Groupand the Supervisory Bureau of SinopecGroup Company, and acted as a DeputyDirector of the Supervisory Bureau ofthe same company from May 1999 toMarch 2001. He was the Deputy Directorof the Supervisory Department ofSinopec Corp. from February 2000 toMarch 2001. He has been a Deputy Headof the Discipline Inspection Group of theLeading Party Group and Director of theSupervisory Bureau of Sinopec GroupCompany, as well as Director of theSupervisory Department of SinopecCorp. since March 2001. Mr. Kang servedas Supervisor of the Second Session ofthe Supervisory Board of Sinopec Corp.from April 2003 to May 2006; he waselected as Supervisor of the ThirdSession of the Supervisory Board ofSinopec Corp. in May 2006.
Wang Zuoran Zhang Youcai Kang Xianzhang

CHINA PETROLEUM & CHEMICAL CORPORATIONAnnual Report 200670
DIRECTORS, SUPERVISORS, SENIOR MANAGEMENT AND EMPLOYEES (CONTINUED)
Dir
ect
ors
, S
up
erv
iso
rs,
Se
nio
r M
an
age
me
nt
an
d E
mp
loye
es
Zou Huiping, 46, Supervisor of SinopecCorp.. Mr. Zou graduated from JiangxiInstitute of Finance and Economics inJuly 1986 specialising in tradeeconomics. He is a professor level senioraccountant. From November 1998 toFebruary 2000, he served as ChiefAccountant of Sinopec Group GuangzhouPetrochemical Company. From February2000 to December 2001, he was DeputyDirector General of Financial AssetsDepartment of Sinopec Group Company.From December 2001 to March 2006, hewas Deputy Director General of FinancePlanning Department of Sinopec GroupCompany. In March 2006, he wasDirector General of Financial AssetsDepartment of Sinopec AssetsManagement Co.,Ltd.. Since March2006, he has been Director General ofAudit Department of Sinopec Corp.. Mr.Zou was elected as Supervisor of theThird Session of the Supervisory Boardof Sinopec Corp. in May 2006.
Li Yonggui, 66, Independent Supervisorof Sinopec Corp.. Mr. Li graduated fromShandong Institute of Finance andEconomics in July 1965, majoring intreasury finance. He is a senioreconomist and CPA, and has long beenengaged in tax management withextensive management experience intaxation. From February 1985 toDecember 1988, he was Deputy Director-General of Taxation Bureau of Ministryof Finance. He served as ChiefEconomist of State Administration ofTaxation from December 1988 to April
1991. From April 1991 to February 1995,he served as Deputy Director-General ofState Administration of Taxation. He wasChief Economist of State Administrationof Taxation from February 1995 toSeptember 2001. Mr. Li has beenChairman of Chinese Association ofCertified Public Taxation Experts sinceApril 2000. Mr. Li served as IndependentSupervisor of the Second Session ofSupervisory Board of Sinopec Corp. fromApril 2003 to May 2006; he was electedas Independent Supervisor of the ThirdSession of Supervisory Board of SinopecCorp. in May 2006.
Su Wensheng, 50, EmployeeRepresentative Supervisor of SinopecCorp.. Mr. Su graduated from the GeneralSection of Tsinghua University inDecember 1980 majoring inenvironmental engineering. He obtaineda master’s degree in managementscience and engineering from PetroleumUniversity (Beijing) in June 2000. He is asenior engineer. From September 1986to November 1996, he was DeputySecretary of Party Committee andSecretary of Disciplinary Committee ofBeijing Designing Institute of the formerSinopec Group Company. FromNovember 1996 to December 1998, hewas Secretary of Party Committee ofBeijing Designing Institute. Mr. Su hasbeen Director-General of Ideology &Politics Department and DeputySecretary of the Affiliated PartyCommittee of Sinopec Group Companysince December 1998. He has been
Managing Deputy Secretary of the PartyWorking Committee of the Western NewRegion Exploration Headquarter ofSinopec Group since December 2001.Mr. Su served as an EmployeeRepresentative Supervisor of the SecondSession of Supervisory Board of SinopecCorp. from April 2003 to May 2006; hewas elected as Employee RepresentativeSupervisor of the Third Session ofSupervisory Board of Sinopec Corp.in May 2006.
Zhang Jitian, 59, EmployeeRepresentative Supervisor of SinopecCorp.. Mr. Zhang graduated from HohhotTransportation Institute in July 1968specialising in road and bridgeconstruction, and he also graduated fromSinopec Management Institute in July1986 specialising in enterprisemanagement (undergraduate course). Heis a senior political engineer. FromAugust 1996 to December 1998, he wasDeputy Director of Personnel andEducational Department of the formerSinopec Group Company; fromDecember 1998 to September 2005, hewas Deputy Director of Personnel andEducational Department of SinopecGroup Company; he has been DeputyDirector (remunerate as Director) ofPersonnel Department of Sinopec Corp.since September 2005. Mr. Zhang waselected as Employee RepresentativeSupervisor of the Third Session ofSupervisory Board of Sinopec Corp.in May 2006.
Li Yonggui Su Wensheng Zhang JitianZou Huiping
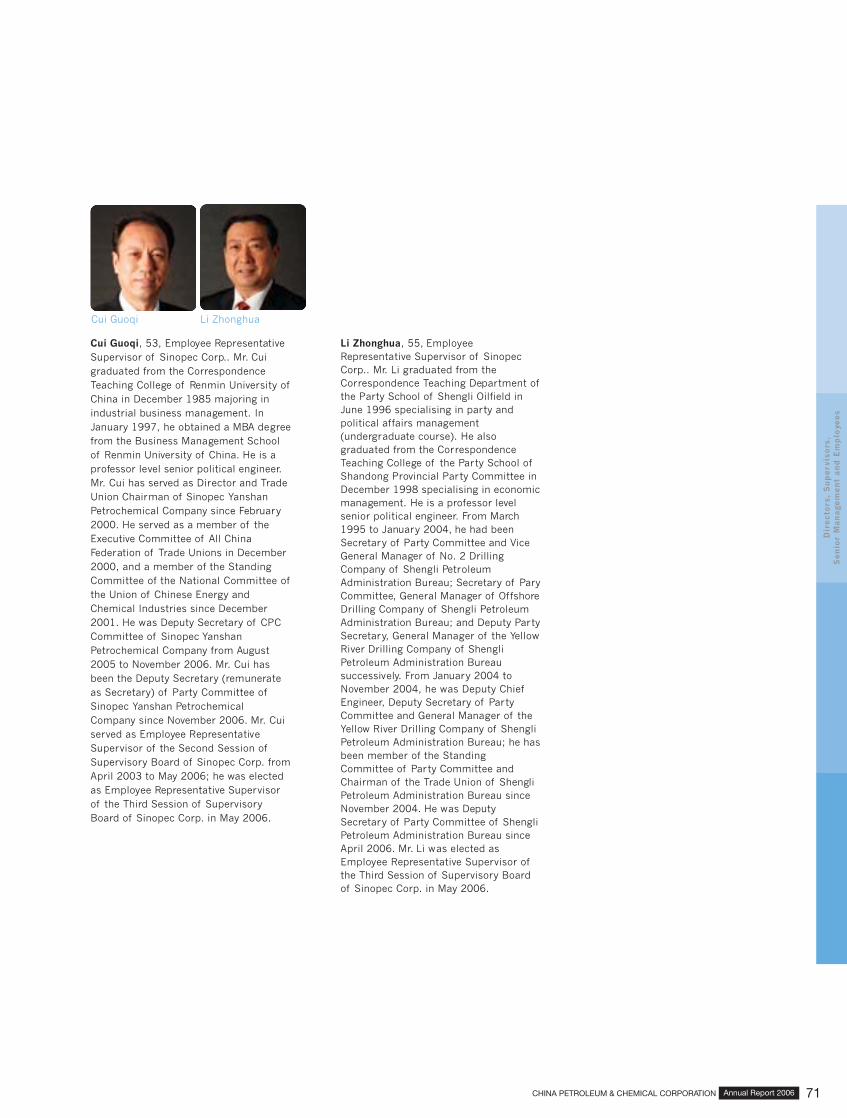
CHINA PETROLEUM & CHEMICAL CORPORATION Annual Report 2006 71
Dir
ect
ors
, S
up
erv
iso
rs,
Se
nio
r M
an
age
me
nt
an
d E
mp
loye
es
Cui Guoqi, 53, Employee RepresentativeSupervisor of Sinopec Corp.. Mr. Cuigraduated from the CorrespondenceTeaching College of Renmin University ofChina in December 1985 majoring inindustrial business management. InJanuary 1997, he obtained a MBA degreefrom the Business Management Schoolof Renmin University of China. He is aprofessor level senior political engineer.Mr. Cui has served as Director and TradeUnion Chairman of Sinopec YanshanPetrochemical Company since February2000. He served as a member of theExecutive Committee of All ChinaFederation of Trade Unions in December2000, and a member of the StandingCommittee of the National Committee ofthe Union of Chinese Energy andChemical Industries since December2001. He was Deputy Secretary of CPCCommittee of Sinopec YanshanPetrochemical Company from August2005 to November 2006. Mr. Cui hasbeen the Deputy Secretary (remunerateas Secretary) of Party Committee ofSinopec Yanshan PetrochemicalCompany since November 2006. Mr. Cuiserved as Employee RepresentativeSupervisor of the Second Session ofSupervisory Board of Sinopec Corp. fromApril 2003 to May 2006; he was electedas Employee Representative Supervisorof the Third Session of SupervisoryBoard of Sinopec Corp. in May 2006.
Li Zhonghua, 55, EmployeeRepresentative Supervisor of SinopecCorp.. Mr. Li graduated from theCorrespondence Teaching Department ofthe Party School of Shengli Oilfield inJune 1996 specialising in party andpolitical affairs management(undergraduate course). He alsograduated from the CorrespondenceTeaching College of the Party School ofShandong Provincial Party Committee inDecember 1998 specialising in economicmanagement. He is a professor levelsenior political engineer. From March1995 to January 2004, he had beenSecretary of Party Committee and ViceGeneral Manager of No. 2 DrillingCompany of Shengli PetroleumAdministration Bureau; Secretary of ParyCommittee, General Manager of OffshoreDrilling Company of Shengli PetroleumAdministration Bureau; and Deputy PartySecretary, General Manager of the YellowRiver Drilling Company of ShengliPetroleum Administration Bureausuccessively. From January 2004 toNovember 2004, he was Deputy ChiefEngineer, Deputy Secretary of PartyCommittee and General Manager of theYellow River Drilling Company of ShengliPetroleum Administration Bureau; he hasbeen member of the StandingCommittee of Party Committee andChairman of the Trade Union of ShengliPetroleum Administration Bureau sinceNovember 2004. He was DeputySecretary of Party Committee of ShengliPetroleum Administration Bureau sinceApril 2006. Mr. Li was elected asEmployee Representative Supervisor ofthe Third Session of Supervisory Boardof Sinopec Corp. in May 2006.
Cui Guoqi Li Zhonghua

CHINA PETROLEUM & CHEMICAL CORPORATIONAnnual Report 200672
DIRECTORS, SUPERVISORS, SENIOR MANAGEMENT AND EMPLOYEES (CONTINUED)
Dir
ect
ors
, S
up
erv
iso
rs,
Se
nio
r M
an
age
me
nt
an
d E
mp
loye
es
Supervisors of the Third Session of the Supervisory Board
Remuneration paidPosition with by the Company Whether paid by Shares Held at Sinopec Corp.
Name Gender Age Sinopec Corp. Term of Office in 2006 the shareholding from any shareholder(RMB) Company (at 31 December)
2006 2005Wang Zuoran M 56 Chairman of the 2006.5-2009.5 — YES 0 0
Supervisory BoardZhang Youcai M 65 Vice Chairman 2006.5-2009.5 109,000 (Fees) NO 0 0
Independent SupervisorKang Xianzhang M 58 Supervisor 2006.5-2009.5 — YES 0 0Zou Huiping M 46 Supervisor 2006.5-2009.5 101,964 NO 0 0Li Yonggui M 66 Independent Supervisor 2006.5-2009.5 121,000 (Fees) NO 0 0Su Wensheng M 50 Employee Representative 2006.5-2009.5 354,664 NO 0 0
SupervisorZhang Jitian M 59 Employee Representative 2006.5-2009.5 101,849 NO 0 0
SupervisorCui Guoqi M 53 Employee Representative 2006.5-2009.5 329,330 NO 0 0
SupervisorLi Zhonghua M 55 Employee Representative 2006.5-2009.5 94,570 NO 0 0
Supervisor
Supervisors of the Second Session of the Supervisory Board (who are no longer the supervisor of the Company)
Remuneration paidPosition with by the Company Whether paid by Shares Held at Sinopec Corp.
Name Gender Age Sinopec Corp. Term of Office in 2006 the shareholding from any shareholder(RMB) Company (at 31 December)
2006 2005Zhang Chongqing M 62 Supervisor 2003.4-2006.5 — YES 0 0Wang Peijun M 61 Supervisor 2003.4-2006.5 — YES 0 0Wang Xianwen M 62 Supervisor 2003.4-2006.5 — YES 0 0Zhang Baojian M 62 Supervisor 2003.4-2006.5 — YES 0 0Cui Jianmin M 74 Independent Supervisor 2003.4-2006. 5 9,000 (Fees) NO 0 0Zhang Xianglin M 60 Employee Representative 2003.4-2006.5 238,722 NO 0 0
Supervisor

CHINA PETROLEUM & CHEMICAL CORPORATION Annual Report 2006 73
Dir
ect
ors
, S
up
erv
iso
rs,
Se
nio
r M
an
age
me
nt
an
d E
mp
loye
es
(3) Other Members of the SeniorManagementCai Xiyou, 45, Senior Vice President ofSinopec Corp.. Mr. Cai graduated fromFushun Petroleum Institute in August1982 majoring in petroleum refiningautomation, and obtained a MBA degreefrom China Industry and Science DalianTraining Center in October 1990. He is asenior economist. From June 1995 toMay 1996, he was Deputy GeneralManager of Jinzhou PetrochemicalCompany of the former Sinopec GroupCompany. From May 1996 to December1998, he was Deputy General Managerof Dalian Western Pacific PetrochemicalCo., Ltd (WEPEC). From December 1998to June 2001, he was Deputy GeneralManager of Sinopec Sales Company, andfrom June 2001 to December 2001, hewas Executive Deputy Manager ofSinopec Sales Company. He has beenDirector and General Manager of ChinaInternational United PetrochemicalCompany Limited (UNIPEC) fromDecember 2001 to December 2005. Hewas Vice President of Sinopec Corp.from April 2003 to November 2005. Mr.Cai has been Senior Vice President ofSinopec Corp. since November 2005.
Zhang Kehua, 53, Vice President ofSinopec Corp.. Mr Zhang graduated fromShanghai Chemical EngineeringUniversity in January 1980 majoring inchemical and mechanical engineering.He is a senior engineer and had hismaster’s degree from University ofPetroleum majoring in managementscience and engineering in December2000. He was Deputy Manager of No. 3Construction Company of the formerSinopec Group Company from February1994 to April 1996. From April 1996 toDecember 1998, he was Deputy DirectorGeneral (Deputy Manager of SinopecEngineering Incorporation) of theEngineering Department of the formerSinopec Group Company. He was DeputyDirector General of the formerEngineering Department of Sinopec
Group Company from December 1998 toDecember 2001 and was Deputy DirectorGeneral of Engineering Department ofSinopec Group Company from December2001 to September 2002. Mr. Zhang wasDirector General of EngineeringDepartment of Sinopec Group Companyfrom September 2002 to October 2004.Mr. Zhang has served as the Assistant tothe President of Sinopec Group Companyand Director General of EngineeringDepartment since October 2004. Mr.Zhang has been Vice President ofSinopec Corp. since May 2006.
Zhang Haichao, 49, Vice President ofSinopec Corp.. Mr. Zhang graduated fromZhoushan Commercial and TechnicalSchool in December 1979, specialising inoil storage and transportation. He alsograduated from Jilin PetrochemicalInstitute in July 1985 specialising inrecycling of lubricating oil. From January2001 to June 2002, he participated inthe business administration programmeat Macau Science & TechnologyUniversity. He is an economist. He servedas Deputy General Manager of ZhejiangPetroleum Company from March 1998 toSeptember 1999. He served as GeneralManager of Zhejiang Petroleum Companyfrom September 1999 to February 2000,and has served as Manager of SinopecZhejiang Petroleum Company fromFebruary 2000 to September 2005. Hehas been Chairman of Sinopec-BPZhejiang Petroleum Sales Co., Ltd. sinceApril 2004. He was Secretary of the CPCParty Committee, Vice Chairman andDeputy General Manager of SinopecSales Co., Ltd. from October 2004 toNovember 2005. He was Secretary ofCPC Pary Committee, Chairman andGeneral Manager of Sinopec Sales Co.,Ltd. from November 2005 to June 2006.He has been Chairman and GeneralManager of Sinopec Sales Co., Ltd. sinceJune 2006. He served as EmployeeRepresentative Supervisor of the SecondSession of the Supervisory Board ofSinopec Corp. from April 2003 to
November 2005. Mr. Zhang has beenVice President of Sinopec Corp. sinceNovember 2005.
Jiao Fangzheng, 44, Vice President ofSinopec Corp.. Mr. Jiao won hisbachelor’s degree in petroleumexploration and won his doctoral degreein natural gas engineering fromSouthwest Petroleum Instituterespectively in July 1983 and November2000. Mr. Jiao is a professor level seniorengineer. From January 1999 to February2000, he was Chief Geologist ofZhongyuan Petroleum ExplorationBureau of Sinopec Group Company. Hethen served as Deputy Manager andChief Geologist of Zhongyuan OilfieldCompany of Sinopec Group Companyfrom February 2000 to February 2001.He was Vice President of SinopecExploration and Production ResearchInstitute from July 2000 to March 2001.He then served as Deputy DirectorGeneral of Sinopec Oilfield E & PDepartment from March 2001 to June2004. Since June 2004, he served asManager of the Northwest Company ofSinopec Group Company. Mr. Jiao hasserved as Vice President of SinopecCorp. since October 2006.
Chen Ge, 44, Secretary to the Board ofDirectors of Sinopec Corp.. Mr. Chengraduated from Daqing PetroleumInstitute in July 1983 majoring inpetroleum refining, and then obtained hisMBA degree from Dalian University ofScience and Technology in July 1996. Heis a senior economist. From July 1983 toFebruary 2000, he worked in BeijingYanshan Petrochemical Company. FromFebruary 2000 to December 2001, hewas Deputy Director General of theBoard Secretariat of Sinopec Corp.. Mr.Chen has been Director General of theBoard Secretariat since December 2001.Mr. Chen has been the Secretary to theBoard of Directors of Sinopec Corp.since April 2003.
Cai Xiyou Zhang Kehua Zhang Haichao Jiao Fangzheng Chen Ge

CHINA PETROLEUM & CHEMICAL CORPORATIONAnnual Report 200674
DIRECTORS, SUPERVISORS, SENIOR MANAGEMENT AND EMPLOYEES (CONTINUED)
Dir
ect
ors
, S
up
erv
iso
rs,
Se
nio
r M
an
age
me
nt
an
d E
mp
loye
es
Other Members of the Senior Management
Remuneration paidPosition with by the Company Whether paid by Shares Held at Sinopec Corp.
Name Gender Age Sinopec Corp. Term of Office in 2006 the shareholding from any shareholder(RMB) Company (at 31 December)
2006 2005Cai Xiyou M 45 Senior Vice President 2005.11- 518,360 NO 0 0Zhang Kehua M 53 Vice President 2006.5- 123,129 NO 0 0Zhang Haichao M 49 Vice President 2005.11- 415,459 NO 0 0Jiao Fangzheng M 44 Vice President 2006.10- 34,921 NO 0 0Chen Ge M 44 Secretary to the 2006.5-2009.5 354,664 NO 0 0
Board of Directors
2 NEW APPOINTMENT OR TERMINATION OFDIRECTORS, SUPERVISORS AND SENIORMANAGEMENTMr. Chen Tonghai, Mr. Zhou Yuan, Mr. WangTianpu, Mr. Zhang Jianhua, Mr. WangZhigang, Mr. Dai Houliang, Mr. Liu Zhongli(Independent Non-Executive Director), Mr.Shi Wanpeng (Independent Non-ExecutiveDirector), Mr. Li Deshui (Independent Non-Executive Director), Mr. Yao Zhongmin andMr. Fan Yifei were elected as Directors of theThird Session of the Board of Directors atthe 2005 Annual General Meeting of SinopecCorp.. Former Vice Chairman Mr. WangJiming, and Director Mr. Mou Shuling, Mr.Zhang Jiaren, Mr. Cao Xianghong, Mr. LiuGenyuan, Mr. Gao Jian, Mr. Chen Qingtai, Mr.He Zhuguo, Mr. Zhang Youcai and Mr. CaoYaofeng of the Second Session of the Boardof Directors of Sinopec Corp. no longer takethe office.
Mr. Wang Zuoran, Mr. Zhang Youcai, Mr.Kang Xianzhang, Mr. Zou Huiping and Mr. LiYonggui were elected as Supervisors of theSecond Session of the Supervisory Board. Inaddition, Mr. Su Wensheng, Mr. Zhang Jitian,
Mr. Cui Guoqi and Mr. Li Zhonghua weredemocratically selected among employeesof Sinopec Corp. as EmployeeRepresentative Supervisors. Mr. ZhangChongqing, Mr. Wang Peijun, Mr. WangXianwen, Mr. Zhang Baojian, Mr. Cui Jianminand Mr. Zhang Xianglin of the SecondSession of the Supervisory Board are nolonger supervisors of Sinopec Corp..
Mr. Chen Tonghai was selected as Chairmanof the Board, Mr. Zhou Yuan as ViceChairman, Mr. Wang Tianpu as President,and Mr. Zhang Jianhua, Mr. Wang Zhigang,Mr. Cai Xiyou and Mr. Dai Houliang as SeniorVice Presidents, Mr. Dai Houliang as ChiefFinancial Officer (concurrently), Mr. ZhangKehua and Mr. Zhang Haichao as VicePresident, and Mr. Chen Ge as Secretary ofthe Board at the First Meeting of the ThirdSession of the Board of Directors ofSinopec Corp..
Mr. Wang Zuoran was elected as Chairmanof the Supervisory Board and Mr. ZhangYoucai as Vice Chairman at the First Meetingof the Third Session of the Board ofDirectors of Sinopec Corp..
Mr. Jiao Fangzheng was elected as VicePresident of Sinopec Corp. at the FifthMeeting of the Third Session of the Board ofDirectors of Sinopec Corp..
3 INTERESTS OF DIRECTORS, SUPERVISORSAND OTHER MEMBERS OF THE SENIORMANAGEMENT IN THE SHARE CAPITAL OFSINOPEC CORP.Please refer to the section of this reportentitled “Significant Events”.
4 DIRECTORS’ OR SUPERVISORS’INTERESTS IN CONTRACTSNone of the Directors nor the Supervisors ofSinopec Corp. had any beneficial interests inany material contracts to which SinopecCorp., its holding company or any of itssubsidiaries or fellow subsidiaries was aparty at 31 December 2006 or at any timeduring the year.
5 SALARIES OF DIRECTORS, SUPERVISORSAND THE SENIOR MANAGEMENTPlease refer to the related tables in thisreport in respect of the directors,supervisors and other senior management.

CHINA PETROLEUM & CHEMICAL CORPORATION Annual Report 2006 75
Dir
ect
ors
, S
up
erv
iso
rs,
Se
nio
r M
an
age
me
nt
an
d E
mp
loye
es
6. THE COMPANY’S EMPLOYEESAs at 31 December 2006, the Company had a total of 340,886 employees.
Breakdown according to operation department structures
Number of Percentage toEmployees Total Employees (%)
Exploration and Production 112,702 33.1Refining 81,352 23.8Marketing and Distribution 61,269 18.0Chemicals 77,185 22.6R&D and Others 8,378 2.5Total 340,886 100
Breakdown according to functions
Number of Percentage toEmployees Total Employees (%)
Production 173,415 50.9Sales 60,479 17.7Technical 44,525 13.1Finance 8,991 2.6Administration 27,270 8.0Others 26,206 7.7Total 340,886 100
Breakdown according to education level
Number of Percentage toEmployees Total Employees (%)
Master’s degree or above 4,392 1.3University 54,764 16.1Tertiary education 72,728 21.3Technical/polytechnic school 34,416 10.1Secondary, technical/polytechnic school or below 174,586 51.2Total 340,886 100
7 EMPLOYEES’ PENSION SCHEMEDetails of the employees’ pension scheme of the Company are set out in note 37 to the financialstatements prepared under IFRS which are contained in this annual report. As at 31 December2006, the Company had a total of 121,616 retired employees. All of them participate in thebasic pension schemes administered by provincial (autonomous regions and municipalities)governments. Government-administered pension schemes are responsible for the payments ofbasic pensions.

CHINA PETROLEUM & CHEMICAL CORPORATIONAnnual Report 200676
PRINCIPAL WHOLLY-OWNED, CONTROLLING AND NON WHOLLY-OWNED SUBSIDIARIES
Pri
nci
pa
l W
ho
lly-
own
ed
, C
on
tro
llin
g a
nd
No
n W
ho
lly-
Ow
ne
d S
ub
sid
iari
es
At 31 December 2006, details of the principal wholly-owned and non wholly-owned subsidiaries of the Company were as follows.
Percentage ofRegistered shares held by Total
Name of company capital Sinopec Corp. assets Net profit Auditor Principal activitiesRMB millions (%) RMB millions RMB millions
China International United 223 100.00 35,261 340 KPMG Trading of crude oil andPetroleum and Chemical Huazhen petrochemical productsCompany Limited
Sinopec Shanghai Petrochemical 7,200 55.56 27,684 737 KPMG Manufacturing of syntheticCompany Limited Huazhen fibers, resin and plastics,
intermediate petrochemicalproducts andpetroleum products
Sinopec Sales Company Limited 1,700 100.00 33,126 9,064 KPMG Marketing and distribution ofHuazhen refined oil products
Sinopec Yangzi Petrochemical 2,330 99.81 19,937 2,032 KPMG Manufacturing of intermediateCompany Limited Huazhen petrochemical products and
petroleum productsSinopec Zhenhai Refining and 2,524 100.00 17,642 1,071 KPMG Manufacturing of intermediate
Chemical Company Limited Huazhen petrochemical products andpetroleum products
Sinopec Hainan Refining 3,986 75.00 12,010 (1,500) KPMG Manufacturing of intermediateand Chemical Company Limited Huazhen petrochemical products and
petroleum productsSinopec Qilu Petrochemical 1,950 99.76 11,539 1,485 KPMG Manufacturing of intermediate
Company Limited Huazhen petrochemical products andpetroleum products
Sinopec Yizheng Chemical 4,000 42.00 10,116 37 KPMG Production and sale ofFibre Company Limited Huazhen polyester chips and
polyester fibresChina Petrochemical International 1,663 100.00 8,931 231 KPMG Trading of petrochemical
Company Limited Huazhen productsSinopec Zhongyuan Petroleum 875 99.35 6,663 897 KPMG Exploration and production
Company Limited Huazhen of crude oil and naturalgas
Sinopec Fujian Petrochemical 2,253 50.00 6,608 (584) KPMG Manufacturing of plastics,Company Limited Huazhen intermediate petrochemical
products and petroleumproducts
Sinopec Kantons Holdings Limited 104 72.40 4,171 157 KPMG Trading of crude oil andRMB millions RMB millions RMB millions petroleum products
Sinopec Qingdao Refining and 800 85.00 3,516 — KPMG Manufacturing of intermediateChemical Company Limited Huazhen petrochemical products
and petroleum productsSinopec Shijiazhuang Refining Chemical 1,154 79.73 2,792 (1,602) KPMG Manufacturing of
Company Limited Huazhen intermediate petrochemicalproducts and petroleumproducts
Sinopec Zhongyuan Petrochemical 2,400 93.51 2,429 508 KPMG Manufacturing ofCompany Limited Huazhen chemical products
Sinopec Shell (Jiangsu) 830 60.00 1,271 57 KPMG Marketing and distributionPetroleum Marketing Company Limited Huazhen of refined petroleum
productsBP Sinopec (Zhejiang) 800 60.00 919 44 KPMG Marketing and distribution
Petroleum Company Limited Huazhen of refined petroleumproducts
Sinopec Wuhan Petroleum Group 147 46.25 609 40 Wuhan Marketing and distributionCompany Limited Zhonghuan of refined petroleum
CPA Company productsLimited
The above indicated total assets and net profit has been prepared in accordance with the PRC Accounting Rules and Regulations. Except for SinopecKantons Holdings Limited, which is incorporated in Bermuda, all of the above wholly-owned and non wholly-owned subsidiaries are incorporated in thePRC. The above wholly-owned and non wholly-owned subsidiaries are limited liability companies. The Directors considered that it would be redundantto disclose the particulars of all subsidiaries and, therefore, only those which have a material impact on Sinopec Corp.’s results or net assets are setout above.
CHINA PETROLEUM & CHEMICAL CORPORATION Annual Report 2006 77
Fina
ncia
l S
tate
men
ts (
PR
C)
REPORT OF THE PRC AUDITORS
Huazhen
To the Shareholders of China Petroleum & Chemical Corporation:
We have audited the accompanying financial statements of China Petroleum & Chemical Company (the “Company”), which comprise the consolidatedbalance sheet and balance sheet as at 31 December 2006, and the consolidated income statement and profit appropriation statement, income statementand profit appropriation statement, consolidated cash flow statement and cash flow statement for the year ended 31 December 2006, and notes to thefinancial statements.
1. Management’s Responsibility for the Financial Statements
The Company’s management is responsible for the preparation of these financial statements in accordance with the Accounting Standards for BusinessEnterprises and the Accounting Regulations for Business Enterprises issued by the Ministry of Finance of the People’s Republic of China. This responsibilityincludes: (1) designing, implementing and maintaining internal control relevant to the preparation of financial statements that are free from materialmisstatement, whether due to fraud or error; (2) selecting and applying appropriate accounting policies; and (3) making accounting estimates that arereasonable.
2. Auditors’ Responsibility
Our responsibility is to express an opinion on these financial statements based on our audit. We conducted our audit in accordance with China’s AuditingStandards for the Certified Public Accountants. Those standards require that we comply with ethical requirements and plan and perform the audit toobtain reasonable assurance whether the financial statements are free from material misstatement.
An audit involves performing procedures to obtain audit evidence about the amounts and disclosures in the financial statements. The procedures selecteddepend on the auditors’ judgment, including the assessment of the risks of material misstatement of the financial statements, whether due to fraud orerror. In making those risk assessments, the auditors consider internal control relevant to the entity’s preparation of the financial statements in order todesign audit procedures that are appropriate in the circumstances, but not for the purpose of expressing an opinion on the effectiveness of the entity’sinternal control. An audit also includes evaluating the appropriateness of accounting policies used and the reasonableness of accounting estimates madeby management, as well as evaluating the overall presentation of the financial statements.
We believe that the audit evidence we have obtained is sufficient and appropriate to provide a basis for our audit opinion.
3. Opinion
In our opinion, the financial statements comply with the requirements of the Accounting Standards for Business Enterprises and the Accounting Regulationsfor Business Enterprises issued by the Ministry of Finance of the People’s Republic of China and present fairly, in all material respects, the Company’sconsolidated financial position and financial position as at 31 December 2006, and the consolidated results of operations, results of operations, consolidatedcash flows and cash flows for the year ended 31 December 2006.
KPMG Huazhen Certified Public AccountantsRegistered in the People’s Republic of China
Wu WeiZhang Jingjing
Beijing, The People’s Republic of China6 April 2007

CHINA PETROLEUM & CHEMICAL CORPORATIONAnnual Report 200678
(A) FINANCIAL STATEMENTS PREPARED UNDER THE PRC ACCOUNTING RULES AND REGULATIONSCONSOLIDATED BALANCE SHEETat 31 December 2006
Fina
ncia
l S
tate
men
ts (
PR
C)
Note 2006 2005RMB millions RMB millions
AssetsCurrent assets
Cash at bank and in hand 4 8,723 14,747Bills receivable 5 8,757 7,143Trade accounts receivable 6 15,590 14,532Other receivables 7 10,597 11,487Advance payments 8 5,392 5,051Inventories 9 93,041 88,936
Total current assets 142,100 141,896--- - - - - - - - - - - - - - - - - - - - - - - - - - - - - - - - - - - - - - - - - - - - - - - - - - - - - - - - - - - - - - - - - - - - - - - - - - - - - - - - - - - - - - - - - - - - - - - - - - - - - - - - - - - - - - - - - - - - - - - - - - - - - - - - - - - - - - - - - - - - - - - - - - - - - - - - - - - - - - - - - - - - - - - - - - - - - - - - - - - - - - - - - - - - - - - - - - - - - - - - - - - - - - - - - - - - - - - - - - - - - - - - - - - - - - - - - - - - - - - - - - - - - - - - - - - - - - - - - - - - - - - - - - - - - - - - - - -
Long-term equity investments (Including equity investment differences ofRMB 13,322 million (2005: RMB 2,003 million)) 10 27,483 14,146
--- - - - - - - - - - - - - - - - - - - - - - - - - - - - - - - - - - - - - - - - - - - - - - - - - - - - - - - - - - - - - - - - - - - - - - - - - - - - - - - - - - - - - - - - - - - - - - - - - - - - - - - - - - - - - - - - - - - - - - - - - - - - - - - - - - - - - - - - - - - - - - - - - - - - - - - - - - - - - - - - - - - - - - - - - - - - - - - - - - - - - - - - - - - - - - - - - - - - - - - - - - - - - - - - - - - - - - - - - - - - - - - - - - - - - - - - - - - - - - - - - - - - - - - - - - - - - - - - - - - - - - - - - - - - - - - - - - -
Fixed assetsFixed assets, at cost 650,689 572,465Less: Accumulated depreciation 291,151 265,611Net book value of fixed assets before impairment losses 11 359,538 306,854Less: Provision for impairment losses on fixed assets 11 6,025 6,234Net book value of fixed assets 353,513 300,620Construction materials 12 413 555Construction in progress 13 52,757 48,073
Total fixed assets 406,683 349,248--- - - - - - - - - - - - - - - - - - - - - - - - - - - - - - - - - - - - - - - - - - - - - - - - - - - - - - - - - - - - - - - - - - - - - - - - - - - - - - - - - - - - - - - - - - - - - - - - - - - - - - - - - - - - - - - - - - - - - - - - - - - - - - - - - - - - - - - - - - - - - - - - - - - - - - - - - - - - - - - - - - - - - - - - - - - - - - - - - - - - - - - - - - - - - - - - - - - - - - - - - - - - - - - - - - - - - - - - - - - - - - - - - - - - - - - - - - - - - - - - - - - - - - - - - - - - - - - - - - - - - - - - - - - - - - - - - - -
Intangible assets and other assetsIntangible assets 14 6,676 5,924Long-term deferred expenses 15 4,898 3,657
Total intangible assets and other assets 11,574 9,581--- - - - - - - - - - - - - - - - - - - - - - - - - - - - - - - - - - - - - - - - - - - - - - - - - - - - - - - - - - - - - - - - - - - - - - - - - - - - - - - - - - - - - - - - - - - - - - - - - - - - - - - - - - - - - - - - - - - - - - - - - - - - - - - - - - - - - - - - - - - - - - - - - - - - - - - - - - - - - - - - - - - - - - - - - - - - - - - - - - - - - - - - - - - - - - - - - - - - - - - - - - - - - - - - - - - - - - - - - - - - - - - - - - - - - - - - - - - - - - - - - - - - - - - - - - - - - - - - - - - - - - - - - - - - - - - - - - -
Deferred tax assets 16 6,710 5,701--- - - - - - - - - - - - - - - - - - - - - - - - - - - - - - - - - - - - - - - - - - - - - - - - - - - - - - - - - - - - - - - - - - - - - - - - - - - - - - - - - - - - - - - - - - - - - - - - - - - - - - - - - - - - - - - - - - - - - - - - - - - - - - - - - - - - - - - - - - - - - - - - - - - - - - - - - - - - - - - - - - - - - - - - - - - - - - - - - - - - - - - - - - - - - - - - - - - - - - - - - - - - - - - - - - - - - - - - - - - - - - - - - - - - - - - - - - - - - - - - - - - - - - - - - - - - - - - - - - - - - - - - - - - - - - - - - - -
Total assets 594,550 520,572Liabilities and shareholders’ fundsCurrent liabilities
Short-term loans 17 30,515 16,124Bills payable 18 21,685 23,243Trade accounts payable 19 52,125 52,967Receipts in advance 20 19,689 14,086Wages payable 3,194 3,436Staff welfare payable 969 1,052Taxes payable 21 11,348 5,262Other payables 22 3,731 1,830Other creditors 23 36,065 24,161Accrued expenses 24 264 512Short-term debentures payable 27 11,885 9,921Current portion of long-term loans 25 16,360 15,198
Total current liabilities 207,830 167,792--- - - - - - - - - - - - - - - - - - - - - - - - - - - - - - - - - - - - - - - - - - - - - - - - - - - - - - - - - - - - - - - - - - - - - - - - - - - - - - - - - - - - - - - - - - - - - - - - - - - - - - - - - - - - - - - - - - - - - - - - - - - - - - - - - - - - - - - - - - - - - - - - - - - - - - - - - - - - - - - - - - - - - - - - - - - - - - - - - - - - - - - - - - - - - - - - - - - - - - - - - - - - - - - - - - - - - - - - - - - - - - - - - - - - - - - - - - - - - - - - - - - - - - - - - - - - - - - - - - - - - - - - - - - - - - - - - - -
Long-term liabilitiesLong-term loans 26 105,565 103,492Debentures payable 27 3,500 3,500Other long-term liabilities 28 795 782
Total long-term liabilities 109,860 107,774--- - - - - - - - - - - - - - - - - - - - - - - - - - - - - - - - - - - - - - - - - - - - - - - - - - - - - - - - - - - - - - - - - - - - - - - - - - - - - - - - - - - - - - - - - - - - - - - - - - - - - - - - - - - - - - - - - - - - - - - - - - - - - - - - - - - - - - - - - - - - - - - - - - - - - - - - - - - - - - - - - - - - - - - - - - - - - - - - - - - - - - - - - - - - - - - - - - - - - - - - - - - - - - - - - - - - - - - - - - - - - - - - - - - - - - - - - - - - - - - - - - - - - - - - - - - - - - - - - - - - - - - - - - - - - - - - - - -
Total liabilities 317,690 275,566--- - - - - - - - - - - - - - - - - - - - - - - - - - - - - - - - - - - - - - - - - - - - - - - - - - - - - - - - - - - - - - - - - - - - - - - - - - - - - - - - - - - - - - - - - - - - - - - - - - - - - - - - - - - - - - - - - - - - - - - - - - - - - - - - - - - - - - - - - - - - - - - - - - - - - - - - - - - - - - - - - - - - - - - - - - - - - - - - - - - - - - - - - - - - - - - - - - - - - - - - - - - - - - - - - - - - - - - - - - - - - - - - - - - - - - - - - - - - - - - - - - - - - - - - - - - - - - - - - - - - - - - - - - - - - - - - - - -
Minority interests 21,985 29,383--- - - - - - - - - - - - - - - - - - - - - - - - - - - - - - - - - - - - - - - - - - - - - - - - - - - - - - - - - - - - - - - - - - - - - - - - - - - - - - - - - - - - - - - - - - - - - - - - - - - - - - - - - - - - - - - - - - - - - - - - - - - - - - - - - - - - - - - - - - - - - - - - - - - - - - - - - - - - - - - - - - - - - - - - - - - - - - - - - - - - - - - - - - - - - - - - - - - - - - - - - - - - - - - - - - - - - - - - - - - - - - - - - - - - - - - - - - - - - - - - - - - - - - - - - - - - - - - - - - - - - - - - - - - - - - - - - - -
Shareholders’ fundsShare capital 29 86,702 86,702Capital reserve 30 37,607 37,121Surplus reserves 31 59,094 34,028Unrecognised investment losses (1,221) (594)Retained profits (Including dividend proposed after the balance sheet date
in respect of year 2006 of RMB 9,537 million (2005: RMB 7,803 million)) 40 72,693 58,366Total shareholders’ funds 254,875 215,623--- - - - - - - - - - - - - - - - - - - - - - - - - - - - - - - - - - - - - - - - - - - - - - - - - - - - - - - - - - - - - - - - - - - - - - - - - - - - - - - - - - - - - - - - - - - - - - - - - - - - - - - - - - - - - - - - - - - - - - - - - - - - - - - - - - - - - - - - - - - - - - - - - - - - - - - - - - - - - - - - - - - - - - - - - - - - - - - - - - - - - - - - - - - - - - - - - - - - - - - - - - - - - - - - - - - - - - - - - - - - - - - - - - - - - - - - - - - - - - - - - - - - - - - - - - - - - - - - - - - - - - - - - - - - - - - - - - -
Total liabilities and shareholders’ funds 594,550 520,572
These financial statements have been approved by the board of directors on 6 April 2007.
Chen Tonghai Wang Tianpu Dai Houliang Liu YunChairman Director, Director, Head of Corporate Finance(Authorised representative) President Senior Vice President and Department
Chief Financial Officer
The notes on pages 86 to 115 form part of these financial statements.
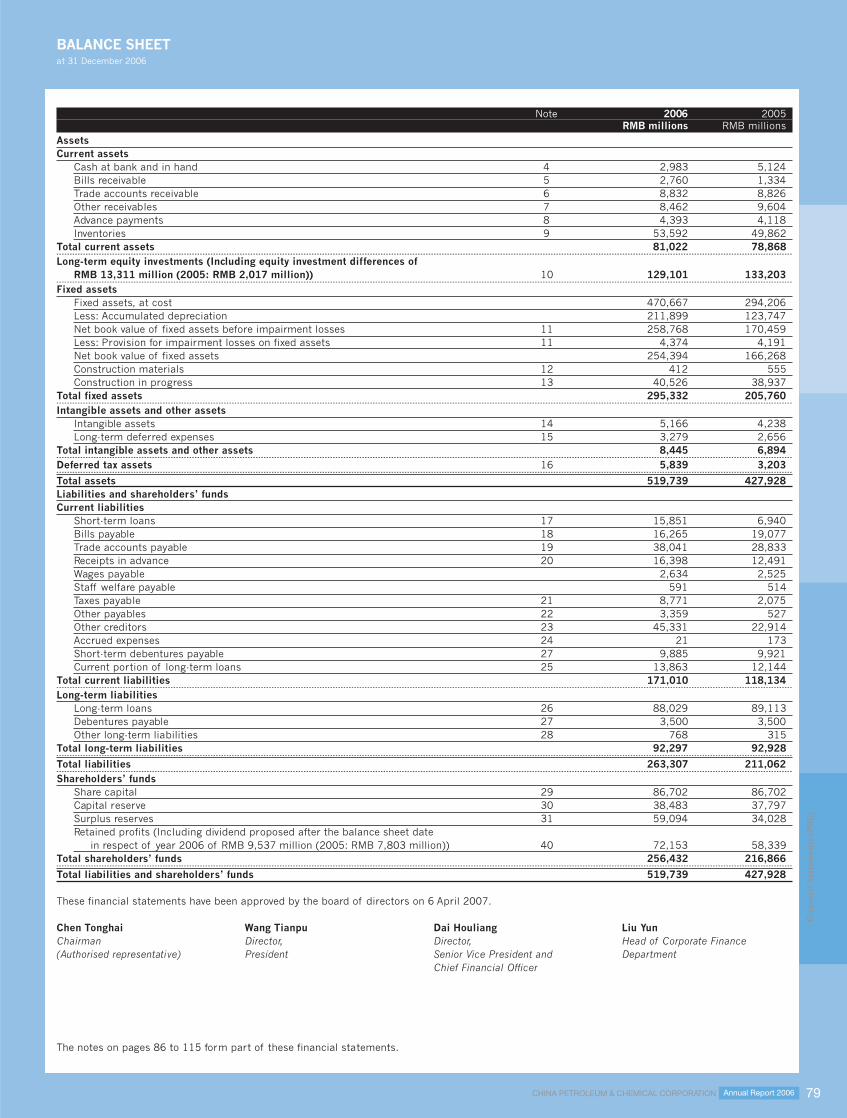
CHINA PETROLEUM & CHEMICAL CORPORATION Annual Report 2006 79
BALANCE SHEETat 31 December 2006
Fina
ncia
l S
tate
men
ts (
PR
C)
Note 2006 2005RMB millions RMB millions
AssetsCurrent assets
Cash at bank and in hand 4 2,983 5,124Bills receivable 5 2,760 1,334Trade accounts receivable 6 8,832 8,826Other receivables 7 8,462 9,604Advance payments 8 4,393 4,118Inventories 9 53,592 49,862
Total current assets 81,022 78,868--- - - - - - - - - - - - - - - - - - - - - - - - - - - - - - - - - - - - - - - - - - - - - - - - - - - - - - - - - - - - - - - - - - - - - - - - - - - - - - - - - - - - - - - - - - - - - - - - - - - - - - - - - - - - - - - - - - - - - - - - - - - - - - - - - - - - - - - - - - - - - - - - - - - - - - - - - - - - - - - - - - - - - - - - - - - - - - - - - - - - - - - - - - - - - - - - - - - - - - - - - - - - - - - - - - - - - - - - - - - - - - - - - - - - - - - - - - - - - - - - - - - - - - - - - - - - - - - - - - - - - - - - - - - - - - - - - - -
Long-term equity investments (Including equity investment differences ofRMB 13,311 million (2005: RMB 2,017 million)) 10 129,101 133,203
--- - - - - - - - - - - - - - - - - - - - - - - - - - - - - - - - - - - - - - - - - - - - - - - - - - - - - - - - - - - - - - - - - - - - - - - - - - - - - - - - - - - - - - - - - - - - - - - - - - - - - - - - - - - - - - - - - - - - - - - - - - - - - - - - - - - - - - - - - - - - - - - - - - - - - - - - - - - - - - - - - - - - - - - - - - - - - - - - - - - - - - - - - - - - - - - - - - - - - - - - - - - - - - - - - - - - - - - - - - - - - - - - - - - - - - - - - - - - - - - - - - - - - - - - - - - - - - - - - - - - - - - - - - - - - - - - - - -
Fixed assetsFixed assets, at cost 470,667 294,206Less: Accumulated depreciation 211,899 123,747Net book value of fixed assets before impairment losses 11 258,768 170,459Less: Provision for impairment losses on fixed assets 11 4,374 4,191Net book value of fixed assets 254,394 166,268Construction materials 12 412 555Construction in progress 13 40,526 38,937
Total fixed assets 295,332 205,760--- - - - - - - - - - - - - - - - - - - - - - - - - - - - - - - - - - - - - - - - - - - - - - - - - - - - - - - - - - - - - - - - - - - - - - - - - - - - - - - - - - - - - - - - - - - - - - - - - - - - - - - - - - - - - - - - - - - - - - - - - - - - - - - - - - - - - - - - - - - - - - - - - - - - - - - - - - - - - - - - - - - - - - - - - - - - - - - - - - - - - - - - - - - - - - - - - - - - - - - - - - - - - - - - - - - - - - - - - - - - - - - - - - - - - - - - - - - - - - - - - - - - - - - - - - - - - - - - - - - - - - - - - - - - - - - - - - -
Intangible assets and other assetsIntangible assets 14 5,166 4,238Long-term deferred expenses 15 3,279 2,656
Total intangible assets and other assets 8,445 6,894--- - - - - - - - - - - - - - - - - - - - - - - - - - - - - - - - - - - - - - - - - - - - - - - - - - - - - - - - - - - - - - - - - - - - - - - - - - - - - - - - - - - - - - - - - - - - - - - - - - - - - - - - - - - - - - - - - - - - - - - - - - - - - - - - - - - - - - - - - - - - - - - - - - - - - - - - - - - - - - - - - - - - - - - - - - - - - - - - - - - - - - - - - - - - - - - - - - - - - - - - - - - - - - - - - - - - - - - - - - - - - - - - - - - - - - - - - - - - - - - - - - - - - - - - - - - - - - - - - - - - - - - - - - - - - - - - - - -
Deferred tax assets 16 5,839 3,203--- - - - - - - - - - - - - - - - - - - - - - - - - - - - - - - - - - - - - - - - - - - - - - - - - - - - - - - - - - - - - - - - - - - - - - - - - - - - - - - - - - - - - - - - - - - - - - - - - - - - - - - - - - - - - - - - - - - - - - - - - - - - - - - - - - - - - - - - - - - - - - - - - - - - - - - - - - - - - - - - - - - - - - - - - - - - - - - - - - - - - - - - - - - - - - - - - - - - - - - - - - - - - - - - - - - - - - - - - - - - - - - - - - - - - - - - - - - - - - - - - - - - - - - - - - - - - - - - - - - - - - - - - - - - - - - - - - -
Total assets 519,739 427,928Liabilities and shareholders’ fundsCurrent liabilities
Short-term loans 17 15,851 6,940Bills payable 18 16,265 19,077Trade accounts payable 19 38,041 28,833Receipts in advance 20 16,398 12,491Wages payable 2,634 2,525Staff welfare payable 591 514Taxes payable 21 8,771 2,075Other payables 22 3,359 527Other creditors 23 45,331 22,914Accrued expenses 24 21 173Short-term debentures payable 27 9,885 9,921Current portion of long-term loans 25 13,863 12,144
Total current liabilities 171,010 118,134--- - - - - - - - - - - - - - - - - - - - - - - - - - - - - - - - - - - - - - - - - - - - - - - - - - - - - - - - - - - - - - - - - - - - - - - - - - - - - - - - - - - - - - - - - - - - - - - - - - - - - - - - - - - - - - - - - - - - - - - - - - - - - - - - - - - - - - - - - - - - - - - - - - - - - - - - - - - - - - - - - - - - - - - - - - - - - - - - - - - - - - - - - - - - - - - - - - - - - - - - - - - - - - - - - - - - - - - - - - - - - - - - - - - - - - - - - - - - - - - - - - - - - - - - - - - - - - - - - - - - - - - - - - - - - - - - - - -
Long-term liabilitiesLong-term loans 26 88,029 89,113Debentures payable 27 3,500 3,500Other long-term liabilities 28 768 315
Total long-term liabilities 92,297 92,928--- - - - - - - - - - - - - - - - - - - - - - - - - - - - - - - - - - - - - - - - - - - - - - - - - - - - - - - - - - - - - - - - - - - - - - - - - - - - - - - - - - - - - - - - - - - - - - - - - - - - - - - - - - - - - - - - - - - - - - - - - - - - - - - - - - - - - - - - - - - - - - - - - - - - - - - - - - - - - - - - - - - - - - - - - - - - - - - - - - - - - - - - - - - - - - - - - - - - - - - - - - - - - - - - - - - - - - - - - - - - - - - - - - - - - - - - - - - - - - - - - - - - - - - - - - - - - - - - - - - - - - - - - - - - - - - - - - -
Total liabilities 263,307 211,062--- - - - - - - - - - - - - - - - - - - - - - - - - - - - - - - - - - - - - - - - - - - - - - - - - - - - - - - - - - - - - - - - - - - - - - - - - - - - - - - - - - - - - - - - - - - - - - - - - - - - - - - - - - - - - - - - - - - - - - - - - - - - - - - - - - - - - - - - - - - - - - - - - - - - - - - - - - - - - - - - - - - - - - - - - - - - - - - - - - - - - - - - - - - - - - - - - - - - - - - - - - - - - - - - - - - - - - - - - - - - - - - - - - - - - - - - - - - - - - - - - - - - - - - - - - - - - - - - - - - - - - - - - - - - - - - - - - -
Shareholders’ fundsShare capital 29 86,702 86,702Capital reserve 30 38,483 37,797Surplus reserves 31 59,094 34,028Retained profits (Including dividend proposed after the balance sheet date
in respect of year 2006 of RMB 9,537 million (2005: RMB 7,803 million)) 40 72,153 58,339Total shareholders’ funds 256,432 216,866--- - - - - - - - - - - - - - - - - - - - - - - - - - - - - - - - - - - - - - - - - - - - - - - - - - - - - - - - - - - - - - - - - - - - - - - - - - - - - - - - - - - - - - - - - - - - - - - - - - - - - - - - - - - - - - - - - - - - - - - - - - - - - - - - - - - - - - - - - - - - - - - - - - - - - - - - - - - - - - - - - - - - - - - - - - - - - - - - - - - - - - - - - - - - - - - - - - - - - - - - - - - - - - - - - - - - - - - - - - - - - - - - - - - - - - - - - - - - - - - - - - - - - - - - - - - - - - - - - - - - - - - - - - - - - - - - - - -
Total liabilities and shareholders’ funds 519,739 427,928
These financial statements have been approved by the board of directors on 6 April 2007.
Chen Tonghai Wang Tianpu Dai Houliang Liu YunChairman Director, Director, Head of Corporate Finance(Authorised representative) President Senior Vice President and Department
Chief Financial Officer
The notes on pages 86 to 115 form part of these financial statements.
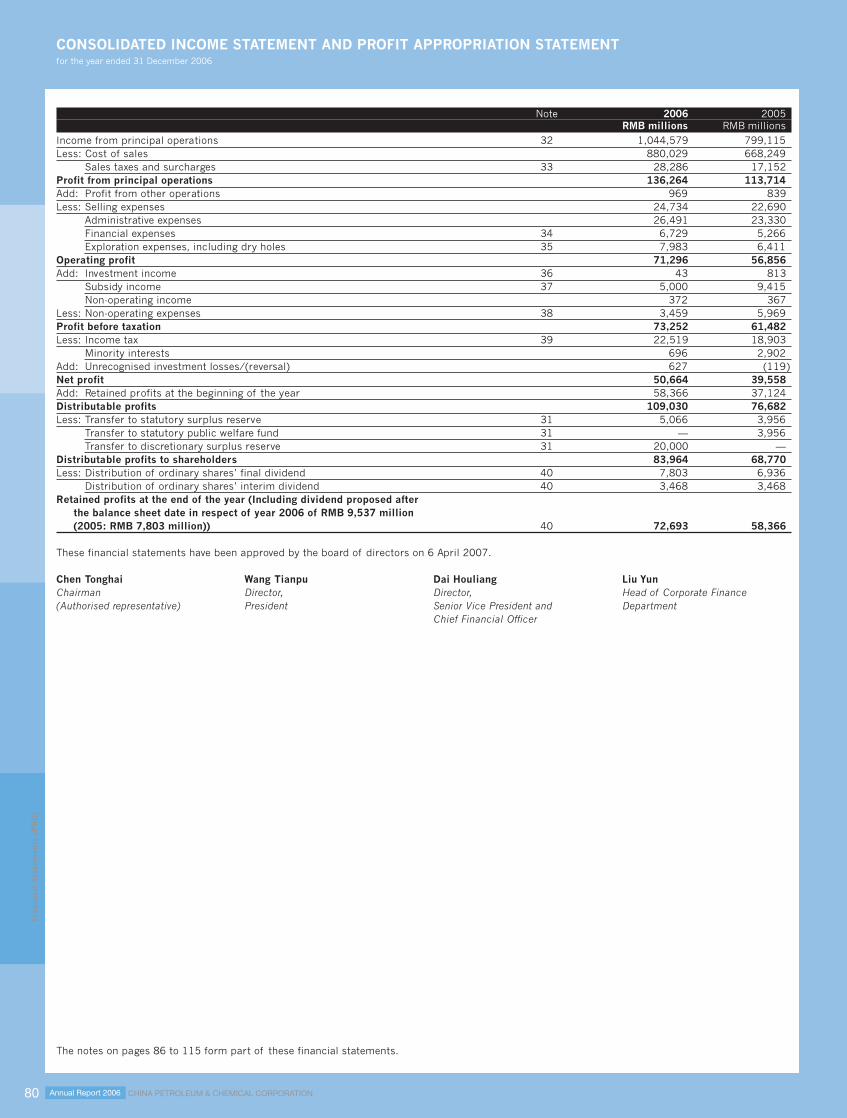
CHINA PETROLEUM & CHEMICAL CORPORATIONAnnual Report 200680
CONSOLIDATED INCOME STATEMENT AND PROFIT APPROPRIATION STATEMENTfor the year ended 31 December 2006
Fina
ncia
l S
tate
men
ts (
PR
C)
Note 2006 2005RMB millions RMB millions
Income from principal operations 32 1,044,579 799,115Less: Cost of sales 880,029 668,249
Sales taxes and surcharges 33 28,286 17,152Profit from principal operations 136,264 113,714Add: Profit from other operations 969 839Less: Selling expenses 24,734 22,690
Administrative expenses 26,491 23,330Financial expenses 34 6,729 5,266Exploration expenses, including dry holes 35 7,983 6,411
Operating profit 71,296 56,856Add: Investment income 36 43 813
Subsidy income 37 5,000 9,415Non-operating income 372 367
Less: Non-operating expenses 38 3,459 5,969Profit before taxation 73,252 61,482Less: Income tax 39 22,519 18,903
Minority interests 696 2,902Add: Unrecognised investment losses/(reversal) 627 (119)Net profit 50,664 39,558Add: Retained profits at the beginning of the year 58,366 37,124Distributable profits 109,030 76,682Less: Transfer to statutory surplus reserve 31 5,066 3,956
Transfer to statutory public welfare fund 31 — 3,956Transfer to discretionary surplus reserve 31 20,000 —
Distributable profits to shareholders 83,964 68,770Less: Distribution of ordinary shares’ final dividend 40 7,803 6,936
Distribution of ordinary shares’ interim dividend 40 3,468 3,468Retained profits at the end of the year (Including dividend proposed after
the balance sheet date in respect of year 2006 of RMB 9,537 million(2005: RMB 7,803 million)) 40 72,693 58,366
These financial statements have been approved by the board of directors on 6 April 2007.
Chen Tonghai Wang Tianpu Dai Houliang Liu YunChairman Director, Director, Head of Corporate Finance(Authorised representative) President Senior Vice President and Department
Chief Financial Officer
The notes on pages 86 to 115 form part of these financial statements.

CHINA PETROLEUM & CHEMICAL CORPORATION Annual Report 2006 81
INCOME STATEMENT AND PROFIT APPROPRIATION STATEMENTfor the year ended 31 December 2006
Fina
ncia
l S
tate
men
ts (
PR
C)
Note 2006 2005RMB millions RMB millions
Income from principal operations 32 779,902 532,621Less: Cost of sales 656,600 480,866
Sales taxes and surcharges 33 23,086 11,249Profit from principal operations 100,216 40,506Add: Profit from other operations 869 512Less: Selling expenses 16,233 14,672
Administrative expenses 20,473 14,573Financial expenses 34 5,283 3,539Exploration expenses, including dry holes 35 7,959 5,052
Operating profit 51,137 3,182Add: Investment income 36 20,944 51,646
Subsidy income 37 3,016 6,584Non-operating income 209 224
Less: Non-operating expenses 38 2,745 3,967Profit before taxation 72,561 57,669Less: Income tax 39 22,410 18,138Net profit 50,151 39,531Add: Retained profits at the beginning of the year 58,339 37,124Distributable profits 108,490 76,655Less: Transfer to statutory surplus reserve 31 5,066 3,956
Transfer to statutory public welfare fund 31 — 3,956Transfer to discretionary surplus reserve 31 20,000 —
Distributable profits to shareholders 83,424 68,743Less: Distribution of ordinary shares’ final dividend 40 7,803 6,936
Distribution of ordinary shares’ interim dividend 40 3,468 3,468Retained profits at the end of the year (Including dividend proposed after
the balance sheet date in respect of year 2006 of RMB 9,537 million(2005: RMB 7,803 million)) 40 72,153 58,339
These financial statements have been approved by the board of directors on 6 April 2007.
Chen Tonghai Wang Tianpu Dai Houliang Liu YunChairman Director, Director, Head of Corporate Finance(Authorised representative) President Senior Vice President and Department
Chief Financial Officer
The notes on pages 86 to 115 form part of these financial statements.

CHINA PETROLEUM & CHEMICAL CORPORATIONAnnual Report 200682
CONSOLIDATED CASH FLOW STATEMENTfor the year ended 31 December 2006
Fina
ncia
l S
tate
men
ts (
PR
C)
Note 2006 2005RMB millions RMB millions
Cash flows from operating activities:Cash received from sale of goods and rendering of services 1,252,217 965,505Rentals received 384 387Government grants received 5,000 9,415Other cash received relating to operating activities 3,756 3,572Sub-total of cash inflows 1,261,357 978,879--- - - - - - - - - - - - - - - - - - - - - - - - - - - - - - - - - - - - - - - - - - - - - - - - - - - - - - - - - - - - - - - - - - - - - - - - - - - - - - - - - - - - - - - - - - - - - - - - - - - - - - - - - - - - - - - - - - - - - - - - - - - - - - - - - - - - - - - - - - - - - - - - - - - - - - - - - - - - - - - - - - - - - - - - - - - - - - - - - - - - - - - - - - - - - - - - - - - - - - - - - - - - - - - - - - - - - - - - - - - - - - - - - - - - - - - - - - - - - - - - - - - - - - - - - - - - - - - - - - - - - - - - - - - - - -
Cash paid for goods and services (1,039,625) (790,429)Cash paid for operating leases (6,087) (5,629)Cash paid to and on behalf of employees (20,323) (18,710)Value added tax paid (31,589) (27,928)Income tax paid (19,564) (20,998)Taxes paid other than value added tax and income tax (26,692) (17,288)Other cash paid relating to operating activities (14,890) (12,934)Sub-total of cash outflows (1,158,770) (893,916)-- - - - - - - - - - - - - - - - - - - - - - - - - - - - - - - - - - - - - - - - - - - - - - - - - - - - - - - - - - - - - - - - - - - - - - - - - - - - - - - - - - - - - - - - - - - - - - - - - - - - - - - - - - - - - - - - - - - - - - - - - - - - - - - - - - - - - - - - - - - - - - - - - - - - - - - - - - - - - - - - - - - - - - - - - - - - - - - - - - - - - - - - - - - - - - - - - - - - - - - - - - - - - - - - - - - - - - - - - - - - - - - - - - - - - - - - - - - - - - - - - - - - - - - - - - - - - - - - - - - - - - - - - - - - - - -
Net cash flow from operating activities (a) 102,587 84,963--- - - - - - - - - - - - - - - - - - - - - - - - - - - - - - - - - - - - - - - - - - - - - - - - - - - - - - - - - - - - - - - - - - - - - - - - - - - - - - - - - - - - - - - - - - - - - - - - - - - - - - - - - - - - - - - - - - - - - - - - - - - - - - - - - - - - - - - - - - - - - - - - - - - - - - - - - - - - - - - - - - - - - - - - - - - - - - - - - - - - - - - - - - - - - - - - - - - - - - - - - - - - - - - - - - - - - - - - - - - - - - - - - - - - - - - - - - - - - - - - - - - - - - - - - - - - - - - - - - - - - - - - - - - - - - - - - - -
Cash flows from investing activities:Cash received from sale of investments 510 417Dividends received 617 668Net cash received from sale of fixed assets and intangible assets 349 510Cash received on maturity of time deposits with financial institutions 1,283 1,462Other cash received relating to investing activities 557 386Sub-total of cash inflows 3,316 3,443--- - - - - - - - - - - - - - - - - - - - - - - - - - - - - - - - - - - - - - - - - - - - - - - - - - - - - - - - - - - - - - - - - - - - - - - - - - - - - - - - - - - - - - - - - - - - - - - - - - - - - - - - - - - - - - - - - - - - - - - - - - - - - - - - - - - - - - - - - - - - - - - - - - - - - - - - - - - - - - - - - - - - - - - - - - - - - - - - - - - - - - - - - - - - - - - - - - - - - - - - - - - - - - - - - - - - - - - - - - - - - - - - - - - - - - - - - - - - - - - - - - - - - - - - - - - - - - - - - - - - - - - - - - - - - -
Cash paid for acquisition of fixed assets and intangible assets (76,701) (65,031)Cash paid for acquisition of fixed assets and intangible assets of jointly controlled entities (382) (2,474)Cash paid for purchase of investments (3,569) (3,605)Cash paid for purchase of time deposits with financial institutions (916) (565)Cash paid for acquisition of operating assets and related liabilities from Sinopec Group Company — (3,128)Cash paid for acquisition of subsidiaries (21,971) (4,324)Sub-total of cash outflows (103,539) (79,127)-- - - - - - - - - - - - - - - - - - - - - - - - - - - - - - - - - - - - - - - - - - - - - - - - - - - - - - - - - - - - - - - - - - - - - - - - - - - - - - - - - - - - - - - - - - - - - - - - - - - - - - - - - - - - - - - - - - - - - - - - - - - - - - - - - - - - - - - - - - - - - - - - - - - - - - - - - - - - - - - - - - - - - - - - - - - - - - - - - - - - - - - - - - - - - - - - - - - - - - - - - - - - - - - - - - - - - - - - - - - - - - - - - - - - - - - - - - - - - - - - - - - - - - - - - - - - - - - - - - - - - - - - - - - - - - -
Net cash flow from investing activities (100,223) (75,684)-- - - - - - - - - - - - - - - - - - - - - - - - - - - - - - - - - - - - - - - - - - - - - - - - - - - - - - - - - - - - - - - - - - - - - - - - - - - - - - - - - - - - - - - - - - - - - - - - - - - - - - - - - - - - - - - - - - - - - - - - - - - - - - - - - - - - - - - - - - - - - - - - - - - - - - - - - - - - - - - - - - - - - - - - - - - - - - - - - - - - - - - - - - - - - - - - - - - - - - - - - - - - - - - - - - - - - - - - - - - - - - - - - - - - - - - - - - - - - - - - - - - - - - - - - - - - - - - - - - - - - - - - - - - - - - - - - - - -
Cash flows from financing activities:Cash received from contribution from minority shareholders 1,255 129Cash received from issuance of corporate bonds, net of issuing expenses 22,689 9,875Cash received from borrowings 763,771 550,557Cash received from borrowings of jointly controlled entities 87 3,954Sub-total of cash inflows 787,802 564,515--- - - - - - - - - - - - - - - - - - - - - - - - - - - - - - - - - - - - - - - - - - - - - - - - - - - - - - - - - - - - - - - - - - - - - - - - - - - - - - - - - - - - - - - - - - - - - - - - - - - - - - - - - - - - - - - - - - - - - - - - - - - - - - - - - - - - - - - - - - - - - - - - - - - - - - - - - - - - - - - - - - - - - - - - - - - - - - - - - - - - - - - - - - - - - - - - - - - - - - - - - - - - - - - - - - - - - - - - - - - - - - - - - - - - - - - - - - - - - - - - - - - - - - - - - - - - - - - - - - - - - - - - - - - - - -
Cash repayments of corporate bonds (21,000) —Cash repayments of borrowings (753,979) (557,432)Cash paid for dividends, profits distribution or interest expenses (20,097) (17,365)Dividends paid to minority shareholders by subsidiaries (722) (1,611)Sub-total of cash outflows (795,798) (576,408)-- - - - - - - - - - - - - - - - - - - - - - - - - - - - - - - - - - - - - - - - - - - - - - - - - - - - - - - - - - - - - - - - - - - - - - - - - - - - - - - - - - - - - - - - - - - - - - - - - - - - - - - - - - - - - - - - - - - - - - - - - - - - - - - - - - - - - - - - - - - - - - - - - - - - - - - - - - - - - - - - - - - - - - - - - - - - - - - - - - - - - - - - - - - - - - - - - - - - - - - - - - - - - - - - - - - - - - - - - - - - - - - - - - - - - - - - - - - - - - - - - - - - - - - - - - - - - - - - - - - - - - - - - - - - - - -
Net cash flow from financing activities (7,996) (11,893)-- - - - - - - - - - - - - - - - - - - - - - - - - - - - - - - - - - - - - - - - - - - - - - - - - - - - - - - - - - - - - - - - - - - - - - - - - - - - - - - - - - - - - - - - - - - - - - - - - - - - - - - - - - - - - - - - - - - - - - - - - - - - - - - - - - - - - - - - - - - - - - - - - - - - - - - - - - - - - - - - - - - - - - - - - - - - - - - - - - - - - - - - - - - - - - - - - - - - - - - - - - - - - - - - - - - - - - - - - - - - - - - - - - - - - - - - - - - - - - - - - - - - - - - - - - - - - - - - - - - - - - - - - - - - - - - - - - - -
Effects of changes in foreign exchange rate (25) (22)-- - - - - - - - - - - - - - - - - - - - - - - - - - - - - - - - - - - - - - - - - - - - - - - - - - - - - - - - - - - - - - - - - - - - - - - - - - - - - - - - - - - - - - - - - - - - - - - - - - - - - - - - - - - - - - - - - - - - - - - - - - - - - - - - - - - - - - - - - - - - - - - - - - - - - - - - - - - - - - - - - - - - - - - - - - - - - - - - - - - - - - - - - - - - - - - - - - - - - - - - - - - - - - - - - - - - - - - - - - - - - - - - - - - - - - - - - - - - - - - - - - - - - - - - - - - - - - - - - - - - - - - - - - - - - - - - - - - -
Net decrease in cash and cash equivalents (b) (5,657) (2,636)
The notes on pages 86 to 115 form part of these financial statements.

CHINA PETROLEUM & CHEMICAL CORPORATION Annual Report 2006 83
CONSOLIDATED CASH FLOW STATEMENT (CONTINUED)for the year ended 31 December 2006notes to the consolidated cash flow statement
Fina
ncia
l S
tate
men
ts (
PR
C)
2006 2005RMB millions RMB millions
(a) Reconciliation of net profit to cash flows from operating activities:Net profit 50,664 39,558Add: Provision/(reversal of) for allowance for doubtful accounts 253 (144)
Provision for diminution in value of inventories 102 82Depreciation of fixed assets 33,627 30,845Amortisation of intangible assets 633 986Impairment losses on fixed assets 600 1,851Impairment losses on long-term investments 48 77Net loss on disposal of fixed assets and intangible assets 1,646 2,202Financial expenses 6,729 5,266Dry hole costs 3,960 2,992Investment income (91) (890)Deferred tax assets (939) (1,733)Increase in inventories (3,203) (25,078)Increase in operating receivables (1,196) (2,256)Increase in operating payables 9,058 28,303Minority interests 696 2,902
Net cash flow from operating activities 102,587 84,963
(b) Net decrease in cash and cash equivalents:Cash and cash equivalents at the end of the year 8,088 13,745Less: Cash and cash equivalents at the beginning of the year 13,745 16,381Net decrease in cash and cash equivalents (5,657) (2,636)
These financial statements have been approved by the board of directors on 6 April 2007.
Chen Tonghai Wang Tianpu Dai Houliang Liu YunChairman Director, Director, Head of Corporate Finance(Authorised representative) President Senior Vice President and Department
Chief Financial Officer
The notes on pages 86 to 115 form part of these financial statements.
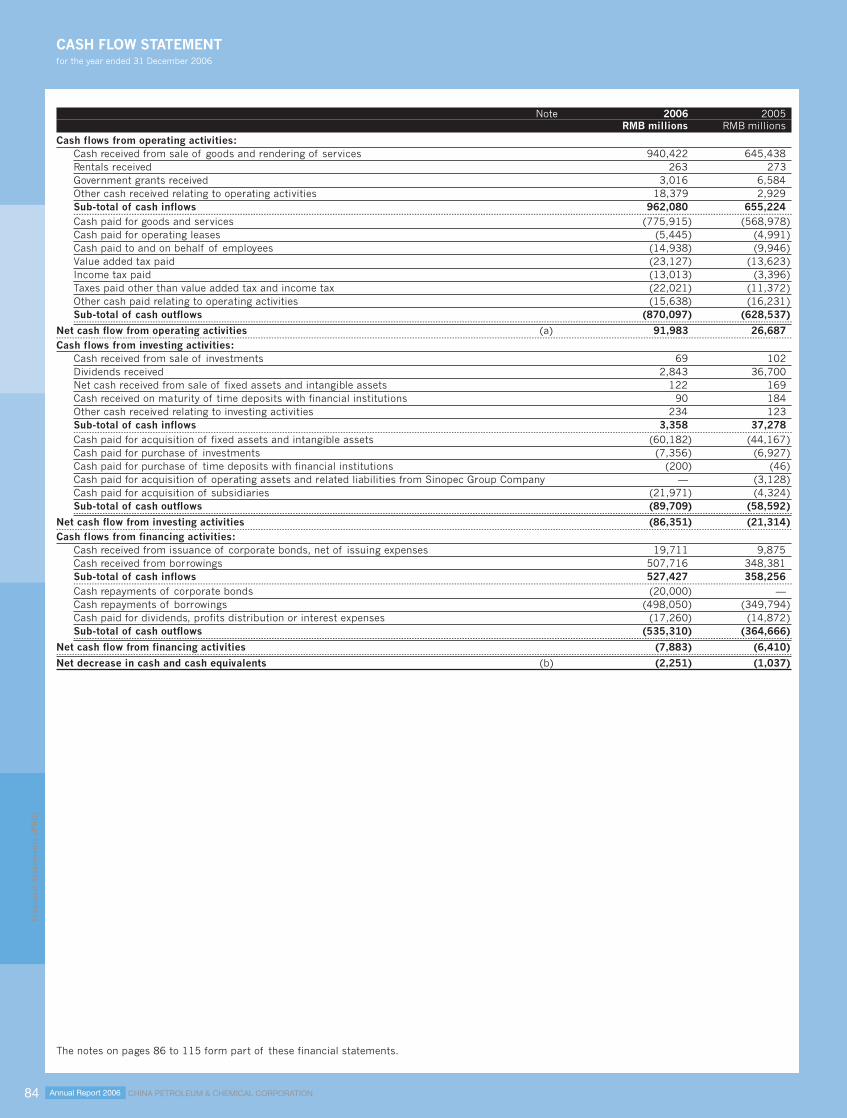
CHINA PETROLEUM & CHEMICAL CORPORATIONAnnual Report 200684
CASH FLOW STATEMENTfor the year ended 31 December 2006
Fina
ncia
l S
tate
men
ts (
PR
C)
Note 2006 2005RMB millions RMB millions
Cash flows from operating activities:Cash received from sale of goods and rendering of services 940,422 645,438Rentals received 263 273Government grants received 3,016 6,584Other cash received relating to operating activities 18,379 2,929Sub-total of cash inflows 962,080 655,224--- - - - - - - - - - - - - - - - - - - - - - - - - - - - - - - - - - - - - - - - - - - - - - - - - - - - - - - - - - - - - - - - - - - - - - - - - - - - - - - - - - - - - - - - - - - - - - - - - - - - - - - - - - - - - - - - - - - - - - - - - - - - - - - - - - - - - - - - - - - - - - - - - - - - - - - - - - - - - - - - - - - - - - - - - - - - - - - - - - - - - - - - - - - - - - - - - - - - - - - - - - - - - - - - - - - - - - - - - - - - - - - - - - - - - - - - - - - - - - - - - - - - - - - - - - - - - - - - - - - - - - - - - - - - - -
Cash paid for goods and services (775,915) (568,978)Cash paid for operating leases (5,445) (4,991)Cash paid to and on behalf of employees (14,938) (9,946)Value added tax paid (23,127) (13,623)Income tax paid (13,013) (3,396)Taxes paid other than value added tax and income tax (22,021) (11,372)Other cash paid relating to operating activities (15,638) (16,231)Sub-total of cash outflows (870,097) (628,537)-- - - - - - - - - - - - - - - - - - - - - - - - - - - - - - - - - - - - - - - - - - - - - - - - - - - - - - - - - - - - - - - - - - - - - - - - - - - - - - - - - - - - - - - - - - - - - - - - - - - - - - - - - - - - - - - - - - - - - - - - - - - - - - - - - - - - - - - - - - - - - - - - - - - - - - - - - - - - - - - - - - - - - - - - - - - - - - - - - - - - - - - - - - - - - - - - - - - - - - - - - - - - - - - - - - - - - - - - - - - - - - - - - - - - - - - - - - - - - - - - - - - - - - - - - - - - - - - - - - - - - - - - - - - - - - -
Net cash flow from operating activities (a) 91,983 26,687--- - - - - - - - - - - - - - - - - - - - - - - - - - - - - - - - - - - - - - - - - - - - - - - - - - - - - - - - - - - - - - - - - - - - - - - - - - - - - - - - - - - - - - - - - - - - - - - - - - - - - - - - - - - - - - - - - - - - - - - - - - - - - - - - - - - - - - - - - - - - - - - - - - - - - - - - - - - - - - - - - - - - - - - - - - - - - - - - - - - - - - - - - - - - - - - - - - - - - - - - - - - - - - - - - - - - - - - - - - - - - - - - - - - - - - - - - - - - - - - - - - - - - - - - - - - - - - - - - - - - - - - - - - - - - - - - - - -
Cash flows from investing activities:Cash received from sale of investments 69 102Dividends received 2,843 36,700Net cash received from sale of fixed assets and intangible assets 122 169Cash received on maturity of time deposits with financial institutions 90 184Other cash received relating to investing activities 234 123Sub-total of cash inflows 3,358 37,278--- - - - - - - - - - - - - - - - - - - - - - - - - - - - - - - - - - - - - - - - - - - - - - - - - - - - - - - - - - - - - - - - - - - - - - - - - - - - - - - - - - - - - - - - - - - - - - - - - - - - - - - - - - - - - - - - - - - - - - - - - - - - - - - - - - - - - - - - - - - - - - - - - - - - - - - - - - - - - - - - - - - - - - - - - - - - - - - - - - - - - - - - - - - - - - - - - - - - - - - - - - - - - - - - - - - - - - - - - - - - - - - - - - - - - - - - - - - - - - - - - - - - - - - - - - - - - - - - - - - - - - - - - - - - - -
Cash paid for acquisition of fixed assets and intangible assets (60,182) (44,167)Cash paid for purchase of investments (7,356) (6,927)Cash paid for purchase of time deposits with financial institutions (200) (46)Cash paid for acquisition of operating assets and related liabilities from Sinopec Group Company — (3,128)Cash paid for acquisition of subsidiaries (21,971) (4,324)Sub-total of cash outflows (89,709) (58,592)-- - - - - - - - - - - - - - - - - - - - - - - - - - - - - - - - - - - - - - - - - - - - - - - - - - - - - - - - - - - - - - - - - - - - - - - - - - - - - - - - - - - - - - - - - - - - - - - - - - - - - - - - - - - - - - - - - - - - - - - - - - - - - - - - - - - - - - - - - - - - - - - - - - - - - - - - - - - - - - - - - - - - - - - - - - - - - - - - - - - - - - - - - - - - - - - - - - - - - - - - - - - - - - - - - - - - - - - - - - - - - - - - - - - - - - - - - - - - - - - - - - - - - - - - - - - - - - - - - - - - - - - - - - - - - - -
Net cash flow from investing activities (86,351) (21,314)-- - - - - - - - - - - - - - - - - - - - - - - - - - - - - - - - - - - - - - - - - - - - - - - - - - - - - - - - - - - - - - - - - - - - - - - - - - - - - - - - - - - - - - - - - - - - - - - - - - - - - - - - - - - - - - - - - - - - - - - - - - - - - - - - - - - - - - - - - - - - - - - - - - - - - - - - - - - - - - - - - - - - - - - - - - - - - - - - - - - - - - - - - - - - - - - - - - - - - - - - - - - - - - - - - - - - - - - - - - - - - - - - - - - - - - - - - - - - - - - - - - - - - - - - - - - - - - - - - - - - - - - - - - - - - - - - - - - -
Cash flows from financing activities:Cash received from issuance of corporate bonds, net of issuing expenses 19,711 9,875Cash received from borrowings 507,716 348,381Sub-total of cash inflows 527,427 358,256--- - - - - - - - - - - - - - - - - - - - - - - - - - - - - - - - - - - - - - - - - - - - - - - - - - - - - - - - - - - - - - - - - - - - - - - - - - - - - - - - - - - - - - - - - - - - - - - - - - - - - - - - - - - - - - - - - - - - - - - - - - - - - - - - - - - - - - - - - - - - - - - - - - - - - - - - - - - - - - - - - - - - - - - - - - - - - - - - - - - - - - - - - - - - - - - - - - - - - - - - - - - - - - - - - - - - - - - - - - - - - - - - - - - - - - - - - - - - - - - - - - - - - - - - - - - - - - - - - - - - - - - - - - - - - -
Cash repayments of corporate bonds (20,000) —Cash repayments of borrowings (498,050) (349,794)Cash paid for dividends, profits distribution or interest expenses (17,260) (14,872)Sub-total of cash outflows (535,310) (364,666)-- - - - - - - - - - - - - - - - - - - - - - - - - - - - - - - - - - - - - - - - - - - - - - - - - - - - - - - - - - - - - - - - - - - - - - - - - - - - - - - - - - - - - - - - - - - - - - - - - - - - - - - - - - - - - - - - - - - - - - - - - - - - - - - - - - - - - - - - - - - - - - - - - - - - - - - - - - - - - - - - - - - - - - - - - - - - - - - - - - - - - - - - - - - - - - - - - - - - - - - - - - - - - - - - - - - - - - - - - - - - - - - - - - - - - - - - - - - - - - - - - - - - - - - - - - - - - - - - - - - - - - - - - - - - - - -
Net cash flow from financing activities (7,883) (6,410)-- - - - - - - - - - - - - - - - - - - - - - - - - - - - - - - - - - - - - - - - - - - - - - - - - - - - - - - - - - - - - - - - - - - - - - - - - - - - - - - - - - - - - - - - - - - - - - - - - - - - - - - - - - - - - - - - - - - - - - - - - - - - - - - - - - - - - - - - - - - - - - - - - - - - - - - - - - - - - - - - - - - - - - - - - - - - - - - - - - - - - - - - - - - - - - - - - - - - - - - - - - - - - - - - - - - - - - - - - - - - - - - - - - - - - - - - - - - - - - - - - - - - - - - - - - - - - - - - - - - - - - - - - - - - - - - - - - - -
Net decrease in cash and cash equivalents (b) (2,251) (1,037)
The notes on pages 86 to 115 form part of these financial statements.

CHINA PETROLEUM & CHEMICAL CORPORATION Annual Report 2006 85
CASH FLOW STATEMENT (CONTINUED)for the year ended 31 December 2006notes to the cash flow statement
Fina
ncia
l S
tate
men
ts (
PR
C)
2006 2005RMB millions RMB millions
(a) Reconciliation of net profit to cash flow from operating activities:Net profit 50,151 39,531Add: Provision/(reversal of) for allowance for doubtful accounts 132 (448)
Provision/(reversal of) for diminution in value of inventories 113 (17)Depreciation of fixed assets 24,822 15,186Amortisation of intangible assets 368 755Impairment losses on fixed assets 531 1,082Impairment losses on long-term investments 20 14Net loss on disposal of fixed assets and intangible assets 1,416 1,681Financial expenses 5,283 3,539Dry hole costs 3,950 2,271Investment income (14,658) (34,690)Deferred tax liabilities (less: assets) (554) 489Increase in inventories (3,450) (16,356)(Increase)/decrease in operating receivables (4,935) 12,853Increase in operating payables 28,794 797
Net cash flow from operating activities 91,983 26,687
(b) Net decrease in cash and cash equivalents:Cash and cash equivalents at the end of the year 2,763 5,014Less: Cash and cash equivalents at the beginning of the year 5,014 6,051Net decrease in cash and cash equivalents (2,251) (1,037)
These financial statements have been approved by the board of directors on 6 April 2007.
Chen Tonghai Wang Tianpu Dai Houliang Liu YunChairman Director, Director, Head of Corporate Finance(Authorised representative) President Senior Vice President and Department
Chief Financial Officer
The notes on pages 86 to 115 form part of these financial statements.

CHINA PETROLEUM & CHEMICAL CORPORATIONAnnual Report 200686
NOTES ON THE FINANCIAL STATEMENTSfor the year ended 31 December 2006
Fina
ncia
l S
tate
men
ts (
PR
C)
1 STATUS OF THE COMPANYChina Petroleum & Chemical Corporation (the “Company”) was established on 25 February 2000 as a joint stock limited company.
According to the State Council’s approval to the “Preliminary Plan for the Reorganisation of China Petrochemical Corporation” ( the “Reorganisation”),the Company was established by China Petrochemical Corporation (“Sinopec Group Company”), which transferred its core businesses together with therelated assets and liabilities at 30 September 1999 to the Company. Such assets and liabilities had been valued jointly by China United AssetsAppraisal Corporation, Beijing Zhong Zheng Appraisal Company, CIECC Assets Appraisal Corporation and Zhong Fa International Properties ValuationCorporation (“registered valuers”). The net asset value was determined at RMB 98,249,084,000. The valuation was reviewed and approved by theMinistry of Finance (the “MOF”) (Cai Ping Zi [2000] No. 20 “Comments on the Review of the Valuation Regarding the Formation of a Joint StockLimited Company by China Petrochemical Corporation”).
In addition, pursuant to the notice Cai Guan Zi [2000] No. 34 “Reply to the Issue Regarding Management of State-Owned Equity by China Petroleumand Chemical Corporation” issued by the MOF, 68.8 billion domestic state-owned shares with a par value of RMB 1.00 each were issued to SinopecGroup Company, the amount of which is equivalent to 70% of the above net asset value transferred from Sinopec Group Company to the Company inconnection with the Reorganisation.
Pursuant to the notice Guo Jing Mao Qi Gai [2000] No. 154 “Reply on the Formation of China Petroleum and Chemical Corporation”, the Companyobtained the approval from the State Economic and Trade Commission on 21 February 2000 for the formation of a joint stock limited company.
The Company took over the exploration, development and production of crude oil and natural gas, refining, chemicals and related sales and marketingbusiness of Sinopec Group Company after the establishment of the Company.
The Company and its subsidiaries (the “Group”) engage in the oil and gas and chemical operations and businesses, including:
(1) the exploration, development and production of crude oil and natural gas;
(2) the refining, transportation, storage and marketing of crude oil and petroleum products, and
(3) the production and sale of chemicals.
Pursuant to the resolution passed at the Directors’ meeting on 10 October 2006, the Company acquired equity interests in Sinopec Hainan Refiningand Chemical Company Limited (“Sinopec Hainan”) by way of capital injection of RMB 2,990 million (hereinafter referred to as the “Acquisition ofSinopec Hainan”). Upon the completion of the capital increase, the Company will hold 75% of the equity interests in Sinopec Hainan.
Pursuant to the resolution passed at the Directors’ meeting on 6 December 2006, the Company acquired the equity interests in certain oil and gascompanies (“Oil Production Plants”) from Sinopec Group Company, for a total consideration of RMB 3,500 million (hereinafter referred to as the“Acquisition of Oil Production Plants”).
2 SIGNIFICANT ACCOUNTING POLICIESThe significant accounting policies adopted by the Group are in conformity with the Accounting Standards for Business Enterprises and “AccountingRegulations for Business Enterprises” and other relevant regulations issued by the Ministry of Finance of the PRC.
(a) Accounting yearThe accounting year of the Group is from 1 January to 31 December.
(b) Basis of consolidationThe Group prepared the consolidated financial statements according to “Accounting Regulations for Business Enterprises” and “Provisional regulationson consolidated financial statements” Cai Kuai Zi [1995] No.11 issued by the MOF.
The consolidated financial statements include the financial statements of the Company and all of its principal subsidiaries. A subsidiary is acompany held by the Company directly or indirectly, of more than 50% (excluding 50%) of the equity interest, or the Company holds less than 50%of the equity interest of a company but has effective controlling power. The consolidated income statement of the Company only includes theresults of the subsidiaries during the period when the Company holds more than 50% of the equity interests or holds less than 50% of equityinterest but has effective controlling power. The effect of minority interests on equity and profit/loss attributable to minority shareholders areseparately shown in the consolidated financial statements. For those subsidiaries whose assets and results of operation are not significant and haveno significant effect on the Group’s consolidated financial statements, the Company does not consolidate these subsidiaries, but accounts forunder the equity method in the long-term equity investments.
Where the accounting policies adopted by the subsidiaries are different from the policies adopted by the Company, the financial statements of thesubsidiaries have been adjusted in accordance with the accounting policies adopted by the Company on consolidation. All significant inter-companybalances and transactions, and any unrealised gains arising from inter-company transactions, have been eliminated on consolidation.
For those jointly controlled entities which the Company has joint control with other investors under contractual arrangement, the Company consolidatestheir assets, liabilities, revenues, costs and expenses based on the proportionate consolidation method according to its percentage of holding ofequity interest in those entities in the consolidated financial statements.
(c) Basis of preparation and measurement basisThe financial statements of the Group have been prepared on an accrual basis under the historical costs convention, unless otherwise stated.

CHINA PETROLEUM & CHEMICAL CORPORATION Annual Report 2006 87
NOTES ON THE FINANCIAL STATEMENTS (CONTINUED)for the year ended 31 December 2006
Fina
ncia
l S
tate
men
ts (
PR
C)
2 SIGNIFICANT ACCOUNTING POLICIES (Continued)
(d) Reporting currency and translation of foreign currenciesThe Group’s reporting currency is Renminbi.
Foreign currency transactions during the year are translated into Renminbi at exchange rates quoted by the People’s Bank of China (“PBOC rates”)prevailing on the transaction dates. Foreign currency monetary assets and liabilities are translated into Renminbi at the PBOC rates at the balancesheet date. Exchange gains and losses on foreign currency translation, except for those directly relating to the construction of fixed assets (see note2(i)), are dealt with in the income statement.
All income statement items of overseas subsidiaries are translated into Renminbi at the annual average PBOC rates. The asset and liability itemsare translated into Renminbi at the PBOC rates at the balance sheet date. The equity items, excluding the item of “Retained Profit”, are translatedinto Renminbi on the transaction date. The resulting exchange gains or losses are accounted for as foreign currency exchange differences.
(e) Cash equivalentsCash equivalents held by the Group are short-term and highly liquid investments which are readily convertible into known amounts of cash and aresubject to an insignificant risk of change in value.
(f) Allowance for doubtful accountsTrade accounts receivable showing signs of uncollectibility are identified individually and allowance is then made based on the probability of beinguncollectible. In respect of trade accounts receivable showing no sign of uncollectibility, allowance is made with reference to the ageing analysisand management’s estimation based on past experience. Allowances for other receivables are determined based on the nature and correspondingcollectibility. Specific approval from management is required for allowances made in respect of significant doubtful accounts.
(g) InventoriesInventories, other than spare parts and consumables, are stated at the lower of cost and net realisable value.
Cost includes the cost of purchase and processing, and other cost. Inventories are measured at their actual cost upon acquisition. The cost ofinventories is calculated using the weighted average method. In addition to the purchase cost of raw material, work in progress and finished goodsinclude direct labour and an appropriate allocation of manufacturing overheads.
Any excess of the cost over the net realisable value of each item of inventories is recognised as a provision for diminution in the value of inventories.Net realisable value is the estimated selling price in the normal course of business less the estimated costs to completion and the estimatedexpenses and related taxes to make the sale.
Spare parts and consumables are stated at cost less any provision for obsolescence. Consumables are expensed when being consumed.
Inventories are recorded by perpetual method.
(h) Long-term equity investmentsWhere the Group has the power to control, jointly control or exercise significant influence over an investee enterprise, the investment is accountedfor under the equity method whereby the investment is initially recorded at cost and adjusted thereafter for any post acquisition change in theGroup’s share of the shareholders’ funds in the investee enterprise.
Equity investment difference, which is the difference between the initial investment cost and the Group’s share of shareholders’ funds of theinvestee enterprise, is accounted for as follows:
— Any excess of the initial investment cost over the share of shareholders’ funds of the investee enterprise is amortised on a straight-line basis.The amortisation period is determined according to the investment period as stipulated in the relevant agreement, or not more than 10 years ifthe investment period is not specified in the agreement. The unamortised balance is included in long-term equity investments at the year end.
— Any shortfall of the initial investment cost over the share of shareholders’ funds of the investee is recognised in capital reserve – reserve forequity investment acquired after the issuance of Cai Kuai [2003] No.10 “Questions and answers on implementing Accounting Regulations forBusiness Enterprises and related accounting standards (II)”. If the investment was acquired before the issuance of Cai Kuai [2003] No.10“Questions and answers on implementing Accounting Regulations for Business Enterprises and related accounting standards (II)”, such shortfallis amortised on a straight-line basis over the investment period as stipulated in the relevant agreement, or 10 years if the investment period isnot specified in the agreement. The unamortised balance is included in long-term equity investments at the year end.
Where the Group does not control, jointly control or exercise significant influence over an investee enterprise, the investment is accounted for underthe cost method, stating it at the initial investment cost. Investment income is recognised when the investee enterprise declares a cash dividend ordistributes profits.
Upon the disposal or transfer of long-term equity investments, the difference between the proceeds received and the carrying amount of theinvestments is recognised in the income statement.
The Group makes provision for impairment losses on long-term equity investments (see note 2(w)).

CHINA PETROLEUM & CHEMICAL CORPORATIONAnnual Report 200688
NOTES ON THE FINANCIAL STATEMENTS (CONTINUED)for the year ended 31 December 2006
Fina
ncia
l S
tate
men
ts (
PR
C)
2 SIGNIFICANT ACCOUNTING POLICIES (Continued)
(i) Fixed assets and construction in progressFixed assets represent the assets held by the Group for use in the production of goods and for administrative purposes with useful life over 1 yearand comparatively high unit value.
Fixed assets are stated in the balance sheet at cost or revalued amount less accumulated depreciation and impairment losses (see note 2(w)).Construction in progress is stated in the balance sheet at cost or revalued amount less impairment losses (see note 2(w)). The revalued amountrepresents the amount of assets, which is determined by revaluation carried out in accordance with the relevant rules and regulations.
All direct and indirect costs related to the purchase or construction of fixed assets, incurred before the assets are ready for their intended uses, arecapitalised as construction in progress. Those costs include borrowing costs (including foreign exchange differences arising from the loan principaland the related interest) on specific borrowings for the construction of the fixed assets during the construction period.
Construction in progress is transferred to fixed assets when the asset is ready for its intended use. No depreciation is provided against constructionin progress.
Fixed assets of the Group are depreciated using the straight-line method over their estimated useful lives. The estimated useful lives and theestimated rate of residual values adopted for respective classes of fixed assets are as follows:
Estimated Estimated rate ofuseful live residual value
Land and buildings 15-45 years 3%-5%Oil and gas properties 10-14 years 0%-3%Plant, machinery, equipment, vehicles and others 4-18 years 3%Oil depots and storage tanks 8-14 years 3%Service stations 25 years 3%-5%
(j) Oil and gas propertiesCosts of development wells and the related support equipment are capitalised. The cost of exploratory wells is initially capitalised as constructionin progress pending determination of whether the well has found proved reserves. Exploratory well costs are charged to expenses upon thedetermination that the well has not found proved reserves. However, in the absence of a determination of the discovery of proved reserves,exploratory well costs are not carried as an asset for more than one year following completion of drilling. If, after one year has passed, a determinationof the discovery of proved reserves cannot be made, the exploratory well costs are impaired and charged to expense. All other exploration costs,including geological and geophysical costs, are charged to the income statement in the period as incurred.
(k) Intangible assetsIntangible assets are stated in the balance sheet at cost or revalued amount less accumulated amortisation and provision for impairment losses(see note 2(w)). Amortisation is provided on a straight-line basis. The amortisation period is the shorter of the contracted beneficial period and theeffective period stipulated by law. Amortisation is provided over 10 years if it is not specified in contracts or stipulated by law.
Intangible assets include exploration and production right. Exploration and production right are amortised on a straight-line basis over the averageperiod of the production rights of the related oil fields.
(l) Pre-operating expendituresExcept for the acquisition and constructions of fixed assets, all expenses incurred during the start-up period are aggregated in long-term deferredexpenses and then fully charged to the income statement in the month operations commence.
(m)Debentures payableDebentures payable is stated in the balance sheet based on the proceeds received upon issuance. Interest expenses are calculated based on actualinterest rate.
The premium/discount on debentures is amortised on a straight-line basis, over the period from the issue date to the maturity date.
(n) Revenue recognitionRevenue is recognised only when it is probable that economic benefits will flow to the enterprises, and the amount of the inflow of economicbenefits can be measured reliably. Revenue is recognised according to the following measures:
(i) Revenues from sales of goodsRevenues associated with the sale of crude oil, natural gas, petroleum and chemical products and all other items are recorded when thecustomer accepts the goods and the significant risks and rewards of ownership and title have been transferred to the buyer. No revenue isrecognised if there are significant uncertainties regarding recovery of the consideration due, the possible return of goods, or when the amountof revenue and the costs incurred or to be incurred in respect of the transaction cannot be measured reliably.
(ii) Revenues from rendering servicesRevenue from the rendering of services only involving in one accounting year is recognised in the income statement upon completion. If atransaction lasts more than one accounting years, when the outcome of the transaction involving the rendering of services can be estimatedreliably, revenue from the rendering of services is recognised in the income statement in proportion to the stage of completion of the transactionbased on the progress of work performed; or when the outcome of the transaction involving the rendering of services cannot be estimatedreliably, revenues recognised only to the extent that costs incurred are expected to be recoverable.
(iii) Interest IncomeInterest income is recognised on a time proportion basis according to the principal outstanding and the applicable rate.
CHINA PETROLEUM & CHEMICAL CORPORATION Annual Report 2006 89
NOTES ON THE FINANCIAL STATEMENTS (CONTINUED)for the year ended 31 December 2006
Fina
ncia
l S
tate
men
ts (
PR
C)
2 SIGNIFICANT ACCOUNTING POLICIES (Continued)
(o) Income taxIncome tax is recognised using the tax effect accounting method. Income tax for the year comprises current tax paid and payable and movement ofdeferred tax assets and liabilities.
Current tax is calculated at the applicable tax rate on taxable income.
Deferred tax is provided using the liability method, for timing differences between accounting profit before tax and the taxable income arising fromthe differences in the tax and accounting treatment of income and expenses or loss.
The tax value of losses expected to be available for utilisation against future taxable income is set off against the deferred tax liability within thesame legal tax unit and jurisdiction. A valuation allowance is provided for the tax value of losses to reduce the deferred tax asset to the amount thatis more likely than not to be realised through future taxable income.
(p) Borrowing costsBorrowing costs incurred on specific borrowings for the construction of fixed assets are capitalised into the cost of the fixed assets during theconstruction period until the fixed assets are ready for their intended uses.
Except for the above, other borrowing costs are recognised as financial expenses in the income statement when incurred.
(q) Repairs and maintenance expensesRepairs and maintenance (including overhauling expenses) expenses are recognised in the income statement when incurred.
(r) Environmental expendituresEnvironmental expenditures relating to circumstances arising as a result of the current or past businesses are recognised in the income statementwhen incurred.
(s) Research and development costsResearch and development costs are recognised in the income statement when incurred.
(t) Operating leasesOperating lease payments are charged as expenses on a straight-line basis over the period of the respective leases.
(u) DividendsDividends appropriated to shareholders are recognised in the income statement and profit appropriation statement when approved. Dividendsproposed or approved after the balance sheet date but before the date on which the financial statements are authorised for issue are separatelydisclosed under shareholders’ funds in the balance sheet.
(v) Retirement benefitsPursuant to the relevant laws and regulations in the PRC, the Group has joined a defined contribution retirement plan for the employees arrangedby a governmental organisation. The Group makes contributions to the retirement scheme at the applicable rate(s) based on the employees’salaries. The contributions are charged to the income statement on an accrual basis. After the payment of the contributions under the retirementplan, the Group does not have any other obligations in this respect.
(w)Provision for impairmentThe carrying amounts of assets (including long-term equity investments, fixed assets, construction in progress, intangible assets and other assets)are reviewed regularly to determine whether their recoverable amounts have declined below their carrying amounts. Assets are tested for impairmentwhenever events or changes in circumstances indicate that their recorded carrying amounts may not be recoverable. When such a decline hasoccurred, the carrying amount is reduced to the recoverable amount. The amount by which the carrying amount is reduced is the impairment loss.
The recoverable amount is the greater of the net selling price and the present value of the estimated future cash flows arising from the continuoususe of the asset and from the disposal of the asset at the end of its useful life.
Provision for impairment loss is calculated on an item by item basis and recognised as an expense in the income statement. However, when a deficitbetween the initial investment cost and the Group’s share of the shareholders’ funds of the investee enterprise has been credited to the capitalreserve, any impairment losses for long-term equity investment are firstly set off against the difference initially recognised in the capital reserverelating to the investment and any excess impairment losses are then recognised in the income statement.
If there is an indication that there has been a change in the estimates used to determine the recoverable amount and as a result the estimatedrecoverable amount is greater than the carrying amount of the asset, the impairment loss recognised in prior years is reversed. Reversals ofimpairment losses are recognised in the income statement. Impairment losses are reversed to the extent of the asset’s carrying amount that wouldhave been determined had no impairment loss been recognised in prior years. In respect of the reversal of an impairment loss for a long-termequity investment, the reversal starts with the impairment losses that had previously been recognised in the income statement and then theimpairment losses that had been charged to capital reserve.
(x) Related partiesIf the Group has the power, directly or indirectly, to control, jointly control or exercise significant influence over another party, or vice versa, or wherethe Group and one or more parties are subject to common control from another party, they are considered to be related parties. Related partiesmay be individuals or enterprises.
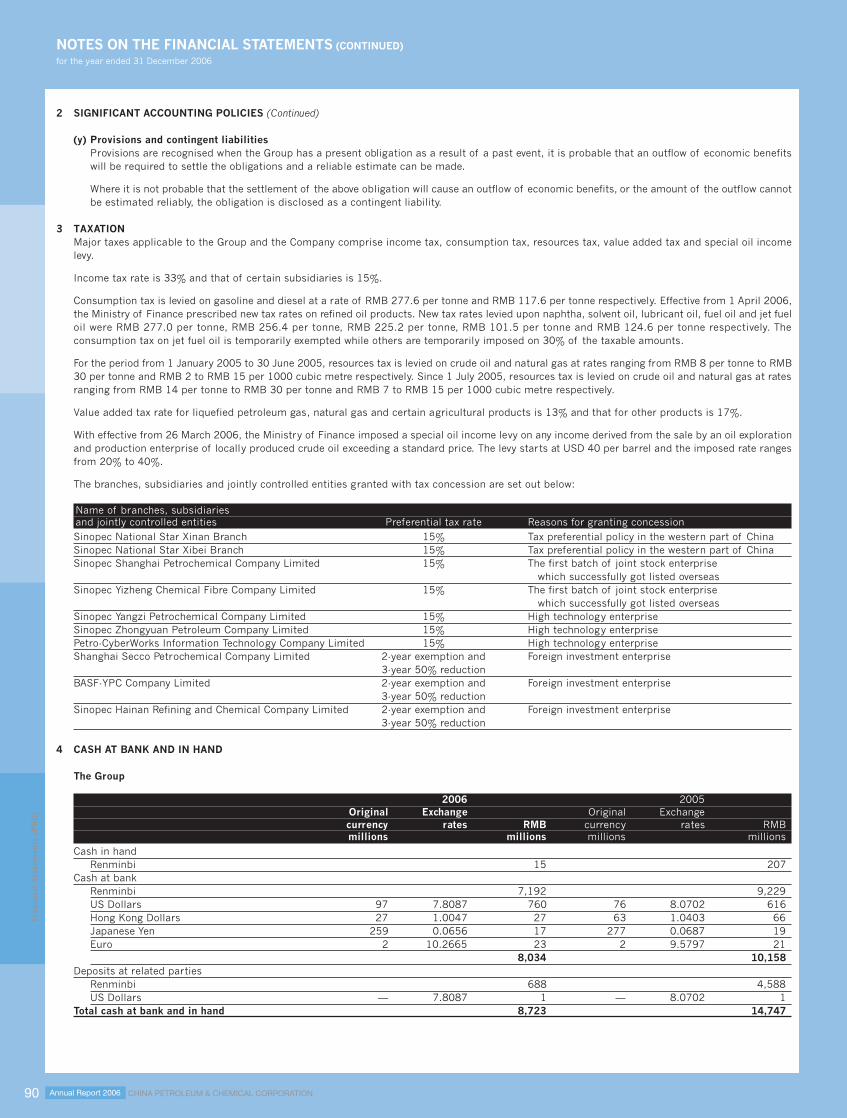
CHINA PETROLEUM & CHEMICAL CORPORATIONAnnual Report 200690
NOTES ON THE FINANCIAL STATEMENTS (CONTINUED)for the year ended 31 December 2006
Fina
ncia
l S
tate
men
ts (
PR
C)
2 SIGNIFICANT ACCOUNTING POLICIES (Continued)
(y) Provisions and contingent liabilitiesProvisions are recognised when the Group has a present obligation as a result of a past event, it is probable that an outflow of economic benefitswill be required to settle the obligations and a reliable estimate can be made.
Where it is not probable that the settlement of the above obligation will cause an outflow of economic benefits, or the amount of the outflow cannotbe estimated reliably, the obligation is disclosed as a contingent liability.
3 TAXATIONMajor taxes applicable to the Group and the Company comprise income tax, consumption tax, resources tax, value added tax and special oil incomelevy.
Income tax rate is 33% and that of certain subsidiaries is 15%.
Consumption tax is levied on gasoline and diesel at a rate of RMB 277.6 per tonne and RMB 117.6 per tonne respectively. Effective from 1 April 2006,the Ministry of Finance prescribed new tax rates on refined oil products. New tax rates levied upon naphtha, solvent oil, lubricant oil, fuel oil and jet fueloil were RMB 277.0 per tonne, RMB 256.4 per tonne, RMB 225.2 per tonne, RMB 101.5 per tonne and RMB 124.6 per tonne respectively. Theconsumption tax on jet fuel oil is temporarily exempted while others are temporarily imposed on 30% of the taxable amounts.
For the period from 1 January 2005 to 30 June 2005, resources tax is levied on crude oil and natural gas at rates ranging from RMB 8 per tonne to RMB30 per tonne and RMB 2 to RMB 15 per 1000 cubic metre respectively. Since 1 July 2005, resources tax is levied on crude oil and natural gas at ratesranging from RMB 14 per tonne to RMB 30 per tonne and RMB 7 to RMB 15 per 1000 cubic metre respectively.
Value added tax rate for liquefied petroleum gas, natural gas and certain agricultural products is 13% and that for other products is 17%.
With effective from 26 March 2006, the Ministry of Finance imposed a special oil income levy on any income derived from the sale by an oil explorationand production enterprise of locally produced crude oil exceeding a standard price. The levy starts at USD 40 per barrel and the imposed rate rangesfrom 20% to 40%.
The branches, subsidiaries and jointly controlled entities granted with tax concession are set out below:
Name of branches, subsidiariesand jointly controlled entities Preferential tax rate Reasons for granting concessionSinopec National Star Xinan Branch 15% Tax preferential policy in the western part of ChinaSinopec National Star Xibei Branch 15% Tax preferential policy in the western part of ChinaSinopec Shanghai Petrochemical Company Limited 15% The first batch of joint stock enterprise
which successfully got listed overseasSinopec Yizheng Chemical Fibre Company Limited 15% The first batch of joint stock enterprise
which successfully got listed overseasSinopec Yangzi Petrochemical Company Limited 15% High technology enterpriseSinopec Zhongyuan Petroleum Company Limited 15% High technology enterprisePetro-CyberWorks Information Technology Company Limited 15% High technology enterpriseShanghai Secco Petrochemical Company Limited 2-year exemption and Foreign investment enterprise
3-year 50% reductionBASF-YPC Company Limited 2-year exemption and Foreign investment enterprise
3-year 50% reductionSinopec Hainan Refining and Chemical Company Limited 2-year exemption and Foreign investment enterprise
3-year 50% reduction
4 CASH AT BANK AND IN HAND
The Group
2006 2005Original Exchange Original Exchangecurrency rates RMB currency rates RMBmillions millions millions millions
Cash in handRenminbi 15 207
Cash at bankRenminbi 7,192 9,229US Dollars 97 7.8087 760 76 8.0702 616Hong Kong Dollars 27 1.0047 27 63 1.0403 66Japanese Yen 259 0.0656 17 277 0.0687 19Euro 2 10.2665 23 2 9.5797 21
8,034 10,158Deposits at related parties
Renminbi 688 4,588US Dollars — 7.8087 1 — 8.0702 1
Total cash at bank and in hand 8,723 14,747
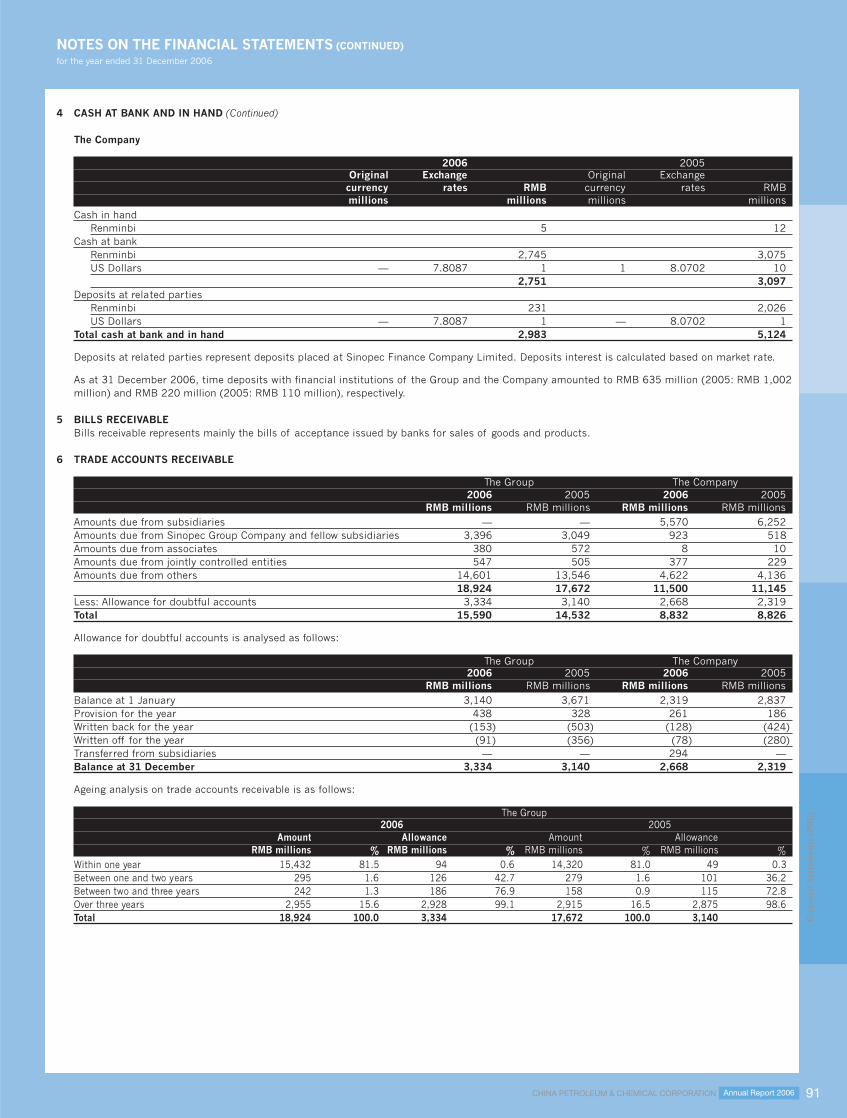
CHINA PETROLEUM & CHEMICAL CORPORATION Annual Report 2006 91
NOTES ON THE FINANCIAL STATEMENTS (CONTINUED)for the year ended 31 December 2006
Fina
ncia
l S
tate
men
ts (
PR
C)
4 CASH AT BANK AND IN HAND (Continued)
The Company
2006 2005Original Exchange Original Exchange
currency rates RMB currency rates RMBmillions millions millions millions
Cash in handRenminbi 5 12
Cash at bankRenminbi 2,745 3,075US Dollars — 7.8087 1 1 8.0702 10
2,751 3,097Deposits at related parties
Renminbi 231 2,026US Dollars — 7.8087 1 — 8.0702 1
Total cash at bank and in hand 2,983 5,124
Deposits at related parties represent deposits placed at Sinopec Finance Company Limited. Deposits interest is calculated based on market rate.
As at 31 December 2006, time deposits with financial institutions of the Group and the Company amounted to RMB 635 million (2005: RMB 1,002million) and RMB 220 million (2005: RMB 110 million), respectively.
5 BILLS RECEIVABLEBills receivable represents mainly the bills of acceptance issued by banks for sales of goods and products.
6 TRADE ACCOUNTS RECEIVABLE
The Group The Company2006 2005 2006 2005
RMB millions RMB millions RMB millions RMB millionsAmounts due from subsidiaries — — 5,570 6,252Amounts due from Sinopec Group Company and fellow subsidiaries 3,396 3,049 923 518Amounts due from associates 380 572 8 10Amounts due from jointly controlled entities 547 505 377 229Amounts due from others 14,601 13,546 4,622 4,136
18,924 17,672 11,500 11,145Less: Allowance for doubtful accounts 3,334 3,140 2,668 2,319Total 15,590 14,532 8,832 8,826
Allowance for doubtful accounts is analysed as follows:
The Group The Company2006 2005 2006 2005
RMB millions RMB millions RMB millions RMB millionsBalance at 1 January 3,140 3,671 2,319 2,837Provision for the year 438 328 261 186Written back for the year (153) (503) (128) (424)Written off for the year (91) (356) (78) (280)Transferred from subsidiaries — — 294 —Balance at 31 December 3,334 3,140 2,668 2,319
Ageing analysis on trade accounts receivable is as follows:
The Group2006 2005
Amount Allowance Amount AllowanceRMB millions % RMB millions % RMB millions % RMB millions %
Within one year 15,432 81.5 94 0.6 14,320 81.0 49 0.3Between one and two years 295 1.6 126 42.7 279 1.6 101 36.2Between two and three years 242 1.3 186 76.9 158 0.9 115 72.8Over three years 2,955 15.6 2,928 99.1 2,915 16.5 2,875 98.6Total 18,924 100.0 3,334 17,672 100.0 3,140

CHINA PETROLEUM & CHEMICAL CORPORATIONAnnual Report 200692
NOTES ON THE FINANCIAL STATEMENTS (CONTINUED)for the year ended 31 December 2006
Fina
ncia
l S
tate
men
ts (
PR
C)
6 TRADE ACCOUNTS RECEIVABLE (Continued)
The Company2006 2005
Amount Allowance Amount AllowanceRMB millions % RMB millions % RMB millions % RMB millions %
Within one year 8,655 75.3 47 0.5 8,721 78.1 45 0.5Between one and two years 219 1.9 61 27.9 164 1.5 52 31.7Between two and three years 144 1.3 101 70.1 95 0.9 70 73.7Over three years 2,482 21.5 2,459 99.1 2,165 19.5 2,152 99.4Total 11,500 100.0 2,668 11,145 100.0 2,319
Major trade accounts receivable of the Group at 31 December 2006 are set out below:
Percentage on tradeName of debtor Balance accounts receivable
RMB millions %
Heilongjiang Union Oil and Chemicals Company Limited 913 4.8North Petroleum International Company Limited 828 4.4Shell International Eastern Trading Company 699 3.7Petroleo Brasileiro S.A. 481 2.5BP Singapore Pte. Limited 453 2.4
Major trade accounts receivable of the Group at 31 December 2005 are set out below:
Percentage on tradeName of debtor Balance accounts receivable
RMB millions %Guangdong Nanhua Petroleum Company Limited 921 5.2Dongxing Oil Industry Limited 697 3.9Sinopec Railway Oil Marketing Company Limited 330 1.9SK Corporation 232 1.3Sinochem Singapore Petroleum International Company Limited 216 1.2
Except for the balances disclosed in Note 41, there is no amount due from shareholders who hold 5% or more voting right of the Company included inthe balance of trade accounts receivable.
During the years ended 31 December 2006 and 2005, the Group and the Company had no individually significant trade accounts receivable been fullyor substantially provided for.
During the years ended 31 December 2006 and 2005, the Group and the Company had no individually significant write off or recover of doubtful debtswhich had been fully or substantially provided for in prior years.
At 31 December 2006 and 2005, the Group and the Company had no individually significant trade accounts receivable that aged over three years.
7 OTHER RECEIVABLES
The Group The Company2006 2005 2006 2005
RMB millions RMB millions RMB millions RMB millionsAmounts due from subsidiaries — — 3,592 1,740Amounts due from Sinopec Group Company and fellow subsidiaries 2,102 3,059 1,784 2,708Amounts due from associates 306 521 284 501Amounts due from others 11,659 11,419 6,501 7,855
14,067 14,999 12,161 12,804Less: Allowance for doubtful accounts 3,470 3,512 3,699 3,200Total 10,597 11,487 8,462 9,604
Allowance for doubtful accounts is analysed as follows:
The Group The Company2006 2005 2006 2005
RMB millions RMB millions RMB millions RMB millionsBalance at 1 January 3,512 3,496 3,200 3,423Provision for the year 107 446 80 176Written back for the year (113) (415) (81) (386)Written off for the year (36) (15) (31) (13)Transferred from subsidiaries — — 531 —Balance at 31 December 3,470 3,512 3,699 3,200

CHINA PETROLEUM & CHEMICAL CORPORATION Annual Report 2006 93
NOTES ON THE FINANCIAL STATEMENTS (CONTINUED)for the year ended 31 December 2006
Fina
ncia
l S
tate
men
ts (
PR
C)
7 OTHER RECEIVABLES (Continued)Ageing analysis of other receivables is as follows:
The Group2006 2005
Amount Allowance Amount AllowanceRMB millions % RMB millions % RMB millions % RMB millions %
Within one year 7,250 51.5 25 0.3 9,167 61.1 15 0.2Between one and two years 1,747 12.4 49 2.8 676 4.5 33 4.9Between two and three years 397 2.9 296 74.6 447 3.0 338 75.6Over three years 4,673 33.2 3,100 66.3 4,709 31.4 3,126 66.4Total 14,067 100.0 3,470 14,999 100.0 3,512
The Company2006 2005
Amount Allowance Amount AllowanceRMB millions % RMB millions % RMB millions % RMB millions %
Within one year 6,171 50.7 9 0.1 7,127 55.7 5 0.1Between one and two years 566 4.7 31 5.5 491 3.8 19 3.9Between two and three years 254 2.1 41 16.1 748 5.8 622 83.1Over three years 5,170 42.5 3,618 70.0 4,438 34.7 2,554 57.5Total 12,161 100.0 3,699 12,804 100.0 3,200
Major other receivables of the Group at 31 December 2006 are set out below:
Percentage onName of debtor Particulars Balance other receivables
RMB millions %China Petrochemical Company Current Account 806 5.7Land Development Center of Quangang District, Quanzhou Current Account 417 3.0Qingdao Huacheng Petro Chemical Property Development Co. Ltd. Current Account 288 2.0Ningbo Taiyi Real Estate Company Limited Current Account 192 1.4CPC Ningbo Construction Co., Ltd Current Account 182 1.3
Major other receivables of the Group at 31 December 2005 are set out below:
Percentage onName of debtor Particulars Balance other receivables
RMB millions %China Petrochemical Corporation Current Account 1,507 10.0Fujian Quanzhou Qu Finance Bureau Current Account 375 2.5Jinhuang Real Estate Company Limited Current Account 208 1.4Ningbo Taiyi Real Estate Company Limited Current Account 192 1.3Qingdao Qirun Petrochemical Company Limited Current Account 162 1.0
Except for the balances disclosed in Note 41, there is no amount due from shareholders who hold 5% or more voting right of the Company included inthe balance of other receivables.
During the years ended 31 December 2006 and 2005, the Group and the Company had no individually significant other receivables been fully orsubstantially provided for.
During the years ended 31 December 2006 and 2005, the Group and the Company had no individually significant write off or recover of doubtful debtswhich had been fully or substantially provided for in prior years.
At 31 December 2006 and 2005, except for the current account with China Petrochemical Company, the Group and the Company had no individuallysignificant other receivables that aged over three years.
8 ADVANCE PAYMENTSAll advance payments are aged within one year.
Except for the balances disclosed in Note 41, there is no amount due from shareholders who hold 5% or more voting right of the Company included inthe balance of advance payments.

CHINA PETROLEUM & CHEMICAL CORPORATIONAnnual Report 200694
NOTES ON THE FINANCIAL STATEMENTS (CONTINUED)for the year ended 31 December 2006
Fina
ncia
l S
tate
men
ts (
PR
C)
9 INVENTORIES
The Group The Company2006 2005 2006 2005
RMB millions RMB millions RMB millions RMB millionsRaw materials 54,245 53,350 28,972 25,471Work in progress 9,828 9,422 5,061 4,659Finished goods 25,762 23,163 17,574 17,980Spare parts and consumables 4,072 3,893 2,454 2,061
93,907 89,828 54,061 50,171Less: Provision for diminution in value of inventories 866 892 469 309
93,041 88,936 53,592 49,862
All of the above inventories are purchased or self-manufactured.
Provision for diminution in value of inventories is mainly against finished goods and spare parts.
Provision for diminution in value of inventories is analysed as follows:
The Group The Company2006 2005 2006 2005
RMB millions RMB millions RMB millions RMB millionsBalance at 1 January 892 906 309 394Provision for the year 419 262 154 64Written back for the year (317) (180) (41) (81)Written off (128) (96) (59) (68)Transferred from subsidiaries — — 106 —Balance at 31 December 866 892 469 309
The cost of inventories recognised as costs and expenses by the Group and the Company amounted to RMB 898,465 million (2005: RMB 683,375million) and RMB 675,493 million (2005: RMB 488,592 million) for the year ended 31 December 2006, respectively.
10 LONG-TERM EQUITY INVESTMENTS
The Group
Unlisted Provisionstock and Equity for
Listed stock other equity investment impairmentinvestment investment differences losses Total
RMB millions RMB millions RMB millions RMB millions RMB millionsBalance at 1 January 2006 823 11,647 2,003 (327) 14,146Addition for the year — 2,606 12,493 — 15,099Share of profits less losses from investments
accounted for under the equity method 25 922 — — 947Long-term equity investments accounted
for as a subsidiary (494) — — — (494)Dividends receivable/received (11) (332) — — (343)Disposal for the year — (709) (16) — (725)Amortisation for the year — — (1,158) — (1,158)Movement of provision for impairment losses — — — 11 11Balance at 31 December 2006 343 14,134 13,322 (316) 27,483
The Company
Unlisted Provisionstock and Equity for
Listed stock other equity investment impairmentinvestment investment differences losses Total
RMB millions RMB millions RMB millions RMB millions RMB millionsBalance at 1 January 2006 48,564 82,725 2,017 (103) 133,203Addition for the year — 21,512 12,470 — 33,982Reclassification (32,817) 32,817 — — —Share of profits less losses from investments
accounted for under the equity method (771) 17,048 — — 16,277Dividends receivable/received (445) (2,303) — — (2,748)Disposal for the year — (169) (14) — (183)Acquired equity interests in subsidiaries (Note) — (50,259) — — (50,259)Amortisation for the year — — (1,162) — (1,162)Movement of provision for impairment losses — — — (9) (9)Balance at 31 December 2006 14,531 101,371 13,311 (112) 129,101
Note: During the year ended 31 December 2006, the Company acquired all the assets and liabilities of Sinopec Shengli Oilfield Company Limited, Sinopec Beijing Yanhua
Petrochemical Company Limited (“Beijing Yanhua”) and Sinopec Zhenhai Refining and Chemical Company Limited (“Sinopec Zhenhai”). The above companies no
longer existed as at 31 December 2006.
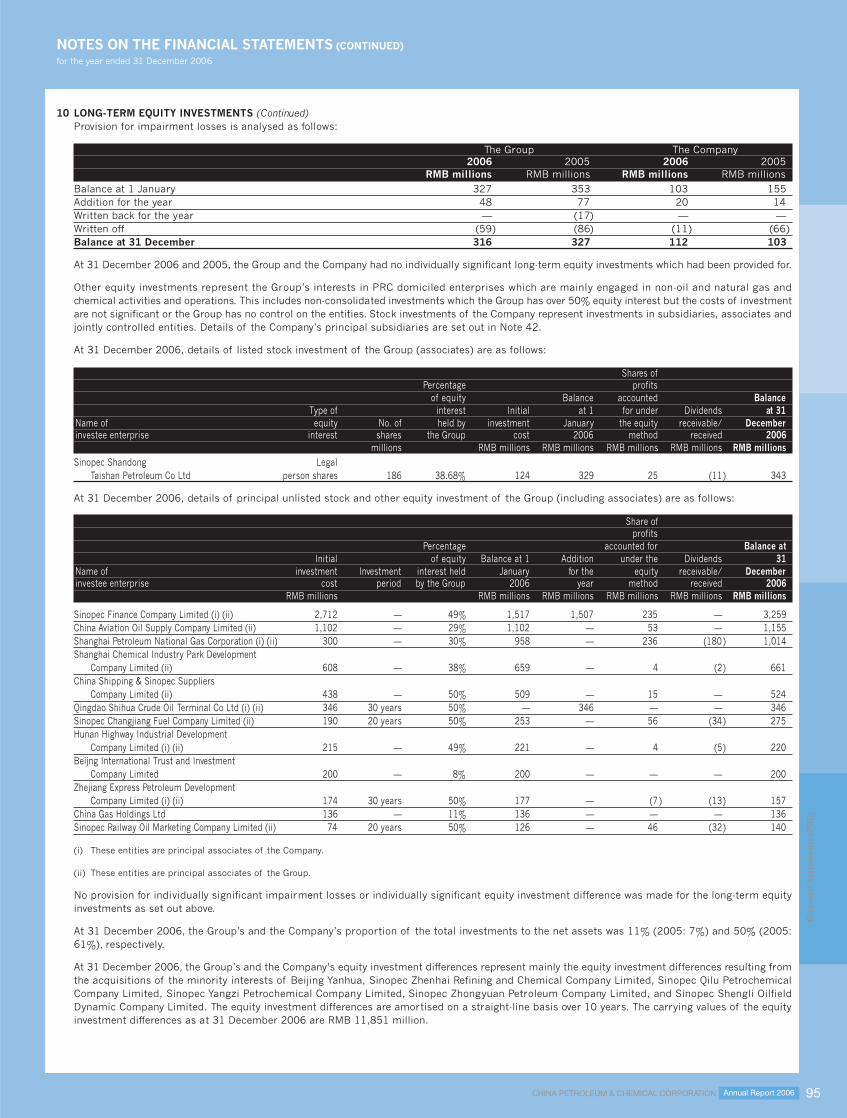
CHINA PETROLEUM & CHEMICAL CORPORATION Annual Report 2006 95
NOTES ON THE FINANCIAL STATEMENTS (CONTINUED)for the year ended 31 December 2006
Fina
ncia
l S
tate
men
ts (
PR
C)
10 LONG-TERM EQUITY INVESTMENTS (Continued)Provision for impairment losses is analysed as follows:
The Group The Company2006 2005 2006 2005
RMB millions RMB millions RMB millions RMB millionsBalance at 1 January 327 353 103 155Addition for the year 48 77 20 14Written back for the year — (17) — —Written off (59) (86) (11) (66)Balance at 31 December 316 327 112 103
At 31 December 2006 and 2005, the Group and the Company had no individually significant long-term equity investments which had been provided for.
Other equity investments represent the Group’s interests in PRC domiciled enterprises which are mainly engaged in non-oil and natural gas andchemical activities and operations. This includes non-consolidated investments which the Group has over 50% equity interest but the costs of investmentare not significant or the Group has no control on the entities. Stock investments of the Company represent investments in subsidiaries, associates andjointly controlled entities. Details of the Company’s principal subsidiaries are set out in Note 42.
At 31 December 2006, details of listed stock investment of the Group (associates) are as follows:
Shares ofPercentage profits
of equity Balance accounted BalanceType of interest Initial at 1 for under Dividends at 31
Name of equity No. of held by investment January the equity receivable/ Decemberinvestee enterprise interest shares the Group cost 2006 method received 2006
millions RMB millions RMB millions RMB millions RMB millions RMB millionsSinopec Shandong Legal
Taishan Petroleum Co Ltd person shares 186 38.68% 124 329 25 (11) 343
At 31 December 2006, details of principal unlisted stock and other equity investment of the Group (including associates) are as follows:
Share ofprofits
Percentage accounted for Balance atInitial of equity Balance at 1 Addition under the Dividends 31
Name of investment Investment interest held January for the equity receivable/ Decemberinvestee enterprise cost period by the Group 2006 year method received 2006
RMB millions RMB millions RMB millions RMB millions RMB millions RMB millions
Sinopec Finance Company Limited (i) (ii) 2,712 — 49% 1,517 1,507 235 — 3,259China Aviation Oil Supply Company Limited (ii) 1,102 — 29% 1,102 — 53 — 1,155Shanghai Petroleum National Gas Corporation (i) (ii) 300 — 30% 958 — 236 (180) 1,014Shanghai Chemical Industry Park Development
Company Limited (ii) 608 — 38% 659 — 4 (2) 661China Shipping & Sinopec Suppliers
Company Limited (ii) 438 — 50% 509 — 15 — 524Qingdao Shihua Crude Oil Terminal Co Ltd (i) (ii) 346 30 years 50% — 346 — — 346Sinopec Changjiang Fuel Company Limited (ii) 190 20 years 50% 253 — 56 (34) 275Hunan Highway Industrial Development
Company Limited (i) (ii) 215 — 49% 221 — 4 (5) 220Beijng International Trust and Investment
Company Limited 200 — 8% 200 — — — 200Zhejiang Express Petroleum Development
Company Limited (i) (ii) 174 30 years 50% 177 — (7 ) (13) 157China Gas Holdings Ltd 136 — 11% 136 — — — 136Sinopec Railway Oil Marketing Company Limited (ii) 74 20 years 50% 126 — 46 (32) 140
(i) These entities are principal associates of the Company.
(ii) These entities are principal associates of the Group.
No provision for individually significant impairment losses or individually significant equity investment difference was made for the long-term equityinvestments as set out above.
At 31 December 2006, the Group’s and the Company’s proportion of the total investments to the net assets was 11% (2005: 7%) and 50% (2005:61%), respectively.
At 31 December 2006, the Group’s and the Company’s equity investment differences represent mainly the equity investment differences resulting fromthe acquisitions of the minority interests of Beijing Yanhua, Sinopec Zhenhai Refining and Chemical Company Limited, Sinopec Qilu PetrochemicalCompany Limited, Sinopec Yangzi Petrochemical Company Limited, Sinopec Zhongyuan Petroleum Company Limited, and Sinopec Shengli OilfieldDynamic Company Limited. The equity investment differences are amortised on a straight-line basis over 10 years. The carrying values of the equityinvestment differences as at 31 December 2006 are RMB 11,851 million.

CHINA PETROLEUM & CHEMICAL CORPORATIONAnnual Report 200696
NOTES ON THE FINANCIAL STATEMENTS (CONTINUED)for the year ended 31 December 2006
Fina
ncia
l S
tate
men
ts (
PR
C)
11 FIXED ASSETS
The Group – by segment
Exploration Marketingand and
production Refining distribution Chemicals Others TotalRMB millions RMB millions RMB millions RMB millions RMB millions RMB millions
Cost/valuation:Balance at 1 January 2006 189,126 122,009 76,673 180,183 4,474 572,465Addition for the year 249 145 1,280 280 456 2,410Transferred from construction in progress 26,504 26,849 9,707 15,792 161 79,013Acquisition of a subsidiary 10,621 16 — — — 10,637Reclassification (56) (600) — 725 (69) —Disposals (5,448) (1,527) (2,280) (4,428) (153) (13,836)Balance at 31 December 2006 220,996 146,892 85,380 192,552 4,869 650,689--- - - - - - - - - - - - - - - - - - - - - - - - - - - - - - - - - - - - - - - - - - - - - - - - - - - - - - - - - - - - - - - - - - - - - - - - - - - - - - - - - - - - - - - - - - - - - - - - - - - - - - - - - - - - - - - - - - - - - - - - - - - - - - - - - - - - - - - - - - - - - - - - - - - - - - - - - - - - - - - - - - - - - - - - - - - - - - - - - - - - - - - - - - - - - - - - - - - - - - - - - - - - - - - - - - - - - - - - - - - - - - - - - - - - - - - - - - - - - - - - - - - - - - - - - - - - - - - - - - - - - - - - - - - - - -
Accumulated depreciation:Balance at 1 January 2006 94,741 61,160 13,476 94,685 1,549 265,611Depreciation charge for the year 12,759 7,635 3,371 9,440 422 33,627Acquisition of a subsidiary 2,330 3 — — — 2,333Reclassification (23) (392) — 420 (5) —Written back on disposal (5,143) (1,315) (961) (2,893) (108) (10,420)Balance at 31 December 2006 104,664 67,091 15,886 101,652 1,858 291,151--- - - - - - - - - - - - - - - - - - - - - - - - - - - - - - - - - - - - - - - - - - - - - - - - - - - - - - - - - - - - - - - - - - - - - - - - - - - - - - - - - - - - - - - - - - - - - - - - - - - - - - - - - - - - - - - - - - - - - - - - - - - - - - - - - - - - - - - - - - - - - - - - - - - - - - - - - - - - - - - - - - - - - - - - - - - - - - - - - - - - - - - - - - - - - - - - - - - - - - - - - - - - - - - - - - - - - - - - - - - - - - - - - - - - - - - - - - - - - - - - - - - - - - - - - - - - - - - - - - - - - - - - - - - - - -
Net book value:Balance at 31 December 2006 116,332 79,801 69,494 90,900 3,011 359,538Balance at 31 December 2005 94,385 60,849 63,197 85,498 2,925 306,854
The Company – by segment
Exploration Marketingand and
production Refining distribution Chemicals Others TotalRMB millions RMB millions RMB millions RMB millions RMB millions RMB millions
Cost/valuation:Balance at 1 January 2006 72,478 91,960 67,548 58,840 3,380 294,206Addition for the year 192 109 1,276 7 11 1,595Transferred from construction in progress 25,317 14,920 7,735 11,717 52 59,741Transferred from subsidiaries 107,949 2,702 — 15,761 — 126,412Transferred to subsidiaries — — (746) — — (746)Reclassification (56) (600) — 725 (69) —Disposals (5,313) (1,242) (2,158) (1,723) (105) (10,541)Balance at 31 December 2006 200,567 107,849 73,655 85,327 3,269 470,667--- - - - - - - - - - - - - - - - - - - - - - - - - - - - - - - - - - - - - - - - - - - - - - - - - - - - - - - - - - - - - - - - - - - - - - - - - - - - - - - - - - - - - - - - - - - - - - - - - - - - - - - - - - - - - - - - - - - - - - - - - - - - - - - - - - - - - - - - - - - - - - - - - - - - - - - - - - - - - - - - - - - - - - - - - - - - - - - - - - - - - - - - - - - - - - - - - - - - - - - - - - - - - - - - - - - - - - - - - - - - - - - - - - - - - - - - - - - - - - - - - - - - - - - - - - - - - - - - - - - - - - - - - - - - - -
Accumulated depreciation:Balance at 1 January 2006 29,346 46,261 12,809 34,263 1,068 123,747Depreciation charge for the year 12,011 5,702 3,031 3,843 235 24,822Transferred from subsidiaries 60,961 1,470 — 9,356 — 71,787Transferred to subsidiaries — — (74) — — (74)Reclassification (23) (395) — 423 (5) —Written back on disposal (5,091) (1,083) (908) (1,230) (71) (8,383)Balance at 31 December 2006 97,204 51,955 14,858 46,655 1,227 211,899--- - - - - - - - - - - - - - - - - - - - - - - - - - - - - - - - - - - - - - - - - - - - - - - - - - - - - - - - - - - - - - - - - - - - - - - - - - - - - - - - - - - - - - - - - - - - - - - - - - - - - - - - - - - - - - - - - - - - - - - - - - - - - - - - - - - - - - - - - - - - - - - - - - - - - - - - - - - - - - - - - - - - - - - - - - - - - - - - - - - - - - - - - - - - - - - - - - - - - - - - - - - - - - - - - - - - - - - - - - - - - - - - - - - - - - - - - - - - - - - - - - - - - - - - - - - - - - - - - - - - - - - - - - - - - -
Net book value:Balance at 31 December 2006 103,363 55,894 58,797 38,672 2,042 258,768Balance at 31 December 2005 43,132 45,699 54,739 24,577 2,312 170,459

CHINA PETROLEUM & CHEMICAL CORPORATION Annual Report 2006 97
NOTES ON THE FINANCIAL STATEMENTS (CONTINUED)for the year ended 31 December 2006
Fina
ncia
l S
tate
men
ts (
PR
C)
11 FIXED ASSETS (Continued)
The Group – by asset class
Oil depots, Plant,storage machinery,
Oil tanks and equipment,Land and and gas service vehicles andbuildings properties stations others Total
RMB millions RMB millions RMB millions RMB millions RMB millionsCost/valuation:Balance at 1 January 2006 49,318 169,941 72,217 280,989 572,465Addition for the year 668 — 1,071 671 2,410Transferred from construction in progress 2,674 24,554 14,169 37,616 79,013Acquisition of a subsidiary 1,053 8,990 — 594 10,637Reclassification (1,569) 10 3,170 (1,611) —Disposals (880) (5,171) (1,658) (6,127) (13,836)Balance at 31 December 2006 51,264 198,324 88,969 312,132 650,689--- - - - - - - - - - - - - - - - - - - - - - - - - - - - - - - - - - - - - - - - - - - - - - - - - - - - - - - - - - - - - - - - - - - - - - - - - - - - - - - - - - - - - - - - - - - - - - - - - - - - - - - - - - - - - - - - - - - - - - - - - - - - - - - - - - - - - - - - - - - - - - - - - - - - - - - - - - - - - - - - - - - - - - - - - - - - - - - - - - - - - - - - - - - - - - - - - - - - - - - - - - - - - - - - - - - - - - - - - - - - - - - - - - - - - - - - - - - - - - - - - - - - - - - - - - - - - - - - - - - - - - - - - - - - - -
Accumulated depreciation:Balance at 1 January 2006 21,130 85,896 12,738 145,847 265,611Depreciation charge for the year 1,850 12,095 3,692 15,990 33,627Acquisition of a subsidiary 103 2,046 — 184 2,333Reclassification (495) (45) 1,072 (532) —Written back on disposal (385) (4,974) (747) (4,314) (10,420)Balance at 31 December 2006 22,203 95,018 16,755 157,175 291,151--- - - - - - - - - - - - - - - - - - - - - - - - - - - - - - - - - - - - - - - - - - - - - - - - - - - - - - - - - - - - - - - - - - - - - - - - - - - - - - - - - - - - - - - - - - - - - - - - - - - - - - - - - - - - - - - - - - - - - - - - - - - - - - - - - - - - - - - - - - - - - - - - - - - - - - - - - - - - - - - - - - - - - - - - - - - - - - - - - - - - - - - - - - - - - - - - - - - - - - - - - - - - - - - - - - - - - - - - - - - - - - - - - - - - - - - - - - - - - - - - - - - - - - - - - - - - - - - - - - - - - - - - - - - - - -
Net book value:Balance at 31 December 2006 29,061 103,306 72,214 154,957 359,538Balance at 31 December 2005 28,188 84,045 59,479 135,142 306,854
The Company – by asset class
Oil depots, Plant,storage machinery,
Oil tanks and equipment,Land and and gas service vehicles andbuildings properties stations others Total
RMB millions RMB millions RMB millions RMB millions RMB millionsCost/valuation:Balance at 1 January 2006 25,278 64,142 64,056 140,730 294,206Addition for the year 61 — 1,046 488 1,595Transferred from construction in progress 959 23,683 12,213 22,886 59,741Transferred from subsidiaries 3,288 101,287 — 21,837 126,412Transferred to subsidiaries — — (746) — (746)Reclassification (2,512) 10 2,845 (343) —Disposals (321) (5,144) (1,531) (3,545) (10,541)Balance at 31 December 2006 26,753 183,978 77,883 182,053 470,667--- - - - - - - - - - - - - - - - - - - - - - - - - - - - - - - - - - - - - - - - - - - - - - - - - - - - - - - - - - - - - - - - - - - - - - - - - - - - - - - - - - - - - - - - - - - - - - - - - - - - - - - - - - - - - - - - - - - - - - - - - - - - - - - - - - - - - - - - - - - - - - - - - - - - - - - - - - - - - - - - - - - - - - - - - - - - - - - - - - - - - - - - - - - - - - - - - - - - - - - - - - - - - - - - - - - - - - - - - - - - - - - - - - - - - - - - - - - - - - - - - - - - - - - - - - - - - - - - - - - - - - - - - - - - - -
Accumulated depreciation:Balance at 1 January 2006 10,329 27,358 11,943 74,117 123,747Depreciation charge for the year 928 11,513 3,095 9,286 24,822Transferred from subsidiaries 1,054 55,576 — 15,157 71,787Transferred to subsidiaries — — (74) — (74)Reclassification (555) (45) 1,060 (460) —Written back on disposal (217) (4,948) (696) (2,522) (8,383)Balance at 31 December 2006 11,539 89,454 15,328 95,578 211,899--- - - - - - - - - - - - - - - - - - - - - - - - - - - - - - - - - - - - - - - - - - - - - - - - - - - - - - - - - - - - - - - - - - - - - - - - - - - - - - - - - - - - - - - - - - - - - - - - - - - - - - - - - - - - - - - - - - - - - - - - - - - - - - - - - - - - - - - - - - - - - - - - - - - - - - - - - - - - - - - - - - - - - - - - - - - - - - - - - - - - - - - - - - - - - - - - - - - - - - - - - - - - - - - - - - - - - - - - - - - - - - - - - - - - - - - - - - - - - - - - - - - - - - - - - - - - - - - - - - - - - - - - - - - - - -
Net book value:Balance at 31 December 2006 15,214 94,524 62,555 86,475 258,768Balance at 31 December 2005 14,949 36,784 52,113 66,613 170,459
The fixed assets and construction in progress of the Group at 30 September 1999 were revalued by registered valuers in the PRC. The valuation wasreviewed and approved by the MOF (Note 1). Surplus on revaluation was RMB 29,093 million and deficit on revaluation was RMB 3,210 million. A netsurplus on revaluation of RMB 25,883 million was resulted which has been incorporated in the Group’s financial statements since the year ended 31December 1999.
In connection with the acquisitions of certain entities and related operations from Sinopec Group Company in prior years, the related fixed assets wererevalued by independent valuers in accordance with relevant PRC rules and regulations. Surplus on these revaluations of RMB 1,029 million has beenincorporated in the Group’s financial statements.
In connection with the Acquisition of Oil Production Plants, the fixed assets and construction of progress of the Oil Production Plants were revalued bya firm of independent valuers in accordance with the relevant PRC rules and regulations. The value of the fixed assets and construction of progress ofthe Oil Production Plants pursuant to the valuation approximated the net historical carrying value of the assets.
At 31 December 2006, the carrying amounts of fixed assets that were pledged by the Group and the Company were RMB 288 million (2005: RMB 83million) and RMB 75 million (2005: RMB 10 million), respectively.

CHINA PETROLEUM & CHEMICAL CORPORATIONAnnual Report 200698
NOTES ON THE FINANCIAL STATEMENTS (CONTINUED)for the year ended 31 December 2006
Fina
ncia
l S
tate
men
ts (
PR
C)
11 FIXED ASSETS (Continued)Provision for impairment losses on fixed assets is analysed as follows:
The Group – by segment
Exploration Marketingand and
production Refining distribution Chemicals TotalRMB millions RMB millions RMB millions RMB millions RMB millions
Balance at 1 January 2006 843 11 1,270 4,110 6,234Addition for the year 327 — 23 250 600Written off for the year (53) — (142) (614) (809)Balance at 31 December 2006 1,117 11 1,151 3,746 6,025
The Company – by segment
Exploration Marketingand and
production Refining distribution Chemicals TotalRMB millions RMB millions RMB millions RMB millions RMB millions
Balance at 1 January 2006 780 11 1,241 2,159 4,191Addition for the year 308 — 23 200 531Transferred from subsidiaries — 2 — — 2Written off for the year (53) — (142) (155) (350)Balance at 31 December 2006 1,035 13 1,122 2,204 4,374
The Group – by asset class
Oil depots, Plant,storage machinery,
Oil tanks and equipment,Land and and gas service vehicles andbuildings properties stations others Total
RMB millions RMB millions RMB millions RMB millions RMB millionsBalance at 1 January 2006 351 843 917 4,123 6,234Addition for the year 118 307 23 152 600Reclassification 143 — 149 (292) —Written off for the year (90) (52) (87) (580) (809)Balance at 31 December 2006 522 1,098 1,002 3,403 6,025
The Company – by asset class
Oil depots, Plant,storage machinery,
Oil tanks and equipment,Land and and gas service vehicles andbuildings properties stations others Total
RMB millions RMB millions RMB millions RMB millions RMB millionsBalance at 1 January 2006 154 780 935 2,322 4,191Addition for the year 118 307 23 83 531Transferred from subsidiaries 2 — — — 2Reclassification 143 — 149 (292) —Written off for the year (13) (52) (87) (198) (350)Balance at 31 December 2006 404 1,035 1,020 1,915 4,374
The factors resulting in the exploration and production segment of the Group provision for impairment losses of RMB 327 million (2005: RMB 60million) for the year ended 31 December 2006 were unsuccessful development drilling and high operating and development costs for certain small oilfields. The carrying values of these oil and gas properties were written down to a recoverable value which was determined based on the present valuesof the expected future cash flows of the assets. The oil and gas pricing was a factor used in the determination of the present values of the expectedfuture cash flows of the assets and had an impact on the recognition of the asset impairment.
Provision for impairment losses recognised on fixed assets of the chemicals segment of the Group of RMB 250 million (2005: RMB 1,425 million) forthe year ended 31 December 2006 relate to certain chemicals production facilities that are held for use. The carrying values of these facilities werewritten down to their recoverable values that were determined based on the asset held for use model using the present value of estimated future cashflows of the production facilities. The primary factor resulting in the provision for impairment losses of the chemicals segment was due to higheroperating and production costs caused by the increase in the prices of raw materials that are not expected to be recovered through an increase inselling price.
Provision for impairment losses recognised on fixed assets of the marketing and distribution segment of the Group of RMB 23 million (2005: RMB 366million) for the year ended 31 December 2006 primarily relate to certain service stations that were closed during the year. In measuring the amountsof impairment charges, the carrying amounts of these assets were compared to the present value of the expected future cash flows of the assets, aswell as information about sales and purchases of similar properties in the same geographic area.
At 31 December 2006 and 2005, the Group and the Company had no individually significant fixed assets which were temporarily idle or pending fordisposal.
At 31 December 2006 and 2005, the Group and the Company had no individually significant fully depreciated fixed assets which were still in use.
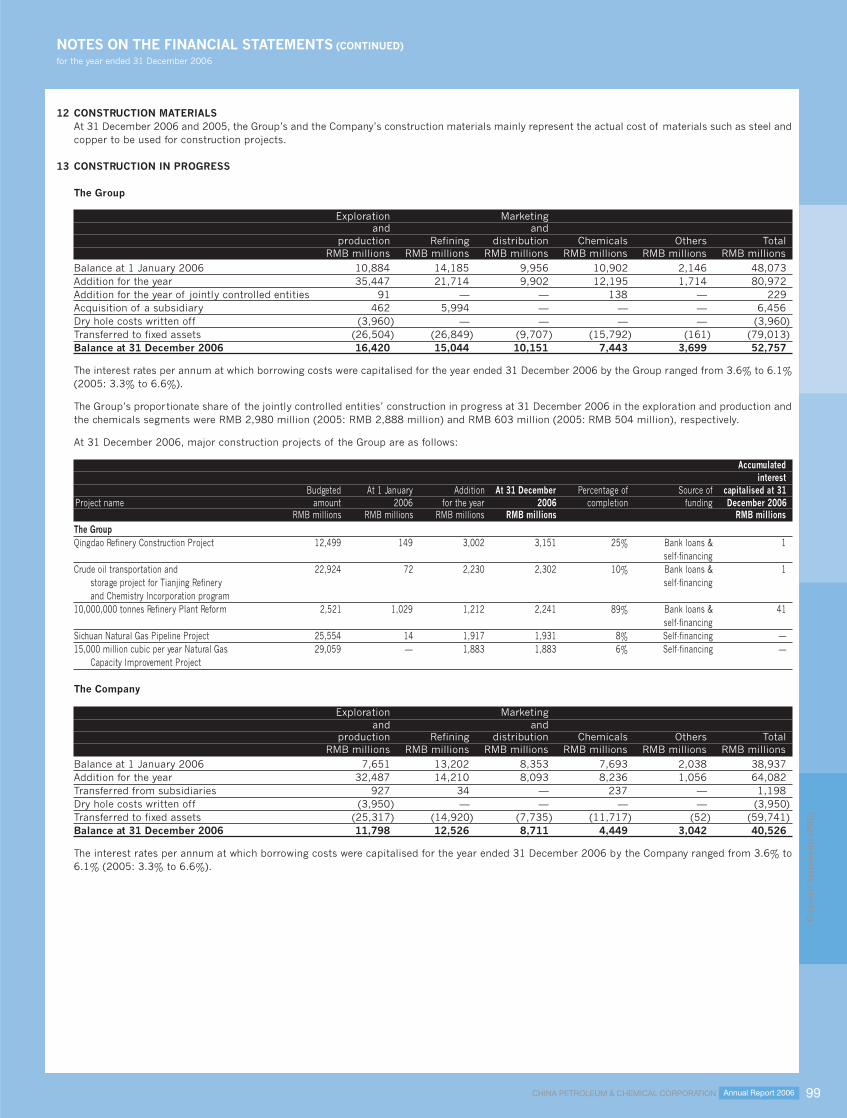
CHINA PETROLEUM & CHEMICAL CORPORATION Annual Report 2006 99
NOTES ON THE FINANCIAL STATEMENTS (CONTINUED)for the year ended 31 December 2006
Fina
ncia
l S
tate
men
ts (
PR
C)
12 CONSTRUCTION MATERIALSAt 31 December 2006 and 2005, the Group’s and the Company’s construction materials mainly represent the actual cost of materials such as steel andcopper to be used for construction projects.
13 CONSTRUCTION IN PROGRESS
The Group
Exploration Marketingand and
production Refining distribution Chemicals Others TotalRMB millions RMB millions RMB millions RMB millions RMB millions RMB millions
Balance at 1 January 2006 10,884 14,185 9,956 10,902 2,146 48,073Addition for the year 35,447 21,714 9,902 12,195 1,714 80,972Addition for the year of jointly controlled entities 91 — — 138 — 229Acquisition of a subsidiary 462 5,994 — — — 6,456Dry hole costs written off (3,960) — — — — (3,960)Transferred to fixed assets (26,504) (26,849) (9,707) (15,792) (161) (79,013)Balance at 31 December 2006 16,420 15,044 10,151 7,443 3,699 52,757
The interest rates per annum at which borrowing costs were capitalised for the year ended 31 December 2006 by the Group ranged from 3.6% to 6.1%(2005: 3.3% to 6.6%).
The Group’s proportionate share of the jointly controlled entities’ construction in progress at 31 December 2006 in the exploration and production andthe chemicals segments were RMB 2,980 million (2005: RMB 2,888 million) and RMB 603 million (2005: RMB 504 million), respectively.
At 31 December 2006, major construction projects of the Group are as follows:
Accumulatedinterest
Budgeted At 1 January Addition At 31 December Percentage of Source of capitalised at 31Project name amount 2006 for the year 2006 completion funding December 2006
RMB millions RMB millions RMB millions RMB millions RMB millionsThe GroupQingdao Refinery Construction Project 12,499 149 3,002 3,151 25% Bank loans & 1
self-financingCrude oil transportation and 22,924 72 2,230 2,302 10% Bank loans & 1
storage project for Tianjing Refinery self-financingand Chemistry Incorporation program
10,000,000 tonnes Refinery Plant Reform 2,521 1,029 1,212 2,241 89% Bank loans & 41self-financing
Sichuan Natural Gas Pipeline Project 25,554 14 1,917 1,931 8% Self-financing —15,000 million cubic per year Natural Gas 29,059 — 1,883 1,883 6% Self-financing —
Capacity Improvement Project
The Company
Exploration Marketingand and
production Refining distribution Chemicals Others TotalRMB millions RMB millions RMB millions RMB millions RMB millions RMB millions
Balance at 1 January 2006 7,651 13,202 8,353 7,693 2,038 38,937Addition for the year 32,487 14,210 8,093 8,236 1,056 64,082Transferred from subsidiaries 927 34 — 237 — 1,198Dry hole costs written off (3,950) — — — — (3,950)Transferred to fixed assets (25,317) (14,920) (7,735) (11,717) (52) (59,741)Balance at 31 December 2006 11,798 12,526 8,711 4,449 3,042 40,526
The interest rates per annum at which borrowing costs were capitalised for the year ended 31 December 2006 by the Company ranged from 3.6% to6.1% (2005: 3.3% to 6.6%).

CHINA PETROLEUM & CHEMICAL CORPORATIONAnnual Report 2006100
NOTES ON THE FINANCIAL STATEMENTS (CONTINUED)for the year ended 31 December 2006
Fina
ncia
l S
tate
men
ts (
PR
C)
14 INTANGIBLE ASSETS
The Group
ExplorationComputer and
software Technical productionlicense know-how right Others Total
RMB millions RMB millions RMB millions RMB millions RMB millionsCost:Balance at 1 January 2006 1,033 2,946 3,163 1,316 8,458Addition for the year 104 608 — 673 1,385Balance at 31 December 2006 1,137 3,554 3,163 1,989 9,843--- - - - - - - - - - - - - - - - - - - - - - - - - - - - - - - - - - - - - - - - - - - - - - - - - - - - - - - - - - - - - - - - - - - - - - - - - - - - - - - - - - - - - - - - - - - - - - - - - - - - - - - - - - - - - - - - - - - - - - - - - - - - - - - - - - - - - - - - - - - - - - - - - - - - - - - - - - - - - - - - - - - - - - - - - - - - - - - - - - - - - - - - - - - - - - - - - - - - - - - - - - - - - - - - - - - - - - - - - - - - - - - - - - - - - - - - - - - - - - - - - - - - - - - - - - - - - - - - - - - - - - - - - - - - - -
Accumulated Amortisation:Balance at 1 January 2006 673 1,156 585 120 2,534Amortisation charge for the year 72 308 117 136 633Balance at 31 December 2006 745 1,464 702 256 3,167--- - - - - - - - - - - - - - - - - - - - - - - - - - - - - - - - - - - - - - - - - - - - - - - - - - - - - - - - - - - - - - - - - - - - - - - - - - - - - - - - - - - - - - - - - - - - - - - - - - - - - - - - - - - - - - - - - - - - - - - - - - - - - - - - - - - - - - - - - - - - - - - - - - - - - - - - - - - - - - - - - - - - - - - - - - - - - - - - - - - - - - - - - - - - - - - - - - - - - - - - - - - - - - - - - - - - - - - - - - - - - - - - - - - - - - - - - - - - - - - - - - - - - - - - - - - - - - - - - - - - - - - - - - - - - -
Net book value:Balance at 31 December 2006 392 2,090 2,461 1,733 6,676Balance at 31 December 2005 360 1,790 2,578 1,196 5,924
Except for the exploration and production right, the above intangible assets were acquired from third parties. The Company acquired Sinopec NationalStar together with the exploration and production right from Sinopec Group Company. The exploration and production right was valued with referenceto the proved reserves of the associated oil fields. The amortisation period of the exploration and production right was 27 years. The amortisationperiods of other intangible assets range from 4 to 40 years. At 31 December 2006, the remaining amortisation period of the exploration and productionright was 21 years.
The Company
ExplorationComputer and
software Technical productionlicense know-how right Others Total
RMB millions RMB millions RMB millions RMB millions RMB millionsCost:Balance at 1 January 2006 825 1,318 3,163 971 6,277Addition for the year 93 608 — 449 1,150Transferred from subsidiaries — 208 — — 208Balance at 31 December 2006 918 2,134 3,163 1,420 7,635--- - - - - - - - - - - - - - - - - - - - - - - - - - - - - - - - - - - - - - - - - - - - - - - - - - - - - - - - - - - - - - - - - - - - - - - - - - - - - - - - - - - - - - - - - - - - - - - - - - - - - - - - - - - - - - - - - - - - - - - - - - - - - - - - - - - - - - - - - - - - - - - - - - - - - - - - - - - - - - - - - - - - - - - - - - - - - - - - - - - - - - - - - - - - - - - - - - - - - - - - - - - - - - - - - - - - - - - - - - - - - - - - - - - - - - - - - - - - - - - - - - - - - - - - - - - - - - - - - - - - - - - - - - - - - -
Accumulated Amortisation:Balance at 1 January 2006 586 803 585 65 2,039Amortisation charge for the year 43 163 117 45 368Transferred from subsidiaries — 62 — — 62Balance at 31 December 2006 629 1,028 702 110 2,469--- - - - - - - - - - - - - - - - - - - - - - - - - - - - - - - - - - - - - - - - - - - - - - - - - - - - - - - - - - - - - - - - - - - - - - - - - - - - - - - - - - - - - - - - - - - - - - - - - - - - - - - - - - - - - - - - - - - - - - - - - - - - - - - - - - - - - - - - - - - - - - - - - - - - - - - - - - - - - - - - - - - - - - - - - - - - - - - - - - - - - - - - - - - - - - - - - - - - - - - - - - - - - - - - - - - - - - - - - - - - - - - - - - - - - - - - - - - - - - - - - - - - - - - - - - - - - - - - - - - - - - - - - - - - - -
Net book value:Balance at 31 December 2006 289 1,106 2,461 1,310 5,166Balance at 31 December 2005 239 515 2,578 906 4,238
Except for the exploration and production right, the above intangible assets were acquired from third parties. The Company acquired Sinopec NationalStar together with the exploration and production right from Sinopec Group Company. The exploration and production right was valued with referenceto the proved reserves of the associated oil fields. The amortisation period of the exploration and production right was 27 years. The amortisationperiods of other intangible assets range from 4 to 40 years. At 31 December 2006, the remaining amortisation period of the exploration and productionright was 21 years.
15 LONG-TERM DEFERRED EXPENSESLong-term deferred expenses primarily represent prepaid rental expenses over one year and catalysts expenditures.
16 DEFERRED TAX ASSETS AND LIABILITIES
The Group The Company2006 2005 2006 2005
RMB millions RMB millions RMB millions RMB millionsCurrentProvisions, primarily for receivables and inventories 3,526 3,444 3,334 1,226Accruals 865 456 814 409Non-currentFixed assets 2,220 1,642 1,674 1,553Tax value of losses carried forward 53 128 — —Others 46 31 17 15Deferred tax assets 6,710 5,701 5,839 3,203

CHINA PETROLEUM & CHEMICAL CORPORATION Annual Report 2006 101
NOTES ON THE FINANCIAL STATEMENTS (CONTINUED)for the year ended 31 December 2006
Fina
ncia
l S
tate
men
ts (
PR
C)
17 SHORT-TERM LOANSThe Group’s and the Company’s short-term loans represent:
The Group The Company2006 2005 2006 2005
RMB millions RMB millions RMB millions RMB millionsShort-term bank loans 25,666 15,392 15,045 3,094Loans from Sinopec Group Company and fellow subsidiaries 4,849 732 806 3,846Total 30,515 16,124 15,851 6,940
The Group’s and the Company’s weighted average interest rates per annum on short-term loans were 5.2% (2005: 4.0%) and 4.7% (2005: 3.2%)respectively at 31 December 2006. The majority of the above loans are unsecured.
Except for the balance disclosed in Note 41, there is no amount due to shareholders who hold 5% or more voting right of the Company included in thebalance of short-term loans.
At 31 December 2006 and 2005, the Group and the Company had no significant overdue short-term loan.
18 BILLS PAYABLEBills payable primarily represented bank accepted bills for the purchase of material, goods and products. The repayment term is normally from threeto six months.
19 TRADE ACCOUNTS PAYABLEThe ageing analysis of trade accounts payable is as follows:
The Group2006 2005
RMB millions % RMB millions %Within 3 months 35,580 68.3 40,932 77.3Between 3 and 6 months 14,850 28.4 10,542 19.9Over 6 months 1,695 3.3 1,493 2.8Total 52,125 100.0 52,967 100.0
The Company2006 2005
RMB millions % RMB millions %Within 3 months 24,066 63.3 22,129 76.7Between 3 and 6 months 12,485 32.8 5,792 20.1Over 6 months 1,490 3.9 912 3.2Total 38,041 100.0 28,833 100.0
Except for the balances disclosed in Note 41, there is no amount due to shareholders who hold 5% or more voting right of the Company included in thebalance of trade accounts payable.
At 31 December 2006 and 2005, the Group and the Company had no individually significant trade accounts payable aged over three years.
20 RECEIPTS IN ADVANCEExcept for the balances disclosed in Note 41, there is no amount due to shareholders who hold 5% or more voting right of the Company included in thebalance of receipts in advance.
At 31 December 2006 and 2005, the Group and the Company had no individually significant receipts in advance aged over one year.

CHINA PETROLEUM & CHEMICAL CORPORATIONAnnual Report 2006102
NOTES ON THE FINANCIAL STATEMENTS (CONTINUED)for the year ended 31 December 2006
Fina
ncia
l S
tate
men
ts (
PR
C)
21 TAXES PAYABLE
The Group The Company2006 2005 2006 2005
RMB millions RMB millions RMB millions RMB millionsValue added tax (859) (2,240) (591) (1,796)Consumption tax 1,744 1,348 1,362 1,031Income tax 9,176 5,029 7,162 2,494Business tax 88 45 81 25Other taxes 1,199 1,080 757 321Total 11,348 5,262 8,771 2,075
The provision for PRC current income tax is based on a statutory rate of 33% of the assessable income of the Group and the Company as determinedin accordance with the relevant tax rules and regulations of the PRC during the years ended 31 December 2006 and 2005, except for certain branchesand subsidiaries of the Company, which are taxed at a preferential rate of 15%, and certain jointly controlled entities of the Company, which areentitled to a tax holiday of a tax-free period for the first two years and a 50% reduction in income tax for the following three years.
22 OTHER PAYABLESAt 31 December 2006 and 2005, the Group’s and the Company’s other payables primarily represented payables for special oil income levy, resourcescompensation fee and education surcharge.
23 OTHER CREDITORSAt 31 December 2006 and 2005, the Group’s and the Company’s other creditors primarily represented payables for constructions.
Except for the balances disclosed in Note 41, there is no amount due to shareholders who hold 5% or more voting right of the Company included in thebalance of other creditors.
At 31 December 2006 and 2005, the Group and the Company had no individually significant other creditors aged over three years.
24 ACCRUED EXPENSESAt 31 December 2006 and 2005, the Group’s and the Company’s accrued expenses primarily represented accrued interest expenses, repair andmaintenance expenses, research and development expenses and other production expenses.
25 CURRENT PORTION OF LONG-TERM LOANSThe Group’s and the Company’s current portion of long-term loans represent:
The Group The Company2006 2005 2006 2005
RMB millions RMB millions RMB millions RMB millionsLong-term bank loans
— Renminbi loans 13,909 11,952 12,443 9,694— Japanese Yen loans 526 615 526 615— US Dollar loans 831 2,206 314 1,710— Euro loans 25 24 25 24— Hong Kong Dollar loans — 82 — —
15,291 14,879 13,308 12,043---- - - - - - - - - - - - - - - - - - - - - - - - - - - - - - - - - - - - - - - - - - - - - - - - - - - - - - - - - - - - - - - - - - - - - - - - - - - - - - - - - - - - - - - - - - - - - - - - - - - - - - - - - - - - - - - - - - - - - - - - - - - - - - - - - - - - - - - - - - - - - - - - - - - - - - - - - - - - - - - - - - - - - - - - - - - - - - - - - - - - - - - - - - - - - - - - - - - - - - - - - - - - - - - - - - - - - - - - - - - - - - - - - - - - - - - - - - - - - - - - - - - - - - - - - - - - - - - - - - - - - - - - - - - - -
Long-term bank loans of jointly controlled entities— Renminbi loans 183 82 — —— US Dollar loans 307 111 — —
490 193 — —- - - - - - - - - - - - - - - - - - - - - - - - - - - - - - - - - - - - - - - - - - - - - - - - - - - - - - - - - - - - - - - - - - - - - - - - - - - - - - - - - - - - - - - - - - - - - - - - - - - - - - - - - - - - - - - - - - - - - - - - - - - - - - - - - - - - - - - - - - - - - - - - - - - - - - - - - - - - - - - - - - - - - - - - - - - - - - - - - - - - - - - - - - - - - - - - - - - - - - - - - - - - - - - - - - - - - - - - - - - - - - - - - - - - - - - - - - - - - - - - - - - - - - - - - - - - - - - - - - - - - - - - - - - - - - - -
Long-term other loans— Renminbi loans 22 22 — —— US Dollar loans 5 4 3 1
27 26 3 1---- - - - - - - - - - - - - - - - - - - - - - - - - - - - - - - - - - - - - - - - - - - - - - - - - - - - - - - - - - - - - - - - - - - - - - - - - - - - - - - - - - - - - - - - - - - - - - - - - - - - - - - - - - - - - - - - - - - - - - - - - - - - - - - - - - - - - - - - - - - - - - - - - - - - - - - - - - - - - - - - - - - - - - - - - - - - - - - - - - - - - - - - - - - - - - - - - - - - - - - - - - - - - - - - - - - - - - - - - - - - - - - - - - - - - - - - - - - - - - - - - - - - - - - - - - - - - - - - - - - - - - - - - - - - -
Long-term loans from Sinopec Group Company and fellow subsidiaries— Renminbi loans 552 100 552 100---- - - - - - - - - - - - - - - - - - - - - - - - - - - - - - - - - - - - - - - - - - - - - - - - - - - - - - - - - - - - - - - - - - - - - - - - - - - - - - - - - - - - - - - - - - - - - - - - - - - - - - - - - - - - - - - - - - - - - - - - - - - - - - - - - - - - - - - - - - - - - - - - - - - - - - - - - - - - - - - - - - - - - - - - - - - - - - - - - - - - - - - - - - - - - - - - - - - - - - - - - - - - - - - - - - - - - - - - - - - - - - - - - - - - - - - - - - - - - - - - - - - - - - - - - - - - - - - - - - - - - - - - - - - - -
Total current portion of long-term loans 16,360 15,198 13,863 12,144
At 31 December 2006 and 2005, the Group and the Company had no significant overdue long-term loan.

CHINA PETROLEUM & CHEMICAL CORPORATION Annual Report 2006 103
NOTES ON THE FINANCIAL STATEMENTS (CONTINUED)for the year ended 31 December 2006
Fina
ncia
l S
tate
men
ts (
PR
C)
26 LONG-TERM LOANSThe Group’s and the Company’s long-term loans represent:
The Group The CompanyInterest rate and final maturity 2006 2005 2006 2005
RMB millions RMB millions RMB millions RMB millions
Third parties debtsLong-term bank loansRenminbi loans Interest rates ranging from interest free 65,484 59,769 55,457 54,792
to 6.9% per annum at 31 December 2006with maturities through 2016
Japanese Yen loans Interest rates ranging from 2.6% to 5.8% 2,713 3,394 2,713 3,394per annum at 31 December 2006with maturities through 2024
US Dollar loans Interest rates ranging from interest free 2,081 5,056 1,192 3,571to 7.4% per annum at 31 December 2006with maturities through 2031
Euro loans Fixed rate at 6.7% per annum 101 117 101 117at 31 December 2006 withmaturities through 2010
Hong Kong Dollar loans Floating rate at Hong Kong Prime Rate — 94 — —plus 0.8% to 1.1% per annumat 31 December 2006 with maturitiesthrough 2007, paid offas at 31 December 2006
Less: Current portion 15,291 14,879 13,308 12,043Long-term bank loans 55,088 53,551 46,155 49,831--- - - - - - - - - - - - - - - - - - - - - - - - - - - - - - - - - - - - - - - - - - - - - - - - - - - - - - - - - - - - - - - - - - - - - - - - - - - - - - - - - - - - - - - - - - - - - - - - - - - - - - - - - - - - - - - - - - - - - - - - - - - - - - - - - - - - - - - - - - - - - - - - - - - - - - - - - - - - - - - - - - - - - - - - - - - - - - - - - - - - - - - - - - - - - - - - - - - - - - - - - - - - - - - - - - - - - - - - - - - - - - - - - - - - - - - - - - - - - - - - - - - - - - - - - - - - - - - - - - - - - - - - - - - - - -
Long-term bank loans of jointly controlled entitiesRenminbi loans Floating rate at 90% of PBOC’s base 5,019 5,710 — —
lending rate per annum at 31 December 2006with maturities through 2021
US Dollar loans Floating rate at London Interbank Offer 3,738 4,296 — —Rate plus 0.4% to 0.7% per annumat 31 December 2006 withmaturities through 2021
Less: Current portion 490 193 — —Long-term bank loans of jointly controlled entities 8,267 9,813 — —- - - - - - - - - - - - - - - - - - - - - - - - - - - - - - - - - - - - - - - - - - - - - - - - - - - - - - - - - - - - - - - - - - - - - - - - - - - - - - - - - - - - - - - - - - - - - - - - - - - - - - - - - - - - - - - - - - - - - - - - - - - - - - - - - - - - - - - - - - - - - - - - - - - - - - - - - - - - - - - - - - - - - - - - - - - - - - - - - - - - - - - - - - - - - - - - - - - - - - - - - - - - - - - - - - - - - - - - - - - - - - - - - - - - - - - - - - - - - - - - - - - - - - - - - - - - - - - - - - - - - - - - - - - - - - - -
Other long-term loansRenminbi loans Interest rates ranging from interest free 3,098 170 3,007 37
to 5.2% per annum at 31 December 2006with maturities through 2009
US Dollar loans Interest rates ranging from interest free 44 51 30 34to 2.0% per annum at 31 December 2006with maturities through 2015
Less: Current portion 27 26 3 1Other long-term loans 3,115 195 3,034 70--- - - - - - - - - - - - - - - - - - - - - - - - - - - - - - - - - - - - - - - - - - - - - - - - - - - - - - - - - - - - - - - - - - - - - - - - - - - - - - - - - - - - - - - - - - - - - - - - - - - - - - - - - - - - - - - - - - - - - - - - - - - - - - - - - - - - - - - - - - - - - - - - - - - - - - - - - - - - - - - - - - - - - - - - - - - - - - - - - - - - - - - - - - - - - - - - - - - - - - - - - - - - - - - - - - - - - - - - - - - - - - - - - - - - - - - - - - - - - - - - - - - - - - - - - - - - - - - - - - - - - - - - - - - - - -
Long-term loans from Sinopec Group Company and fellow subsidiariesRenminbi loans Interest rates ranging from interest free to 5.7% 39,572 39,962 39,392 39,312
per annum at 31 December 2006 withmaturities through 2020
Less: Current portion 552 100 552 100Long-term loans from Sinopec Group Company and fellow subsidiaries 39,020 39,862 38,840 39,212--- - - - - - - - - - - - - - - - - - - - - - - - - - - - - - - - - - - - - - - - - - - - - - - - - - - - - - - - - - - - - - - - - - - - - - - - - - - - - - - - - - - - - - - - - - - - - - - - - - - - - - - - - - - - - - - - - - - - - - - - - - - - - - - - - - - - - - - - - - - - - - - - - - - - - - - - - - - - - - - - - - - - - - - - - - - - - - - - - - - - - - - - - - - - - - - - - - - - - - - - - - - - - - - - - - - - - - - - - - - - - - - - - - - - - - - - - - - - - - - - - - - - - - - - - - - - - - - - - - - - - - - - - - - - - -
Long-term loans of jointly controlled entitiesfrom Sinopec Group Company and fellow subsidiaries
Renminbi loans Floating rate at 90% of PBOC’s base 75 71 — —lending rate applicable to three-yeartenor loan per annum at 31 December 2006with maturities through 2021
Long-term loans of jointly controlled entities 75 71 — —from Sinopec Group Company and fellow subsidiaries
-- - - - - - - - - - - - - - - - - - - - - - - - - - - - - - - - - - - - - - - - - - - - - - - - - - - - - - - - - - - - - - - - - - - - - - - - - - - - - - - - - - - - - - - - - - - - - - - - - - - - - - - - - - - - - - - - - - - - - - - - - - - - - - - - - - - - - - - - - - - - - - - - - - - - - - - - - - - - - - - - - - - - - - - - - - - - - - - - - - - - - - - - - - - - - - - - - - - - - - - - - - - - - - - - - - - - - - - - - - - - - - - - - - - - - - - - - - - - - - - - - - - - - - - - - - - - - - - - - - - - - - - - - - - - - - -
Total 105,565 103,492 88,029 89,113

CHINA PETROLEUM & CHEMICAL CORPORATIONAnnual Report 2006104
NOTES ON THE FINANCIAL STATEMENTS (CONTINUED)for the year ended 31 December 2006
Fina
ncia
l S
tate
men
ts (
PR
C)
26 LONG-TERM LOANS (Continued)The maturity analysis of the Group’s and the Company’s long-term loans is as follows:
The Group The Company2006 2005 2006 2005
RMB millions RMB millions RMB millions RMB millionsBetween one and two years 26,529 18,787 24,590 16,420Between two and five years 36,205 39,142 26,147 34,771After five years 42,831 45,563 37,292 37,922Total long-term loans 105,565 103,492 88,029 89,113
At 31 December 2006, the Group and the Company had secured loans from third parties amounting to RMB 171 million (2005: RMB 35 million) andRMB 46 million (2005: RMB 13 million) respectively. At 31 December 2006, the Group had loans secured by long-term investments from third partiesamounting to RMB 3,590 million (2005: RMB 3,899 million). All long-term other loans are unsecured.
Except for the balances disclosed in Note 41, there is no amount due to shareholders who hold 5% or more voting right of the Company included in thebalance of long-term loans.
27 DEBENTURES PAYABLE
The Group The Company2006 2005 2006 2005
RMB millions RMB millions RMB millions RMB millionsShort-term corporate bonds (i) 11,885 9,921 9,885 9,921Corporate bonds (ii) 3,500 3,500 3,500 3,500
(i) The Company issued six-month corporate bonds of face value at RMB 10 billion to corporate investors in PRC debenture market on 24 October2005, at a discounted value of RMB 98.75 per RMB 100 par value, with an effective yield at 2.54% per annum with maturity in April 2006.
A subsidiary of the Company issued 270-day corporate bonds of face value at RMB 1 billion to corporate investors in PRC debenture market on 23February 2006, at a discounted value of RMB 97.78 per RMB 100 par value with an effective yield of 3.07% per annum. The Company redeemedthe corporate bonds in November 2006.
The Company issued 183-day corporate bonds of face value at RMB 10 billion to corporate investors in PRC debenture market on 16 May 2006, ata discounted value of RMB 98.68 per RMB 100 par value, with an effective yield of 2.67% per annum. The Company redeemed the corporate bondsin November 2006.
The Company issued 182-day corporate bonds of face value at RMB 10 billion to corporate investors in PRC debenture market on 13 November2006, at a discounted value of RMB 98.43 per RMB 100 par value, with an effective yield of 3.20% per annum. The bonds mature in May 2007.
A subsidiary of the Company issued 365-day corporate bonds of face value at RMB 2 billion to corporate investors in the PRC debenture market on11 December 2006 at par value of RMB 100, with an effective yield 3.83% per annum. The bonds mature in December 2007.
(ii) The Company issued ten years corporate bonds of RMB 3.5 billion to PRC citizens as well as PRC legal and non-legal persons on 24 February 2004,guaranteed by Sinopec Group Company with a fixed interest rate at 4.61% per annum and annual interest payment schedule. Interest payable forthe current period was included in accrued expenses.
28 OTHER LONG-TERM LIABILITIESOther long-term liabilities primarily represent provision for future dismantlement of oil and gas properties, the costs arising from environmentalrestoration and specific research and development projects.

CHINA PETROLEUM & CHEMICAL CORPORATION Annual Report 2006 105
NOTES ON THE FINANCIAL STATEMENTS (CONTINUED)for the year ended 31 December 2006
Fina
ncia
l S
tate
men
ts (
PR
C)
29 SHARE CAPITAL
The Group and the Company2006 2005
RMB millions RMB millionsRegistered, issued and fully paid:69,921,951,000 domestic listed A shares of RMB 1.00 each 69,922 —16,780,488,000 overseas listed H shares of RMB 1.00 each 16,780 16,78067,121,951,000 domestic state-owned A shares of RMB 1.00 each — 67,1222,800,000,000 domestic listed A shares of RMB 1.00 each — 2,800
86,702 86,702
The Company was established on 25 February 2000 with a registered capital of 68.8 billion state-owned domestic shares with a par value of RMB 1.00each, which were all held by Sinopec Group Company (see Note 1).
Pursuant to the resolutions passed in the Extraordinary General Meeting of the Company held on 25 July 2000 and the approval from relevantauthorities, the Company issued 15,102,439,000 H shares with a par value of RMB 1.00 each in its initial global offering in October 2000. The sharesinclude 12,521,864,000 H shares and 25,805,750 American Depositary Shares (“ADSs”, each representing 100 H shares) at prices of HK$ 1.59 andUS$ 20.645 respectively. As part of the offering, 1,678,049,000 shares were offered in placing to Hong Kong and overseas investors.
In July 2001, the Company issued 2,800,000,000 domestic listed A shares with a par value of RMB 1.00 each at RMB 4.22.
On 25 September 2006, the shareholders of listed A shares accepted the proposal offered by the shareholders of state-owned A shares whereby theshareholders of state-owned A shares agreed to transfer 2.8 state-owned A shares to shareholders of listed A shares for every 10 listed A shares theyheld, in exchange for the approval for the listing of all state-owned A shares. The 784,000,000 state-owned A shares paid to the shareholders of listedA shares were tradable on 10 October 2006. The 66,337,551,000 domestic state-owned A shares have been granted trading right upon settlement ofthe above consideration.
All the domestic ordinary shares and H shares rank pari passu in all material aspects.
KPMG Huazhen had verified the above paid-in capital. The capital verification reports, KPMG-C (2000) CV No. 0007, KPMG-C (2001) CV No. 0002 andKPMG-C (2001) CV No. 0006 were issued on 22 February 2000, 27 February 2001 and 23 July 2001 respectively.
30 CAPITAL RESERVEThe movements in capital reserve are as follows:
The Group The Company2006 2005 2006 2005
RMB millions RMB millions RMB millions RMB millionsBalance at 1 January 37,121 37,121 37,797 37,797Gain from debt restructuring by a subsidiary (i) 486 — 486 —Reserve for equity investment (ii) — — 200 —Balance at 31 December 37,607 37,121 38,483 37,797
The capital reserve represents mainly: (a) the difference between the total amount of the par value of shares issued and the amount of the net assetstransferred from Sinopec Group Company in connection with the Reorganisation; and (b) share premiums derived from issuances of H shares and Ashares by the Company and excess of cash paid by investors over their proportionate shares in share capital.
(i) During the year ended 31 December 2006, a subsidiary of the Group reached an agreement with a bank to waive loan principal balance and relatedinterest payable. The gain in connection with the debt restructuring was reflected as an increase of capital reserve.
(ii) During the year ended 31 December 2006, the Company invested in certain newly established subsidiaries with certain non-monetary assets. Theinitial investment costs are determined based on the assets’ revalued amount. The shortfalls of the initial investment costs over the Company’sshare of the shareholders’ funds in these subsidiaries resulting from the surplus of the assets’ revalued amount over the carrying amount arerecognised in the Company’s capital reserve. Such reserve for equity investment has been eliminated in the Group’s consolidated financial statements.
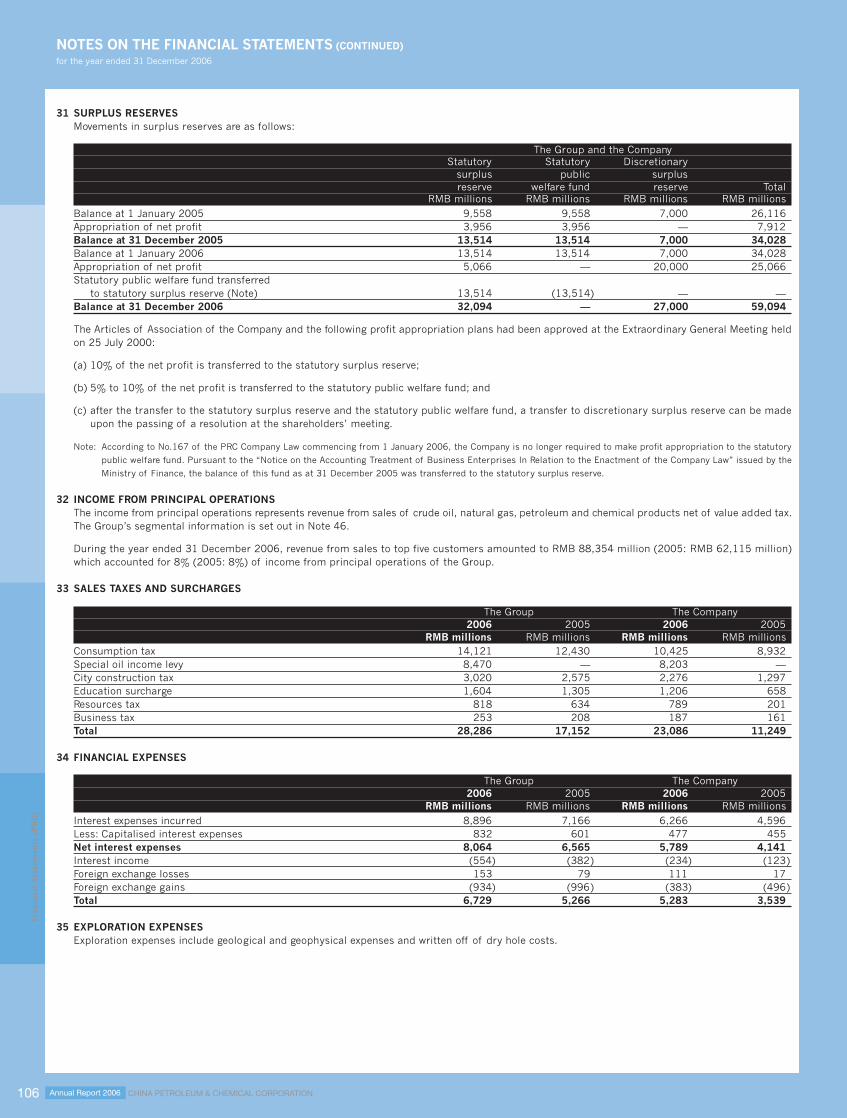
CHINA PETROLEUM & CHEMICAL CORPORATIONAnnual Report 2006106
NOTES ON THE FINANCIAL STATEMENTS (CONTINUED)for the year ended 31 December 2006
Fina
ncia
l S
tate
men
ts (
PR
C)
31 SURPLUS RESERVESMovements in surplus reserves are as follows:
The Group and the CompanyStatutory Statutory Discretionary
surplus public surplusreserve welfare fund reserve Total
RMB millions RMB millions RMB millions RMB millionsBalance at 1 January 2005 9,558 9,558 7,000 26,116Appropriation of net profit 3,956 3,956 — 7,912Balance at 31 December 2005 13,514 13,514 7,000 34,028Balance at 1 January 2006 13,514 13,514 7,000 34,028Appropriation of net profit 5,066 — 20,000 25,066Statutory public welfare fund transferred
to statutory surplus reserve (Note) 13,514 (13,514) — —Balance at 31 December 2006 32,094 — 27,000 59,094
The Articles of Association of the Company and the following profit appropriation plans had been approved at the Extraordinary General Meeting heldon 25 July 2000:
(a) 10% of the net profit is transferred to the statutory surplus reserve;
(b) 5% to 10% of the net profit is transferred to the statutory public welfare fund; and
(c) after the transfer to the statutory surplus reserve and the statutory public welfare fund, a transfer to discretionary surplus reserve can be madeupon the passing of a resolution at the shareholders’ meeting.
Note: According to No.167 of the PRC Company Law commencing from 1 January 2006, the Company is no longer required to make profit appropriation to the statutory
public welfare fund. Pursuant to the “Notice on the Accounting Treatment of Business Enterprises In Relation to the Enactment of the Company Law” issued by the
Ministry of Finance, the balance of this fund as at 31 December 2005 was transferred to the statutory surplus reserve.
32 INCOME FROM PRINCIPAL OPERATIONSThe income from principal operations represents revenue from sales of crude oil, natural gas, petroleum and chemical products net of value added tax.The Group’s segmental information is set out in Note 46.
During the year ended 31 December 2006, revenue from sales to top five customers amounted to RMB 88,354 million (2005: RMB 62,115 million)which accounted for 8% (2005: 8%) of income from principal operations of the Group.
33 SALES TAXES AND SURCHARGES
The Group The Company2006 2005 2006 2005
RMB millions RMB millions RMB millions RMB millionsConsumption tax 14,121 12,430 10,425 8,932Special oil income levy 8,470 — 8,203 —City construction tax 3,020 2,575 2,276 1,297Education surcharge 1,604 1,305 1,206 658Resources tax 818 634 789 201Business tax 253 208 187 161Total 28,286 17,152 23,086 11,249
34 FINANCIAL EXPENSES
The Group The Company2006 2005 2006 2005
RMB millions RMB millions RMB millions RMB millionsInterest expenses incurred 8,896 7,166 6,266 4,596Less: Capitalised interest expenses 832 601 477 455Net interest expenses 8,064 6,565 5,789 4,141Interest income (554) (382) (234) (123)Foreign exchange losses 153 79 111 17Foreign exchange gains (934) (996) (383) (496)Total 6,729 5,266 5,283 3,539
35 EXPLORATION EXPENSESExploration expenses include geological and geophysical expenses and written off of dry hole costs.
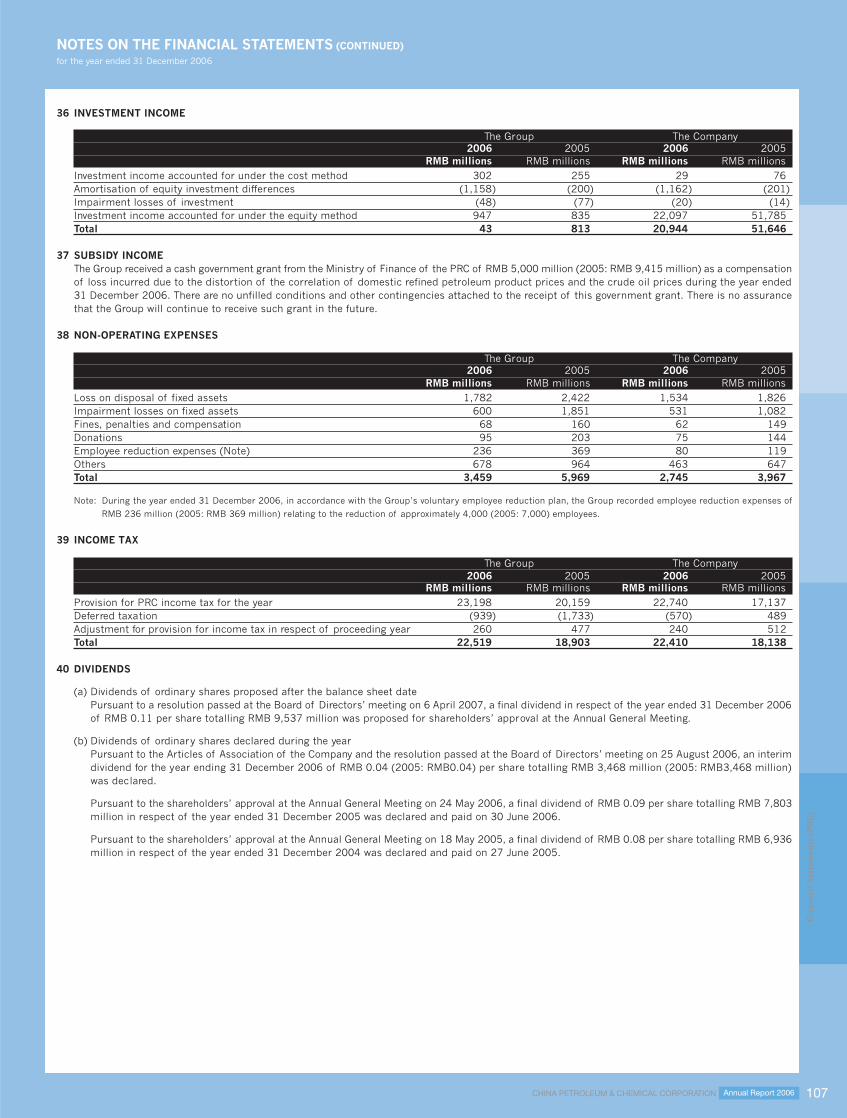
CHINA PETROLEUM & CHEMICAL CORPORATION Annual Report 2006 107
NOTES ON THE FINANCIAL STATEMENTS (CONTINUED)for the year ended 31 December 2006
Fina
ncia
l S
tate
men
ts (
PR
C)
36 INVESTMENT INCOME
The Group The Company2006 2005 2006 2005
RMB millions RMB millions RMB millions RMB millionsInvestment income accounted for under the cost method 302 255 29 76Amortisation of equity investment differences (1,158) (200) (1,162) (201)Impairment losses of investment (48) (77) (20) (14)Investment income accounted for under the equity method 947 835 22,097 51,785Total 43 813 20,944 51,646
37 SUBSIDY INCOMEThe Group received a cash government grant from the Ministry of Finance of the PRC of RMB 5,000 million (2005: RMB 9,415 million) as a compensationof loss incurred due to the distortion of the correlation of domestic refined petroleum product prices and the crude oil prices during the year ended31 December 2006. There are no unfilled conditions and other contingencies attached to the receipt of this government grant. There is no assurancethat the Group will continue to receive such grant in the future.
38 NON-OPERATING EXPENSES
The Group The Company2006 2005 2006 2005
RMB millions RMB millions RMB millions RMB millionsLoss on disposal of fixed assets 1,782 2,422 1,534 1,826Impairment losses on fixed assets 600 1,851 531 1,082Fines, penalties and compensation 68 160 62 149Donations 95 203 75 144Employee reduction expenses (Note) 236 369 80 119Others 678 964 463 647Total 3,459 5,969 2,745 3,967
Note: During the year ended 31 December 2006, in accordance with the Group’s voluntary employee reduction plan, the Group recorded employee reduction expenses of
RMB 236 million (2005: RMB 369 million) relating to the reduction of approximately 4,000 (2005: 7,000) employees.
39 INCOME TAX
The Group The Company2006 2005 2006 2005
RMB millions RMB millions RMB millions RMB millionsProvision for PRC income tax for the year 23,198 20,159 22,740 17,137Deferred taxation (939) (1,733) (570) 489Adjustment for provision for income tax in respect of proceeding year 260 477 240 512Total 22,519 18,903 22,410 18,138
40 DIVIDENDS
(a) Dividends of ordinary shares proposed after the balance sheet datePursuant to a resolution passed at the Board of Directors’ meeting on 6 April 2007, a final dividend in respect of the year ended 31 December 2006of RMB 0.11 per share totalling RMB 9,537 million was proposed for shareholders’ approval at the Annual General Meeting.
(b) Dividends of ordinary shares declared during the yearPursuant to the Articles of Association of the Company and the resolution passed at the Board of Directors’ meeting on 25 August 2006, an interimdividend for the year ending 31 December 2006 of RMB 0.04 (2005: RMB0.04) per share totalling RMB 3,468 million (2005: RMB3,468 million)was declared.
Pursuant to the shareholders’ approval at the Annual General Meeting on 24 May 2006, a final dividend of RMB 0.09 per share totalling RMB 7,803million in respect of the year ended 31 December 2005 was declared and paid on 30 June 2006.
Pursuant to the shareholders’ approval at the Annual General Meeting on 18 May 2005, a final dividend of RMB 0.08 per share totalling RMB 6,936million in respect of the year ended 31 December 2004 was declared and paid on 27 June 2005.

CHINA PETROLEUM & CHEMICAL CORPORATIONAnnual Report 2006108
NOTES ON THE FINANCIAL STATEMENTS (CONTINUED)for the year ended 31 December 2006
Fina
ncia
l S
tate
men
ts (
PR
C)
41 RELATED PARTIES AND RELATED PARTY TRANSACTIONS
(a) Related parties having the ability to exercise control over the Group
The name of the company : China Petrochemical CorporationRegistered address : No. 6A, Huixin East Street, Chaoyang District, BeijingPrincipal activities : Processing crude oil into refined products and petrochemical products, petrochemical products
which include: petrochemical products made from crude oil and natural gas; production, sale andimport and export of synthetic fibre and synthetic fibre monomer.
Relationship with the Group : Ultimate holding companyTypes of legal entity : State-ownedAuthorised representative : Chen TonghaiRegistered capital : RMB 104,912 million
There is no movement in the above registered capital for the year ended 31 December 2006.
Change of the Company’s equity interests held by Sinpec Group Company is as follows:
From 1 January 2006 to 26 September 2006 71.23%
From 27 September 2006 to 9 October 2006 76.74%
From 10 October 2006 to 31 December 2006 75.84%
(b) Related parties not having the ability to exercise control over the Group
Related parties under common control of a parent company with the Company:Sinopec Finance Company LimitedSinopec Shengli Petroleum Administration BureauSinopec Zhongyuan Petroleum Exploration BureauGuangdong Nanhua Petroleum Company LimitedQingdao Petrochemical CompanyZhanjiang Dongxing Petroleum Corporation Company LimitedBaling Petrochemical Company LimitedJinling Petrochemical Company LimitedSinopec Assets Management Corporation
Associates of the Company:Sinopec Railway Oil Marketing Company LimitedSinopec Changjiang Fuel Company LimitedChina Shipping & Sinopec Suppliers Company Limited
Jointly controlled entities of the Group:Shanghai Secco Petrochemical Company LimitedBASF-YPC Company LimitedYueyang Sinopec and Shell Coal Gasification Company LimitedBlock A Oil Field in the Western Area Chengdao in Bohai Bay

CHINA PETROLEUM & CHEMICAL CORPORATION Annual Report 2006 109
NOTES ON THE FINANCIAL STATEMENTS (CONTINUED)for the year ended 31 December 2006
Fina
ncia
l S
tate
men
ts (
PR
C)
41 RELATED PARTIES AND RELATED PARTY TRANSACTIONS (Continued)
(c) The principal related party transactions carried out in the ordinary course of business are as follows:
Note 2006 2005RMB millions RMB millions
Sales of goods (i) 129,425 95,123Purchases (ii) 60,821 48,454Transportation and storage (iii) 1,592 1,959Exploration and development services (iv) 22,060 17,001Production related services (v) 12,412 10,653Ancillary and social services (vi) 1,710 1,790Operating lease charges (vii) 3,826 3,213Agency commission income (viii) 60 48Intellectual property license fee paid (ix) — 9Interest received (x) 52 52Interest paid (xi) 1,201 994Net deposits withdrawn from related parties (xii) (3,900) (82)Net loans obtained from/(paid to) related parties (xiii) 3,731 (4,714)
The amounts set out in the table above in respect of the years ended 31 December 2006 and 2005 represent the relevant costs to the Group andincome from related parties as determined by the corresponding contracts with the related parties.
At 31 December 2006 and 2005, there were no guarantees given to banks by the Group in respect of banking facilities to Sinopec Group Companyand fellow subsidiaries.
The directors of the Company are of the opinion that the above transactions with related parties were conducted in the ordinary course of businessand on normal commercial terms or in accordance with the agreements governing such transactions, and this has been confirmed by the independentnon-executive directors.
Notes:
(i) Sales of goods represent the sale of crude oil, intermediate petrochemical products, petroleum products and ancillary materials.
(ii) Purchases represent the purchase of material and utility supplies directly related to the Group’s operations such as the procurement of raw and ancillary materials
and related services, supply of water, electricity and gas.
(iii) Transportation and storage represent the cost for the use of railway, road and marine transportation services, pipelines, loading, unloading and storage facilities.
(iv) Exploration and development services comprise direct costs incurred in the exploration of crude oil such as geophysical, drilling, well testing and well measurement
services.
(v) Production related services represent ancillary services rendered in relation to the Group’s operations such as equipment repair and general maintenance, insurance
premium, technical research, communications, fire fighting, security, product quality testing and analysis, information technology, design and engineering, construction
which includes the construction of oilfield ground facilities, refineries and chemical plants, manufacture of replacement parts and machinery, installation, project
management and environmental protection.
(vi) Ancillary and social services represent expenditures for social welfare and support services such as educational facilities, media communication services, sanitation,
accommodation, canteens, property maintenance and management services.
(vii) Operating lease charges represent the rental paid to Sinopec Group Company for operating leases in respect of land, buildings and equipments.
(viii)Agency commission income represents commission earned for acting as an agent in respect of sales of products and purchase of goods of certain entities owned
by Sinopec Group Company.
(ix) Intellectual property license fee represents reimbursement paid to Sinopec Group Company for fees required to maintain the validity of certain licenses for trademarks,
patents, technology and computer software.
(x) Interest received represents interest received from deposits placed with Sinopec Finance Company Limited, a finance company controlled by Sinopec Group Company.
The applicable interest rate is determined in accordance with the prevailing saving deposit rate.
(xi) Interest paid represents interest charges on the loans obtained from Sinopec Group Company and Sinopec Finance Company Limited.
(xii)Net deposits withdrawn from related parties represent net deposits were withdrawn from/placed with Sinopec Finance Company Limited.
(xiii)The Group obtained/repaid loans from/to Sinopec Group Company and Sinopec Finance Company Limited. The calculated periodic balance of average loan for the
year ended 31 December 2006, which is based on monthly average balances, was RMB 47,593 million (2005: RMB 42,518 million).
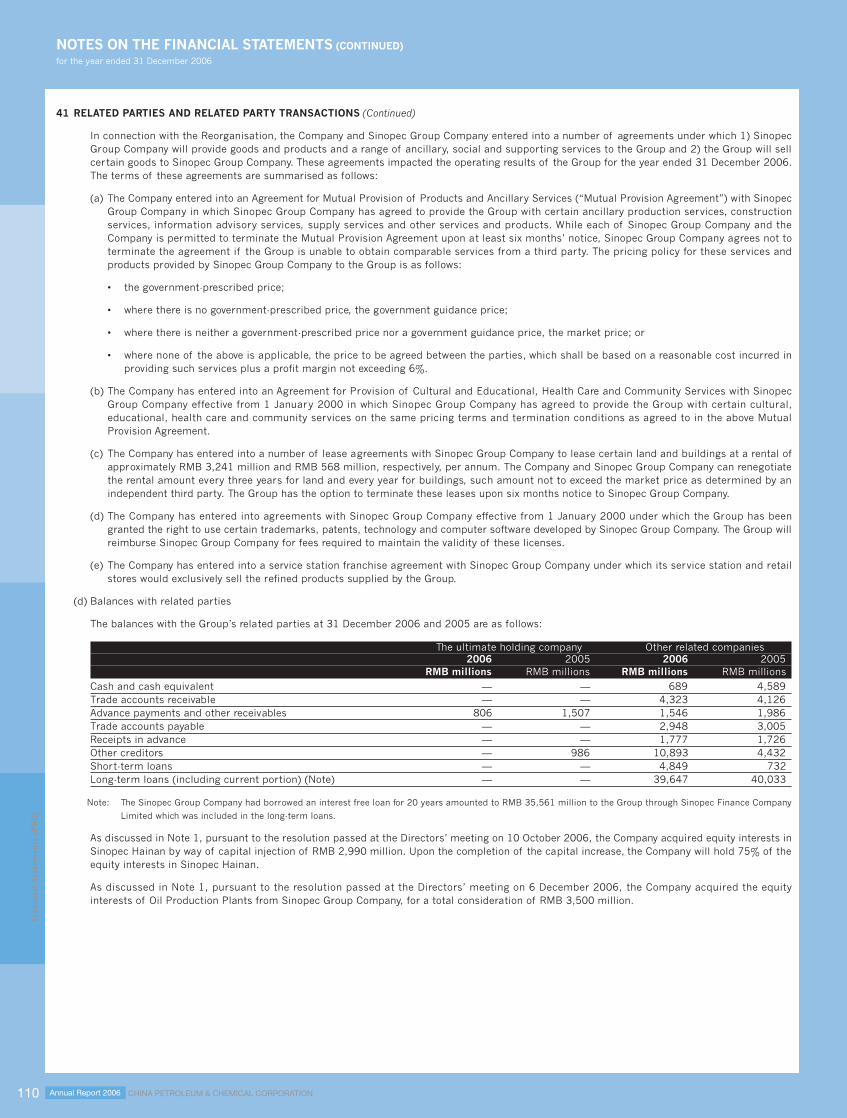
CHINA PETROLEUM & CHEMICAL CORPORATIONAnnual Report 2006110
NOTES ON THE FINANCIAL STATEMENTS (CONTINUED)for the year ended 31 December 2006
Fina
ncia
l S
tate
men
ts (
PR
C)
41 RELATED PARTIES AND RELATED PARTY TRANSACTIONS (Continued)
In connection with the Reorganisation, the Company and Sinopec Group Company entered into a number of agreements under which 1) SinopecGroup Company will provide goods and products and a range of ancillary, social and supporting services to the Group and 2) the Group will sellcertain goods to Sinopec Group Company. These agreements impacted the operating results of the Group for the year ended 31 December 2006.The terms of these agreements are summarised as follows:
(a) The Company entered into an Agreement for Mutual Provision of Products and Ancillary Services (“Mutual Provision Agreement”) with SinopecGroup Company in which Sinopec Group Company has agreed to provide the Group with certain ancillary production services, constructionservices, information advisory services, supply services and other services and products. While each of Sinopec Group Company and theCompany is permitted to terminate the Mutual Provision Agreement upon at least six months’ notice, Sinopec Group Company agrees not toterminate the agreement if the Group is unable to obtain comparable services from a third party. The pricing policy for these services andproducts provided by Sinopec Group Company to the Group is as follows:
• the government-prescribed price;
• where there is no government-prescribed price, the government guidance price;
• where there is neither a government-prescribed price nor a government guidance price, the market price; or
• where none of the above is applicable, the price to be agreed between the parties, which shall be based on a reasonable cost incurred inproviding such services plus a profit margin not exceeding 6%.
(b) The Company has entered into an Agreement for Provision of Cultural and Educational, Health Care and Community Services with SinopecGroup Company effective from 1 January 2000 in which Sinopec Group Company has agreed to provide the Group with certain cultural,educational, health care and community services on the same pricing terms and termination conditions as agreed to in the above MutualProvision Agreement.
(c) The Company has entered into a number of lease agreements with Sinopec Group Company to lease certain land and buildings at a rental ofapproximately RMB 3,241 million and RMB 568 million, respectively, per annum. The Company and Sinopec Group Company can renegotiatethe rental amount every three years for land and every year for buildings, such amount not to exceed the market price as determined by anindependent third party. The Group has the option to terminate these leases upon six months notice to Sinopec Group Company.
(d) The Company has entered into agreements with Sinopec Group Company effective from 1 January 2000 under which the Group has beengranted the right to use certain trademarks, patents, technology and computer software developed by Sinopec Group Company. The Group willreimburse Sinopec Group Company for fees required to maintain the validity of these licenses.
(e) The Company has entered into a service station franchise agreement with Sinopec Group Company under which its service station and retailstores would exclusively sell the refined products supplied by the Group.
(d) Balances with related parties
The balances with the Group’s related parties at 31 December 2006 and 2005 are as follows:
The ultimate holding company Other related companies2006 2005 2006 2005
RMB millions RMB millions RMB millions RMB millionsCash and cash equivalent — — 689 4,589Trade accounts receivable — — 4,323 4,126Advance payments and other receivables 806 1,507 1,546 1,986Trade accounts payable — — 2,948 3,005Receipts in advance — — 1,777 1,726Other creditors — 986 10,893 4,432Short-term loans — — 4,849 732Long-term loans (including current portion) (Note) — — 39,647 40,033
Note: The Sinopec Group Company had borrowed an interest free loan for 20 years amounted to RMB 35,561 million to the Group through Sinopec Finance Company
Limited which was included in the long-term loans.
As discussed in Note 1, pursuant to the resolution passed at the Directors’ meeting on 10 October 2006, the Company acquired equity interests inSinopec Hainan by way of capital injection of RMB 2,990 million. Upon the completion of the capital increase, the Company will hold 75% of theequity interests in Sinopec Hainan.
As discussed in Note 1, pursuant to the resolution passed at the Directors’ meeting on 6 December 2006, the Company acquired the equityinterests of Oil Production Plants from Sinopec Group Company, for a total consideration of RMB 3,500 million.
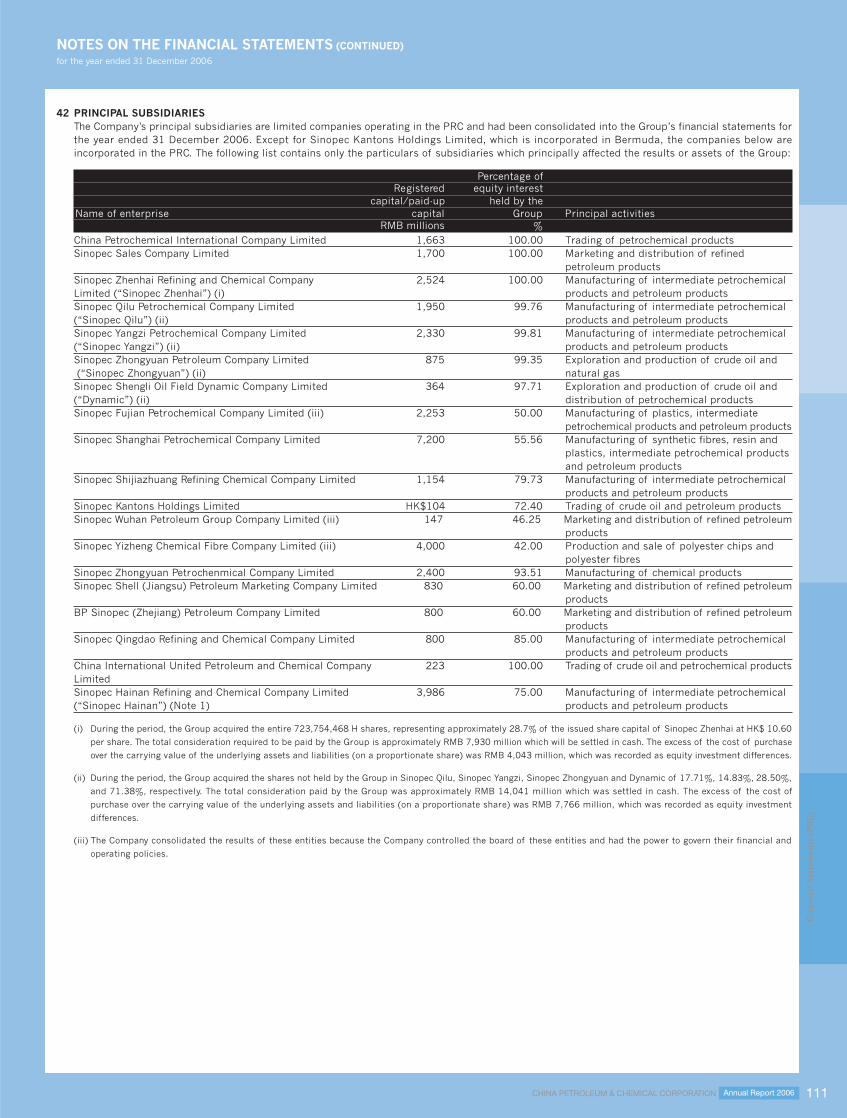
CHINA PETROLEUM & CHEMICAL CORPORATION Annual Report 2006 111
NOTES ON THE FINANCIAL STATEMENTS (CONTINUED)for the year ended 31 December 2006
Fina
ncia
l S
tate
men
ts (
PR
C)
42 PRINCIPAL SUBSIDIARIESThe Company’s principal subsidiaries are limited companies operating in the PRC and had been consolidated into the Group’s financial statements forthe year ended 31 December 2006. Except for Sinopec Kantons Holdings Limited, which is incorporated in Bermuda, the companies below areincorporated in the PRC. The following list contains only the particulars of subsidiaries which principally affected the results or assets of the Group:
Percentage ofRegistered equity interest
capital/paid-up held by theName of enterprise capital Group Principal activities
RMB millions %China Petrochemical International Company Limited 1,663 100.00 Trading of petrochemical productsSinopec Sales Company Limited 1,700 100.00 Marketing and distribution of refined
petroleum productsSinopec Zhenhai Refining and Chemical Company 2,524 100.00 Manufacturing of intermediate petrochemicalLimited (“Sinopec Zhenhai”) (i) products and petroleum productsSinopec Qilu Petrochemical Company Limited 1,950 99.76 Manufacturing of intermediate petrochemical(“Sinopec Qilu”) (ii) products and petroleum productsSinopec Yangzi Petrochemical Company Limited 2,330 99.81 Manufacturing of intermediate petrochemical(“Sinopec Yangzi”) (ii) products and petroleum productsSinopec Zhongyuan Petroleum Company Limited 875 99.35 Exploration and production of crude oil and (“Sinopec Zhongyuan”) (ii) natural gasSinopec Shengli Oil Field Dynamic Company Limited 364 97.71 Exploration and production of crude oil and(“Dynamic”) (ii) distribution of petrochemical productsSinopec Fujian Petrochemical Company Limited (iii) 2,253 50.00 Manufacturing of plastics, intermediate
petrochemical products and petroleum productsSinopec Shanghai Petrochemical Company Limited 7,200 55.56 Manufacturing of synthetic fibres, resin and
plastics, intermediate petrochemical productsand petroleum products
Sinopec Shijiazhuang Refining Chemical Company Limited 1,154 79.73 Manufacturing of intermediate petrochemicalproducts and petroleum products
Sinopec Kantons Holdings Limited HK$104 72.40 Trading of crude oil and petroleum productsSinopec Wuhan Petroleum Group Company Limited (iii) 147 46.25 Marketing and distribution of refined petroleum
productsSinopec Yizheng Chemical Fibre Company Limited (iii) 4,000 42.00 Production and sale of polyester chips and
polyester fibresSinopec Zhongyuan Petrochenmical Company Limited 2,400 93.51 Manufacturing of chemical productsSinopec Shell (Jiangsu) Petroleum Marketing Company Limited 830 60.00 Marketing and distribution of refined petroleum
productsBP Sinopec (Zhejiang) Petroleum Company Limited 800 60.00 Marketing and distribution of refined petroleum
productsSinopec Qingdao Refining and Chemical Company Limited 800 85.00 Manufacturing of intermediate petrochemical
products and petroleum productsChina International United Petroleum and Chemical Company 223 100.00 Trading of crude oil and petrochemical productsLimitedSinopec Hainan Refining and Chemical Company Limited 3,986 75.00 Manufacturing of intermediate petrochemical(“Sinopec Hainan”) (Note 1) products and petroleum products
(i) During the period, the Group acquired the entire 723,754,468 H shares, representing approximately 28.7% of the issued share capital of Sinopec Zhenhai at HK$ 10.60
per share. The total consideration required to be paid by the Group is approximately RMB 7,930 million which will be settled in cash. The excess of the cost of purchase
over the carrying value of the underlying assets and liabilities (on a proportionate share) was RMB 4,043 million, which was recorded as equity investment differences.
(ii) During the period, the Group acquired the shares not held by the Group in Sinopec Qilu, Sinopec Yangzi, Sinopec Zhongyuan and Dynamic of 17.71%, 14.83%, 28.50%,
and 71.38%, respectively. The total consideration paid by the Group was approximately RMB 14,041 million which was settled in cash. The excess of the cost of
purchase over the carrying value of the underlying assets and liabilities (on a proportionate share) was RMB 7,766 million, which was recorded as equity investment
differences.
(iii) The Company consolidated the results of these entities because the Company controlled the board of these entities and had the power to govern their financial and
operating policies.

CHINA PETROLEUM & CHEMICAL CORPORATIONAnnual Report 2006112
NOTES ON THE FINANCIAL STATEMENTS (CONTINUED)for the year ended 31 December 2006
Fina
ncia
l S
tate
men
ts (
PR
C)
43 PRINCIPAL JOINTLY CONTROLLED ENTITIESAt 31 December 2006, the Group’s and the Company’s principal jointly controlled entities are as follows:
Percentage ofPercentage of equity interest
Registered equity interest held by theName of jointly capital/paid-up held by the Group’scontrolled entities capital Company subsidiaries Principal activities
% %Shanghai Secco Petrochemical Registered capital 30.00 20.00 Manufacturing and distribution
Company Limited USD 901,440,964 of petrochemical productsBASF-YPC Company Limited Registered capital 30.00 10.00 Manufacturing and distribution
RMB 8,793,000,000 of petrochemical productsYueyang Sinopec and Shell Coal Registered capital 50.00 — Manufacturing and distribution
Gasification Company Limited USD 45,588,700 of industrial gasBlock A Oil Field in the Western Area — — 43.00 Exploration and production
Chengdao in Bohai Bay of crude oil and natural gas
44 COMMITMENTS
Operating lease commitmentsThe Group and the Company lease service stations and other equipment through non-cancellable operating leases. These operating leases do notcontain provisions for contingent lease rentals. None of the rental agreements contain escalation provisions that may require higher future rentalpayments.
At 31 December 2006, the future minimum lease payments of the Group and the Company under operating leases are as follows:
The Group The Company2006 2005 2006 2005
RMB millions RMB millions RMB millions RMB millionsWithin one year 4,711 3,593 4,457 3,424Between one and two years 4,568 3,442 4,391 3,363Between two and three years 4,531 3,388 4,359 3,319Between three and four years 4,505 3,357 4,337 3,292Between four and five years 4,450 3,353 4,372 3,290After five years 122,406 95,176 120,638 93,601Total 145,171 112,309 142,554 110,289
Capital commitmentsAt 31 December 2006, the capital commitments are as follows:
2006 2005RMB millions RMB millions
The GroupAuthorised and contracted for 113,192 71,666Authorised but not contracted for 165,967 84,213
279,159 155,879Jointly controlled entitiesAuthorised and contracted for 1,878 2,160Authorised but not contracted for 5 60
1,883 2,220The CompanyAuthorised and contracted for 95,206 55,496Authorised but not contracted for 97,699 45,938
192,905 101,434
These capital commitments relate to oil and gas exploration and development, refining and petrochemical production capacity expansion projects, theconstruction of service stations and oil depots, and capital contributions to the Group’s equity investments.

CHINA PETROLEUM & CHEMICAL CORPORATION Annual Report 2006 113
NOTES ON THE FINANCIAL STATEMENTS (CONTINUED)for the year ended 31 December 2006
Fina
ncia
l S
tate
men
ts (
PR
C)
44 COMMITMENTS (Continued)
Exploration and production licensesExploration licenses for exploration activities are registered with the Ministry of Land and Resources. The maximum term of the Group’s explorationlicenses is 7 years, and may be renewed twice within 30 days prior to expiration of the original term with each renewal being for a two-year term. TheGroup is obligated to make progressive annual minimum exploration investment relating to the exploration blocks in respect of which the license isissued. The Ministry of Land and Resources also issues production licenses to the Group on the basis of the reserve reports approved by relevantauthorities. The maximum term of a full production license is 30 years unless a special dispensation was given by the State Council. The maximumterm of the production licenses issued to the Group is 55 years as a special dispensation was given by the State Council. The Group’s productionlicense is renewable upon application by the Group 30 days prior to expiration.
The Group is required to make payments of exploration license fees and production right usage fees to the Ministry of Land and Resources annuallywhich are expensed as incurred. Payments incurred were approximately RMB 236 million for the year ended 31 December 2006 (2005: RMB 208million).
Estimated future annual payments are as follows:
The Group The Company2006 2005 2006 2005
RMB millions RMB millions RMB millions RMB millionsWithin one year 156 107 156 74Between one and two years 147 112 147 81Between two and three years 67 59 67 49Between three and four years 57 67 57 58Between four and five years 10 56 10 49After five years 226 239 226 108Total 663 640 663 419
45 CONTINGENT LIABILITIES
(a) The Company has been advised by its PRC lawyers that, except for liabilities constituting or arising out of or relating to the business assumed by theCompany in the Reorganisation, no other liabilities were assumed by the Company, and the Company is not jointly and severally liable for otherdebts and obligations incurred by Sinopec Group Company prior to the Reorganisation.
(b) At 31 December 2006, guarantees given by the Group and the Company to banks in respect of banking facilities granted to the parties below areas follows:
The Group The Company2006 2005 2006 2005
RMB millions RMB millions RMB millions RMB millionsSubsidiaries — — 2,674 2,583Associates and jointly controlled entities 160 79 11,863 11,986Total 160 79 14,537 14,569
The Company monitors the conditions that are subject to the guarantees to identify whether it is probable that a loss has occurred, and recognisesany such losses under guarantees when those losses are estimable. At 31 December 2006 and 2005, it is not probable that the Company will berequired to make payments under the guarantees. Thus no liability has been accrued for a loss related to the Company’s obligation under theguarantees arrangement.
Environmental contingenciesTo date, the Group has not incurred any significant expenditure for environmental remediation, is currently not involved in any environmental remediation,and has not accrued any amounts for environmental remediation relating to its operations. Under existing legislation, management believes that thereare no probable liabilities that will have a material adverse effect on the financial position or operating results of the Group. The PRC government,however, has moved and may move further towards more rigorous enforcement of applicable laws, and towards the adoption of more stringentenvironmental standards. Environmental liabilities are subject to considerable uncertainties which affect the Group’s ability to estimate the ultimatecost of remediation efforts. These uncertainties include: i) the exact nature and extent of the contamination at various sites including, but not limitedto refineries, oil fields, service stations, terminals and land development areas, whether operating, closed or sold; ii) the extent of required cleanupefforts; iii) varying costs of alternative remediation strategies; iv) changes in environmental remediation requirements; and v) the identification of newremediation sites. The amount of such future cost is indeterminable due to such factors as the unknown magnitude of possible contamination and theunknown timing and extent of the corrective actions that may be required. Accordingly, the outcome of environmental liabilities under proposed orfuture environmental legislation cannot reasonably be estimated at present, and could be material. The Group paid normal routine pollutant dischargefee of approximately RMB 1,637 million for the year ended 31 December 2006 (2005: RMB 493 million).
Legal contingenciesThe Group is a defendant in certain lawsuits as well as the named party in other proceedings arising in the ordinary course of business. While theoutcomes of such contingencies, lawsuits or other proceedings cannot be determined at present, management is of the opinion that any resultingliabilities will not have a material adverse effect on the financial position or operating results of the Group.

CHINA PETROLEUM & CHEMICAL CORPORATIONAnnual Report 2006114
NOTES ON THE FINANCIAL STATEMENTS (CONTINUED)for the year ended 31 December 2006
Fina
ncia
l S
tate
men
ts (
PR
C)
46 SEGMENTAL INFORMATIONThe Group has five operating segments as follows:
(i) Exploration and production – which explores and develops oil fields, produces crude oil and natural gas and sells such products to the refiningsegment of the Group and external customers.
(ii) Refining – which processes and purifies crude oil, which is sourced from the exploration and production segment of the Group and externalsuppliers, and manufactures and sells petroleum products to the chemicals, marketing and distribution segments of the Group and externalcustomers.
(iii)Marketing and distribution – which owns and operates oil depots and service stations in the PRC, and distributes and sells refined petroleumproducts (mainly gasoline and diesel) in the PRC through wholesale and retail sales networks.
(iv)Chemicals – which manufactures and sells petrochemical products, derivative petrochemical products and other chemical products to externalcustomers.
(v) Others – which largely comprise the trading activities of the import and export companies of the Group and research and development undertakenby other subsidiaries.
The segments were determined primarily because the Group manages its exploration and production, refining, marketing and distribution, chemicals,and others businesses separately. The reportable segments are each managed separately because they manufacture and / or distribute distinctproducts with different production processes and due to their distinct operating and gross margin characteristics. In view of the fact that the Companyand its subsidiaries operate mainly in the PRC, no geographical segment information is presented.
The Group evaluates the performance and allocates resources to its operating segments on an operating income basis, without considering the effectsof finance costs or investment income. The accounting policies of the Group’s segments are the same as those described in the principal accountingpolicies (see Note 2). Corporate administrative costs and assets are not allocated to the operating segments; instead, operating segments are billed fordirect corporate services. Inter-segment transfer pricing is based on cost plus an appropriate margin, as specified by the Group’s policy.
Reportable information on the Group’s operating segments is as follows:
2006 2005RMB millions RMB millions
Income from principal operationsExploration and production
External sales 23,282 19,862Inter-segment sales 105,656 84,423
128,938 104,285---- - - - - - - - - - - - - - - - - - - - - - - - - - - - - - - - - - - - - - - - - - - - - - - - - - - - - - - - - - - - - - - - - - - - - - - - - - - - - - - - - - - - - - - - - - - - - - - - - - - - - - - - - - - - - - - - - - - - - - - - - - - - - - - - - - - - - - - - - - - - - - - - - - - - - - - - - - - - - - - - - - - - - - - - - - - - - - - - - - - - - - - - - - - - - - - - - - - - - - - - - - - - - - - - - - - - - - - - - - - - - - - - - - - - - - - - - - - - - - - - - - - - - - - - - - - - - - - - - - - - - - - - - - - - -
RefiningExternal sales 99,201 82,810Inter-segment sales 471,571 386,456
570,772 469,266---- - - - - - - - - - - - - - - - - - - - - - - - - - - - - - - - - - - - - - - - - - - - - - - - - - - - - - - - - - - - - - - - - - - - - - - - - - - - - - - - - - - - - - - - - - - - - - - - - - - - - - - - - - - - - - - - - - - - - - - - - - - - - - - - - - - - - - - - - - - - - - - - - - - - - - - - - - - - - - - - - - - - - - - - - - - - - - - - - - - - - - - - - - - - - - - - - - - - - - - - - - - - - - - - - - - - - - - - - - - - - - - - - - - - - - - - - - - - - - - - - - - - - - - - - - - - - - - - - - - - - - - - - - - - -
Marketing and distributionExternal sales 588,270 459,292Inter-segment sales 4,601 3,172
592,871 462,464---- - - - - - - - - - - - - - - - - - - - - - - - - - - - - - - - - - - - - - - - - - - - - - - - - - - - - - - - - - - - - - - - - - - - - - - - - - - - - - - - - - - - - - - - - - - - - - - - - - - - - - - - - - - - - - - - - - - - - - - - - - - - - - - - - - - - - - - - - - - - - - - - - - - - - - - - - - - - - - - - - - - - - - - - - - - - - - - - - - - - - - - - - - - - - - - - - - - - - - - - - - - - - - - - - - - - - - - - - - - - - - - - - - - - - - - - - - - - - - - - - - - - - - - - - - - - - - - - - - - - - - - - - - - - -
ChemicalsExternal sales 209,133 160,783Inter-segment sales 12,299 12,199
221,432 172,982---- - - - - - - - - - - - - - - - - - - - - - - - - - - - - - - - - - - - - - - - - - - - - - - - - - - - - - - - - - - - - - - - - - - - - - - - - - - - - - - - - - - - - - - - - - - - - - - - - - - - - - - - - - - - - - - - - - - - - - - - - - - - - - - - - - - - - - - - - - - - - - - - - - - - - - - - - - - - - - - - - - - - - - - - - - - - - - - - - - - - - - - - - - - - - - - - - - - - - - - - - - - - - - - - - - - - - - - - - - - - - - - - - - - - - - - - - - - - - - - - - - - - - - - - - - - - - - - - - - - - - - - - - - - - -
OthersExternal sales 124,693 76,368Inter-segment sales 136,775 44,897
261,468 121,265---- - - - - - - - - - - - - - - - - - - - - - - - - - - - - - - - - - - - - - - - - - - - - - - - - - - - - - - - - - - - - - - - - - - - - - - - - - - - - - - - - - - - - - - - - - - - - - - - - - - - - - - - - - - - - - - - - - - - - - - - - - - - - - - - - - - - - - - - - - - - - - - - - - - - - - - - - - - - - - - - - - - - - - - - - - - - - - - - - - - - - - - - - - - - - - - - - - - - - - - - - - - - - - - - - - - - - - - - - - - - - - - - - - - - - - - - - - - - - - - - - - - - - - - - - - - - - - - - - - - - - - - - - - - - -
Elimination of inter-segment sales (730,902) (531,147)- - - - - - - - - - - - - - - - - - - - - - - - - - - - - - - - - - - - - - - - - - - - - - - - - - - - - - - - - - - - - - - - - - - - - - - - - - - - - - - - - - - - - - - - - - - - - - - - - - - - - - - - - - - - - - - - - - - - - - - - - - - - - - - - - - - - - - - - - - - - - - - - - - - - - - - - - - - - - - - - - - - - - - - - - - - - - - - - - - - - - - - - - - - - - - - - - - - - - - - - - - - - - - - - - - - - - - - - - - - - - - - - - - - - - - - - - - - - - - - - - - - - - - - - - - - - - - - - - - - - - - - - - - - - - - - -
Income from principal operations 1,044,579 799,115Cost of sales, sales taxes and surchargesExploration and production 53,052 40,118Refining 595,118 477,843Marketing and distribution 536,381 427,308Chemicals 196,274 149,431Others 258,977 118,152Elimination of inter-segment cost of sales (731,487) (527,451)Cost of sales, sales taxes and surcharges 908,315 685,401Profit from principal operationsExploration and production 76,022 59,732Refining (23,897) (7,838)Marketing and distribution 56,490 35,156Chemicals 25,158 23,551Others 2,491 3,113Profit from principal operations 136,264 113,714

CHINA PETROLEUM & CHEMICAL CORPORATION Annual Report 2006 115
NOTES ON THE FINANCIAL STATEMENTS (CONTINUED)for the year ended 31 December 2006
Fina
ncia
l S
tate
men
ts (
PR
C)
47 POST BALANCE SHEET EVENTSOn 15 February 2006, the Ministry of Finance (the “MOF”) issued the new Accounting Standards for Business Enterprises, with effect from 1 January2007, which requires the Group no longer to adopt the current Accounting Standards for Business Enterprises and “Accounting Regulations forBusiness Enterprises”. As a result of the adoption of the new accounting standards, it may cause changes to the accounting policies and the accountingestimates, and have impact on the Group’s financial position and results of operations.
On 16 March 2007, the Fifth Plenary Session of the Tenth National People’s Congress passed the Corporate Income Tax Law of the People’s Republicof China (“new tax law”), which will take effect on 1 January 2008. According to the new tax law, the corporate income tax rate for entities other thancertain high-tech enterprises and small-scale enterprises, as defined in the new tax law will be revised to 25%. In addition, entities that are currentlytaxed at preferential rates will be subject to a five-year transition period during which the tax rates will gradually be increased to the unified rate of 25%from 1 January 2008. As a result of the new tax law, it is expected that the income tax rate applicable to the Company and certain of its entities willbe reduced from 33% to 25% from 1 January 2008. However, since the detailed implementation rules as to how the existing preferential rates willgradually be increased to the unified rate of 25% over the five-year transition period have not been formulated and promulgated, management is notyet in a position to estimate the impact of the new tax law on the deferred tax assets and liabilities of certain entities which are being taxed atpreferential rates. The financial effect of the new tax law, if any, will be reflected in the Group’s 2007 financial statements. The enactment of the newtax law is not expected to have any financial effect on the amounts accrued in the balance sheet in respect of current tax payable.
On 6 December 2006, the Group announced its proposal to issue USD 1,500 million convertible bonds, which are convertible into H shares of theCompany. This proposal was subsequently approved by the shareholders of the Company at the Extraordinary General Meeting held on 22 January2007 and is subject to the approval from the relevant PRC governmental and regulatory bodies.
48 EXTRAORDINARY GAIN AND LOSSPursuant to “Questions and answers in the prepayment of information disclosures of companies issuing public shares, No.1 — Extraordinary gain andloss” (2004 revised), the extraordinary gains and losses of the Group are as follows:
2006 2005RMB millions RMB millions
Extraordinary gain and loss for the year:Loss on disposal of fixed assets 1,782 2,422Employee reduction expenses 236 369Donations 95 203Gain on disposal of long-term equity investments (25) (25)Other non-operating income and expenses, excluding impairment losses on long-lived assets 374 757Written back of provisions for impairment losses in previous years (583) (1,115)Subsidy income (5,000) (9,415)Tax effect 1,030 2,245Total (2,091) (4,559)
49 OTHER SIGNIFICANT EVENTSThe Group had no any other significant event required to disclose as at the approval date of these financial statements.

CHINA PETROLEUM & CHEMICAL CORPORATIONAnnual Report 2006116
REPORT OF THE INTERNATIONAL AUDITORSFi
nanc
ial
Sta
tem
ents
(In
tern
ati
onal
)
To the Shareholders ofChina Petroleum & Chemical Corporation(Established in The People’s Republic of China with limited liability)
We have audited the consolidated financial statements of China Petroleum & Chemical Corporation (the “Company”) set out on pages 117 to 160, whichcomprise the consolidated and company balance sheets as at 31 December 2006, and the consolidated income statement, the consolidated statement ofchanges in equity and the consolidated cash flow statement for the year then ended, and a summary of significant accounting policies and other explanatorynotes.
DIRECTORS’ RESPONSIBILITY FOR THE FINANCIAL STATEMENTSThe directors of the Company are responsible for the preparation and the true and fair presentation of these financial statements in accordance withInternational Financial Reporting Standards promulgated by the International Accounting Standards Board and the disclosure requirements of the HongKong Companies Ordinance. This responsibility includes designing, implementing and maintaining internal control relevant to the preparation and the trueand fair presentation of financial statements that are free from material misstatement, whether due to fraud or error; selecting and applying appropriateaccounting policies; and making accounting estimates that are reasonable in the circumstances.
AUDITORS’ RESPONSIBILITYOur responsibility is to express an opinion on these financial statements based on our audit. This report is made solely to you, as a body, and for no otherpurpose. We do not assume responsibility towards or accept liability to any other person for the contents of the report.
We conducted our audit in accordance with Hong Kong Standards on Auditing issued by the Hong Kong Institute of Certified Public Accountants. Thosestandards require that we comply with ethical requirements and plan and perform the audit to obtain reasonable assurance as to whether the financialstatements are free from material misstatement.
An audit involves performing procedures to obtain audit evidence about the amounts and disclosures in the financial statements. The procedures selecteddepend on the auditors’ judgement, including the assessment of the risks of material misstatement of the financial statements, whether due to fraud orerror. In making those risk assessments, the auditors consider internal control relevant to the entity’s preparation and true and fair presentation of thefinancial statements in order to design audit procedures that are appropriate in the circumstances, but not for the purpose of expressing an opinion on theeffectiveness of the entity’s internal control. An audit also includes evaluating the appropriateness of accounting policies used and the reasonableness ofaccounting estimates made by the directors, as well as evaluating the overall presentation of the financial statements.
We believe that the audit evidence we have obtained is sufficient and appropriate to provide a basis for our audit opinion.
OPINIONIn our opinion, the financial statements give a true and fair view of the state of affairs of the Company and of the Group as at 31 December 2006 and ofthe Group’s profit and cash flows for the year then ended in accordance with International Financial Reporting Standards promulgated by the InternationalAccounting Standards Board and have been properly prepared in accordance with the disclosure requirements of the Hong Kong Companies Ordinance.
KPMGCertified Public Accountants8th Floor, Prince’s Building10 Chater RoadCentral, Hong Kong
6 April 2007

CHINA PETROLEUM & CHEMICAL CORPORATION Annual Report 2006 117
(B) FINANCIAL STATEMENTS PREPARED UNDER INTERNATIONAL FINANCIAL REPORTING STANDARDS (“IFRS”)CONSOLIDATED INCOME STATEMENTfor the year ended 31 December 2006(Amounts in millions, except per share data)
Fina
ncia
l S
tate
men
ts (
Inte
rna
tion
al)
Note 2006 2005RMB RMB
Turnover and other operating revenuesTurnover 3 1,044,652 799,259Other operating revenues 4 26,750 24,013
1,071,402 823,272--- - - - - - - - - - - - - - - - - - - - - - - - - - - - - - - - - - - - - - - - - - - - - - - - - - - - - - - - - - - - - - - - - - - - - - - - - - - - - - - - - - - - - - - - - - - - - - - - - - - - - - - - - - - - - - - - - - - - - - - - - - - - - - - - - - - - - - - - - - - - - - - - - - - - - - - - - - - - - - - - - - - - - - - - - - - - - - - - - - - - - - - - - - - - - - - - - - - - - - - - - - - - - - - - - - - - - - - - - - - - - - - - - - - - - - - - - - - - - - - - - - - - - - - - - - - - - - - - - - - - - - - - - - - - - -
Other income 5 5,000 9,415--- - - - - - - - - - - - - - - - - - - - - - - - - - - - - - - - - - - - - - - - - - - - - - - - - - - - - - - - - - - - - - - - - - - - - - - - - - - - - - - - - - - - - - - - - - - - - - - - - - - - - - - - - - - - - - - - - - - - - - - - - - - - - - - - - - - - - - - - - - - - - - - - - - - - - - - - - - - - - - - - - - - - - - - - - - - - - - - - - - - - - - - - - - - - - - - - - - - - - - - - - - - - - - - - - - - - - - - - - - - - - - - - - - - - - - - - - - - - - - - - - - - - - - - - - - - - - - - - - - - - - - - - - - - - - - - - - - -
Operating expensesPurchased crude oil, products and operating supplies and expenses (861,437) (651,201)Selling, general and administrative expenses 6 (37,758) (33,880)Depreciation, depletion and amortisation (34,235) (31,618)Exploration expenses, including dry holes (7,983) (6,411)Personnel expenses 7 (19,857) (18,649)Employee reduction expenses 8 (236) (369)Taxes other than income tax 9 (28,639) (17,185)Other operating expenses, net 10 (2,437) (5,128)
Total operating expenses (992,582) (764,441)--- - - - - - - - - - - - - - - - - - - - - - - - - - - - - - - - - - - - - - - - - - - - - - - - - - - - - - - - - - - - - - - - - - - - - - - - - - - - - - - - - - - - - - - - - - - - - - - - - - - - - - - - - - - - - - - - - - - - - - - - - - - - - - - - - - - - - - - - - - - - - - - - - - - - - - - - - - - - - - - - - - - - - - - - - - - - - - - - - - - - - - - - - - - - - - - - - - - - - - - - - - - - - - - - - - - - - - - - - - - - - - - - - - - - - - - - - - - - - - - - - - - - - - - - - - - - - - - - - - - - - - - - - - - - - -
Operating profit 83,820 68,246--- - - - - - - - - - - - - - - - - - - - - - - - - - - - - - - - - - - - - - - - - - - - - - - - - - - - - - - - - - - - - - - - - - - - - - - - - - - - - - - - - - - - - - - - - - - - - - - - - - - - - - - - - - - - - - - - - - - - - - - - - - - - - - - - - - - - - - - - - - - - - - - - - - - - - - - - - - - - - - - - - - - - - - - - - - - - - - - - - - - - - - - - - - - - - - - - - - - - - - - - - - - - - - - - - - - - - - - - - - - - - - - - - - - - - - - - - - - - - - - - - - - - - - - - - - - - - - - - - - - - - - - - - - - - - - - - - - -
Finance costsInterest expense 11 (7,437) (5,926)Interest income 555 384Foreign exchange losses (153) (79)Foreign exchange gains 935 996
Net finance costs (6,100) (4,625)--- - - - - - - - - - - - - - - - - - - - - - - - - - - - - - - - - - - - - - - - - - - - - - - - - - - - - - - - - - - - - - - - - - - - - - - - - - - - - - - - - - - - - - - - - - - - - - - - - - - - - - - - - - - - - - - - - - - - - - - - - - - - - - - - - - - - - - - - - - - - - - - - - - - - - - - - - - - - - - - - - - - - - - - - - - - - - - - - - - - - - - - - - - - - - - - - - - - - - - - - - - - - - - - - - - - - - - - - - - - - - - - - - - - - - - - - - - - - - - - - - - - - - - - - - - - - - - - - - - - - - - - - - - - - - -
Investment income 256 178- - - - - - - - - - - - - - - - - - - - - - - - - - - - - - - - - - - - - - - - - - - - - - - - - - - - - - - - - - - - - - - - - - - - - - - - - - - - - - - - - - - - - - - - - - - - - - - - - - - - - - - - - - - - - - - - - - - - - - - - - - - - - - - - - - - - - - - - - - - - - - - - - - - - - - - - - - - - - - - - - - - - - - - - - - - - - - - - - - - - - - - - - - - - - - - - - - - - - - - - - - - - - - - - - - - - - - - - - - - - - - - - - - - - - - - - - - - - - - - - - - - - - - - - - - - - - - - - - - - - - - - - - - - - - - - - - - - - -
Share of profits less losses from associates 947 857- - - - - - - - - - - - - - - - - - - - - - - - - - - - - - - - - - - - - - - - - - - - - - - - - - - - - - - - - - - - - - - - - - - - - - - - - - - - - - - - - - - - - - - - - - - - - - - - - - - - - - - - - - - - - - - - - - - - - - - - - - - - - - - - - - - - - - - - - - - - - - - - - - - - - - - - - - - - - - - - - - - - - - - - - - - - - - - - - - - - - - - - - - - - - - - - - - - - - - - - - - - - - - - - - - - - - - - - - - - - - - - - - - - - - - - - - - - - - - - - - - - - - - - - - - - - - - - - - - - - - - - - - - - - - - - - - - - - -
Profit before taxation 78,923 64,656Taxation 12 (23,515) (19,880)Profit for the year 55,408 44,776Attributable to:
Equity shareholders of the Company 53,912 41,455Minority interests 1,496 3,321
Profit for the year 55,408 44,776Dividends payable to equity shareholders of the Company attributable to the year: 16Interim dividend declared during the year 3,468 3,468Final dividend proposed after the balance sheet date 9,537 7,803
13,005 11,271Basic and diluted earnings per share 17 0.62 0.48
The notes on pages 123 to 160 form part of these financial statements.

CHINA PETROLEUM & CHEMICAL CORPORATIONAnnual Report 2006118
CONSOLIDATED BALANCE SHEETat 31 December 2006(Amounts in millions)
Fina
ncia
l S
tate
men
ts (
Inte
rna
tion
al)
Note 2006 2005RMB RMB
Non-current assetsProperty, plant and equipment 18 366,475 317,382Construction in progress 19 53,180 54,380Goodwill 20 14,325 2,203Investments 22 2,582 3,151Interest in associates 23 11,617 9,267Deferred tax assets 29 7,158 6,072Lease prepayments 2,937 2,407Long-term prepayments and other assets 25 8,049 7,121
Total non-current assets 466,323 401,983--- - - - - - - - - - - - - - - - - - - - - - - - - - - - - - - - - - - - - - - - - - - - - - - - - - - - - - - - - - - - - - - - - - - - - - - - - - - - - - - - - - - - - - - - - - - - - - - - - - - - - - - - - - - - - - - - - - - - - - - - - - - - - - - - - - - - - - - - - - - - - - - - - - - - - - - - - - - - - - - - - - - - - - - - - - - - - - - - - - - - - - - - - - - - - - - - - - - - - - - - - - - - - - - - - - - - - - - - - - - - - - - - - - - - - - - - - - - - - - - - - - - - - - - - - - - - - - - - - - - - - - - - - - - - - - - - - - -
Current assetsCash and cash equivalents 8,088 14,069Time deposits with financial institutions 635 1,002Trade accounts receivable 26 15,590 14,646Bills receivable 26 8,757 7,167Inventories 27 93,436 89,519Prepaid expenses and other current assets 28 18,961 20,654
Total current assets 145,467 147,057--- - - - - - - - - - - - - - - - - - - - - - - - - - - - - - - - - - - - - - - - - - - - - - - - - - - - - - - - - - - - - - - - - - - - - - - - - - - - - - - - - - - - - - - - - - - - - - - - - - - - - - - - - - - - - - - - - - - - - - - - - - - - - - - - - - - - - - - - - - - - - - - - - - - - - - - - - - - - - - - - - - - - - - - - - - - - - - - - - - - - - - - - - - - - - - - - - - - - - - - - - - - - - - - - - - - - - - - - - - - - - - - - - - - - - - - - - - - - - - - - - - - - - - - - - - - - - - - - - - - - - - - - - - - - - - - - - - -
Current liabilitiesShort-term debts 30 53,359 40,411Loans from Sinopec Group Company and fellow subsidiaries 30 5,401 2,805Trade accounts payable 31 52,125 53,817Bills payable 31 21,685 23,243Accrued expenses and other payables 32 69,056 49,523Income tax payable 9,176 5,212
Total current liabilities 210,802 175,011--- - - - - - - - - - - - - - - - - - - - - - - - - - - - - - - - - - - - - - - - - - - - - - - - - - - - - - - - - - - - - - - - - - - - - - - - - - - - - - - - - - - - - - - - - - - - - - - - - - - - - - - - - - - - - - - - - - - - - - - - - - - - - - - - - - - - - - - - - - - - - - - - - - - - - - - - - - - - - - - - - - - - - - - - - - - - - - - - - - - - - - - - - - - - - - - - - - - - - - - - - - - - - - - - - - - - - - - - - - - - - - - - - - - - - - - - - - - - - - - - - - - - - - - - - - - - - - - - - - - - - - - - - - - - - - - - - - -
Net current liabilities (65,335) (27,954 )-- - - - - - - - - - - - - - - - - - - - - - - - - - - - - - - - - - - - - - - - - - - - - - - - - - - - - - - - - - - - - - - - - - - - - - - - - - - - - - - - - - - - - - - - - - - - - - - - - - - - - - - - - - - - - - - - - - - - - - - - - - - - - - - - - - - - - - - - - - - - - - - - - - - - - - - - - - - - - - - - - - - - - - - - - - - - - - - - - - - - - - - - - - - - - - - - - - - - - - - - - - - - - - - - - - - - - - - - - - - - - - - - - - - - - - - - - - - - - - - - - - - - - - - - - - - - - - - - - - - - - - - - - - - - - - - - - - - -
Total assets less current liabilities 400,988 374,029--- - - - - - - - - - - - - - - - - - - - - - - - - - - - - - - - - - - - - - - - - - - - - - - - - - - - - - - - - - - - - - - - - - - - - - - - - - - - - - - - - - - - - - - - - - - - - - - - - - - - - - - - - - - - - - - - - - - - - - - - - - - - - - - - - - - - - - - - - - - - - - - - - - - - - - - - - - - - - - - - - - - - - - - - - - - - - - - - - - - - - - - - - - - - - - - - - - - - - - - - - - - - - - - - - - - - - - - - - - - - - - - - - - - - - - - - - - - - - - - - - - - - - - - - - - - - - - - - - - - - - - - - - - - - - - - - - - -
Non-current liabilitiesLong-term debts 30 69,970 72,359Loans from Sinopec Group Company and fellow subsidiaries 30 39,095 39,933Deferred tax liabilities 29 6,339 5,975Other liabilities 795 782
Total non-current liabilities 116,199 119,049--- - - - - - - - - - - - - - - - - - - - - - - - - - - - - - - - - - - - - - - - - - - - - - - - - - - - - - - - - - - - - - - - - - - - - - - - - - - - - - - - - - - - - - - - - - - - - - - - - - - - - - - - - - - - - - - - - - - - - - - - - - - - - - - - - - - - - - - - - - - - - - - - - - - - - - - - - - - - - - - - - - - - - - - - - - - - - - - - - - - - - - - - - - - - - - - - - - - - - - - - - - - - - - - - - - - - - - - - - - - - - - - - - - - - - - - - - - - - - - - - - - - - - - - - - - - - - - - - - - - - - - - - - - - - - - - - - - -
284,789 254,980Equity
Share capital 33 86,702 86,702Reserves 34 176,143 137,599
Total equity attributable to equity shareholders of the Company 262,845 224,301Minority interests 21,944 30,679Total equity 284,789 254,980
Approved and authorised for issue by the board of directors on 6 April 2007.
Chen Tonghai Wang Tianpu Dai HouliangChairman Director, President Director, Senior Vice President and
Chief Financial Officer
The notes on pages 123 to 160 form part of these financial statements.

CHINA PETROLEUM & CHEMICAL CORPORATION Annual Report 2006 119
BALANCE SHEETat 31 December 2006(Amounts in millions)
Fina
ncia
l S
tate
men
ts (
Inte
rna
tion
al)
Note 2006 2005RMB RMB
Non-current assetsProperty, plant and equipment 18 270,783 170,711Construction in progress 19 41,139 39,086Investments in subsidiaries 21 66,809 75,579Investments 22 971 1,037Interest in associates 23 7,470 5,933Interest in jointly controlled entities 24 7,482 7,280Deferred tax assets 29 5,936 3,220Lease prepayments 765 568Long-term prepayments and other assets 25 5,011 3,748
Total non-current assets 406,366 307,162--- - - - - - - - - - - - - - - - - - - - - - - - - - - - - - - - - - - - - - - - - - - - - - - - - - - - - - - - - - - - - - - - - - - - - - - - - - - - - - - - - - - - - - - - - - - - - - - - - - - - - - - - - - - - - - - - - - - - - - - - - - - - - - - - - - - - - - - - - - - - - - - - - - - - - - - - - - - - - - - - - - - - - - - - - - - - - - - - - - - - - - - - - - - - - - - - - - - - - - - - - - - - - - - - - - - - - - - - - - - - - - - - - - - - - - - - - - - - - - - - - - - - - - - - - - - - - - - - - - - - - - - - - - - - - - - - - - -
Current assetsCash and cash equivalents 2,763 5,014Time deposits with financial institutions 220 110Trade accounts receivable 26 8,832 8,826Bills receivable 26 2,760 1,334Inventories 27 53,988 50,417Prepaid expenses and other current assets 28 15,225 15,556
Total current assets 83,788 81,257--- - - - - - - - - - - - - - - - - - - - - - - - - - - - - - - - - - - - - - - - - - - - - - - - - - - - - - - - - - - - - - - - - - - - - - - - - - - - - - - - - - - - - - - - - - - - - - - - - - - - - - - - - - - - - - - - - - - - - - - - - - - - - - - - - - - - - - - - - - - - - - - - - - - - - - - - - - - - - - - - - - - - - - - - - - - - - - - - - - - - - - - - - - - - - - - - - - - - - - - - - - - - - - - - - - - - - - - - - - - - - - - - - - - - - - - - - - - - - - - - - - - - - - - - - - - - - - - - - - - - - - - - - - - - - - - - - - -
Current liabilitiesShort-term debts 30 38,241 25,059Loans from Sinopec Group Company and fellow subsidiaries 30 1,358 3,946Trade accounts payable 31 38,041 28,833Bills payable 31 16,265 19,077Accrued expenses and other payables 32 72,313 40,559Income tax payable 7,162 2,494
Total current liabilities 173,380 119,968--- - - - - - - - - - - - - - - - - - - - - - - - - - - - - - - - - - - - - - - - - - - - - - - - - - - - - - - - - - - - - - - - - - - - - - - - - - - - - - - - - - - - - - - - - - - - - - - - - - - - - - - - - - - - - - - - - - - - - - - - - - - - - - - - - - - - - - - - - - - - - - - - - - - - - - - - - - - - - - - - - - - - - - - - - - - - - - - - - - - - - - - - - - - - - - - - - - - - - - - - - - - - - - - - - - - - - - - - - - - - - - - - - - - - - - - - - - - - - - - - - - - - - - - - - - - - - - - - - - - - - - - - - - - - - - - - - - -
Net current liabilities (89,592) (38,711)-- - - - - - - - - - - - - - - - - - - - - - - - - - - - - - - - - - - - - - - - - - - - - - - - - - - - - - - - - - - - - - - - - - - - - - - - - - - - - - - - - - - - - - - - - - - - - - - - - - - - - - - - - - - - - - - - - - - - - - - - - - - - - - - - - - - - - - - - - - - - - - - - - - - - - - - - - - - - - - - - - - - - - - - - - - - - - - - - - - - - - - - - - - - - - - - - - - - - - - - - - - - - - - - - - - - - - - - - - - - - - - - - - - - - - - - - - - - - - - - - - - - - - - - - - - - - - - - - - - - - - - - - - - - - - - - - - - - -
Total assets less current liabilities 316,774 268,451--- - - - - - - - - - - - - - - - - - - - - - - - - - - - - - - - - - - - - - - - - - - - - - - - - - - - - - - - - - - - - - - - - - - - - - - - - - - - - - - - - - - - - - - - - - - - - - - - - - - - - - - - - - - - - - - - - - - - - - - - - - - - - - - - - - - - - - - - - - - - - - - - - - - - - - - - - - - - - - - - - - - - - - - - - - - - - - - - - - - - - - - - - - - - - - - - - - - - - - - - - - - - - - - - - - - - - - - - - - - - - - - - - - - - - - - - - - - - - - - - - - - - - - - - - - - - - - - - - - - - - - - - - - - - - - - - - - -
Non-current liabilitiesLong-term debts 30 52,689 53,401Loans from Sinopec Group Company and fellow subsidiaries 30 38,840 39,212Deferred tax liabilities 29 6,174 2,216Other liabilities 768 315
Total non-current liabilities 98,471 95,144--- - - - - - - - - - - - - - - - - - - - - - - - - - - - - - - - - - - - - - - - - - - - - - - - - - - - - - - - - - - - - - - - - - - - - - - - - - - - - - - - - - - - - - - - - - - - - - - - - - - - - - - - - - - - - - - - - - - - - - - - - - - - - - - - - - - - - - - - - - - - - - - - - - - - - - - - - - - - - - - - - - - - - - - - - - - - - - - - - - - - - - - - - - - - - - - - - - - - - - - - - - - - - - - - - - - - - - - - - - - - - - - - - - - - - - - - - - - - - - - - - - - - - - - - - - - - - - - - - - - - - - - - - - - - - - - - - - -
218,303 173,307Equity
Share capital 33 86,702 86,702Reserves 34 131,601 86,605
Total equity 218,303 173,307
Approved and authorised for issue by the board of directors on 6 April 2007.
Chen Tonghai Wang Tianpu Dai HouliangChairman Director, President Director, Senior Vice President and
Chief Financial Officer
The notes on pages 123 to 160 form part of these financial statements.

CHINA PETROLEUM & CHEMICAL CORPORATIONAnnual Report 2006120
CONSOLIDATED CASH FLOW STATEMENTfor the year ended 31 December 2006(Amounts in millions)
Fina
ncia
l S
tate
men
ts (
Inte
rna
tion
al)
Note 2006 2005RMB RMB
Net cash generated from operating activities (a) 95,875 78,214--- - - - - - - - - - - - - - - - - - - - - - - - - - - - - - - - - - - - - - - - - - - - - - - - - - - - - - - - - - - - - - - - - - - - - - - - - - - - - - - - - - - - - - - - - - - - - - - - - - - - - - - - - - - - - - - - - - - - - - - - - - - - - - - - - - - - - - - - - - - - - - - - - - - - - - - - - - - - - - - - - - - - - - - - - - - - - - - - - - - - - - - - - - - - - - - - - - - - - - - - - - - - - - - - - - - - - - - - - - - - - - - - - - - - - - - - - - - - - - - - - - - - - - - - - - - - - - - - - - - - - - - - - - - - - - - - - - -
Investing activitiesCapital expenditure (70,604) (63,993)Exploratory wells expenditure (7,985) (5,810)Capital expenditure by jointly controlled entities (382) (2,474)Acquisitions of minority interests in subsidiaries (21,971) (4,324)Purchase of investments, investments in associates and subsidiaries, net of cash acquired (3,571) (3,650)Proceeds from disposal of investments and investments in associates 717 1,264Proceeds from disposal of property, plant and equipment 406 567Purchase of time deposits with financial institutions (916) (565)Maturity of time deposits with financial institutions 1,283 1,462
Net cash used in investing activities (103,023) (77,523)-- - - - - - - - - - - - - - - - - - - - - - - - - - - - - - - - - - - - - - - - - - - - - - - - - - - - - - - - - - - - - - - - - - - - - - - - - - - - - - - - - - - - - - - - - - - - - - - - - - - - - - - - - - - - - - - - - - - - - - - - - - - - - - - - - - - - - - - - - - - - - - - - - - - - - - - - - - - - - - - - - - - - - - - - - - - - - - - - - - - - - - - - - - - - - - - - - - - - - - - - - - - - - - - - - - - - - - - - - - - - - - - - - - - - - - - - - - - - - - - - - - - - - - - - - - - - - - - - - - - - - - - - - - - - - - - - - - - -
Financing activitiesProceeds from bank and other loans 764,659 554,187Proceeds from bank and other loans of jointly controlled entities 87 3,954Proceeds of issuance of corporate bonds, net of issuing expenses 22,689 9,875Repayments of bank and other loans (754,159) (557,692)Repayments of corporate bonds (21,000) —Distributions to minority interests (852) (1,682)Contributions from minority interests 1,255 129Dividend paid (11,271) (10,404)Distributions to Sinopec Group Company (216) (3,218)
Net cash generated from/(used in) financing activities 1,192 (4,851)-- - - - - - - - - - - - - - - - - - - - - - - - - - - - - - - - - - - - - - - - - - - - - - - - - - - - - - - - - - - - - - - - - - - - - - - - - - - - - - - - - - - - - - - - - - - - - - - - - - - - - - - - - - - - - - - - - - - - - - - - - - - - - - - - - - - - - - - - - - - - - - - - - - - - - - - - - - - - - - - - - - - - - - - - - - - - - - - - - - - - - - - - - - - - - - - - - - - - - - - - - - - - - - - - - - - - - - - - - - - - - - - - - - - - - - - - - - - - - - - - - - - - - - - - - - - - - - - - - - - - - - - - - - - - - - - - - - - -
Net decrease in cash and cash equivalents (5,956) (4,160)Effect of foreign exchange rate changes (25) (22)Cash and cash equivalents at 1 January 14,069 18,251Cash and cash equivalents at 31 December 8,088 14,069
The notes on pages 123 to 160 form part of these financial statements.

CHINA PETROLEUM & CHEMICAL CORPORATION Annual Report 2006 121
NOTES TO THE CONSOLIDATED CASH FLOW STATEMENTfor the year ended 31 December 2006(Amounts in millions)
Fina
ncia
l S
tate
men
ts (
Inte
rna
tion
al)
(a) Reconciliation of profit before taxation to net cash generated from operating activities
2006 2005RMB RMB
Operating activitiesProfit before taxation 78,923 64,656Adjustments for:Depreciation, depletion and amortisation 34,235 31,618Dry hole costs 3,960 2,992Share of profits less losses from associates (947) (857)Investment income (256) (178)Interest income (555) (384)Interest expense 7,437 5,926Unrealised foreign exchange gains (689) (852)Loss on disposal of property, plant and equipment, net 1,646 2,098Impairment losses on long-lived assets 825 1,851
Operating profit before changes in working capital 124,579 106,870Increase in trade accounts receivable (737) (4,759)(Increase)/decrease in bills receivable (1,570) 652Increase in inventories (3,112) (25,037)Decrease in prepaid expenses and other current assets 371 1,786Increase in lease prepayments (559) (1,071)Increase in long-term prepayments and other assets (1,123) (2,222)(Decrease)/increase in trade accounts payable (1,901) 29,142Decrease in bills payable (1,613) (7,554)Increase in accrued expenses and other payables 9,531 8,154Increase/(decrease) in other liabilities 13 (227)
Cash generated from operations 123,879 105,734Interest received 558 388Interest paid (8,861) (6,967)Investment and dividend income received 619 668Income tax paid (20,320) (21,609)
Net cash generated from operating activities 95,875 78,214
The notes on pages 123 to 160 form part of these financial statements.

CHINA PETROLEUM & CHEMICAL CORPORATIONAnnual Report 2006122
CONSOLIDATED STATEMENT OF CHANGES IN EQUITYfor the year ended 31 December 2006(Amounts in millions)
Fina
ncia
l S
tate
men
ts (
Inte
rna
tion
al)
Total equityattributable
Statutory to equityStatutory public Discretionary shareholders
Share Capital Share Revaluation surplus welfare surplus Other Retained of the Minority Totalcapital reserve premium reserve reserve fund reserve reserves earnings Company interests equity
RMB RMB RMB RMB RMB RMB RMB RMB RMB RMB RMB RMBBalance at 1 January 2005, as previously reported 86,702 (19,217 ) 18,072 27,998 9,558 9,558 7,000 247 53,122 193,040 31,046 224,086Adjusted for the acquisition of the Acquired Group — — — — — — — 300 — 300 909 1,209Balance at 1 January 2005, as adjusted 86,702 (19,217 ) 18,072 27,998 9,558 9,558 7,000 547 53,122 193,340 31,955 225,295Profit for the year/total recognised income for the year — — — — — — — — 41,455 41,455 3,321 44,776Final dividend for 2004 (Note 16) — — — — — — — — (6,936 ) (6,936 ) — (6,936 )Interim dividend for 2005 (Note 16) — — — — — — — — (3,468 ) (3,468 ) — (3,468 )Appropriation (Note (a) and (b)) — — — — 3,956 3,956 — — (7,912 ) — — —Revaluation surplus realised — — — (1,656 ) — — — — 1,656 — — —Realisation of deferred tax on land use rights — — — — — — — (5 ) 5 — — —Transfer from retained earnings to other reserves — — — — — — — 535 (535 ) — — —Distribution to Sinopec Group Company (Note (f)) — — — — — — — (90 ) — (90 ) — (90 )Acquisitions of minority interests in subsidiaries — — — — — — — — — — (2,957 ) (2,957 )Distributions to minority interests net of contribution — — — — — — — — — — (1,640 ) (1,640 )Balance at 31 December 2005 86,702 (19,217 ) 18,072 26,342 13,514 13,514 7,000 987 77,387 224,301 30,679 254,980Balance at 1 January 2006 86,702 (19,217 ) 18,072 26,342 13,514 13,514 7,000 987 77,387 224,301 30,679 254,980Net gain recognised directly in equity:
Change in fair value of available-for-sale securities,net of deferred tax — — — — — — — 34 — 34 — 34
Profit for the year — — — — — — — — 53,912 53,912 1,496 55,408Total recognised income for the year — — — — — — — 34 53,912 53,946 1,496 55,442Final dividend for 2005 (Note 16) — — — — — — — — (7,803 ) (7,803 ) — (7,803 )Interim dividend for 2006 (Note 16) — — — — — — — — (3,468 ) (3,468 ) — (3,468 )Appropriation (Note (a) and (c)) — — — — 5,066 — 20,000 — (25,066 ) — — —Statutory public welfare fund transferred to statutory
surplus reserve (Note (b)) — — — — 13,514 (13,514 ) — — — — — —Revaluation surplus realised — — — (1,590 ) — — — — 1,590 — — —Realisation of deferred tax on land use rights — — — — — — — (7 ) 7 — — —Transfer from retained earnings to other reserves — — — — — — — 1,013 (1,013 ) — — —Transfer from capital reserve to other reserves — (2,373 ) — — — — — 2,373 — — — —Distribution to Sinopec Group Company (Note (f)) — — — — — — — (631 ) — (631 ) — (631 )Consideration for the Acquisition of Oil
Production Plants (Note 1) — — — — — — — (3,500 ) — (3,500 ) — (3,500 )Acquisitions of minority interests in subsidiaries — — — — — — — — — — (9,730 ) (9,730 )Contributions from minority interests net of distributions — — — — — — — — — — 242 242Disposal of a subsidiary (Note 39) — — — — — — — — — — (743 ) (743 )Balance at 31 December 2006 86,702 (21,590 ) 18,072 24,752 32,094 — 27,000 269 95,546 262,845 21,944 284,789
Notes:
(a) According to the Company’s Articles of Association, the Company is required to transfer 10% of its net profit, as determined in accordance with the PRC Accounting Rulesand Regulations, to statutory surplus reserve until the reserve balance reaches 50% of the registered capital. The transfer to this reserve must be made before distributionof a dividend to shareholders.
Statutory surplus reserve can be used to make good previous years’ losses, if any, and may be converted into share capital by the issue of new shares to shareholders inproportion to their existing shareholdings or by increasing the par value of the shares currently held by them, provided that the balance after such issue is not less than 25%of the registered capital. During the year ended 31 December 2006, the Company transferred RMB 5,066 million (2005: RMB 3,956 million), being 10% of the current year’snet profit determined in accordance with the PRC Accounting Rules and Regulations, to this reserve.
(b) Before 1 January 2006, according to the Company’s Articles of Association, the Company was required to transfer 5% to 10% of its net profit, as determined in accordancewith the PRC Accounting Rules and Regulations, to the statutory public welfare fund. This fund could only be utilised on capital items for the collective benefits of theCompany’s employees such as the construction of dormitories, canteen and other staff welfare facilities. The transfer to this fund must be made before distribution of adividend to shareholders.
Pursuant to the Company’s Articles of Associations and a resolution passed at the Directors’ meeting on 26 August 2005, the directors authorised to transfer RMB 1,804million for the six-month period ended 30 June 2005, being 10% of the net profit for the six-month period ended 30 June 2005 determined in accordance with the PRCAccounting Rules and Regulations, to this fund.
The directors authorised the transfer of RMB 2,152 million, being 10% of the net profit for the six-month period ended 31 December 2005 determined in accordance withthe PRC Accounting Rules and Regulations, which was approved by the shareholders at the Annual General Meeting on 24 May 2006, to this fund.
According to the Company Law of the PRC which was revised on 27 October 2005, the Company is no longer required to make appropriation to the statutory public welfarefund commencing from 1 January 2006. Pursuant to the notice “Cai Qi [2006] No. 67” issued by the Ministry of Finance on 15 March 2006, the balance of this fund as at31 December 2005 was transferred to the statutory surplus reserve.
(c) The directors authorised the transfer of RMB 20,000 million (2005: RMB nil), subject to the shareholders’ approval at the Annual General Meeting to the discretionarysurplus reserve. The usage of the discretionary surplus reserve is similar to that of statutory surplus reserve.
(d) According to the Company’s Articles of Association, the amount of retained earnings available for distribution to equity shareholders of the Company is the lower of theamount determined in accordance with the PRC Accounting Rules and Regulations and the amount determined in accordance with IFRS. At 31 December 2006, the amountof retained earnings available for distribution was RMB 42,156 million (2005: RMB 20,591 million), being the amount determined in accordance with IFRS. Final dividendof RMB 9,537 million (2005: RMB 7,803 million) proposed after the balance sheet date has not been recognised as a liability at the balance sheet date.
(e) The capital reserve represents (i) the difference between the total amount of the par value of shares issued and the amount of the net assets transferred from Sinopec GroupCompany in connection with the Reorganisation and (ii) the difference between the considerations paid over the amount of the net assets of certain entities and relatedoperations acquired from Sinopec Group Company.
(f) These represent net assets distributed to Sinopec Group Company for no monetary consideration.
(g) The application of the share premium account is governed by Sections 168 and 169 of the PRC Company Law.
The notes on pages 123 to 160 form part of these financial statements.
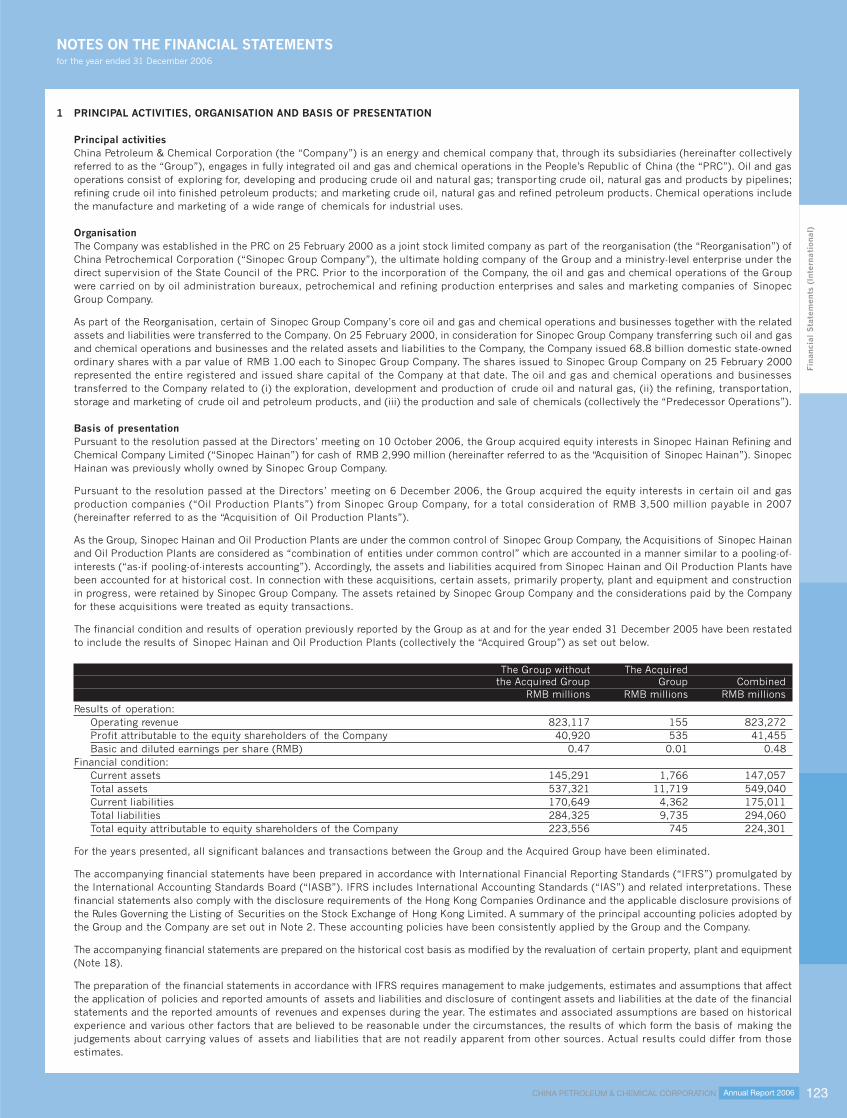
CHINA PETROLEUM & CHEMICAL CORPORATION Annual Report 2006 123
NOTES ON THE FINANCIAL STATEMENTSfor the year ended 31 December 2006
Fina
ncia
l S
tate
men
ts (
Inte
rna
tion
al)
1 PRINCIPAL ACTIVITIES, ORGANISATION AND BASIS OF PRESENTATION
Principal activitiesChina Petroleum & Chemical Corporation (the “Company”) is an energy and chemical company that, through its subsidiaries (hereinafter collectivelyreferred to as the “Group”), engages in fully integrated oil and gas and chemical operations in the People’s Republic of China (the “PRC”). Oil and gasoperations consist of exploring for, developing and producing crude oil and natural gas; transporting crude oil, natural gas and products by pipelines;refining crude oil into finished petroleum products; and marketing crude oil, natural gas and refined petroleum products. Chemical operations includethe manufacture and marketing of a wide range of chemicals for industrial uses.
OrganisationThe Company was established in the PRC on 25 February 2000 as a joint stock limited company as part of the reorganisation (the “Reorganisation”) ofChina Petrochemical Corporation (“Sinopec Group Company”), the ultimate holding company of the Group and a ministry-level enterprise under thedirect supervision of the State Council of the PRC. Prior to the incorporation of the Company, the oil and gas and chemical operations of the Groupwere carried on by oil administration bureaux, petrochemical and refining production enterprises and sales and marketing companies of SinopecGroup Company.
As part of the Reorganisation, certain of Sinopec Group Company’s core oil and gas and chemical operations and businesses together with the relatedassets and liabilities were transferred to the Company. On 25 February 2000, in consideration for Sinopec Group Company transferring such oil and gasand chemical operations and businesses and the related assets and liabilities to the Company, the Company issued 68.8 billion domestic state-ownedordinary shares with a par value of RMB 1.00 each to Sinopec Group Company. The shares issued to Sinopec Group Company on 25 February 2000represented the entire registered and issued share capital of the Company at that date. The oil and gas and chemical operations and businessestransferred to the Company related to (i) the exploration, development and production of crude oil and natural gas, (ii) the refining, transportation,storage and marketing of crude oil and petroleum products, and (iii) the production and sale of chemicals (collectively the “Predecessor Operations”).
Basis of presentationPursuant to the resolution passed at the Directors’ meeting on 10 October 2006, the Group acquired equity interests in Sinopec Hainan Refining andChemical Company Limited (“Sinopec Hainan”) for cash of RMB 2,990 million (hereinafter referred to as the “Acquisition of Sinopec Hainan”). SinopecHainan was previously wholly owned by Sinopec Group Company.
Pursuant to the resolution passed at the Directors’ meeting on 6 December 2006, the Group acquired the equity interests in certain oil and gasproduction companies (“Oil Production Plants”) from Sinopec Group Company, for a total consideration of RMB 3,500 million payable in 2007(hereinafter referred to as the “Acquisition of Oil Production Plants”).
As the Group, Sinopec Hainan and Oil Production Plants are under the common control of Sinopec Group Company, the Acquisitions of Sinopec Hainanand Oil Production Plants are considered as “combination of entities under common control” which are accounted in a manner similar to a pooling-of-interests (“as-if pooling-of-interests accounting”). Accordingly, the assets and liabilities acquired from Sinopec Hainan and Oil Production Plants havebeen accounted for at historical cost. In connection with these acquisitions, certain assets, primarily property, plant and equipment and constructionin progress, were retained by Sinopec Group Company. The assets retained by Sinopec Group Company and the considerations paid by the Companyfor these acquisitions were treated as equity transactions.
The financial condition and results of operation previously reported by the Group as at and for the year ended 31 December 2005 have been restatedto include the results of Sinopec Hainan and Oil Production Plants (collectively the “Acquired Group”) as set out below.
The Group without The Acquiredthe Acquired Group Group Combined
RMB millions RMB millions RMB millionsResults of operation:
Operating revenue 823,117 155 823,272Profit attributable to the equity shareholders of the Company 40,920 535 41,455Basic and diluted earnings per share (RMB) 0.47 0.01 0.48
Financial condition:Current assets 145,291 1,766 147,057Total assets 537,321 11,719 549,040Current liabilities 170,649 4,362 175,011Total liabilities 284,325 9,735 294,060Total equity attributable to equity shareholders of the Company 223,556 745 224,301
For the years presented, all significant balances and transactions between the Group and the Acquired Group have been eliminated.
The accompanying financial statements have been prepared in accordance with International Financial Reporting Standards (“IFRS”) promulgated bythe International Accounting Standards Board (“IASB”). IFRS includes International Accounting Standards (“IAS”) and related interpretations. Thesefinancial statements also comply with the disclosure requirements of the Hong Kong Companies Ordinance and the applicable disclosure provisions ofthe Rules Governing the Listing of Securities on the Stock Exchange of Hong Kong Limited. A summary of the principal accounting policies adopted bythe Group and the Company are set out in Note 2. These accounting policies have been consistently applied by the Group and the Company.
The accompanying financial statements are prepared on the historical cost basis as modified by the revaluation of certain property, plant and equipment(Note 18).
The preparation of the financial statements in accordance with IFRS requires management to make judgements, estimates and assumptions that affectthe application of policies and reported amounts of assets and liabilities and disclosure of contingent assets and liabilities at the date of the financialstatements and the reported amounts of revenues and expenses during the year. The estimates and associated assumptions are based on historicalexperience and various other factors that are believed to be reasonable under the circumstances, the results of which form the basis of making thejudgements about carrying values of assets and liabilities that are not readily apparent from other sources. Actual results could differ from thoseestimates.

CHINA PETROLEUM & CHEMICAL CORPORATIONAnnual Report 2006124
NOTES ON THE FINANCIAL STATEMENTS (CONTINUED)for the year ended 31 December 2006
Fina
ncia
l S
tate
men
ts (
Inte
rna
tion
al)
1 PRINCIPAL ACTIVITIES, ORGANISATION AND BASIS OF PRESENTATION (Continued)The estimates and underlying assumptions are reviewed on an ongoing basis. Revisions to accounting estimates are recognised in the period in whichthe estimate is revised if the revision affects only that period, or in the period of the revision and future periods if the revision affects both current andfuture periods.
Key assumptions and estimation made by management in the application of IFRS that have significant effect on the financial statements and have asignificant risk of causing a material adjustment to the carrying amounts of assets and liabilities in the following financial year are disclosed in Note41.
2 PRINCIPAL ACCOUNTING POLICIES
(a) Basis of consolidationThe consolidated financial statements comprise the Company and its subsidiaries, and the Group’s interest in associates and jointly controlledentities.
(i) SubsidiariesSubsidiaries are those entities controlled by the Group. Control exists when the Group has the power, directly or indirectly, to govern the financialand operating policies of an entity so as to obtain benefits from its activities.
The financial statements of subsidiaries are included in the consolidated financial statements from the date that control effectively commencesuntil the date that control effectively ceases.
Minority interests at the balance sheet date, being the portion of the net assets of subsidiaries attributable to equity interests that are notowned by the Company, whether directly or indirectly through subsidiaries, are presented in the consolidated balance sheet and statement ofchanges in equity within equity, separately from equity attributable to the equity shareholders of the Company. Minority interests in the resultsof the Group are presented on the face of the consolidated income statement as an allocation of the total profit or loss for the period betweenminority interests and the equity shareholders of the Company.
In the Company’s balance sheet, investments in subsidiaries are stated at cost less impairment losses (Note 2(l)).
The particulars of the Group’s principal subsidiaries are set out in Note 39.
(ii) Interest in associatesAn associate is an entity, not being a subsidiary, in which the Group or the Company exercises significant influence over its management.Significant influence is the power to participate in the financial and operating policy decisions of the investee but is not control or joint controlover those policies.
Investments in associates are accounted for in the consolidated financial statements using the equity method from the date that significantinfluence commences until the date that significant influence ceases.
In the Company’s balance sheet, investments in associates are stated at cost less impairment losses (Note 2(l)).
(iii)Jointly controlled entitiesA jointly controlled entity is an entity over which the Group or the Company can exercise joint control with other venturers. Joint control is thecontractually agreed sharing of control over an economic activity.
Investments in jointly controlled entities are accounted for in the consolidated financial statements on a proportionate consolidation basis.Under this method, the Group combines its proportionate share of the jointly controlled entity’s turnover and expenses with each major turnoverand expense caption of the Group’s income statement and combines its proportionate share of the jointly controlled entity’s assets andliabilities with each major asset and liability caption of the Group’s balance sheet, from the date that joint control commences until the datethat joint control ceases.
In the Company’s balance sheet, investments in jointly controlled entities are stated at cost less impairment losses (Note 2(l)).
(iv)Transactions eliminated on consolidationInter-company balances and transactions and any unrealised gains arising from inter-company transactions are eliminated on consolidation.Unrealised gains arising from transactions with associates and jointly controlled entities are eliminated to the extent of the Group’s interest inthe entity. Unrealised losses are eliminated in the same way as unrealised gains, but only to the extent that there is no evidence of impairment.
(b) Translation of foreign currenciesThe presentation currency of the Group is Renminbi. Foreign currency transactions during the year are translated into Renminbi at the applicablerates of exchange quoted by the People’s Bank of China (“PBOC”) prevailing on the transaction dates. Foreign currency monetary assets andliabilities are translated into Renminbi at the PBOC’s rates at the balance sheet date.
Exchange differences, other than those capitalised as construction in progress, are recognised as income or expense in the income statement.
(c) Cash and cash equivalentsCash equivalents consist of time deposits with financial institutions with an initial term of less than three months when purchased. Cash equivalentsare stated at cost, which approximates fair value.
(d) Trade accounts and other receivablesTrade accounts and other receivables are initially recognised at fair value and thereafter stated at amortised cost less impairment losses for badand doubtful debts (Note 2(l)).
CHINA PETROLEUM & CHEMICAL CORPORATION Annual Report 2006 125
NOTES ON THE FINANCIAL STATEMENTS (CONTINUED)for the year ended 31 December 2006
Fina
ncia
l S
tate
men
ts (
Inte
rna
tion
al)
2 PRINCIPAL ACCOUNTING POLICIES (Continued)
(e) InventoriesInventories, other than spare parts and consumables, are stated at the lower of cost and net realisable value. Cost includes the cost of purchasecomputed using the weighted average method and, in the case of work in progress and finished goods, direct labour and an appropriate proportionof production overheads. Net realisable value is the estimated selling price in the ordinary course of business, less the estimated costs ofcompletion and the estimated costs necessary to make the sale.
Spare parts and consumables are stated at cost less any provision for obsolescence.
(f) Property, plant and equipmentAn item of property, plant and equipment is initially recorded at cost, less accumulated depreciation and impairment losses (Note 2(l)). The costof an asset comprises its purchase price, any directly attributable costs of bringing the asset to working condition and location for its intended use.Subsequent to the revaluation (Note 18), which was based on depreciated replacement costs, property, plant and equipment are carried at revaluedamount, being the fair value at the date of the revaluation less any subsequent accumulated depreciation and impairment losses. Revaluations areperformed periodically to ensure that the carrying amount does not differ materially from that which would be determined using fair value at thebalance sheet date. The Group recognises in the carrying amount of an item of property, plant and equipment the cost of replacing part of such anitem when that cost is incurred if it is probable that the future economic benefits embodied with the item will flow to the Group and the cost of theitem can be measured reliably. All other expenditure is recognised as an expense in the income statement in the year in which it is incurred.
Gains or losses arising from the retirement or disposal of an item of property, plant and equipment, other than oil and gas properties, aredetermined as the difference between the net disposal proceeds and the carrying amount of the item and are recognised as income or expense inthe income statement on the date of retirement or disposal. On disposal of a revalued asset, the related revaluation surplus is transferred from therevaluation reserve to retained earnings.
Depreciation is provided to write off the cost/revalued amount of items of property, plant and equipment, other than oil and gas properties, overits estimated useful life on a straight-line basis, after taking into account its estimated residual value, as follows:
Buildings 15 to 45 yearsPlant, machinery, equipment, oil depots, storage tanks and others 4 to 18 yearsService stations 25 years
Where parts of an item of property, plant and equipment have different useful lives, the cost or valuation of the item is allocated on a reasonablebasis between the parts and each part is depreciated separately. Both the useful life of an asset and its residual value, if any, are reassessedannually.
(g) Oil and gas propertiesThe Group uses the successful efforts method of accounting for its oil and gas producing activities. Under this method, costs of development wellsand the related support equipment are capitalised. The cost of exploratory wells is initially capitalised as construction in progress pendingdetermination of whether the well has found proved reserves. The impairment of exploratory well costs occurs upon the determination that the wellhas not found proved reserves. Exploratory wells that find oil and gas reserves in any area requiring major capital expenditure are expensed unlessthe well has found a sufficient quantity of reserves to justify its completion as a producing well if the required capital expenditure is made, anddrilling of the additional exploratory wells is under way or firmly planned for the near future. However, in the absence of a determination of thediscovery of proved reserves, exploratory well costs are not carried as an asset for more than one year following completion of drilling. If, after oneyear has passed, a determination of the discovery of proved reserves cannot be made, the exploratory well costs are impaired and charged toexpense. All other exploration costs, including geological and geophysical costs, other dry hole costs and annual lease rentals, are expensed asincurred. Capitalised costs relating to proved properties are amortised at the field level on a unit-of-production method. The amortisation rates aredetermined based on oil and gas reserves estimated to be recoverable from existing facilities over the shorter of the economic lives of crude oil andnatural gas reservoirs and the terms of the relevant production licenses.
Gains and losses on the disposal of proved oil and gas properties are not recognised unless the disposal encompasses an entire property. Theproceeds on such disposals are credited to the carrying amounts of oil and gas properties.
(h) Lease prepaymentsLease prepayments represent land use rights paid to the relevant government authorities. Land use rights are carried at cost less accumulatedamortisation and impairment losses (Note 2(l)). Amortisation is provided to write off the cost of lease prepayments on a straight-line basis over therespective periods of the rights.
(i) Construction in progressConstruction in progress represents buildings, oil and gas properties, various plant and equipment under construction and pending installation,and is stated at cost less impairment losses (Note 2(l)). Cost comprises direct costs of construction as well as interest charges, and foreignexchange differences on related borrowed funds to the extent that they are regarded as an adjustment to interest charges, during the periods ofconstruction.
Construction in progress is transferred to property, plant and equipment when the asset is substantially ready for its intended use.
No depreciation is provided in respect of construction in progress.
(j) GoodwillGoodwill represents amounts arising on acquisition of subsidiaries, associates or jointly controlled entities. Goodwill represents the differencebetween the cost of acquisition and the fair value of the net identifiable assets acquired.
Goodwill is stated at cost less accumulated impairment losses. Goodwill is allocated to cash-generating units and is tested annually for impairment(Note 2(l)). In respect of associates, the carrying amount of goodwill is included in the carrying amount of the interest in associates.

CHINA PETROLEUM & CHEMICAL CORPORATIONAnnual Report 2006126
NOTES ON THE FINANCIAL STATEMENTS (CONTINUED)for the year ended 31 December 2006
Fina
ncia
l S
tate
men
ts (
Inte
rna
tion
al)
2 PRINCIPAL ACCOUNTING POLICIES (Continued)
(k) InvestmentsInvestment in available-for-sale equity securities are carried at fair value with any change in fair value, other than impairment losses (Note2(l)),recognised directly in equity. When these investments are derecognised or impaired, the cumulative gain or loss previously recognised directly inequity is recognised in the income statement. Investments in equity securities, other than investments in associates, that do not have a quotedmarket price in an active market and whose fair value cannot be reliably measured are recognised in the balance sheet at cost less impairmentlosses (Note 2(l)).
(l) Impairment of assets(i) Impairment of trade accounts receivable, other receivables and investment in equity securities other than investments in associates are accounted
as follows:
Trade accounts receivable, other receivables and investment in equity securities other than investments in associates are reviewed at eachbalance sheet date to determine whether there is objective evidence of impairment. If any such evidence exists, an impairment loss is determinedand recognised. The impairment loss is measured as the difference between the asset’s carrying amount and the estimated future cash flows,discounted at the current market rate of return for a similar financial asset where the effect of discounting is material, and is recognised as anexpense in the income statement. Impairment losses for trade and other receivables are reversed through the income statement if in a subsequentperiod the amount of the impairment losses decreases. Impairment losses for equity securities are not reversed.
(ii) Impairment of other long-lived assets is accounted as follows:
The carrying amounts of other long-lived assets, including property, plant and equipment, construction in progress, lease prepayment andinvestments in associates, are reviewed periodically in order to assess whether the recoverable amounts have declined below the carryingamounts. These assets are tested for impairment whenever events or changes in circumstances indicate that their recorded carrying amountsmay not be recoverable. When such a decline has occurred, the carrying amount is reduced to the recoverable amount. For goodwill, therecoverable amount is estimated at each balance sheet date.
The recoverable amount is the greater of the fair value less costs to sell and the value in use. In determining the value in use, expected futurecash flows generated by the asset are discounted to their present value using a pre-tax discount rate that reflects current market assessmentsof time value of money and the risks specific to the asset. Where an asset does not generate cash inflows largely independent of those fromother assets, the recoverable amount is determined for the smallest group of assets that generates cash inflows independently (i.e. a cash-generating unit).
The amount of the reduction is recognised as an expense in the income statement unless the asset is carried at revalued amount for which animpairment loss is recognised directly against any related revaluation reserve to the extent that the impairment loss does not exceed theamount held in the revaluation reserve for that same asset. Impairment losses recognised in respect of cash-generating units are allocated firstto reduce the carrying amount of any goodwill allocated to the cash-generating unit and then, to reduce the carrying amount of the other assetsin the unit on a pro rata basis, except that the carrying value of an asset will not be reduced below its individual fair value less costs to sell, orvalue in use, if determinable.
The Group assesses at each balance sheet date whether there is any indication that an impairment loss recognised for an asset, except in thecase of goodwill, in prior years may no longer exist. An impairment loss is reversed if there has been a favourable change in the estimates usedto determine the recoverable amount. A subsequent increase in the recoverable amount of an asset, when the circumstances and events that ledto the write-down or write-off cease to exist, is recognised as an income unless the asset is carried at revalued amount. Reversal of animpairment loss on a revalued asset is credited to the revaluation reserve except for impairment loss which was previously recognised as anexpense in the income statement; a reversal of such impairment loss is recognised as an income. The reversal is reduced by the amount thatwould have been recognised as depreciation had the write-down or write-off not occurred. An impairment loss in respect of goodwill is notreversed.
(m)Trade accounts and other payablesTrade accounts and other payables are initially recognised at fair value and thereafter stated at amortised cost unless the effect of discountingwould be immaterial, in which case they are stated at cost.
(n) Interest-bearing borrowingsInterest bearing borrowings are recognised initially at fair value less attributable transaction costs. Subsequent to initial recognition, interest-bearing borrowings are stated at amortised cost with any difference between cost and redemption value being recognised in income statement overthe period of borrowings using the effective interest method.
(o) Provisions and contingent liabilityA provision is recognised for liability of uncertain timing or amount when the Group has a legal or constructive obligation arising as a result of apast event, it is probable that an outflow of economic benefits will be required to settle the obligation and a reliable estimate can be made.
When it is not probable that an outflow of economic benefits will be required, or the amount cannot be estimated reliably, the obligation is disclosedas a contingent liability, unless the probability of outflow of economic benefits is remote. Possible obligations, whose existence will only beconfirmed by the occurrence or non-occurrence of one or more future events are also disclosed as contingent liabilities unless the probability ofoutflow of economic benefits is remote.

CHINA PETROLEUM & CHEMICAL CORPORATION Annual Report 2006 127
NOTES ON THE FINANCIAL STATEMENTS (CONTINUED)for the year ended 31 December 2006
Fina
ncia
l S
tate
men
ts (
Inte
rna
tion
al)
2 PRINCIPAL ACCOUNTING POLICIES (Continued)
(p) Revenue recognitionRevenues associated with the sale of crude oil, natural gas, petroleum and chemical products and ancillary materials are recorded when thecustomer accepts the goods and the significant risks and rewards of ownership and title have been transferred to the buyer. Revenue from therendering of services is recognised in the income statement upon performance of the services. No revenue is recognised if there are significantuncertainties regarding recovery of the consideration due, the possible return of goods, or when the amount of revenue and the costs incurred orto be incurred in respect of the transaction cannot be measured reliably.
Interest income is recognised on a time apportioned basis that takes into account the effective yield on the asset.
Government grants relating to the purchase of assets used for technology improvements are initially recorded as long-term liabilities when there isreasonable assurance that they will be received and thereafter offset against the cost of the related assets upon the transfer of these assets toproperty, plant and equipment. The grants are recognised as an income over the useful life of these property, plant and equipment by way ofreduced depreciation.
A government grant that becomes receivable as compensation for expenses or losses already incurred with no future related costs is recognised asincome in the period in which it becomes receivable.
(q) Borrowing costsBorrowing costs are expensed in the income statement in the period in which they are incurred, except to the extent that they are capitalised asbeing attributable to the construction of an asset which necessarily takes a period of time to get ready for its intended use.
(r) Repairs and maintenance expenditureRepairs and maintenance expenditure is expensed as incurred.
(s) Environmental expendituresEnvironmental expenditures that relate to current ongoing operations or to conditions caused by past operations are expensed as incurred.
Liabilities related to future remediation costs are recorded when environmental assessments and/or cleanups are probable and the costs can bereasonably estimated. As facts concerning environmental contingencies become known to the Group, the Group reassesses its position both withrespect to accrued liabilities and other potential exposures.
(t) Research and development costsResearch and development costs are recognised as expenses in the period in which they are incurred. Research and development costs amountedto RMB 2,902 million for the year ended 31 December 2006 (2005: RMB 2,244 million).
(u) Operating leasesOperating lease payments are charged to the income statement on a straight-line basis over the period of the respective leases.
(v) Retirement benefitsThe contributions payable under the Group’s retirement plans are recognised as expenses in the income statement as incurred and according to thecontribution determined by the plans. Further information is set out in Note 37.
(w) Income taxIncome tax comprises current and deferred tax. Current tax is calculated on taxable income by applying the applicable tax rates. Deferred tax isprovided using the balance sheet liability method on all temporary differences between the carrying amounts of assets and liabilities for financialreporting purposes and the amounts used for taxation purposes. Deferred tax is calculated on the basis of the enacted tax rates that are expectedto apply in the period when the asset is realised or the liability is settled.
The tax value of losses expected to be available for utilisation against future taxable income is set off against the deferred tax liability within thesame legal tax unit and jurisdiction to the extent appropriate, and is not available for set-off against the taxable profit of another legal tax unit.Deferred tax assets are reduced to the extent that it is no longer probable that the related tax benefit will be realised.
(x) DividendsDividends are recognised as a liability in the period in which they are declared.
(y) Segmental reportingA business segment is a distinguishable component of the Group that is engaged in providing products or services and is subject to risks andrewards that are different from those of other segments.
CHINA PETROLEUM & CHEMICAL CORPORATIONAnnual Report 2006128
NOTES ON THE FINANCIAL STATEMENTS (CONTINUED)for the year ended 31 December 2006
Fina
ncia
l S
tate
men
ts (
Inte
rna
tion
al)
3 TURNOVERTurnover represents revenue from the sales of crude oil, natural gas, petroleum and chemical products, net of value-added tax.
4 OTHER OPERATING REVENUES
The Group2006 2005
RMB millions RMB millionsSale of materials, service and others 26,366 23,619Rental income 384 394
26,750 24,013
5 OTHER INCOMEThe Group received a cash government grant from the Ministry of Finance of the PRC of RMB 5,000 million (2005: RMB 9,415 million) as a compensationof loss incurred due to the distortion of the correlation of domestic refined petroleum product prices and the crude oil prices during the year ended31 December 2006. There are no unfilled conditions and other contingencies attached to the receipt of this government grant. There is no assurancethat the Group will continue to receive such grant in the future.
6 SELLING, GENERAL AND ADMINISTRATIVE EXPENSESThe following items are included in selling, general and administrative expenses:
The Group2006 2005
RMB millions RMB millions
Operating lease charges 6,128 5,516Auditors’ remuneration – audit services 84 76Impairment losses:
– trade accounts receivable 438 328– other receivables 107 454
7 PERSONNEL EXPENSES
The Group2006 2005
RMB millions RMB millionsWages and salaries 14,840 13,742Staff welfare 1,927 1,808Contributions to retirement schemes 2,270 2,273Social security contributions 820 826
19,857 18,649
8 EMPLOYEE REDUCTION EXPENSESIn accordance with the Group’s voluntary employee reduction plan, the Group recorded employee reduction expenses of RMB 236 million (2005: RMB369 million) during the year ended 31 December 2006 in respect of the voluntary termination of approximately 4,000 (2005: 7,000) employees.

CHINA PETROLEUM & CHEMICAL CORPORATION Annual Report 2006 129
NOTES ON THE FINANCIAL STATEMENTS (CONTINUED)for the year ended 31 December 2006
Fina
ncia
l S
tate
men
ts (
Inte
rna
tion
al)
9 TAXES OTHER THAN INCOME TAX
The Group2006 2005
RMB millions RMB millions
Consumption tax 14,121 12,430Special oil income levy 8,747 —City construction tax 3,038 2,589Education surcharge 1,615 1,311Resources tax 854 642Business tax 264 213
28,639 17,185
Consumption tax is levied on producers of gasoline, diesel, naphtha, fuel oil, jet fuel, lubricant oil and solvent oil based on a tariff rate applied to thevolume of sales. Effective 26 March 2006, a special oil income levy has been levied on oil exploration and production entities based on the progressiverates ranging from 20% to 40% on the portion of the monthly weighted average sales price of the crude oil produced in the PRC exceeding USD 40 perbarrel. City construction tax is levied on an entity based on its total amount of value-added tax, consumption tax and business tax.
10 OTHER OPERATING EXPENSES, NET
The Group2006 2005
RMB millions RMB millionsFines, penalties and compensations 65 155Donations 98 203Loss on disposal of property, plant and equipment, net 1,646 2,098Impairment losses on long-lived assets (i) 825 1,851Gain from debt extinguishment (ii) (486) —Others 289 821
2,437 5,128
Note:
(i) Impairment losses recognised on long-lived assets of the chemicals segment was RMB 250 million (2005: RMB 1,425 million) for the year ended 31 December 2006.
These impairment losses relate to certain chemicals production facilities that are held for use. The carrying values of these facilities were written down to their
recoverable amounts that were determined based on the asset held for use model using the present value of estimated future cash flows of the production facilities. The
primary factor resulting in the impairment losses on long-lived assets of the chemicals segment was due to higher operating and production costs caused by the increase
in the prices of raw materials that are not expected to be recovered through an increase in selling price.
Impairment losses recognised on long-lived assets of the marketing and distribution segment of RMB 23 million (2005: RMB 366 million) for the year ended 31
December 2006 primarily relate to certain service stations that were closed during the year. In measuring the amounts of impairment charges, the carrying amounts of
these assets were compared to the present value of the expected future cash flows of the assets, as well as information about sales and purchases of similar properties
in the same geographic area.
The factors resulting in the exploration and production (“E&P”) segment impairment losses of RMB 552 million for the year ended 31 December 2006 (2005: RMB 60
million) were unsuccessful development drilling and high operating and development costs for certain small oil fields. The carrying values of these E&P properties were
written down to a recoverable amount which was determined based on the present values of the expected future cash flows of the assets. The oil and gas pricing was a
factor used in the determination of the present values of the expected future cash flows of the assets and had an impact on the recognition of the asset impairment.
(ii) During the year ended 31 December 2006, a subsidiary of the Group reached an agreement with a bank to waive loan principal balance and related interest payable
totalling RMB 486 million.
11 INTEREST EXPENSE
The Group2006 2005
RMB millions RMB millionsInterest expense incurred 8,931 7,311Less: Interest expense capitalised* (1,494) (1,385)Interest expense 7,437 5,926* Interest rates per annum at which borrowing costs were capitalised for construction in progress 3.6% to 6.1% 3.3% to 6.6%
CHINA PETROLEUM & CHEMICAL CORPORATIONAnnual Report 2006130
NOTES ON THE FINANCIAL STATEMENTS (CONTINUED)for the year ended 31 December 2006
Fina
ncia
l S
tate
men
ts (
Inte
rna
tion
al)
12 TAXATIONTaxation in the consolidated income statement represents:
The Group2006 2005
RMB millions RMB millionsCurrent tax
– Provision for the year 23,981 20,646– Under-provision in prior years 260 477
Deferred taxation (726) (1,243)23,515 19,880
A reconciliation between actual tax expense and accounting profit at applicable tax rates is as follows:
The Group2006 2005
RMB millions RMB millionsProfit before taxation 78,923 64,656Expected PRC income tax expense at a statutory tax rate of 33% 26,045 21,336Tax effect of non-deductible expenses 516 461Tax effect of non-taxable income (648) (567)Tax effect of differential tax rate on subsidiaries’ income (Note) (2,867) (2,010)Tax effect of tax losses not recognised for deferred tax, net 258 391Under-provision in prior years 260 477Tax credit for domestic equipment purchases (49) (208)Actual tax expense 23,515 19,880
Substantially all income before income tax and related tax expense is from PRC sources.
Note:
The provision for PRC current income tax is based on a statutory rate of 33% of the assessable income of the Group as determined in accordance with the relevant income
tax rules and regulations of the PRC, except for certain entities of the Group, which are taxed at a preferential rate of 15%.

CHINA PETROLEUM & CHEMICAL CORPORATION Annual Report 2006 131
NOTES ON THE FINANCIAL STATEMENTS (CONTINUED)for the year ended 31 December 2006
Fina
ncia
l S
tate
men
ts (
Inte
rna
tion
al)
13 DIRECTORS’ AND SUPERVISORS’ EMOLUMENTSDirectors’ and supervisors’ emoluments are as follows:
Salaries, Retirementallowances and Discretionary scheme 2006
Name Directors’ fee benefits in kind bonuses contributions TotalRMB’000 RMB’000 RMB’000 RMB’000 RMB’000
Executive directorsWang Tianpu — 280 317 19 616Zhang Jianhua — 268 289 19 576Wang Zhigang — 268 289 19 576Dai Houliang — 230 200 16 446Cao Yaofeng* — 108 — 5 113Wang Jiming* — 141 — 8 149Mou Suling* — 109 — 6 115Zhang Jiaren* — 114 — 8 122Cao Xianghong* — 136 — 8 144Non-executive directorsChen Tonghai — — — — —Zhou Yuan — — — — —Liu Genyuan* — — — — —Fan Yifei 35 — — — 35Yao Zhongmin 35 — — — 35Gao Jian* — — — — —Independent non-executive directorsShi Wanpeng 121 — — — 121Liu Zhongli 109 — — — 109Li Deshui 109 — — — 109Chen Qingtai* 12 — — — 12Zhang Youcai* 9 — — — 9Ho Tsu Kwok Charles* 9 — — — 9SupervisorsWang Zuoran — — — — —Zhang Chongqing* — — — — —Wang Peijun* — — — — —Wang Xianwen* — — — — —Zhang Baojian* — — — — —Kang Xianzhang — — — — —Su Wensheng — 160 175 19 354Cui Guoqi — 147 163 19 329Zhang Xianglin* — 63 170 6 239Zhang Jitian — 90 — 12 102Zou Huiping — 90 — 12 102Li Zhonghua — 86 — 8 94Independent supervisorsCui Jianmin* 9 — — — 9Li Yonggui 121 — — — 121Zhang Youcai 109 — — — 109Total 678 2,290 1,603 184 4,755
* These directors and supervisors were resigned on 24 May 2006.

CHINA PETROLEUM & CHEMICAL CORPORATIONAnnual Report 2006132
NOTES ON THE FINANCIAL STATEMENTS (CONTINUED)for the year ended 31 December 2006
Fina
ncia
l S
tate
men
ts (
Inte
rna
tion
al)
13 DIRECTORS’ AND SUPERVISORS’ EMOLUMENTS (Continued)
Salaries, Retirementallowances and Discretionary scheme 2005
Name Directors’ fee benefits in kind bonuses contributions TotalRMB’000 RMB’000 RMB’000 RMB’000 RMB’000
Executive directorsWang Jiming — 239 225 16 480Mou Shuling — 219 212 11 442Zhang Jiaren — 227 212 16 455Cao Xianghong — 227 212 16 455Cao Yaofeng — 133 134 12 279Non-executive directorsChen Tonghai — — — — —Liu Genyuan — — — — —Gao Jian — — — — —Fan Yifei — — — — —Independent non-executive directorsChen Qingtai 27 — — — 27Ho Tsu Kwok Charles 21 — — — 21Shi Wanpeng 24 — — — 24Zhang Youcai 21 — — — 21SupervisorsWang Zuoran — — — — —Zhang Chongqing — — — — —Wang Peijun — — — — —Wang Xianwen — — — — —Zhang Baojian — — — — —Kang Xianzhang — — — — —Su Wensheng — 164 22 16 202Cui Guoqi — 105 42 7 154Zhang Xianglin — 82 88 11 181Zhang Haichao — 89 95 10 194Independent supervisorsCui Jianming 24 — — — 24Li Yonggui 24 — — — 24Total 141 1,485 1,242 115 2,983
14 SENIOR MANAGEMENT’S EMOLUMENTSFor the year ended 31 December 2006, of the five highest paid individuals, four (2005: four) are directors whose emoluments are disclosed in Note 13.The aggregate of the emoluments in respect of the five highest paid individuals are as follows:
2006 2005RMB’000 RMB’000
Salaries and other emoluments 2,640 2,269Retirement scheme contributions 92 77
2,732 2,346
An analysis of emoluments paid to the five highest paid individuals by number of individuals and emolument range is as follows:
2006 2005Number Number
Nil to HK$ 1,000,000 5 5
15 PROFIT ATTRIBUTABLE TO EQUITY SHAREHOLDERS OF THE COMPANYThe consolidated profit attributable to equity shareholders of the Company includes a profit of RMB 55,140 million (2005: RMB 26,668 million) whichhas been dealt with in the financial statements of the Company.
16 DIVIDENDSDividends payable to equity shareholders of the Company attributable to the year represent:
2006 2005RMB millions RMB millions
Dividends declared and paid during the year of RMB 0.04 per share (2005: RMB 0.04 per share) 3,468 3,468Dividends declared after the balance sheet date of RMB 0.11 per share (2005: RMB 0.09 per share) 9,537 7,803
13,005 11,271
Pursuant to the Company’s Articles of Association and a resolution passed at the Directors’ meeting on 25 August 2006, the directors authorised todeclare an interim dividends for the year ended 31 December 2006 of RMB 0.04 (2005: RMB 0.04) per share totalling RMB 3,468 million (2005: RMB3,468 million), which was paid on 28 September 2006 (2005: 30 September 2005).

CHINA PETROLEUM & CHEMICAL CORPORATION Annual Report 2006 133
NOTES ON THE FINANCIAL STATEMENTS (CONTINUED)for the year ended 31 December 2006
Fina
ncia
l S
tate
men
ts (
Inte
rna
tion
al)
16 DIVIDENDS (Continued)Pursuant to a resolution passed at the Directors’ meeting on 6 April 2007, a final dividend in respect of the year ended 31 December 2006 of RMB0.11 (2005: RMB 0.09) per share totalling RMB 9,537 million (2005: RMB 7,803 million) was proposed for shareholders’ approval at the AnnualGeneral Meeting. Final dividend of RMB 9,537 million (2005: RMB 7,803 million) proposed after the balance sheet date has not been recognised as aliability at the balance sheet date.
Dividends payable to equity shareholders of the Company attributable to the previous financial year, approved and paid during the period represent:
2006 2005RMB millions RMB millions
Final dividends in respect of the previous financial year, approved and paid during the year ofRMB 0.09 per share (2005: RMB 0.08 per share) 7,803 6,936
Pursuant to the shareholders’ approval at the Annual General Meeting on 24 May 2006, a final dividend of RMB 0.09 per share totalling RMB 7,803million in respect of the year ended 31 December 2005 was declared and paid on 30 June 2006.
Pursuant to the shareholders’ approval at the Annual General Meeting on 18 May 2005, a final dividend of RMB 0.08 per share totalling RMB 6,936million in respect of the year ended 31 December 2004 was declared and paid on 27 June 2005.
17 BASIC AND DILUTED EARNINGS PER SHAREThe calculations of basic and diluted earnings per share for the year ended 31 December 2006 are based on the profit attributable to equity shareholdersof the Company of RMB 53,912 million (2005: RMB 41,455 million) and the weighted average number of shares of 86,702,439,000 (2005:86,702,439,000) during the year.
18 PROPERTY, PLANT AND EQUIPMENT
The Group - by segment
Exploration Marketing Corporateand and and
production Refining distribution Chemicals others TotalRMB millions RMB millions RMB millions RMB millions RMB millions RMB millions
Cost/valuation:Balance at 1 January 2005 194,466 116,923 65,345 163,222 4,092 544,048Additions 412 129 382 271 150 1,344Transferred from construction in progress 23,451 8,121 14,017 18,457 381 64,427Proportionate share of a jointly controlled entity — — — 1,028 — 1,028Reclassification (157) (432) 204 289 96 —Disposals (3,131) (2,859) (2,927) (3,164) (245) (12,326)Balance at 31 December 2005 215,041 121,882 77,021 180,103 4,474 598,521Balance at 1 January 2006 215,041 121,882 77,021 180,103 4,474 598,521Additions 1,175 145 1,280 280 456 3,336Transferred from construction in progress 28,695 26,994 10,087 15,461 161 81,398Acquisition of a subsidiary 2,071 — — — — 2,071Reclassification (56) (600) — 725 (69) —Disposals (5,562) (1,522) (2,280) (4,302) (153) (13,819)Balance at 31 December 2006 241,364 146,899 86,108 192,267 4,869 671,507
Accumulated depreciation:Balance at 1 January 2005 94,977 56,581 13,465 92,042 1,407 258,472Depreciation charge for the year 11,090 6,974 3,013 9,392 282 30,751Impairment losses for the year 60 — 366 1,425 — 1,851Reclassification (78) (214) 78 160 54 —Written back on disposals (2,706) (2,206) (2,110) (2,719) (194) (9,935)Balance at 31 December 2005 103,343 61,135 14,812 100,300 1,549 281,139Balance at 1 January 2006 103,343 61,135 14,812 100,300 1,549 281,139Depreciation charge for the year 12,839 7,671 3,422 9,391 401 33,724Acquisition of a subsidiary 592 — — — — 592Impairment losses for the year 552 — 23 250 — 825Reclassification (23) (392) — 420 (5) —Written back on disposals (5,253) (1,314) (1,103) (3,470) (108) (11,248)Balance at 31 December 2006 112,050 67,100 17,154 106,891 1,837 305,032
Net book value:At 1 January 2005 99,489 60,342 51,880 71,180 2,685 285,576Balance at 31 December 2005 111,698 60,747 62,209 79,803 2,925 317,382Balance at 31 December 2006 129,314 79,799 68,954 85,376 3,032 366,475

CHINA PETROLEUM & CHEMICAL CORPORATIONAnnual Report 2006134
NOTES ON THE FINANCIAL STATEMENTS (CONTINUED)for the year ended 31 December 2006
Fina
ncia
l S
tate
men
ts (
Inte
rna
tion
al)
18 PROPERTY, PLANT AND EQUIPMENT (Continued)
The Company - by segment
Exploration Marketing Corporateand and and
production Refining distribution Chemicals others TotalRMB millions RMB millions RMB millions RMB millions RMB millions RMB millions
Cost/valuation:Balance at 1 January 2005 69,584 88,066 61,983 59,859 3,070 282,562Additions 151 113 267 38 120 689Transferred from construction in progress 13,213 5,772 9,363 2,069 371 30,788Transferred to subsidiaries — — (577) — — (577)Reclassification (130) (176) 276 (2) 32 —Disposals (1,415) (1,546) (2,864) (978) (213) (7,016)Balance at 31 December 2005 81,403 92,229 68,448 60,986 3,380 306,446Balance at 1 January 2006 81,403 92,229 68,448 60,986 3,380 306,446Additions 192 109 1,276 7 11 1,595Transferred from construction in progress 25,317 15,049 8,115 11,357 52 59,890Transferred from subsidiaries 109,581 2,702 — 15,866 — 128,149Transferred to subsidiaries — — (746) — — (746)Reclassification (56) (600) — 725 (69) —Disposals (5,313) (1,242) (2,158) (1,723) (105) (10,541)Balance at 31 December 2006 211,124 108,247 74,935 87,218 3,269 484,793
Accumulated depreciation:Balance at 1 January 2005 32,119 42,789 12,892 35,694 1,057 124,551Depreciation charge for the year 5,048 4,742 2,920 2,892 180 15,782Transferred to subsidiaries — — (66) — — (66)Impairment losses for the year 60 — 351 671 — 1,082Reclassification (65) (49) 99 (1) 16 —Written back on disposals (1,371) (1,183) (2,061) (814) (185) (5,614)Balance at 31 December 2005 35,791 46,299 14,135 38,442 1,068 135,735Balance at 1 January 2006 35,791 46,299 14,135 38,442 1,068 135,735Depreciation charge for the year 11,569 5,757 3,082 3,835 235 24,478Transferred from subsidiaries 50,994 1,472 — 9,382 — 61,848Transferred to subsidiaries — — (74) — — (74)Impairment losses for the year 533 — 23 200 — 756Reclassification (23) (395) — 423 (5) —Written back on disposals (5,144) (1,083) (1,050) (1,385) (71) (8,733)Balance at 31 December 2006 93,720 52,050 16,116 50,897 1,227 214,010
Net book value:At 1 January 2005 37,465 45,277 49,091 24,165 2,013 158,011Balance at 31 December 2005 45,612 45,930 54,313 22,544 2,312 170,711Balance at 31 December 2006 117,404 56,197 58,819 36,321 2,042 270,783

CHINA PETROLEUM & CHEMICAL CORPORATION Annual Report 2006 135
NOTES ON THE FINANCIAL STATEMENTS (CONTINUED)for the year ended 31 December 2006
Fina
ncia
l S
tate
men
ts (
Inte
rna
tion
al)
18 PROPERTY, PLANT AND EQUIPMENT (Continued)
The Group - by asset class
Oil depots, Plant,storage tanks machinery,
Oil and gas and service equipmentBuildings properties stations and others Total
RMB millions RMB millions RMB millions RMB millions RMB millionsCost/valuation:Balance at 1 January 2005 45,119 175,522 60,533 262,874 544,048Additions 108 253 228 755 1,344Transferred from construction in progress 2,535 22,235 13,851 25,806 64,427Proportionate share of a jointly controlled entity 182 — — 846 1,028Reclassification (406) (802) 650 558 —Disposals (1,034) (1,928) (2,145) (7,219) (12,326)Balance at 31 December 2005 46,504 195,280 73,117 283,620 598,521Balance at 1 January 2006 46,504 195,280 73,117 283,620 598,521Additions 748 777 1,071 740 3,336Transferred from construction in progress 2,777 26,579 14,549 37,493 81,398Acquisition of a subsidiary 519 1,313 — 239 2,071Reclassification (1,569) 10 3,170 (1,611) —Disposals (749) (5,266) (1,658) (6,146) (13,819)Balance at 31 December 2006 48,230 218,693 90,249 314,335 671,507
Accumulated depreciation:Balance at 1 January 2005 20,334 85,996 11,781 140,361 258,472Depreciation charge for the year 1,724 10,431 2,914 15,682 30,751Impairment losses for the year 79 60 261 1,451 1,851Reclassification (98) (430) 153 375 —Written back on disposals (598) (1,683) (1,379) (6,275) (9,935)Balance at 31 December 2005 21,441 94,374 13,730 151,594 281,139Balance at 1 January 2006 21,441 94,374 13,730 151,594 281,139Depreciation charge for the year 1,787 12,126 3,728 16,083 33,724Acquisition of a subsidiary 49 468 — 75 592Impairment losses for the year 118 532 23 152 825Reclassification (352) (45) 1,221 (824) —Written back on disposals (437) (5,073) (834) (4,904) (11,248)Balance at 31 December 2006 22,606 102,382 17,868 162,176 305,032
Net book value:At 1 January 2005 24,785 89,526 48,752 122,513 285,576Balance at 31 December 2005 25,063 100,906 59,387 132,026 317,382Balance at 31 December 2006 25,624 116,311 72,381 152,159 366,475

CHINA PETROLEUM & CHEMICAL CORPORATIONAnnual Report 2006136
NOTES ON THE FINANCIAL STATEMENTS (CONTINUED)for the year ended 31 December 2006
Fina
ncia
l S
tate
men
ts (
Inte
rna
tion
al)
18 PROPERTY, PLANT AND EQUIPMENT (Continued)
The Company - by asset class
Oil depots, Plant,storage tanks machinery,
Oil and gas and service equipmentBuildings properties stations and others Total
RMB millions RMB millions RMB millions RMB millions RMB millionsCost/valuation:Balance at 1 January 2005 25,838 61,866 57,395 137,463 282,562Additions 132 64 174 319 689Transferred from construction in progress 989 12,266 9,363 8,170 30,788Transferred to subsidiaries (9) — (529) (39) (577)Reclassification (469) (551) 651 369 —Disposals (552) (578) (2,097) (3,789) (7,016)Balance at 31 December 2005 25,929 73,067 64,957 142,493 306,446Balance at 1 January 2006 25,929 73,067 64,957 142,493 306,446Additions 61 — 1,046 488 1,595Transferred from construction in progress 1,339 23,683 12,213 22,655 59,890Transferred from subsidiaries 3,288 102,919 — 21,942 128,149Transferred to subsidiaries — — (746) — (746)Reclassification (2,512) 10 2,845 (343) —Disposals (321) (5,144) (1,531) (3,545) (10,541)Balance at 31 December 2006 27,784 194,535 78,784 183,690 484,793
Accumulated depreciation:Balance at 1 January 2005 10,537 29,934 11,403 72,677 124,551Depreciation charge for the year 1,046 4,682 2,524 7,530 15,782Transferred to subsidiaries (3) — (41) (22) (66)Impairment losses for the year 21 60 261 740 1,082Reclassification (111) (309) 154 266 —Written back on disposals (326) (565) (1,349) (3,374) (5,614)Balance at 31 December 2005 11,164 33,802 12,952 77,817 135,735Balance at 1 January 2006 11,164 33,802 12,952 77,817 135,735Depreciation charge for the year 927 11,071 3,146 9,334 24,478Transferred from subsidiaries 1,056 45,609 — 15,183 61,848Transferred to subsidiaries — — (74) — (74)Impairment losses for the year 118 532 23 83 756Reclassification (412) (45) 1,209 (752) —Written back on disposals (230) (5,000) (783) (2,720) (8,733)Balance at 31 December 2006 12,623 85,969 16,473 98,945 214,010
Net book value:Balance at 1 January 2005 15,301 31,932 45,992 64,786 158,011Balance at 31 December 2005 14,765 39,265 52,005 64,676 170,711Balance at 31 December 2006 15,161 108,566 62,311 84,745 270,783
The Group’s proportionate share of the jointly controlled entities’ net book value of property, plant and equipment at 31 December 2006 in theexploration and production and the chemicals segments were RMB 388 million (2005: RMB 398 million) and RMB 13,871 million (2005: RMB 14,889million), respectively.
As required by the relevant PRC regulations with respect to the Reorganisation, the property, plant and equipment of the Group at 30 September 1999were valued for each asset class by China United Assets Appraisal Corporation, Beijing Zhong Zheng Appraisal Company, CIECC Assets AppraisalCorporation and Zhong Fa International Properties Valuation Corporation, independent valuers registered in the PRC, on a depreciated replacementcost basis. The value of property, plant and equipment was determined at RMB 159,788 million. The surplus on revaluation of RMB 32,320 million, netof amounts allocated to minority interests, was incorporated in the financial statements of the Group at 31 December 1999.
In connection with the acquisitions of certain entities and related operations from Sinopec Group Company in prior years, the related property, plantand equipment were revalued by independent valuers in accordance with relevant PRC rules and regulations. The surplus on these revaluations of RMB1,409 million, net of amounts allocated to minority interests, was credited to revaluation reserve.
In connection with the Acquisition of Oil Production Plants, the property, plant and equipment of the Oil Production Plants were revalued at 30 June2006, by a firm of independent valuers in accordance with the relevant PRC rules and regulations. The value of property, plant and equipment of theOil Production Plants pursuant to the valuation, based on a depreciated replacement cost basis, was determined at RMB 2,303 million, which approximatedthe net historical carrying value of the assets.
In accordance with IAS 16, subsequent to these revaluations, which was based on depreciated replacement costs, property, plant and equipment arecarried at revalued amount, being the fair value at the date of the revaluation less any subsequent accumulated depreciation and impairment losses.Revaluation is performed periodically to ensure that the carrying amount does not differ materially from that which would be determined using fairvalue at the balance sheet date. Based on a revaluation performed as of 31 December 2004, which was based on depreciated replacement costs, thecarrying value of property, plant and equipment did not differ materially from their fair value.

CHINA PETROLEUM & CHEMICAL CORPORATION Annual Report 2006 137
NOTES ON THE FINANCIAL STATEMENTS (CONTINUED)for the year ended 31 December 2006
Fina
ncia
l S
tate
men
ts (
Inte
rna
tion
al)
19 CONSTRUCTION IN PROGRESS
The Group
Exploration and Marketing and Corporate andproduction Refining distribution Chemicals others Total
RMB millions RMB millions RMB millions RMB millions RMB millions RMB millionsBalance at 1 January 2005 9,387 9,483 13,781 13,170 1,513 47,334Additions 27,245 18,971 10,572 9,115 1,014 66,917Additions by jointly controlled entities 814 — — 1,830 — 2,644Proportionate share of a jointly controlled entity — — — 5,461 — 5,461Dry hole costs written off (2,992) — — — — (2,992)Transferred to property, plant and equipment
and other assets (23,451) (8,121) (14,017) (19,014) (381) (64,984)Balance at 31 December 2005 11,003 20,333 10,336 10,562 2,146 54,380Balance at 1 January 2006 11,003 20,333 10,336 10,562 2,146 54,380Additions 37,892 21,824 10,039 12,361 1,714 83,830Additions by jointly controlled entities 91 — — 148 — 239Acquisition of a subsidiary 89 — — — — 89Dry hole costs written off (3,960) — — — — (3,960)Transferred to property, plant and equipment (28,695) (26,994) (10,087) (15,461) (161) (81,398)Balance at 31 December 2006 16,420 15,163 10,288 7,610 3,699 53,180
The Group’s proportionate share of the jointly controlled entities’ construction in progress at 31 December 2006 in the exploration and production andthe chemicals segments were RMB 2,979 million (2005: RMB 2,888 million) and RMB 603 million (2005: RMB 504 million), respectively.
As at 31 December 2006, the amount of capitalised cost of exploratory wells included in the Group’s construction in progress in the exploration andproduction segment was RMB 4,771 million (2005: RMB 3,573 million). The geological and geophysical costs paid during the year ended 31 December2006 were RMB 3,878 million (2005: RMB 3,200 million).
The Company
Exploration and Marketing and Corporate andproduction Refining distribution Chemicals others Total
RMB millions RMB millions RMB millions RMB millions RMB millions RMB millionsBalance at 1 January 2005 6,607 6,961 10,271 3,615 1,494 28,948Additions 16,528 12,084 7,825 5,845 915 43,197Dry hole costs written off (2,271) — — — — (2,271)Transferred to property, plant and equipment (13,213) (5,772) (9,363) (2,069) (371) (30,788)Balance at 31 December 2005 7,651 13,273 8,733 7,391 2,038 39,086Balance at 1 January 2006 7,651 13,273 8,733 7,391 2,038 39,086Additions 32,487 14,311 8,468 8,373 1,056 64,695Transferred from subsidiaries 927 34 — 237 — 1,198Dry hole costs written off (3,950) — — — — (3,950)Transferred to property, plant and equipment (25,317) (15,049) (8,115) (11,357) (52) (59,890)Balance at 31 December 2006 11,798 12,569 9,086 4,644 3,042 41,139

CHINA PETROLEUM & CHEMICAL CORPORATIONAnnual Report 2006138
NOTES ON THE FINANCIAL STATEMENTS (CONTINUED)for the year ended 31 December 2006
Fina
ncia
l S
tate
men
ts (
Inte
rna
tion
al)
20 GOODWILL
The Group2006 2005
RMB millions RMB millionsCost:Balance at 1 January 2,203 383Additions 12,122 1,820Balance at 31 December 14,325 2,203Accumulated impairment losses:Balance at 1 January and 31 December — —Net book value:Balance at 1 January 2,203 383Balance at 31 December 14,325 2,203
Impairment tests for cash-generating units containing goodwillGoodwill is allocated to the following Group’s cash-generating units:
2006 2005RMB millions RMB millions
Sinopec Beijing Yanshan Branch (“Sinopec Yanshan”) 1,157 1,157Sinopec Zhenhai Refining and Chemical Company Limited (“Sinopec Zhenhai”) 3,952 —Sinopec Qilu Petrochemical Company Limited (“Sinopec Qilu”) 2,159 —Sinopec Yangzi Petrochemical Company Limited (“Sinopec Yangzi”) 2,737 —Sinopec Zhongyuan Petroleum Company Limited (“Sinopec Zhongyuan”) 1,391 —Shengli Oil Field Dynamic Company Limited (“Dynamic”) 1,361 —Multiple units without significant goodwill 1,568 1,046
14,325 2,203
During the year ended 31 December 2005, the Group acquired the entire 1,012,000,000 H shares, representing approximately 29.99% of the issuedshare capital of Sinopec Beijing Yanshan Petrochemical Company Limited from minority interests shareholders at HK$ 3.80 per share. The totalconsideration paid by the Group was approximately RMB 4,088 million which was settled in cash. The excess of the cost of purchase over the fair valueof the underlying assets and liabilities (on a proportionate share) was RMB 1,157 million.
During the year ended 31 December 2006, the Group acquired additional equity interests in Sinopec Zhenhai, Sinopec Qilu, Sinopec Yangzi, SinopecZhongyuan and Dynamic of 28.7%, 17.7%, 14.8%, 28.5% and 71.4%, respectively. The Company acquired these additional equity interests to reducemanagement layers and improve the efficiency of the production, management and sales of the Group as a whole. The total consideration paid by theGroup was approximately RMB 21,971 million which was settled in cash. The excess of the cost of purchase over the fair value of the underlying assetsand liabilities (on a proportionate share) in Sinopec Zhenhai, Sinopec Qilu, Sinopec Yangzi, Sinopec Zhongyuan and Dynamic were RMB 3,952 million,RMB 2,159 million, RMB 2,737 million, RMB 1,391 million and RMB 1,361 million, respectively.
The recoverable amounts of the Sinopec Yanshan, Sinopec Zhenhai, Sinopec Yangzi, Sinopec Qilu, Sinopec Zhongyuan and Dynamic are determinedbased on value in use calculations. These calculations use cash flow projections based on financial budgets approved by management covering a one-year period and pre-tax discount rates primarily ranging from 14.2% to 17.2%. Cash flows beyond the one-year period are maintained constant.Management believes any reasonably possible change in the key assumptions on which these entities’ recoverable amounts are based would not causethese entities’ carrying amounts to exceed their recoverable amounts.
Key assumptions used for the value in use calculations for these entities are the gross margin and sales volume. Management determined the budgetedgross margin based on the gross margin achieved in the period immediately before the budget period and its expectation for the development ofinternational crude oil prices. The sales volume was based on the production capacity and the sales volume in the period immediately before thebudget period.
21 INVESTMENTS IN SUBSIDIARIES
The Company2006 2005
RMB millions RMB millionsInvestments in subsidiaries, at cost 66,809 75,579
Details of the Company’s principal subsidiaries at 31 December 2006 are set out in Note 39.

CHINA PETROLEUM & CHEMICAL CORPORATION Annual Report 2006 139
NOTES ON THE FINANCIAL STATEMENTS (CONTINUED)for the year ended 31 December 2006
Fina
ncia
l S
tate
men
ts (
Inte
rna
tion
al)
22 INVESTMENTS
The Group The Company2006 2005 2006 2005
RMB millions RMB millions RMB millions RMB millionsAvailable-for-sale securities 157 119 — —Other unlisted investments, at cost 2,741 3,359 1,083 1,140
2,898 3,478 1,083 1,140Less: Impairment losses (316) (327) (112) (103)
2,582 3,151 971 1,037
Unlisted investments represent the Group’s interests in PRC domiciled enterprises which are mainly engaged in non-oil and gas activities and operations.The Group has no significant investments in marketable securities.
The impairment losses relating to investments for the year ended 31 December 2006 amounted to RMB 48 million (2005: RMB 77 million).
23 INTEREST IN ASSOCIATES
The Group The Company2006 2005 2006 2005
RMB millions RMB millions RMB millions RMB millionsInvestments in associates, at cost — — 7,470 5,933Share of net assets 11,617 9,267 — —
11,617 9,267 7,470 5,933
The Group’s investments in associates are with companies primarily engaged in the oil and gas and chemical operations in the PRC. These investmentsare individually and in the aggregate not material to the Group’s financial condition or results of operations for all periods presented. The share ofassociates’ taxation for the year ended 31 December 2006 was RMB 439 million (2005: RMB 420 million). The principal investments in associates, allof which are incorporated in the PRC, are as follows:
Percentage ofPercentage equity held
Form of of equity by thebusiness Particulars of issued held by the Company’s
Name of company structure and paid up capital Company subsidiaries Principal activities% %
Sinopec Shandong Taishan Petroleum Incorporated 480,793,320 ordinary shares of 38.68 — Trading of petroleum products andCompany Limited RMB 1.00 each decoration of service gas stations
Sinopec Finance Company Limited Incorporated Registered capital 49.00 — Provision of non-banking financialRMB 6,000,000,000 services
Shanghai Petroleum National Gas Incorporated Registered capital 30.00 — Exploration and production of crude oilCorporation RMB 900,000,000 and natural gas
Shanghai Chemical Incorporated Registered capital — 38.26 Planning, development andIndustry Park Development RMB 2,372,439,000 operation of the Chemical Industry ParkCompany Limited in Shanghai, the PRC
China Shipping & Sinopec Incorporated Registered capital — 50.00 Transportation of petroleum productsSuppliers Company Limited RMB 876,660,000
China Aviation Oil Supply Incorporated Registered capital — 29.00 Marketing and distribution of refinedCompany Limited RMB 3,800,000,000 petroleum products
During the year ended 31 December 2006, the Group acquired 71.4% equity interests in Dynamic, which was previously an associate of the Group, andthereafter, Dynamic became a subsidiary of the Company (Notes 20 and 39).
CHINA PETROLEUM & CHEMICAL CORPORATIONAnnual Report 2006140
NOTES ON THE FINANCIAL STATEMENTS (CONTINUED)for the year ended 31 December 2006
Fina
ncia
l S
tate
men
ts (
Inte
rna
tion
al)
24 INTEREST IN JOINTLY CONTROLLED ENTITIES
The Company2006 2005
RMB millions RMB millionsInvestments in jointly controlled entities, at cost 7,482 7,280
The Group’s principal interests in jointly controlled entities are primarily engaged in the oil and gas and chemical operations in the PRC as follows:
Percentage ofPercentage equity held
Form of of equity by thebusiness Par ticulars of issued held by the Company’s
Name of company structure and paid up capital Company subsidiaries Principal activities% %
Shanghai Secco Petrochemical Incorporated Registered capital 30.00 20.00 Manufacturing and distribution ofCompany Limited USD 901,440,964 petrochemical products
BASF-YPC Company Limited Incorporated Registered capital 30.00 10.00 Manufacturing and distribution ofRMB 8,793,000,000 petrochemical products
Yueyang Sinopec and Shell Coal Incorporated Registered capital 50.00 — Manufacturing and distribution ofGasification Company Limited USD 45,588,700 industrial gas
Block A Oil Field in the Western Unincorporated — — 43.00 Exploration and production ofArea Chengdao in Bohai Bay crude oil and natural gas
Included in the consolidated financial statements are the following items that represent the Group’s proportionate share of the jointly controlledentities’ results of operation, financial condition and cash flows.
2006 2005RMB millions RMB millions
Results of operation:Operating revenue 17,913 10,082Expenses (15,180) (9,773)Net profit 2,733 309
Financial condition:Current assets 4,966 2,631Non-current assets, primarily property, plant and equipment and construction in progress with
net book values of RMB 14,259 million (2005: RMB 15,287 million) and RMB 3,582 million(2005: RMB 3,392 million), respectively 18,635 19,522
Current liabilities (2,736) (2,543)Non-current liabilities, primarily long-term bank loans, excluding current portion,
of RMB 8,267 million (2005: RMB 10,006 million) (8,643) (10,177)Net assets 12,222 9,433
Cash flows:Net cash generated from/(used in) operating activities 2,452 (1,434)Net cash used in investing activities (382) (2,474)Net cash (used in)/generated from financing activities (939) 4,011

CHINA PETROLEUM & CHEMICAL CORPORATION Annual Report 2006 141
NOTES ON THE FINANCIAL STATEMENTS (CONTINUED)for the year ended 31 December 2006
Fina
ncia
l S
tate
men
ts (
Inte
rna
tion
al)
25 LONG-TERM PREPAYMENTS AND OTHER ASSETSLong term prepayments and other assets primarily represent prepaid rental expenses over one year, computer software and catalysts.
26 TRADE ACCOUNTS AND BILLS RECEIVABLES
The Group The Company2006 2005 2006 2005
RMB millions RMB millions RMB millions RMB millionsAmounts due from third parties 14,601 13,564 4,622 4,136Amounts due from subsidiaries — — 5,570 6,252Amounts due from Sinopec Group Company and fellow subsidiaries 3,396 3,145 923 518Amounts due from associates 380 572 8 10Amounts due from jointly controlled entities 547 505 377 229
18,924 17,786 11,500 11,145Less: Impairment losses for bad and doubtful debts (3,334) (3,140) (2,668) (2,319)
15,590 14,646 8,832 8,826Bills receivable 8,757 7,167 2,760 1,334
24,347 21,813 11,592 10,160
The ageing analysis of trade accounts and bills receivables (net of impairment losses for bad and doubtful debts) is as follows:
The Group The Company2006 2005 2006 2005
RMB millions RMB millions RMB millions RMB millionsWithin one year 24,095 21,552 11,368 10,010Between one and two years 169 178 158 112Between two and three years 56 43 43 25Over three years 27 40 23 13
24,347 21,813 11,592 10,160
Sales are generally on a cash term. Credit is generally only available for major customers with well-established trading records. Amounts due fromSinopec Group Company and fellow subsidiaries are repayable under the same terms.
27 INVENTORIES
The Group The Company2006 2005 2006 2005
RMB millions RMB millions RMB millions RMB millions
Crude oil and other raw materials 54,227 53,360 28,956 25,471Work in progress 9,828 9,422 5,061 4,659Finished goods 25,762 23,173 17,574 17,980Spare parts and consumables 4,485 4,456 2,866 2,616
94,302 90,411 54,457 50,726Less: Allowance for diminution in value of inventories (866) (892) (469) (309)
93,436 89,519 53,988 50,417
The cost of inventories recognised as an expense in the consolidated income statement amounted to RMB 895,290 million for the year ended 31December 2006 (2005: RMB 682,288 million), including the write-down of inventories amounted to RMB 419 million (2005: RMB 262 million) and thereversal of write-down of inventories made in prior years amounted to RMB 445 million (2005: RMB 276 million) mainly arising from the sales ofinventories.
28 PREPAID EXPENSES AND OTHER CURRENT ASSETS
The Group The Company2006 2005 2006 2005
RMB millions RMB millions RMB millions RMB millionsAdvances to third parties 1,732 1,776 893 909Amounts due from Sinopec Group Company and fellow subsidiaries 2,020 2,965 1,896 2,559Amounts due from subsidiaries — — 4,491 2,964Other receivables 2,298 1,977 1,166 742Purchase deposits 3,106 2,496 2,222 1,106Prepayments in connection with construction work and equipment purchases 4,658 6,613 1,753 4,584Prepaid value-added tax and customs duty 4,815 4,288 2,496 2,184Amounts due from associates 332 539 308 508
18,961 20,654 15,225 15,556

CHINA PETROLEUM & CHEMICAL CORPORATIONAnnual Report 2006142
NOTES ON THE FINANCIAL STATEMENTS (CONTINUED)for the year ended 31 December 2006
Fina
ncia
l S
tate
men
ts (
Inte
rna
tion
al)
29 DEFERRED TAX ASSETS AND LIABILITIESDeferred tax assets and deferred tax liabilities are attributable to the items detailed in the table below:
The Group
Assets Liabilities Net balance2006 2005 2006 2005 2006 2005
RMB millions RMB millions RMB millions RMB millions RMB millions RMB millionsCurrentReceivables and inventories 3,531 3,448 — — 3,531 3,448Accruals 865 456 — — 865 456Non-currentProperty, plant and equipment 2,295 1,642 (1,678) (1,619) 617 23Accelerated depreciation — — (4,657) (4,290) (4,657) (4,290)Tax value of losses carried forward,
net of valuation allowances 53 128 — — 53 128Lease prepayments 351 359 — — 351 359Others 63 39 (4) (66) 59 (27)Deferred tax assets/(liabilities) 7,158 6,072 (6,339) (5,975) 819 97
The Company
Assets Liabilities Net balance2006 2005 2006 2005 2006 2005
RMB millions RMB millions RMB millions RMB millions RMB millions RMB millionsCurrentReceivables and inventories 3,339 1,226 — — 3,339 1,226Accruals 814 409 — — 814 409Non-currentProperty, plant and equipment 1,749 1,553 (1,634) (1,083) 115 470Accelerated depreciation — — (4,540) (1,066) (4,540) (1,066)Lease prepayments 17 17 — — 17 17Others 17 15 — (67) 17 (52)Deferred tax assets/(liabilities) 5,936 3,220 (6,174) (2,216) (238) 1,004
As at 31 December 2006, certain subsidiaries of the Company provided valuation allowance against tax value of losses carried forward for PRC incometax purpose of RMB 4,382 million which are available to offset their future PRC taxable income, if any. The tax value of these losses carried forward ofRMB 215 million, RMB 341 million, RMB 720 million, RMB 1,185 million and RMB 1,921 million will expire in 2007, 2008, 2009, 2010 and 2011,respectively.
A valuation allowance on deferred tax assets is recorded if it is probable that some portion or all of the deferred tax assets will not be realised throughthe recovery of taxes previously paid and/or future taxable income. The allowance is subject to ongoing adjustments based on changes in circumstancesthat affect the Group’s assessment on the realisability of the deferred tax assets. The Group has reviewed its deferred tax assets at the balance sheetdate. Based on this review, net valuation allowances of RMB 258 million (2005: RMB 391 million) were provided for the year ended 31 December 2006.The Group determined the valuation allowance based on management’s assessment of the probability that taxable profit will be available over theperiod which the deferred tax assets can be realised or utilised. In assessing the probability, both positive and negative evidence was considered,including whether it is probable that the operations will have future taxable profits over the periods which the deferred tax assets are deductible orutilised and whether the tax losses result from identifiable causes which are unlikely to recur. Based on this assessment, a valuation allowance wasprovided to reduce the deferred tax asset to the amount that is probable to be realised.

CHINA PETROLEUM & CHEMICAL CORPORATION Annual Report 2006 143
NOTES ON THE FINANCIAL STATEMENTS (CONTINUED)for the year ended 31 December 2006
Fina
ncia
l S
tate
men
ts (
Inte
rna
tion
al)
29 DEFERRED TAX ASSETS AND LIABILITIES (Continued)Movements in the deferred tax assets and liabilities are as follows:
The Group
Recognised inBalance at consolidated Recognised in Balance at1 January income other 31 December
2005 statement reserve 2005RMB millions RMB millions RMB millions RMB millions
CurrentReceivables and inventories 2,260 1,188 — 3,448Accruals 268 188 — 456Non-currentProperty, plant and equipment (138) 161 — 23Accelerated depreciation (4,000) (290) — (4,290)Tax value of losses carried forward, net of valuation allowance 66 62 — 128Lease prepayments 366 (7) — 359Others 32 (59) — (27)Net deferred tax (liabilities)/assets (1,146) 1,243 — 97
Recognised inBalance at consolidated Recognised in Balance at1 January income other 31 December
2006 statement reserve 2006RMB millions RMB millions RMB millions RMB millions
CurrentReceivables and inventories 3,448 83 — 3,531Accruals 456 409 — 865Non-currentProperty, plant and equipment 23 594 — 617Accelerated depreciation (4,290) (367) — (4,657)Tax value of losses carried forward, net of valuation allowance 128 (75) — 53Lease prepayments 359 (8) — 351Others (Note) (27) 90 (4) 59Net deferred tax assets/(liabilities) 97 726 (4) 819
Note:
The amount recognised in equity represents the tax effect of change in fair value of available-for-sale securities, which was recognised directly in equity.
The Company
Balance at Transferred Recognised in Balance at1 January from income 31 December
2005 subsidiaries statement 2005RMB millions RMB millions RMB millions RMB millions
CurrentReceivables and inventories 1,999 — (773) 1,226Accruals 246 — 163 409Non-currentProperty, plant and equipment 474 — (4) 470Accelerated depreciation (1,042) — (24) (1,066)Lease prepayments 16 — 1 17Others 6 — (58) (52)Net deferred tax assets/(liabilities) 1,699 — (695) 1,004
Balance at Transferred Recognised in Balance at1 January from income 31 December
2006 subsidiaries statement 2006RMB millions RMB millions RMB millions RMB millions
CurrentReceivables and inventories 1,226 2,066 47 3,339Accruals 409 — 405 814Non-currentProperty, plant and equipment 470 (494) 139 115Accelerated depreciation (1,066) (3,102) (372) (4,540)Lease prepayments 17 — — 17Others (52) — 69 17Net deferred tax assets/(liabilities) 1,004 (1,530) 288 (238)
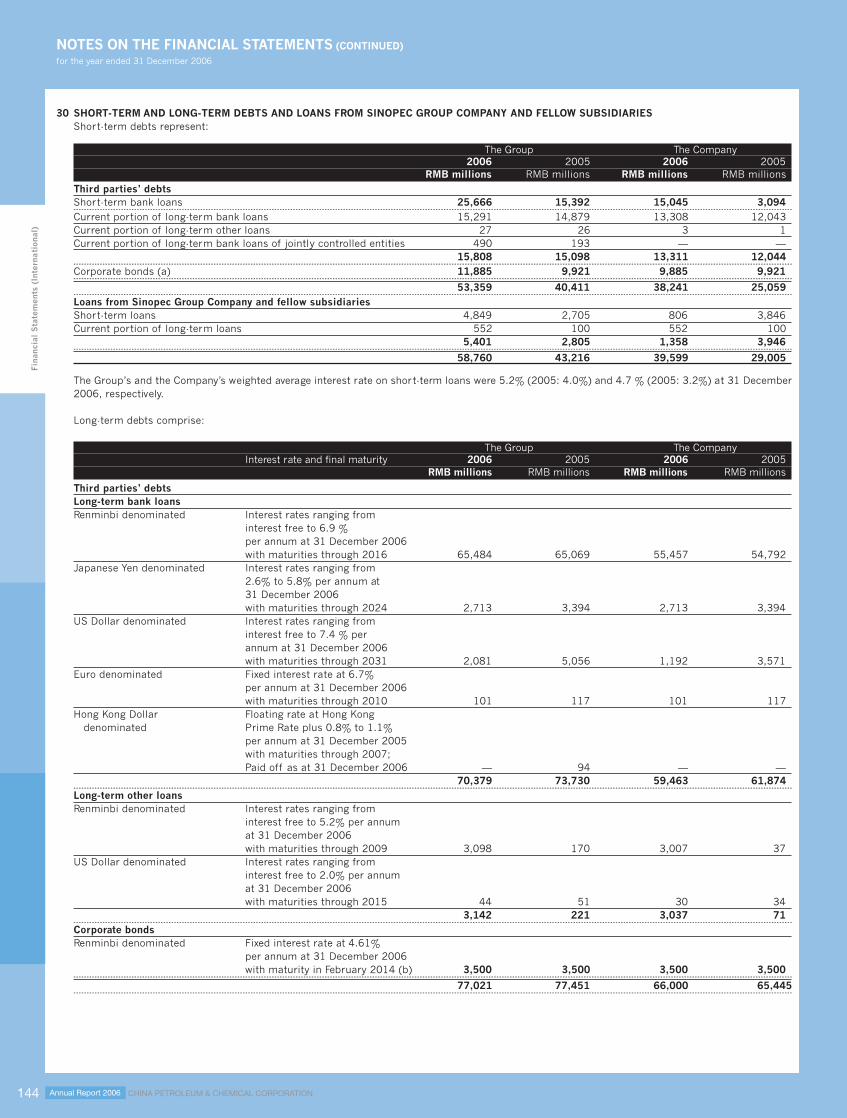
CHINA PETROLEUM & CHEMICAL CORPORATIONAnnual Report 2006144
NOTES ON THE FINANCIAL STATEMENTS (CONTINUED)for the year ended 31 December 2006
Fina
ncia
l S
tate
men
ts (
Inte
rna
tion
al)
30 SHORT-TERM AND LONG-TERM DEBTS AND LOANS FROM SINOPEC GROUP COMPANY AND FELLOW SUBSIDIARIESShort-term debts represent:
The Group The Company2006 2005 2006 2005
RMB millions RMB millions RMB millions RMB millionsThird parties’ debtsShort-term bank loans 25,666 15,392 15,045 3,094--- - - - - - - - - - - - - - - - - - - - - - - - - - - - - - - - - - - - - - - - - - - - - - - - - - - - - - - - - - - - - - - - - - - - - - - - - - - - - - - - - - - - - - - - - - - - - - - - - - - - - - - - - - - - - - - - - - - - - - - - - - - - - - - - - - - - - - - - - - - - - - - - - - - - - - - - - - - - - - - - - - - - - - - - - - - - - - - - - - - - - - - - - - - - - - - - - - - - - - - - - - - - - - - - - - - - - - - - - - - - - - - - - - - - - - - - - - - - - - - - - - - - - - - - - - - - - - - - - - - - - - - - - - - - - -
Current portion of long-term bank loans 15,291 14,879 13,308 12,043Current portion of long-term other loans 27 26 3 1Current portion of long-term bank loans of jointly controlled entities 490 193 — —
15,808 15,098 13,311 12,044--- - - - - - - - - - - - - - - - - - - - - - - - - - - - - - - - - - - - - - - - - - - - - - - - - - - - - - - - - - - - - - - - - - - - - - - - - - - - - - - - - - - - - - - - - - - - - - - - - - - - - - - - - - - - - - - - - - - - - - - - - - - - - - - - - - - - - - - - - - - - - - - - - - - - - - - - - - - - - - - - - - - - - - - - - - - - - - - - - - - - - - - - - - - - - - - - - - - - - - - - - - - - - - - - - - - - - - - - - - - - - - - - - - - - - - - - - - - - - - - - - - - - - - - - - - - - - - - - - - - - - - - - - - - - - -
Corporate bonds (a) 11,885 9,921 9,885 9,921--- - - - - - - - - - - - - - - - - - - - - - - - - - - - - - - - - - - - - - - - - - - - - - - - - - - - - - - - - - - - - - - - - - - - - - - - - - - - - - - - - - - - - - - - - - - - - - - - - - - - - - - - - - - - - - - - - - - - - - - - - - - - - - - - - - - - - - - - - - - - - - - - - - - - - - - - - - - - - - - - - - - - - - - - - - - - - - - - - - - - - - - - - - - - - - - - - - - - - - - - - - - - - - - - - - - - - - - - - - - - - - - - - - - - - - - - - - - - - - - - - - - - - - - - - - - - - - - - - - - - - - - - - - - - - -
53,359 40,411 38,241 25,059--- - - - - - - - - - - - - - - - - - - - - - - - - - - - - - - - - - - - - - - - - - - - - - - - - - - - - - - - - - - - - - - - - - - - - - - - - - - - - - - - - - - - - - - - - - - - - - - - - - - - - - - - - - - - - - - - - - - - - - - - - - - - - - - - - - - - - - - - - - - - - - - - - - - - - - - - - - - - - - - - - - - - - - - - - - - - - - - - - - - - - - - - - - - - - - - - - - - - - - - - - - - - - - - - - - - - - - - - - - - - - - - - - - - - - - - - - - - - - - - - - - - - - - - - - - - - - - - - - - - - - - - - - - - - - -
Loans from Sinopec Group Company and fellow subsidiariesShort-term loans 4,849 2,705 806 3,846Current portion of long-term loans 552 100 552 100
5,401 2,805 1,358 3,946--- - - - - - - - - - - - - - - - - - - - - - - - - - - - - - - - - - - - - - - - - - - - - - - - - - - - - - - - - - - - - - - - - - - - - - - - - - - - - - - - - - - - - - - - - - - - - - - - - - - - - - - - - - - - - - - - - - - - - - - - - - - - - - - - - - - - - - - - - - - - - - - - - - - - - - - - - - - - - - - - - - - - - - - - - - - - - - - - - - - - - - - - - - - - - - - - - - - - - - - - - - - - - - - - - - - - - - - - - - - - - - - - - - - - - - - - - - - - - - - - - - - - - - - - - - - - - - - - - - - - - - - - - - - - - -
58,760 43,216 39,599 29,005
The Group’s and the Company’s weighted average interest rate on short-term loans were 5.2% (2005: 4.0%) and 4.7 % (2005: 3.2%) at 31 December2006, respectively.
Long-term debts comprise:
The Group The CompanyInterest rate and final maturity 2006 2005 2006 2005
RMB millions RMB millions RMB millions RMB millions
Third parties’ debtsLong-term bank loansRenminbi denominated Interest rates ranging from
interest free to 6.9 %per annum at 31 December 2006with maturities through 2016 65,484 65,069 55,457 54,792
Japanese Yen denominated Interest rates ranging from2.6% to 5.8% per annum at31 December 2006with maturities through 2024 2,713 3,394 2,713 3,394
US Dollar denominated Interest rates ranging frominterest free to 7.4 % perannum at 31 December 2006with maturities through 2031 2,081 5,056 1,192 3,571
Euro denominated Fixed interest rate at 6.7%per annum at 31 December 2006with maturities through 2010 101 117 101 117
Hong Kong Dollar Floating rate at Hong Kongdenominated Prime Rate plus 0.8% to 1.1%
per annum at 31 December 2005with maturities through 2007;Paid off as at 31 December 2006 — 94 — —
70,379 73,730 59,463 61,874--- - - - - - - - - - - - - - - - - - - - - - - - - - - - - - - - - - - - - - - - - - - - - - - - - - - - - - - - - - - - - - - - - - - - - - - - - - - - - - - - - - - - - - - - - - - - - - - - - - - - - - - - - - - - - - - - - - - - - - - - - - - - - - - - - - - - - - - - - - - - - - - - - - - - - - - - - - - - - - - - - - - - - - - - - - - - - - - - - - - - - - - - - - - - - - - - - - - - - - - - - - - - - - - - - - - - - - - - - - - - - - - - - - - - - - - - - - - - - - - - - - - - - - - - - - - - - - - - - - - - - - - - - - - - - -
Long-term other loansRenminbi denominated Interest rates ranging from
interest free to 5.2% per annumat 31 December 2006with maturities through 2009 3,098 170 3,007 37
US Dollar denominated Interest rates ranging frominterest free to 2.0% per annumat 31 December 2006with maturities through 2015 44 51 30 34
3,142 221 3,037 71--- - - - - - - - - - - - - - - - - - - - - - - - - - - - - - - - - - - - - - - - - - - - - - - - - - - - - - - - - - - - - - - - - - - - - - - - - - - - - - - - - - - - - - - - - - - - - - - - - - - - - - - - - - - - - - - - - - - - - - - - - - - - - - - - - - - - - - - - - - - - - - - - - - - - - - - - - - - - - - - - - - - - - - - - - - - - - - - - - - - - - - - - - - - - - - - - - - - - - - - - - - - - - - - - - - - - - - - - - - - - - - - - - - - - - - - - - - - - - - - - - - - - - - - - - - - - - - - - - - - - - - - - - - - - - -
Corporate bondsRenminbi denominated Fixed interest rate at 4.61%
per annum at 31 December 2006with maturity in February 2014 (b) 3,500 3,500 3,500 3,500
--- - - - - - - - - - - - - - - - - - - - - - - - - - - - - - - - - - - - - - - - - - - - - - - - - - - - - - - - - - - - - - - - - - - - - - - - - - - - - - - - - - - - - - - - - - - - - - - - - - - - - - - - - - - - - - - - - - - - - - - - - - - - - - - - - - - - - - - - - - - - - - - - - - - - - - - - - - - - - - - - - - - - - - - - - - - - - - - - - - - - - - - - - - - - - - - - - - - - - - - - - - - - - - - - - - - - - - - - - - - - - - - - - - - - - - - - - - - - - - - - - - - - - - - - - - - - - - - - - - - - - - - - - - - - - -
77,021 77,451 66,000 65,445--- - - - - - - - - - - - - - - - - - - - - - - - - - - - - - - - - - - - - - - - - - - - - - - - - - - - - - - - - - - - - - - - - - - - - - - - - - - - - - - - - - - - - - - - - - - - - - - - - - - - - - - - - - - - - - - - - - - - - - - - - - - - - - - - - - - - - - - - - - - - - - - - - - - - - - - - - - - - - - - - - - - - - - - - - - - - - - - - - - - - - - - - - - - - - - - - - - - - - - - - - - - - - - - - - - - - - - - - - - - - - - - - - - - - - - - - - - - - - - - - - - - - - - - - - - - - - - - - - - - - - - - - - - - - - -

CHINA PETROLEUM & CHEMICAL CORPORATION Annual Report 2006 145
NOTES ON THE FINANCIAL STATEMENTS (CONTINUED)for the year ended 31 December 2006
Fina
ncia
l S
tate
men
ts (
Inte
rna
tion
al)
30 SHORT-TERM AND LONG-TERM DEBTS AND LOANS FROM SINOPEC GROUP COMPANY AND FELLOW SUBSIDIARIES (Continued)
The Group The CompanyInterest rate and final maturity 2006 2005 2006 2005
RMB millions RMB millions RMB millions RMB millions
Long-term bank loans of jointly controlled entitiesRenminbi denominated Floating rate at 90 % of PBOC’s
base lending rate per annumat 31 December 2006with maturities through 2021 5,019 5,710 — —
US Dollar denominated Floating rate at London InterbankOffer Rate plus 0.4% to 0.7%per annum at 31 December 2006with maturities through 2021 3,738 4,296 — —
8,757 10,006 — —- - - - - - - - - - - - - - - - - - - - - - - - - - - - - - - - - - - - - - - - - - - - - - - - - - - - - - - - - - - - - - - - - - - - - - - - - - - - - - - - - - - - - - - - - - - - - - - - - - - - - - - - - - - - - - - - - - - - - - - - - - - - - - - - - - - - - - - - - - - - - - - - - - - - - - - - - - - - - - - - - - - - - - - - - - - - - - - - - - - - - - - - - - - - - - - - - - - - - - - - - - - - - - - - - - - - - - - - - - - - - - - - - - - - - - - - - - - - - - - - - - - - - - - - - - - - - - - - - - - - - - - - - - - - - - - -
Total third parties’ long-term debts 85,778 87,457 66,000 65,445Less: Current portion (15,808) (15,098) (13,311) (12,044)
69,970 72,359 52,689 53,401--- - - - - - - - - - - - - - - - - - - - - - - - - - - - - - - - - - - - - - - - - - - - - - - - - - - - - - - - - - - - - - - - - - - - - - - - - - - - - - - - - - - - - - - - - - - - - - - - - - - - - - - - - - - - - - - - - - - - - - - - - - - - - - - - - - - - - - - - - - - - - - - - - - - - - - - - - - - - - - - - - - - - - - - - - - - - - - - - - - - - - - - - - - - - - - - - - - - - - - - - - - - - - - - - - - - - - - - - - - - - - - - - - - - - - - - - - - - - - - - - - - - - - - - - - - - - - - - - - - - - - - - - - - - - - -
Long-term loans from Sinopec Group Company and fellow subsidiariesRenminbi denominated Interest rates ranging from interest free
to 5.7% per annum at 31 December2006 with maturities through 2020 39,572 39,962 39,392 39,312
Long-term loans of jointly controlled entities from Sinopec GroupCompany and fellow subsidiaries
Renminbi denominated Floating rate at 90% of PBOC’s baselending rate applicable to three-yeartenor loan per annumat 31 December 2006with maturities through 2021 75 71 — —
Less: Current portion (552) (100) (552) (100)39,095 39,933 38,840 39,212
--- - - - - - - - - - - - - - - - - - - - - - - - - - - - - - - - - - - - - - - - - - - - - - - - - - - - - - - - - - - - - - - - - - - - - - - - - - - - - - - - - - - - - - - - - - - - - - - - - - - - - - - - - - - - - - - - - - - - - - - - - - - - - - - - - - - - - - - - - - - - - - - - - - - - - - - - - - - - - - - - - - - - - - - - - - - - - - - - - - - - - - - - - - - - - - - - - - - - - - - - - - - - - - - - - - - - - - - - - - - - - - - - - - - - - - - - - - - - - - - - - - - - - - - - - - - - - - - - - - - - - - - - - - - - - -
109,065 112,292 91,529 92,613
(a) The Company issued six-month corporate bonds of face value at RMB 10 billion to corporate investors in PRC debenture market on 24 October2005, at a discounted value of RMB 98.75 per RMB 100 par value,with an effective yield of 2.54% per annum. The Company redeemed thecorporate bonds in April 2006.
A subsidiary of the Company issued 270-day corporate bonds of face value at RMB 1 billion to corporate investors in PRC debenture market on 23February 2006, at a discounted value of RMB 97.78 per RMB 100 par value with an effective yield of 3.07% per annum. The Company redeemedthe corporate bonds in November 2006.
The Company issued 183-day corporate bonds of face value at RMB 10 billion to corporate investors in PRC debenture market on 16 May 2006, ata discounted value of RMB 98.68 per RMB 100 par value, with an effective yield of 2.67% per annum. The Company redeemed the corporate bondsin November 2006.
The Company issued 182-day corporate bonds of face value at RMB 10 billion to corporate investors in PRC debenture market on 13 November2006, at a discounted value of RMB 98.43 per RMB 100 par value, with an effective yield of 3.20% per annum. The bonds mature in May 2007.
A subsidiary of the Company issued 365-day corporate bonds of face value at RMB 2 billion to corporate investors in the PRC debenture market on11 December 2006 at par value, with an effective yield 3.83% per annum. The bonds mature in December 2007.
(b) The Company issued ten-year corporate bonds of RMB 3.5 billion to PRC citizens as well as PRC legal and non-legal persons on 24 February 2004with a fixed interest rate at 4.61% per annum.
Third parties’ loans of RMB 171 million of the Group at 31 December 2006 (2005: RMB 35 million) were secured by certain of the Group’sproperty, plant and equipment. The net book value of property, plant and equipment of the Group pledged as security amounted to RMB 288million at 31 December 2006 (2005: RMB 83 million).
Third parties’ loans of RMB 46 million of the Company at 31 December 2006 (2005: RMB 13 million) were secured by certain of the Company’sproperty, plant and equipment. The net book value of property, plant and equipment of the Company pledged as security amounted to RMB 75million at 31 December 2006 (2005: RMB 10 million).
The aggregate maturities of long-term debts and loans from Sinopec Group Company and fellow subsidiaries are as follows:
The Group The Company2006 2005 2006 2005
RMB millions RMB millions RMB millions RMB millionsWithin one year 16,360 15,198 13,863 12,144Between one and two years 26,529 19,787 24,590 16,420Between two and five years 36,205 43,442 26,147 34,771After five years 46,331 49,063 40,792 41,422
125,425 127,490 105,392 104,757

CHINA PETROLEUM & CHEMICAL CORPORATIONAnnual Report 2006146
NOTES ON THE FINANCIAL STATEMENTS (CONTINUED)for the year ended 31 December 2006
Fina
ncia
l S
tate
men
ts (
Inte
rna
tion
al)
30 SHORT-TERM AND LONG-TERM DEBTS AND LOANS FROM SINOPEC GROUP COMPANY AND FELLOW SUBSIDIARIES (Continued)
Included in short-term and long-term debts and loans from Sinopec Group Company and fellow subsidiaries of the Group are the following amountsdenominated in a currency other than the functional currency of the entity to which they relate:
2006 2005millions millions
US Dollars USD985 USD2,158Japanese Yen JPY41,350 JPY50,507Euro EUR10 EUR12Hong Kong Dollars HKD7,789 HKD128
31 TRADE ACCOUNTS AND BILLS PAYABLES
The Group The Company2006 2005 2006 2005
RMB millions RMB millions RMB millions RMB millionsAmounts due to third parties 49,177 50,353 17,213 12,032Amounts due to subsidiaries — — 19,775 15,805Amounts due to Sinopec Group Company and fellow subsidiaries 2,194 2,763 1,049 996Amounts due to jointly controlled entities 750 650 — —Amounts due to associates 4 51 4 —
52,125 53,817 38,041 28,833Bills payable 21,685 23,243 16,265 19,077
73,810 77,060 54,306 47,910
Amounts due to Sinopec Group Company and fellow subsidiaries are repayable in accordance with normal commercial terms.
The maturities of trade accounts and bills payables are as follows:
The Group The Company2006 2005 2006 2005
RMB millions RMB millions RMB millions RMB millionsDue within 1 month or on demand 44,303 45,044 32,295 23,251Due after 1 month but within 6 months 29,386 31,704 21,937 24,353Due after 6 months 121 312 74 306
73,810 77,060 54,306 47,910
32 ACCRUED EXPENSES AND OTHER PAYABLES
The Group The Company2006 2005 2006 2005
RMB millions RMB millions RMB millions RMB millionsAmounts due to Sinopec Group Company and fellow subsidiaries 12,670 8,133 9,757 4,538Amounts due to subsidiaries — — 16,191 7,032Accrued expenditures 23,266 19,660 18,384 13,984Taxes other than income tax 6,313 3,092 5,048 1,415Receipts in advance 18,513 12,375 15,473 9,133Advances from third parties 1,356 1,226 1,305 1,100Others 6,938 5,037 6,155 3,357
69,056 49,523 72,313 40,559

CHINA PETROLEUM & CHEMICAL CORPORATION Annual Report 2006 147
NOTES ON THE FINANCIAL STATEMENTS (CONTINUED)for the year ended 31 December 2006
Fina
ncia
l S
tate
men
ts (
Inte
rna
tion
al)
33 SHARE CAPITAL
The Group and the Company2006 2005
RMB millions RMB millionsRegistered, issued and fully paid:69,921,951,000 domestic listed A shares of RMB 1.00 each 69,922 —16,780,488,000 overseas listed H shares of RMB 1.00 each 16,780 16,78067,121,951,000 domestic state-owned A shares of RMB 1.00 each — 67,1222,800,000,000 domestic listed A shares of RMB 1.00 each — 2,800
86,702 86,702
The Company was established on 25 February 2000 with a registered capital of 68.8 billion domestic state-owned shares with a par value of RMB 1.00each. Such shares were issued to Sinopec Group Company in consideration for the assets and liabilities of the Predecessor Operations transferred tothe Company (Note 1).
Pursuant to the resolutions passed at an Extraordinary General Meeting held on 25 July 2000 and approvals from relevant government authorities, theCompany is authorised to increase its share capital to a maximum of 88.3 billion shares with a par value of RMB 1.00 each and offer not more than19.5 billion shares with a par value of RMB 1.00 each to investors outside the PRC. Sinopec Group Company is authorised to offer not more than 3.5billion shares of its shareholdings in the Company to investors outside the PRC. The shares sold by Sinopec Group Company to investors outside thePRC would be converted into H shares.
In October 2000, the Company issued 15,102,439,000 H shares with a par value of RMB 1.00 each, representing 12,521,864,000 H shares and25,805,750 American Depositary Shares (“ADSs”, each representing 100 H shares), at prices of HK$ 1.59 per H share and US$ 20.645 per ADS,respectively, by way of a global initial public offering to Hong Kong and overseas investors. As part of the global initial public offering, 1,678,049,000domestic state-owned ordinary shares of RMB 1.00 each owned by Sinopec Group Company were converted into H shares and sold to Hong Kong andoverseas investors.
In July 2001, the Company issued 2.8 billion domestic listed A shares with a par value of RMB 1.00 each at RMB 4.22 by way of a public offering tonatural persons and institutional investors in the PRC.
On 25 September 2006, the shareholders of listed A shares accepted the proposal offered by the shareholders of state-owned A shares whereby theshareholders of state-owned A shares agreed to transfer 2.8 state-owned A shares to shareholders of listed A shares for every 10 listed A shares theyheld, in exchange for the approval for the listing of all state-owned A shares. The 784,000,000 stated-owned A shares paid to the shareholders of listedA shares were tradable on 10 October 2006. The 66,337,551,000 domestic stated-owned A shares have been granted trading right upon settlement ofthe above consideration.
All A shares and H shares rank pari passu in all material aspects.

CHINA PETROLEUM & CHEMICAL CORPORATIONAnnual Report 2006148
NOTES ON THE FINANCIAL STATEMENTS (CONTINUED)for the year ended 31 December 2006
Fina
ncia
l S
tate
men
ts (
Inte
rna
tion
al)
34 RESERVES
The Group The Company2006 2005 2006 2005
RMB millions RMB millions RMB millions RMB millionsCapital reserveBalance at 1 January (19,217) (19,217) 13,672 13,672Transfer from capital reserve to other reserves (2,373) — (1,628) —Balance at 31 December (21,590) (19,217) 12,044 13,672--- - - - - - - - - - - - - - - - - - - - - - - - - - - - - - - - - - - - - - - - - - - - - - - - - - - - - - - - - - - - - - - - - - - - - - - - - - - - - - - - - - - - - - - - - - - - - - - - - - - - - - - - - - - - - - - - - - - - - - - - - - - - - - - - - - - - - - - - - - - - - - - - - - - - - - - - - - - - - - - - - - - - - - - - - - - - - - - - - - - - - - - - - - - - - - - - - - - - - - - - - - - - - - - - - - - - - - - - - - - - - - - - - - - - - - - - - - - - - - - - - - - - - - - - - - - - - - - - - - - - - - - - - - - - - -
Share premiumBalance at 1 January/31 December 18,072 18,072 18,072 18,072--- - - - - - - - - - - - - - - - - - - - - - - - - - - - - - - - - - - - - - - - - - - - - - - - - - - - - - - - - - - - - - - - - - - - - - - - - - - - - - - - - - - - - - - - - - - - - - - - - - - - - - - - - - - - - - - - - - - - - - - - - - - - - - - - - - - - - - - - - - - - - - - - - - - - - - - - - - - - - - - - - - - - - - - - - - - - - - - - - - - - - - - - - - - - - - - - - - - - - - - - - - - - - - - - - - - - - - - - - - - - - - - - - - - - - - - - - - - - - - - - - - - - - - - - - - - - - - - - - - - - - - - - - - - - - -
Revaluation reserveBalance at 1 January 26,342 27,998 — —Revaluation surplus realised (1,590) (1,656) — —Balance at 31 December 24,752 26,342 — —- - - - - - - - - - - - - - - - - - - - - - - - - - - - - - - - - - - - - - - - - - - - - - - - - - - - - - - - - - - - - - - - - - - - - - - - - - - - - - - - - - - - - - - - - - - - - - - - - - - - - - - - - - - - - - - - - - - - - - - - - - - - - - - - - - - - - - - - - - - - - - - - - - - - - - - - - - - - - - - - - - - - - - - - - - - - - - - - - - - - - - - - - - - - - - - - - - - - - - - - - - - - - - - - - - - - - - - - - - - - - - - - - - - - - - - - - - - - - - - - - - - - - - - - - - - - - - - - - - - - - - - - - - - - - - - -
Statutory surplus reserveBalance at 1 January 13,514 9,558 13,514 9,558Appropriation 5,066 3,956 5,066 3,956Statutory public welfare fund transferred to statutory surplus reserve 13,514 — 13,514 —Balance at 31 December 32,094 13,514 32,094 13,514--- - - - - - - - - - - - - - - - - - - - - - - - - - - - - - - - - - - - - - - - - - - - - - - - - - - - - - - - - - - - - - - - - - - - - - - - - - - - - - - - - - - - - - - - - - - - - - - - - - - - - - - - - - - - - - - - - - - - - - - - - - - - - - - - - - - - - - - - - - - - - - - - - - - - - - - - - - - - - - - - - - - - - - - - - - - - - - - - - - - - - - - - - - - - - - - - - - - - - - - - - - - - - - - - - - - - - - - - - - - - - - - - - - - - - - - - - - - - - - - - - - - - - - - - - - - - - - - - - - - - - - - - - - - - - -
Statutory public welfare fundBalance at 1 January 13,514 9,558 13,514 9,558Appropriation — 3,956 — 3,956Statutory public welfare fund transferred to statutory surplus reserve (13,514) — (13,514) —Balance at 31 December — 13,514 — 13,514--- - - - - - - - - - - - - - - - - - - - - - - - - - - - - - - - - - - - - - - - - - - - - - - - - - - - - - - - - - - - - - - - - - - - - - - - - - - - - - - - - - - - - - - - - - - - - - - - - - - - - - - - - - - - - - - - - - - - - - - - - - - - - - - - - - - - - - - - - - - - - - - - - - - - - - - - - - - - - - - - - - - - - - - - - - - - - - - - - - - - - - - - - - - - - - - - - - - - - - - - - - - - - - - - - - - - - - - - - - - - - - - - - - - - - - - - - - - - - - - - - - - - - - - - - - - - - - - - - - - - - - - - - - - - - -
Discretionary surplus reserveBalance at 1 January 7,000 7,000 7,000 7,000Appropriation 20,000 — 20,000 —Balance at 31 December 27,000 7,000 27,000 7,000--- - - - - - - - - - - - - - - - - - - - - - - - - - - - - - - - - - - - - - - - - - - - - - - - - - - - - - - - - - - - - - - - - - - - - - - - - - - - - - - - - - - - - - - - - - - - - - - - - - - - - - - - - - - - - - - - - - - - - - - - - - - - - - - - - - - - - - - - - - - - - - - - - - - - - - - - - - - - - - - - - - - - - - - - - - - - - - - - - - - - - - - - - - - - - - - - - - - - - - - - - - - - - - - - - - - - - - - - - - - - - - - - - - - - - - - - - - - - - - - - - - - - - - - - - - - - - - - - - - - - - - - - - - - - - -
Other reservesBalance at 1 January, as adjusted 987 547 242 247Change in fair value of available-for-sale securities, net of deferred tax 34 — — —Realisation of deferred tax on land use rights (7) (5) (7) (5)Transfer from retained earnings to other reserves 1,013 535 — —Transfer from capital reserve to other reserves 2,373 — 1,628 —Distribution to Sinopec Group Company (631) (90) (1,628) —Consideration for Acquisition of Oil Production Plants (Note 1) (3,500) — — —Balance at 31 December 269 987 235 242--- - - - - - - - - - - - - - - - - - - - - - - - - - - - - - - - - - - - - - - - - - - - - - - - - - - - - - - - - - - - - - - - - - - - - - - - - - - - - - - - - - - - - - - - - - - - - - - - - - - - - - - - - - - - - - - - - - - - - - - - - - - - - - - - - - - - - - - - - - - - - - - - - - - - - - - - - - - - - - - - - - - - - - - - - - - - - - - - - - - - - - - - - - - - - - - - - - - - - - - - - - - - - - - - - - - - - - - - - - - - - - - - - - - - - - - - - - - - - - - - - - - - - - - - - - - - - - - - - - - - - - - - - - - - - -
Retained earningsBalance at 1 January 77,387 53,122 20,591 (4,211)Profit for the year attributable to equity shareholders of the Company 53,912 41,455 57,895 43,113Final dividend for 2004 (Note 16) — (6,936) — —Interim dividend for 2005 (Note 16) — (3,468) — —Final dividend for 2005 (Note 16) (7,803) — (7,803) (6,936)Interim dividend for 2006 (Note 16) (3,468) — (3,468) (3,468)Appropriation (25,066) (7,912) (25,066) (7,912)Revaluation surplus realised 1,590 1,656 — —Realisation of deferred tax on land use rights 7 5 7 5Transfer from retained earnings to other reserves (1,013) (535) — —Balance at 31 December 95,546 77,387 42,156 20,591--- - - - - - - - - - - - - - - - - - - - - - - - - - - - - - - - - - - - - - - - - - - - - - - - - - - - - - - - - - - - - - - - - - - - - - - - - - - - - - - - - - - - - - - - - - - - - - - - - - - - - - - - - - - - - - - - - - - - - - - - - - - - - - - - - - - - - - - - - - - - - - - - - - - - - - - - - - - - - - - - - - - - - - - - - - - - - - - - - - - - - - - - - - - - - - - - - - - - - - - - - - - - - - - - - - - - - - - - - - - - - - - - - - - - - - - - - - - - - - - - - - - - - - - - - - - - - - - - - - - - - - - - - - - - - -
176,143 137,599 131,601 86,605
35 COMMITMENTS AND CONTINGENT LIABILITIES
Operating lease commitmentsThe Group leases service stations and other equipment through non-cancellable operating leases. These operating leases do not contain provisions forcontingent lease rentals. None of the rental agreements contain escalation provisions that may require higher future rental payments.
At 31 December 2006 and 31 December 2005, the future minimum lease payments under operating leases are as follows:
The Group The Company2006 2005 2006 2005
RMB millions RMB millions RMB millions RMB millionsWithin one year 4,711 3,593 4,457 3,424Between one and two years 4,568 3,442 4,391 3,363Between two and three years 4,531 3,388 4,359 3,319Between three and four years 4,505 3,357 4,337 3,292Between four and five years 4,450 3,353 4,372 3,290Thereafter 122,406 95,176 120,638 93,601
145,171 112,309 142,554 110,289
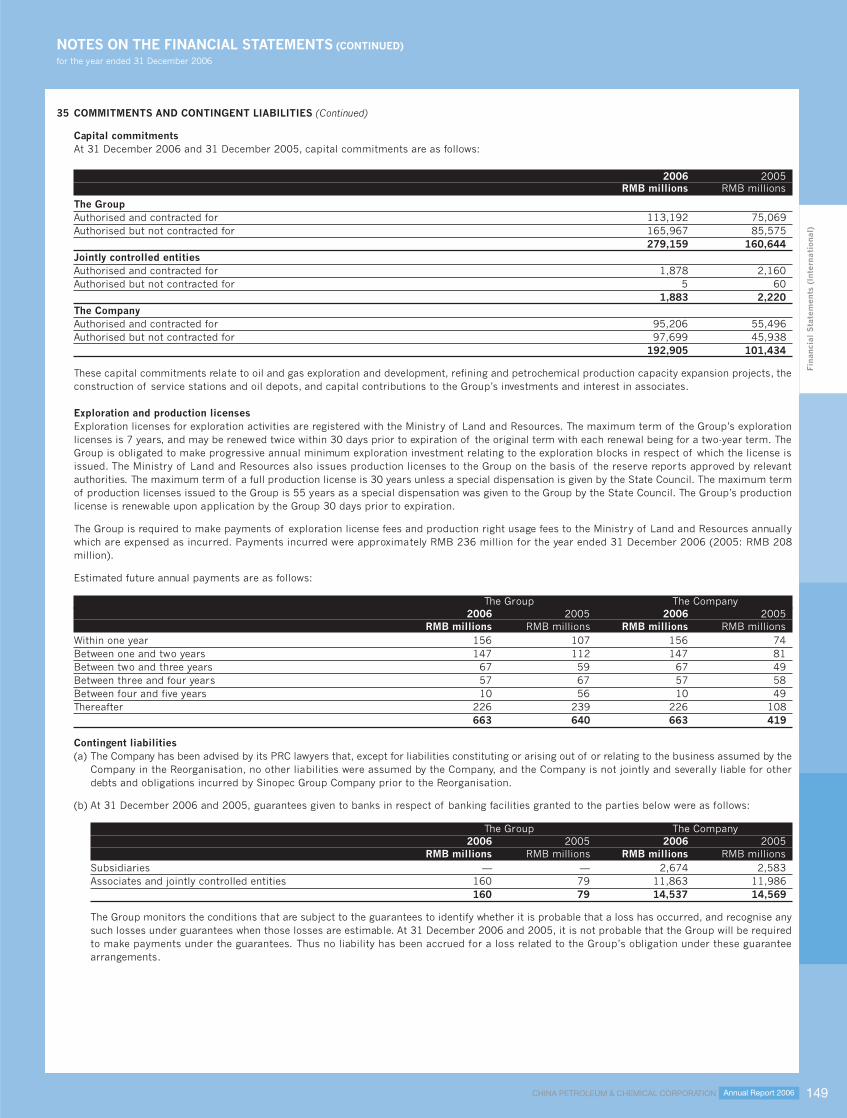
CHINA PETROLEUM & CHEMICAL CORPORATION Annual Report 2006 149
NOTES ON THE FINANCIAL STATEMENTS (CONTINUED)for the year ended 31 December 2006
Fina
ncia
l S
tate
men
ts (
Inte
rna
tion
al)
35 COMMITMENTS AND CONTINGENT LIABILITIES (Continued)
Capital commitmentsAt 31 December 2006 and 31 December 2005, capital commitments are as follows:
2006 2005RMB millions RMB millions
The GroupAuthorised and contracted for 113,192 75,069Authorised but not contracted for 165,967 85,575
279,159 160,644Jointly controlled entitiesAuthorised and contracted for 1,878 2,160Authorised but not contracted for 5 60
1,883 2,220The CompanyAuthorised and contracted for 95,206 55,496Authorised but not contracted for 97,699 45,938
192,905 101,434
These capital commitments relate to oil and gas exploration and development, refining and petrochemical production capacity expansion projects, theconstruction of service stations and oil depots, and capital contributions to the Group’s investments and interest in associates.
Exploration and production licensesExploration licenses for exploration activities are registered with the Ministry of Land and Resources. The maximum term of the Group’s explorationlicenses is 7 years, and may be renewed twice within 30 days prior to expiration of the original term with each renewal being for a two-year term. TheGroup is obligated to make progressive annual minimum exploration investment relating to the exploration blocks in respect of which the license isissued. The Ministry of Land and Resources also issues production licenses to the Group on the basis of the reserve reports approved by relevantauthorities. The maximum term of a full production license is 30 years unless a special dispensation is given by the State Council. The maximum termof production licenses issued to the Group is 55 years as a special dispensation was given to the Group by the State Council. The Group’s productionlicense is renewable upon application by the Group 30 days prior to expiration.
The Group is required to make payments of exploration license fees and production right usage fees to the Ministry of Land and Resources annuallywhich are expensed as incurred. Payments incurred were approximately RMB 236 million for the year ended 31 December 2006 (2005: RMB 208million).
Estimated future annual payments are as follows:
The Group The Company2006 2005 2006 2005
RMB millions RMB millions RMB millions RMB millionsWithin one year 156 107 156 74Between one and two years 147 112 147 81Between two and three years 67 59 67 49Between three and four years 57 67 57 58Between four and five years 10 56 10 49Thereafter 226 239 226 108
663 640 663 419
Contingent liabilities(a) The Company has been advised by its PRC lawyers that, except for liabilities constituting or arising out of or relating to the business assumed by the
Company in the Reorganisation, no other liabilities were assumed by the Company, and the Company is not jointly and severally liable for otherdebts and obligations incurred by Sinopec Group Company prior to the Reorganisation.
(b) At 31 December 2006 and 2005, guarantees given to banks in respect of banking facilities granted to the parties below were as follows:
The Group The Company2006 2005 2006 2005
RMB millions RMB millions RMB millions RMB millionsSubsidiaries — — 2,674 2,583Associates and jointly controlled entities 160 79 11,863 11,986
160 79 14,537 14,569
The Group monitors the conditions that are subject to the guarantees to identify whether it is probable that a loss has occurred, and recognise anysuch losses under guarantees when those losses are estimable. At 31 December 2006 and 2005, it is not probable that the Group will be requiredto make payments under the guarantees. Thus no liability has been accrued for a loss related to the Group’s obligation under these guaranteearrangements.

CHINA PETROLEUM & CHEMICAL CORPORATIONAnnual Report 2006150
NOTES ON THE FINANCIAL STATEMENTS (CONTINUED)for the year ended 31 December 2006
Fina
ncia
l S
tate
men
ts (
Inte
rna
tion
al)
35 COMMITMENTS AND CONTINGENT LIABILITIES (Continued)
Environmental contingenciesTo date, the Group has not incurred any significant expenditures for environmental remediation, is currently not involved in any environmental remediation,and has not accrued any amounts for environmental remediation relating to its operations. Under existing legislation, management believes that thereare no probable liabilities that will have a material adverse effect on the financial position or operating results of the Group. The PRC government,however, has moved, and may move further towards more rigorous enforcement of applicable laws, and towards the adoption of more stringentenvironmental standards. Environmental liabilities are subject to considerable uncertainties which affect the Group’s ability to estimate the ultimatecost of remediation efforts. These uncertainties include i) the exact nature and extent of the contamination at various sites including, but not limitedto refineries, oil fields, service stations, terminals and land development areas, whether operating, closed or sold, ii) the extent of required cleanupefforts, iii) varying costs of alternative remediation strategies, iv) changes in environmental remediation requirements, and v) the identification of newremediation sites. The amount of such future cost is indeterminable due to such factors as the unknown magnitude of possible contamination and theunknown timing and extent of the corrective actions that may be required. Accordingly, the outcome of environmental liabilities under proposed orfuture environmental legislation cannot reasonably be estimated at present, and could be material. The Group paid normal routine pollutant dischargefees of approximately RMB 1,637 million for the year ended 31 December 2006 (2005: RMB 493 million).
Legal contingenciesThe Group is a defendant in certain lawsuits as well as the named party in other proceedings arising in the ordinary course of business. While theoutcomes of such contingencies, lawsuits or other proceedings cannot be determined at present, management believes that any resulting liabilities willnot have a material adverse effect on the financial position or operating results of the Group.
36 RELATED PARTY TRANSACTIONSParties are considered to be related to the Group if the Group has the ability, directly or indirectly, to control or jointly control the party or exercisesignificant influence over the party in making financial and operating decisions, or vice versa, or where the Group and the party are subject to commoncontrol or common significant influence. Related parties may be individuals (being members of key management personnel, significant shareholdersand/or their close family members) or other entities and include entities which are under the significant influence of related parties of the Group wherethose parties are individuals, and post-employment benefit plans which are for the benefit of employees of the Group or of any entity that is a relatedparty of the Group.
(a) Transactions with Sinopec Group Company and fellow subsidiaries, associates and jointly controlled entitiesThe Group is part of a larger group of companies under Sinopec Group Company, which is owned by the PRC government, and has significanttransactions and relationships with Sinopec Group Company and fellow subsidiaries. Because of these relationships, it is possible that the termsof these transactions are not the same as those that would result from transactions among wholly unrelated parties.
The principal related party transactions with Sinopec Group Company and fellow subsidiaries, associates and jointly controlled entities, which werecarried out in the ordinary course of business, are as follows:
Note 2006 2005RMB millions RMB millions
Sales of goods (i) 129,221 95,043Purchases (ii) 56,703 45,923Transportation and storage (iii) 1,592 1,959Exploration and development services (iv) 22,060 17,001Production related services (v) 12,412 10,653Ancillary and social services (vi) 1,710 1,790Operating lease charges (vii) 3,826 3,213Agency commission income (viii) 60 48Intellectual property license fee paid (ix) — 9Interest received (x) 52 52Interest paid (xi) 1,201 1,036Net deposits withdrawn from related parties (xii) (3,910) (67)Net loans obtained from/(repaid to) related parties (xiii) 1,758 (4,714)
The amounts set out in the table above in respect of the year ended 31 December 2006 and 2005 represent the relevant costs to the Group asdetermined by the corresponding contracts with the related parties.
At 31 December 2006 and 2005, there were no guarantees given to banks by the Group in respect of banking facilities to Sinopec Group Companyand fellow subsidiaries. Guarantees given to banks by the Group in respect of banking facilities to associates and jointly controlled entities aredisclosed in Note 35.
The directors of the Company are of the opinion that the above transactions with related parties were conducted in the ordinary course of businessand on normal commercial terms or in accordance with the agreements governing such transactions, and this has been confirmed by the independentnon-executive directors.
Notes:
(i) Sales of goods represent the sale of crude oil, intermediate petrochemical products, petroleum products and ancillary materials.
(ii) Purchases represent the purchase of materials and utility supplies directly related to the Group’s operations such as the procurement of raw and ancillary materials
and related services, supply of water, electricity and gas.
(iii)Transportation and storage represent the cost for the use of railway, road and marine transportation services, pipelines, loading, unloading andstorage facilities.

CHINA PETROLEUM & CHEMICAL CORPORATION Annual Report 2006 151
NOTES ON THE FINANCIAL STATEMENTS (CONTINUED)for the year ended 31 December 2006
Fina
ncia
l S
tate
men
ts (
Inte
rna
tion
al)
36 RELATED PARTY TRANSACTIONS (Continued)
(a) Transactions with Sinopec Group Company and fellow subsidiaries, associates and jointly controlled entities (Continued)(iv) Exploration and development services comprise direct costs incurred in the exploration and development such as geophysical, drilling, well testing and well measurement
services.
(v) Production related services represent ancillary services rendered in relation to the Group’s operations such as equipment repair and general maintenance, insurance
premium, technical research, communications, fire fighting, security, product quality testing and analysis, information technology, design and engineering, construction
which includes the construction of oilfield ground facilities, refineries and chemical plants, manufacture of replacement parts and machinery, installation, project
management and environmental protection.
(vi) Ancillary and social services represent expenditures for social welfare and support services such as educational facilities, media communication services, sanitation,
accommodation, canteens, property maintenance and management services.
(vii) Operating lease charges represent the rental paid to Sinopec Group Company for operating leases in respect of land, buildings and equipment.
(viii)Agency commission income represents commission earned for acting as an agent in respect of sales of products and purchase of materials for certain entities
owned by Sinopec Group Company.
(ix) Intellectual property license fee represents reimbursement paid to Sinopec Group Company for fees required to maintain the validity of certain licenses for trademarks,
patents, technology and computer software.
(x) Interest received represents interest received from deposits placed with Sinopec Finance Company Limited, a finance company controlled by Sinopec Group Company.
The applicable interest rate is determined in accordance with the prevailing saving deposit rate. The balance of deposits at 31 December 2006 was RMB 689 million
(2005: RMB 4,599 million).
(xi) Interest paid represents interest charges on the loans and advances obtained from Sinopec Group Company and Sinopec Finance Company Limited.
(xii)Deposits withdrawn from related parties represent net deposits withdrawn from Sinopec Finance Company Limited.
(xiii)The Group obtained loans from/repaid loans to Sinopec Group Company and Sinopec Finance Company Limited.
In connection with the Reorganisation, the Company and Sinopec Group Company entered into a number of agreements under which 1) SinopecGroup Company will provide goods and products and a range of ancillary, social and supporting services to the Group and 2) the Group will sellcertain goods to Sinopec Group Company. The terms of these agreements are summarised as follows:
(a) The Company has entered into a non-exclusive Agreement for Mutual Provision of Products and Ancillary Services (“Mutual Provision Agreement”)with Sinopec Group Company effective from 1 January 2000 in which Sinopec Group Company has agreed to provide the Group with certainancillary production services, construction services, information advisory services, supply services and other services and products. While eachof Sinopec Group Company and the Company is permitted to terminate the Mutual Provision Agreement upon at least six months notice,Sinopec Group Company has agreed not to terminate the agreement if the Group is unable to obtain comparable services from a third party. Thepricing policy for these services and products provided by Sinopec Group Company to the Group is as follows:
� the government-prescribed price;
� where there is no government-prescribed price, the government-guidance price;
� where there is neither a government-prescribed price nor a government-guidance price, the market price; or
� where none of the above is applicable, the price to be agreed between the parties, which shall be based on a reasonable cost incurred inproviding such services plus a profit margin not exceeding 6%.
(b) The Company has entered into a non-exclusive Agreement for Provision of Cultural and Educational, Health Care and Community Services withSinopec Group Company effective from 1 January 2000 in which Sinopec Group Company has agreed to provide the Group with certain cultural,educational, health care and community services on the same pricing terms and termination conditions as agreed to in the above MutualProvision Agreement.
(c) The Company has entered into a series of lease agreements with Sinopec Group Company to lease certain land and buildings at a rental ofapproximately RMB 3,241 million and RMB 568 million, respectively, per annum. The Company and Sinopec Group Company can renegotiatethe rental amount every three years for land and every year for buildings, however such amount cannot exceed the market price as determinedby an independent third party. The Group has the option to terminate these leases upon six months notice to Sinopec Group Company.
(d) The Company has entered into agreements with Sinopec Group Company effective from 1 January 2000 under which the Group has beengranted the right to use certain trademarks, patents, technology and computer software developed by Sinopec Group Company. The Group willreimburse Sinopec Group Company for fees required to maintain the validity of these licenses.
(e) The Company has entered into a service stations franchise agreement with Sinopec Group Company effective from 1 January 2000 under whichits service stations and retail stores would exclusively sell the refined products supplied by the Group.
As discussed in Note 1, pursuant to the resolution passed at the Directors’ meeting on 10 October 2006, the Group acquired equity interests inSinopec Hainan for cash of RMB 2,990 million. Sinopec Hainan was previously wholly owned by Sinopec Group Company.
As discussed in Note 1, pursuant to the resolution passed at the Directors’ meeting on 6 December 2006, the Group acquired the equity interestsof Oil Production Plants from Sinopec Group Company, for a total consideration of RMB 3,500 million payable in 2007.

CHINA PETROLEUM & CHEMICAL CORPORATIONAnnual Report 2006152
NOTES ON THE FINANCIAL STATEMENTS (CONTINUED)for the year ended 31 December 2006
Fina
ncia
l S
tate
men
ts (
Inte
rna
tion
al)
36 RELATED PARTY TRANSACTIONS (Continued)
(a) Transactions with Sinopec Group Company and fellow subsidiaries, associates and jointly controlled entities (Continued)Amounts due from/to Sinopec Group Company and fellow subsidiaries, associates and jointly controlled entities included in the following accountscaptions are summarised as follows:
2006 2005RMB millions RMB millions
Trade accounts receivable 4,323 4,222Prepaid expenses and other current assets 2,352 3,504Total amounts due from Sinopec Group Company and fellow subsidiaries,
associates and jointly controlled entities 6,675 7,726Trade accounts payable 2,948 3,464Accrued expenses and other payables 12,670 8,133Short-term loans and current portion of long-term loans fromSinopec Group Company and fellow subsidiaries 5,401 2,805Long-term loans excluding current portion from Sinopec Group Company and fellow subsidiaries 39,095 39,933Total amounts due to Sinopec Group Company and fellow
subsidiaries, associates and jointly controlled entities 60,114 54,335
Amounts due from/to Sinopec Group Company and fellow subsidiaries, associates and jointly controlled entities, other than short-term loans andlong-term loans, bear no interest, are unsecured and are repayable in accordance with normal commercial terms. The terms and conditionsassociated with short-term loans and long-term loans payable to Sinopec Group Company and fellow subsidiaries are set out in Note 30.
As at and for the year ended 31 December 2006 and 2005, no impairment losses for bad and doubtful debts were recorded in respect of amountsdue from Sinopec Group Company and fellow subsidiaries, associates and jointly controlled entities.
(b) Key management personnel emolumentsKey management personnel are those persons having authority and responsibility for planning, directing and controlling the activities of the Group,directly or indirectly, including directors and supervisors of the Group. The key management personnel compensations are as follows:
2006 2005RMB’000 RMB’000
Short-term employee benefits 4,571 2,868Retirement scheme contributions 184 115
4,755 2,983
Total emoluments are included in “personnel expenses” as disclosed in Note 7.
(c) Contributions to defined contribution retirement plansThe Group participates in various defined contribution retirement plans organised by municipal and provincial governments for its staff. The detailsof the Group’s employee benefits plan are disclosed in Note 37. As at 31 December 2006 and 2005, there was no material outstanding contributionto post-employment benefit plans.
(d) Transactions with other state-controlled entities in the PRCThe Group is a state-controlled energy and chemical enterprise and operates in an economic regime currently dominated by entities directly orindirectly controlled by the PRC government through its government authorities, agencies, affiliations and other organisations (collectively referredas “state-controlled entities”).
Apart from transactions with Sinopec Group Company and fellow subsidiaries, the Group has transactions with other state-controlled entitiesinclude but not limited to the following:
� sales and purchase of goods and ancillary materials;
� rendering and receiving services;
� lease of assets;
� depositing and borrowing money; and
� use of public utilities.
These transactions are conducted in the ordinary course of the Group’s business on terms comparable to those with other entities that are notstate-controlled. The Group has established its procurement policies, pricing strategy and approval process for purchases and sales of productsand services which do not depend on whether the counterparties are state-controlled entities or not.
Having considered the transactions potentially affected by related party relationships, the entity’s pricing strategy, procurement policies andapproval processes, and the information that would be necessary for an understanding of the potential effect of the related party relationship onthe financial statements, the directors are of the opinion that the following related party transactions require disclosure of numeric details:

CHINA PETROLEUM & CHEMICAL CORPORATION Annual Report 2006 153
NOTES ON THE FINANCIAL STATEMENTS (CONTINUED)for the year ended 31 December 2006
Fina
ncia
l S
tate
men
ts (
Inte
rna
tion
al)
36 RELATED PARTY TRANSACTIONS (Continued)
(d) Transactions with other state-controlled entities in the PRC (Continued)
(i) Transactions with other state-controlled energy and chemical companiesThe Group’s major domestic suppliers of crude oil and refined petroleum products are China National Petroleum Corporation and its subsidiaries(“CNPC Group”) and China National Offshore Oil Corporation and its subsidiaries (“CNOOC Group”), which are state-controlled entities.
During the year ended 31 December 2006, the aggregate amount of crude oil purchased by refining segment from CNPC and CNOOC Group andrefined petroleum purchased by marketing and distribution segment from CNPC Group was RMB 60,863 million (2005: RMB 58,957 million).
The aggregate amounts due from/to CNPC Group and CNOOC Group are summarised as follows:
2006 2005RMB millions RMB millions
Trade accounts receivable 111 213Prepaid expenses and other current assets 115 120Total amounts due from CNPC Group and CNOOC Group 226 333Trade accounts payable 1,231 1,237Accrued expenses and other payables 7 127Total amounts due to CNPC Group and CNOOC Group 1,238 1,364
(ii) Transactions with state-controlled banksThe Group deposits its cash with several state-controlled banks in the PRC. The Group also obtains short-term and long-term loans from thesebanks in the ordinary course of business. The interest rates of the bank deposits and loans are regulated by the PBOC. The Group’s interestincome from and interest expense to these state-controlled banks in the PRC are as follows:
2006 2005RMB millions RMB millions
Interest income 458 323Interest expense 6,001 4,878
The amounts of cash deposited at and loans from state-controlled banks in the PRC are summarised as follows:
2006 2005RMB millions RMB millions
Cash and cash equivalents 7,366 9,418Time deposits with financial institutions 615 964Total deposits at state-controlled banks in the PRC 7,981 10,382Short-term loans and current portion of long-term loans 34,803 27,891Long-term loans excluding current portion of long-term loans 62,346 67,641Total loans from state-controlled banks in the PRC 97,149 95,532
37 EMPLOYEE BENEFITS PLANAs stipulated by the regulations of the PRC, the Group participates in various defined contribution retirement plans organised by municipal andprovincial governments for its staff. The Group is required to make contributions to the retirement plans at rates ranging from 17.0% to 30.0% of thesalaries, bonuses and certain allowances of its staff. A member of the plan is entitled to a pension equal to a fixed proportion of the salary prevailingat his or her retirement date. The Group has no other material obligation for the payment of pension benefits associated with these plans beyond theannual contributions described above. The Group’s contributions for the year ended 31 December 2006 were RMB 2,270 million (2005: RMB 2,273million).
CHINA PETROLEUM & CHEMICAL CORPORATIONAnnual Report 2006154
NOTES ON THE FINANCIAL STATEMENTS (CONTINUED)for the year ended 31 December 2006
Fina
ncia
l S
tate
men
ts (
Inte
rna
tion
al)
38 SEGMENTAL REPORTINGThe Group has five operating segments as follows:
(i) Exploration and production, which explores and develops oil fields, produces crude oil and natural gas and sells such products to the refiningsegment of the Group and external customers.
(ii) Refining, which processes and purifies crude oil, that is sourced from the exploration and production segment of the Group and external suppliers,and manufactures and sells petroleum products to the chemicals and marketing and distribution segments of the Group and external customers.
(iii)Marketing and distribution, which owns and operates oil depots and service stations in the PRC, and distributes and sells refined petroleumproducts (mainly gasoline and diesel) in the PRC through wholesale and retail sales networks.
(iv)Chemicals, which manufactures and sells petrochemical products, derivative petrochemical products and other chemical products mainly toexternal customers.
(v) Corporate and others, which largely comprise the trading activities of the import and export companies of the Group and research and developmentundertaken by other subsidiaries.
The segments were determined primarily because the Group manages its exploration and production, refining, marketing and distribution, chemicals,and corporate and others businesses separately. The reportable segments are each managed separately because they manufacture and/or distributedistinct products with different production processes and due to their distinct operating and gross margin characteristics. In view of the fact that theCompany and its subsidiaries operate mainly in the PRC, no geographical segment information is presented.
The Group evaluates the performance and allocates resources to its operating segments on an operating income basis, without considering the effectsof finance costs or investment income. The accounting policies of the Group’s segments are the same as those described in the principal accountingpolicies (see Note 2). Corporate administrative costs and assets are not allocated to the operating segments; instead, operating segments are billed fordirect corporate services. Inter-segment transfer pricing is based on cost plus an appropriate margin, as specified by the Group’s policy.

CHINA PETROLEUM & CHEMICAL CORPORATION Annual Report 2006 155
NOTES ON THE FINANCIAL STATEMENTS (CONTINUED)for the year ended 31 December 2006
Fina
ncia
l S
tate
men
ts (
Inte
rna
tion
al)
38 SEGMENTAL REPORTING (Continued)Reportable information on the Group’s business segments is as follows:
2006 2005RMB millions RMB millions
TurnoverExploration and production
External sales 23,355 20,006Inter-segment sales 105,656 84,423
129,011 104,429---- - - - - - - - - - - - - - - - - - - - - - - - - - - - - - - - - - - - - - - - - - - - - - - - - - - - - - - - - - - - - - - - - - - - - - - - - - - - - - - - - - - - - - - - - - - - - - - - - - - - - - - - - - - - - - - - - - - - - - - - - - - - - - - - - - - - - - - - - - - - - - - - - - - - - - - - - - - - - - - - - - - - - - - - - - - - - - - - - - - - - - - - - - - - - - - - - - - - - - - - - - - - - - - - - - - - - - - - - - - - - - - - - - - - - - - - - - - - - - - - - - - - - - - - - - - - - - - - - - - - - - - - - - - - -
RefiningExternal sales 99,201 82,810Inter-segment sales 471,571 386,456
570,772 469,266---- - - - - - - - - - - - - - - - - - - - - - - - - - - - - - - - - - - - - - - - - - - - - - - - - - - - - - - - - - - - - - - - - - - - - - - - - - - - - - - - - - - - - - - - - - - - - - - - - - - - - - - - - - - - - - - - - - - - - - - - - - - - - - - - - - - - - - - - - - - - - - - - - - - - - - - - - - - - - - - - - - - - - - - - - - - - - - - - - - - - - - - - - - - - - - - - - - - - - - - - - - - - - - - - - - - - - - - - - - - - - - - - - - - - - - - - - - - - - - - - - - - - - - - - - - - - - - - - - - - - - - - - - - - - -
Marketing and distributionExternal sales 588,270 459,292Inter-segment sales 4,601 3,172
592,871 462,464---- - - - - - - - - - - - - - - - - - - - - - - - - - - - - - - - - - - - - - - - - - - - - - - - - - - - - - - - - - - - - - - - - - - - - - - - - - - - - - - - - - - - - - - - - - - - - - - - - - - - - - - - - - - - - - - - - - - - - - - - - - - - - - - - - - - - - - - - - - - - - - - - - - - - - - - - - - - - - - - - - - - - - - - - - - - - - - - - - - - - - - - - - - - - - - - - - - - - - - - - - - - - - - - - - - - - - - - - - - - - - - - - - - - - - - - - - - - - - - - - - - - - - - - - - - - - - - - - - - - - - - - - - - - - -
ChemicalsExternal sales 209,133 160,783Inter-segment sale 12,299 12,199
221,432 172,982---- - - - - - - - - - - - - - - - - - - - - - - - - - - - - - - - - - - - - - - - - - - - - - - - - - - - - - - - - - - - - - - - - - - - - - - - - - - - - - - - - - - - - - - - - - - - - - - - - - - - - - - - - - - - - - - - - - - - - - - - - - - - - - - - - - - - - - - - - - - - - - - - - - - - - - - - - - - - - - - - - - - - - - - - - - - - - - - - - - - - - - - - - - - - - - - - - - - - - - - - - - - - - - - - - - - - - - - - - - - - - - - - - - - - - - - - - - - - - - - - - - - - - - - - - - - - - - - - - - - - - - - - - - - - -
Corporate and othersExternal sales 124,693 76,368Inter-segment sales 136,775 44,897
261,468 121,265---- - - - - - - - - - - - - - - - - - - - - - - - - - - - - - - - - - - - - - - - - - - - - - - - - - - - - - - - - - - - - - - - - - - - - - - - - - - - - - - - - - - - - - - - - - - - - - - - - - - - - - - - - - - - - - - - - - - - - - - - - - - - - - - - - - - - - - - - - - - - - - - - - - - - - - - - - - - - - - - - - - - - - - - - - - - - - - - - - - - - - - - - - - - - - - - - - - - - - - - - - - - - - - - - - - - - - - - - - - - - - - - - - - - - - - - - - - - - - - - - - - - - - - - - - - - - - - - - - - - - - - - - - - - - -
Elimination of inter-segment sales (730,902) (531,147)- - - - - - - - - - - - - - - - - - - - - - - - - - - - - - - - - - - - - - - - - - - - - - - - - - - - - - - - - - - - - - - - - - - - - - - - - - - - - - - - - - - - - - - - - - - - - - - - - - - - - - - - - - - - - - - - - - - - - - - - - - - - - - - - - - - - - - - - - - - - - - - - - - - - - - - - - - - - - - - - - - - - - - - - - - - - - - - - - - - - - - - - - - - - - - - - - - - - - - - - - - - - - - - - - - - - - - - - - - - - - - - - - - - - - - - - - - - - - - - - - - - - - - - - - - - - - - - - - - - - - - - - - - - - - - - -
Turnover 1,044,652 799,259--- - - - - - - - - - - - - - - - - - - - - - - - - - - - - - - - - - - - - - - - - - - - - - - - - - - - - - - - - - - - - - - - - - - - - - - - - - - - - - - - - - - - - - - - - - - - - - - - - - - - - - - - - - - - - - - - - - - - - - - - - - - - - - - - - - - - - - - - - - - - - - - - - - - - - - - - - - - - - - - - - - - - - - - - - - - - - - - - - - - - - - - - - - - - - - - - - - - - - - - - - - - - - - - - - - - - - - - - - - - - - - - - - - - - - - - - - - - - - - - - - - - - - - - - - - - - - - - - - - - - - - - - - - - - - -
Other operating revenuesExploration and production 14,155 10,756Refining 4,590 5,421Marketing and distribution 687 1,358Chemicals 6,661 5,841Corporate and others 657 637Other operating revenues 26,750 24,013--- - - - - - - - - - - - - - - - - - - - - - - - - - - - - - - - - - - - - - - - - - - - - - - - - - - - - - - - - - - - - - - - - - - - - - - - - - - - - - - - - - - - - - - - - - - - - - - - - - - - - - - - - - - - - - - - - - - - - - - - - - - - - - - - - - - - - - - - - - - - - - - - - - - - - - - - - - - - - - - - - - - - - - - - - - - - - - - - - - - - - - - - - - - - - - - - - - - - - - - - - - - - - - - - - - - - - - - - - - - - - - - - - - - - - - - - - - - - - - - - - - - - - - - - - - - - - - - - - - - - - - - - - - - - - -
Other incomeRefining 5,000 9,415Total other income 5,000 9,415--- - - - - - - - - - - - - - - - - - - - - - - - - - - - - - - - - - - - - - - - - - - - - - - - - - - - - - - - - - - - - - - - - - - - - - - - - - - - - - - - - - - - - - - - - - - - - - - - - - - - - - - - - - - - - - - - - - - - - - - - - - - - - - - - - - - - - - - - - - - - - - - - - - - - - - - - - - - - - - - - - - - - - - - - - - - - - - - - - - - - - - - - - - - - - - - - - - - - - - - - - - - - - - - - - - - - - - - - - - - - - - - - - - - - - - - - - - - - - - - - - - - - - - - - - - - - - - - - - - - - - - - - - - - - - -
Turnover, other operating revenues and other income 1,076,402 832,687
2006 2005RMB millions RMB millions
ResultOperating profitBy segment
– Exploration and production 63,182 48,334– Refining (25,298) (3,536)– Marketing and distribution 30,234 10,350– Chemicals 17,234 14,296– Corporate and others (1,532) (1,198)
Total operating profit 83,820 68,246--- - - - - - - - - - - - - - - - - - - - - - - - - - - - - - - - - - - - - - - - - - - - - - - - - - - - - - - - - - - - - - - - - - - - - - - - - - - - - - - - - - - - - - - - - - - - - - - - - - - - - - - - - - - - - - - - - - - - - - - - - - - - - - - - - - - - - - - - - - - - - - - - - - - - - - - - - - - - - - - - - - - - - - - - - - - - - - - - - - - - - - - - - - - - - - - - - - - - - - - - - - - - - - - - - - - - - - - - - - - - - - - - - - - - - - - - - - - - - - - - - - - - - - - - - - - - - - - - - - - - - - - - - - - - - -
Share of profits less losses from associates– Exploration and production 233 326– Refining 58 23– Marketing and distribution 404 241– Chemicals 20 1– Corporate and others 232 266
Aggregate share of profits less losses from associates 947 857--- - - - - - - - - - - - - - - - - - - - - - - - - - - - - - - - - - - - - - - - - - - - - - - - - - - - - - - - - - - - - - - - - - - - - - - - - - - - - - - - - - - - - - - - - - - - - - - - - - - - - - - - - - - - - - - - - - - - - - - - - - - - - - - - - - - - - - - - - - - - - - - - - - - - - - - - - - - - - - - - - - - - - - - - - - - - - - - - - - - - - - - - - - - - - - - - - - - - - - - - - - - - - - - - - - - - - - - - - - - - - - - - - - - - - - - - - - - - - - - - - - - - - - - - - - - - - - - - - - - - - - - - - - - - - -
Finance costsInterest expense (7,437) (5,926)Interest income 555 384Foreign exchange losses (153) (79)Foreign exchange gains 935 996
Net finance costs (6,100) (4,625)-- - - - - - - - - - - - - - - - - - - - - - - - - - - - - - - - - - - - - - - - - - - - - - - - - - - - - - - - - - - - - - - - - - - - - - - - - - - - - - - - - - - - - - - - - - - - - - - - - - - - - - - - - - - - - - - - - - - - - - - - - - - - - - - - - - - - - - - - - - - - - - - - - - - - - - - - - - - - - - - - - - - - - - - - - - - - - - - - - - - - - - - - - - - - - - - - - - - - - - - - - - - - - - - - - - - - - - - - - - - - - - - - - - - - - - - - - - - - - - - - - - - - - - - - - - - - - - - - - - - - - - - - - - - - - - -
Investment income 256 178- - - - - - - - - - - - - - - - - - - - - - - - - - - - - - - - - - - - - - - - - - - - - - - - - - - - - - - - - - - - - - - - - - - - - - - - - - - - - - - - - - - - - - - - - - - - - - - - - - - - - - - - - - - - - - - - - - - - - - - - - - - - - - - - - - - - - - - - - - - - - - - - - - - - - - - - - - - - - - - - - - - - - - - - - - - - - - - - - - - - - - - - - - - - - - - - - - - - - - - - - - - - - - - - - - - - - - - - - - - - - - - - - - - - - - - - - - - - - - - - - - - - - - - - - - - - - - - - - - - - - - - - - - - - - - - -
Profit before taxation 78,923 64,656Taxation (23,515) (19,880)Profit for the year 55,408 44,776

CHINA PETROLEUM & CHEMICAL CORPORATIONAnnual Report 2006156
NOTES ON THE FINANCIAL STATEMENTS (CONTINUED)for the year ended 31 December 2006
Fina
ncia
l S
tate
men
ts (
Inte
rna
tion
al)
38 SEGMENTAL REPORTING (Continued)Assets and liabilities dedicated to a particular segment’s operations are included in that segment’s total assets and liabilities. Assets which benefitmore than one segment or are considered to be corporate assets are not allocated. “Unallocated assets” consists primarily of cash and cash equivalents,time deposits with financial institutions, investments and deferred tax assets. “Unallocated liabilities” consists primarily of short-term and long-termdebts, loans from Sinopec Group Company and fellow subsidiaries, income tax payable, deferred tax liabilities and other liabilities.
Interests in and share of profits from associates are included in the segments in which the associates operate. Information on associates is includedin Note 23. Additions to long-lived assets by operating segment are included in Notes 18 and 19.
2006 2005RMB millions RMB millions
AssetsSegment assets
— Exploration and production 155,043 127,471— Refining 163,898 142,776— Marketing and distribution 108,053 102,935— Chemicals 125,051 115,942— Corporate and others 22,641 20,570
Total segment assets 574,686 509,694--- - - - - - - - - - - - - - - - - - - - - - - - - - - - - - - - - - - - - - - - - - - - - - - - - - - - - - - - - - - - - - - - - - - - - - - - - - - - - - - - - - - - - - - - - - - - - - - - - - - - - - - - - - - - - - - - - - - - - - - - - - - - - - - - - - - - - - - - - - - - - - - - - - - - - - - - - - - - - - - - - - - - - - - - - - - - - - - - - - - - - - - - - - - - - - - - - - - - - - - - - - - - - - - - - - - - - - - - - - - - - - - - - - - - - - - - - - - - - - - - - - - - - - - - - - - - - - - - - - - - - - - - - - - - - -
Interest in associates— Exploration and production 1,063 1,494— Refining 1,117 571— Marketing and distribution 4,692 4,298— Chemicals 1,245 1,092— Corporate and others 3,500 1,812
Aggregate interest in associates 11,617 9,267--- - - - - - - - - - - - - - - - - - - - - - - - - - - - - - - - - - - - - - - - - - - - - - - - - - - - - - - - - - - - - - - - - - - - - - - - - - - - - - - - - - - - - - - - - - - - - - - - - - - - - - - - - - - - - - - - - - - - - - - - - - - - - - - - - - - - - - - - - - - - - - - - - - - - - - - - - - - - - - - - - - - - - - - - - - - - - - - - - - - - - - - - - - - - - - - - - - - - - - - - - - - - - - - - - - - - - - - - - - - - - - - - - - - - - - - - - - - - - - - - - - - - - - - - - - - - - - - - - - - - - - - - - - - - - -
Unallocated assets 25,487 30,079--- - - - - - - - - - - - - - - - - - - - - - - - - - - - - - - - - - - - - - - - - - - - - - - - - - - - - - - - - - - - - - - - - - - - - - - - - - - - - - - - - - - - - - - - - - - - - - - - - - - - - - - - - - - - - - - - - - - - - - - - - - - - - - - - - - - - - - - - - - - - - - - - - - - - - - - - - - - - - - - - - - - - - - - - - - - - - - - - - - - - - - - - - - - - - - - - - - - - - - - - - - - - - - - - - - - - - - - - - - - - - - - - - - - - - - - - - - - - - - - - - - - - - - - - - - - - - - - - - - - - - - - - - - - - - -
Total assets 611,790 549,040LiabilitiesSegment liabilities
— Exploration and production 30,082 20,262— Refining 30,162 27,311— Marketing and distribution 27,090 23,713— Chemicals 19,619 19,442— Corporate and others 35,913 35,855
Total segment liabilities 142,866 126,583Unallocated liabilities 184,135 167,477Total liabilities 327,001 294,060
Segment capital expenditure is the total cost incurred during the year to acquire segment assets that are expected to be used for more than one year.
2006 2005RMB millions RMB millions
Capital expenditureExploration and production 31,734 23,095Refining 21,969 19,100Marketing and distribution 11,319 10,954Chemicals 12,629 9,386Corporate and others 2,170 1,164
79,821 63,699Capital expenditure of Oil Production PlantsExploration and production 3,362 1,612Capital expenditure of jointly controlled entitiesExploration and production 102 772Chemicals 160 1,830
262 2,602Depreciation, depletion and amortisationExploration and production 12,945 11,118Refining 7,733 7,055Marketing and distribution 3,452 3,026Chemicals 9,697 9,697Corporate and others 408 722
34,235 31,618Impairment losses on long-lived assetsExploration and production 552 60Marketing and distribution 23 366Chemicals 250 1,425
825 1,851

CHINA PETROLEUM & CHEMICAL CORPORATION Annual Report 2006 157
NOTES ON THE FINANCIAL STATEMENTS (CONTINUED)for the year ended 31 December 2006
Fina
ncia
l S
tate
men
ts (
Inte
rna
tion
al)
39 PRINCIPAL SUBSIDIARIESAt 31 December 2006, the following list contains the particulars of subsidiaries which principally affected the results or assets of the Group.
Percentage of equityParticulars of Type of held by the
issued legal held by the Company’sName of company capital entity Company subsidiary Principal activities
(millions) % %China Petrochemical International RMB 1,663 Limited 100.00 — Trading of petrochemical products
Company Limited companySinopec Sales Company Limited RMB 1,700 Limited 100.00 — Marketing and distribution of
company refined petroleum productsSinopec Zhenhai Refining and Chemical RMB 2,524 Limited 100.00 — Manufacturing of intermediate
Company Limited (Note 20) company petrochemical products andpetroleum products
Sinopec Qilu Petrochemical Company Limited RMB 1,950 Limited 99.76 — Manufacturing of intermediate(Note 20) company petrochemical products and
petroleum productsSinopec Yangzi Petrochemical Company Limited RMB 2,330 Limited 99.81 — Manufacturing of intermediate
(Note 20) company petrochemical products andpetroleum products
Sinopec Zhongyuan Petroleum Company Limited RMB 875 Limited 99.35 — Exploration and production of(Note 20) company crude oil and natural gas
Sinopec Shengli Oil Field Dynamic Company RMB 364 Limited 97.71 — Exploration and production ofLimited (Note 20) company crude oil and distribution of
petrochemical productsSinopec Fujian Petrochemical Company RMB 2,253 Limited 50.00 — Manufacturing of plastics,
Limited (i) company intermediate petrochemicalproducts and petroleum products
Sinopec Shanghai Petrochemical Company RMB 7,200 Limited 55.56 — Manufacturing of synthetic fibres,Limited company resin and plastics, intermediate
petrochemical products andpetroleum products
Sinopec Shijiazhuang Refining Chemical RMB 1,154 Limited 79.73 — Manufacturing of intermediateCompany Limited company petrochemical products and
petroleum productsSinopec Kantons Holdings Limited HK$ 104 Limited — 72.40 Trading of crude oil and
company petroleum productsSinopec Wuhan Petroleum Group Company RMB 147 Limited 46.25 — Marketing and distribution of
Limited (i) company refined petroleum productsSinopec Yizheng Chemical Fibre Company RMB 4,000 Limited 42.00 — Production and sale of polyester
Limited (i) company chips and polyester fibresSinopec Zhongyuan Petrochemical Company RMB 2,400 Limited 93.51 — Manufacturing of chemical products
Limited companySinopec Shell (Jiangsu) Petroleum Marketing RMB 830 Limited 60.00 — Marketing and distribution of
Company Limited company refined petroleum productsBP Sinopec (Zhejiang) Petroleum Company RMB 800 Limited 60.00 — Marketing and distribution of
Limited company refined petroleum productsSinopec Qingdao Refining and Chemical RMB 800 Limited 85.00 — Manufacturing of intermediate
Company Limited company petrochemical products andpetroleum products
China International United Petroleum and RMB 223 Limited 100.00 — Trading of crude oil andChemical Company Limited company petrochemical products
Sinopec Hainan Refining and Chemical RMB 3,986 Limited 75.00 — Manufacturing of intermediateCompany Limited company petrochemical products and
petroleum products
Except for Sinopec Kantons Holdings Limited, which is incorporated in Bermuda, all of the above principal subsidiaries are incorporated in the PRC.
(i) The Group consolidated the results of the entity because the Group controlled the board of this entity and had the power to govern its financial andoperating policies.
(ii) During the year ended 31 December 2006, the Company disposed the 211,423,651 A shares, representing approximately 40.72% of the issuedshare capital, in Sinopec Wuhan Phoenix Company Limited pursuant to an agreement entered into with a third party. No significant disposal gainor loss was recorded from this transaction.

CHINA PETROLEUM & CHEMICAL CORPORATIONAnnual Report 2006158
NOTES ON THE FINANCIAL STATEMENTS (CONTINUED)for the year ended 31 December 2006
Fina
ncia
l S
tate
men
ts (
Inte
rna
tion
al)
40 FINANCIAL INSTRUMENTSFinancial assets of the Group include cash and cash equivalents, time deposits with financial institutions, investments, trade accounts receivable, billsreceivable, amounts due from Sinopec Group Company and fellow subsidiaries, advances to third parties, amounts due from associates, and otherreceivables. Financial liabilities of the Group include bank and other loans, loans from Sinopec Group Company and fellow subsidiaries, trade accountspayable, bills payable, amounts due to Sinopec Group Company and fellow subsidiaries, receipts in advance, and advances from third parties. TheGroup has no derivative instruments that are designated and qualified as hedging instruments at 31 December 2006 and 2005.
Credit riskThe carrying amounts of cash and cash equivalents, time deposits with financial institutions, trade accounts and bills receivables, and other currentassets, except for prepayments and deposits, represent the Group’s maximum exposure to credit risk in relation to financial assets.
The majority of the Group’s trade accounts receivable relate to sales of petroleum and chemical products to related parties and third parties operatingin the petroleum and chemical industries. The Group performs ongoing credit evaluations of its customers’ financial condition and generally does notrequire collateral on trade accounts receivable. The Group maintains an impairment loss for doubtful accounts and actual losses have been withinmanagement’s expectations. No single customer accounted for greater than 10% of total revenues.
No other financial assets carry a significant exposure to credit risk.
Currency riskSubstantially all of the revenue-generating operations of the Group are transacted in Renminbi, which is not fully convertible into foreign currencies. On1 January 1994, the PRC government abolished the dual rate system and introduced a single rate of exchange as quoted by the PBOC. However, theunification of the exchange rate does not imply convertibility of Renminbi into United States dollars or other foreign currencies. All foreign exchangetransactions continue to take place either through the PBOC or other banks authorised to buy and sell foreign currencies at the exchange rates quotedby the PBOC. Approval of foreign currency payments by the PBOC or other institutions requires submitting a payment application form together withsuppliers’ invoices, shipping documents and signed contracts.
With the authorisation from the PRC government, the PBOC announced that the PRC government reformed the exchange rate regime by moving into amanaged floating exchange rate regime based on market supply and demand with reference to a basket of currencies on 21 July 2005.
Other than the amounts as disclosed in Note 30, the amounts of other financial assets and liabilities of the Group are substantially denominated in thefunctional currency of respective entity of the Group.
Interest rate riskThe interest rates and terms of repayment of short-term and long-term debts of the Group are disclosed in Note 30.
Fair valuesThe disclosures of the fair value estimates, methods and assumptions, set forth below for the Group’s financial instruments, are made to comply withthe requirements of IAS 32 and IAS 39 and should be read in conjunction with the Group’s consolidated financial statements and related notes. Theestimated fair value amounts have been determined by the Group using market information and valuation methodologies considered appropriate.However, considerable judgement is required to interpret market data to develop the estimates of fair value. Accordingly, the estimates presentedherein are not necessarily indicative of the amounts the Group could realise in a current market exchange. The use of different market assumptionsand/or estimation methodologies may have a material effect on the estimated fair value amounts.
The following table presents the carrying amount and fair value of the Group’s long-term indebtedness other than loans from Sinopec Group Companyand fellow subsidiaries at 31 December 2006 and 31 December 2005:
2006 2005RMB millions RMB millions
Carrying amount 85,778 87,457Fair value 85,376 87,461
The fair value of long-term indebtedness is estimated by discounting future cash flows thereon using current market interest rates offered to the Groupfor debts with substantially the same characteristics and maturities.
Unquoted equity securities are individually and in the aggregate not material to the Group’s financial condition or results of operations. There are nolisted market prices for such interests in the PRC and, accordingly, a reasonable estimate of fair value could not be made without incurring excessivecosts.
The fair values of all other financial instruments approximate their carrying amounts due to the nature or short-term maturity of these instruments.
CHINA PETROLEUM & CHEMICAL CORPORATION Annual Report 2006 159
NOTES ON THE FINANCIAL STATEMENTS (CONTINUED)for the year ended 31 December 2006
Fina
ncia
l S
tate
men
ts (
Inte
rna
tion
al)
41 ACCOUNTING ESTIMATES AND JUDGEMENTSThe Group’s financial condition and results of operations are sensitive to accounting methods, assumptions and estimates that underlie the preparationof the financial statements. The Group bases the assumptions and estimates on historical experience and on various other assumptions that the Groupbelieves to be reasonable and which form the basis for making judgements about matters that are not readily apparent from other sources. On an on-going basis, management evaluates its estimates. Actual results may differ from those estimates as facts, circumstances and conditions change.
The selection of critical accounting policies, the judgements and other uncertainties affecting application of those policies and the sensitivity ofreported results to changes in conditions and assumptions are factors to be considered when reviewing the financial statements. The principalaccounting policies are set forth in Note 2. The Group believes the following critical accounting policies involve the most significant judgements andestimates used in the preparation of the financial statements.
Oil and gas properties and reservesThe accounting for the exploration and production’s oil and gas activities is subject to accounting rules that are unique to the oil and gas business.There are two methods to account for oil and gas business activities, the successful efforts method and the full cost method. The Group has elected touse the successful efforts method. The successful efforts method reflects the volatility that is inherent in exploring for mineral resources in that costsof unsuccessful exploratory efforts are charged to expense as they are incurred. These costs primarily include dry hole costs, seismic costs and otherexploratory costs. Under the full cost method, these costs are capitalised and written-off or depreciated over time.
Engineering estimates of the Group’s oil and gas reserves are inherently imprecise and represent only approximate amounts because of the subjectivejudgements involved in developing such information. There are authoritative guidelines regarding the engineering criteria that have to be met beforeestimated oil and gas reserves can be designated as “proved”. Proved and proved developed reserves estimates are updated at least annually and takeinto account recent production and technical information about each field. In addition, as prices and cost levels change from year to year, the estimateof proved and proved developed reserves also changes. This change is considered a change in estimate for accounting purposes and is reflected on aprospective basis in related depreciation rates.
Despite the inherent imprecision in these engineering estimates, these estimates are used in determining depreciation expense and impairmentexpense. Depreciation rates are determined based on estimated proved developed reserve quantities (the denominator) and capitalised costs ofproducing properties (the numerator). Producing properties’ capitalised costs are amortised based on the units of oil or gas produced.
Impairment for long lived assetsIf circumstances indicate that the net book value of a long-lived asset may not be recoverable, the asset may be considered “impaired”, and animpairment loss may be recognised in accordance with IAS 36 “Impairment of Assets”. The carrying amounts of long-lived assets are reviewedperiodically in order to assess whether the recoverable amounts have declined below the carrying amounts. These assets are tested for impairmentwhenever events or changes in circumstances indicate that their recorded carrying amounts may not be recoverable. When such a decline has occurred,the carrying amount is reduced to recoverable amount. For goodwill, the recoverable amount is estimated annually. The recoverable amount is thegreater of the net selling price and the value in use. It is difficult to precisely estimate selling price because quoted market prices for the Group’s assetsor cash-generating units are not readily available. In determining the value in use, expected cash flows generated by the asset or the cash-generatingunit are discounted to their present value, which requires significant judgement relating to level of sale volume, selling price and amount of operatingcosts. The Group uses all readily available information in determining an amount that is a reasonable approximation of recoverable amount, includingestimates based on reasonable and supportable assumptions and projections of sale volume, selling price and amount of operating costs.
DepreciationProperty, plant and equipment, other than oil and gas properties, are depreciated on a straight-line basis over the estimated useful lives of the assets,after taking into account the estimated residual value. The Group reviews the estimated useful lives of the assets regularly in order to determine theamount of depreciation expense to be recorded during any reporting period. The useful lives are based on the Group’s historical experience with similarassets and taking into account anticipated technological changes. The depreciation expense for future periods is adjusted if there are significantchanges from previous estimates.
Impairment for bad and doubtful debtsThe Group estimates impairment losses for bad and doubtful debts resulting from the inability of the customers to make the required payments. TheGroup bases the estimates on the aging of the accounts receivable balance, customer credit-worthiness, and historical write-off experience. If thefinancial condition of the customers were to deteriorate, actual write-offs would be higher than estimated.
42 POSSIBLE IMPACT OF AMENDMENTS, NEW STANDARDS AND INTERPRETATIONS ISSUED BUT NOT YET EFFECTIVE FOR THE ANNUAL ACCOUNTINGPERIOD ENDING 31 DECEMBER 2006Up to the date of issue of these financial statements, the IASB has issued the following amendments, new standards and interpretations which are notyet effective for the annual accounting period ending 31 December 2006 and which have not been adopted in these financial statements:
Effective for accountingperiod beginning on or after
IFRS 7, Financial instruments: disclosures 1 January 2007IFRS 8, Operating Segments 1 January 2009IFRIC 7, Applying the restatement approach under IAS 29, Financial reporting in hyperinflationary economies 1 March 2006IFRIC 8, Scope of IFRS 2 1 May 2006IFRIC 9, Reassessment of Embedded Derivatives 1 June 2006IFRIC 10, Interim financial reporting and impairment 1 November 2006IFRIC 11, IFRS2- Group and treasury share transaction 1 March 2007IFRIC 12, Service concession arrangements 1 January 2008Amendment to IAS 1, Presentation of financial statements: capital disclosures 1 January 2007
The Group is in the process of making an assessment of what the impact of these amendments, new standards and new interpretations is expected tobe in the period of initial application. Up to the date of issuance of these financial statements, the Group believes that the adoption of IFRIC 7, IFRIC8, IFRIC 9, IFRIC 10, IFRIC 11, IFRIC 12 and the amendment to IAS 1 are not applicable to any of the Group’s operations and that the adoption of theremainder of the above new standards and new interpretations is unlikely to have a significant impact on the Group’s results of operations and financialposition.
CHINA PETROLEUM & CHEMICAL CORPORATIONAnnual Report 2006160
NOTES ON THE FINANCIAL STATEMENTS (CONTINUED)for the year ended 31 December 2006
Fina
ncia
l S
tate
men
ts (
Inte
rna
tion
al)
43 POST BALANCE SHEET EVENTOn 6 December 2006, the Group announced its proposal to issue USD 1,500 million convertible bonds, which are convertible into H shares of theCompany. This proposal was subsequently approved by the shareholders of the Company at the Extraordinary General Meeting held on 22 January2007.
On 16 March 2007, the Fifth Plenary Session of the Tenth National People’s Congress passed the Corporate Income Tax Law of the People’s Republicof China (“new tax law”), which will take effect on 1 January 2008. According to the new tax law, the corporate income tax rate for entities other thancertain high-tech enterprises and small-scale enterprises, as defined in the new tax law will be revised to 25%. In addition, entities that are currentlytaxed at preferential rates will be subject to a five-year transition period during which the tax rates will gradually be increased to the unified rate of 25%from 1 January 2008. As a result of the new tax law, it is expected that the income tax rate applicable to the Company and certain of its entities willbe reduced from 33% to 25% from 1 January 2008. However, since the detailed implementation rules as to how the existing preferential rates willgradually be increased to the unified rate of 25% over the five-year transition period have not been formulated and promulgated, management is notyet in a position to estimate the impact of the new tax law on the deferred tax assets and liabilities of certain entities which are being taxed atpreferential rates. The financial effect of the new tax law, if any, will be reflected in the Group’s 2007 financial statements. The enactment of the newtax law is not expected to have any financial effect on the amounts accrued in the balance sheet in respect of current tax payable.
44 PARENT AND ULTIMATE HOLDING COMPANYThe directors consider the parent and ultimate holding company of the Group as at 31 December 2006 is Sinopec Group Company, a state-ownedenterprise established in the PRC. This entity does not produce financial statements available for public use.

CHINA PETROLEUM & CHEMICAL CORPORATION Annual Report 2006 161
Fina
ncia
l S
tate
men
ts(D
iffe
renc
es B
etw
een
the
PR
C a
nd I
FRS
)
(C) DIFFERENCES BETWEEN FINANCIAL STATEMENTS PREPARED UNDER THE PRC ACCOUNTING RULESAND REGULATIONS AND IFRS
Other than the differences in the classifications of certain financial statements captions and the accounting for the items described below, there are nomaterial differences between the Group’s financial statements prepared under the PRC Accounting Rules and Regulations and IFRS. The reconciliationpresented below is included as supplemental information, is not required as part of the basic financial statements and does not include differences relatedto classification, display or disclosures. Such information has not been subject to independent audit or review. The major differences are:
(i) Equity investment differencesUnder the PRC Accounting Rules and Regulations, equity investment difference, being the excess of the initial investment cost over the investor’s shareof equity of the investee enterprise, is amortised on a straight-line basis. The amortisation period is determined according to the investment period asstipulated in the relevant agreement, or less than 10 years if the investment period is not specified in the agreement.
Under IFRS, goodwill, being the excess of the cost of the business combination over the investor’s interest in the net fair value of the identifiable assets,liabilities and contingent liabilities, is not amortised. Instead, goodwill is tested for impairment annually, or more frequently if events or changes incircumstance indicate that it might be impaired.
(ii) Acquisitions of Sinopec National Star, Sinopec Hainan and Oil Production PlantsUnder the PRC Accounting Rules and Regulations, the acquisitions of Sinopec National Star Petroleum Company (“Sinopec National Star”), SinopecHainan and Oil Production Plants (the “Acquisitions”) are accounted for by the acquisition method. Under the acquisition method, the income of anacquiring enterprise includes the operations of the acquired enterprise subsequent to the acquisition. The difference between the cost of acquiringSinopec National Star and the fair value of the net assets acquired is capitalised as an exploration and production right, which is amortised over 27years. The difference between the cost of acquiring Oil Production Plants and the fair value of the net assets acquired is recognised as equityinvestment differences, which is amortised over 10 years.
Under IFRS, as the Group, Sinopec National Star, Sinopec Hainan and Oil Production Plants are under the common control of Sinopec Group Company,the Acquisitions are considered “combination of entities under common control” which are accounted in a manner similar to a pooling-of-interests(“as-if pooling-of-interests accounting”). Accordingly, the assets and liabilities of Sinopec National Star, Sinopec Hainan and Oil Production Plantsacquired have been accounted for at historical cost and the financial statements of the Group for periods prior to the Acquisitions have been restatedto include the financial condition and results of operation of Sinopec National Star, Sinopec Hainan and Oil Production Plants on a combined basis.The considerations paid by the Group are treated as equity transactions.
(iii) Pre-operating expendituresUnder the PRC Accounting Rules and Regulations, expenditures incurred during the start-up period are aggregated in long-term deferred expenses andcharged to the income statement when operations commence. Under IFRS, expenditures on start-up activities are recognised as an expense when theyare incurred.
(iv) Depreciation of oil and gas propertiesUnder the PRC Accounting Rules and Regulations, oil and gas properties are depreciated on a straight-line basis. Under IFRS, oil and gas properties aredepreciated on the unit of production method.
(v) Capitalisation of general borrowing costsUnder the PRC Accounting Rules and Regulations, only borrowing costs on funds that are specifically borrowed for construction are capitalised as partof the cost of property, plant and equipment. Under IFRS, to the extent that funds are borrowed generally and used for the purpose of obtaining aqualifying asset, the borrowing costs should be capitalised as part of the cost of that asset.
(vi)Gain from debt restructuringUnder the PRC Accounting Rules and Regulations, gain from debt restructuring resulting from the difference between the carrying amount of liabilitiesextinguished or assumed by other parties and the amount paid is credited to capital reserve. Under IFRS, the gain resulting from such difference isrecognised as income.
(vii) Revaluation of land use rightsUnder the PRC Accounting Rules and Regulations, land use rights are carried at revalued amount. Under IFRS, land use rights are carried at historicalcost less amortisation. Accordingly, the surplus on the revaluation of land use rights, credited to revaluation reserve, was eliminated.
(viii) Government grantsUnder the PRC Accounting Rules and Regulations, government grants relating to the purchase of equipment used for technology improvements arecredited to capital reserve. Under IFRS, government grants relating to the purchase of equipment used for technology improvements are initiallyrecorded as long-term liabilities and are offset against the cost of assets to which the grants related when construction commences. Upon transfer toproperty, plant and equipment, the grants are recognised as an income over the useful life of the property, plant and equipment by way of reduceddepreciation charge.
(ix) Impairment losses on long-lived assetsUnder the PRC Accounting Rules and Regulations and IFRS, impairment charges are recognised when the carrying value of long-lived assets exceedsthe higher of the fair value less costs to sell or the value in use which incorporates discounting the asset’s estimated future cash flows. Due to thedifference in the depreciation method of oil and gas properties discussed in (iv) above, the provision for impairment losses and reversal of impairmentloss under the PRC Accounting Rules and Regulations are measured differently from the amounts recorded under IFRS.

CHINA PETROLEUM & CHEMICAL CORPORATIONAnnual Report 2006162
(C) DIFFERENCES BETWEEN FINANCIAL STATEMENTS PREPARED UNDER THE PRC ACCOUNTING RULESAND REGULATIONS AND IFRS (CONTINUED)
Fina
ncia
l S
tate
men
ts(D
iffe
renc
es B
etw
een
the
PR
C a
nd I
FRS
)
(x) Disposal of oil and gas propertiesUnder the PRC Accounting Rules and Regulations, gains and losses arising from the retirement or disposal of an individual item of oil and gasproperties are recognised as an income or expense in the income statement and are measured as the difference between the estimated net disposalproceeds and the carrying amount of the asset.
Under IFRS, gains and losses on the retirement or disposal of an individual item of proved oil and gas properties are not recognised unless theretirement or disposal encompasses an entire property. The costs of the asset retired or disposed are charged to accumulated depreciation with theproceeds received on disposals credited to the carrying amounts of oil and gas properties.
(xi)Unrecognised losses of subsidiariesUnder the PRC Accounting Rules and Regulations, the results of subsidiaries are included in the Group’s consolidated income statement to the extentthat the subsidiaries’ accumulated losses do not result in their carrying amount being reduced below zero. Further losses are debited to a separatereserve in the shareholders’ funds. Any profits earned by the subsidiaries subsequently are firstly credited to this reserve before being included in theGroup’s consolidated income statement to the extent that the aggregate amounts credited do not exceed the accumulated losses debited to thisreserve previously for that same subsidiary.
Under IFRS, the results of subsidiaries are included in the Group’s consolidated income statement from the date that control effectively commencesuntil the date that control effectively ceases.
(xii) Change in fair value of available-for-sale securitiesUnder the PRC Accounting Rules and Regulations, long-term equity investments in which the Group does not have control, joint control or significantinfluence on their management are stated at cost less accumulated impairment losses.
Under IFRS, investment in available-for-sale equity securities are carried at fair value with any change in fair value, other than impairment losses,recognised directly in equity. When these investments are derecognised or impaired, the cumulative gain or loss previously recognised directly in equityis recognised in the income statement.
(xiii) Minority interestsUnder the PRC Accounting Rules and Regulations, minority interests at the balance sheet date are presented in the consolidated balance sheetseparately from liabilities and as deduction from the shareholders’ funds. Minority interests in the results of the Group for the period are alsoseparately presented in the consolidated income statement as deduction before arriving at the net profit.
Under IFRS, minority interests at the balance sheet date are presented in the consolidated balance sheet within equity, separately from the equityattributable to the equity shareholders of the Company, and minority interests in the results of the Group for the period are presented on the face ofthe consolidated income statement as an allocation of the total profit or loss for the period between the minority interests and the equity shareholdersof the Company.
Effects of major differences between the net profit under the PRC Accounting Rules and Regulations and the profit for the year under IFRS are analysedas follows:
Note 2006 2005RMB millions RMB millions
Net profit under the PRC Accounting Rules and Regulations 50,664 39,558Adjustments:
Equity investment differences (i) 1,158 200Capital injection in Sinopec Hainan and acquisition of Oil Production Plants (ii) 1,013 535Capital Acquisition of Sinopec National Star (ii) 117 117Pre-operating expenditures (iii) 703 435Depreciation of oil and gas properties (iv) 666 751Capitalisation of general borrowing costs, net of depreciation effect (v) 524 507Gain from debt restructuring (vi) 486 —Reduced amortisation on revaluation of land use rights (vii) 26 24Reduced depreciation on government grants (viii) 12 4Impairment losses on long-lived assets (ix) (150) —Disposal of oil and gas properties, net of depreciation effect (x) (335) (310)Unrecognised losses of subsidiaries (xi) (627) 119Effects of the above adjustments on taxation (345) (485)Minority interests (xiii) 1,496 3,321
Profit for the year under IFRS* 55,408 44,776

CHINA PETROLEUM & CHEMICAL CORPORATION Annual Report 2006 163
Fina
ncia
l S
tate
men
ts(D
iffe
renc
es B
etw
een
the
PR
C a
nd I
FRS
)
(C) DIFFERENCES BETWEEN FINANCIAL STATEMENTS PREPARED UNDER THE PRC ACCOUNTING RULESAND REGULATIONS AND IFRS
Effects of major differences between the shareholders’ funds under the PRC Accounting Rules and Regulations and the total equity under IFRS areanalysed as follows:
Note 2006 2005RMB millions RMB millions
Shareholders’ funds under the PRC Accounting Rules and Regulations 254,875 215,623Adjustments:
Equity investment differences (i) 1,358 200Capital injection in Sinopec Hainan and acquisition of Oil Production Plants (ii) (1,628) 745Acquisition of Sinopec National Star (ii) (2,461) (2,578)Pre-operating expenditures (iii) (64) (22)Depreciation of oil and gas properties (iv) 12,749 12,233Capitalisation of general borrowing costs (v) 2,636 2,112Revaluation of land use rights (vii) (927) (953)Government grants (viii) (576) (588)Disposal of oil and gas properties (x) 2,725 3,060Change in fair value of available-for-sale securities (xii) 38 —Effects of the above adjustments on taxation (5,880) (5,531)Minority interests (xiii) 21,944 30,679
Total equity under IFRS* 284,789 254,980
* The above figure is extracted from the financial statements prepared in accordance with IFRS which have been audited by KPMG.
CHINA PETROLEUM & CHEMICAL CORPORATIONAnnual Report 2006164
Fin
an
cia
l S
tate
me
nts
(Re
con
cili
ati
on
Sta
tem
en
t o
fD
iffe
ren
ces
in C
on
soli
da
ted
Sh
are
ho
lde
r s’
Fu
nd
s B
etw
ee
n t
he
Ne
w a
nd
Old
PR
C A
cco
un
tin
g S
tan
da
rds)
(D)RECONCILIATION STATEMENT OF DIFFERENCES IN CONSOLIDATED SHAREHOLDERS’ FUNDS BETWEEN THENEW AND OLD PRC ACCOUNTING STANDARDSREVIEW REPORT OF THE PRC AUDITORS
Huazhen
The Board of Directors of China Petroleum & Chemical Corporation:
We have reviewed the attached reconciliation statement of differences in consolidated shareholders’ funds between the new and old PRC accountingstandards of China Petroleum & Chemical Corporation (the “Company”) as at 31 December 2006 and 1 January 2007 (the “reconciliation statement ofdifferences”). It is the responsibility of the Company’s management to prepare the reconciliation statement of differences in accordance with the basis ofpreparation set out in note 2 to the reconciliation statement of differences. Our responsibility is to issue a review report on the reconciliation statement ofdifferences based on our review.
According to relevant requirements of the “Notice on the Proper Disclosure of Financial and Accounting Information In Relation to the New AccountingStandards” (Zheng Jian Fa [2006] No. 136), we conducted our review by reference to the Standard on Review Engagements for Certified Public AccountantsRegistered in the PRC no. 2101 – Engagements to Review Financial Statements. This standard requires that we plan and perform the review to obtainlimited assurance about whether the reconciliation statement of differences is free from material misstatement. A review is limited largely to makingenquiries of relevant personnel of the Company about the accounting policies and all the important assumptions underlying the reconciliation statementof differences, obtaining an understanding of the calculation of the reconciled amounts in the reconciliation statement of differences, reading thereconciliation statement of differences to determine whether the basis of preparation has been properly followed and performing analytical procedures asand when necessary. A review provides a lower level of assurance than an audit. We have not conducted an audit and, accordingly, we do not express anaudit opinion.
On the basis of our review, we are not aware of any issues which cause us to believe that the above reconciliation statement of differences has not beenprepared, in all material respects, in accordance with the basis of preparation set out in note 2 to the reconciliation statement of differences.
KPMG Huazhen Certified Public AccountantsRegistered in the People’s Republic of China
Wu WeiZhang Jingjing
Beijing, The People’s Republic of China6 April 2007

CHINA PETROLEUM & CHEMICAL CORPORATION Annual Report 2006 165
(D) RECONCILIATION STATEMENT OF DIFFERENCES IN CONSOLIDATED SHAREHOLDERS’ FUNDS BETWEEN THENEW AND OLD PRC ACCOUNTING STANDARDS (CONTINUED)
RECONCILIATION STATEMENT OF DIFFERENCES
Fin
an
cia
l S
tate
me
nts
(Re
con
cili
atio
n S
tate
me
nt
of
Dif
fere
nce
s in
Co
nso
lid
ate
d S
ha
reh
old
ers
’F
un
ds
Be
twe
en
th
e N
ew
an
dO
ld P
RC
Acc
ou
nti
ng
Sta
nd
ard
s)
Note RMB millionsConsolidated shareholders’ funds as at 31 December 2006 (Old PRC Accounting Standards) 3(a) 254,875Adjustments:
Capitalisation of general borrowing costs 3(b) 2,636Equity investment differences 3(c) 1,358Disposal of oil and gas properties 3(d) 620Change in the fair value of available-for-sale securities 3(e) 38Pre-operating expenditures 3(f) (64)Government grants 3(g) (576)Income tax 3(h) (994)Minority interests 3(i) 22,038
Consolidated shareholders’ funds as at 1 January 2007 (New PRC Accounting Standards) 4 279,931
This reconciliation statement of differences in consolidated shareholders’ funds between the new and old accounting standards has been approved by theboard of directors on 6 April 2007.
Chen Tonghai Wang Tianpu Dai Houliang Liu YunChairman Director, Director, Head of Corporate Finance(Authorised representative) President Senior Vice President and Department
Chief Financial Officer
The notes on pages 166 to 167 form part of this reconciliation statement of differences in consolidated shareholders’ funds between the new and old PRCaccounting standards.

CHINA PETROLEUM & CHEMICAL CORPORATIONAnnual Report 2006166
(D) RECONCILIATION STATEMENT OF DIFFERENCES IN CONSOLIDATED SHAREHOLDERS’ FUNDS BETWEEN THENEW AND OLD PRC ACCOUNTING STANDARDS (CONTINUED)
NOTE ON THE RECONCILIATION STATEMENT OF DIFFERENCES
Fin
an
cia
l S
tate
me
nts
(Re
con
cili
ati
on
Sta
tem
en
t o
fD
iffe
ren
ces
in C
on
soli
da
ted
Sh
are
ho
lde
r s’
Fu
nd
s B
etw
ee
n t
he
Ne
w a
nd
Old
PR
C A
cco
un
tin
g S
tan
da
rds)
1 PURPOSE OF PREPARATIONCommencing from 1 January 2007, the Company has adopted the Accounting Standards for Business Enterprises (the “New PRC Accounting Standards”)promulgated by the Ministry of Finance of the People’s Republic of China (the “MOF”) in 2006. To analyse and disclose the impact of adopting the NewPRC Accounting Standards on the Company’s financial position, the China Securities Regulatory Commission issued the “Notice on the Proper Disclosureof Financial and Accounting Information In Relation to the New Accounting Standards” (Zheng Jian Fa [2006] No. 136) (the “Notice”) in November2006 under which the Company is required to disclose the reconciliation of major differences in the “Supplementary Information” section of theannual financial report for 2006 in the form of reconciliation statement of differences in consolidated shareholders’ funds between the new and oldPRC accounting standards (“reconciliation statement of differences”) in accordance with relevant requirements of the Accounting Standard for BusinessEnterprises No. 38 — First time adoption of Accounting Standards for Business Enterprises (“ASBE 38”) and the Notice.
2 BASIS OF PREPARATIONThe Company issued H shares and prepared financial reports for external use under the PRC Accounting Rules and Regulations (the “Old PRC AccountingStandards”) and the International Financial Reporting Standards (“IFRS”) for the previous years. As required by the “Opinion of the Expert Team on theImplementation of the Accounting Standards for Business Enterprises” (the “Opinion”), on the date of first time adoption, the following retrospectiveadjustments have been made to items relevant to the changes in accounting policies arising from the implementation of New PRC Accounting Standards.
For the principles of the New PRC Accounting Standards which are different from the Old PRC Accounting Standards, if the Company had alreadyadopted the principles of the New PRC Accounting Standards in the preparation of financial statements under IFRS for the previous years, retrospectiveadjustments will be made to the changes in accounting policies arising from the implementation of New PRC Accounting Standards based on theinformation relied upon by the Company in preparing the financial statements under IFRS for the previous years.
Apart from the retrospective adjustments which are required by the Opinion as stated above, the Company has also made retrospective adjustments toother items in accordance with paragraphs 5 to19 of ASBE 38.
This reconciliation statement of differences has been prepared in accordance with the principle of retrospective adjustment as stated above, thecharacteristics and actual situation of the Company and its subsidiaries and the principle of materiality, on the basis of the consolidated financialstatements of 2006. References have been made to the Notice in respect of the presentation and disclosure of information in the reconciliationstatement of differences.
3 DESCRIPTIONS OF SIGNIFICANT ITEMS(a) The amount of consolidated shareholders’ funds as at 31 December 2006 (under the Old PRC Accounting Standards) is extracted from the
Company’s consolidated financial statements for the year ended 31 December 2006 prepared under the Old PRC Accounting Standards. Thesefinancial statements were audited by KPMG Huazhen, an auditors’ report with unqualified opinion was issued on 6 April 2007. The basis ofpresentation and the significant accounting policies of these financial statements are set out in the Company’s financial statements for the yearended 31 December 2006 prepared under the Old PRC Accounting Standards.
This reconciliation statement of differences and its notes should be read in conjunction with the Company’s 2006 financial statements for the yearended 31 December 2006 prepared under the Old PRC Accounting Standards.
(b) Capitalisation of general borrowing costs
Under the Accounting Standards for Business Enterprises No.17 – Borrowing Cost, where funds are borrowed generally and qualified for capitalisation,the corresponding borrowing costs are capitalised as part of the cost of related assets. The Company has, upon its first time adoption of the NewPRC Accounting Standards as at 1 January 2007, adjusted the carrying amount of fixed assets and the construction in progress, and increasedretained earnings.
(c) Equity investment differences
Under the Accounting Standards for Business Enterprises No.2 – Long Term Equity Investment, where there is an excess of the long term equityinvestment’s initial investment cost over the investor’s interest in the fair value of the investee’s identifiable net assets, equity investment differencesare not recognised, nor are they amortised. The Company has, upon its first time adoption of the New PRC Accounting Standards as at 1 January2007, reversed the equity investment differences amortised in prior years, and increased retained earnings.
(d) Disposal of oil and gas properties
Under the Accounting Standards for Business Enterprises – No.27 Exploration of Oil and Gas, gains and losses on the retirement or disposal of anindividual item of proved oil and gas properties are not recognised unless the retirement or disposal encompasses an entire property. The Companyhas, upon its first time adoption of the New PRC Accounting Standards on 1 January 2007, adjusted the losses on the retirement or disposal of anyindividual item of proved oil and gas properties recognised in previous years, net of depreciation charges, and increased retained earnings.
(e) Change in the fair value of available-for-sale securities
Given that the fair value of available-for-sale financial assets is determined in accordance with the Accounting Standards for Business Enterprises– No.22 Recognition and Measurement of Financial Instruments, the Company has determined the available-for-sale securities’ fair value as at 1January 2007 based on quoted prices in active markets, and increased shareholders’ funds by the difference between the fair value and the carryingvalue.
(f) Pre-operating expenditures
Under the New PRC Accounting Standards, expenditures on start-up activities are recognised as an expense when they are incurred. The Companyhas, upon its first time adoption of the New Accounting Standards on 1 January 2007, adjusted the incurred pre-operating expenditures, andreduced retained earnings.

CHINA PETROLEUM & CHEMICAL CORPORATION Annual Report 2006 167
(D) RECONCILIATION STATEMENT OF DIFFERENCES IN CONSOLIDATED SHAREHOLDERS’ FUNDS BETWEEN THENEW AND OLD PRC ACCOUNTING STANDARDS (CONTINUED)
NOTE ON THE RECONCILIATION STATEMENT OF DIFFERENCES
Fin
an
cia
l S
tate
me
nts
(Re
con
cili
atio
n S
tate
me
nt
of
Dif
fere
nce
s in
Co
nso
lid
ate
d S
ha
reh
old
ers
’F
un
ds
Be
twe
en
th
e N
ew
an
dO
ld P
RC
Acc
ou
nti
ng
Sta
nd
ard
s)
(g) Government grants
Under the Accounting Standards for Business Enterprises No.16 – Government Grants, the asset-related government grants received in previousyears are recognised as deferred income and recognised on the income statement over the assets’ useful lives. The Company has, upon its first timeadoption of the New PRC Accounting Standards on 1 January 2007, adjusted the asset-related government grants received in previous years whichhad been recognised in capital reserve, and reduced shareholders’ funds.
(h) Income tax
The Company adjusted the deferred tax effect and shareholders’ funds as at 1 January 2007 due to the retrospective adjustments made to theabove items 3(b) to 3(g).
(i) Minority interests
Under the New PRC Accounting Standards, the Company has changed the accounting treatment of minority interests by separately presentingminority interests within the consolidated shareholders’ funds, which increased the shareholders’ funds accordingly.
4 IMPORTANT NOTESThe Company commenced adoption of the New PRC Accounting Standards on 1 January 2007, and is in the process of assessing the impact on theCompany’s financial position, operating results, and cash flow. After giving careful consideration to this and the further interpretation on the New PRCAccounting Standards by the MOF, the Company may adjust related accounting policies or significant recognition applied in the preparation of thereconciliation statement of differences during the preparation of the interim and annual financial statements of 2007. This may, in turn, cause adifference between the consolidated shareholders’ funds (under the New PRC Accounting Standards) as at 1 January 2007 as stated in the reconciliationstatement of differences and the respective figures as presented in the interim and annual financial statements of 2007.
CHINA PETROLEUM & CHEMICAL CORPORATIONAnnual Report 2006168
Fina
ncia
l S
tate
men
ts(S
upp
lem
enta
l In
form
atio
n fo
rN
orth
Am
eric
an S
hare
hold
ers)
(E) SUPPLEMENTAL INFORMATION FOR NORTH AMERICAN SHAREHOLDERS
The Group’s accounting policies conform with IFRS which differ in certain significant respects from accounting principles generally accepted in the UnitedStates of America (“US GAAP”). Information relating to the nature and effect of such differences are set out below. The US GAAP reconciliation presentedbelow is included as supplemental information, is unaudited, is not required as part of the basic financial statements and does not include differencesrelated to classification, display or disclosures.
(a) Foreign exchange gains and lossesIn accordance with IFRS, foreign exchange differences on funds borrowed for construction are capitalised as property, plant and equipment to theextent that they are regarded as an adjustment to interest costs during the construction period. Under US GAAP, all foreign exchange gains and losseson foreign currency debt are included in current earnings. For the years presented herein, the US GAAP adjustments represent the amortisation effectof such originating adjustments described above. Accordingly, the carrying amount of property, plant and equipment under IFRS was higher than theamount under US GAAP by RMB 195 million (2005: RMB 241 million) as of 31 December 2006.
(b) Revaluation of property, plant and equipmentAs required by the relevant PRC regulations with respect to the Reorganisation, the property, plant and equipment of the Group were revalued at 30September 1999. In addition, in connection with the acquisitions of certain entities and related operations from Sinopec Group Company in prioryears, the related property, plant and equipment were revalued by independent valuers in accordance with relevant PRC rules and regulations. UnderIFRS, such revaluations result in an increase in equity with respect to the increase in carrying amount of certain property, plant and equipment abovetheir historical cost bases and a charge to income with respect to the reduction in carrying amount of certain property, plant and equipment belowtheir historical cost bases.
Under US GAAP, property, plant and equipment are stated at their historical cost less accumulated depreciation. However, as a result of the taxdeductibility of the net revaluation surplus, a deferred tax asset related to the reversal of the revaluation surplus is created under US GAAP with acorresponding increase in equity.
In addition, under IFRS, on disposal of a revalued asset, the related revaluation surplus is transferred from the revaluation reserve to retained earnings.Under US GAAP, the gain and loss on disposal of an asset is determined with reference to the asset’s historical carrying amount and included in currentearnings.
Accordingly, the carrying amount of property, plant and equipment under IFRS was higher than the amount under US GAAP by RMB 441 million (2005:RMB 1,838 million) as of 31 December 2006.
(c) Exchange of assetsDuring 2002, the Company and Sinopec Group Company entered into an asset swap transaction. Under IFRS, the cost of property, plant and equipmentacquired in an exchange for a dissimilar item of property, plant and equipment is measured at fair value. Under US GAAP, as the exchange of assetswas between entities under common control, the assets received from Sinopec Group Company are measured at historical cost. The difference betweenthe historical cost of the net assets transferred and the net assets received is accounted for as an equity transaction. For the years presented herein,the US GAAP adjustments represent the amortisation effect of such originating adjustments described above. Accordingly, the carrying amount ofproperty, plant and equipment under IFRS was higher than the amount under US GAAP by RMB 486 million (2005: RMB 509 million) as of 31December 2006.
(d) Reversal of impairment of long-lived assetsUnder IFRS, impairment charges are recognised when a long-lived asset’s carrying amount exceeds the higher of an asset’s fair value less costs to selland value in use, which incorporates discounting the asset’s estimated future cash flows.
Under US GAAP, determination of the recoverability of a long-lived asset held for use is based on an estimate of undiscounted future cash flowsresulting from the use of the asset and its eventual disposition. If the sum of the expected future cash flows is less than the carrying amount of theasset, an impairment loss is recognised. Measurement of an impairment loss for a long-lived asset is based on the difference between the asset’scarrying value and the fair value of the asset.
In addition, under IFRS, a subsequent increase in the recoverable amount of an asset is reversed to the consolidated income statement to the extentthat an impairment loss on the same asset was previously recognised as an expense when the circumstances and events that led to the write-down orwrite-off cease to exist. The reversal is reduced by the amount that would have been recognised as depreciation had the write-off not occurred. UnderUS GAAP, an impairment loss establishes a new cost basis for the impaired asset and the new cost basis should not be adjusted subsequently otherthan for further impairment losses.
For the years presented herein, the US GAAP adjustment represents the effect of reversing the recovery of previous impairment charges recorded underIFRS. Accordingly, the carrying amount of property, plant and equipment under IFRS was higher than the amount under US GAAP by RMB 418 million(2005: RMB 456 million) as of 31 December 2006.
(e) Capitalised interest on investment in associatesUnder IFRS, an investment accounted for by the equity method is not considered a qualifying asset for which interest is capitalised. Under US GAAP, aninvestment accounted for by the equity method while the investee has activities in progress necessary to commence its planned principal operations,provided that the investee’s activities include the use of funds to acquire qualifying assets for its operations, is a qualifying asset for which interest isinitially capitalised and subsequently amortised when the operation of the qualifying assets begin. Accordingly, the carrying amount of the interest inassociates under IFRS was lower than the amount under US GAAP by RMB 446 million (2005: RMB 486 million) as of 31 December 2006.

CHINA PETROLEUM & CHEMICAL CORPORATION Annual Report 2006 169
(E) SUPPLEMENTAL INFORMATION FOR NORTH AMERICAN SHAREHOLDERS (CONTINUED)
Fina
ncia
l S
tate
men
ts(S
upp
lem
enta
l In
form
atio
n fo
rN
orth
Am
eric
an S
hare
hold
ers)
(f) GoodwillUnder IFRS, with reference to IFRS 3, “Business Combination”, goodwill arising from a business combination for which the purchase agreement dateis on or after 31 March 2004 is not amortised, or goodwill arising from a business combination for which the purchase agreement date was before 31March 2004 is no longer amortised from the first annual reporting period beginning on or after 31 March 2004. Instead, goodwill is tested forimpairment annually.
Under US GAAP, with reference to Statement of Financial Accounting Standards No.142, “Goodwill and Other Intangible Assets” (“SFAS No.142”),goodwill is no longer amortised beginning 1 January 2002. Instead, goodwill is reviewed for impairment at least annually.
As a result, there is no difference in respect of goodwill amortisation effective 1 January 2005. Accordingly, the carrying amount of the goodwill underIFRS was lower than the amount under US GAAP by RMB 43 million (2005: RMB 43 million) as of 31 December 2006 due to the continued amortisationof goodwill under IFRS until the end of 2004.
(g) Presentation of minority interestsUnder IFRS, minority interests at the balance sheet date are presented in the consolidated balance sheet within equity, separately from the equityattributable to the equity shareholders of the Company, and minority interests in the results of the Group for the year are presented on the face of theconsolidated income statement as an allocation of the profit for the year between the minority interests and the equity shareholders of the Company.Under US GAAP, minority interests at the balance sheet date are presented in the consolidated balance sheet either as liabilities or separately fromliabilities and equity. Minority interests in the results of the Group for the year are also separately presented in the consolidated income statement asa component of net income.
(h) Companies included in consolidationUnder IFRS, the Group consolidates less than majority owned entities in which the Group has the power, directly or indirectly, to govern the financialand operating policies of an entity so as to obtain benefits from its activities, and proportionately consolidates jointly controlled entities in which theGroup has joint control with other venturers. However, US GAAP requires that any entity of which the Group owns 20% to 50% of total outstandingvoting stock not be consolidated nor proportionately consolidated, but rather be accounted for under the equity method. Accordingly, certain of theGroup’s subsidiaries, of which the Group owns between 40.72% to 50% of the outstanding voting stock, and the Group’s jointly controlled entities arenot consolidated nor proportionately consolidated under US GAAP and instead accounted for under the equity method. This exclusion does not affectthe profit attributable to equity shareholders of the Company or the total equity attributable to the equity shareholders of the Company reconciliationsbetween IFRS and US GAAP.
Presented below is summarised financial information prepared in accordance with US GAAP of such subsidiaries and jointly controlled entities.
Years ended 31 December2006 2005
RMB millions RMB millionsRevenues 75,184 53,768Profit before taxation 6,119 286Net profit/(loss) 5,672 (204)
At 31 December2006 2005
RMB millions RMB millionsCurrent assets 19,417 12,101Total assets 68,458 64,560Current liabilities 12,231 8,901Total liabilities 31,448 31,727Total equity 37,010 32,833

CHINA PETROLEUM & CHEMICAL CORPORATIONAnnual Report 2006170
(E) SUPPLEMENTAL INFORMATION FOR NORTH AMERICAN SHAREHOLDERS (CONTINUED)
Fina
ncia
l S
tate
men
ts(S
upp
lem
enta
l In
form
atio
n fo
rN
orth
Am
eric
an S
hare
hold
ers)
(i) Recently issued accounting standards
SFAS No. 157In September 2006, the FASB issued SFAS No. 157 “Fair Value Measurements” which defines fair value, provides a framework for measuring fair value,and expands the disclosures required for fair value measurements. SFAS No. 157 applies to other accounting pronouncements that require fair valuemeasurements and does not require any new fair value measurements. SFAS No. 157 is effective for fiscal years beginning after 15 November 2007.Currently, the Group does not expect the adoption of SFAS No. 157 will have a material impact on its consolidation financial statements.
FIN No. 48In June 2006, the FASB issued FASB Interpretation No. 48 “Accounting for Uncertainty in Income Taxes – an interpretation of SFAS No. 109” (“FIN48”).FIN 48 requires that the Group recognizes in the consolidated financial statements the impact of a tax position, if that position is more likely than notof being sustained upon examination, based on the technical merits of the position. FIN 48 will be effective for the first fiscal year beginning after 15December 2006. Currently, the Group does not expect the adoption of this Interpretation will have a material effect on its consolidated financialstatements.
The effect on profit attributable to equity shareholders of the Company of significant differences between IFRS and US GAAP is as follows:
Reference Years ended 31 Decemberin note 2006 2006 2005above US$ millions RMB millions RMB millions
Profit attributable to equity shareholders of the Company under IFRS 6,908 53,912 41,455US GAAP adjustments:
Foreign exchange gains and losses (a) 6 46 54Depreciation on revalued property, plant and equipment (b) 172 1,340 4,016Disposal of property, plant and equipment (b) 7 57 1,838Exchange of assets (c) 3 23 23Depreciation effect of reversal of impairment of long-lived assets (d) 5 38 76Capitalised interest on investments in associates, net of
amortisation effect (e) (5) (40) (40)Deferred tax effect of US GAAP adjustments (54) (421) (1,786)Minority interests (g) (12) (93) (489)
Profit attributable to equity shareholders of the Company under US GAAP 7,030 54,862 45,147Basic and diluted earnings per share under US GAAP USD0.08 RMB0.63 RMB0.52Basic and diluted earnings per ADS under US GAAP* USD8.11 RMB63.28 RMB52.07
* Basic and diluted earnings per ADS is calculated on the basis that one ADS is equivalent to 100 H shares.
The effect on the total equity attributable to equity shareholders of the Company of significant differences between IFRS and US GAAP is as follows:
Reference At 31 Decemberin note 2006 2006 2005above US$ millions RMB millions RMB millions
Total equity attributable to equity shareholders of the Company under IFRS 33,680 262,845 224,301US GAAP adjustments:
Foreign exchange gains and losses (a) (25) (195) (241)Revaluation of property, plant and equipment (b) (57) (441) (1,838)Exchange of assets (c) (62) (486) (509)Reversal of impairment of long-lived assets (d) (54) (418) (456)Capitalised interest on investments in associates (e) 57 446 486Goodwill (f) 6 43 43Effect of US GAAP adjustments on deferred tax assets 62 487 921Effect of US GAAP adjustments on deferred tax liabilities (15) (121) (134)Minority interests (g) 18 137 230
Total equity attributable to equity shareholders of the Company under US GAAP 33,610 262,297 222,803
Note: United States dollar equivalents
For the convenience of readers, amounts in Renminbi have been translated into United States dollars at the rate of US$1.00 = RMB 7.8041 beingthe noon buying rate in New York City on 29 December 2006 for cable transfers in Renminbi as certified for customs purposes by the FederalReserve Bank of New York. No representation is made that the Renminbi amounts could have been, or could be, converted into United Statesdollars at that rate.
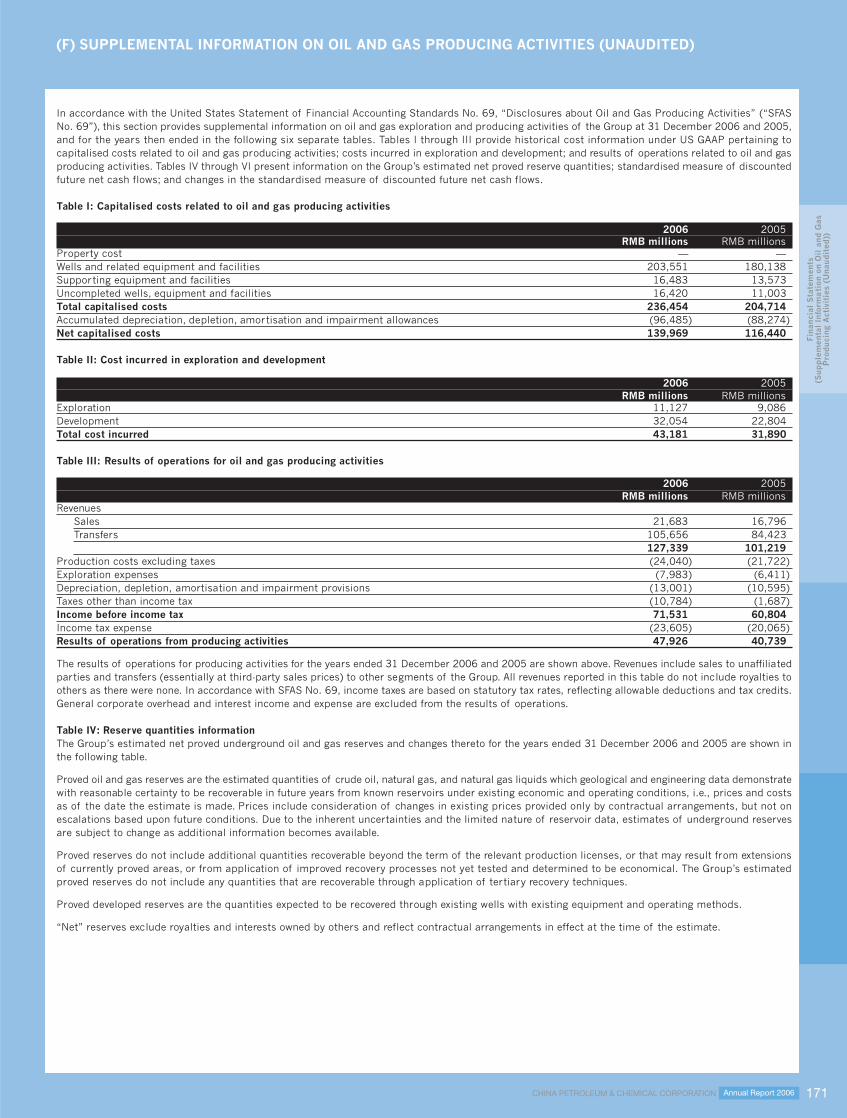
CHINA PETROLEUM & CHEMICAL CORPORATION Annual Report 2006 171
(F) SUPPLEMENTAL INFORMATION ON OIL AND GAS PRODUCING ACTIVITIES (UNAUDITED)
Fina
ncia
l S
tate
men
ts(S
upp
lem
enta
l In
form
ati
on o
n O
il a
nd G
asP
rod
ucin
g A
ctiv
itie
s (U
naud
ited
))
In accordance with the United States Statement of Financial Accounting Standards No. 69, “Disclosures about Oil and Gas Producing Activities” (“SFASNo. 69”), this section provides supplemental information on oil and gas exploration and producing activities of the Group at 31 December 2006 and 2005,and for the years then ended in the following six separate tables. Tables I through III provide historical cost information under US GAAP pertaining tocapitalised costs related to oil and gas producing activities; costs incurred in exploration and development; and results of operations related to oil and gasproducing activities. Tables IV through VI present information on the Group’s estimated net proved reserve quantities; standardised measure of discountedfuture net cash flows; and changes in the standardised measure of discounted future net cash flows.
Table I: Capitalised costs related to oil and gas producing activities
2006 2005RMB millions RMB millions
Property cost — —Wells and related equipment and facilities 203,551 180,138Supporting equipment and facilities 16,483 13,573Uncompleted wells, equipment and facilities 16,420 11,003Total capitalised costs 236,454 204,714Accumulated depreciation, depletion, amortisation and impairment allowances (96,485) (88,274)Net capitalised costs 139,969 116,440
Table II: Cost incurred in exploration and development
2006 2005RMB millions RMB millions
Exploration 11,127 9,086Development 32,054 22,804Total cost incurred 43,181 31,890
Table III: Results of operations for oil and gas producing activities
2006 2005RMB millions RMB millions
RevenuesSales 21,683 16,796Transfers 105,656 84,423
127,339 101,219Production costs excluding taxes (24,040) (21,722)Exploration expenses (7,983) (6,411)Depreciation, depletion, amortisation and impairment provisions (13,001) (10,595)Taxes other than income tax (10,784) (1,687)Income before income tax 71,531 60,804Income tax expense (23,605) (20,065)Results of operations from producing activities 47,926 40,739
The results of operations for producing activities for the years ended 31 December 2006 and 2005 are shown above. Revenues include sales to unaffiliatedparties and transfers (essentially at third-party sales prices) to other segments of the Group. All revenues reported in this table do not include royalties toothers as there were none. In accordance with SFAS No. 69, income taxes are based on statutory tax rates, reflecting allowable deductions and tax credits.General corporate overhead and interest income and expense are excluded from the results of operations.
Table IV: Reserve quantities informationThe Group’s estimated net proved underground oil and gas reserves and changes thereto for the years ended 31 December 2006 and 2005 are shown inthe following table.
Proved oil and gas reserves are the estimated quantities of crude oil, natural gas, and natural gas liquids which geological and engineering data demonstratewith reasonable certainty to be recoverable in future years from known reservoirs under existing economic and operating conditions, i.e., prices and costsas of the date the estimate is made. Prices include consideration of changes in existing prices provided only by contractual arrangements, but not onescalations based upon future conditions. Due to the inherent uncertainties and the limited nature of reservoir data, estimates of underground reservesare subject to change as additional information becomes available.
Proved reserves do not include additional quantities recoverable beyond the term of the relevant production licenses, or that may result from extensionsof currently proved areas, or from application of improved recovery processes not yet tested and determined to be economical. The Group’s estimatedproved reserves do not include any quantities that are recoverable through application of tertiary recovery techniques.
Proved developed reserves are the quantities expected to be recovered through existing wells with existing equipment and operating methods.
“Net” reserves exclude royalties and interests owned by others and reflect contractual arrangements in effect at the time of the estimate.

CHINA PETROLEUM & CHEMICAL CORPORATIONAnnual Report 2006172
(F) SUPPLEMENTAL INFORMATION ON OIL AND GAS PRODUCING ACTIVITIES (UNAUDITED) (CONTINUED)
Fina
ncia
l S
tate
men
ts(S
upp
lem
enta
l In
form
atio
n on
Oil
and
Gas
Pro
duc
ing
Act
ivit
ies
(Una
udit
ed))
2006 2005Proved developed and undeveloped reserves (oil) (million barrels)Beginning of year 3,294 3,267Revisions of previous estimates (10) 26Improved recovery 146 142Extensions and discoveries 148 138Production (285) (279)End of year 3,293 3,294Proved developed reservesBeginning of year 2,870 2,808End of year 2,903 2,870Proved developed and undeveloped reserves (gas) (billion cubic feet)Beginning of year 2,952 3,033Revisions of previous estimates (9) (42)Extensions and discoveries 170 183Production (257) (222)End of year 2,856 2,952Proved developed reservesBeginning of year 1,557 1,398End of year 1,472 1,557
Table V: Standardised measure of discounted future net cash flowsThe standardised measure of discounted future net cash flows, related to the above proved oil and gas reserves, is calculated in accordance with therequirements of SFAS No. 69. Estimated future cash inflows from production are computed by applying year-end prices for oil and gas to year-endquantities of estimated net proved reserves. Future price changes are limited to those provided by contractual arrangements in existence at the end ofeach reporting year. Future development and production costs are those estimated future expenditures necessary to develop and produce year-endestimated proved reserves based on year-end cost indices, assuming continuation of year-end economic conditions. Estimated future income taxes arecalculated by applying appropriate year-end statutory tax rates to estimated future pre-tax net cash flows, less the tax basis of related assets. Discountedfuture net cash flows are calculated using 10% midperiod discount factors. This discounting requires a year-by-year estimate of when the future expenditurewill be incurred and when the reserves will be produced.
The information provided does not represent management’s estimate of the Group’s expected future cash flows or value of proved oil and gas reserves.Estimates of proved reserve quantities are imprecise and change over time as new information becomes available. Moreover, probable and possiblereserves, which may become proved in the future, are excluded from the calculations. The arbitrary valuation prescribed under SFAS No. 69 requiresassumptions as to the timing and amount of future development and production costs. The calculations are made for the years ended 31 December 2006and 2005 and should not be relied upon as an indication of the Group’s future cash flows or value of its oil and gas reserves.
2006 2005RMB millions RMB millions
Future cash flows 1,235,524 1,401,283Future production costs (487,895) (440,743)Future development costs (33,523) (26,994)Future income tax expenses (189,465) (270,607)Undiscounted future net cash flows 524,641 662,93910% annual discount for estimated timing of cash flows (241,180) (304,893)Standardised measure of discounted future net cash flows 283,461 358,046
Table VI: Changes in the standardised measure of discounted future net cash flows
2006 2005RMB millions RMB millions
Sales and transfers of oil and gas produced, net of production costs (92,849) (61,346)Net changes in prices and production costs (114,796) 130,221Net change due to extensions, discoveries and improved recoveries 51,445 56,131Revisions of previous quantity estimates (1,207) 3,964Previously estimated development costs incurred during the year 8,516 8,134Accretion of discount 30,190 21,352Net change in income taxes 43,784 (50,397)Others 332 308Net change for the year (74,585) 108,367

CHINA PETROLEUM & CHEMICAL CORPORATION Annual Report 2006 173
CORPORATE INFORMATION
Co
rpo
rate
In
form
ati
on
STATUTORY NAME中國石油化工股份有限公司
ENGLISH NAMEChina Petroleum & Chemical Corporation
CHINESE ABBREVIATION中國石化
ENGLISH ABBREVIATIONSinopec Corp.
LEGAL REPRESENTATIVEMr. Chen Tonghai
REGISTERED ADDRESS AND PLACE OFBUSINESS
6A Huixindong StreetChaoyang DistrictBeijing, PRCPostcode : 100029Tel. : 86-10-64990060Fax : 86-10-64990022Website : http://www.sinopec.comE-mail addresses : [email protected]
PLACE OF BUSINESS IN HONG KONG20th Floor, Office TowerConvention Plaza1 Harbour RoadWanchaiHong Kong
AUTHORISED REPRESENTATIVESMr. Wang TianpuMr. Chen Ge
SECRETARY TO THE BOARD OF DIRECTORSMr. Chen Ge
REPRESENTATIVE ON SECURITIES MATTERSMr. Huang WenshengAddress : 6A Huixindong Street
Chaoyang DistrictBeijing, PRC
Postcode : 100029Tel. : 86-10-64990060Fax : 86-10-64990022
NEWSPAPERS FOR INFORMATIONDISCLOSURE
Hong Kong Economic Times (Hong Kong)South China Morning Post (Hong Kong)(in English)China Securities JournalShanghai Securities NewsSecurities Times
INTERNET WEBSITE PUBLISHING THISANNUAL REPORT DESIGNATED BY THECHINA SECURITIES REGULATORYCOMMISSION
http://www.sse.com.cn
LEGAL ADVISORSPeople’s Republic of China:Haiwen & PartnersRoom 1711, Beijing Silver TowerNo. 2, Dong San Huan North RoadChaoyang DistrictBeijingPRCPostcode: 100027
Hong Kong:Herbert Smith23rd Floor, Gloucester Tower11 Pedder StreetCentral, Hong Kong
United States:Skadden, Arps, Slate, Meagher & Flom LLP30th Floor, Tower II, Lippo Centre89 QueenswayHong Kong
PRINCIPAL BANKERSBank of China410 Fuchengmenwai StreetXicheng DistrictBeijing, PRC
Industrial and Commercial Bank of China55 Fuxingmennei AvenueXicheng DistrictBeijing, PRC
China Construction Bank25 Finance StreetXicheng DistrictBeijing, PRC
China Development Bank29 Fuchengmenwai StreetXicheng DistrictBeijing, PRC

CHINA PETROLEUM & CHEMICAL CORPORATIONAnnual Report 2006174
CORPORATE INFORMATION (CONTINUED)
Co
rpo
rate
In
form
ati
on
REGISTRARSH Shares:Hong Kong Registrars LimitedRooms 1712 to 171617th Floor, Hopewell Centre183 Queen’s Road EastHong Kong
A Shares:China Securities Registration and ClearingCompany Limited Shanghai Branch Company72 Pu Jian RoadPudong DistrictShanghai, PRC
DEPOSITARY FOR ADRsThe US:Citibank, N.A.388 Greenwich St., 14th FloorNew York NY 10013United States of America
COPIES OF THIS ANNUAL REPORT AREAVAILABLE AT
The PRC:China Petroleum & Chemical CorporationBoard Secretariat6A Huixindong StreetChaoyang DistrictBeijing PRC
The US:Citibank, N.A.388 Greenwich St., 14th FloorNew York NY 10013United States of America
The UK:Citibank, N.A.Citigroup CentreCanada Square, Canary WharfLondon E14 5LB, U.K.
PLACES OF LISTING OF SHARES, STOCKNAMES AND STOCK CODES
H Shares:Hong Kong Stock ExchangeStock name: Sinopec CorpStock code: 0386
ADRs:New York Stock ExchangeStock name: SINOPEC CORPStock code: SNP
London Stock ExchangeStock name: SINOPEC CORPStock code: SNP
A Shares:Shanghai Stock ExchangeStock name: SINOPEC CORPStock code: 600028
FIRST REGISTRATION DATE OFSINOPEC CORP.
25 February 2000
FIRST REGISTRATION PLACE OFSINOPEC CORP.
6A Huixindong Street, Chaoyang District,Beijing, PRC
ENTERPRISE LEGAL BUSINESSES LICENSEREGISTRATION NO.
1000001003298 (10-10)
TAXATION REGISTRATION NO.Jing Guo Shui Chao Zi 110105710926094
NAMES AND ADDRESSES OF AUDITORS OFSINOPEC CORP.Domestic Auditors : KPMG Huazhen Certified
Public AccountantsAddress : 8/F, Office Tower E2
Oriental Plaza1 East Chang An AvenueDong Cheng DistrictBeijing 100738, PRC
Overseas Auditors : KPMG Certified PublicAccountants
Address : 8th FloorPrince’s BuildingCentral, Hong Kong

CHINA PETROLEUM & CHEMICAL CORPORATION Annual Report 2006 175
DOCUMENTS FOR INSPECTION
Do
cum
en
ts f
or
Insp
ect
ion
The following documents will be available forinspection during normal business hours after 6April 2007 (Friday) at the registered address ofSinopec Corp. upon requests by the relevantregulatory authorities and shareholders inaccordance with the Articles of Associationof Sinopec Corp. and the laws and regulationsof the PRC:
a) The original annual report signed by theChairman and the President;
b) The original audited financial statementsand audited consolidated financialstatements of Sinopec Corp. for the yearended 31 December 2006, prepared inaccordance with IFRS and the PRCAccounting Rules and Regulations andsigned by the Chairman, the President,the Chief Financial Officer and the headof the Corporate Finance Departmentof Sinopec Corp.;
c) The original auditors’ reports in respect ofthe above financial statements signed by theauditors; and
d) All original copies of the documents andannouncements Sinopec Corp. has publishedin the newspapers stipulated by the ChinaSecurities Regulatory Commission duringthe reporting period.
By Order of the BoardChen TonghaiChairman
Beijing, PRC, 6 April 2007

CHINA PETROLEUM & CHEMICAL CORPORATIONAnnual Report 2006176
CONFIRMATION FROM THE DIRECTORS AND SENIOR MANAGEMENT
Co
nfi
rmati
on
fro
m t
he
Dir
ect
ors
an
d S
en
ior
Ma
na
ge
me
nt
This annual report is published in both Englishand Chinese. Should any conflict regardingmeaning arises, the Chinese version shallprevail.
According to the relevant provisions andrequirements of the Securities Law of thePeople’s Republic of China and the Contentsand Formats Standard No.2 ConcerningInformation Disclosure of Companies OfferingShares to the Public - Contents and Formats ofAnnual Report (revised 2005) promulgated bythe China Securities Regulatory Commission, asthe Board Directors and senior management ofSinopec Corp., we have carefully reviewed theannual report for 2006 and accounts of SinopecCorp. and concluded that this annual reporttruly and objectively represents the SinopecCorp.’s business performance in 2006, itcontains no false representations, misleadingstatements or material omissions and complieswith the requirements of the China SecuritiesRegulatory Commission and other relevantregulatory authorities.
Signatures of the Directors and Senior Management
Chen Tonghai Zhou Yuan Wang Tianpu
Zhang Jianhua Wang Zhigang Dai Houliang
Liu Zhongli Shi Wanpeng Li Deshui
Yao Zhongmin Fan Yifei Cai Xiyou
Zhang Kehua Zhang Haichao Jiao Fangzheng
Chen Ge
6 April 2007

����� ������ � ��� ���� ������
����� ��������� ��������� ������������������� ������ ! "#$%$&'(&) *+,--+./0(10&) 2$3+,$4+5-$6$&) 78889:;<.
��������
��
� ���� ���������
�=>>?
�����������@�������
;,$&+-' (& -&A$,(&B-&+0CC1 D,$-&'C1 E0E-,
=>>? ������ ��� ��@ �������F����� G��� H ��� I JKKKLM N O ��� I KPMJ N HQ� I �� R