newfoundland and labrador offshore oil & gas industry ...€¦ · the offshore oil and gas...
TRANSCRIPT

Newfoundland and Labrador Offshore Oil & Gas Industry:
Economic Impact ReportCurrent impact and future potential
Prepared by: Jupia Consultants Inc. | October 2018


Summary of Findings ............................................................................................................................. 5
1. Introduction ........................................................................................................................................ 6
1.1 Background .................................................................................................................................. 6
1.2 Purpose of this report .................................................................................................................. 6
1.3 The economic impact model ...................................................................................................... 6
1.4 Estimating future economic impacts .......................................................................................... 7
2. Offshore oil and gas: Setting the stage ........................................................................................... 8
2.1 Offshore oil and gas: A game changer for Newfoundland and Labrador .............................. 8
2.2 Distributed benefits: Offshore oil and gas - A rising tide lifts all boats ................................. 10
2.3 Estimating the current economic impact from offshore oil and gas ...................................... 10
2.4 Putting the industry’s economic impact into perspective....................................................... 17
2.5 What does $1.42 billion worth of NL tax and royalty revenue pay for? ................................. 18
2.6 Economic impacts outside Newfoundland and Labrador ...................................................... 19
3. Estimating the future economic impact from the offshore oil and gas sector ........................... 20
3.1 Advance 2030 – Guiding the industry’s development ............................................................ 20
3.2 Offshore Newfoundland and Labrador oil and gas in the global context ............................ 21
3.3 The economic impact from offshore oil and gas in 2033: Impact model assumptions ........ 22
3.4 Economic impact from offshore oil and gas in Newfoundland and Labrador: 2033 ............ 23
3.5 Estimating cumulative tax and royalty impacts: 2029-2045 .................................................... 27
3.6 Royalty and corporate income tax sensitivity analysis ............................................................ 27
3.7 Investing oil and gas royalties ................................................................................................... 28
4. Conclusion........................................................................................................................................ 29
Appendix A: The economic impact model and sources .................................................................. 30
Appendix B: About Jupia Consultants Inc. ...................................................................................... 31TAB
LE O
F C
ON
TEN
TS

Figure 1: Real GDP from oil and gas extraction: Newfoundland and Labrador .............................................................. 8
Figure 2: GDP from oil and gas extraction as a share of total provincial GDP - Newfoundland and Labrador ........... 8
Figure 3: Largest industries by GDP contribution (% of total GDP) - Newfoundland and Labrador ............................. 9
Figure 4: Average weekly wage: All industries combined, Newfoundland and Labrador, Canada ............................ 10
Figure 5: Average weekly wage in Newfoundland and Labrador as a percentage of the Canadian average........... 11
Figure 6: Average employment income by industry: Newfoundland and Labrador ..................................................... 11
Figure 7: Wage premium for oil and gas related industries - Newfoundland and Labrador ........................................ 12
Figure 8: Full-time equivalent (FTE) jobs created in Canada as a result of NL oil and gas sector (2017) .................... 13
Figure 9: Jobs supported across the economy by the Newfoundland and Labrador offshore oil and gas sector ... 18
Figure 10: Estimated jobs supported across Canada from the NL offshore oil and gas sector ................................... 19
Figure 11: Offshore Newfoundland and Labrador oil and gas reserves .......................................................................... 21
Figure 12: Newfoundland and Labrador offshore oil and gas sector - Projected barrels per day profile (000s) ....... 22
Figure 13: Estimated capital investment pattern in NL required to reach 650,000 barrels/day by 2030 ..................... 23
Figure 14: Growth in consumer spending as a result of the expanded oil and gas industry ....................................... 26
Table 1: The Economic Impact Model .................................................................................................................................... 7
Table 2: Sectors included in the economic impact model .................................................................................................. 7
Table 3: Oil and gas extraction - GDP contribution by province (2017) ............................................................................. 9
Table 4: Oil and gas extraction capital expenditures in Newfoundland and Labrador ................................................. 10
Table 5: Cumulative increase in average weekly wage by industry (2001-2017) ............................................................. 12
Table 6: Employment and labour income from the offshore oil and gas sector in Newfoundland and Labrador .... 14
Table 7: Consumer spending generated by the offshore oil and gas sector in NL (2017) ............................................ 15
Table 8: Consumer spending generated by the offshore oil and gas sector in NL (2017) ............................................ 15
Table 9: Tax and royalty revenue generated for provincial and local governments – 2017 estimate .......................... 16
Table 10: Summary economic impact of the Newfoundland and Labrador offshore oil and gas sector (2017) ........ 17
Table 11: Increase in employment supported by offshore oil and gas in Newfoundland and Labrador .................... 25
Table 12: Forecasted economic impact from the NL offshore oil and gas sector (2033) .............................................. 27
Table 13: Royalty and tax revenue sensitivity to the price of Brent crude (2029-2045) .................................................. 28
FIG
UR
ES
AN
D T
AB
LES

5
Summary of Findings
This report evaluates the economic impact of Newfoundland and Labrador’s offshore oil and gas industry now and projects the potential increase in economic impact in the province and across the country if the Advance 2030 production targets are achieved.
Newfoundland and Labrador’s offshore oil and gas industry is:
• An important driver of economic activity and tax/royalty revenue for the province including contributing 23 percent of provincial gross domestic product (GDP) in 2017, supporting 23,509 jobs (direct, indirect and induced), $2 billion worth of labour income and $1.4 billion worth of consumer spending across the province. It also generated $1.4 billion worth of tax and royalty revenue to support provincial and local government spending (see Sections 2.3-2.5).
• Benefiting the entire province. The average wage for all industries has gone from 13 percent below the national average in 1998 to six percent above by 2017. Between 2001 and 2017, the average wage in the province’s professional services sector has risen 46 percent faster than the sector across Canada. The average wage in the personal services sector has risen 55 percent faster and in the retail trade sector 26 percent faster when compared to the country as a whole. Since 2000, average personal income outside the St. John’s metropolitan area (CMA) has risen faster than in the CMA (see Section 2.2).
• A significant contributor to Canada’s economy generating in other provinces an estimated $1.4 billion worth of GDP, 10,697 jobs, $755 million in labour income and $561 million worth of consumer spending in 2017. The federal and other provincial governments benefit from $680 million worth of tax revenue as a result of Newfoundland and Labrador’s offshore oil and gas industry. For every direct job in Newfoundland and Labrador’s offshore oil and gas industry, there are 1.8 jobs created in the rest of Canada (see Section 2.6).
The provincial government’s Advance 2030 roadmap for the development of the offshore oil and gas industry envisions output rising to over 650,000 barrels of oil equivalent per day by 2030. This report models an offshore investment scenario that would reach that output level. If the goal is achieved, by 2033, Newfoundland and Labrador’s offshore oil and gas industry has the potential to:
• Increase total employment supported by the industry across the province to 56,000 jobs (direct, indirect and induced); boost labour income across the province to $4.6 billion per year; increase consumer spending to $3.5 billion per year and increase provincial and local government tax and royalty payments to $6.7 billion in 2033 including the impact of Nalcor Energy’s equity stake in the projects (see Sections 3.3-3.5).
• Substantially expand the industry’s contribution to the rest of Canada’s economy. In 2033, the industry would support 22,737 jobs in other provinces, $1.6 billion worth of labour income, $1.2 billion worth of consumer spending and $3.3 billion worth of tax revenue to the federal government and other provincial governments. In 2033, for every direct job in Newfoundland and Labrador’s offshore oil and gas industry, there will be an estimated 2.3 jobs created in the rest of Canada.
Cumulative impacts: If the Advance 2030 targets are reached, the economic impact model estimates that between 2018 and 2045, the total royalty and tax revenue will be in excess of $100 billion (in 2018 dollars) (See Section 3.6).
Sensitivity analysis: The model is based on the U.S. Energy Information Administration estimates for the future price of Brent crude. Section 3.7 shows that even if the price of Brent drops by 20 percent from the forecast, the tax and royalty benefits will still be substantial.

6
1. Introduction
1.1 Background The offshore oil and gas industry has only been a major part of the Newfoundland and Labrador economy for a little more than two decades. The first commercial oil production started in 1997 and the sector rapidly became the most important industry in terms of both gross domestic product (GDP) and the generation of tax and royalty revenue for the provincial government. In 2017, the sector remains a main driver of the provincial economy.
As this report will show, a substantial increase in offshore oil and gas output could significantly change the fiscal picture for the provincial government. However, given the long development cycle for offshore projects, the potential tax and royalty gains are likely still a number of years away.
1.2 Purpose of this reportThe purpose of this report is to show how the oil and gas industry impacts the Newfoundland and Labrador economy and how potential growth in output in the years ahead could benefit the province. Specifically, the report will address:
• The current economic impact of the offshore oil industry on the Newfoundland and Labrador economy, including:
o Estimates of economic activity (gross domestic product), employment, taxation/royalties, and consumer spending in the province. This includes direct, supply chain/indirect and induced effects.
o Estimated economic impacts in the rest of Canada.
• A broader narrative about the industry’s importance to the province’s economy and society.
• The economic impact from expanding the industry’s output in the coming years - including an estimate of tax and royalty benefits.
1.3 The economic impact modelThe economic impact model used to estimate how the offshore oil industry is directly impacting the economy is based on Statistics Canada’s Input-Output (I-O) tables which provide a detailed profile of how expenditures in specific sectors flow through the provincial and national economy, as well as through international trade. The I-O tables are developed using actual spending patterns within specific industries and provinces and, as a result, estimates of new economic activity are based on the expenditure profile of previous activity in those industries. The economic impact model evaluates the direct, indirect, and induced economic impacts, using the following parameters:
• Direct impact measures the value-added to the economy that is attributed directly from the employees, the wages earned, and the revenues generated from the Newfoundland and Labrador offshore oil and gas industry.
• Indirect impact measures the value-added generated within the provincial and national economies through firm and organizational demand for intermediate inputs or other support services (e.g. the supply chain).
• Induced impacts are derived when employees in the aforementioned industries spend their earnings and owners spend their profits. These purchases lead to more employment, higher wages, and increased income and tax revenues, and can be felt across a wide range of industries.

7
The I-O tables trace the impact of economic activity (output shock) on the provincial and national economies (including imports and exports). In addition to the GDP and employment impacts, the economic impact model estimates the amount of tax revenue supported by the industry, as well as consumer spending impacts.
Table 2 shows the industries used in the model. Industry code BS23C200 Oil and gas engineering construction was used to estimate impact of the annual spending on infrastructure, drilling, etc. and code BS211113 Oil and gas extraction was used to estimate impact from annual oil and gas extraction activity.
Statistics Canada’s estimates of the economic impact associated with oil and gas engineering construction and oil and gas extraction in Newfoundland and Labrador do not include the impact of royalty payments being spent by government on public services. As a result, the economic impact model also includes an estimate of the effect of royalty payments being spent by government on services such as health care and education to provide a true picture of the industry’s impacts. Other sources and assumptions are developed in Section 6 and in Appendix A.
1.4 Estimating future economic impactsThe economic impact estimates for 2033 (developed in Section 6) are based on the same Statistics Canada I-O tables described above. Other sources and assumptions are developed in Appendix A.
Table 1: The Economic Impact Model
Direct effect - within Simple multipliers (direct and indirect) Total multipliers (direct, province (where available) - within province and rest of Canada indirect and induced) - within province and rest of Canada• Output • Output • Output• GDP basic price • GDP basic price • GDP basic price• Labour income • Labour income • Labour income• Jobs • Jobs • Jobs• Consumer spending • Consumer spending • Consumer spending• Taxation • Taxation • Taxation
Table 2: Sectors included in the economic impact model
Industry: Title: Included:
BS23C200 Oil and gas engineering construction To estimate impact of the annual spending on infrastructure, drilling, etc.
BS211113 Oil and gas extraction To estimate impact from annual oil and gas extraction activity

8
2. Offshore oil and gas: Setting the stage
2.1 Offshore oil and gas: A game changer for Newfoundland and LabradorNot long after the offshore oil started to flow, the oil and gas extraction sector became the largest industrial contributor to the provincial economy measured by gross domestic product (GDP) contribution. In 1998, the industry contributed $1.9 billion to the provincial GDP (in chained 2007 dollars) and that contribution steadily rose to a period between 2002 and 2011 when the GDP contribution averaged $8 billion per year. Mainly driven by the decline in the price of oil, the GDP contribution has declined somewhat since 2011 but it is still a substantial economic driver for the provincial economy. In 2017, it’s contribution was $6.1 billion worth of real GDP or 23 percent of the total economy.
To put the impact into historical context, Figure 2 shows the GDP contribution from oil and gas extraction in Newfoundland and Labrador as a share of total provincial GDP per year since 1997. The GDP contribution surpassed 30 percent of the total in 2002 and remained in that range until 2012. The industry still contributes nearly a quarter of provincial GDP.
Figure 1: Real GDP from oil and gas extraction: Newfoundland and Labrador
$Billions*
Figure 2: GDP from oil and gas extraction as a share of total provincial GDP - Newfoundland and Labrador*
*Chained (2007) dollars. Source: Statistics Canada.
*Chained (2007) dollars. Source: Statistics Canada.

9
The second largest sector by GDP contribution in the province, construction, contributed 9.5 percent to provincial GDP and this sector is heavily influenced by the oil and gas industry. In fact, oil and gas has been one of the main drivers of construction activity as will be developed below. Figure 3 shows the top industries in Newfoundland and Labrador by GDP contribution.
When compared to other provinces, only Alberta has a larger oil and gas sector as measured by its impact on the provincial economy (Table 3). Saskatchewan and British Columbia generate more GDP in absolute terms, but as a share of the provincial economy both provinces have smaller oil and gas sectors.
Table 3: Oil and gas extraction - GDP contribution by province (2017)
GDP % of total $Billions* provincial GDP
Newfoundland and Labrador $ 6.08 22.7%
Nova Scotia $ 0.28 0.8%
New Brunswick $0.002 0.01%
Ontario $ 0.10 0.0%
Manitoba $ 0.92 1.6%
Saskatchewan $ 9.10 15.0%
Alberta $88.08 28.9%
British Columbia $ 8.22 3.6%
*Chained (2007) dollars. Source: Statistics Canada.
Figure 3: Largest industries by GDP contribution (% of total GDP) - Newfoundland and Labrador*
*In 2017. Source: Statistics Canada.

10
Table 4: Oil and gas extraction capital expenditures in Newfoundland and Labrador
Year CAPEX $Billions % of all CAPEX*
2013 $3.2 40%
2014 $5.0 50%
2015 $4.3 42%
2016 $3.8 41%
2017 $2.5 29%
5-year total $18.9 40%
*CAPEX = capital expenditures. Based on Statistics Canada Table 34-10-0035-01 - Capital and repair expenditures, non-residential tangible assets, by industry and
geography. Includes the public and private sectors.
Source: Statistics Canada.
The oil and gas sector in Newfoundland and Labrador is also a major contributor to overall capital expenditures within the province. As shown in Table 4, the oil and gas extraction sector made $18.9 billion worth of capital expenditures in the province in total between 2013 and 2017 – an amount equivalent to 40 percent of all capital expenditures across the total economy.
2.2 Distributed benefits: Offshore oil and gas - A rising tide lifts all boatsThrough its capital expenditures and the economic impact of oil and gas extraction, the revenue generated from the offshore oil and gas industry results in billions of dollars spent and recirculated throughout the provincial economy each year. This boost in the size of the economy has benefitted all residents of the province in a variety of ways, from increasing wages to increased public spending. As shown in Figure 4, before the introduction of the oil and gas extraction sector, the overall average weekly wage in Newfoundland and Labrador for all industries combined was 13 percent below the Canadian average (in 1998). By 2017, the average weekly wage in the province had surpassed the rest of the country and is now six percent higher than the Canadian average.
Figure 4: Average weekly wage: All industries combined, Newfoundland and Labrador, Canada*
*including overtime. Source: Statistics Canada Survey of Employment, Payrolls and Hours.
11
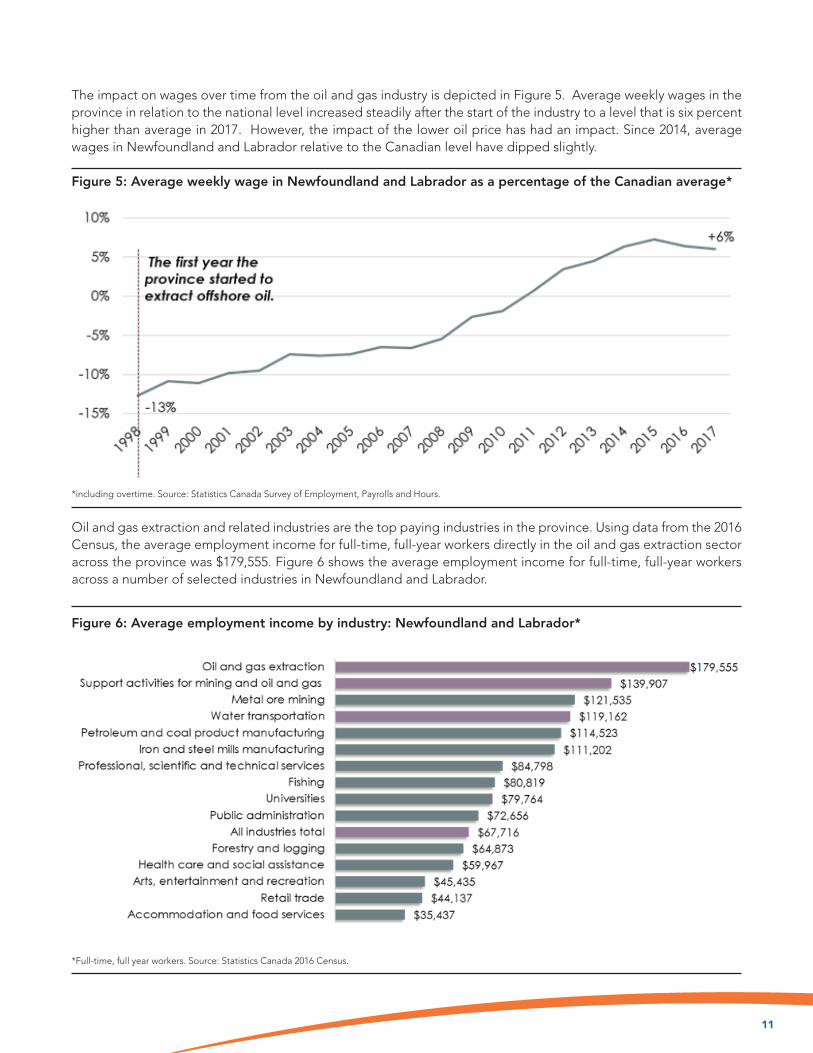
The impact on wages over time from the oil and gas industry is depicted in Figure 5. Average weekly wages in the province in relation to the national level increased steadily after the start of the industry to a level that is six percent higher than average in 2017. However, the impact of the lower oil price has had an impact. Since 2014, average wages in Newfoundland and Labrador relative to the Canadian level have dipped slightly.
Figure 5: Average weekly wage in Newfoundland and Labrador as a percentage of the Canadian average*
*including overtime. Source: Statistics Canada Survey of Employment, Payrolls and Hours.
Oil and gas extraction and related industries are the top paying industries in the province. Using data from the 2016 Census, the average employment income for full-time, full-year workers directly in the oil and gas extraction sector across the province was $179,555. Figure 6 shows the average employment income for full-time, full-year workers across a number of selected industries in Newfoundland and Labrador.
Figure 6: Average employment income by industry: Newfoundland and Labrador*
*Full-time, full year workers. Source: Statistics Canada 2016 Census.

12
Table 5: Cumulative increase in average weekly wage by industry (2001-2017)*
Canada Newfoundland and Labrador
All industries +49% +75%
Health care +56% +60%
Education +51% +54%
Retail trade +39% +49%
Professional services +50% +73%
Personal services +58% +90%
*including overtime. Source: Statistics Canada Survey of Employment, Payrolls and Hours.
Figure 7: Wage premium for oil and gas related industries - Newfoundland and Labrador*
*Compared to the average wage for all full-time, full year workers. Source: Statistics Canada 2016 Census.
The wage benefits are not restricted to workers in the oil and gas extraction industry. Other related industries also saw significant growth in wages after the introduction of the oil and gas sector in the late 1990s. For example, workers in the “support activities for mining and oil and gas” sector earn more than double the provincial average and workers in the water transportation sector, a key support industry, earn 79 percent more.
But have the wage and income benefits extended beyond the oil and gas and related sectors? There is evidence to suggest the economic boost from the industry has benefitted personal income more broadly.
First, the average weekly wage for all industries, as discussed above, has risen rapidly since 1998. Wage gains, relative to the national economy, have occurred across many sectors. One way to depict this is the cumulative increase in average weekly wages. Statistics Canada compiles comparative data on weekly wages from its Survey of Employment, Payrolls and Hours. Comparing the change in average weekly wages from 2001 to 2017 reveals that wage growth in Newfoundland and Labrador has been broad-based. As shown in Table 5, wage growth in the province outpaced the national economy across a wide range of public and private sectors. Professional services (e.g. legal, accounting, engineering, etc.) and personal services (hairstylists, auto repair, etc.) witnessed strong gains compared to the country as a whole.
It is impossible to conclude definitively that the oil and gas industry was the main reason why workers in the Newfoundland and Labrador personal services industry (i.e. hairdressers, auto repair, etc.) saw average wages rise by 90 percent since 2001 but the size and scope of the industry and its contribution to the province’s economy suggests it played an important role in those wage gains.

13
Finally, there is one other data point that supports the theory that income benefits from the oil and gas sector are broad-based. Statistics Canada publishes annual data on income levels for the St. John’s Census Metropolitan Area (CMA)1 and the province as a whole. This data is based on income tax filings and therefore is a very good representation of income levels. When comparing this data for 2000 and 2016 (the latest year for which the data is available), average personal income outside of the St. John’s CMA increased faster than in the metropolitan area itself between 2000 and 2016. In the St. John’s CMA, average personal income (from all sources) increased by 89 percent between 2000 and 2016. Extracting the St. John’s CMA data from the provincial figures and the rest of the province witnessed a 98 percent increase in average personal income. It is important to note that average personal income is still much higher in the St. John’s CMA compared to the rest of the province ($52,000 versus $40,400) but the growth rate has actually been faster outside the metropolitan area since 2000.
2.3 Estimating the current economic impact from offshore oil and gasSections 2.1-2.2 above considered how the introduction of the offshore oil and gas sector in Newfoundland and Labrador positively impacted the provincial economy. This section estimates how the 2017 direct and supply chain spending from the industry impacted the provincial and national economies. The economic impact model here estimates the industry impacts employment, labour income, taxation and consumer spending in the province and across the country. The offshore oil and gas sector impacts the economy in several ways:
• The impact of operational expenditures (OPEX) as oil and gas is extracted and transported to market.
• The impact of capital expenditures (CAPEX) associated with existing fields and new exploration.
• The impact of royalty payments expended on public services in the province. For this model, it was assumed that 50 percent of the offshore oil royalty payments in fiscal 2017 collected by the provincial government would be spent on hospitals, 25 percent on educational services and 25 percent on provincial government administration. This is approximately the historical distribution of provincial government spending.
Employment and income impactsIn 2017, in addition to the output from oil and gas extraction, the offshore oil and gas sector generated $2.5 billion worth of capital expenditures. While a significant share of this investment went towards the purchase of equipment and components produced elsewhere, the remaining capital spending supported nearly 3,000 direct jobs in the province. There was also $920 million worth of royalty payments to the provincial government that was used to pay for public services and other provincial government spending2.
1The metropolitan area includes the cities of St. John’s and Mount Pearl and the towns of Bauline, Bay Bulls, Conception Bay South, Flatrock, Logy Bay-Middle Cove-Outer Cove, Paradise, Petty Harbour-Maddox Cove, Portugal Cove-St. Philip’s, Pouch Cove, Torbay, and Witless Bay.2 Provincial government royalty payments are taken from the government’s main estimates document and are for the fiscal year 2016-2017. The rest of the data inputs for the model are based on the calendar year for 2017.
Figure 8: Full-time equivalent (FTE) jobs created in Canada as a result of NL oil and gas sector (2017)
*includes oil and gas extraction and capital expenditures. **includes the impact associated with royalty payment spending.
Total: 34,206

14
The direct jobs associated with oil and gas extraction and with capital spending by the industry supported 5,915 full-time equivalent (FTE) jobs in 2017. Supply chain spending, induced impacts and the jobs supported by the payment of royalties in Newfoundland and Labrador supported another 17,594 jobs across the province. The economic activity supported by the oil and gas industry in Newfoundland and Labrador boosted employment in the rest of the country by another 10,697 jobs. Overall, over 34,000 jobs across Canada were supported by the oil and gas industry in Newfoundland and Labrador.
On average, these are high wage jobs. The 5,915 direct jobs in Newfoundland and Labrador generated $707 million worth of labour income, resulting in an average employment income of $119,000 per year. In total, the oil and gas sector supported just under $2 billion worth of labour income in Newfoundland and Labrador and another $755 million in the rest of the country. The average labour income per FTE across Canada was $80,300.
Figure 8 above shows the summary direct, indirect and induced employment impacts in Newfoundland and Labrador and across the country. Table 6 provides a more detailed look at estimated employment and labour income supported by the industry in the province and across the rest of the country.
Table 6: Employment and labour income from the offshore oil and gas sector in Newfoundland and Labrador
OPEX CAPEX Impact from Royalties Total impact
Direct economic impact (NL only)
Jobs (FTE) 3,039 2,876 5,915
Labour income ($000s) $477,306 229,558 $706,864
Average labour income per FTE $119,503
Total economic impact (NL only)
Jobs (FTE) 8,696 4,943 9,870 23,509
Labour income ($000s) $902,991 $397,934 $690,761 $1,991,686
Average labour income per FTE $84,720
Total economic impact - rest of Canada (excl. NL)
Jobs (FTE) 6,492 2,453 1,752 10,697
Labour income ($000s) $479,776 $182,779 $92,338 $754,894
Average labour income per FTE $70,570
Canada-wide economic impact
(incl. NL)
Jobs (FTE) 15,187 7,396 11,623 34,206
Labour income ($000s) $1,382,768 $580,713 $783,099 $2,746,580
Average labour income per FTE $80,295
See Appendix A for methodology and sources.
Consumer spending impactsThrough direct, supply chain, induced effects and from the impact of royalty payments, the oil and gas sector in Newfoundland and Labrador generates an amount equivalent to 14.6 percent of all labour income earned across the province. To put it another way, 14.6 cents out of every dollar worth of labour income comes from the oil and gas sector. The vast majority of this income is spent in the province by households on goods and services

15
As shown in Table 7, an estimated $1.45 billion worth of consumer spending in Newfoundland and Labrador was generated by the offshore oil and gas sector in 2017 and another $561.5 million in the rest of Canada. The largest top line spending category was shelter, which includes mortgage payments, rent, utilities and related property taxes.
Table 7: Consumer spending generated by the offshore oil and gas sector in Newfoundland and Labrador (2017)
Top level spending categories - $Millions
In NL Rest of Canada Total
Total current consumption $1,446.5 $561.5 $2,008.0
Food expenditures $238.1 $80.6 $318.7
Shelter $344.8 $159.2 $504.0
Transportation $299.3 $114.0 $413.4
Recreation $108.0 $38.9 $146.9
Health care and education $74.3 $35.4 $109.7
Source: Derived using Statistics Canada Survey of Household Spending. Based on the fourth quintile household spending.
Using Statistics Canada’s Survey of Household Spending, a more detailed estimate of how the consumer spending flows through the provincial and national economies can be developed. Table 8 shows the spending by a few selected categories. Restaurants are a significant benefactor. As a result of the oil and gas industry, the restaurant sector in Newfoundland and Labrador generates nearly $66 million in annual revenue. The insurance sector, broadly defined, generates over $122 million worth of revenue and the communications sector another $66 million. Section 3.4 below provides a more detailed review of consumer spending by category and the expected boost in spending in the future from an expansion of the oil and gas sector.
Table 8: Consumer spending generated by the offshore oil and gas sector in Newfoundland and Labrador (2017)Selected spending categories
Spending category: In NL Rest of Canada Total
Food purchased from restaurants $65,864,630 $22,178,756 $88,043,386
Insurance products/premiums (home, auto, health, etc.) 122,293,423 41,816,196 164,109,618
Gifts of money, support payments and charitable contributions 43,040,663 16,672,572 59,713,235
Eye care and dental services (includes eyewear, 9,373,760 5,960,541 15,334,300
exams, minor surgery, etc.)
Clothing and accessories (women, men and children’s clothing) 84,715,613 29,864,311 114,579,924
Household furnishings and equipment (includes furniture, 61,415,716 18,928,952 80,344,667
art, appliances and equipment)
Communications (telephone, internet, etc.) 66,092,249 19,937,777 86,030,026
Source: Derived using Statistics Canada Survey of Household Spending. Based on the fourth quintile household spending.

16
Taxation and royalty impactsThe offshore oil and gas sector is a significant generator of tax and royalty revenue. Taxes are generated from the spending of labour income, from corporate profits and other sources. Because of the high average wages in both the sector directly and in its supply chain, offshore oil and gas generates significantly more personal income tax compared to the average industry in the province.
Royalty revenues are paid based on the price of oil and on production levels. Between 2010 and 2014, the offshore oil and gas sector generated an average of $2.2 billion worth of royalty revenue for the provincial government. Between 2015 and 2017, the average annual royalty amount dropped to $793 million per year. In 2018, it is estimated to be $975 million.
The economic impact model estimates how much tax revenue is generated for local, provincial and federal governments, including sales tax (HST), personal income tax, property taxes and other indirect taxes. The provincial royalty revenue amount was taken from provincial government budget documents. Table 9 shows the estimated tax and royalty revenue generated for provincial and local governments as a result of the oil and gas sector in Newfoundland and Labrador for 2017. In total, the industry contributed over $1.4 billion worth of tax and royalty revenue to provincial and local governments.
Table 9: Tax and royalty revenue generated for provincial and local governments as a result of the oil and gas sector in Newfoundland and Labrador ($Millions) – 2017 estimate
Personal income tax $210.6
Harmonized sales tax $116.6
Property tax $30.0
Other indirect taxes $145.2
Offshore royalties $919.8
Total taxes and royalties $1,422.1
See Appendix A for methodology and sources.
There is significant tax revenue generated elsewhere in Canada from the offshore oil and gas sector in Newfoundland and Labrador. The federal government and other provincial governments benefitted from an estimated $680 million worth of tax revenue in 2017 (See Table 10 below and Appendix A for sources and methodology).
Summary economic impactsIn summary, the operating and capital expenditures of the offshore oil and gas sector in Newfoundland and Labrador supported an estimated 23,509 full-time equivalent (FTE) jobs in the province in 2017, generating an estimated $1.99 billion worth of labour income. This labour income resulted in $1.5 billion worth of consumer spending across the province. Direct, indirect and induced taxes for provincial and local government came in at an estimated $502 million and royalty revenue was $920 million. In the rest of Canada, the Newfoundland and Labrador offshore oil and gas sector supported nearly 10,700 FTE jobs, $755 million in labour income, $550 million in consumer spending and $680 million in tax revenue to federal, provincial and local governments.
In total, the Newfoundland and Labrador offshore oil and gas sector supported an estimated 34,206 jobs across the country, $2.75 billion in labour income, $2.05 billion in consumer spending and $2.1 billion worth of tax and royalty revenue for all levels of government.

17
Table 10: Summary economic impact of the Newfoundland and Labrador offshore oil and gas sector (2017)
Direct, indirect and induced impact: In NL Rest of Canada Total impact:
Employment (FTE) 23,509 10,697 34,206
Labour income $1.99 billion $755 million $2.75 billion
Consumer spending $1.5 billion $550 million $2.05 billion
Taxes $502 million $680 million $1.18 billion
Royalties $920 million $920 million
Includes the impacts from oil and gas extraction, related capital expenditures and spending arising from royalty payments.
FTE = full-time equivalent employment.
Total impact includes supply chain (indirect) and induced economic effects. Taxes exclude corporate income tax.
See Appendix A for methodology and sources.
2.4 Putting the industry’s economic impact into perspectiveNewfoundland and Labrador’s offshore oil and gas sector generated an estimated 14.6 percent of all the labour income generated in the province during 2017 through direct, indirect and induced effects. To put it another way, nearly 15 cents out of every $1.00 worth of labour income across the entire province came as a result of the offshore oil and gas sector.
The $1.42 billion worth of tax and royalty revenue for provincial and local governments in 2017 represented an amount equivalent to 28 percent of all provincial government “own source” generated revenue (i.e. excluding federal government transfers).
The direct, indirect and induced economic activity associated with the offshore oil and gas sector supports a significant number of jobs across the province. More than eight percent of all provincial employment is due directly or through supply chain and induced effects to the oil and gas extraction industry3.
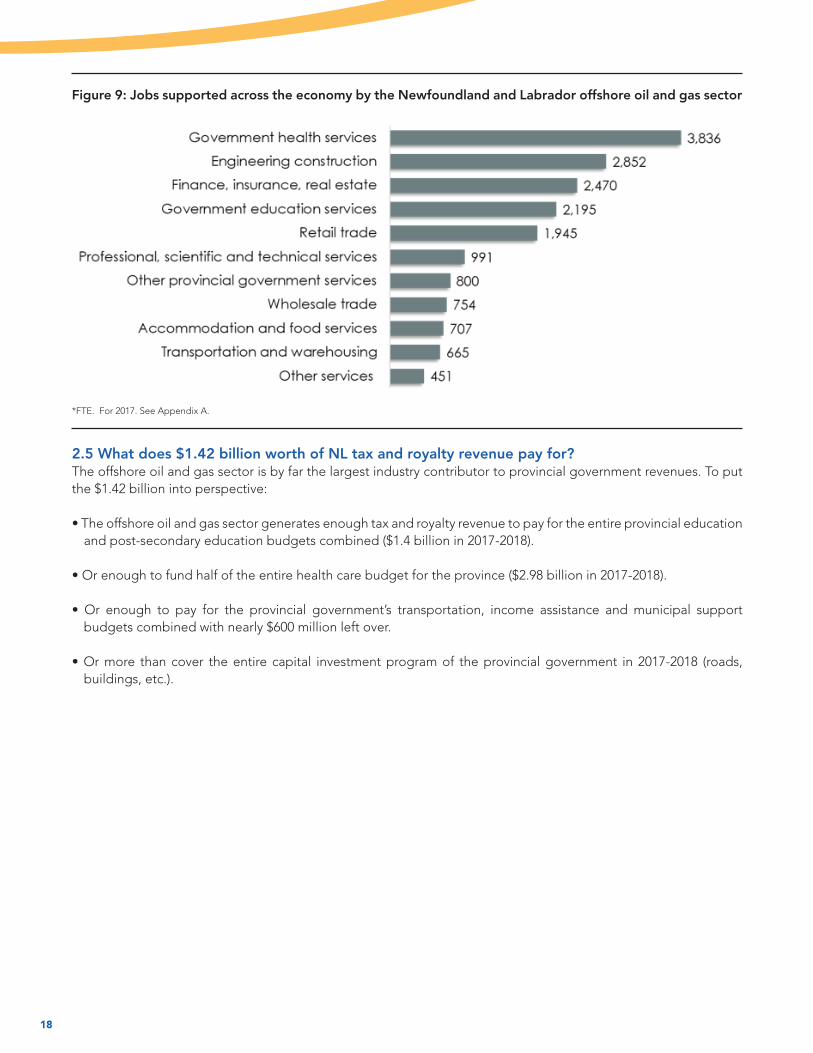
The economic impact model estimates the FTE job creation by sector across the economy. Figure 9 shows the number of jobs supported across the economy by the Newfoundland and Labrador offshore oil and gas sector. It includes the estimated employment impacts associated with the $920 million worth of royalty payments.
The offshore oil and gas sector generates enough economic activity to support more than 3,800 jobs (FTE) in health care; 2,500 jobs in finance, insurance and real estate; 2,200 jobs in education; nearly 2,000 jobs in the retail trade, nearly 1,000 in professional services and more than 700 in the accommodation and food services sector across the province.
3 E.g. the number of jobs supported by the industry is an amount equivalent to eight percent of everyone in the province who earned employment income in 2017.
18
Figure 9: Jobs supported across the economy by the Newfoundland and Labrador offshore oil and gas sector
*FTE. For 2017. See Appendix A.
2.5 What does $1.42 billion worth of NL tax and royalty revenue pay for?The offshore oil and gas sector is by far the largest industry contributor to provincial government revenues. To put the $1.42 billion into perspective:
• The offshore oil and gas sector generates enough tax and royalty revenue to pay for the entire provincial education and post-secondary education budgets combined ($1.4 billion in 2017-2018).
• Or enough to fund half of the entire health care budget for the province ($2.98 billion in 2017-2018).
• Or enough to pay for the provincial government’s transportation, income assistance and municipal support budgets combined with nearly $600 million left over.
• Or more than cover the entire capital investment program of the provincial government in 2017-2018 (roads, buildings, etc.).

19
2.6 Economic impacts outside Newfoundland and Labrador It is important to note the industry’s economic footprint extends well beyond the province of Newfoundland and Labrador. The economic impact model estimates how much supply chain spending and induced economic activity is generated in other provinces. The offshore oil and gas sector in Newfoundland and Labrador supports nearly 10,700 full-time equivalent (FTE) jobs elsewhere in Canada as a result of the Newfoundland and Labrador offshore oil and gas sector. Ontario is the largest beneficiary with nearly 5,000 jobs in the province supported by the industry. There are more than 1,600 jobs in the three other Atlantic Provinces supported by the industry.
In total, the spending of the offshore oil and gas sector in Newfoundland and Labrador generated an estimated $755 million worth of labour income in the rest of Canada. Overall, the sector boosted GDP in the rest of Canada by more than $1.4 billion.
The offshore oil and gas sector in Newfoundland and Labrador also generates considerable tax revenue in the rest of Canada. In total, the economic impact model estimates the industry generates some $680 million worth of tax revenue to pay for public services and infrastructure in the other provinces and territories.
Figure 10: Estimated jobs supported across Canada from the Newfoundland and Labrador offshore oil and gas sector*
*FTE in 2017. See Appendix A.

20
3. Estimating the future economic impact from the offshore oil and gas sector
The economic impact model can be used to estimate the future economic contribution of the offshore oil and gas industry in Newfoundland and Labrador. In the last few years, Nalcor Energy Oil and Gas, the province’s crown corporation, has been involved in what is described as “one of the largest seismic programs in the world.”4 It has been leading the exploration of the province’s frontier and deepwater basins by making investments in geoscience data and analysis used to evaluate undiscovered oil and gas resource potential. Nalcor Energy Oil and Gas is also a working interest partner in three offshore developments: the Hebron oil field; the White Rose Growth Project; and the Hibernia Southern Extension.
Driven in large part by Nalcor Energy’s investment in exploration and seismic surveying, there have been a number of new entrants over the last several years which resulted in significant work commitment bids during the global downturn.
3.1 Advance 2030 – Guiding the industry’s developmentIt is clear there is significant potential to further develop the province’s offshore oil and gas industry. In February 2018 the provincial government released its Advance 2030 plan which provides a roadmap for the industry’s development over the next decade. The vision is for “Newfoundland and Labrador to be an internationally preferred location for oil and gas exploration and development driven by an innovative, sustainable, local industry that is globally competitive, environmentally responsible and maximizes benefits to the people of the province.”The Advance 2030 plan envisions:
• Over 100 new exploration wells drilled by 2030.
• Over 650,000 barrels of oil equivalent per day from existing and new projects and potentially rising even further in subsequent years.
• Direct employment of more than 7,500 people.
Figure 11 shows the potential scale of the development opportunity. In 2013 a scheduled land tenure system was implemented to provide increased timeframes for calls for bids in more frontier areas of the Canada-Newfoundland and Labrador Offshore Area. The first license round closed in late 2015 and future license rounds are scheduled through 2021. Each round follows the same process with detailed independent resource assessments being conducted over relevant areas with results released prior to bid closing. To date, these independent assessments estimate the combined potential in less than seven percent of the province’s offshore to be 49.2 billion barrels of oil and 193.8 trillion cubic feet of gas. There has been $2.6 billion in recent exploration work commitments.
4 https://nalcorenergy.com/nalcor-operations/oil-and-gas/at-a-glance/

21
Figure 11: Offshore Newfoundland and Labrador oil and gas reserves
Source: Nalcor Energy.
3.2 Offshore Newfoundland and Labrador oil and gas in the global contextAccording to the International Energy Agency (IEA), the U.S. Energy Information Administration (EIA) and many private sector forecasts, the demand for oil will remain significant for decades to come. At the Advance 2030 target level of 650,000 barrels per day in 2030, the Newfoundland and Labrador offshore oil and gas sector would supply only 0.65 percent of world demand. Even if the forecasts turn out to be wrong and global demand for oil drops well below the forecasts, Newfoundland and Labrador’s relatively small production target of 650,000 barrels per day by 2030 would still be below one percent of global demand at that time.

22
3.3 The economic impact from offshore oil and gas in 2033: Impact model assumptionsWhat could be the economic impact of the offshore oil and gas sector in Newfoundland and Labrador in the future? In order to estimate the future impact, an economic impact model was developed using the Statistics Canada input-output tables, input from Noia and Nalcor Energy, and from reviewing recent provincial government and Canada-Newfoundland and Labrador Offshore Petroleum Board (C-NLOPB) publications related to the industry. The model assumes that production from existing fields will peak at 336,000 barrels per day in 2023 and that three new moderately sized fields will come into production between 2027 and 2029. These assumptions lead to the province achieving its Advance 2030 target of 650,000 barrels per day by 2030.
Figure 12 shows the projected barrels per day profile from 2018 to 2035 as used in the economic impact model. They represent a realistic development scenario if the province is to hit its target of 650,000 barrels per day by 2030. In addition, the model does not include any additional developments beyond 2030. It is solely based on the development of three new moderately sized fields coming into production within the next decade and sustaining production into the 2040s.
Figure 12: Newfoundland and Labrador offshore oil and gas sector - Projected barrels per day profile (000s)
See Appendix A for methodology and sources.
In order to develop these new fields, a significant amount of capital will need to be invested in the offshore. The economic impact model includes both the expected capital outlays associated with the existing fields and the new investment needed to develop the three new fields. The capital and operating cost profile for new and existing fields was developed with input from Nalcor Energy using an industry standard approach for the offshore. Figure 13 shows the estimated capital investment required in the offshore to reach the 650,000 barrels/day target by 2030. All the figures are shown in 2018 dollars.
Provincial Equity PartnershipsNalcor Energy - Oil and Gas is currently a working interest partner in three offshore developments: the Hebron oil field, the White Rose Growth Project and the Hibernia Southern Extension. Equity investments enable the province to maximize the value of its resources through the creation of an additional revenue stream for the province. To date, Nalcor Energy - Oil and Gas has produced approximately 15 percent of its current equity reserves, resulting in over $720 million in revenues. These investments will offer an additional dividend for the province should the oil and gas sector develop as outlined in this report. The significant government revenue projections forecasted below in Section 3.4 includes the impact of Nalcor Energy’s equity stake in the projects.

23
Based on the capital investment profile and the production target of 650,000 barrels per day by 2030, the economic impact model assumes there will be $37 billion worth of new capital expenditures between 2018 and 2033. This represents approximately $2.3 billion worth of new capital expenditures, on average, per year over this timeframe. Peak capital expenditures of an average of over $6 billion per year will occur between 2023 and 2027.
Figure 13: Estimated capital investment pattern in Newfoundland and Labrador required to reach 650,000 barrels/day by 2030 ($millions)
All values are shown in 2018 dollars. See Appendix A for methodology and sources.
Another very important assumption in the model is the price of crude oil as royalty and corporate income tax payments are highly sensitive to price fluctuations. For the model, the future price for Brent crude (in 2017 dollars per barrel) was used as forecasted by the U.S. Energy Information Administration5. See Appendix A for other model parameters and assumptions.
The year 2033 was chosen as the future comparison year because it is the point at which royalty payments from the offshore oil and gas sector accelerate dramatically. In the first few years of new production firms pay less royalties as the government’s royalty regime allows for accelerated capital cost recovery.
3.4 Economic impact from offshore oil and gas in Newfoundland and Labrador: 2033The economic impact model for 2033 projects offshore oil and gas could significantly expand its contribution to the provincial economy in terms of jobs, labour income, consumer spending and tax/royalty revenues. The royalty payment alone will be an estimated $5.1 billion (in 2018 dollars) that year. Instead of assuming this full amount would be spent on public services in the 2033 year, the model assumes that 50 percent was set aside to either pay down provincial debt or some other purpose (see inset).
Why not assume the full royalties would be spent in the economy?The estimated royalty payment for 2033 of $5.1 million (in 2018 dollars) represents an amount larger than the entire amount of revenue raised by the provincial government in fiscal 2017-2018. Taking this high level of revenue and directly expending it on public services and public infrastructure would likely lead to inflation and could overheat the economy. It is likely the provincial government will continue to carry a significant public debt by 2033 and using at least a portion of the royalties to pay down some portion of debt could be a good option. See Section 3.8 below for more on the impact of royalty revenue.
5U.S. Energy Information Administration. International Petroleum and Other Liquids Supply, Disposition, and Prices (June 2018).

24
In that year, the economic activity from the new fields (and the residual economic activity from the existing fields) will result in an economic contribution from the offshore oil and gas sector as follows:
• Employment rising from 23,509 FTEs in 2017 to 56,000 FTEs supported across the province through direct, indirect and induced effects (from oil and gas construction, exploration and production, as well as the substantial spinoff activity)*. This level of employment is equivalent to 19 percent of total provincial employment (all industries) today.
• Labour income rising from $1.99 billion in 2017 to $4.6 billion in 2033*.
• Consumer spending rising from $1.5 billion in 2017 to $3.5 billion across the province in 2033.
• $1.6 billion worth of tax revenue for the province and local governments.
• $5.1 billion worth of offshore oil and gas royalty payments.
*This assumes that 50 percent of royalty revenues are reinvested in the economy in the form of public services and public infrastructure and 50 percent are set aside for other purposes such as debt reduction (i.e. it was not included in the economic impact model).
Employment impacts in Newfoundland and Labrador: 2033Based on the significant increase in oil output, the economic impact model (using Statistics Canada input-output tables) predicts the amount of employment in Newfoundland and Labrador supported by the economic activity generated by the offshore oil and gas industry will rise significantly.
A substantial contribution to this increase in employment arises from the spending associated with tax and royalty payments. The $4.6 billion worth of labour income and the large oil and gas royalty payments will result in the total jobs supported rising from 23,509 today to some 56,000 in 2033.
The new jobs created will be spread across the economy. Table 11 shows the increase in employment by selected industries if the industry is able to expand and hit the Advance 2030 production target. There will be significant growth in the number of jobs in the health care and education sectors supported through tax and royalty revenues. The finance, insurance and real estate sector will add more than 3,000 jobs as there are billions of dollars more being spent each year across the province. The retail trade industry will require an estimated 2,700 more workers to support the growth in retail sales. The number of jobs supported by the oil and gas industry in the accommodation and food services sector will more than double, growing by nearly 1,000 jobs between 2017 and 2033.
Appendix A includes a description of how the economic impact model estimates job creation.

25
Table 11: Increase in employment supported by offshore oil and gas in Newfoundland and LabradorSelected industries
Industry: 2017 2033 Increase:
Government health services* 3,836 9,138 5,302
Engineering construction 2,852 6,795 3,942
Finance, insurance, real estate 2,470 5,885 3,414
Government education services* 2,195 5,229 3,034
Retail trade 1,945 4,634 2,689
Professional, scientific and technical services 991 2,361 1,370
Other provincial government services 800 1,905 1,105
Wholesale trade 754 1,796 1,042
Accommodation and food services 707 1,684 977
*Public sector jobs supported as a result of increased tax and royalty revenues generated by the industry. The model assumes 50 percent of all incremental royalty
revenue will be spent on public services and public infrastructure investment. See Appendix A.
Consumer spending impacts in Newfoundland and Labrador: 2033If the oil and gas sector expands to the level developed in Section 3.3, consumer spending in Newfoundland and Labrador through the direct, indirect and induced impacts arising from the oil and gas sector (including spending 50 percent of royalty payments on public services and public infrastructure) will be an estimated $3.5 billion in 2033, up from $1.5 billion in 2017.
This will have significant impacts across all sectors of the consumer economy in the province. Figure 14 shows the growth in a few selected consumer spending sectors supported by the oil and gas sector between 2017 and 2033. The model assumes that labour income generated by the oil and gas sector will be spent similar to the average household in the province as published by Statistics Canada.
Annual spending on restaurants is forecasted to rise by $93 million to $156 million in 2033. Spending on pets (including food, veterinarian services, etc.) will rise by nearly $20 million per year and spending on clothing and accessories will rise by $119 million. The insurance industry will expand significantly as a result of the growth in oil and gas activity. Life insurance premium spending is forecast to rise by $20 million per year and vehicle insurance premiums will be up by $61 million. Annual homeowner insurance premiums will rise by $26 million.

26
Figure 14: Growth in consumer spending in Newfoundland and Labrador as a result of the expanded oil and gas industry, by selected expenditure category ($Millions)
See Appendix A for sources and methodology.
National economic impacts: 2033The national impacts are shown in Table 12 below. In 2033, the oil and gas sector in Newfoundland and Labrador will boost GDP in the rest of Canada by $3.0 billion. The other provinces will benefit from 22,737 FTE jobs earning an estimated $1.6 billion worth of labour income. This labour income will translate into $1.2 billion worth of consumer spending. Tax revenues to federal and provincial governments outside Newfoundland and Labrador will be an estimated $3.3 billion. Combined, the offshore oil and gas sector in the province in 2033 will support an estimated 78,738 jobs across Canada and royalty/tax revenue of $10 billion.

27
Table 12: Forecasted economic impact from the Newfoundland and Labrador offshore oil and gas sector (2033)*
In NL Rest of Canada Total Canada
Employment (FTE) 56,001 22,737 78,738
Labour income $4.6 billion $1.6 billion $6.2 billion
Consumer spending $3.5 billion $1.2 billion $4.7 billion
Taxes** $1.6 billion $3.3 billion $4.9 billion
Royalties*** $5.1 billion
*Shown in 2018 dollars. Includes the direct, indirect and induced impacts from oil and gas extraction, related capital expenditures and spending arising from royalty
payments in Newfoundland and Labrador. FTE = full-time equivalent employment. Taxes include federal, provincial and local taxes generated across the country.
**Includes corporate income tax payments for both provincial and federal governments. This is a substantial portion of total tax revenues – estimated at $2.6 billion
nation wide in 2033.
***50 percent of royalty payments was not included in the formal economic impact model and assumed to be used for some other purpose such as government
debt reduction or savings.
See Appendix A for methodology and sources.
3.5 Estimating cumulative tax and royalty impacts: 2029-2045Using the same assumptions for the 2033 year, an estimate of the cumulative economic impact from the impact of the new oil and gas activity can be derived for the period 2029 to 2045, which would include the bulk of the production phase of the new fields. For the purpose of the cumulative impacts, only Newfoundland and Labrador economic impacts were modelled. Please note it was assumed that 50 percent of all royalty payments throughout the period would be used to pay down debt or be put in reserve.
If the Advance 2030 target of 650,000 barrels per day is reached and based on the other assumptions in the model, there will be an estimated $81.6 billion worth of royalty and tax revenue for provincial and local governments between 2029 and 2045 or an amount equivalent to $4.8 billion per year in 2018 dollars. Adding in the projected royalty and tax revenue from the capital and operational spending of the existing industry activity between 2018 and 2028, the total royalty and tax revenue impact over the 28-year period 2018 to 2045 is estimated to be in excess of $100 billion (in 2018 dollars).
3.6 Royalty and corporate income tax sensitivity analysisThe economic impact model is forecasting a substantial increase in revenue to the provincial government from royalties and other sources of taxes as a result of the projected growth in the offshore oil and gas sector. A core assumption underpinning the model is that the price of Brent crude will rise to $97/barrel by 2033, which is the official estimate published by the U.S. Energy Information Administration in its latest forecast. Table 13 provides a sensitivity analysis on the royalty and tax revenue that will be generated by the industry should the price decline by 10 percent and 20 percent from the baseline.
To put these figures into context, in fiscal 2017-18 the provincial government raised $4.6 billion in revenue from all provincial tax sources (excluding federal transfers). The economic impact model predicts that using the current forecast for the price of Brent crude, the offshore oil and gas sector itself will generate more revenue for the provincial government than the entire economy generates today ($4.8 billion per average year between 2029 and

28
2045). Even at a 20 percent discount in the price of crude, the model predicts average annual royalty/tax revenue of $3.5 billion throughout the entire 17-year period (2029-2045).
Table 13: Royalty and tax revenue sensitivity to the price of Brent crude (2029-2045)*Revenue to provincial government only
Cumulative revenue 2029-2045 Avg. per year
Baseline – current Brent forecast** $81.6 billion $4.8 billion
Brent price 10% below baseline $70.8 billion $4.2 billion
Brent price 20% below baseline $59.8 billion $3.5 billion
*in 2018 dollars. **U.S. Energy Information Administration forecast. See Appendix A.
3.7 Investing oil and gas royaltiesAs discussed above, the economic impact model projects the industry will generate $4.8 billion worth of tax and royalty revenue in an average year between 2029 and 2045. The economic impact model is based on the assumption that half the royalties would be spent on public services, leaving a cumulative amount of over $40 billion to be put to other uses such as paying down the public debt ($12.4 billion in 2017-2018), investing in a future fund (similar to Alberta and Norway) or other uses. Paying off the public debt would eliminate interest payments (a $500 million expense in 2017-2018). Establishing a $20 billion ‘fund’ by saving some of the oil and gas royalty payments could generate $800 million per year worth of interest payments.
This report doesn’t speculate on the potential development of additional fields beyond the development needed to get to the 650,000 barrels per day target by 2030. It is reasonable to assume that additional new offshore oil and gas fields will be developed beyond 2030. However, at some point in the future the provincial government will have to reduce its dependence on oil and gas revenue as a primary source of revenue. Using some of the proceeds of the offshore oil and gas sector to foster a positive environment for other industries to thrive might be a prudent use of at least some of the royalties/taxes not going to fund current public sector expenditures. This includes transitioning the province’s overall energy mix to more renewable energy.

29
4. Conclusion
The purpose of this report was to model the economic impacts of the Newfoundland and Labrador offshore oil and gas sector today and report on how this economic activity translates into real benefits for the people of Newfoundland and Labrador and the rest of Canada. It also looked at the economic impact of a significant increase in the industry by the mid-2030s. There are other benefits that are not directly quantifiable but are important to the value proposition for investment into the offshore oil and gas sector. These include:
• Carbon emissions in the Newfoundland and Labrador offshore oil and gas industry are estimated to be 30 percent below the global average at extraction.
• A large portion of the offshore production is sold and refined in Canada. Expanding production could help with the objective of energy independence and reduce the country’s reliance on foreign oil.
• There are relatively few challenges with distribution of the oil to end markets.
Will the offshore oil and gas sector meet the objectives established in Advance 2030? Will this result in the forecasted investment and economic impact profile included in this report? The significant private sector investment in exploration in the province’s offshore is an early indication that there is a real possibility that new fields will be developed in the coming years.
There is a public interest in Newfoundland and Labrador and in the rest of Canada to have a growing and thriving offshore oil and gas sector on the east coast. Even with efforts to reduce global use of fossil fuel-based energy, the International Energy Agency (IEA), the U.S. Energy Information Administration and other experts agree there will still be a significant demand for oil for many decades to come. Canada should continue to responsibly develop its oil industry and provide its share of the global supply even as it reduces its own carbon footprint at home.
As this report shows, the oil and gas sector in Newfoundland and Labrador is already a substantial part of the provincial economy, providing good jobs for thousands of residents and generating a large share of the tax and royalty revenue used to pay for public services across the province. If the Advance 2030 vision is fulfilled, the growth in the sector will more than double the number of jobs supported and boost government revenue by billions. This will set the foundation for a strong and dynamic provincial economy for decades to come.

30
The economic impact modelThe economic impact model was developed by Jupia Consultants Inc. It is primarily based on Statistics Canada Input-Output (I-O) tables which trace how expenditures in one industry impact other sectors across the economy as well as national and other provincial impacts. To determine the 2017 economic impact of the oil and gas industry, the output values for the oil and gas extraction and oil and gas engineering construction sectors for Newfoundland and Labrador were run through the I-O tables to determine gross domestic product (GDP), employment, income and other effects. To determine the 2033 and future impact estimates, all figures are expressed in 2018 dollars, except where noted. The two industries used in the model were:
• BS23C200 - Oil and gas engineering construction: Used to estimate impact of the annual spending on infrastructure, drilling, etc.
• BS211113 - Oil and gas extraction: Used to estimate impact from annual oil and gas extraction activity.
The Statistics Canada Input-Output model produces the following output:
• GDP at basic prices, direct impact
• GDP at basic prices, total impact, open model
• GDP at basic prices, total impact, closed model
• Jobs, direct impact
• Jobs, total impact, open model
• Jobs, total impact, closed model
• Employee, full-time equivalent (FTE) jobs, direct impact
• Employee, full-time equivalent (FTE) jobs, total impact, open model
• Employee, full-time equivalent (FTE) jobs, total impact, closed model
• Industry output, total impact, open model
• Industry output, total impact, closed model
• Commodity output, total impact, open model
• Commodity output, total impact, closed model
• International imports, direct impact
• International imports, total impact, open model
• International imports, total impact, closed model
Appendix A: The Economic Impact Model and Sources

31
It shows how spending in the oil and gas sector across Newfoundland and Labrador boosts employment, GDP and spending in 236 detailed industries and 488 commodity groups and in each of the following jurisdictions:
• Newfoundland and Labrador
• Prince Edward Island
• Nova Scotia
• New Brunswick
• Quebec
• Ontario
• Manitoba
• Saskatchewan
• Alberta
• British Columbia
• Yukon
• Northwest Territories
• Nunavut
• Canadian territorial enclaves abroad

32
Estimated taxes and royalties generatedThere are several sources of government revenue developed in the model. These impacts were modelled in two ways. Using Statistics Canada and other primary sources, an estimate of the personal income tax, harmonized sales tax (HST), property taxes and other indirect taxes was development. Statistics Canada tables used included: Table 11-10-0007-01 - Tax filers and dependents with income by source of income; and Statistics Canada; Table 11-10-0174-01 - Government transfers and income tax by after-tax income quintiles; as well as other sources. This provided an estimate of the taxes generated from the economic activity associated with the industry. The other two main sources of government revenue are royalties and corporate income taxes. These were developed using a royalty and corporate income tax model based on the Newfoundland and Labrador royalty regime. The model includes multiple variables including:
• Production levels
• Capital Costs: Exploration Costs, Facilities Costs and Production Wells Cost
• Operating Costs: Administration, Operations and Maintenance
• Transportation Costs
• Oil Price forecast US$/bbl / Oil Price C$/bbl
• Foreign Exchange Rate (USD/CND)
• Inflation Index
Currency conversionUnless where noted, all values are expressed in Canadian dollars. For the future economic impact analysis, the foreign exchange rate used was 1.300 (USD/CND).
Gross domestic product The analysis of the GDP impact associated with the oil and gas sector in Section 2 is based on Statistics Canada. Table 36-10-0402-01 - Gross domestic product (GDP) at basic prices, by industry, provinces and territories. The data is expressed in chained (2007) dollars.
Capital investment data - historicalDerived using Statistics Canada Table 34-10-0035-01 - Capital and repair expenditures, non-residential tangible assets, by industry and geography. Includes the public and private sectors.
Capital investment estimates for future developmentDeveloped with input from Nalcor Energy and reflects industry standard estimates for offshore oil and gas development.
Various income and employment dataThroughout the report there are references to wage levels, income and employment meant to set the impact of the oil and gas sector in context. There were several sources used to provide this context including: Statistics Canada’s 2016 Census, Table 14-10-0204-01 - Average weekly earnings by industry, annual and Table: 11-10-0007-01 - Tax filers and dependents with income by source of income. Average wage comparison by industry is based on full-time, full-year workers to allow for an accurate comparison between industries with varying levels of seasonality or part time work.

33
Consumer spending estimatesDerived using Statistics Canada Survey of Household Spending (2016). Shows the estimated consumer spending impacts across Newfoundland and Labrador as a result of the direct, indirect and induced impacts arising from the oil and gas sector. The model assumes that household income generated as a result of the oil and gas sector will be spent in the same pattern as the average household across the province.
Oil price forecastThe oil price forecast through 2045 was taken from the U.S. Energy Information Administration’s International Petroleum and Other Liquids Supply, Disposition, and Prices (June 2018). This is the most current estimate (as of June 2018) of the future price of oil. Other sources reviewed included the International Energy Agency oil price forecast (November 2017) and the Wood Mackenzie Macro Oils Long-Term Outlook H1 2018.
Future demand for oilThe main source used was the International Energy Agency (IEA) but other sources were reviewed including the U.S. Energy Information Administration (EIA) and the BP Energy Outlook.
Royalty payment historyThe royalty payment history was taken from the Government of Newfoundland and Labrador’s 2018-2019 Main Estimates.
Advance 2030 planSource: Government of Newfoundland and Labrador. February 2018.
Production levels in the offshoreCurrent and past production levels in the offshore comes from the Canada-Newfoundland and Labrador Offshore Petroleum Board (C-NLOPB).
Current offshore exploration activitySupplied by Nalcor Energy and current as of October 2018.
Provincial government spending by activity (2017)Spending by government department was taken from the Government of Newfoundland and Labrador’s 2018-2019 Main Estimates.

34
Appendix B: About Jupia Consultants Inc. Jupia Consultants Inc. is an economic research and consulting firm based in Moncton, New Brunswick with clients across Canada. The firm has been working with companies, communities, economic development agencies and government departments for more than 15 years. It is a particular expertise in economic impact analysis. Recent clients in this area include: University of Prince Edward Island, Research and Productivity Council, New Brunswick Innovation Foundation, Atlantic Ballet Theatre of Canada, New Brunswick film and media production sector, aerospace and defence industry on PEI, forest products sector in New Brunswick, shipbuilding sector in Nova Scotia, information technology industry on PEI, natural gas sector in the Maritimes, a proposed LNG export terminal and the EnergyEast pipeline.
David Campbell is the lead author of this report. David is the President and lead consultant with Jupia Consultants Inc. and was formerly Chief Economist with the Government of New Brunswick. He has over 25 years experience writing industry reports, completing economic impact assessments and labour market reviews.
For more information visit www.jupia.ca.


NEWFOUNDLAND & LABRADOROIL & GAS INDUSTRIES ASSOCIATION
Suite 606, Box 44215 Water StreetSt. John’s, Newfoundland & Labrador, CanadaA1C 6C9
T. 709-758-6610F. 709-758-6611E. [email protected]
www.noia.ca@NoiaNL