of geography.… · web viewgeography alive! regions and people. you have just begun an active,...
TRANSCRIPT
Tools of Geography
(Geography Alive)
Welcome to Geography Alive! Regions and People. You have just begun an active,
hands-on journey into the world around you.The Field of GeographyGeography is the study of Earth and its people. It helps us understand how people, places,
and environments came to be and how they affect each other.
When geographers look at something on Earth, they ask questions. Where is it? Why is it
there? How did it get there? How does it affect the people who are living there? How does it
affect the natural environment in this area? That “something” could be as ordinary as a
nearby factory. Or it could be as extraordinary as a distant, fire-belching volcano.
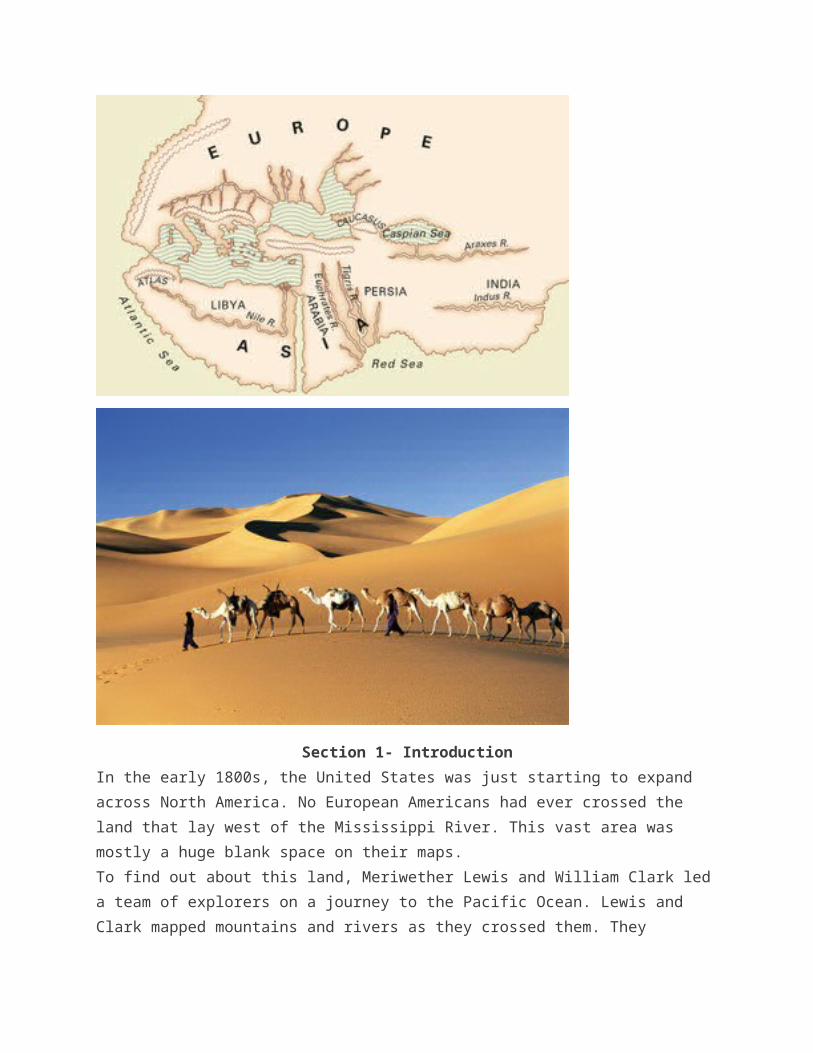
To answer such questions, geographers look at the world in spatial terms. This means they
look at how things are arranged in space relative to each other. Look at the photograph of
the camels below. The first question to pop into a geographer’s mind about this photograph
would be a spatial one. Of all the places on Earth, where were these camels when this
picture was taken? Why were they there?
Physical Geography Geographers divide their field into two broad branches: physical and human. The word
physical means relating to things that can be seen, tasted, or felt. Physical geography is
the study of natural features on the surface of Earth. These are things that can be seen
(and sometimes tasted), such as mountains, plants, and animals. They also include things
that can be felt more than seen, such as temperature, wind, and weather.
Physical geographers looking at the camel photograph below would be interested in its
desert landscape. They would wonder how this place got to be so very dry and what might
live in this sea of sand.
Human GeographyHuman geography is the study of people as they have spread across Earth. Human
geographers seek to understand who lives where, how, and why. They are also interested
in human-made features such as towns, farms, dams, and roads.
Viewing the same camel picture, a human geographer would wonder who is driving those
camels. Where did the people come from? Where are they going? And why are they
traveling through such a harsh, dry land?

The Geographic Inquiry Process
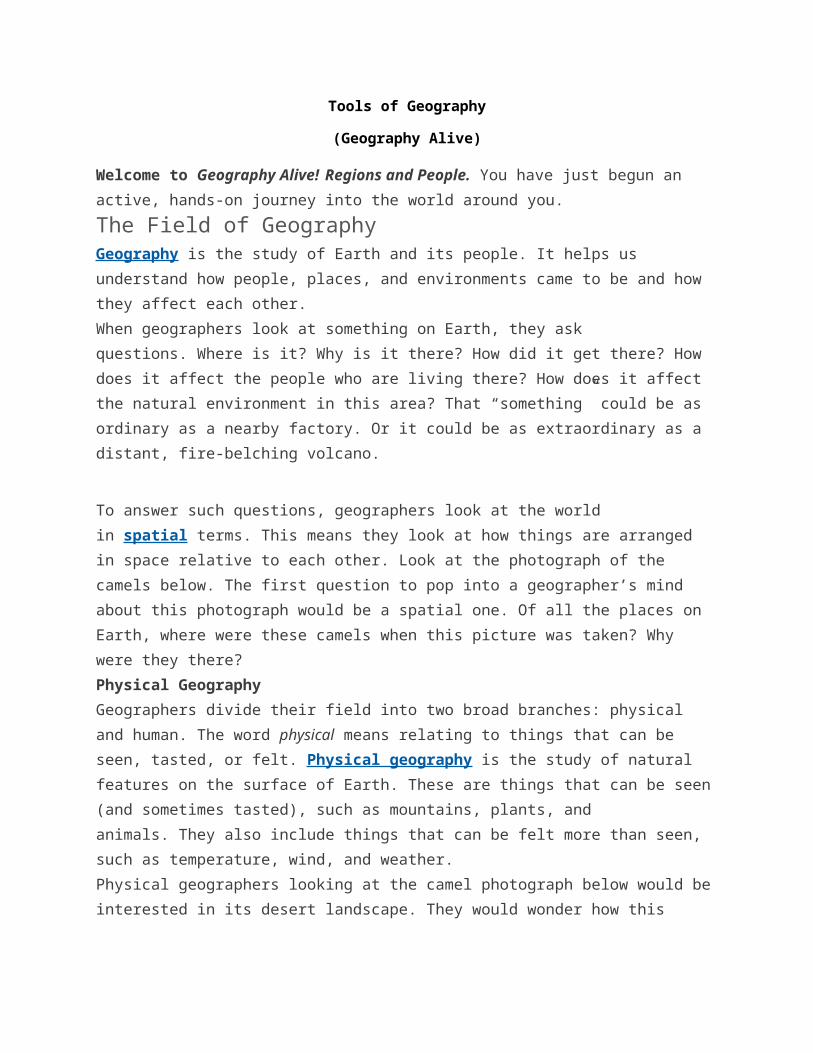
Geography is a very old field of study. Around 450 B.C.E., a Greek scholar named
Herodotus created the first map of the known world. You can see a modern version of it at
the bottom of this page. Looking at this map, you may notice two things. First, how much of
the world it shows. Second, how much of the world is missing. What you cannot see is how
Herodotus created his map. He followed a series of steps known as the geographic inquiry process.
Asking Geographic Questions Herodotus began by asking geographic questions. What is the world like? What lands and
seas cover Earth? What peoples does the world contain? Where do they live?
Acquiring Geographic Information To answer his questions, Herodotus needed geographic information. He traveled widely to
see the world. He interviewed other travelers and traders. They told him many tales, some
true and some tall, about distant lands. In this way, Herodotus learned about peoples and
places he would never see.
Geographers today still travel in search of geographic information. Those travels may take
them to nearby places or to distant lands. Like Herodotus, they also look for information
gathered by others. This information can often be found in books and on the Internet.
Organizing Geographic Information Once Herodotus had collected his information, he needed to organize it in some way. There
are many ways to organize geographic information. The most common, however, is the one
he chose to organize information about all of the places he had learned about: a map.
A map is a way of showing how things are arranged in space. On his map, Herodotus
showed what he had learned about the locations of lands, seas, and peoples.
Analyzing Geographic Information To analyze means to examine something in detail in order to discover more about it.
Analyzing geographic information involves seeing patterns and making connections.
As Herodotus analyzed his information, he compared different ways of life. He noticed that
Egyptians, for example, did many things “backward” from a Greek point of view. They wrote
from right to left, instead of from left to right. They ate outdoors but washed indoors, while
the Greeks did just the opposite.

Answering Geographic Questions At the end of his inquiry, Herodotus tried to answer the questions he had started with. He
wrote down all that he had learned. He also recorded conclusions about peoples based on
his analysis. People still read his books today.
Throughout this course, you will be engaged in the geographic inquiry process. You will ask
questions and gather information. You will organize and analyze that information. Finally,
you will try to answer your questions. You may find, however, that each answer leads to
new questions. When that happens, you are thinking like a geographer.
Section 1- IntroductionIn the early 1800s, the United States was just starting to expand across North America. No
European Americans had ever crossed the land that lay west of the Mississippi River. This
vast area was mostly a huge blank space on their maps.
To find out about this land, Meriwether Lewis and William Clark led a team of explorers on a
journey to the Pacific Ocean. Lewis and Clark mapped mountains and rivers as they
crossed them. They collected samples of wildlife and plants. They also learned about the
Native Americans of the West and how they lived.
In many ways, today’s geographers are explorers like Lewis and Clark. They study the
natural features of the land, the sea, and even the sky. They try to understand the way
people interact with the world around them. For example, they look at where people choose
to live and why. They study the way people use Earth’s resources, such as forests, water,
and minerals. They explore the advantages that come with living in cities or in the
country. Often they use maps as a basic tool for recording information and making new
discoveries.
In this chapter, you will learn how to use different kinds of maps. You will see how maps can
show information about people and places on Earth. You will use these tools throughout
your own study of geography.

Section 2 -Geographic Setting
In September 1805, Lewis and Clark crossed the Rocky Mountains on their way to the Pacific Ocean. They wanted to find the Columbia River, which could take them to the ocean. But they didn’t know how to find it. A Native American chief named Twisted Hair came to the rescue. He drew a map on a white elk skin that showed how to reach the Columbia. The river, said Twisted Hair, was “five sleeps” away.
Today we still use maps to find the locations of places and how far apart they are. Like Twisted Hair’s drawing, the most basic map is a diagram that shows what is where.
Locating Things on Earth: The Main Purpose of Maps For geographers, maps are tools that show where things are on Earth. With these tools, we can find the absolute location of any place in the world. Every feature is located at a precise, or absolute, point on Earth. There are many ways to describe this precise point. Your street address, for example, indicates the absolute location of your home. Later in this chapter, you’ll learn how a grid, or system of lines, can be used to show the absolute location of places on a map.
Maps also show the relative location of places on Earth. This is the location of one place compared to another. For instance, one place might be located east or west of another one. You probably use relative location when you give directions. Suppose you want to tell a friend how to find the street where you live. You might tell her to go down a main street and turn right one block past the park. You would be telling her your street’s location relative to a place she knows well.
Distortion: The Big Problem with Maps- Maps are great tools, but they’re not perfect pictures of Earth’s surface. Maps are two-dimensional, or flat. Earth is three-dimensional and shaped like a sphere, much like an orange. The only way to show a round Earth on a flat map is by stretching some parts of it. This changes the shape, size, and position of its features. These changes are called distortion. The picture at the right shows how severe this distortion can be.
One way geographers deal with the problem of distortion is to use globes. Because they are spheres, globes are better models of the whole Earth than maps. They show the size, shape, distance, and direction of places on Earth very accurately. Unfortunately, globes cannot show a lot of detail without becoming huge. Maps can show smaller areas of Earth and include much more detail. In addition, maps are much easier than globes to carry around.
A second way to deal with distortion is to use map projections. A map projection is a particular way of showing Earth on a flat surface. All map projections have some kind of distortion. For example, a projection that accurately shows the sizes of places will distort their shapes. One that shows accurate shapes will distort sizes and distances. Geographers choose the projection that best suits the kind of information they want the map to show.

Flattening a Sphere Distorts Features A person’s head is shaped almost like a sphere. If you try to flatten a head, its features stretch and change shape. As a result, the person becomes almost unrecognizable. In a similar way, flat maps can distort information about Earth’s features.
Follow the directions below to complete the Common Core Activities. Write a definition for each Geoterm in your own words. Then write a sentence that includes the term and the word map.
absolute location
distortion
map projection
relative location

Section 3 -Map Titles and Symbols
Like Lewis and Clark, early explorers often had no maps to guide them on their
journeys.Lewis Carroll, the English author of Alice in Wonderland, made fun of their
situation in a poem called The Hunting of the Snark. The poem tells of sailors in search of
an imaginary creature called a snark. To assist them, the ship’s captain unrolls a large map
of the sea without a trace of land. The snark-hunting sailors, Carroll wrote,
were much pleased when they found it to beA map they could all understand . . . “A perfect and absolute blank!”
The Top of a Map Doesn’t Always Point North On most maps, the top of the map points north, but not all maps work this way. This map turns our usual view of Earth upside down. The map isn’t right or wrong. After all, Earth does not have a “right” side up as seen from space. When you look at any map, be sure to check the compass rose so you know which direction is which.
Luckily for us, maps are not blank. Instead, they are filled with information.
The Title Tells What a Map Shows
A map’s title gives us our first clue about its content. It usually describes the area shown on
the map. It also identifies the map’s main topic. The topic might be gold mining, politics,
farming, or even the night sky. Often the title lists a date. The date tells us that the map
shows the locations of places at a certain time.
A Compass Rose Shows Directions on a Map
Have you ever used a magnetic compass to find your way in a strange place? If so, you
know that the needle of a compass always points north, or toward the North Pole. Knowing
where north is can help you decide which way to go.

Mapmakers use a diagram called a compass rose to show directions on a map. On early
maps, these diagrams often looked like a flower. For this reason, sailors called this
direction-finding tool a compass rose.
A simple compass rose has two short lines that cross at right angles. The points at the ends
of the lines are labeled north, south, east, and west. These four directions are called
cardinal directions. A more complicated compass rose has lines between the cardinal
points. These lines show the intermediate directions. They are northeast, southeast,
southwest, and northwest.
A Legend Identifies Symbols on a Map
A compass rose is one of many symbols used to show information on a map. Some
symbols use color to show features. Blue lines, for example, are symbols showing
rivers. Lakes and oceans are often colored blue as well. Other symbols use shapes to show
information. A bold star is a common symbol for the capital of a state or country. Tiny
airplanes are often used to show the location of airports.
The symbols used on a map are usually identified in a box known as the map legend, or
sometimes the map key. The map legend lists each symbol and explains what it shows on
the map.
A Grid Organizes Space on a Map
Mapmakers often use a system of imaginary lines to divide up space on their maps. This
system of lines is called a map grid. You can see an example of a grid on the map
above. To form this grid, the mapmaker drew horizontal lines and vertical lines that meet at
90-degree angles. (Remember that horizontal lines go straight across. Vertical lines go up
and down.)
Geographers make map grids useful by giving each line a label. For instance, on some
maps horizontal lines have letters, and vertical lines have numbers. Once the grid is
labeled, any location on the map can be indicated by a letter and number combination, such
as C3 or H7. The letter and number indicate where a horizontal and vertical line meet. Find
this point, and you will have found the place you are looking for close by.
One very useful type of grid is the system of latitude and longitude. This global grid allows
you to locate any place on Earth with a simple number code. You’ll learn more about the
global grid in the next section.

Using a Map’s Title, Compass Rose, Legend, and Grid You can use this map to tour a historic site. The map title
tells which site you will be exploring. The compass rose shows which way north is on the map. The map legend tells
you what the symbols on the map mean. Once you know what you want to visit, the map grid will help you locate it on
the map.Follow the directions below to complete the Common Core Activities. 1 Label the map. Refer to the map in your Student Text if necessary. Follow these directions:
• Write the map's title at the northwest corner of the map.
• Draw a compass rose near the west edge of the map.
• Label the two historical monuments south of the Gold Discovery site.
• Label the park buildings northeast of the Gold Discovery Museum.
• Label the footpath you find at grid coordinates F1.
• Label the park building whose absolute location is G6.
• Trace two routes—each in a different color—from the Mill Site to the Jail Ruins.

Look at the map above to answer these questions.
How many picnic areas does the park have?
What direction is Emmanuel Church from the Olde Coloma Theater?
What direction is St. John's Church from the schoolhouse?

Section 4- The Global Grid: Longitude and Latitude
In early November of 2003, a hiker set up camp high in the Adirondack Mountains of New
York. Heavy snow trapped him there with no way to hike out. Luckily, he had a Personal
Locator Beacon. He pressed a button to call for help. A helicopter soon flew him to safety.
How did the rescuers find the stranded hiker? His locator beacon showed his location on
the global grid. Geographers use this same global grid to show the absolute location of
every place on Earth.
Lines of Latitude Parallel the Equator
The global grid system is made up of two sets of imaginary lines. The first are
called parallels of latitude. These lines run east and west around the globe.
The equator is the most important parallel of latitude. It circles Earth exactly midway
between the North and South poles. All other lines of latitude are parallel to the equator.
Parallels of latitude are measured in degrees (°). The equator is 0° latitude. It is a reference
for measuring other parallels of latitude.
Lines of Longitude Run from Pole to Pole
The other lines in the global grid are half-circles that run from the North Pole to the South
Pole. These lines are called meridians of longitude. They are not parallel to each other, so
the distance between them varies.
The most important of these north-south lines is the prime meridian. It runs through
Greenwich, England. Like parallels of latitude, meridians are measured in degrees. The
prime meridian is 0° longitude. It is a reference for measuring other meridians of longitude.
The next most important meridian is the International Date Line. This line runs through the
Pacific Ocean halfway around the world from the prime meridian. When travelers cross this
line, they cross over to a different day. Travelers moving west across the line go forward a
day. Travelers moving east across it go back a day.
Latitude and Longitude Mark Absolute Location
The numbering system of this global grid makes it easy to locate any place on Earth.
Moving north from the equator, the parallels of latitude increase in number from 0° up to
90°N (north) at the North Pole. The same thing happens moving south of the equator. There
the numbers of the parallels increase from 0° to 90°S (south) at the South Pole. One degree
of latitude covers about 69 miles, or 111 kilometers.
Meridians of longitude start from 0° at the prime meridian. Going east from there, the
numbers on lines of longitude increase until they reach 180° at the International Date Line.
These numbers are labeled E (east). The same thing occurs going west from the prime
meridian. The numbers increase until they reach 180° at the date line and are labeled W
(west).
The absolute location of any place on Earth can be described as the meeting point of a
parallel of latitude and a meridian of longitude. The numbers of these lines are the
geographic coordinates of a place. These coordinates are like a street address for your
house. They tell exactly where that place is located.
The Absolute Location of Cities Latitude and longitude mark the absolute location of cities. The coordinates of Rio de Janeiro are 23°S, 43°W. To find this location, look for the parallel of latitude that is 23 degrees south of the equator. Move your finger
along it until you come to the prime meridian. Now move west along the same line until you reach 43 degrees. You should be pointing to Rio de Janeiro.
Section 5-Dealing with Distances: Map Scale
In Ithaca, New York, there is a winding path called the Sagan Planet Walk. The path takes people past models of the sun and the planets. In less than a mile, walkers pass through a model of the entire solar system. The model shrinks the vast distances of space to make them easier to understand. For instance, people can see that the planet Mars is about one and a half times Earth’s distance from the sun.
A map does a similar thing for the area it shows. The scale on a map tells you how the distances on the map compare to the actual distances on Earth.
How Scale Affects Details
A map can be large scale or small scale. A large-scale map gives a close-up view of a small area. It shows lots of detail. You could use a large-scale map to find a store in a mall or on a neighborhood street. A small-scale map shows a larger area, but with fewer details. Small-scale maps are best for finding your way between cities, states, and larger areas.
Estimating Distance with a Map Scale
A map scale appears on most maps. The scale tells you how to read the distances on the map. For instance, an inch on a map might equal 10 miles on Earth.
The map scale is usually made up of two short lines with notches on them. One line measures distance in miles, the other in kilometers. The easiest way to use a map scale is to make a scale strip. Take a strip of paper and place it under the map scale. Mark the scale’s notches on the paper, and label the marks with the numbers of miles or kilometers. Then place your strip with the “0” mark at one point on the map. Line up the strip with a second point. Now read the closest number on your strip to this second point. You’ve just figured out the distance between the two points.
+
Maps with Different Scales
The map on the left is a small-scale map. It shows where Washington, D.C., is located in relation to nearby cities. The map does not show details like city streets. But it does show larger features, such as

major highways. The map on the right is a large-scale map. It focuses on Washington, D.C. You could use it to find your way through the city’s streets to the White House or other monuments.

Section 6- Hemispheres, Continents, and Oceans
“One of my favorite things to do when I have time off is to just watch the world go by,” said astronaut Ed Lu about his time in space. In 2003, Lu watched Earth go by from the International Space Station. “It isn’t exactly seeing the Earth like a big blue marble,” he explained. “It’s more like having your face up against a big blue beach ball.” On the “beach ball,” he saw Earth’s wide continents and blue oceans.
Few of us will ever see Earth from an astronaut’s point of view. But we can use maps and globes to get a view of our planet’s natural wonders. Geographers make these features easier to understand by dividing Earth into different areas.
A Hemisphere Is Half a World
Geographers divide Earth into halves. These halves are called hemispheres. The equator divides Earth into two hemispheres. The northern half is the Northern Hemisphere. The southern half is the Southern Hemisphere.
Geographers also divide Earth in half by longitude. The Western Hemisphere lies west of the prime meridian. The Eastern Hemisphere is east of it. The two hemispheres divide again at the International Date Line.
Continents and Oceans Cover Earth
Geographers also divide Earth’s lands and seas into areas. Ocean water covers more than 70 percent of Earth. This ocean is really just one big body of water. But geographers usually divide it into four oceans. They are the Atlantic, Pacific, Indian, and Arctic oceans.
These oceans lap the shores of continents, the largest areas of land on our planet. Geographers identify seven continents. From largest to smallest, they are Asia, Africa, North America, South America, Antarctica, Europe, and Australia. Europe and Asia are actually parts of one huge landmass [landmass: a very large, unbroken area of land] . But geographers usually think of them as two continents because they have different cultures and histories.

Follow these directions:
• Label the largest continent. • Label the smallest continent. • Label the continent directly north of Africa. • Label the ocean that touches the shores of Europe and South America. • Label the ocean that lies north of Europe.

• Label the ocean that touches the shores of both Asia and South America. • Label the ocean that lies to the south of Asia.
Look at the map above to answer these questions.
What are the two hemispheres in which the United States is located?
3 What are the hemispheres in which Africa is located?
4 What are the three continents that the equator runs through?
Section 7-Showing a Round World on a Flat Map
In this chapter, you have learned how geographers show information on maps. A map’s
title, legend, and symbols can help you understand what a map shows.
You learned how geographers describe where a place is in terms of its absolute
location. The global grid allows mapmakers to indicate the exact location of any place on
Earth using lines of latitude and longitude. Map scales are useful for describing the relative
location of two places. Using a scale, you can estimate about how far two places are from
each other.
All Flat Maps Have Distortion Geographers use maps to show features of Earth, such as
oceans and continents. But every flat map involves some distortion. The size or shape of
landmasses may be distorted. The distances between places may not be accurately shown.
To deal with distortions, mapmakers use different map projections. Many projections are
named after the mapmakers who designed them. For example, Arthur Robinson designed
the Robinson projection. The world map in section 6 is a Robinson projection. It is a popular
projection because it balances the distortions of size and shape. In this way it gives a fairly
accurate picture of the world.
You can see several map projections on this page. Note how each projection does some
things better than others. As you look at them, think about what type of information each
map projection might show best.
Mercator Projections Show Direction but Distort Size Gerardus Mercator designed his map projection in 1569. It shows directions between places accurately near
the equator. But it distorts the size of continents, especially near the North and South poles. This is called area distortion.
Lambert Projections Show Polar Areas that Other Maps Distort
A Lambert projection is a circular map. It shows size accurately at its center but not distance or shape. It is good for showing the areas around the North and South Pole. Most other map projections distort the shape and size of the Arctic and Antarctica
Eckert IV Projections Show Size but Distort Shape The Eckert IV projection is an equal-area map. Equal-area maps show the sizes of places accurately. However, they distort shape near the poles. This is called shape distortion. Geographers often use Eckert IV projections to show the number of people in different areas.

Goode’s Homolosine Projections Show Continents but Distort Oceans Goode’s Homolosine projection uses a trick to help us see how the continents compare in size. It snips bits out of the oceans. This trick allows the continents to stretch without distorting their shapes. But it distorts the shape and size of the oceans.

Look at the maps above to answer these questions.
You own an outdoor adventure company that specializes in sailing trips throughout the Atlantic Ocean. You need to be able to determine accurate direction. Which map projection is most helpful to you?
You work for the United Nations studying how many people live per square mile in various countries. You need to be able to determine the accurate size of land. Which map projection is most helpful to you?
You work for a book publisher that has to present a fairly accurate picture of the world. You need to avoid a lot of area or shape distortion. Which map projection is most helpful to you?
Summary
Maps are important tools geographers use that show information about people and places
on Earth. Many maps feature important devices such as compass roses, legends, grids,
and scales. The global grid system, which is made up of lines of latitude and longitude, help
people find the absolute location of a place.

Some maps show the entire world, including the continents and oceans. Because the world
is round, all flat maps involve distortion. Different types of map projections deal with
distortion in various ways.