of early-stage breast cancer cis-acting super-enhancer
TRANSCRIPT

Page 1/30
Cis-acting Super-Enhancer lncRNAs as Biomarkersof Early-Stage Breast CancerAli Salman Ropri ( [email protected] )
SUNY at Albany: University at Albany https://orcid.org/0000-0001-6159-1543Rebecca DeVaux
miR Scienti�cJonah Eng
Bethlehem Central High SchoolSridar V. Chittur
SUNY at Albany: University at AlbanyJason Herschkowitz
SUNY at Albany: University at Albany
Research article
Keywords: Breast Cancer Progression, Ductal Carcinoma in Situ, Super-enhancer long non-coding RNAs,Super-enhancers.
Posted Date: August 17th, 2021
DOI: https://doi.org/10.21203/rs.3.rs-800791/v1
License: This work is licensed under a Creative Commons Attribution 4.0 International License. Read Full License

Page 2/30
AbstractBackground
Increased breast cancer screening over the past four decades has led to a substantial rise in thediagnosis of ductal carcinoma in situ (DCIS). Although DCIS lesions precede invasive ductal carcinoma(IDC), they do not always transform into cancer. The current standard-of-care for DCIS is an aggressivecourse of therapy to prevent invasive and metastatic disease resulting in over-diagnosis and over-treatment. Thus, there is a critical need to identify functional determinants of progression of DCIS to IDCto allow discrimination between indolent and aggressive disease.
Recent studies show that super-enhancers, in addition to promoting other gene transcription, arethemselves transcribed producing super-enhancer associated long noncoding RNAs (SE-lncRNAs). TheseSE-lncRNAs can interact with their associated enhancer regions in cis and in�uence activities andexpression of neighboring genes. Furthermore, they represent a novel, untapped group of therapeutictargets.
Methods
With an integrative analysis of enhancer loci with global expression of SE-lncRNAs in the MCF10Aprogression series, we have identi�ed differentially expressed SE-lncRNAs which can identifymechanisms for DCIS to IDC progression. Furthermore, cross-referencing these SE-lncRNAs with patientsamples in the TCGA database, we have unveiled 31 clinically relevant SE-lncRNAs that potentiallyinteract with their enhancer to regulate nearby gene expression. To complement SE-lncRNA expressionstudies, we conducted an unbiased global analysis of super-enhancers that are acquired or lost inprogression.
Results
Here we designate SE-lncRNAs RP11-379F4.4 and RP11-465B22.8 as potential markers of progression ofDCIS to IDC through regulation of the expression of their neighboring genes (RARRES1 and miR200brespectively). Moreover, we classi�ed 403 super-enhancer regions in MCF10A normal cells, 627 in AT1,1053 in DCIS, and 320 in CA1 cells. Comparison analysis of acquired/lost super-enhancer regions withsuper-enhancer regions classi�ed in 47 ER positive patients, 10 Triple Negative Breast Cancer (TNBC)patients, and 11 TNBC cell lines reveal critically acquired pathways including STAT signaling and NF-kBsignaling. In contrast, protein folding and local estrogen production are identi�ed as major pathways lostin progression.
Conclusion
Collectively, these analyses identify differentially expressed SE-lncRNAs and acquired/lost super-enhancers in progression of breast cancer important for promoting DCIS lesions to IDC.

Page 3/30
1. BackgroundBreast cancer can be de�ned as a group of diseases with heterogeneous origins, molecular pro�les andbehaviors characterized by uncontrolled proliferation of cells within the mammary gland. Around one ineight women in the US will develop breast cancer in their lifetime, making it the second most frequentlydiagnosed cancer behind skin cancer(1). In 2021, an estimated 281,550 cases of invasive breastcarcinoma are predicted to be diagnosed, and over 40,000 deaths are expected, accounting for almost 7%of all cancer mortality each year. Ductal carcinoma in situ (DCIS) is the presence of abnormal cells insidea milk duct in the breast and is a precursor to invasive cancer. DCIS accounts for 20% of breast cancerdiagnoses per year(2), however, while not all DCIS lesions progress to invasive cancer, all are treated assuch leading to overdiagnosis and overtreatment. In fact, DCIS lesions sometimes grow so slowly thateven without treatment it would not affect a woman’s health. Long-term studies have found that only 40%of women with untreated DCIS are ultimately diagnosed with invasive breast cancer (3). The steepincrease in diagnosis of DCIS over the past 30–40 years is believed to be a result of more frequentmammography(4). However, because over half of these in situ lesions will not progress to invasive breastcancer, controversies have arisen about approaches to treatment.
As early screening is advocated and on the rise, better understanding of the progression of non-invasiveto invasive breast cancer is a prerequisite for correct diagnosis of patients. There is a need to highlightfunctional determinants DCIS progression to Invasive Ductal Carcinoma (IDC) thus allowingdiscrimination between indolent and potentially metastatic breast cancers. Understanding themechanisms of transition of normal breast to invasive breast cancer can have signi�cant implications forpreventive and clinical management of breast cancer.
Transcriptome reprogramming is one of the crucial characteristics of cancer, where aberrant geneexpression promotes tumor initiation, progression, and metastasis. This can be ampli�ed by cis-elementchanges in noncoding genomic regions (5). For example, super-enhancers (SEs), also known as stretchenhancers, are genomic regions where multiple enhancers are clustered together. They exert more potenteffects than typical enhancers, are characterized by high levels of Mediator binding, and are associatedprimarily with tissue-speci�c genes(6). Super-enhancers are most likely the major contributors to theexpression of their associated genes (7). There have also been several indications of links between super-enhancers and diseases (8). Recent studies have shown that SEs play key roles in determining cellidentity in both healthy and pathological states. Over 25,000 enhancers were identi�ed as differentiallyactivated in renal, breast, and prostate tumor cells, as compared with normal cells. This suggests anetwork between malignancy and enhancer activity(9). Likewise, cancer cells have been shown to acquiresuper-enhancers at oncogenes and cancerous phenotype relies on the abnormal transcription propelledby SEs(10). Additionally, super-enhancer regions are transcribed generating long non-coding RNAs(lncRNAs) that may play a pivotal role in assisting the super-enhancer function (11).
Long non-coding RNAs are a large class of non-coding transcripts that are > 200 nucleotides in lengthand do not encode proteins(12). Evidence has indicated that lncRNAs regulate gene expression at the
Page 4/30
levels of epigenetic modi�cation, transcription, translation, and post-translation(13). At the transcriptionlevel, these RNAs can be associated with super-enhancer regions, and interact with enhancer sequencesto in�uence activities of neighboring genes. A study published in 2011 shows that e-lncRNA HOTTIP,which resides at the 5′ tip of the HOXA locus, regulates the transcription of various HOXA genes in vivothrough chromosomal looping of its enhancer to the promoter region of these genes(14). In the samefashion, Sigova et al. observe that nascent e-lncRNAs are necessary for the recruitment of Yin-Yang-1transcription factor to its target enhancer(15). As a result, e-lncRNAs have been indicated to play a vitalrole in engaging with transcription factors and localizing them to cognate enhancers. Enhancer lncRNAsare also involved in diverse tumor biological processes, including cell proliferation, apoptosis, invasion,metastasis and angiogenesis as well as interacting with their enhancers to regulate genes speci�c to cellidentity(16).
Previously, our lab has pro�led global lncRNA expression in a unique patient-based model of breastcancer progression wherein early DCIS lesions are directly contiguous with an IDC lesion. From thisunbiased patient‐based model, 132 lncRNAs were identi�ed as differentially expressed in early breastcancer progression(17), of which 78 were transcribed from super-enhancer regions. This statisticallysigni�cant enrichment in enhancer associated lncRNAs suggests a core mechanism of breast cancerprogression. In this study, we identify super-enhancer associated lncRNAs (SE-lncRNAs) that aredifferentially expressed between non-invasive and invasive breast cancer in the MCF10A progressionseries as well as DCIS and IDC patient samples. We also designate two of the most promising SE-lncRNAs from our list for their potential cis-acting capabilities in regulating nearby gene expressioncrucial for progression to IDC. Furthermore, we highlight super-enhancers that are acquired or lost inprogression to IDC, giving insight about genes and pathways these super-enhancers regulate which maybe necessary for progression.
2. Materials And Methods
2.1 Cell CultureThe MCF10A progression series was purchased from the Barbara Ann Karmanos Cancer Institute andmaintained in a culture of Dulbecco's modi�ed Eagle's medium (DMEM) medium supplemented with 5%horse serum, 20 ng/mL EGF, 0.5 mg/mL hydrocortisone, 100 ng/mL cholera toxin, 10 µg/mL insulin and1× antibiotic-antimycotic (Gibco, Grand Island, NY). All cell lines were veri�ed by STR analysis androutinely screened for mycoplasma contamination.
2.2 MicroarrayArraystar Super-enhancer lncRNA arrays were used to systematically pro�le 7753 lncRNAs transcribedfrom super-enhancer (SE) regions along with 7040 corresponding SE-regulated protein coding genes.Brie�y, an optimized mixture of oligo(dT) and random primers, each containing a T7 polymerase
Page 5/30
promoter, is annealed to the RNA. The cDNA is synthesized by reverse transcription followed by 5’ adapterannealing and PCR ampli�cation. Finally, cyanine 3- or cyanine 5-labeled cRNA is synthesized by in vitrotranscription from the T7 promoter by T7 RNA polymerase. Paired t-test was performed to obtainsigni�cance of 27 potentially cis-acting SE-lncRNAs and 4 highest differentiated SE-lncRNAs, p-value = 0.5, Fold Change cutoff = 2.
2.3 Gene expression analysisGene expression was con�rmed for the 27 potentially cis-acting SE-lncRNAs and 4 highest differentiatedSE-lncRNAs. Forty-eight hours after seeding, total RNA was collected using Omega Bio-Tek E.Z.N.A. TotalRNA Kit (Catalog No. R6-834-02). RNA was subsequently reverse-transcribed using Applied BiosystemsHigh-Capacity cDNA Reverse Transcription Kit (Life Technologies Catalog No. 4368813) and analyzed byquantitative reverse transcription PCR (qRT-PCR) with Sybr Green on the QuantStudio 12K Flex (ThermoFisher Scienti�c) for indicated genes. The ΔΔCt method was used to determine gene expression foldchange with 18s, Act-b, and GAPDH used for controls.
2.4 Cellular LocalizationWhole cell lysate, cytoplasmic fraction, and nuclear fraction were extracted from MCF10A (10A) andMCF10A-CA1 (CA1) cells using Protein and RNA Isolation System (PARIS) Kit (Life technologies CatalogNo. AM1921). For the whole cell lysate and for each cytoplasmic and nuclear fraction from 10A and CA1cells, 87.5 % of the sample was used for RNA extraction while 12.5 % was used for an immunoblot toensure the fractionation was done correctly. The 7:1 ratio was used to maximize RNA content as lncRNAsare relatively lowly expressed. GAPDH (Cell Signaling 14C10) was utilized as control for cytoplasmicfraction while Tri-Methyl Histone H3 (Lys 27) (Cell Signaling C36B11) was used as control for nuclearfraction for the immunoblot. RNA was isolated from each fraction using Omega Bio-Tek E.Z.N.A. TotalRNA Kit (Catalog No. R6-834-02). Reverse transcription was performed with the Applied Biosystems High-Capacity cDNA Reverse Transcription Kit (Life Technologies Catalog No. 4368813) on the extracted RNAfrom each compartment as well as the whole cell lysate and RT-qPCR was carried out to analyze thelocalization of these SE-lncRNAs within the 10A and CA1 cells as well as fold change. 18s, Actin-B,HOTAIR were used as controls for localization. 18s and Actin-B were also used as controls for foldchange to validate the change in expression we saw in our microarray data.
2.5 Patient Samples ExtractionArchived Formalin-Fixed Para�n-Embedded (FFPE) patient samples were acquired from ReadingHospital, PA. RNA was extracted from 24 DCIS and 24 IDC samples using the miRNeasy FFPE Kitsupplied by QIAGEN (Cat. No. 217504). Reverse transcription was performed using Applied BiosystemsHigh-Capacity cDNA Reverse Transcription Kit (Life Technologies Catalog No. 4368813) on the extractedRNA from each patient sample and RT-qPCR was performed to analyze expression of the 14 target SE-lncRNAs. 18s, Actin-B and GAPDH were used as controls for fold change in each sample. Unpaired t-testwas performed to obtain signi�cance between expression of SE-lncRNAs in DCIS versus IDC patientSamples.
Page 6/30
2.6 Quantitative reverse transcription PCR primersTaqMan assays were purchased from Thermo Fisher Scienti�c (Waltham, MA):, 18S (Hs99999901_s1),Actin (Hs99999903_m1), glyceraldehyde 3-phosphate dehydrogenase (GAPDH; Hs02758991_g1), HOTAIR(Hs03296680). Sybr‐green assays purchased from Integrated DNA Technologies (Coralville, IA):
AC053503.6 Forward Primer: 5’-AGGTGGATTAGAGGGGGTGT-3’
Reverse Primer: 5’-GGCTGAGAAGGGGGTTTCTG-3’,
AC068580.7 Forward Primer: 5’-CCCGTCGTGACCTCATTGTG-3'
Reverse Primer: 5’-GAACCCCTTTTCCTCACCCA-3’,
CCND2-AS1 Forward Primer: 5’-CAAGCTGGAACCCTGCAAGA-3’
Reverse Primer: 5’-AAGGGTATACCTTCCTCCCCA-3’,
CTD-2033D15.1 Forward Primer: 5’-GGTAAGAAGCAAAGCCCTGGA3’
Reverse Primer: 5’-TGGCTGAGACGCCATCTGTA-3’,
FAM83H-AS1 Forward Primer: 5’-GCAACACCCTACTGACCTTGT-3’
Reverse Primer: 5’-AGCTCTGTGGTGACTGTCTT-3’,
FAM87A Forward Primer: 5’-TTCCGCAGGTTTTAGTGGCT-3’
Reverse Primer: 5’-CAAACTGTCCCCAACTCCCA-3’,
GATA2-AS1 Forward Primer: 5’-GACCCTCTGAAAGACACCGC-3’
Reverse Primer: 5’-TCTTGCTCATGTGTGAGGGC-3’,
HCG9 Forward Primer: 5’-CAGGAACCCAGGGACTTCAG-3’
Reverse Primer: 5’-TGTTCTCTGCAGCTTGACCT-3’,
HOXA11-AS Forward Primer: 5’-TCCGATTTGCACGGTGACTT-3’
Reverse Primer: 5’-CGGATGTCAGCGCCTCTAAA-3’,
LINC00885 Forward Primer: 5’-GGCACTGTAGAAGCCCCATT-3’
Reverse Primer: 5’-GTCCAGCGAACTGAAGGACA-3’,
LINC01125 Forward Primer: 5’-AGGCAAAGATGAGCAGAGCC-3’
Page 7/30
Reverse Primer: 5’-CCAAGCAATGCTGGTTCCTTT-3’,
LINC01589 Forward Primer: 5’-AAATGGAATGCAGCCACACC-3’
Reverse Primer: 5’-CCAAGAGGCCATCCGTCTTC-3’,
NR2F1-AS1 Forward Primer: 5’-GGTCACGGAGAAAACAGGTTCA-3’
Reverse Primer: 5’-CCCCAGAGCTGCATCCTTATG-3’
OSMR-AS1 Forward Primer: 5’-TTGGAAACCGAAAACTCGGC-3’
Reverse Primer: 5’-ACATTGGGATGTTCTGCCCC-3’,
PCAT1 Forward Primer: 5’-CCTCTAAGTGCCAGTGCAGG-3’
Reverse Primer: 5’-ATGTATCTGCGCACCCTTTGA-3’,
RP11-107N15.1 Forward Primer: 5’-GGGTCCTCAATGTGGGGTTT-3’
Reverse Primer: 5’-TCGCTAGAGTCACCCCAGTT-3’,
RP11-258F1.1 Forward Primer: 5’-CGTTGTACAGGCCCTTCTCA-3’
Reverse Primer: 5’-GTGCGCACAACCCTGGTATC-3’,
RP11-303E16.3 Forward Primer: 5’-CAGACTCCGTACGCCTTCAC-3’
Reverse Primer: 5’-CTGAGCCTGCAACTCGACTG-3’,
RP11-323N12.5 Forward Primer: 5’-TGGACCAGTCGAAACCCTTG-3’
Reverse Primer: 5’-TCTCGACATCGAGGACCCAT-3’,
RP11-326G21.1 Forward Primer: 5’-ACTCCGCATTACACCACTGA-3’
Reverse Primer: 5’-CCCGAAACAGTACCAGGCAA-3’,
RP11-346D6.6 Forward Primer: 5’-CAAGCAGCCCTGGAGAGTTTA-3’
Reverse Primer: 5’-AACTTGGGGGTCACAGCATC-3’
RP11-373D23.3 Forward Primer: 5’-CTTCCAAGGCCCTGCATGAT-3’
Reverse Primer: 5’-GGTGAGGGAAGACAACACGG-3’,
RP11-379F4.4 Forward Primer: 5’-TGCCCGGTTTTATAGCCCTG-3’
Page 8/30
Reverse Primer: 5’-ATCTGTTCCGTGCTCCCTTC-3’,
RP11-403A21.1 Forward Primer: 5’-AGGGATGGGGTCTCGAGTTT-3’
Reverse Primer: 5’-TCAGCTGGTGGGTGTTTAGC-3’,
RP11-465B22.8 Forward Primer: 5’-AGCCTGAGCTCATCCAACAC-3’
Reverse Primer: 5’-GTGCGTGAACTGCAGACTTT-3’
RP3-483K16.4 Forward Primer: 5-’AGTTGCCATTGAGCTCCACAA-3’
Reverse Primer: 5’-TGGACTACTGGCAGAAGCGT-3’,
RP11-507M3.1 Forward Primer: 5’-CGCATTTTCCTGATTGGCCC-3’
Reverse Primer: 5’-ACATTCCCCTTCAACGCCTG-3’,
RP11-560J1.2 Forward Primer: 5’-CCTAGGGTAGTCCGAGGTCA-3’
Reverse Primer: 5’ACAAAATACGCCCGGCAAAG-3’,
RP11-61F12.1 Forward Primer: 5’-GGACGTGGTTTGCTAGGTGA-3’
Reverse Primer: 5’-ACAGGTTTTCCGTCTCCGAC-3’,
RP11-63G10.2 Forward Primer: 5’-ACCTGTGCCAGTGTGAACAA-3’
Reverse Primer: 5’-GGGCTAGTCAAAGTCAGCGT-3’,
SLC44A3-AS1 Forward Primer: 5’-AGCAACAGTGTAGTGGCGTA-3’
Reverse Primer: 5’-CTGGCCTGTGATGCTTTTCC-3’,
SNHG18 Forward Primer: 5’-CATGTTCCCAGAGGTTGGCA-3’
Reverse Primer: 5’-AGAGGACAAGGCAAAACACTT-3’,
TMEM220-AS1 Forward Primer: 5’-TCCAAGTCCCCTTCTGACTTC-3’
Reverse Primer: 5’-CAGGCTCCTCAGGAAGAATCC-3’
SNORD3B-2 Forward Primer: 5’-GGCAGTGTAGCGAGAAAGGT-3’
Reverse Primer: 5’-AATAGGAGGTGCCACACAGC-3’
2.7 Chromatin Immunoprecipitation (ChIP)

Page 9/30
MCF10A, MCF10A-AT1, DCIS.com, and MCF10A-CA1 cells were grown to a �nal count of 5 x 10^6. Cellswere chemically crosslinked by the addition of 1 mL of fresh 10% formaldehyde solution for 10 min atroom temperature on a rocker. After 10 minutes added 1/10 volume of 1.25M Glycine to quenchunreacted formaldehyde and incubated for 5 minutes on rocker. Cells were pelleted at 1000g for 5minutes, washed twice with 1 × PBS, �ash frozen in liquid nitrogen, and stored at − 80°C prior to use. Cellswere resuspended, lysed in lysis buffer (50 mM HEPES, 140 mM NaCl, 1mM EDTA, 1% Triton X-100, 0.1%Sodium deoxycholate, .1% SDS), and sonicated to solubilize and shear crosslinked DNA. Sonicationconditions vary depending on cells, but cells were sonicated using a Diagenode Bioruptor Sonicator andsonicated at power 7 for 13 × 30s pulses (30s pause between pulses) at 4°C while samples wereimmersed in an ice bath. The sonicated cells were centrifuged for 10 min at 8000g at 4°C and thesupernatant collected to proceed with immunoprecipitation. The resulting whole-cell extract volume wasdivided into two, one for IgG and the other for H3K27ac targeting. The samples were diluted in 1:10 ratiowith RIPA buffer (50 mM Tris-HCl pH8, 150 mM NaCl, 2 mM EDTA pH8, 1% NP-40, 0.5% SodiumDeoxycholate, 0.1% SDS) incubated overnight at 4°C with the 2.5 µg of the appropriate antibody, CellSignaling IgG (Rabbit (DA1E) mAb IgG XP® Isotype Control #3900) and Abcam H3K27ac (Anti-HistoneH3 (acetyl K27) antibody - ChIP Grade (ab4729)). The following day, 60 µL of ChIP Grade Protein GMagnetic beads (Cell Signaling 9006S) were washed three times with RIPA buffer and 30 µL each of thewashed beads were added to IgG and H3K27ac samples and left rotating at 4°C for 3 hours. IgG andH3K27ac samples with magnetic beads were then washed three times with low salt wash buffer (0.1%SDS, 1% Triton X-100, 2 mM EDTA, 20 mM Tris-HCl pH 8.0, 150 mM NaCl) and one time with high saltwash buffer (0.1% SDS, 1% Triton X-100, 2 mM EDTA, 20 mM Tris-HCl pH 8.0, 500 mM NaCl). DNA wasthen eluted off the beads for each sample by heating at 65°C at 1200g for 1 hour, cooling each sample atroom temp for 2 min, centrifuging for 1 min at 10,000g, and putting each sample on a magnet for 2 minand removing the liquid. 4.8 µL of 5 M NaCl and 2 µL RNase A (10 mg/mL) was added to each sampleand incubated while shaking at 1200rpm, 65°C overnight. The next day, 2 µL proteinase K (20 mg/mL)was added to each sample and incubated while shaking at 1400 rpm, 60°C for 1 hour. DNA was puri�edusing a QIAGEN QIAquick PCR puri�cation kit (cat. Number 28104).
2.8 ChIP-Sequencing Sample Preparation and Analysis1 to 10 ng of DNA was prepared for sequencing using NEBNext Ultra II DNA Library Prep Kit (E7645S) andNEBNext® Multiplex Oligos for Illumina® (Index Primers Set 1) (E7335S). DNA was sequenced at theUAlbany Center for Functional Genomics using the Illumina NextSeq 500 with single end 75 bp reads.Quality of samples for ChIP were assessed using the Bioconductor package FastQC (version 0.11.9).Data was mapped to the human reference genome (hg38 assembly) using STAR Aligner (version 2.7.0).PCR duplicated reads were �ltered using Sambamba (version 0.7.1). The MACS2 (version 2.2.7.1)algorithm was used to identify enriched regions (peaks). Default parameters were used except to ensurebroad regions were identi�ed; broad peak calling was used with a broad cutoff of 0.1. Reads werenormalized to mapped reads.
2.9 Super-enhancer Identi�cation

Page 10/30
Super-enhancers were de�ned by stitching peaks using Rank Order Super-Enhancer (ROSE) (versionpython 2.7.3) with default parameters, except TSS exclusion zone size was adjusted to 250 bp. TSSexclusion was used because the H3K27ac signal is enriched for both active enhancers and promoters.However, several high-throughput reporter studies in mammals assessing either selected genomic regions(e.g. open chromatin regions or transcription factor binding sites) or human whole genomes have alsofound a substantial proportion of enhancers overlapping TSS-proximal regions (18) (19). Signals forsuper-enhancers identi�ed in each cell line were quanti�ed in progression. Brie�y, super-enhancer bed �lesfor each cell line were collapsed into AllSEs.bed using bedtools merge. Coverage of AllSEs.bed wasquanti�ed using bam �les for each cell line in the progression series using bedtools intersect. Reads werenormalized to the sequencing depth, and fold-change was calculated. H3K27ac ChIP seq data for ER + patients was obtained from European Nucleotide Archive under project no. PRJEB22757 and for TNBCpatient samples and TNBC cell lines under project no. PRJEB33558
2.10 Acquired/Lost Super-enhancer Identi�cationAcquired super-enhancer regions were classi�ed at the AT1 stage in progression by comparing super-enhancers ranked in AT1 cells with super-enhancers ranked in MCF10A cells and only keeping those thatwere ranked as super-enhancers in AT1 but not in MCF10A cells using bedtools intersect. Similarly, super-enhancers acquired at the DCIS stage were those that were ranked in DCIS cells but were not ranked inMCF10A and AT1 cells. Lastly, super-enhancers acquired at the CA1 stage were only ranked in CA1 cellsbut not in MCF10A, AT1, and DCIS cells. Lost super-enhancers were identi�ed by comparing super-enhancers ranked in AT1, DCIS, and CA1 cells with super-enhancers in MCF10A cells and observing thosethat were not present in the corresponding cells but were in the normal MCF10A cells. Genes within 50 kbof the acquired/lost super-enhancers were classi�ed using bedtools closest function. Gene Ontology (GO)analysis of these genes was performed using ENRICHR.
2.11 Statistical AnalysisAll experiments were run in triplicate, except ChIP seq, which were done in duplicates. Data arerepresented as the mean ± standard deviation (mean ± SD). All statistical analyses were carried out usingGraphPad Prism 9 Software (La Jolla, CA, USA). Statistical signi�cance was analyzed by Student’s t-test.p < 0.05 (compared with the negative control group) was considered signi�cant and is marked with anasterisk in the �gures.
3. Results
3.1 Global analysis of SE-lncRNAs acquired in IDCprogressionUnderlying mechanisms that support breast cancer progression have been well studied. However, clearfunctional determinants segregating non-invasive from invasive tumors have yet to be de�ned. Acquired
Page 11/30
lncRNAs transcribed from super-enhancers can lead to discovering markers of progression, improvingbreast cancer diagnostics and treatment for patients. The MCF10A progression series mimicsprogression of breast cancer originating within the epithelial cells of the mammary ducts. Theprogression series was originally generated from MCF10A (10A) cells, a spontaneously immortalizedmammary epithelial cell line derived from benign breast tissue from a woman with �brocystic disease.MCF10A cells were transformed with oncogenic HRAS to generate MCF10AT1 pre-malignant cells thatform atypical ductal hyperplasia in mice(21). MCF10DCIS.com (DCIS.com) cells were derived fromMCF10AT1 xenograft model and form predominantly comedo DCIS when injected into mice (22).MCF10CA1 (CA1) cells, derived from MCF10AT1, form poorly differentiated malignant tumors inxenograft models(23). Arraystar has developed a platform to comprehensively study super-enhancerlncRNAs and their downstream targets(20). Taking advantage of this commercially available approach,we assessed SE-lncRNA expression within the MCF10A progression series. This analysis interrogated7753 SE-lncRNAs (Fig. 1A), as well as 7040 associated mRNAs(24).
We found that super-enhancer associated lncRNAs are dynamically expressed during breast cancerprogression. There are patterns of both SE-lncRNAs being acquired and lost as well as several SE-lncRNAs that exhibit a stepwise gain or loss in expression in progression (Supplementary Table 1). Whilethe heat map from our analysis (Fig. 1A) demonstrates dynamic expression changes, the majority ofthese lncRNAs are not functionally de�ned.
Enhancer elements may become engaged either distally or locally to impact target gene expression.Trans-acting lncRNAs are transcribed, processed and then vacate their sites of transcription to exert theirfunction elsewhere, akin to mRNAs. Their �nal destination, be it in the cytoplasm or nucleus, does notdepend on their transcription site(25). By contrast, cis-acting lncRNAs are those whose activity is based atand dependent on the loci from which they are transcribed. Transcripts with the potential of acting in cislikely make up a substantial portion of known lncRNAs: the majority of lncRNAs are enriched in thechromatin fraction, and speci�cally are tethered to chromatin, presumably at their sites of transcription,through Pol II (25, 26). If functional, this would indicate that the effects of these lncRNAs are centered atthese loci. In addition, the fairly low levels at which lncRNAs are generally expressed, oftentimes just afew molecules per cell, naturally favor a cis mechanism of action, as diffusion or transport to othercellular compartments would render these transcripts too diluted to mediate a plausible function (27).Identifying distally engaged enhancer elements is di�cult since within the three-dimensional structure ofthe nucleus there are a myriad of possible locations they can interact.
To classify super-enhancers that may become locally engaged and regulate cancer progression, weapplied �lters to identify potential cis-acting SE-lncRNAs (Fig. 1B). First, from the 7753 SE-lncRNAsscreened (Fig. 1B), we sorted and extracted SE-lncRNAs that are up or down regulated from normal 10Acells to invasive CA1 cells (fold change cut-off: +/- 2). Furthermore, from these SE-lncRNAs that met ourcutoff, we identi�ed those which have neighboring genes within 50 kilo-bases upstream or downstreamof the lncRNA that also demonstrate changing expression. This allowed us to identify 138 SE-lncRNAs(Supplementary Table 2). Gene Ontology (GO) assessment on the list of mRNAs was performed to

Page 12/30
provide insight into what pathways the SE-lncRNAs might be regulating (Fig. 1C). Many pathways thatappear in our GO analysis, such as focal adhesion, p53 signaling pathway, and JAK-STAT signalingpathway, constitute a major group of related signaling pathways that control proliferation, survival,angiogenesis and metastasis of breast cancer, suggesting these SE-lncRNAs could be regulatingcanonical cancer promoting genes.
3.2 Identifying clinically relevant potentially cis-acting SE-lncRNAsTo give clinical relevance to our data, these 138 SE-lncRNAs were cross-referenced with The Atlas of Non-coding RNAs In Cancer (TANRIC), which compiles patient data from The Cancer Genome Atlas (TCGA),and data from Cancer Cell Line Encyclopedia (CCLE)(28). From our list of 138 SE-lncRNAs that areassociated with mRNAs within the MCF10A series, we identi�ed 27 SE-lncRNAs that are annotated inpatient samples within TANRIC (Fig. 2). If a SE-lncRNA is cis-acting and impacting enhancer activity orassociated mRNA expression, then a change in SE-lncRNA expression should be accompanied by achange in target mRNA expression. Therefore, we next identi�ed mRNAs whose expression levelscorrelated in patient samples within all subtypes of breast cancer for each of these 27 SE-lncRNAs(Pearson correlation coe�cient ≥ 0.5 or ≤ -0.5). This analysis identi�ed 11 SE-lncRNAs as potentially cis-acting (Fig. 3A). The remaining 16 SE-lncRNAs were further �ltered out to focus on those whoseneighboring mRNAs expression showed similar trends from normal to tumorous cells in patient samplesand our progression series (Fig. 3B). Lastly, we took the most differentiated SE-lncRNAs (Fig. 1B) withinthe progression series from our array (fold change cut-off: +/- 10) and highlighted 4 that were annotatedby TANRIC (Fig. 3C). From our approach to identify potentially cis-acting SE-lncRNAs, we narrowed ourlist from 7753 to 31, with 11 likely to function in cis, as well as 4 SE-lncRNAs selected for follow up due tohigh differential expression within disease progression.
3.3 Characterization of potential cis-acting SE-lncRNAsOur approach to identify cis-acting SE-lncRNAs in progression provided 31 potential targets, 11 of whichare highly promising, as well as 4 SE-lncRNAs with the highest differential expression within diseaseprogression. Cis-acting SE-lncRNAs are expected to be localized within the nucleus; thus, to focus andnarrow our list of potentially cis-acting SE-lncRNAs that are active in progression of DCIS to IDC, weinvestigated their sub cellular location. Whole cell lysate, as well as separated cytoplasmic fraction andnuclear fraction were extracted from the 10A and CA1 cells. These cell lines were chosen to determine iflocalization changed during progression. For all samples, 87.5 % of the sample was used for RNAextraction while 12.5 % was used for an immunoblot to ensure the fractionation was done correctly (Fig.4A). The 7:1 ratio was used to maximize RNA content as lncRNAs are relatively lowly expressed. From the31 SE-lncRNAs, 14 were primarily localized within the nucleus (Fig. 4B and 4C). The remaining 17 wereeither localized within the cytoplasm or were expressed at low levels that localization could not bedetermined (Supplementary Fig. 1).
Page 13/30
Next, we utilized 24 DCIS and 24 IDC Formalin-Fixed Para�n-Embedded (FFPE) patient samples ofvarying subtypes to assess the expression levels of the 14 SE-lncRNAs. Of the 14 SE-lncRNAs we testedin patient samples, RP11-379F4.4 and RP11-465B22.8 stood out as their increase in expression fromDCIS to IDC was statistically signi�cant and the expression levels matched our MCF10A model (Fig. 4Dand E). The remaining targets either did not show signi�cant results (Supplementary Fig. 2) or expressionwas not determined. We have discovered several SE-lncRNAs that exhibit dynamic expression inprogression, but more importantly, our approach has identi�ed 2 of the most promising, potentially cis-acting, target SE-lncRNAs (Fig. 4D and E) that, by regulating nearby gene expression, could be crucial inthe progression of indolent DCIS to IDC.
3.4 Classi�cation of super-enhancers in breast cancerprogressionTo complement our SE-lncRNA data, we identi�ed super-enhancers in the MCF10A progression series.Enhancers are critical signaling elements regardless of their association with SE-lncRNAs, therefore weperformed H3K27ac chromatin immunoprecipitation (ChIP) to identify global enhancer activity(Supplementary Fig. 3). This analysis enabled us to identify super-enhancers at each stage ofprogression as well as active elements that may be predictive of progression. H3K27ac has previouslybeen demonstrated to identify 2–3 times more enhancer regions of interest than Med1 alone(29). Super-enhancer regions were identi�ed using the Rank Order Super-Enhancer (ROSE) algorithm(30) (Fig. 5A).Our analysis determined 403 super-enhancer regions in 10A, 627 in AT1, 1053 in DCIS, and 320 in CA1cells (Supplementary Table 3). Interestingly, a stepwise increase in the number of super-enhancer regionswas seen from MCF10As to DCIS cells, however in invasive CA1 cells the number of super-enhancersregions classi�ed decreased. Although the number of classi�ed super-enhancers decreased in CA1 cells,the H3K signal is, on average, three-fold more. In other words, even though the number of genomicregions that meet the threshold to be ranked as super-enhancers decrease from 10A to CA1 cells, a higherH3K signal is seen in CA1 cells indicating a higher expression of those genomic regions.
Despite being classi�ed as a super-enhancer in one cell line, a region may not be classi�ed as a super-enhancer in another because ROSE compares signal intensity within cell lines and not between cell linesto rank super-enhancers. Consequently, we analyzed H3K27ac signal intensity of super-enhancer regionsidenti�ed in each cell line in the MCF10A progression series and observed their signal in thecorresponding cell lines (Fig. 5B). Many of the super-enhancers classi�ed in MCF10As lose signalintensity in AT1, DCIS, and CA1 cells indicating a loss of genomic expression within these regions. Similartrends of loss and gain of signal of the super-enhancers classi�ed in AT1 and DCIS cells are seen (Fig.5B). In conjunction with the higher H3K27ac signal observed for all CA1 identi�ed super-enhancers, mostof these regions are upregulated for H3K27ac signal (Fig. 5B). Correspondingly, we scanned the rankedsuper-enhancer regions in the progression series for our 2 identi�ed SE-lncRNAs (Fig. 4D and E), RP11-379F4.4 and RP11-465B22.8. H3K27ac signal intensity was observed to increase in a stepwise mannerfor both targets (Fig. 5C), demonstrating that these genomic regions increase in accessibility inprogression and contribute to a higher expression of their neighboring genes. Furthermore, RP11-379F4.4
Page 14/30
is ranked as a super-enhancer in DCIS (#8) as well as CA1 (#92) cells (Supplementary Table 3). Thesechanges in the enhancer activation of DNA within progression are crucial to helping understandingprogression of normal tissue to cancerous.
3.5 Acquired/Lost super-enhancers in breast cancerprogressionWe examined our super-enhancer list to unravel newly acquired super-enhancers at each stage inprogression in addition to super-enhancers lost at each stage relative to MCF10A cells (Fig. 6). 383 super-enhancers were newly acquired at the AT1 stage, 684 were newly acquired in DCIS, while only 28 werenewly acquired at the CA1 stage (Supplementary Table 3). Consistent with previously established trends,most of the newly acquired super-enhancers were classi�ed in AT1 and DCIS cells. Gene ontologyassessment on the closest genes to these regions reveal many acquired pathways including STATsignaling in AT1 and NF-kB signaling in DCIS, which are putative pathways known for promotingproliferation and tumorigenesis (Fig. 6). Conversely, 173, 120, and 259 super-enhancers were lost at AT1,DCIS, and CA1 stages respectively (Supplementary Table 3). Similarly, a gene ontology assessment ongenes ( 100 kb up or downstream) near lost super-enhancers reveal protein folding and local estrogenproduction as major pathways lost in progression (Fig. 6).
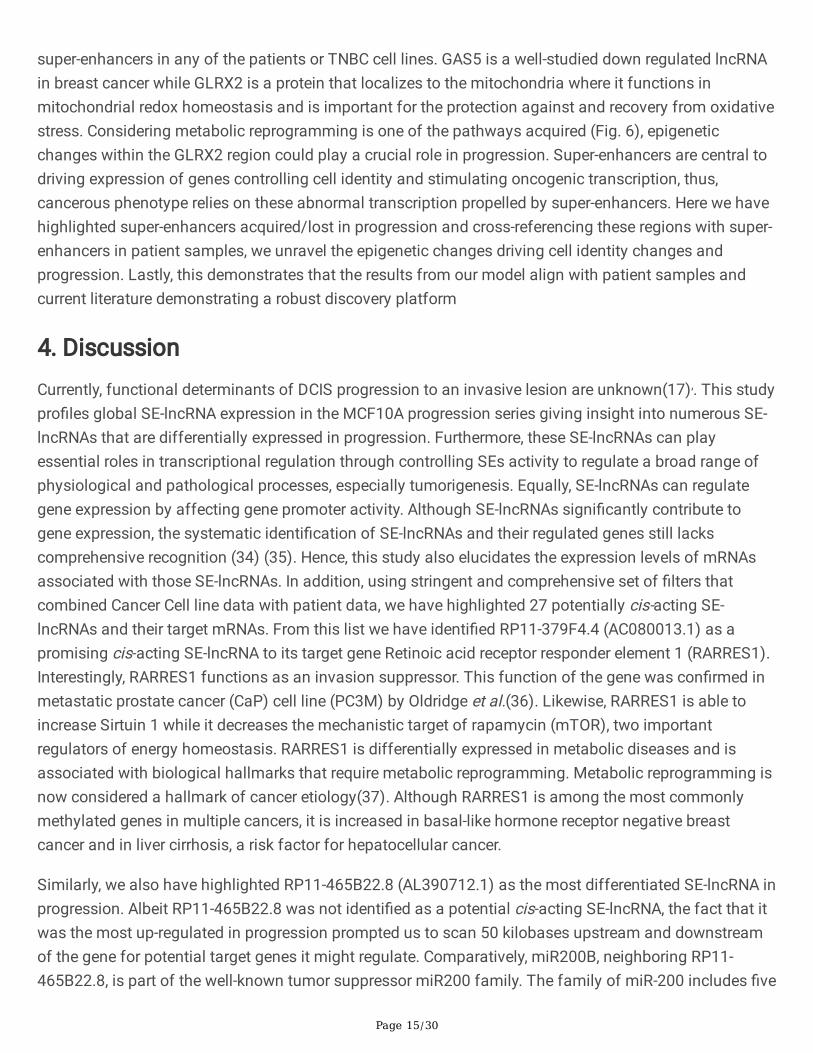
3.6 Comparison of acquired/lost super-enhancers in theMCF10A model with super-enhancers classi�ed in ER + andTriple Negative Breast Cancer patientsTo couple our MCF10A series �ndings with patient data, we identi�ed super-enhancers in 47 estrogenreceptor positive (ER+) patient samples (31), 10 triple-negative breast cancer (TNBC) patient samples,and 11 triple-negative breast cancer cell lines (TNBCC)(32) (Supplementary Table 4). Comparisonanalysis of acquired super-enhancer regions at each stage in progression was performed with super-enhancer regions in patient samples and TNBCC (Fig. 7A) (Supplementary Table 4). Super-enhancersacquired/lost in progression that were most represented in ER + and TNBC patients are listed (Fig. 7A).We highlight super-enhancer regions and their neighboring genes that were well represented in patientsamples, TNBCC, and our progression series (Fig. 7B). Ephrin Type-A Receptor 2 (EphA2) region wasclassi�ed as a super-enhancer at the DCIS stage in progression as well as being classi�ed as a super-enhancer region in 34/47 ER + patients and 10/10 TNBC patients. Similarly, the region containingCadherin 23 (CDH23) which was acquired at the CA1 stage in progression as a super-enhancer, wasclassi�ed as a super-enhancer in 6/47 ER + patients and 10/10 TNBC patients. Interestingly, TranscriptionFactor AP-2 Alpha (TFAP2A) region was not ranked as a super-enhancer in any of the ER + patients whileit was in all TNBC patients. Sumoylation of TFAP2A has been shown to block its ability to induce theexpression of luminal genes and maintain a basal/triple-negative cancer subtype(33). At the same time,genomic regions containing Glutaredoxin 2 (GLRX2), Laminin Subunit Alpha 2 (LAMA2), and GrowthArrest Speci�c 5 (GAS5), which are lost at the AT1 and DCIS stages respectively, were not ranked as
Page 15/30
super-enhancers in any of the patients or TNBC cell lines. GAS5 is a well-studied down regulated lncRNAin breast cancer while GLRX2 is a protein that localizes to the mitochondria where it functions inmitochondrial redox homeostasis and is important for the protection against and recovery from oxidativestress. Considering metabolic reprogramming is one of the pathways acquired (Fig. 6), epigeneticchanges within the GLRX2 region could play a crucial role in progression. Super-enhancers are central todriving expression of genes controlling cell identity and stimulating oncogenic transcription, thus,cancerous phenotype relies on these abnormal transcription propelled by super-enhancers. Here we havehighlighted super-enhancers acquired/lost in progression and cross-referencing these regions with super-enhancers in patient samples, we unravel the epigenetic changes driving cell identity changes andprogression. Lastly, this demonstrates that the results from our model align with patient samples andcurrent literature demonstrating a robust discovery platform
4. DiscussionCurrently, functional determinants of DCIS progression to an invasive lesion are unknown(17),. This studypro�les global SE-lncRNA expression in the MCF10A progression series giving insight into numerous SE-lncRNAs that are differentially expressed in progression. Furthermore, these SE-lncRNAs can playessential roles in transcriptional regulation through controlling SEs activity to regulate a broad range ofphysiological and pathological processes, especially tumorigenesis. Equally, SE-lncRNAs can regulategene expression by affecting gene promoter activity. Although SE-lncRNAs signi�cantly contribute togene expression, the systematic identi�cation of SE-lncRNAs and their regulated genes still lackscomprehensive recognition (34) (35). Hence, this study also elucidates the expression levels of mRNAsassociated with those SE-lncRNAs. In addition, using stringent and comprehensive set of �lters thatcombined Cancer Cell line data with patient data, we have highlighted 27 potentially cis-acting SE-lncRNAs and their target mRNAs. From this list we have identi�ed RP11-379F4.4 (AC080013.1) as apromising cis-acting SE-lncRNA to its target gene Retinoic acid receptor responder element 1 (RARRES1).Interestingly, RARRES1 functions as an invasion suppressor. This function of the gene was con�rmed inmetastatic prostate cancer (CaP) cell line (PC3M) by Oldridge et al.(36). Likewise, RARRES1 is able toincrease Sirtuin 1 while it decreases the mechanistic target of rapamycin (mTOR), two importantregulators of energy homeostasis. RARRES1 is differentially expressed in metabolic diseases and isassociated with biological hallmarks that require metabolic reprogramming. Metabolic reprogramming isnow considered a hallmark of cancer etiology(37). Although RARRES1 is among the most commonlymethylated genes in multiple cancers, it is increased in basal-like hormone receptor negative breastcancer and in liver cirrhosis, a risk factor for hepatocellular cancer.
Similarly, we also have highlighted RP11-465B22.8 (AL390712.1) as the most differentiated SE-lncRNA inprogression. Albeit RP11-465B22.8 was not identi�ed as a potential cis-acting SE-lncRNA, the fact that itwas the most up-regulated in progression prompted us to scan 50 kilobases upstream and downstreamof the gene for potential target genes it might regulate. Comparatively, miR200B, neighboring RP11-465B22.8, is part of the well-known tumor suppressor miR200 family. The family of miR-200 includes �ve

Page 16/30
members: miR-200a, miR-200b, miR-200c, miR-429, and miR-141. miR-200b, which acts as anantioncogene, participates in the proliferation and metastasis inhibition of different kinds of cancers bydownregulating target molecules. For instance, miR-200b inhibition promotes Rac1 activation andincreases the metastatic potential of HBEC cells(38). miR-200b can repress angiogenesis by targetingangiogenic factors and receptors(39). It can inhibit the epithelial to mesenchymal transition (EMT) byinactivating transcription factors in breast cancer. miR-200b is associated with the estrogen receptorstatus of breast cancer cells (39, 40). Zheng et al. also highlight Fucosyltransferase IV (FUT4) couldapply as a novel target for miR-200b that suppresses the proliferation and metastasis of breast cancercells by reducing α1,3-fucosylation and LeY biosynthesis of glycoproteins(41). Thus, SE-lncRNAs RP11-379F4.4 and RP11-465B22.8 and their respective potential targets are promising candidates for their cis-acting capabilities leading to progression.
In the past decade, increasing evidence has revealed that super-enhancers play a vital role intumorigenesis and there is great interest in developing super-enhancer therapeutics, thus, this study alsoelucidates super-enhancers that are acquired or lost in progression. We pro�led H3K27ac using ChIP inthe MCF10A progression series. As enhancers and super-enhancers play an important role in driving cellidentity, the alteration in intensity of the H3K27ac in progression paints a picture of epigenetic changeswhich could be leading to the hijacking of genes involved in various hallmarks of cancer.
Correspondingly, we uncover newly acquired super-enhancers at each stage in progression in addition tosuper-enhancers lost at each stage relative to MCF10A cells. This analysis enabled us to highlight anddistinguish loci that are activated/suppressed. Importantly, we identi�ed 28 super-enhancers that areacquired from DCIS to CA1 transition and over 100 super-enhancers that are lost from DCIS to CA1.Furthermore, we classify genes neighboring these acquired/lost regions which identify pathways thatcontribute to progression. For example, STAT signaling is acquired in AT1 transition from normal cells,while NF-kB signaling is acquired in the transition to DCIS. Similarly, protein folding and local estrogenproduction pathways are lost overall in progression in addition to regions responsible for cell cycleregulation. These are canonical cancer pathways leading to proliferation and metastasis. Here we showhow super-enhancers being activated/suppressed neighboring genes involved in these pathways areinvolved in their misregulation.
Comparison of acquired/lost super-enhancer regions with super-enhancer regions classi�ed in 47 ER + patients, 10 TNBC patients, and 11 TNBC cell lines provides clinical relevance. This comprehensiveanalysis reveals epigenetic changes at the genome wide level in breast tumors. For example, Ephrin type-A receptor 2 (EphA2), is a receptor tyrosine kinase which binds ephrin-A family ligands residing onadjacent cells, leading to contact-dependent bidirectional signaling into neighboring cells. This gene hasbeen known to regulate migration, integrin-mediated adhesion, proliferation and differentiation of cellsthrough DSG1/desmoglein-1 and inhibition of the ERK1/ERK2 signaling pathway (42). EphA2 has beenimplicated in breast tumors and resistance of tumors to targeted therapies (42) (43) (44). TargetingEphA2 has been shown to inhibit cell cycle progression and proliferation (42). The genomic regioncontaining EphA2 is an acquired super-enhancer at the DCIS stage in our progression model. Interestingly,

Page 17/30
it is also classi�ed as a super-enhancer region in 34/47 ER + patient samples and 10/10 TNBC patients inour analysis. This explains the observed overexpression of this gene in breast tumors and can providenew targeting methods. Identically, the region containing GAS5 lncRNA is classi�ed as a super-enhanceron normal MCF10A cells, however, is lost at the AT1, DCIS, and CA1 stages. Neither is it classi�ed as asuper-enhancer in all 47 ER + and 9/10 TNBC patients implying a mechanism of the down-regulation seenof this lncRNA in breast tumors. GAS5 can bind to the DNA binding domain of the glucocorticoid receptorinactivating it and subsequently inhibiting the regulation of its target genes. In addition, GAS5 canregulate the transcriptional activity of other receptors, such as androgen and progesterone and has beensuggested as a potential tumor suppressor due to its pro-apoptotic function. The epigenetic changesoccurring within this region can explain the down-regulation of this lncRNA and reduce its effects incarrying out normal processes leading to tumorigenesis.
Lastly, we also analyzed the regions that contained our two identi�ed targets, RP11-379F4.4 and RP11-465B22.8, to see if they were classi�ed as super-enhancers in progression. RP11-379F4.4 was ranked asa super-enhancer in DCIS as well as CA1 cells and is seen to be acquired during progression. RP11-465B22.8 was not ranked as a super-enhancer by the ROSE algorithm in any of the cells, however, thesignal intensity of H3K27ac saw a dramatic stepwise increase from normal to CA1 cells. This resultveri�es the enhanced transcription that is observed of these SE-lncRNAs and hints at a possible role thatthey may play to induce progression. We also examined if RP11-379F4.4, which was an acquired super-enhancer at the DCIS stage in progression, was classi�ed as a super-enhancer in any of the patientsamples. Although RP11-379F4.4 was not classi�ed as a super-enhancer in patient samples, itsclassi�cation as an enhancer represents open DNA, and most likely, the cause of its higher expressionseen in CA1 cells and patient tumors. Super-enhancers associate with key oncogenes in cancers anddrive expression of genes that de�ne cell identity. Additionally, cancer cells can acquire super-enhancersat oncogenes while losing super-enhancers at tumor suppressing genes. Understanding the alterations inthe genomic landscape within breast tumors will uncover underlying biology that can be useful indiagnostic and targeted therapies.
The data presented here highlights several SE-lncRNAs that through their potential cis-acting abilities playan important role in progression of DCIS lesions into invasive IDC. Furthermore, we have identi�ed twopromising target SE-lncRNAs that may regulate their neighboring genes leading to progression. Futurestudies will expand on understanding their potential cis-acting functions in the progression series as wellas expanding to patient samples. Equally, we reveal acquired/lost super-enhancers in progressioncoupled with patient data that can help elucidate the epigenetic alterations promoting cancerousphenotypes. While there may not be one key protein that determines DCIS progression, understanding thenetworks of signaling pathways that change during progression unravel critical changes that push aDCIS lesion to be invasive.
5. Conclusion
Page 18/30
Altogether, this comprehensive study of breast cancer cell lines coupled with patient samples provides aunique platform that identi�es differentially expressed SE-lncRNAs and acquired/lost super-enhancers inprogression of breast cancer important for promoting DCIS lesions to IDC.
AbbreviationsDCIS - Ductal Carcinoma in Situ
IDC - Invasive Ductal Carcinoma
SE - Super-Enhancer
SE-lncRNA - Super-enhancer long non-coding RNA
10A - MCF10A
ChIP - Chromatin Immunoprecipitation
ER+ - Estrogen Receptor positive
TNBC - Triple Negative Breast Cancer
Declarations
Con�ict of InterestsThe authors declare no con�ict of interest.
Ethics approval and consent to participateThe protocol of deriving primary human epithelial cells from normal tissues adjacent to breast tumorsfrom breast cancer patients was approved by the institutional review board at Fox Chase Cancer Center.
Consent for publicationNot applicable
FundingThis work was supported by Susan G Komen Foundation grant 1144184-1-80226

Page 19/30
Author ContributionsAR - designed the study, performed all experiments and analysis, and wrote the paper. RD - designed thestudy, analyzed microarray data, helped with patient expression data and analysis. JE - performed ROSEanalysis of ER + and TNBC patient samples, performed statistical analysis of in-house patient samples.SC - provided expertise on sequencing of ChIP seq samples and helped with ChIP seq experiments. JH -principal investigator and mentor.
AcknowledgementsSpecial thanks to Marcy Kuentzel and Andrew Hayden at the CFG Core SUNY Albany for their expertiseand help with ChIP sequencing, qPCR expression data, and patient data.
Availability of data and MaterialThe dataset generated and analyzed during the current study is available from the corresponding authoron request. In addition, the H3K27ac ChIP-seq data for the MCF10A progression series discussed in thispublication has been deposited in NCBI’s Gene Expression Omnibus database under accession number GSE181524 .
References1. Vaidya JC, Patkar V. Fast Facts: Early Breast Cancer [Internet]. 2016. Available from:
http://dx.doi.org/10.1159/isbn.978-1-910797-25-9
2. Breast Cancer Facts & Figures [Internet]. [cited 2020 Sep 3]. Available from:https://www.cancer.org/research/cancer-facts-statistics/breast-cancer-facts-�gures.html
3. Lian J, Li K. A review of breast density implications and breast cancer screening [Internet]. ClinicalBreast Cancer. 2020. Available from: http://dx.doi.org/10.1016/j.clbc.2020.03.004
4. Virnig BA, Wang S-Y, Shamilyan T, Kane RL, Tuttle TM. Ductal Carcinoma In Situ: Risk Factors andImpact of Screening [Internet]. Vol. 2010, JNCI Monographs. 2010. p. 113–6. Available from:http://dx.doi.org/10.1093/jncimonographs/lgq024
5. Mansour MR, Abraham BJ, Anders L, Berezovskaya A, Gutierrez A, Durbin AD, et al. An oncogenicsuper-enhancer formed through somatic mutation of a noncoding intergenic element [Internet]. Vol.346, Science. 2014. p. 1373–7. Available from: http://dx.doi.org/10.1126/science.1259037
�. pubmeddev, Thandapani P. Super-enhancers in cancer. - PubMed - NCBI [Internet]. [cited 2020 Apr 18].Available from: https://www.ncbi.nlm.nih.gov/pubmed/30885876
7. Tang F, Yang Z, Tan Y, Li Y. Super-enhancer function and its application in cancer targeted therapy.NPJ Precis Oncol. 2020 Feb 12;4:2.

Page 20/30
�. He Y, Long W, Liu Q. Targeting Super-Enhancers as a Therapeutic Strategy for Cancer Treatment[Internet]. Vol. 10, Frontiers in Pharmacology. 2019. Available from:http://dx.doi.org/10.3389/fphar.2019.00361
9. Gregg C. Faculty of 1000 evaluation for Super-enhancers in the control of cell identity and disease[Internet]. F1000 - Post-publication peer review of the biomedical literature. 2013. Available from:http://dx.doi.org/10.3410/f.718140971.793486542
10. Hnisz D, Abraham BJ, Lee TI, Lau A, Saint-André V, Sigova AA, et al. Super-enhancers in the control ofcell identity and disease. Cell. 2013 Nov 7;155(4):934–47.
11. Hou Y, Zhang R, Sun X. Enhancer LncRNAs In�uence Chromatin Interactions in Different Ways[Internet]. Vol. 10, Frontiers in Genetics. 2019. Available from:http://dx.doi.org/10.3389/fgene.2019.00936
12. Rao MRS. Long Non Coding RNA Biology. Springer; 2017. 323 p.
13. Factor DC, Tesar PJ, Khalil AM. Chromatin Regulation by Long Non-coding RNAs [Internet]. MolecularBiology of Long Non-coding RNAs. 2013. p. 1–13. Available from: http://dx.doi.org/10.1007/978-1-4614-8621-3_1
14. Wang KC, Yang YW, Liu B, Sanyal A, Corces-Zimmerman R, Chen Y, et al. A long noncoding RNAmaintains active chromatin to coordinate homeotic gene expression. Nature. 2011 Apr7;472(7341):120–4.
15. pubmeddev, Sigova AA E al. Transcription factor trapping by RNA in gene regulatory elements. -PubMed - NCBI [Internet]. [cited 2020 Apr 18]. Available from:https://www.ncbi.nlm.nih.gov/pubmed/26516199
1�. Lee J-H, Xiong F, Li W. Enhancer RNAs in cancer: regulation, mechanisms and therapeutic potential[Internet]. RNA Biology. 2020. p. 1–10. Available from:http://dx.doi.org/10.1080/15476286.2020.1712895
17. DeVaux RS, Ropri AS, Grimm SL, Hall PA, Herrera EO, Chittur SV, et al. Long noncoding RNABHLHE40-AS1 promotes early breast cancer progression through modulating IL-6/STAT3 signaling. JCell Biochem. 2020 Jul;121(7):3465–78.
1�. Nguyen TA, Jones RD, Snavely AR, Pfenning AR, Kirchner R, Hemberg M, et al. High-throughputfunctional comparison of promoter and enhancer activities [Internet]. Vol. 26, Genome Research.2016. p. 1023–33. Available from: http://dx.doi.org/10.1101/gr.204834.116
19. Ernst J, Melnikov A, Zhang X, Wang L, Rogov P, Mikkelsen TS, et al. Genome-scale high-resolutionmapping of activating and repressive nucleotides in regulatory regions. Nat Biotechnol. 2016Nov;34(11):1180–90.
20. Shi Y, Shang J. Long Noncoding RNA Expression Pro�ling Using Arraystar LncRNA Microarrays[Internet]. Long Non-Coding RNAs. 2016. p. 43–61. Available from: http://dx.doi.org/10.1007/978-1-4939-3378-5_6
21. Soule HD, Maloney TM, Wolman SR, Peterson WD Jr, Brenz R, McGrath CM, et al. Isolation andcharacterization of a spontaneously immortalized human breast epithelial cell line, MCF-10. Cancer
Page 21/30
Res. 1990 Sep 15;50(18):6075–86.
22. Miller FR, Santner SJ, Tait L, Dawson PJ. MCF10DCIS.com Xenograft Model of Human ComedoDuctal Carcinoma In Situ. J Natl Cancer Inst. 2000 Jul 19;92(14):1185a – 1186.
23. Santner SJ, Dawson PJ, Tait L, Soule HD, Eliason J, Mohamed AN, et al. Malignant MCF10CA1 CellLines Derived from Premalignant Human Breast Epithelial MCF10AT Cells [Internet]. Vol. 65, BreastCancer Research and Treatment. 2001. p. 101–10. Available from:http://dx.doi.org/10.1023/a:1006461422273
24. Super-enhancer lncRNA Array Service [Internet]. [cited 2021 May 27]. Available from:https://www.arraystar.com/super-enhancer-lncrna-array-service/
25. Gil N, Ulitsky I. Regulation of gene expression by cis-acting long non-coding RNAs. Nat Rev Genet.2020 Feb;21(2):102–17.
2�. Hezroni H, Koppstein D, Schwartz MG, Avrutin A, Bartel DP, Ulitsky I. Principles of Long NoncodingRNA Evolution Derived from Direct Comparison of Transcriptomes in 17 Species [Internet]. Vol. 11,Cell Reports. 2015. p. 1110–22. Available from: http://dx.doi.org/10.1016/j.celrep.2015.04.023
27. Derrien T, Johnson R, Bussotti G, Tanzer A, Djebali S, Tilgner H, et al. The GENCODE v7 catalog ofhuman long noncoding RNAs: Analysis of their gene structure, evolution, and expression [Internet].Vol. 22, Genome Research. 2012. p. 1775–89. Available from:http://dx.doi.org/10.1101/gr.132159.111
2�. Li J, Han L, Roebuck P, Diao L, Liu L, Yuan Y, et al. TANRIC: An Interactive Open Platform to Explorethe Function of lncRNAs in Cancer. Cancer Res. 2015 Sep 15;75(18):3728–37.
29. Fong PK, Lee NK. Improved H3K27ac histone mark prediction using k-mer proximity feature [Internet].2015 9th International Conference on IT in Asia (CITA). 2015. Available from:http://dx.doi.org/10.1109/cita.2015.7349830
30. Whyte WA, Orlando DA, Hnisz D, Abraham BJ, Lin CY, Kagey MH, et al. Master transcription factorsand mediator establish super-enhancers at key cell identity genes. Cell. 2013 Apr 11;153(2):307–19.
31. Patten DK, Corleone G, Győrffy B, Perone Y, Slaven N, Barozzi I, et al. Enhancer mapping uncoversphenotypic heterogeneity and evolution in patients with luminal breast cancer. Nat Med. 2018Sep;24(9):1469–80.
32. Raisner R, Bainer R, Haverty PM, Benedetti KL, Gascoigne KE. Super-enhancer acquisition drivesoncogene expression in triple negative breast cancer. PLoS One. 2020 Jun 25;15(6):e0235343.
33. Bogachek MV, Chen Y, Kulak MV, Wood�eld GW, Cyr AR, Park JM, et al. Sumoylation pathway isrequired to maintain the basal breast cancer subtype. Cancer Cell. 2014 Jun 16;25(6):748–61.
34. McKinsey T. Faculty Opinions recommendation of Transcription of the non-coding RNA upperhandcontrols Hand2 expression and heart development [Internet]. Faculty Opinions – Post-PublicationPeer Review of the Biomedical Literature. 2018. Available from:http://dx.doi.org/10.3410/f.726887070.793551660
35. Ounzain S, Micheletti R, Arnan C, Plaisance I, Cecchi D, Schroen B, et al. CARMEN, a human superenhancer-associated long noncoding RNA controlling cardiac speci�cation, differentiation and

Page 22/30
homeostasis [Internet]. Vol. 89, Journal of Molecular and Cellular Cardiology. 2015. p. 98–112.Available from: http://dx.doi.org/10.1016/j.yjmcc.2015.09.016
3�. Oldridge EE, Walker HF, Stower MJ, Simms MS, Mann VM, Collins AT, et al. Retinoic acid repressesinvasion and stem cell phenotype by induction of the metastasis suppressors RARRES1 and LXN.Oncogenesis. 2013 Apr 15;2:e45.
37. Pavlova NN, Thompson CB. The Emerging Hallmarks of Cancer Metabolism. Cell Metab. 2016 Jan12;23(1):27–47.
3�. Wang Z, Humphries B, Xiao H, Jiang Y, Yang C. MicroRNA-200b Suppresses Arsenic-transformed CellMigration by Targeting Protein Kinase Cα and Wnt5b-Protein Kinase Cα Positive Feedback Loop andInhibiting Rac1 Activation [Internet]. Vol. 289, Journal of Biological Chemistry. 2014. p. 18373–86.Available from: http://dx.doi.org/10.1074/jbc.m114.554246
39. Chang S-H, Lu Y-C, Li X, Hsieh W-Y, Xiong Y, Ghosh M, et al. Antagonistic function of the RNA-bindingprotein HuR and miR-200b in post-transcriptional regulation of vascular endothelial growth factor-Aexpression and angiogenesis. J Biol Chem. 2013 Feb 15;288(7):4908–21.
40. Gregory PA, Bert AG, Paterson EL, Barry SC, Tsykin A, Farshid G, et al. The miR-200 family and miR-205 regulate epithelial to mesenchymal transition by targeting ZEB1 and SIP1. Nat Cell Biol. 2008May;10(5):593–601.
41. Zheng Q, Cui X, Zhang D, Yang Y, Yan X, Liu M, et al. miR-200b inhibits proliferation and metastasisof breast cancer by targeting fucosyltransferase IV and α1,3-fucosylated glycans. Oncogenesis. 2017Jul 10;6(7):e358.
42. Song W, Hwang Y, Youngblood VM, Cook RS, Balko JM, Chen J, et al. Targeting EphA2 impairs cellcycle progression and growth of basal-like/triple-negative breast cancers. Oncogene. 2017 Oct5;36(40):5620–30.
43. Tandon M, Vemula SV, Mittal SK. Emerging strategies for EphA2 receptor targeting for cancertherapeutics. Expert Opin Ther Targets. 2011 Jan;15(1):31–51.
44. Martini G, Cardone C, Vitiello PP, Belli V, Napolitano S, Troiani T, et al. EPHA2 Is a Predictive Biomarkerof Resistance and a Potential Therapeutic Target for Improving Antiepidermal Growth FactorReceptor Therapy in Colorectal Cancer. Mol Cancer Ther. 2019 Apr;18(4):845–55.
Figures
Page 23/30
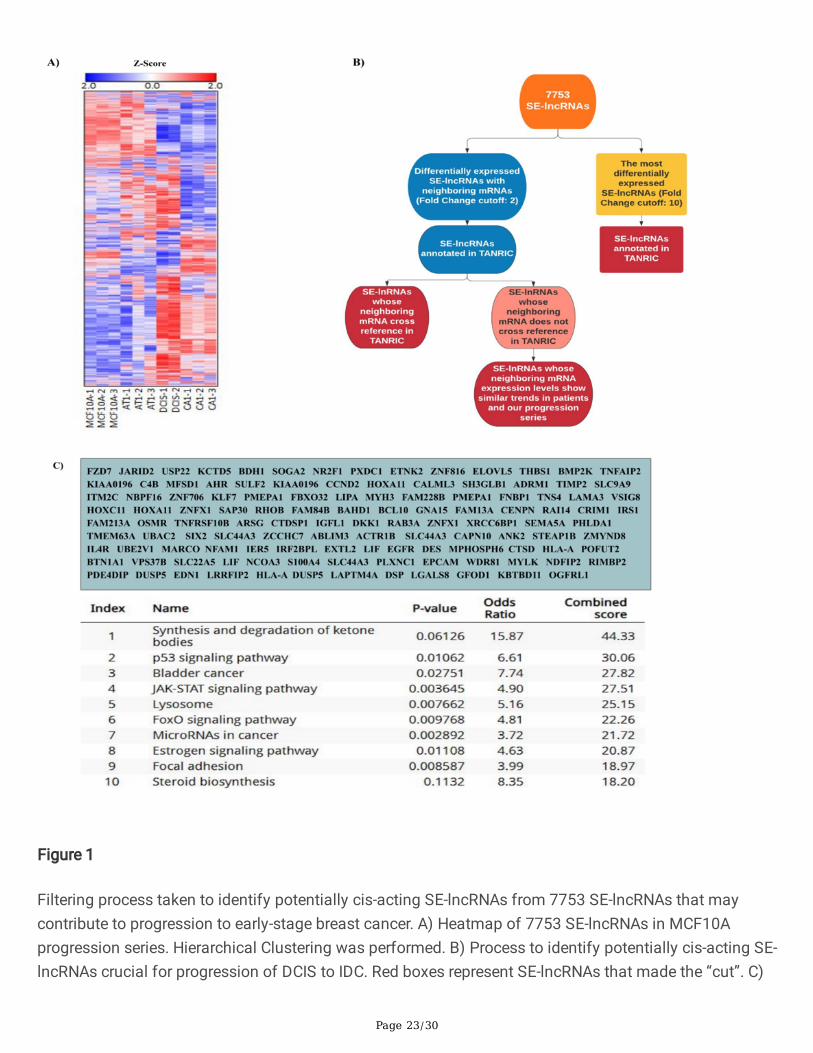
Figure 1
Filtering process taken to identify potentially cis-acting SE-lncRNAs from 7753 SE-lncRNAs that maycontribute to progression to early-stage breast cancer. A) Heatmap of 7753 SE-lncRNAs in MCF10Aprogression series. Hierarchical Clustering was performed. B) Process to identify potentially cis-acting SE-lncRNAs crucial for progression of DCIS to IDC. Red boxes represent SE-lncRNAs that made the “cut”. C)

Page 24/30
Gene Ontology analysis on the list of 138 mRNAs that were neighboring differentially expressed SE-lncRNAs (Fold Change cutoff: 2).
Figure 2
138 SE-lncRNAs �ltered to 27 SE-lncRNAs and their neighboring mRNAs. From 138 SE-lncRNAs, 27potentially cis-acting SE-lncRNAs and their neighboring mRNA were highlighted.

Page 25/30
Figure 3
Expression of 27 potentially cis-acting SE-lncRNAs and their neighboring mRNA and 4 of the highestdifferentially expressed SE-lncRNAs in the MCF10A progression series. A) Expression of 11 SE-lncRNAsand their neighboring mRNAs in progression that correlated in TANRIC. B) Expression of 16 SE-lncRNAsand their neighboring mRNAs in progression that did not correlate in TANRIC. C) Expression of the highestdifferentiated SE-lncRNAs in progression.

Page 26/30
Figure 4
Localization of the potential cis-acting SE-lncRNAs. A) Immunoblot of Cell Fractionation of Whole CellLysate, Cytoplasmic Fraction, and Nuclear Fraction in MCF10A and CA1 cells. GAPDH was used ascontrol for Cytoplasmic fraction while Tri-methyl Histone was used as control for Nuclear Fraction. B, C)Localization of 14 SE-lncRNAs (11 up-regulated and 3 down-regulated) from our list of 27 potentially cis-acting SE-lncRNAs and 4 highest differentiated that are primarily localized within the nucleus. D)Expression level of SE-lncRNA, RP11-379F4.1, and its neighboring mRNA, RARRES1, in MFC10Aprogression series, n =3, * = P < 0.05, paired t-test, error bars represent standard deviation. Expressionlevels of SE-lncRNA RP11-379F4.1 in 24 DCIS and 24 IDC patients (* = P < 0.05), unpaired t test. E)Expression level of the highest differentiated SE-lncRNA, RP11-465B22.8, in MCF10A progression series, n= 3, * = P < 0.05, paired t-test, error bars represent standard deviation. Expression levels of SE-lncRNARP11-465B22.8 in 16 DCIS and IDC patients (** = P < 0.005), unpaired t test.

Page 27/30
Figure 5
Super-enhancers Identi�ed in MCF10A progression series. A) Super-enhancers quanti�ed in the MCF10Aprogression series by H3K27ac signal applying the ROSE Algorithm. B) Heatmap of super-enhancerregions classi�ed in each cell line in MCF10A progression series and their H3K27ac signal incorresponding cell lines in the series (From Left to Right: MCF10A super-enhancers, AT1 super-enhancers,DCIS.com super-enhancers, and CA1 super-enhancers). Hierarchical Clustering was performed. C)H3K27ac signal at AC080013.1 (RP11-379F4.4), the most promising potential -cis acting SE-lncRNA, andAL390719.2 (RP11-465B22.8), the highest up-regulated SE-lncRNA in progression. H3K27ac signal wasnormalized to mapped reads.

Page 28/30
Figure 6
Super-enhancers Acquired/Lost in Progression. Number of newly acquired super-enhancer at each stagein progression in the MCF10A progression series and the number of lost super-enhancer at each stage inprogression relative to MCF10A. Super-enhancers that were acquired at a speci�c stage and were alsoranked as super-enhancers in later stages up to CA1 cells were classi�ed as retained. GO analysis ofneighboring genes (100 kb up or downstream) for each list of acquired/lost super-enhancer regionsclassi�ed in the MCF10A progression series. Pathways acquired at in progression at each stage areindicated by red arrows. Pathways lost in progression at each stage are indicated by blue arrows.

Page 29/30
Figure 7
Comparison of Super-Enhancers Acquired/Lost in Progression with Super-Enhancers Identi�ed in PatientSamples. A) Schematic of the comparison between super-enhancers acquired/lost in progression with 47estrogen receptor positive patients (ER+P), 10 triple-negative breast cancer patients (TNBCP) and 11triple-negative breast cancer cell lines (TNBCC). Top super-enhancers within our comparison are shown.The stage super-enhancers were acquired/lost at within our progression series and how many patientsamples they were present/not present in are listed, in addition to the nearest gene. B) 6 of the mostinteresting super-enhancer regions in our progression series that corresponded with patient samples withtheir nearest gene highlighted
Supplementary Files
This is a list of supplementary �les associated with this preprint. Click to download.
SupplementaryFigure1.docx
SupplementaryFigure2.docx
SupplementaryFigure3.docx
AllSElncRNArawvaluesinMFC10Aprogressionseries.xlsx
SupplementaryTable2.xlsx
SupplementaryTable3.xlsx

Page 30/30
SupplementaryTable4.xlsx