october 2010 world - world trade organization - home … 2010 world merchandise trade value, mn $...
TRANSCRIPT
October 2010
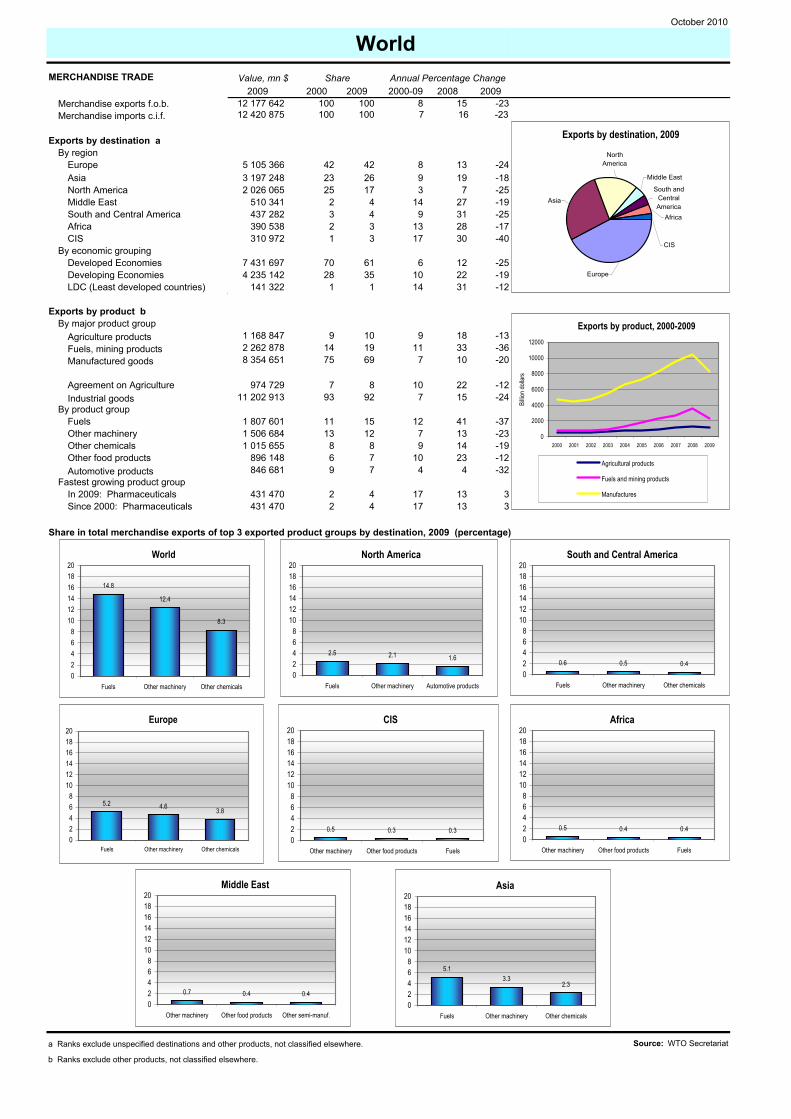
World MERCHANDISE TRADE Value, mn $
2009 2000 2009 2000-09 2008 2009Merchandise exports f.o.b. 12 177 642 100 100 8 15 -23 Merchandise imports c.i.f. 12 420 875 100 100 7 16 -23
Exports by destination aBy region
Europe 5 105 366 42 42 8 13 -24Asia 3 197 248 23 26 9 19 -18 North America 2 026 065 25 17 3 7 -25 Middle East 510 341 2 4 14 27 -19 South and Central America 437 282 3 4 9 31 -25 Africa 390 538 2 3 13 28 -17 CIS 310 972 1 3 17 30 -40
By economic grouping Developed Economies 7 431 697 70 61 6 12 -25 Developing Economies 4 235 142 28 35 10 22 -19 LDC (Least developed countries) 141 322 1 1 14 31 -12
Exports by product b By major product group
Agriculture products 1 168 847 9 10 9 18 -13Fuels, mining products 2 262 878 14 19 11 33 -36Manufactured goods 8 354 651 75 69 7 10 -20
Agreement on Agriculture 974 729 7 8 10 22 -12Industrial goods 11 202 913 93 92 7 15 -24
By product groupFuels 1 807 601 11 15 12 41 -37Other machinery 1 506 684 13 12 7 13 -23Other chemicals 1 015 655 8 8 9 14 -19Other food products 896 148 6 7 10 23 -12Automotive products 846 681 9 7 4 4 -32
Fastest growing product groupIn 2009: Pharmaceuticals 431 470 2 4 17 13 3Since 2000: Pharmaceuticals 431 470 2 4 17 13 3
Share in total merchandise exports of top 3 exported product groups by destination, 2009 (percentage)
a Ranks exclude unspecified destinations and other products, not classified elsewhere. Source: WTO Secretariat
b Ranks exclude other products, not classified elsewhere.
Share Annual Percentage Change
North America
2.5 2.1 1.6
02468
101214161820
Fuels Other machinery Automotive products
South and Central America
0.6 0.5 0.402468
101214161820
Fuels Other machinery Other chemicals
CIS
0.5 0.3 0.302468
101214161820
Other machinery Other food products Fuels
Africa
0.5 0.4 0.402468
101214161820
Other machinery Other food products Fuels
World
14.8
12.4
8.3
02468
101214161820
Fuels Other machinery Other chemicals
Europe
5.2 4.6 3.8
02468
101214161820
Fuels Other machinery Other chemicals
Middle East
0.7 0.4 0.402468
101214161820
Other machinery Other food products Other semi-manuf.
Asia
5.13.3
2.3
02468
101214161820
Fuels Other machinery Other chemicals
Exports by destination, 2009
Middle East
South and Central America
Africa
Europe
Asia
North America
CIS
Exports by product, 2000-2009
0
2000
4000
6000
8000
10000
12000
2000 2001 2002 2003 2004 2005 2006 2007 2008 2009
Billio
n doll
ars
Agricultural products
Fuels and mining products
Manufactures
October 2010
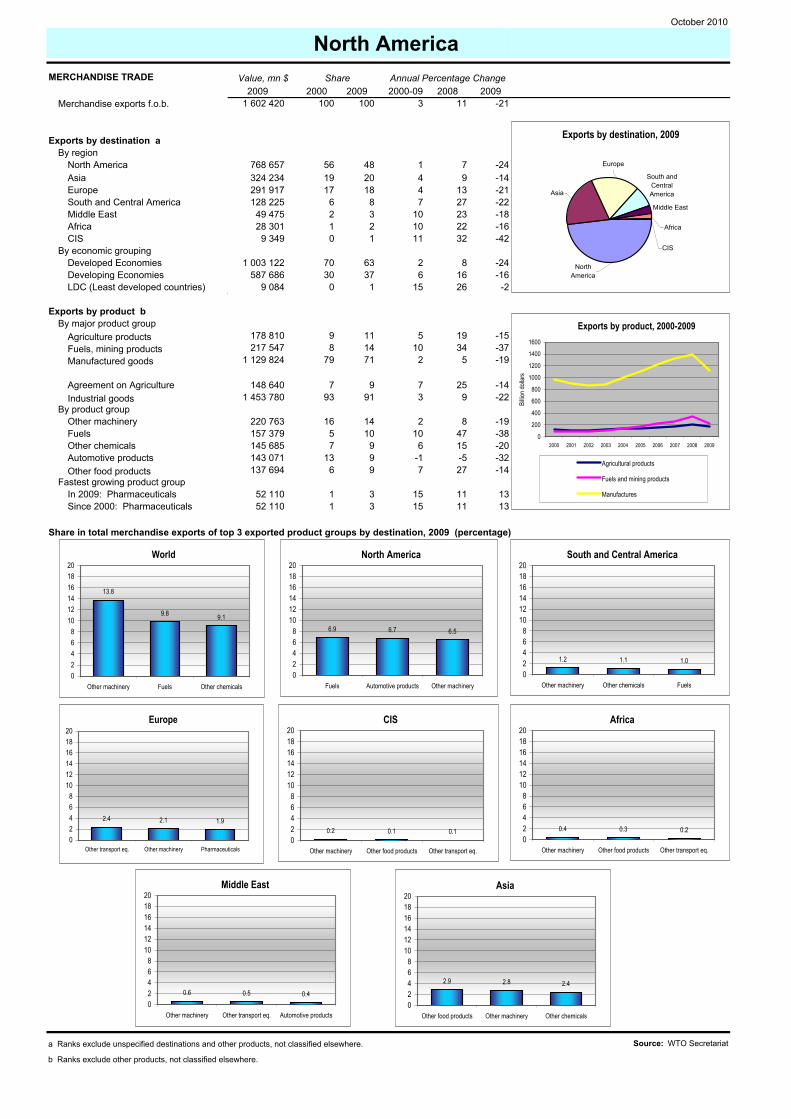
North America MERCHANDISE TRADE Value, mn $
2009 2000 2009 2000-09 2008 2009Merchandise exports f.o.b. 1 602 420 100 100 3 11 -21
Exports by destination aBy region
North America 768 657 56 48 1 7 -24Asia 324 234 19 20 4 9 -14 Europe 291 917 17 18 4 13 -21 South and Central America 128 225 6 8 7 27 -22 Middle East 49 475 2 3 10 23 -18 Africa 28 301 1 2 10 22 -16 CIS 9 349 0 1 11 32 -42
By economic grouping Developed Economies 1 003 122 70 63 2 8 -24 Developing Economies 587 686 30 37 6 16 -16 LDC (Least developed countries) 9 084 0 1 15 26 -2
Exports by product b By major product group
Agriculture products 178 810 9 11 5 19 -15Fuels, mining products 217 547 8 14 10 34 -37Manufactured goods 1 129 824 79 71 2 5 -19
Agreement on Agriculture 148 640 7 9 7 25 -14Industrial goods 1 453 780 93 91 3 9 -22
By product groupOther machinery 220 763 16 14 2 8 -19Fuels 157 379 5 10 10 47 -38Other chemicals 145 685 7 9 6 15 -20Automotive products 143 071 13 9 -1 -5 -32Other food products 137 694 6 9 7 27 -14
Fastest growing product groupIn 2009: Pharmaceuticals 52 110 1 3 15 11 13Since 2000: Pharmaceuticals 52 110 1 3 15 11 13
Share in total merchandise exports of top 3 exported product groups by destination, 2009 (percentage)
a Ranks exclude unspecified destinations and other products, not classified elsewhere. Source: WTO Secretariat
b Ranks exclude other products, not classified elsewhere.
Share Annual Percentage Change
North America
6.9 6.7 6.5
02468
101214161820
Fuels Automotive products Other machinery
South and Central America
1.2 1.1 1.0
02468
101214161820
Other machinery Other chemicals Fuels
CIS
0.2 0.1 0.102468
101214161820
Other machinery Other food products Other transport eq.
Africa
0.4 0.3 0.202468
101214161820
Other machinery Other food products Other transport eq.
World
13.8
9.8 9.1
02468
101214161820
Other machinery Fuels Other chemicals
Europe
2.4 2.1 1.9
02468
101214161820
Other transport eq. Other machinery Pharmaceuticals
Middle East
0.6 0.5 0.402468
101214161820
Other machinery Other transport eq. Automotive products
Asia
2.9 2.8 2.4
02468
101214161820
Other food products Other machinery Other chemicals
Exports by destination, 2009
South and Central America
Middle East
Africa
North America
Asia
Europe
CIS
Exports by product, 2000-2009
0
200
400
600
800
1000
1200
1400
1600
2000 2001 2002 2003 2004 2005 2006 2007 2008 2009
Billio
n doll
ars
Agricultural products
Fuels and mining products
Manufactures

October 2010
South and Central America MERCHANDISE TRADE Value, mn $
2009 2000 2009 2000-09 2008 2009Merchandise exports f.o.b. 458 867 100 100 10 21 -24
Exports by destination aBy region
South and Central America 119 959 26 26 10 30 -26North America 114 825 40 25 4 14 -32 Asia 95 590 10 21 20 23 -5 Europe 89 848 20 20 10 14 -26 Africa 12 994 1 3 19 21 -22 Middle East 11 330 1 2 17 29 -5 CIS 5 827 1 1 18 32 -33
By economic grouping Developed Economies 209 067 60 46 6 14 -29 Developing Economies 235 478 37 51 14 27 -17 LDC (Least developed countries) 5 464 0 1 24 26 2
Exports by product b By major product group
Agriculture products 139 737 27 30 11 24 -11Fuels, mining products 178 293 34 39 11 25 -31Manufactured goods 125 574 37 27 6 12 -27
Agreement on Agriculture 122 385 21 27 13 28 -11Industrial goods 336 483 79 73 9 19 -28
By product groupOther food products 118 019 21 26 12 27 -10Fuels 109 610 24 24 10 41 -34Ores and minerals 42 271 5 9 17 10 -26Non-ferrous metals 26 413 5 6 12 -7 -24Other chemicals 24 992 5 5 10 22 -25
Fastest growing product groupIn 2009: Pharmaceuticals 3 739 1 1 12 23 0Since 2000: Ores and minerals 42 271 5 9 17 10 -26
Share in total merchandise exports of top 3 exported product groups by destination, 2009 (percentage)
a Ranks exclude unspecified destinations and other products, not classified elsewhere. Source: WTO Secretariat
b Ranks exclude other products, not classified elsewhere.
Share Annual Percentage Change
North America
10.9
3.21.8
02468
1012141618202224262830
Fuels Other food products Clothing
South and Central America
7.9
4.42.5
02468
1012141618202224262830
Fuels Other food products Other chemicals
CIS
1.1 0.1 0.002468
1012141618202224262830
Other food products Raw materials Fish
Africa
1.70.2 0.2
02468
1012141618202224262830
Other food products Other machinery Iron and steel
World25.7
23.9
9.2
02468
1012141618202224262830
Other food products Fuels Ores and minerals
Europe
7.3
2.2 2.1
02468
1012141618202224262830
Other food products Ores and minerals Fuels
Middle East
1.90.1 0.1
02468
1012141618202224262830
Other food products Ores and minerals Iron and steel
Asia
6.0 5.42.8
02468
1012141618202224262830
Other food products Ores and minerals Non-ferrous metals
Exports by destination, 2009
Europe
Africa
Middle East
South and Central America
North America
Asia
CIS
Exports by product, 2000-2009
0
50
100
150
200
250
300
2000 2001 2002 2003 2004 2005 2006 2007 2008 2009
Billio
n doll
ars
Agricultural products
Fuels and mining products
Manufactures

October 2010
Europe MERCHANDISE TRADE Value, mn $
2009 2000 2009 2000-09 2008 2009Merchandise exports f.o.b. 5 015 954 100 100 7 12 -22
Exports by destination aBy region
Europe 3 619 532 73 72 7 10 -23Asia 425 985 8 8 9 13 -13 North America 365 935 10 7 3 4 -23 Africa 161 884 2 3 11 25 -13 Middle East 153 517 2 3 11 23 -19 CIS 146 587 1 3 18 26 -39 South and Central America 74 645 2 1 6 21 -23
By economic grouping Developed Economies 3 948 525 84 79 7 10 -23 Developing Economies 852 972 14 17 10 18 -17 LDC (Least developed countries) 32 518 0 1 11 23 -11
Exports by product b By major product group
Agriculture products 528 290 9 11 9 16 -12Fuels, mining products 482 553 8 10 10 26 -37Manufactured goods 3 879 198 81 77 7 9 -22
Agreement on Agriculture 459 028 8 9 9 18 -12Industrial goods 4 556 926 92 91 7 11 -23
By product groupOther machinery 763 433 15 15 7 12 -25Other chemicals 523 161 10 10 8 9 -18Automotive products 470 460 11 9 6 3 -31Non-electrical machinery 448 530 . 9 . 12 -29Other food products 425 326 7 8 10 19 -12
Fastest growing product groupIn 2009: Pharmaceuticals 337 720 3 7 17 13 1Since 2000: Pharmaceuticals 337 720 3 7 17 13 1
Share in total merchandise exports of top 3 exported product groups by destination, 2009 (percentage)
a Ranks exclude unspecified destinations and other products, not classified elsewhere. Source: WTO Secretariat
b Ranks exclude other products, not classified elsewhere.
Share Annual Percentage Change
North America
1.4 1.0 0.9
02468
101214161820
Other machinery Pharmaceuticals Other chemicals
South and Central America
0.4 0.3 0.202468
101214161820
Other machinery Non-electricalmachinery
Other chemicals
CIS
0.7 0.5 0.302468
101214161820
Other machinery Non-electricalmachinery
Other chemicals
Africa
0.8 0.5 0.302468
101214161820
Other machinery Non-electricalmachinery
Automotive products
World
15.2
10.49.4
02468
101214161820
Other machinery Other chemicals Automotive products
Europe
8.87.6 7.4
02468
101214161820
Other machinery Other chemicals Automotive products
Middle East
0.8 0.5 0.302468
101214161820
Other machinery Non-electricalmachinery
Other semi-manuf.
Asia
2.3 1.5 0.9
02468
101214161820
Other machinery Non-electricalmachinery
Other chemicals
Exports by destination, 2009
Africa
Middle East
CIS
Europe
Asia North
America
South and Central America
Exports by product, 2000-2009
0
1000
2000
3000
4000
5000
6000
2000 2001 2002 2003 2004 2005 2006 2007 2008 2009
Billio
n doll
ars
Agricultural products
Fuels and mining products
Manufactures

October 2010
Commonwealth of Independent States (CIS) MERCHANDISE TRADE Value, mn $
2009 2000 2009 2000-09 2008 2009Merchandise exports f.o.b. 451 565 100 100 13 35 -36
Exports by destination aBy region
Europe 238 886 51 53 14 36 -41CIS 86 855 20 19 13 32 -37 Asia 62 781 14 14 14 32 -21 North America 23 388 7 5 10 33 -33 Middle East 14 319 2 3 18 50 -43 Africa 7 198 1 2 17 40 -31 South and Central America 5 097 4 1 -1 44 -40
By economic grouping Developed Economies 247 653 58 55 13 34 -39 Developing Economies 104 016 22 23 14 42 -31 LDC (Least developed countries) 1 634 0 0 17 57 -26
Exports by product b By major product group
Agriculture products 39 246 9 9 13 18 -16Fuels, mining products 284 049 58 63 14 39 -39Manufactured goods 108 777 30 24 11 29 -37
Agreement on Agriculture 26 142 4 6 17 31 -15Industrial goods 425 423 96 94 13 36 -37
By product groupFuels 254 188 43 56 17 44 -39Iron and steel 36 446 10 8 11 36 -45Other chemicals 26 084 6 6 12 43 -33Other food products 22 106 3 5 19 33 -18Non-ferrous metals 19 863 11 4 2 -10 -36
Fastest growing product groupIn 2009: Fish 4 446 2 1 6 -3 9Since 2000: Other food products 22 106 3 5 19 33 -18
Share in total merchandise exports of top 3 exported product groups by destination, 2009 (percentage)
a Ranks exclude unspecified destinations and other products, not classified elsewhere. Source: WTO Secretariat
b Ranks exclude other products, not classified elsewhere.
Share Annual Percentage Change
North America
3.50.5 0.4
05
1015202530354045505560
Fuels Other chemicals Non-ferrous metals
South and Central America
0.5 0.3 0.205
1015202530354045505560
Fuels Other chemicals Iron and steel
CIS
6.22.4 2.0
05
1015202530354045505560
Fuels Other food products Other machinery
Africa
0.4 0.4 0.305
1015202530354045505560
Iron and steel Other food products Fuels
World56.3
8.1 5.8
05
1015202530354045505560
Fuels Iron and steel Other chemicals
Europe
39.2
2.4 2.4
05
1015202530354045505560
Fuels Non-ferrous metals Iron and steel
Middle East
1.2 0.9 0.605
1015202530354045505560
Iron and steel Fuels Other food products
Asia
5.61.6 1.3
05
1015202530354045505560
Fuels Iron and steel Other chemicals
Exports by destination, 2009
North America
Middle East
Africa
Europe
CIS Asia
South and Central America
Exports by product, 2000-2009
050
100150200250300350400450500
2000 2001 2002 2003 2004 2005 2006 2007 2008 2009
Billio
n doll
ars
Agricultural products
Fuels and mining products
Manufactures

October 2010
Africa MERCHANDISE TRADE Value, mn $
2009 2000 2009 2000-09 2008 2009Merchandise exports f.o.b. 383 940 100 100 11 28 -31
Exports by destination aBy region
Europe 148 842 50 39 8 31 -34Asia 85 273 17 22 15 37 -26 North America 65 681 17 17 11 20 -44 Africa 44 913 9 12 14 38 -18 Middle East 11 512 2 3 16 43 -27 South and Central America 9 254 2 2 11 53 -51 CIS 1 260 0 0 18 60 -29
By economic grouping Developed Economies 218 571 69 57 9 27 -38 Developing Economies 146 904 29 38 15 39 -24 LDC (Least developed countries) 9 702 4 3 6 39 -53
Exports by product b By major product group
Agriculture products 39 101 12 10 9 18 -7Fuels, mining products 245 748 59 64 12 32 -38Manufactured goods 73 794 24 19 8 23 -25
Agreement on Agriculture 31 057 9 8 10 23 -3Industrial goods 352 883 91 92 11 29 -33
By product groupFuels 212 387 52 55 12 34 -39Other food products 27 284 7 7 10 23 -2Non-ferrous metals 17 017 4 4 12 2 -26Ores and minerals 16 344 3 4 16 49 -28Other semi-manuf. 15 098 7 4 5 10 -23
Fastest growing product groupIn 2009: EDP and office equipment 504 0 0 17 10 7Since 2000: EDP and office equip. 504 0 0 17 10 7 17 10 7
Share in total merchandise exports of top 3 exported product groups by destination, 2009 (percentage)
a Ranks exclude unspecified destinations and other products, not classified elsewhere. Source: WTO Secretariat
b Ranks exclude other products, not classified elsewhere.
Share Annual Percentage Change
North America
14.2
0.5 0.405
1015202530354045505560
Fuels Other food products Non-ferrous metals
South and Central America
2.0 0.2 0.005
1015202530354045505560
Fuels Other chemicals Ores and minerals
CIS
0.2 0.1 0.005
1015202530354045505560
Other food products Ores and minerals Fuels
Africa
3.2 1.8 1.105
1015202530354045505560
Fuels Other food products Other chemicals
World55.3
7.14.4
05
1015202530354045505560
Fuels Other food products Non-ferrous metals
Europe
21.9
3.3 1.905
1015202530354045505560
Fuels Other food products Clothing
Middle East
0.4 0.3 0.305
1015202530354045505560
Other food products Other semi-manuf. Fuels
Asia
13.0
2.3 1.905
1015202530354045505560
Fuels Ores and minerals Non-ferrous metals
Exports by destination, 2009
Africa
Middle East
South and Central America
Europe
Asia
North America
CIS
Exports by product, 2000-2009
050
100150200250300350400450
2000 2001 2002 2003 2004 2005 2006 2007 2008 2009
Billio
n doll
ars
Agricultural products
Fuels and mining products
Manufactures

October 2010
Middle East MERCHANDISE TRADE Value, mn $
2009 2000 2009 2000-09 2008 2009Merchandise exports f.o.b. 689 744 100 100 11 33 -33
Exports by destination aBy region
Asia 356 955 50 52 12 48 -37Middle East 106 777 9 15 18 16 -14 Europe 75 813 17 11 6 23 -40 North America 60 304 14 9 5 32 -45 Africa 33 653 4 5 12 24 -29 South and Central America 4 621 1 1 9 65 -35 CIS 3 660 1 1 11 4 -35
By economic grouping Developed Economies 221 910 47 32 7 31 -42 Developing Economies 416 214 48 60 14 41 -31 LDC (Least developed countries) 8 278 1 1 16 -6 0
Exports by product b By major product group
Agriculture products 18 159 2 3 13 12 -4Fuels, mining products 469 130 73 68 10 37 -38Manufactured goods 187 958 24 27 13 29 -20
Agreement on Agriculture 15 088 2 2 13 10 -13Industrial goods 674 657 98 98 11 34 -33
By product groupFuels 460 692 72 67 10 37 -37Other chemicals 37 303 5 5 12 45 -23Other semi-manuf. 35 908 6 5 10 18 -24Other machinery 22 027 3 3 13 31 -22Automotive products 18 389 1 3 21 29 -29
Fastest growing product groupIn 2009: Integrated circuits 3 978 1 1 9 201 159Since 2000: Pharmaceuticals 6 005 0 1 26 30 -6
Share in total merchandise exports of top 3 exported product groups by destination, 2009 (percentage)
a Ranks exclude unspecified destinations and other products, not classified elsewhere. Source: WTO Secretariat
b Ranks exclude other products, not classified elsewhere.
Share Annual Percentage Change
North America
5.60.8 0.5
0
10
20
30
40
50
60
70
Fuels Other semi-manuf. Pharmaceuticals
South and Central America
0.4 0.1 0.00
10
20
30
40
50
60
70
Fuels Other chemicals Other machinery
CIS
0.1 0.1 0.10
10
20
30
40
50
60
70
Other food products Automotive products Other chemicals
Africa
1.6 0.7 0.40
10
20
30
40
50
60
70
Fuels Automotive products Other chemicals
World66.8
5.4 5.2
0
10
20
30
40
50
60
70
Fuels Other chemicals Other semi-manuf.
Europe
6.81.1 0.7
0
10
20
30
40
50
60
70
Fuels Other chemicals Other semi-manuf.
Middle East
2.6 1.7 1.60
10
20
30
40
50
60
70
Fuels Other machinery Automotive products
Asia
44.3
2.2 1.70
10
20
30
40
50
60
70
Fuels Other chemicals Other semi-manuf.
Exports by destination, 2009
North America
Africa
South and Central America
Asia
Middle East
Europe
CIS
Exports by product, 2000-2009
0
100
200
300
400
500
600
700
800
2000 2001 2002 2003 2004 2005 2006 2007 2008 2009
Billio
n doll
ars
Agricultural products
Fuels and mining products
Manufactures

October 2010
Asia MERCHANDISE TRADE Value, mn $
2009 2000 2009 2000-09 2008 2009Merchandise exports f.o.b. 3 575 151 100 100 9 15 -18
Exports by destination aBy region
Asia 1 846 431 49 52 10 16 -16Europe 640 528 17 18 9 12 -20 North America 627 274 26 18 4 3 -19 Middle East 163 412 3 5 16 35 -20 Africa 101 595 1 3 18 30 -16 South and Central America 95 483 2 3 14 38 -25 CIS 57 434 0 2 25 36 -47
By economic grouping Developed Economies 1 582 849 55 44 6 10 -20 Developing Economies 1 891 873 44 53 11 18 -16 LDC (Least developed countries) 75 370 1 2 17 37 -4
Exports by product b By major product group
Agriculture products 225 504 6 6 9 22 -14Fuels, mining products 385 558 7 11 14 35 -29Manufactured goods 2 849 526 84 80 8 11 -17
Agreement on Agriculture 172 391 4 5 11 25 -14Industrial goods 3 402 761 96 95 9 14 -18
By product groupOther machinery 460 416 13 13 8 15 -21EDP 270 883 11 8 5 1 -15Fuels 266 063 5 7 14 50 -31Telecom. 258 181 6 7 11 8 -14Integrated circuits 256 510 11 7 4 1 -12
Fastest growing product groupIn 2009: Pharmaceuticals 30 468 1 1 15 12 6Since 2000: Ores and minerals 65 613 1 2 16 19 -15
Share in total merchandise exports of top 3 exported product groups by destination, 2009 (percentage)
a Ranks exclude unspecified destinations and other products, not classified elsewhere. Source: WTO Secretariat
b Ranks exclude other products, not classified elsewhere.
Share Annual Percentage Change
North America
2.4 2.3 2.1
02468
101214161820
EDP Other machinery Telecom.
South and Central America
0.4 0.3 0.202468
101214161820
Other machinery Automotive products Other transport eq.
CIS
0.3 0.2 0.102468
101214161820
Clothing Other machinery Automotive products
Africa
0.4 0.3 0.302468
101214161820
Other machinery Automotive products Other semi-manuf.
World
12.9
7.6 7.4
02468
101214161820
Other machinery EDP Fuels
Europe
2.1 2.0 1.6
02468
101214161820
Other machinery EDP Telecom.
Middle East
0.7 0.6 0.602468
101214161820
Other machinery Other semi-manuf. Automotive products
Asia
6.7 6.1 5.7
02468
101214161820
Other machinery Fuels Integrated circuits
Exports by destination, 2009
Middle East
Africa South and
Central America
Asia
Europe
North America
CIS
Exports by product, 2000-2009
0
500
1000
1500
2000
2500
3000
3500
4000
2000 2001 2002 2003 2004 2005 2006 2007 2008 2009
Billio
n doll
ars
Agricultural products
Fuels and mining products
Manufactures

October 2010
South and Central America and the Caribbean: Antigua and Barbuda* Brazil* Ecuador* Jamaica* Saint Lucia* Argentina* Chile* El Salvador* Netherlands Antilles Saint Vincent and the Grenadines* Bahamas** Colombia* Grenada* Nicaragua* Suriname* Barbados* Costa Rica* Guatemala* Panama* Trinidad and Tobago* Belize* Cuba* Guyana* Paraguay* Uruguay* Bolivarian Rep. of Venezuela* Dominica* Haiti* Peru* Bolivia* Dominican Republic* Honduras* Saint Kitts and Nevis* Other territories in the region not elsewhere specified.Europe: Andorra** Denmark* Iceland* Montenegro** Slovenia* Austria* Estonia* Ireland* Netherlands* Spain* Belgium* Finland* Italy* Norway* Sweden* Bosnia and Herzegovina** France* Latvia* Poland* Switzerland* Bulgaria* FYR Macedonia* Liechtenstein Portugal* Turkey* Croatia* Germany* Lithuania* Romania* United Kingdom* Cyprus* Greece* Luxembourg* Serbia** Czech Republic* Hungary* Malta* Slovak Republic* Other territories in the region not elsewhere specified .
a Georgia is not a member of the Commonwealth of Independent States but is included in this group for reasons of geography and similarities in economic structure.
ProductsAll product groups are defined according to Revision 3 of the Standard International Trade Classification (SITC).A. Primary products(i) Agricultural products (SITC sections 0, 1, 2 and 4 minus divisions 27 and 28)of which,- Food (SITC sections 0, 1, 4 and division 22)of which,0 - Food and live animals1 - Beverages and tobacco4 - Animal and vegetable oils, fats and waxes22 - Oil seeds and oleaginous fruits- - Fish (SITC division 03)- - Other food products and live animals ( SITC sections 0, 1, 4 and division 22 minus division 03)- Raw materials (SITC divisions 21, 23, 24, 25, 26, 29)of which,21 - Hides, skins and furskins, raw23 - Crude rubber (including synthetic and reclaimed)24 - Cork and wood25 - Pulp and waste paper26 - Textile fibres (other than wool tops and other combed wool) and their wastes (not manufactured into yarn or fabric)29 - Crude animal and vegetable materials, not elsewhere specified(ii) Fuels and mining products (SITC section 3 and divisions 27, 28, 68)of which,- Ores and other minerals (SITC divisions 27, 28)of which,27 - Crude fertilizers, other than those of division 56, and crude minerals (excluding coal, petroleum and precious stones)28 - Metalliferous ores and metal scrap- Fuels (SITC section 3)- Non-ferrous metals (SITC division 68)
Developing economies: Africa; Asia excl. Australia, Japan, and New Zealand; Europe excl. the European Union (27) and EFTA; Latin America (incl. Mexico); Middle East;
Technical Notes
North America: Bermuda Canada* Mexico* United States of America* Other territories in the region not elsewhere specified.Composition of regions and LDCs:
Network of world merchandise trade:The world merchandise trade network by region and product is based on export data. The network is constructed in the following way:First, total merchandise exports from each of the seven regions are aggregated from the individual country or territory figures.Next, the total merchandise exports of each region are distributed by destination and then by product. The regional and commodity breakdown is based on UNSD Comtrade database, EUROSTAT, GTIS GTA database, national statistics and Secretariat estimates.During this process, the principal adjustments to the figures are as follows:(i) Exports of ships to the open registry countries Panama and Liberia are re-allocated from each region’s exports to South and Central America and Africa to “unspecified destinations” (a category not shown separately).(ii) China’s exports are adjusted to approximate their final destination.(iii) Exports of non-monetary gold, where known, are included. When they cannot be broken down by destination, they are allocated to “unspecified destinations”.(iv) South Africa’s trade does not include trade with the former Southern African Customs Union members. If South Africa’s exports would be
The network is only available for selected product aggregates and regional groupings (see below). Rankings neither include exports to unspecified destinations nor other products, not elsewhere specified.
adjusted for these shipments to SACU members, its total exports would increase by about $5 billion in 2008 and intra-African trade would be substantially higher, with intra-SACU trade being the largest intra trade flow for regional trade agreements in Africa.
(ii) Chemicals (SITC section 5)
B. Manufactures (SITC sections 5, 6, 7, 8 minus division 68 and group 891)(i) Iron and steel (SITC division 67)
Commonwealth of Independent States (CIS) a : Armenia* Georgia a * Moldova* Turkmenistan Azerbaijan** Kazakhstan** Russian Federation** Ukraine* Belarus** Kyrgyz Republic* Tajikistan** Uzbekistan** Other territories in the region not elsewhere specified .Africa: Algeria** Congo* Guinea* Morocco* South Africa* Angola* Congo Dem. Rep. of* Guinea-Bissau* Mozambique* Sudan**Benin* Côte d'Ivoire* Kenya* Namibia* Swaziland* Botswana* Djibouti* Lesotho* Niger* Tanzania* Burkina Faso* Egypt* Liberia Nigeria* Togo* Burundi* Equatorial Guinea** Libyan Arab Jamahiriya** Rwanda* Tunisia* Cameroon* Eritrea Madagascar* Sao Tome and Principe** Uganda* Cape Verde* Ethiopia** Malawi* Senegal* Zambia* Central African Republic* Gabon* Mali* Seychelles** Zimbabwe* Chad* Gambia* Mauritania* Sierra Leone* Comoros Ghana* Mauritius* Somalia Other territories in the region not elsewhere specified.
LDCs (Least-developed countries): Afghanistan Chad Haiti Mozambique Somalia Angola Comoros Kiribati Myanmar Sudan Bangladesh Congo Dem. Rep. of Lao People's Dem. Rep. Nepal Timor Leste Benin Djibouti Lesotho Niger Togo Bhutan Equatorial Guinea Liberia Rwanda Tuvalu Burkina Faso Eritrea Madagascar Samoa Uganda Burundi Ethiopia Malawi Sao Tome and Principe United Republic of Tanzania Cambodia Gambia Maldives Senegal Vanuatu Cape Verde Guinea Mali Sierra Leone Yemen Central African Republic Guinea-Bissau Mauritania Solomon Islands Zambia
Middle East: Bahrain* Israel* Lebanon** Saudi Arabia* Yemen** Iran Islamic Rep. of** Jordan* Oman* Syrian Arab Republic Iraq** Kuwait* Qatar* United Arab Emirates* Other territories in the region not elsewhere specified.Asia (including Oceania): Afghanistan** Hong Kong China* Malaysia* Papua New Guinea* Tonga* Australia* India* Maldives* Philippines* Tuvalu Bangladesh* Indonesia* Mongolia* Samoa** Vanuatu** Bhutan** Japan* Myanmar* Singapore* Viet Nam* Brunei Darussalam* Kiribati Nepal* Solomon Islands* Cambodia* Korea Republic of* New Zealand* Sri Lanka* China* Lao People's Dem. Rep.** Pakistan* Taipei Chinese* Fiji* Macao China* Palau Thailand* Other territories in the region not elsewhere specified.* WTO members ** Observer governments
Developed economies: North America (excl. Mexico); European Union (27); EFTA (Iceland, Liechtenstein, Norway, Switzerland); Australia, Japan and New Zealand;

October 2010
Technical Notes
mn $ million US dollars... not available or not reported
Source: WTO SecretariatSymbols and abbreviations:
of which,51 - Organic chemicals52 - Inorganic chemicals53 - Dyeing, tanning and colouring materials55 - Essential oils and resinoids and perfume materials; toilet, polishing and cleaning preparations56 - Fertilizers (other than those of Group 272, i.e Fertilizers, crude)57 - Plastics in primary forms58 - Plastics in non-primary forms59 - Chemical materials and products, not elsewhere specified(iii) Other semi-manufactures (SITC divisions 61, 62, 63, 64, 66, 69)of which,61 - Leather, leather manufactures, not elsewhere specified and dressed furskins62 - Rubber manufactures, not elsewhere specified63 - Cork and wood manufactures (excluding furniture)64 - Paper, paperboard and articles of paper pulp, of paper or of paperboard66 - Non-metallic mineral manufactures, not elsewhere specified69 - Manufactures of metals, not elsewhere specified(iv) Machinery and transport equipment (SITC section 7)- Office and telecommunication equipment (SITC divisions 75, 76 and group 776)of which,- - Electronic data processing and office equipment (SITC division 75)- - Telecommunications equipment (SITC division 76)- - Integrated circuits, and electronic components (SITC group 776)- Transport equipment (SITC group 713, sub-group 7783 and divisions 78, 79)of which,78 - Road vehicles (including air-cushion vehicles)79 - Other transport equipment- - Automotive products (SITC groups 781, 782, 783, 784 and subgroups 7132, 7783)of which,781 - Motor cars and other motor vehicles principally designed for the transport of persons (other than public-transport type vehicles),including station wagons and racing cars782 - Motor vehicles for the transport of goods and special purpose motor vehicles783 - Road motor vehicles, not elsewhere specified784 - Parts and accessories of the motor vehicles and tractors
7132 - Internal combustion piston engines for propelling vehicles listed above- -Other transport equipment (SITC division 79, groups 713, 785, 786 minus sub-group 7132)of which,79 - Other transport equipment713 - Internal combustion piston engines, and parts thereof, not elsewhere specified785 - Motorcycles and cycles, motorized and non-motorized786 - Trailers and semi-trailers, other vehicles (not mechanically propelled), and specially designed and equipped transport containers- Other machinery (SITC divisions 71, 72, 73, 74, 77 minus groups 713, 776 minus sub-group 7783)of which,- - Power generating machinery (SITC division 71 minus group 713)of which,71 - Power generating machinery and equipmentminus713 - Internal combustion piston engines, and parts thereof, not elsewhere specified- - Non-electrical machinery (SITC divisions 72, 73, 74)of which,72 - Machinery specialized for particular industries73 - Metal working machinery74 - General industrial machinery and equipment, not elsewhere specified and machine parts, not elsewhere specified- - Electrical machinery (SITC division 77 minus group 776 and subgroup 7783)of which,77 - Electrical machinery, apparatus and appliances, not elsewhere specified and electrical parts thereofminus776 - Thermionic, cold cathode or photo-cathode valves and tubes7783 - Electrical equipment, not elsewhere specified, for internal combustion engines and vehicles; and parts thereof(v) Textiles (SITC division 65)(vi) Clothing (SITC division 84)(vii) Other manufactures (SITC divisions 81, 82, 83, 85, 87, 88, 89 excluding group 891)of which,- Personal and household goods (SITC divisions 82, 83 and 85)of which,82 - Furniture and parts thereof, bedding, mattresses, mattress supports, cushions and similar stuffed furnishings83 - Travel goods, handbags and similar containers85 - Footwear
- Scientific and controlling instruments (SITC division 87)- Miscellaneous manufactures (SITC divisions 81, 88 and 89 minus group 891)of which,81 - Prefabricated buildings, sanitary plumbing, heating and lighting fixtures and fittings, not elsewhere specified88 - Photographic apparatus, equipment and supplies and optical goods, not elsewhere specified; watches and clocks89 - Miscellaneous manufactured articles, not elsewhere specifiedC. Other products: commodities and transactions not classified elsewhere (including gold); arms and ammunition (SITC section 9 and group 891)9- Commodities and transactions not classfied elsewhere in SITC891 - Arms and Ammunition
of which,- Pharmaceuticals (SITC division 54)- Other chemicals (SITC divisions 51, 52, 53, 55, 56, 57, 58, 59)