ochirsukh ya ochir consulting ltd 20nov11
TRANSCRIPT

Mongolia 2010 Population Census:
Main Findings
Ochirsukh Ya
Ochir Consulting Ltd 20Nov11

Mongolia Population: Size and Annual Growth Rates (in %)
Annual Growth Rate (%) Population size

Population Pyramids 1989, 2000, 2010 census & projections for 2020 (male-blue, female-red )
< Enter Transition Line >

TWO THIRDS OF POPULATION ARE 15-65 YEAR OLDS (for population census year of 2010 )
64.7% 64.3%
CRUDE BIRTH RATE ACCELERATED IN 2005-2010 (for population census year of 2010 )
70+
65-69
60-64
55-59
50-54
45-49
40-44
35-39
30-34
25-29
20-24
15-19
10-14
5-9
0-4
Male Female
200,000 100,000 0 100,000 200,000

105.0
100.0
95.0
90.0
85.0
80.0
75.0
70.0
65.0
60.0
2000 2010
0-4 5-9 10-14 15-19 20-24 25-29 30-34 35-39 40-44 45-49 50-54 55-59 60-64 65-69 70+
POPULATION SEX RATIO
Sex ratio decreased after 40 year of age: 40+ male death rate increased drastically

40,0%
50,0%
60,0%
70,0%
80,0%
90,0%
100,0%
1979 1989 2000 2010
Dependency ratio
44,3% 41,9% 35,8%
27,3%
50,7% 54,1% 60,7%
69,0%
5,0% 4,0% 3,5% 3,7%
0%
20%
40%
60%
80%
100%
1979 1989 2000 2010
65 and above 15-64 0-14
Population Age Structure and Dependency Ratio (for population census years of 1979-2010 )

Population
of 0-14 age
Population
65 and more
years old
Population
of 15-64
years old
Demographic window
will be open for 15-20
more years
DEPENDENCY RATIO IS TWICE LOWER COMPARED WITH
1989
45.0
64.6
84.9
2010
2000
1989

As per 2010 census, total population of Mongolia was 2 754 685. The annual growth rate between the last two censuses was 1.5%. Mongolia has 107 410 citizens living abroad for more than six months, 16 428 foreign citizens and stateless people living for more than six months in Mongolia. 49.5 percent of the resident population is male, 50.5 percent is female, and the sex ratio is 98.1. Percentage of population aged 0-14 is 27.3, 15-64 is 69.0 percent, 65 and above is 3.7 percent. Dependency ratio in 2010 is 45.0, a decrease by 19.6 percentage points when compared with 2000. Since the 2000 Population and Housing Census, total population of Mongolia has increased by 16.1 percent. The increase is 0.1 percentage points higher or 51.6 thousand people more than that of between the 1989 and 2000 Censuses.
Demographic window will be open for 15-20 more years
Total population, age structure, sex ratio, dependency ratio and growth rate.

800
1000
1200
1400
1600
1800
2000
1989 2000 2010
Urban population
(thousands people)
30,0%
35,0%
40,0%
45,0%
50,0%
55,0%
60,0%
65,0%
70,0%
1989 2000 2010
Urbanization (%)
Urbanization - percentage of urban population in total resident population
Urban Population and Urbanization (for population census years of 1979-2010 )

POPULATION DENSITY
Source: Mongolia Population Census ; 1989, 2000 and 2010 (NSO)
1989 2000 2010
Population Density (persons per sq.km) 1,36 1,50 1,70
1,36
1,50
1,70
1,2
1,4
1,6
1,8
1989 2000 2010
Population Density (persons per sq.km)

Number of Foreign Citizen Share in the Total Population
16 320 0.6%
Orkhon
807
Selenge
323
Ulaanbaatar
9 254
Dornogobi
319 Omnogobi
3 913
89,5% of all foreign citizens
reside in the abovementioned
Aimags and the Capital
A quarter (24.0%) of
all foreigners reside in
Omnogobi aimag
Omnogobi aimag is the second biggest concentration of foreigners
in the country after the Capital (3 913 or 24.0 percent)
Foreigners in Resident Population of Mongolia

MIGRATION AFFECTS POPULATION DISTRIBUTION
1989/1979 Y2K/1989 2010/Y2K 1979-1989 1989-Y2K Y2K- 2010
1 Аrkhangai 109 114.9 87.1 0.86 1.27 (1.17)
2 Bayan-Ulgii 127.5 100.2 96.7 2.46 0.02 (0.30)
3 Bayankhongor 118.4 113.7 89.7 1.70 1.17 (0.93)
4 Bulgan 122.9 119 86.9 2.08 1.59 (1.20)
5 Gobi-Altai 112.4 101.4 84.2 1.17 0.13 (1.44)
6 Dornogobi 137.2 88.6 115.9 3.22 (1.10) 1.44
7 Dornod 138.5 93.6 92.3 3.31 (0.66) (0.70)
8 Dundgobi 126.9 104.5 75.4 2.41 0.40 (2.24)
9 Zavkhan 110.7 101.7 72.8 1.03 0.15 (2.48)
10 Ovorkhangai 117.1 115.4 90.9 1.59 1.31 (0.82)
11 Omnogobi 128.9 110.4 130.9 2.57 0.90 2.80
12 Sukhbaatar 117.8 110.5 91.4 1.65 0.91 (0.78)
13 Selenge 136.7 114.9 97.6 3.17 1.27 (0.22)
14 Tuv 125.3 99.2 85.8 3.28 (0.07) (1.29)
15 Uvs 116.7 107.2 81.4 1.55 0.64 (1.69)
16 Khovd 122.3 113.4 88.5 2.04 1.15 (1.04)
17 Khubsugul 115.1 116.9 96.5 1.41 1.43 (0.32)
18 Khentii 141.8 96.1 92.8 3.55 (0.36) (0.66)
19 Darkhan-Uul 192.4 97.1 113.6 6.77 (0.26) 1.24
20 Ulaanbaatar 142.6 138.6 163.1 3.61 3.01 5.74
21 Orkhon 356 127.4 126.8 13.54 2.23 2.44
22 Gobisumber - - 108.3 - - 0.75
128.2 116.1 116.1 2.51 1.37 1.46
Average Annual Growth Rate Growth Index (%)
TOTAL
Aimag Name
Omnogobi aimag has 2nd highest population growth rates in the last decade
(2000-2010) after the Capital city of Ulaanbaatar

MIGRATION I
Place of Residence in January 2005
Place of Residence at the Date of Census in 2010
Total Western Region
Khangai Region
Central Region
Eastern Region
Ulaan baatar
Emigrants
Total 2 321 148 303 132 449 421 386 720 161 727 1 020 148 -
Western Region 348 358 292 011 5 355 11 204 379 39 409 56 347
Khangai Region 493 075 1 430 425 698 9 642 441 55 864 67 377
Central Region 391 445 1 117 4 382 332 898 1 439 51 609 58 547
Eastern Region 182 152 120 431 3 409 153 452 24 740 28 700
Ulaanbaatar 884 407 7 721 12 572 24 038 5 385 834 691 49 716
Abroad 21 711 733 983 5 529 631 13 835 21 711
Immigrants - 11 121 23 723 53 822 8 275 185 457 282 398
POPULATION 5 YEARS AND OLDER, BY REGIONS OF RESIDENCE
AS OF JANUARY 2005 AND
CENSUS DATE IN 2010
Net immigration to Capital city of Ulaanbaatar in the last 5
years (2005-2010) was 185 457 – 49 716 = 135 741.

Place of Residence 1
year before the 2010 census
Place of Residence at the Date of Census in 2010
Total Western Region
Khangai Region
Central Region
Eastern Region
Ulaan baatar
Emigrants
Total 2 647 545 352 537 514 726 440 693 185 299 1 154 290 -
Western Region 365 998 347 989 1 632 3 083 130 13 164 18 009
Khangai Region 530 152 570 506,142 4 137 178 19 125 24 010
Central Region 435 318 409 1,551 417,104 488 15 766 18 214
Eastern Region 191 418 61 158 1,227 182,146 7 826 9 272
Ulaanbaatar 1 113 649 3 077 4 838 10,746 1,991 1,092,997 20 652
Abroad 11 010 431 405 4,396 366 5,412 11 010
Immigrants - 4 548 8 584 23,589 3,153 61,293 101 167
MIGRATION II
MIGRATION OF RESIDENT POPULATION WITHIN ONE YEAR TO
THE DATE OF 2010 CENSUS
Net immigration to Omnogobi aimag only in the last year
(2009-2010) was 8504 (8.4% of total migration flow).

Population location, density and migration
Urban population has increased significantly both absolutely and relatively; 1345 thousand people in urban areas in 2000, 68 percents 1798.1 thousand people 2010, with growth rate being 33 percent. Urbanization (percentage of urban population in total resident population) has increased dramatically from 57 percent 2000 to 68 percents in 2010.
In 2000, average population density of Mongolia was 1.5 persons per square kilometer. In 2010, the density has increased by 13, 3 percentage points to 1.7 persons per square kilometer. Population density in the capital city of Ulaanbaatar remains the highest and increased to 246 persons per square kilometer in 2010 compared to 162 in 2000 (51,9% increase).
Omnogobi aimag is the second largest concentration of foreigners in Mongolia after the Capital; almost a quarter (24.0%) of all foreigners residing in the country for more than 6 months.
88.4 92.5
2000
2010
Primary
Basic
17.0
19.3
26.5
28.4
34.6 Complete Secondary
Technical and Vocational
Special Vocational
Higher
23.7
3.0
4.1 6.2
8.6
8.6
Percentage of the Total
19.8
11.6 7.5
Educated Uneducated
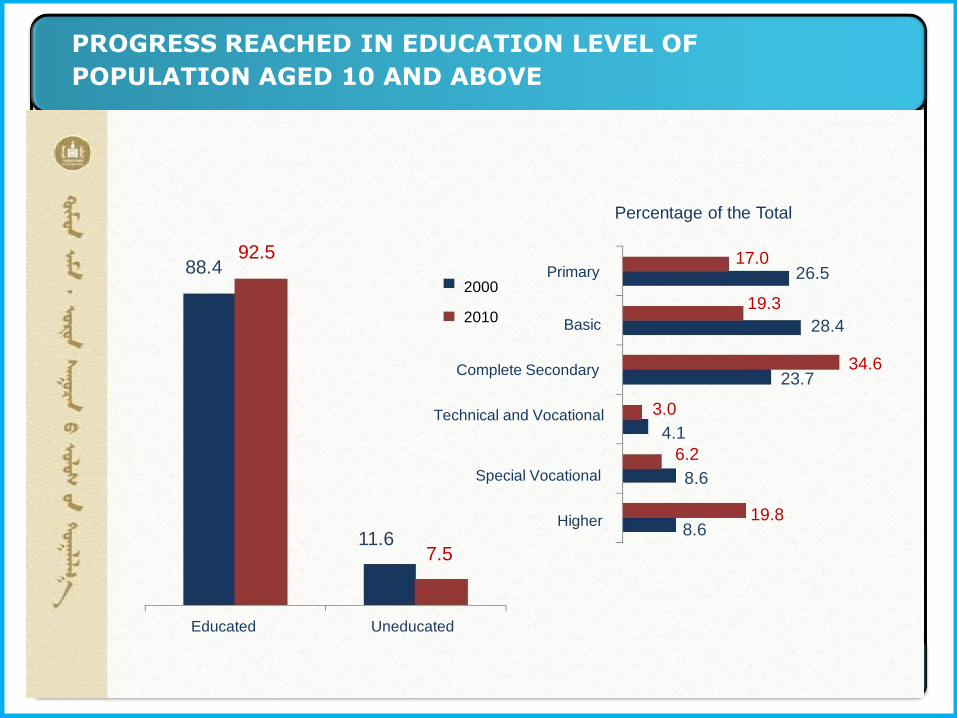
PROGRESS REACHED IN EDUCATION LEVEL OF
POPULATION AGED 10 AND ABOVE

URBAN POPULATION IS FULLY
LITERATE NOW
SCHOOL ENROLLMENT
INCREASED FOR 15-19 YEAR
OLDS
PROGRESS REACHED IN EDUCATION
98.9 99.1
96.2 96.3
Urban Area Rural Area
6-10 11-14 15-19 20-24 25-29
100.0
80.0
2000
2010
60.0
40.0
20.0
0.0
2000
2010

RELIGIOUS BELIEFS OF MONGOLIANS
Non-religious; 38,6%
Muslim; 3,0% Christians; 2,2%
Buddists; 53,0%
Shamanists; 2,9% Others; 0,4%

Level of education, literacy, religion and other social indicators
Among population aged 10 and above, percentage of people with at least primary education is 92.5 percent, an increase of 4.6 percent.
Literacy level (among population aged 15 and above) is 98.3 percent, which has increased by 0.5 percentage points since 2000.
Two thirds (64.4%) of Mongolians stated having religious faith, of which
53 percent are Buddhist, 3 percent are Muslim, 2.9 percent are Shamanist 2.1 percent are Christian, and the remaining 0.4 percent are with other religious faith.
31.3 percent are single (never married), 60.1 percent are married, 3.1 percent are divorced or separated and 5.5 percent are widowed. Average age at first marriage for male is 26.2, for female is 24.2, increasing by 0.5 percentage points when compared with 2000. Among population aged 6 and above, 74.0 percent use cellular phones, whereas 30.6 percent use internet on regularly basis.

RESIDENT POPULATION AGED 15 AND ABOVE
1,905,969 = 100%
LABOR FORCE
1,075,780
56,4%
EMPLOYED
911,664
47,8%
UNEMPLO
YED
164,116
8,6%
NOT ECONOMICALLY ACTIVE POPULATION
830,189
43,6%
DISABLED
55,888
2,9%
RETIRED
191,907
10,1%
NO INTEREST IN A JOB,
NO SUITABLE
JOB AVAILABLE
124,802
6,5%
HOME DUTIES
108,403
5,7%
STUDYING
300,494
15,8%
OTHERS
48,695
2,6%
POPULATION ECONOMIC ACTIVITY STATUS

2011 (%)
2000
RESIDENT POPULATION AGED
15 AND ABOVE 1,524,372 1,905,969 25.0%
LABOR FORCE 944,083 1,075,780 13.9%
EMPLOYED 779,151 911,664 17.0%
UNEMPLOYED 164,932 164,116 -0.5%
NOT ECONOMICALLY ACTIVE
POPULATION 580,289 830,189 43.1%
DISABLED 36,912 55,888 51.4%
RETIRED 163,666 191,907 17.3%
NO INTEREST IN A JOB,
NO SUITABLE JOB AVAILABLE 90,353 124,802 38.1%
HOME DUTIES 76,307 108,403 42.1%
STUDYING 171,003 300,494 75.7%
OTHERS 42,048 48,695 15.8%
2011 2000
POPULATION ECONOMIC ACTIVITY STATUS
Economic activity, employment
Population aged 15 and above has increased by 25.0 percent, the increase in labor force is only 13.9 percent, which is twice less.
About 56.4 percent of population aged 15 and above are in labor force, which is a decrease of 5.5 percentage points when compared with 2000.
Between the last two Censuses, economically inactive population has increased by 43.0 percent. In 2000, the number of employed persons was 779.1 thousand; in 2010, the number has increased by 17 percent to 911.7 thousand.
Unemployment rate is 15.3 percent which has decreased by 2.2 percentage points when compared to 2000.
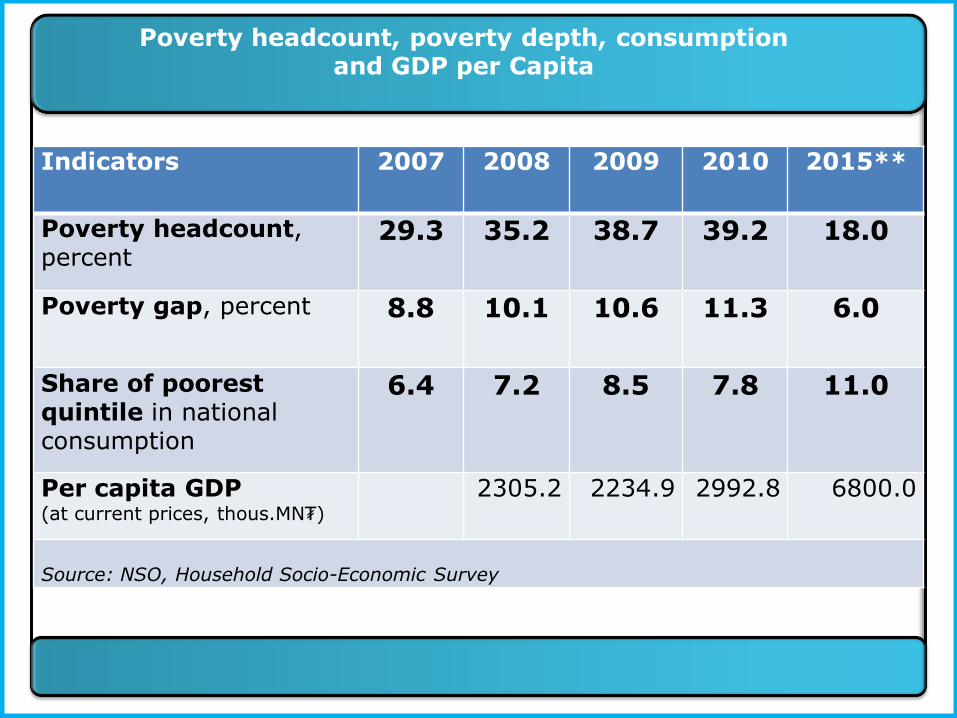
Indicators 2007 2008 2009 2010 2015**
Poverty headcount, percent
29.3 35.2 38.7 39.2 18.0
Poverty gap, percent 8.8 10.1 10.6 11.3 6.0
Share of poorest quintile in national consumption
6.4 7.2 8.5 7.8 11.0
Per capita GDP (at current prices, thous.MN₮)
2305.2 2234.9 2992.8 6800.0
Source: NSO, Household Socio-Economic Survey
Poverty headcount, poverty depth, consumption and GDP per Capita

0
2
4
6
8
10
12
14
0,0
0,5
1,0
1,5
2,0
2,5
3,0
3,5
4,0
1989
1990
1991
1992
1993
1994
1995
1996
1997
1998
1999
2000
2001
2002
2003
2004
2005
2006
2007
2008
2009
2010
MN
₮ t
ril
lion
s
Unemployment, old method
Unemployment, new methodology
GDP, mln MNT, 2005 price
36,3 35,6
36,1
32,2
35,2
20
25
30
35
40
45
50
1995 1998* 2002-2003* 2006** 2007-2008***
National average Urban
Ulaanbaatar Rural
Poverty and economic situations in Mongolia
Source: Findings of ADB-financed “Analyzing Triangle Relationship between Growth, Inequality and Poverty in Mongolia” ,
based on Household Socio-economic Survey of 2002/3, 2007/8 studies http://ochirsukh.blogspot.com/2011/06/adb-
analyzing-triangle-relationship.html
Poverty Headcount (%) GDP and Unemployment (%)
24

Main findings ADB-financed “Analyzing Triangle Relationship between Growth, Inequality and Poverty in Mongolia” ,
based on Household Socio-economic Survey of 2002, 2007 studies
• Significant factors increasing poverty likelihood: – Household (HH) size, dependency ratio, and migrant status.
– Living in ger district
– HH unemployment rate
– Pension for urban HHs
– Working in the manufacturing sector
• Significant factors reducing poverty likelihood : – Female-headed HHs (2007/08)
– Mother’s education equal to/higher than secondary for rural HHs
– Father’s education higher than secondary for rural HHs (2007/08)
– Mother’s education higher than secondary for urban HHs
– Father’s education higher than primary for urban HHs (2007/08)
– Pension for rural HHs (2002/03)
– Land/mobile phones
– Assets and Remittances from abroad (2007/08)
– Working in the public sector and mining sector (2007/08)
• Insignificant factors to poverty: – Age, marital status, female-headed HHs (2002/03)
– Social welfare programs
Source: Findings of ADB-financed “Analyzing Triangle Relationship between Growth, Inequality and Poverty in Mongolia” ,
based on Household Socio-economic Survey of 2002/3, 2007/8 studies http://ochirsukh.blogspot.com/2011/06/adb-
analyzing-triangle-relationship.html 25

Vulnerability level by poor and
non poor groups, %
Vulnerability
Classification
Share of Vulnerability
Poor Non Poor Overall
2002/3 2007/8 2002/3 2007/8 2002/3 2007/8
Highly
vulnerable
23.4 26.2 31.7 35.1 55.2 61.3
Relatively
vulnerable
2.6 2.4 11.0 12.1 13.6 14.5
Not
vulnerable
2.4 1.4 28.8 22.9 31.2 24.27
All groups/
Overall
28.4 29.9 71.6 70.1 100.0 100.0
55.2
Highly vulnerable households increased from 55.2% in 2002/3 to 61.3% in
2007/8. More than a half of the households were categorized as non-poor.
Source: Findings of ADB-financed “Analyzing Triangle Relationship between Growth, Inequality and Poverty in Mongolia” ,
based on Household Socio-economic Survey of 2002/3, 2007/8 studies http://ochirsukh.blogspot.com/2011/06/adb-
analyzing-triangle-relationship.html 26

Poverty and vulnerability to poverty at
population and sample levels, %
Poverty and vulnerability to poverty of population and sample levels, %
Source: Findings of ADB-financed “Analyzing Triangle Relationship between Growth, Inequality and Poverty in Mongolia” ,
based on Household Socio-economic Survey of 2002/3, 2007/8 studies http://ochirsukh.blogspot.com/2011/06/adb-
analyzing-triangle-relationship.html 27
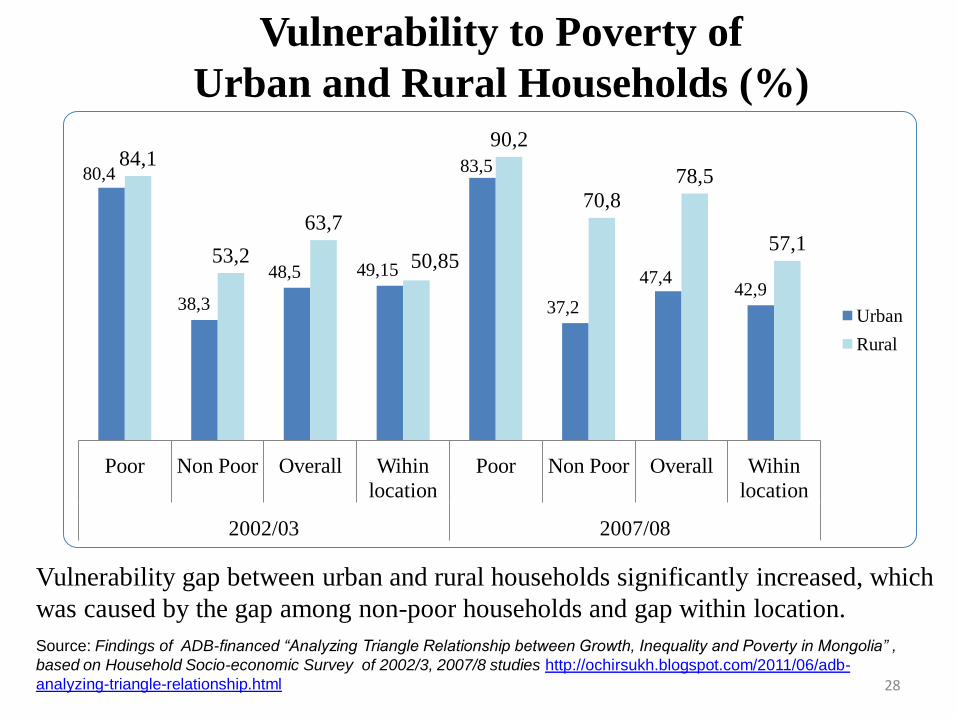
Vulnerability to Poverty of
Urban and Rural Households (%)
80,4
38,3
48,5 49,15
83,5
37,2
47,4 42,9
84,1
53,2
63,7
50,85
90,2
70,8 78,5
57,1
Poor Non Poor Overall Wihin
location
Poor Non Poor Overall Wihin
location
2002/03 2007/08
Urban
Rural
Vulnerability gap between urban and rural households significantly increased, which
was caused by the gap among non-poor households and gap within location.
Source: Findings of ADB-financed “Analyzing Triangle Relationship between Growth, Inequality and Poverty in Mongolia” ,
based on Household Socio-economic Survey of 2002/3, 2007/8 studies http://ochirsukh.blogspot.com/2011/06/adb-
analyzing-triangle-relationship.html 28

Vulnerability to Poverty by Region, %
Region
Vulnerability
to poverty
Share of vulnerability Vulnerability to
poverty within
the region Poor Non poor
2002/3 2007/8 2002/3 2007/8 2002/3 2007/8 2002/3 2007/8
Western 72.7 78.8 83.4 88.7 65.2 72.1 21 21.1
Khangai 60.4 85.5 84.7 94.2 49.6 79 28.1 32.1
Central 52.9 52.7 82 80.8 42.6 43.3 20.2 16.8
Eastern 53.6 70.8 77.2 86.3 44.6 61.9 9.8 10.5
UB 42.3 37.4 80.7 80.1 32.3 28.9 20.9 19.5
Approximately 60 % of the total households with high vulnerability to poverty
were regions other than the Central region and Ulaanbaatar.
Source: Findings of ADB-financed “Analyzing Triangle Relationship between Growth, Inequality and Poverty in Mongolia” ,
based on Household Socio-economic Survey of 2002/3, 2007/8 studies http://ochirsukh.blogspot.com/2011/06/adb-
analyzing-triangle-relationship.html
29

Vulnerability to Poverty (%)
Age of Household Head:
• Household vulnerability increased in Western, Khangai and Eastern Regions and decreased in Central Region and Ulaanbaatar between two periods.
• Households with heads aged 30-49 were most vulnerable in all regions in 2002/03. They remained most vulnerable in Central, Eastern Regions and UB, while households with heads aged below 30 became most vulnerable in Western and Khangai Regions.
20,0
30,0
40,0
50,0
60,0
70,0
80,0
90,0
2002/03 2007/8 2002/3 2007/8 2002/3 2007/8 2002/3 2007/8 2002/3 2007/8
Western Khangai Central Eastern Ulaanbaatar
<30 30-49 50≤
Source: Findings of ADB-financed “Analyzing Triangle Relationship between Growth, Inequality and Poverty in Mongolia” ,
based on Household Socio-economic Survey of 2002/3, 2007/8 studies http://ochirsukh.blogspot.com/2011/06/adb-
analyzing-triangle-relationship.html 30

Gini Coefficient
Source: Findings of ADB-financed “Analyzing Triangle Relationship between Growth, Inequality and Poverty in Mongolia” ,
based on Household Socio-economic Survey of 2002/3, 2007/8 studies http://ochirsukh.blogspot.com/2011/06/adb-
analyzing-triangle-relationship.html
31

Gini Coefficient by Region
and Location
Region Change in Gini
Coefficient
Location
Change in Gini
Coefficient
Western – Aimag center ++
Khangai + Soum center ++
Central* ++ Countryside –
Eastern – Ulaanbaatar ++
Ulaanbaatar ++ Between group +
Between group +
++: significant increase ; +: insignificant increase
–: insignificant decrease
Source: Findings of ADB-financed “Analyzing Triangle Relationship between Growth, Inequality and Poverty in Mongolia”,
based on Household Socio-economic Survey of 2002/3, 2007/8 studies http://ochirsukh.blogspot.com/2011/06/adb-
analyzing-triangle-relationship.html 32

GDP per Capita and Average Wage Rate (in MN₮ thousand)
Source: The Millennium Development Goals Implementation in Mongolia: Fourth National Report, Ulaanbaatar, 2011, p.26
0,0
1000,0
2000,0
3000,0
4000,0
5000,0
6000,0
7000,0
2008 2009 2010 2015
2305,2 2234,9 2992,8 6800,0
274,2 300,5
341,5
Дундаж цалин/мян.төг./
Нэг хүнд ногдох ДНБ/мян.төг/
GDP per Capita and Average Wage Rate

Household composition, living conditions
The number of households has increased by 31.9 percent when compared with 2000:
About 10.6 percent of total households are single family households, 62.3 percent are nuclear family, 24.9 percent are extended family and 2.1 percent are mixed family households.
Average size of a household is 3.6 persons, which is a decrease of 0.7 percentage points since previous Census.
About 53.7 percent live in different types of houses and buildings, and 45.2 percent of total households live in gers (traditional Mongolian dwellings).
Share of households who live in gers has decreased by 5.7 points and those who live in houses has increased by 5.2 points.
Number of households without any source of electricity (23,200) decreased by 2.9 times compared to Y2K.
35.0 percent of households who live in gers supply their drinking water from springs, rivers, streams, and lakes.

About 73.1% of households who live in houses/ buildings have 1-2 rooms, an increase of7.6 percentage points since 2000.
Households with hot and cold piped water supply system represent 39.7 percent of total households who live in houses/ buildings, which also represent 46.1 percent of urban households and 3.7 percent of rural households.
In 2000, percentage of households in houses/ buildings who disposed their solid waste in unauthorized areas represented 10.0 percent; the figure has dropped to 5.2 percent in 2010. About 42.4 percent of households in houses/ buildings have indoor toilet facility, of which 6.1 percent share with others.
Household composition, living conditions (Continued)
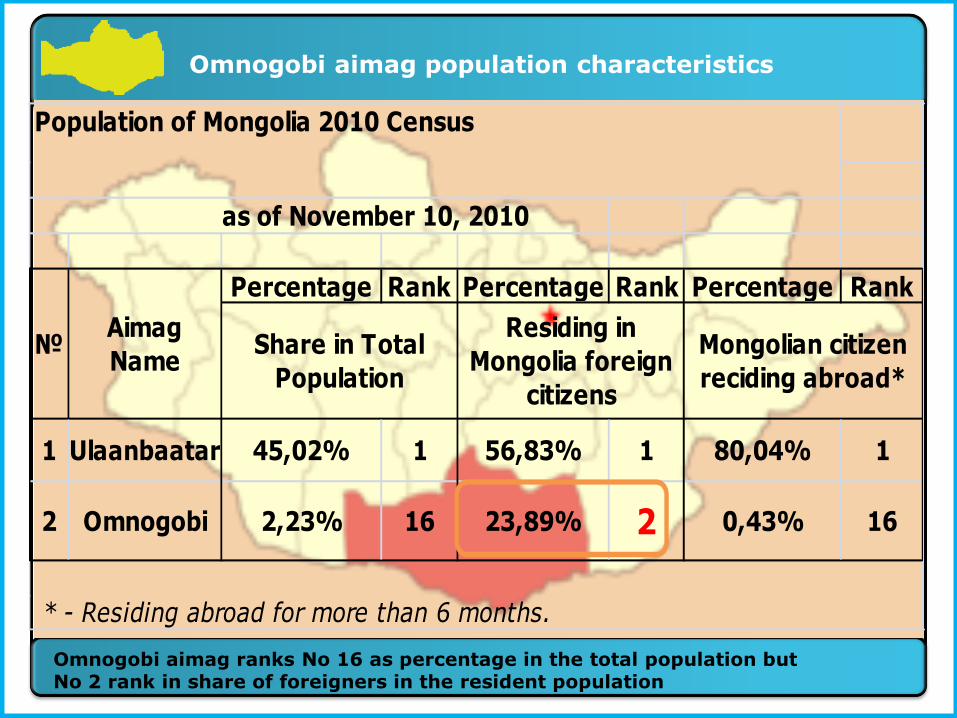
as of November 10, 2010
Percentage Rank Percentage Rank Percentage Rank
1 Ulaanbaatar 45,02% 1 56,83% 1 80,04% 1
2 Omnogobi 2,23% 16 23,89% 2 0,43% 16
Share in Total
Population
Residing in
Mongolia foreign
citizens
Mongolian citizen
reciding abroad*
* - Residing abroad for more than 6 months.
Population of Mongolia 2010 Census
№Aimag
Name
Omnogobi aimag population characteristics
Omnogobi aimag ranks No 16 as percentage in the total population but No 2 rank in share of foreigners in the resident population

1 Aimag, Total 46858 56,930 21%
2 Dalanzadgad 14050 18,740 33%
3 Bayandalai 2431 1,953 -20%
4 Bayan-Ovoo 1643 1,596 -3%
5 Bulgan 2395 2,036 -15%
6 Gurvantes 3608 4,411 22%
7 Mandal-Ovoo 2366 1,569 -34%
8 Manlai 2323 2,028 -13%
9 Noyon 3031 1,017 -66%
10 Nomgon 1569 2,645 69%
11 Servei 2327 1,891 -19%
12 Khanbogd 2373 7,150 201%
13 Khankhongor 2470 1,616 -35%
14 Khurmen 2177 1,557 -28%
15 Tsogt-Ovoo 1928 1,540 -20%
16 Tsogttsetsii 2185 7,181 229%
Omnogobi Population: Net Growth
2010Sum Name№ 2000 Net Growth 2000-10 (%)
Omnogobi Aimag Population Net Growth, by soums
In general, for soums except those having big mining sites (Khanbogd & Tosgttsetsii) as well as those having the border points and the aimag center, Omnogobi aimag population net growth, by soums was negative.

Youth issues

Migration flow from regions to the Capital and age of migrants
53.4 percent of migrants are youth aged from 15-29.

Educational level by age and sex
Share of People with College
Diploma in Total Population,
by sex and age (in percent)
40
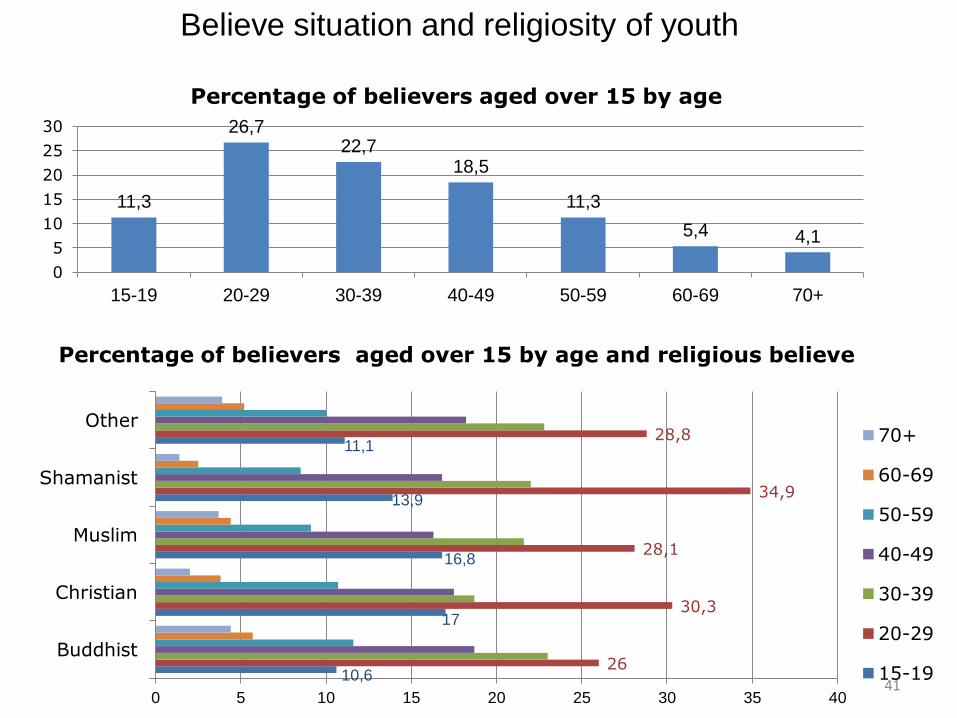
Believe situation and religiosity of youth
11,3
26,7 22,7
18,5
11,3
5,4 4,1
0
5
10
15
20
25
30
15-19 20-29 30-39 40-49 50-59 60-69 70+
Percentage of believers aged over 15 by age
10,6
17
16,8
13,9
11,1
26
30,3
28,1
34,9
28,8
0 5 10 15 20 25 30 35 40
Buddhist
Christian
Muslim
Shamanist
Other 70+
60-69
50-59
40-49
30-39
20-29
15-19
Percentage of believers aged over 15 by age and religious believe
41

Share of Internet users by age and sex (percent)
Share of Internet users among population aged over 15 (percent)
0
10
20
30
40
50
60
15-19 20-24 25-29 30-34 35-39 40-44 45-49 50-54 55-59 60-64 65-69 70+
Male
Female
Total
42

Thank You
Ochir Consulting Ltd
Phone: +976 99185150
Peace Avenue-44/753
Ulaanbaatar 14250 MN
Menu