19.04.2013 investment in stocks and equities in mongolia risks, challenges and trends, d. gan-ochir
TRANSCRIPT

INVESTMENTS IN EQUITIES AND STOCKS
MARKET: RISKS, CHALLENGES, SUBSEQUENT TRENDS
D.Gan-‐Ochir
Any conclusions, opinions mentioned in this report express only the position of researcher and will not banded as Mongol Bank position.
“Foreign investments – Risks and challenges: Methods of solution” meeting

Scope • D.Gan-‐Ochir 2006, ‘Influence of monetary policy to capital market’ research work, ECONOMY: Theory and practice journal, 2006-12.
• D.Gan-‐Ochir, B.Lkhagvajav and D.Batnyam 2008, ‘Monetary Policy and Bond Market: A Case of Mongolia ’research work <http://www.unescap.org/pdd/projects/bondmkt/12_Mongolia_monetary_policy_bond.pdf>.
D.Gan-‐Ochir 2008, ‘Mongolian capital market model (MSMM): Influence of World financial crisis to economy, capital market’ research work <http://www.eri.mn/index.php/en/l?task=view&catid=49&id=21>
• D.Gan-Ochir 2009, ‘Capital flows and their implications for central bank policies in Mongolia’ research work <http://seacen.org/gui/pdf/publications/research_proj/2009/rp76/6-chap5.pdf>.
• D.Gan-Ochir, G.Borkhuu & D.Tsenddorj2012, ‘Financial Contagion and Volatile Capital Flows’ research work <http://www.eri.mn/index.php/en/l?task=view&catid=49&id=732>.

Plan
⋅ Capital flow in financial system
⋅ Theory trends: Proven documents
⋅ Equities and stock market
⋅ Current situation ⋅ Risks, challenges ⋅ Subsequent trends
⋅ Issues to be considered at equities and stock market development

Financial system: Capital flow
Source: Mishkin, FS & Eakins, SG, Financial Markets and Institutions, 7th edition, Pearson Education, Inc., Boston.
NON-‐DIRECT FINANCING: 60-‐80%
CAPITAL CAPITAL
CAPITAL
CAPITAL CAPITAL
Financial market:
⋅ Bond market ⋅ Capital market
DIRECT FINANCING: 20-‐40%
Creditor – Savers
1. Families 2. Business
companies 3. Government 4. Foreign citizens,
organizations
Borrower – Users
1. Business companies 2. Government 3. Families 4. Foreign citizens,
organizations
Financial intermediaries: ⋅ Bank ⋅ Insurance ⋅ Pension fund
Factors impeding proper development and work of market:
⋅ Information costs ⋅ Transaction costs
Obligations of financial system:
⋅ Savings transfer ⋅ Effective placement of recourses
⋅ Establishing of company control
⋅ Improvement of risk management
⋅ Easing product, service trade Channel for economic
growth:
⋅ Capital accumulation ⋅ Technology modernization

Financial systems proven documents
Source: Mishkin, FS, The Economics of Money, Banking and Financial Markets, 10th edition, Pearson Education, Inc., New Jersey.
Bank loan Nonbanking financial institutions loans
Bond Equities
USA
Germany
Japan
Canada
Equities and stocks are not main source of business financing
⋅ Transaction costs:(1) Expansion effectiveness (2) Professionalism (computer technology)
⋅ Asymmetrical information:(1) Bad choice (Lemon’s issue) (2) Ethics deformation (another’s money)
Financial intermediaries, especially banks are essential source of financing business activities
Only major companies are able to raise financing from equities market
Financial system is most regulated sector of economy
⋅ Increase of information ⋅ Improvement of correct and transparent conditions
⋅ Improvement of monitoring

CURRENT SITUATION IN EQUITIES AND STOCK MARKET

Equities and stocks market development (1)
Source: Mongol bank’s monthly statistical bulletin
3,3% 3,0% 2,3% 2,7% 1,3% 1,8% 3,3%
14,5%
7,9% 9,4%
16,3%19,6%
12,9%
5,5%9,7%
14,9%
24,2% 25,7%28,3%
30,4%
41,5% 40,2% 40,3% 38,8%
49,1% 50,1%
0,0%
10,0%
20,0%
30,0%
40,0%
50,0%
60,0%
2000 2001 2002 2003 2004 2005 2006 2007 2008 2009 2010 2011 2012
Хөрөнгийн зах зээлийн үнэлгээ, нэрлэсэн ДНБ-ий харьцаа
Банкны салбарын нийт зээл, нэрлэсэн ДНБ-ий харьцаа
0,0
500,0
1000,0
1500,0
2000,0
2500,0
3000,0
2005
01 05 09
2006
01 05 09
2007
01 05 09
2008
01 05 09
2009
01 05 09
2010
01 05 09
2011
01 05 09
2012
01 05 09
Хөрөнгийн зах зээлийн нийт үнэлгээ, сая ам.доллараар
0
2 000
4 000
6 000
8 000
10 000
12 000
0
5 000
10 000
15 000
20 000
25 000
30 000
35 000
2005
01 05 09
2006
01 05 09
2007
01 05 09
2008
01 05 09
2009
01 05 09
2010
01 05 09
2011
01 05 09
2012
01 05 09Топ-20 (max)-Топ-20 (Min), баруун тэнхлэг
Топ-20 индекс (Хамгийн их утга)
Топ-20 индекс (хамгийн бага утга)
0
20 000
40 000
60 000
80 000
100 000
120 000
140 000
0
20 000
40 000
60 000
80 000
100 000
120 000
2007
01 04 07 10
2008
01 04 07 10
2009
01 04 07 10
2010
01 04 07 10
2011
01 04 07 10
2012
01 04 07 10
Нийт гүйлгээний дүн, сая төгрөг
Засгий газрын бонд, сая төгрөг
Компанийн бонд, сая төгрөг
Хувьцаа, сая төгрөг
Sri Lanka: 40% Indonesia: 50% Mongolia: 12.9%
Cycle related capital market
Capital market value, declared GNP ratio
Total loans of banking sector, declared GNP ratio
Capital market value, million US$ Top-‐20 (max) – Top-‐20 (min), right axis Top-‐20 index (Maximal value) Top-‐20 index (Minimal value)
Total transactions sum, million tugrik’s Government bonds, million tugrik’s Company bonds, million tugrik’s Stocks, million tugrik’s
Equities and stocks market development (2)
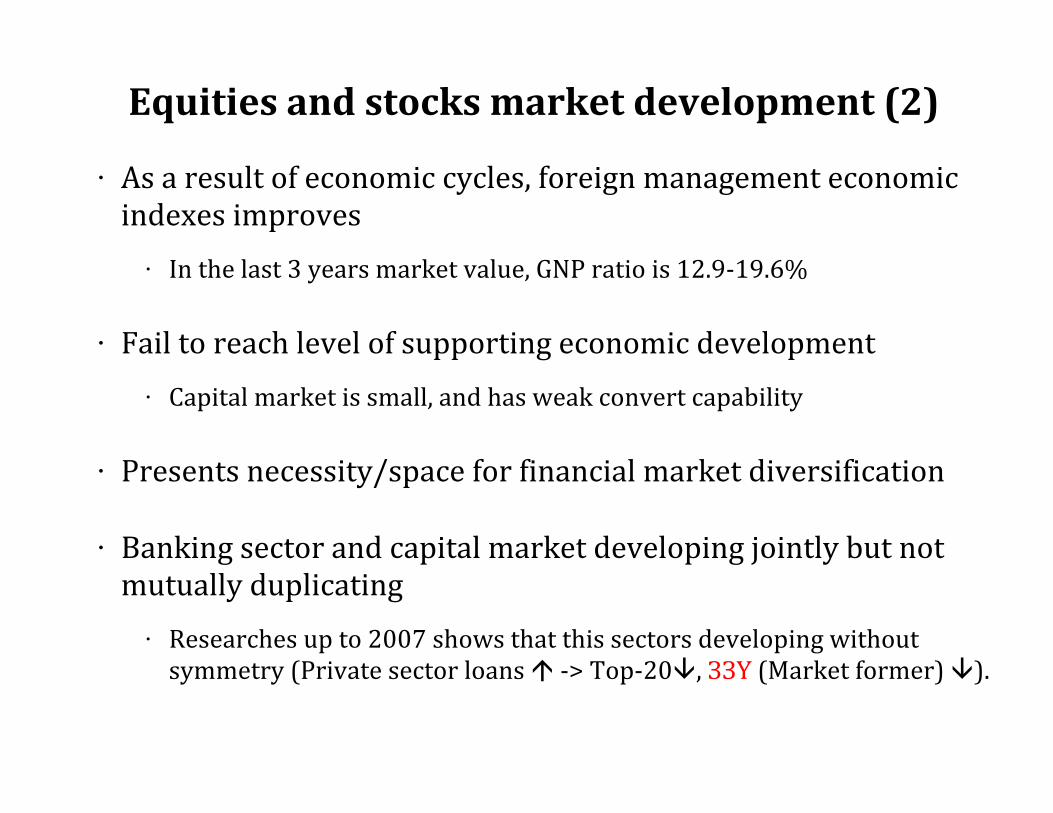
⋅ As a result of economic cycles, foreign management economic indexes improves
⋅ In the last 3 years market value, GNP ratio is 12.9-‐19.6%
⋅ Fail to reach level of supporting economic development
⋅ Capital market is small, and has weak convert capability
⋅ Presents necessity/space for financial market diversification
⋅ Banking sector and capital market developing jointly but not mutually duplicating
⋅ Researches up to 2007 shows that this sectors developing without symmetry (Private sector loans á -‐> Top-‐20â, ЗЗҮ (Market former) â).

EQUITIES AND STOCK MARKETS RISKS AND CHALLENGES

Foreign sector conditions is weak
-0.1
0.1
0.3
0.5
0.7
0.9
1.1
1.3
1.5
1.7
1.9
2.1
2.3
2.5
0.0
1.0
2.0
3.0
4.0
5.0
6.0
7.0
8.0
2000
2001
2002
2003
2004
2005
2006
2007
2008
2009
2010
2011
2012
Худалдааны нөхцөл (баруун тэнхлэг)
Экспортын үнийн индекс
Импортын үнийн индекс
1123
-225-377
-1500
-1000
-500
0
500
1000
1500
2000
2500
I '09
II '0
9
III '
09
IV '0
9
I '10
II '1
0
III '
10
IV '1
0
I '11
II '1
1
III '
11
IV '1
1
I '12
II '1
2
III '
12
IV '1
2
Хөрөнгө ба санхүүгийн тэнцэл
Урсгал тэнцэл
Нийт тэнцэл
838 570
1 630
4 6203 835
0
1 000
2 000
3 000
4 000
5 000
2000
2001
2002
2003
2004
2005
2006
2007
2008
2009
2010
2011
2012
Foreign direct investments decreased by 17% (785 million US$)
2009:01 1.315
2013:02 1.432
Foreign trade conditions worsened by
12.5%
Current account deficit was defrayed
by capital and financial balance
profits
Trade conditions (right axis)
Export price index
Import price index
Capital and finance equality
Flow equality
Total equality

Current conditions of macroeconomics (As of February 2013)
• Export lowering -‐ 4.5%
• Import lowering -‐ 13.6%
• Frogeign trade conditions lowering -‐ 12.5%
• Foreign-‐trade deoicit -‐305.2 million $
• М2 money growth-‐ 16.1%
• Increasment of remainder of the debts -‐ 21.6%
• Inolation rate in Ulaanbaatar -‐ 11.1%
• Inolation rate in state -‐ 11.3%
• Currency rate weakening -‐ 4.6%
• Actual GNP growth -‐ 12.3%
• Agricultural sector growth -‐ 21.3%
• Mining sector growth -‐ 8.9%
• Others -‐ 11.3% Economic growth
Inolation, currency
exchange rate
Foreign trade Money, loan increasement

Economy sensitivity assessment: end of the 2012
Foreign sector
Budget Money&curre
ncy rate
Finance Society
⋅ Raw material export/Total export: 90.8%
⋅ Export/GNP: 43.9% ⋅ ГВЦАН/Import: 20 долоо хоног
⋅ Trade balance/GNP: 23.6%
⋅ Budget balance/GNP:6.7% ⋅ Government dept’s/GNP:
49.6% ⋅ Financial source
necessity/GNP: 7.6% ⋅ Essential expenses/Total
costs:75% ⋅ Raw materials income/Total
income: 32.9%
⋅ Inflation: 14.0% ⋅ Actual interests: -0.75% ⋅ Forex resources/GNP:
40.9% ⋅ Currency rate
flexibility: Relatively weak
⋅ Percentage of foreign currency dept’s in total dept’s: 19.2%
⋅ Equity capital, total assets ratio: 8.2%
⋅ Low grade loan, total loan ratio: 4.2%
⋅ Loan, deposit ratio: 99.7% ⋅ Loan, GNP ratio increase:
2.2%
⋅ Poverty sensitivity: 2.7
⋅ Unemployment rate: 7.7%
⋅ Number of indigents with daily income less than $1.25/total population: 29.8%
⋅ Jeni index: 0.44
Economy sensitivity
Economy sensitivity to foreign shocks is high.
Financial sector sensitivity is average.
Social sector sensitivity is average.
Money, currency rate sensitivity is average-> high.
Budget sensitivity is high.
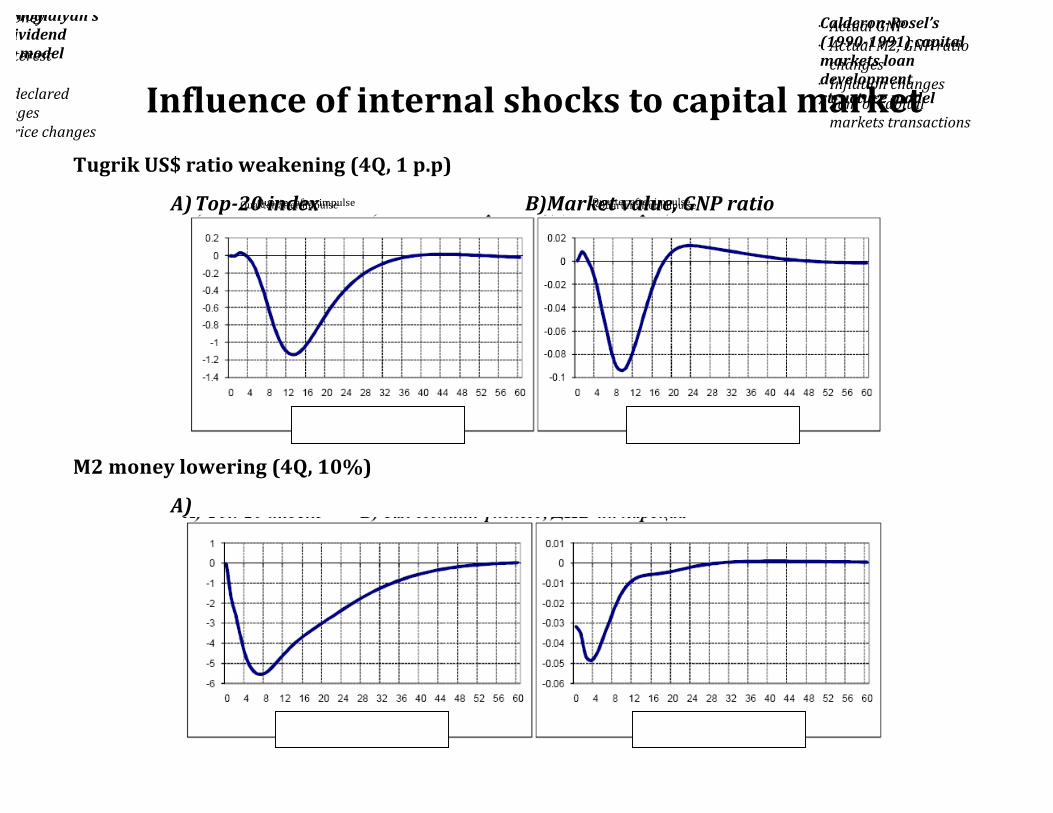
Influence of internal shocks to capital market Tugrik US$ ratio weakening (4Q, 1 p.p)
A) Top-‐20 index B)Market value, GNP ratio
М2 money lowering (4Q, 10%)
A)
Calderon-‐Rosel’s (1990-‐1991) capital markets loan development structure model
Miller & Mogidlyan’s (1961) dividend deflation model
⋅ Actual money changes
⋅ Actual interest changes
⋅ Tugrik’s declared rate changes
⋅ Copper price changes
⋅ Actual GNP ⋅ Actual М2, GNP ratio changes
⋅ Inflation changes ⋅ Sum of capital markets transactions
Quarter after impulse Quarter after impulse Quarter after impulse Quarter after impulse

Influence of foreign shocks to capital market
Deceleration of Chinese growth (4Q, 1 p.p)
Copper price lowering (4Q, 10%)
⋅ Actual money changes
⋅ Actual interest changes
⋅ Tugrik’s declared rate changes
⋅ Copper price changes
⋅ Actual GNP ⋅ Actual М2, GNP ratio changes
⋅ Inflation changes ⋅ Sum of capital markets transactions
Quarter after impulse Quarter after impulse Quarter after impulse Quarter after impulse
A)Top-‐20 index B) Market value, GNP ratio A)Top-‐20 index B) Market value, GNP ratio

Economic growth, inflation guiding indexes
2008-‐09 оны хямралын үе
Э/З-‐ийн өрнөлийн үе
???
2008-‐09 оны хямралын үе
Э/З-‐ийн өрнөлийн үе
??? 2008-‐09 оны хямралын үе
Э/З-‐ийн өрнөлийн үе
??? ⋅ In economic growth with 5-‐6 quarters delay
⋅ In annual inflation with 2 quarters delay
⋅ In annual inflation with 2 quarter delay
⋅ In economic growth with 1-‐5 quarter delay
⋅ In annual inflation with 2-‐3 quarter delay
Foreign sector sensitivity index Finance sensitivity index
General sensitivity index 1 General sensitivity index 5
2008-‐2009 crisis period
2008-‐2009 crisis period
2008-‐2009 crisis period
Economy growth period
Economy growth period
Economy growth period

SUBSEQUENT TRENDS AND CHALLENGES OF EQUITIES AND STOCK MARKET
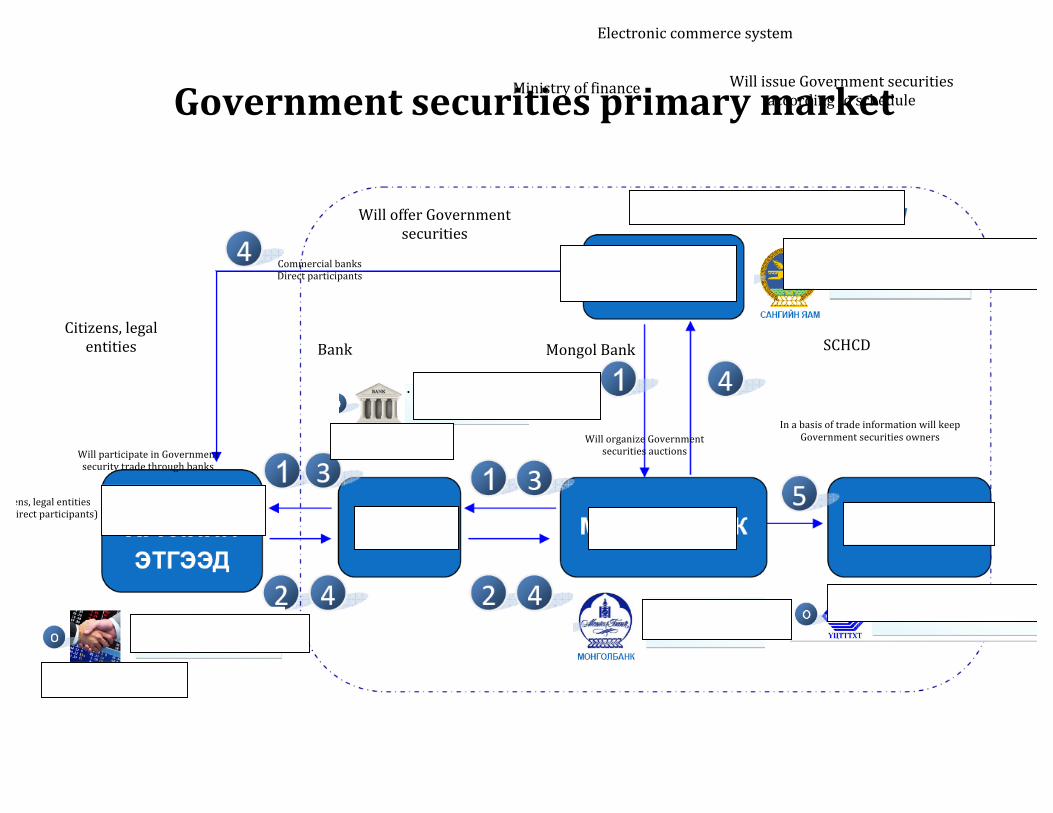
Government securities primary market
Electronic commerce system
Ministry of finance Will issue Government securities according to schedule
Will offer Government securities
Commercial banks Direct participants
Citizens, legal entities Bank Mongol Bank
Citizens, legal entities (non-‐direct participants)
SCHCD
Will participate in Government security trade through banks
Will organize Government securities auctions
In a basis of trade information will keep Government securities owners

Foreign investment procedure in domestic bond, equities market
International financial market
Foreign investors
Domestic banks
Foreign currency swap market Domestic
banks Domestic broker, dealer companies
Government bond market
Mongolian capital market
USD
LIBOR USD
USD ₮ ₮
LIBOR
PR<i<RP
₮ ₮
Government securities interest хүү (12.0%, 1 year)
₮
Government securities, Government
bonds
Companies securities, bonds ₮
Equities, bonds interest
Will conclude executive agent contract
Will give sale, purchase order Mongolian rating
Moody’s: B1
S&P:BB-‐
Fitch:B+
Are foreign investors will be interested in domestic Government bonds?
5 years: 4.125%+3.2%(45₮)=>7.5%
10 years: 5.125%+3.2%(45₮)=> 8.5%

Long-‐term, stabile structure of housing financing Mongol Bank (Finance
intermediator)
Commercial bank
Owners of old housing
New housing payment
Co-‐owner of new housing
State owned organizations in
mortgage secondary market
(SOOMSM)
Capital market Government Investors (SIF etc.)
Source Advance payment
Remainder
Old housing: Credit security
New housing: Credit security
Mortgage loan
Mortgage credit line
Government m
edium-‐
term bonds
At the first stage of development – Government guarantees for
SOOMSM equities
(7) M
ortgage loan
Source
Source
Equities secured by mortgage loan
Equities secured by mortgage loan
Source
(1) (2)
(2)
(2)
(3)
(3)
(3)
(1)
(4)
(5) (6) (6)
(6) (6)
(7) (7)
Mortgage secondary market
Financial structure of purchasing new housing in a basis of old housing
(4) New mortgage loan
Mongol Bank, Government and banks will conclude trilateral contract: Bank will transfer new loan pack, received from Mongol Bank and issued in a basis of Government bond source to the SOOMSM.

Some necessary works
⋅ Government has to activate secondary securities market
⋅ Give possibility to organize human benchmark or effectiveness curve ⋅ Will be formed possibilities to use in implementation of monetary policy
⋅ Organize institutional investors based on pension fund
⋅ Main investor in financial system ⋅ Will be organized long-‐term sources
⋅ Support financial organizations in mortgage secondary market
⋅ Issue MBS of become one of the main supplier of equities ⋅ Will be created long-‐term sources

ISSUES TO BE CONSIDERED AT EQUITIES AND STOCK MARKET DEVELOPMENT

Basic conditions of market development
⋅ Constant sale of Government equities, bonds according to determined schedule, make information transparent
⋅ Will be formed market benchmarks ⋅ Will be developed company bond & derivative market ⋅ Search for bank or foreign sources by companies will be lowered
⋅ Development of market of shares
⋅ Number of registered major companies are low (6 major companies: 5 million $)
⋅ Improvement of assessment process ⋅ Create true, open state of company profit, income ⋅ Improve activity and capability of capital market intermediator’s ⋅ Increase investors knowledge and trust
⋅ Extend base of institutional investors: Joined investment fund, pension fund, insurance companies

⋅ Stabile demand for long-‐term equities and stocks

Questions to be considered during market development
⋅ Improvement of legal environment ⋅ Updated revision of Equity market law ⋅ Adjust in accordance with International capital market principles
⋅ Create legal system oriented to power of the companies and improvement of openness ⋅ Recording, audit standards: Increase trust to companies
⋅ Give consideration to improve capabilities and potentials of capital market participants ⋅ Discuss market difficulties, take information about and implement new products and cervices
⋅ Correct definition of subsequent reforms ⋅ Prepare documents including challenges, solutions and cooperation in the way of capital market development

Thank you for your attention