ocean modelling - ucd
TRANSCRIPT

Ocean Modelling 25 (2008) 83–94
Contents lists available at ScienceDirect
Ocean Modelling
journal homepage: www.elsevier .com/ locate/ocemod
The impact of climate change on storm surges over Irish waters
Shiyu Wang a,*, Ray McGrath a, Jenny Hanafin b, Peter Lynch b, Tido Semmler a, Paul Nolan b
a Met Éireann, Glasnevin Hill, Dublin 9, Irelandb Meteorology and Climate Centre, University College Dublin, Belfield, Dublin 4, Ireland
a r t i c l e i n f o
Article history:Received 1 January 2008Received in revised form 27 June 2008Accepted 27 June 2008Available online 6 July 2008
Keywords:ROMSStorm surgeRegional atmosphere modelExtreme surge
1463-5003/$ - see front matter � 2008 Elsevier Ltd. Adoi:10.1016/j.ocemod.2008.06.009
* Corresponding author. Tel.: +353 1 8065515; fax:E-mail address: [email protected] (S. Wang).
a b s t r a c t
The Regional Ocean Model System (ROMS) of Rutgers University is used to investigate the influence ofanthropogenic climate change on storm surges over Irish waters, particularly on the extreme values.Two experiments were performed to confirm the validity of the approach in the current climate: the firstfocused on hindcasting the surge generated by a storm in early 2002 while the second provided surgestatistics by running the model for the period 1990–2002; in both cases ROMS was driven with ERA-40 forcing fields. The results show that the model is capable of simulating both specific surge eventsand surge climate statistics with reasonable accuracy (order of 10 cm). Model outputs were also com-pared spatially against satellite altimetry data, corrected for long wavelength errors, from 1993 to2001. The ROMS model consistently reproduces the sea level changes in the Irish Sea, and over the watersto the south and west of Ireland. For the investigation of the impact of the climate change on stormsurges, the same configuration of ROMS was driven by atmospheric forcing fields downscaled fromECHAM5/OM1 data for the past (1961–1990) and future (2031–2060; SRES A1B greenhouse gas sce-nario); the downscaled data were produced using the Rossby Centre Regional Atmosphere model(RCA3). The results show an increase in storm surge events around Irish coastal areas in the future pro-jection, except along the south Irish coast; there is also a significant increase in the height of the extremesurges along the west and east coasts, with most of the extreme surges occurring in wintertime.
� 2008 Elsevier Ltd. All rights reserved.
1. Introduction
Storm surges are occasionally severe enough to lead to a signif-icant loss of life and damage to property in coastal areas (McRobieet al., 2005; Wolf and Flather, 2005). With a warming climate thereare concerns that such events may increase in frequency and inten-sity due a combination of rising sea level and an increase in the fre-quency of extreme weather, including storms (IPCC, 2007).According to the IPCC report, there is likely to be an increase inthe number of intense cyclones and associated strong winds, par-ticularly in winter over the North Atlantic; a slight poleward shiftof the storm tracks is also likely. These changes will have a directimpact on storm surges, which are primarily caused by low pres-sure and strong winds. Rising time-mean sea levels will enhancethe impact of surges. In the same report, global sea level is pro-jected to rise 18–59 cm towards the end of this century,excludingthe scaled-up ice discharge, although some researchers argue thatthe range is underestimated and that the rise could reach 1.4 m,based on a proposed linear relationship between global surfacetemperatures and the rate of global mean sea level change overthe timescales relevant to humans-decades to centuries (Rahm-
ll rights reserved.
+353 1 8064247.
storf, 2007). Due to the changes in ocean density structure and cir-culation, local sea level changes will be more difficult to predict butany rise in sea level will exacerbate the impact of storm surges.
In Ireland, flooding is associated mainly with heavy rainfallwhich can lead to enhanced river-flow and over-topping of riverbanks. However, coastal flooding events also cause devastating ef-fect, particularly those associated with storm surge events that oc-cur in combination with spring tides. The effects may be enhancedlocally by the coastal topography (Wells, 1997).
Several early studies on storm surge have been carried out overthe NE Atlantic area. The WASA project (Waves and Storms in theNorth Atlantic; WASA, 1998), for example, analyzed availablestorm data and found that the climate has undergone significantvariation on time scales of several decades. Flather and Smith(1998) found that under enhanced greenhouse gas conditions ex-treme wind speeds could increase by 10% in the North Sea result-ing in a similar increase in the extreme storm surge. Lowe et al.(2001) employed a dynamical approach similar to Flather andSmith (1998) with some improvements, including longer timeslices, higher temporal (3-h) and spatial resolutions (35 km) ofthe atmosphere forcing fields. Their results found a statistically sig-nificant increase in extreme storm surge along the UK coastline un-der assumed future climate conditions. Woth et al. (2005) appliedan ensemble method for the surge study, using 6-h atmospheric

84 S. Wang et al. / Ocean Modelling 25 (2008) 83–94
forcing fields from four different regional climate models (horizon-tal resolution around 50 km) to drive a high resolution surge model(horizontal resolution around 10 km). Their results suggest thatstorm surge extremes may increase along the North Sea coast to-wards the end of this century; based on a comparison betweenthe results of the different ensemble members, it was found thatthe increase is significantly different from zero at the 95% confi-dence level for most of the North Sea coast. All of the studies con-firm the dependence on the underlying driving fields: in order toreach reliable conclusions regarding the impact of climate change,it is necessary to run long time-slice experiments to cover the nat-ural variability of the Atlantic weather.
While the above studies show the uncertainties in predictingfuture storm surges, nevertheless the numerical storm surge mod-els, driven with accurate atmospheric fields, can produce surgeinformation in good agreement with observed data. They can alsobe used to generate information at arbitrary locations and for peri-ods without observation. However, the atmospheric forcing fieldsmust also be available with high temporal resolution; the 12- or6-h data typically available from global models are insufficient tocapture rapid storm developments associated with surge extremes.Because of the local characteristic of the surge, a high spatial reso-lution is also required of the surge model, particularly near com-plex coastlines (e.g. in the Irish Sea). Jones and Davies (2006)have suggested that the wind-induced circulation, which is impor-tant for the surge generation, can be adequately resolved on a7-km mesh except in estuary area. The integration area must alsobe large enough to capture the major Atlantic cyclone systems.Flather (2000), for example, points out that the tides in shelf andcoastal seas are responses to oscillations generated primarily inthe deep oceans and that changes in sea level can also modifythe dynamics of the tides and surges. To allow the least con-strained resonant response to the lateral tidal forcing, the modeldomain should also be large enough to accommodate the majorAtlantic cyclone systems that move over the area, while capturingthe shallow-water characteristics of the Irish Sea.
In previous climate change studies of storm surge in theAtlantic Ocean, most of the research has focused on the NorthSea. In Irish coastal areas and the Irish Sea most of the studies have
Fig. 1. The model doma
used two-dimensional surge models driven with relatively coarsespatial or temporal resolution data (Flather et al., 1998; Flatherand Williams, 2000). Kauker and Langenberg (2000) comparedthe performance of a 3D ocean model and 2D storm surge model;they found that the 2D surge model produces less variability thanthe 3D ocean model. The 2D studies could also be viewed as defi-cient either through the lack of sufficient resolution in the basicmodel or driving data, or the lack of a proper treatment of the in-verted barometer effect in the lateral boundaries. In our study, wefollow and extend the approach used in previous studies. A highresolution regional climate model (25 km horizontal resolution)is run to generate the hourly atmosphere forcing field for the surgemodel. Considering Flather’s experience, a large domain was se-lected, covering an area from the middle of the Atlantic Ocean tothe North Sea and including the Rockall Trough and the Bay of Bis-cay (Fig. 1). The 3D ROMS model also includes the interaction dueto the non-linear dynamical processes in shallow water.
Li et al. (2006) used the ROMS model to study the storm surgeinduced by a hurricane in a semi-enclosed bay. Their results showthat the model has excellent predictability for the storm surge asverified against the real-time data recorded on the observation sys-tems. However, compared to a semi-enclosed bay, the Irish Sea is amuch more complex shelf area, prompting an initial validation ofthe model over the area before the climate change simulationswere performed.
The layout of the paper is as follows: following the methodol-ogy and model setup in Section 2, the validation of the ROMSmodel is presented in Section 3 and the impact of the climatechange study on the storm surge is given in Section 4.
2. Methodology
2.1. The GCM scenario data and regional climate model
The climate change scenario used in this downscaling experi-ment was obtained from ECHAM5/OM1 model (Roeckner et al.,2003), with the future simulations based on the SRES A1B emis-sion scenario (IPCC, 2000). This scenario is characterized by lowpopulation growth, rapid economic growth and rapid introduc-
in and bathymetry.
S. Wang et al. / Ocean Modelling 25 (2008) 83–94 85
tion of new and efficient technologies using a balanced emphasison all energy sources. The atmospheric CO2 concentration in thisscenario reaches 720 ppm at the end of 21th century and theglobal mean temperature will rise about 3.8 degrees Celsius bythe end of this century (relative to the mean temperaturebetween 1961 and 1990). The regional climate model used todownscale the GCM data is the Rossby Centre Regional Atmo-spheric Model (RCA3) developed from the High Resolution Lim-ited Area Model (HIRLAM). Most HIRLAM parameterisationshave been retained in RCA3. However, RCA3 hosts a new land sur-face scheme and some extra hydrological processes are included(Rummukainen et al., 2001; Jones, 2001), which improve the sim-ulation of precipitation and evaporation; these two parametersare used to calculate the fresh water fluxes for the ocean model.In order to cover the selected domain areas for the ocean model-ling, the RCA3 model domain was set up on a 0.22� (25 km),rotated latitude/longitude grid, covering a slightly bigger areathan that shown in Fig. 1. RCA3 has been validated extensivelyusing ECMWF ERA-40 reanalysis data (Uppala et al., 2005) to sim-ulate the present day climate; it has also been used to simulatethe future climate using ECHAM4 (Roeckner et al., 1996) and EC-HAM5 (Roeckner et al., 2003) scenario data. The results suggestthat the model is well able to capture the characteristics of thepresent day climate and is suitable for dynamical downscalingof future climate scenarios (Wang et al., 2006; McGrath et al.,2005).
In this study, the downscaling was performed for two 30-yeartime-slice periods (1961–1990 and 2031–2060) using boundarydata at 6-h intervals from ECHAM5/OM1. In order to drive thestorm surge model and to catch the fast moving cyclone systems,the meteorological forcing fields were saved every hour; theseincluded the 10-m u and v component of wind speed, mean sealevel pressure, net long-wave and short-wave radiation fluxes,precipitation, evaporation, latent and sensible heat fluxes.
2.2. The surge model
The ROMS model is a three-dimensional, hydrostatic, primitiveequation ocean model originally developed by Rutgers University(Shchepetkin and McWilliams, 2003; Shchepetkin and McWil-liams, 2005). It incorporates a non-linear free surface in the baro-tropic mode, enabling simulation of surface elevation changesdue to tides and surges. Stretched, terrain-following, coordinatetransformations are used in the vertical, while orthogonal curvilin-ear coordinate transformations are used in the horizontal.
As mentioned in the introduction, the model domain encloseda large part of the north-west European continental shelf with ahorizontal resolution of 4 min (about 7 km) and 16 vertical levels.As a large part of the North Atlantic Ocean is included in ourmodel domain, open boundary conditions are used in the hori-zontal. For the sea surface elevation boundary condition, the in-verted barometer effect (the change in sea level related to theatmospheric pressure, calculated using the hydrostatic assump-tion) was used. This gives a reasonable approximation to thesea level on the open ocean where coastal effects are not felt,and was used as a boundary condition to approximate changesto sea level related to pressure changes associated with atmo-spheric systems approaching the model domain. In this set up,the model does not include the direct effects of global sea levelrise due to the thermal expansion of seawater or fresh water in-flux from melting ice or glaciers; the changes in sea level andstorm surge are primarily due to the impact of the atmosphericwind and mean sea level pressure. Sea level rise associated withclimate change may affect surge heights in shallow water due tochanges in bathymetry, but the impact is likely to be small (Loweet al., 2001; de Ronde, 1993).
A Flather boundary condition (Flather, 1976) was used for the ti-dal currents and a radiation condition for the momentum, salinityand temperature. The salinity and temperature data are taken fromthe monthly ECHAM5/OM1 data sets. For the tidal forcing, datawere derived from the barotropic tidal data assimilation system ofOregon State University (TPXO6.2) (Egbert and Erofeeva, 2002); itincludes eight primary (M2, S2, N2, K2, K1, O1, P1, Q1) and two longperiod (Mf, Mm) harmonic constituents. These data are mainlyassimilated from 364 cycles of Topex/Posedon satellite data.
Because surges are superimposed on the normal astronomicaltides generated by variations in the gravitational attraction of theMoon and Sun, the surge height was computed following Flatherand Williams (2000):
Sea level elevation ¼ predicted tide levelþ storm surge height
ð1Þ
In order to include the effects of interactions due to non-lineardynamical processes in shallow water, two simultaneous simula-tions were run on separate, but identical, grids. One was driven withall the forcings (tides, inverted barometer effect and wind forcing);the other was driven with tidal forcing only. The surge heights weredetermined by subtracting the tide-only run from the tide plusmeteorological forcing run.
2.3. Validation run
On 1 February, 2002, an intense cyclone formed over thenorthwest of Ireland with a central pressure of about 928 hPa re-corded at 18 UTC (Burt, 2007). The low pressure, in combinationwith strong surface winds and coinciding with high tides, causedserious coastal flooding, particularly along the east and southcoasts of Ireland and the west coast of the UK. This storm waschosen to evaluate the performance of the ROMS model in hind-casting extreme surge events. To reduce the time for model toreach balance, the temperature and salinity data taken from theWorld Ocean Atlas 1998 datasets (Antonov et al., 1998; Boyer etal., 1998) were used as the initial fields. The model simulationwas run for a total of 45 days from 00 UTC on 1 January, 2002to 00 UTC on 15 February, 2002. The first 15 days of results weredisregarded to allow for model spin-up.
To assess the stability of the ROMS model to simulate multi-decadal climate runs, a second and much longer validation run(1990–2002) was carried out. In both cases the model was drivenwith 6-h ERA40 reanalysis data.
For an independent assessment of the performance of ROMS,satellite altimetry data, corrected for long wavelength errors bySSALTO/DUACS (Segment Sol multimissions d’ALTimétrie, d’Orbi-tographie et de localisation précise/Data Unification and AltimeterCombination System) using a 2D gravity wave model (MOG2D-G),were used (Carrere and Lyard, 2003). This dynamic atmosphericcorrection (DAC) data are available from the SSTALTO/DUACS sys-tem at 6-h intervals on a 0.25� � 0.25� global grid.
2.4. Surge extreme analysis
The surge elevations are fitted using a Generalized ExtremeValue distribution GEV (l,r,j), where l is the location parame-ter, r the scale parameter and j the shape parameter. All theseparameters are estimated by the maximum likelihood method.For reliable estimates of the parameters long terms series arerequired (Martins and Stedinger, 2000). In this study, as the30-year time slice is still relatively short for the long-term re-turn period estimation, the 5 largest maxima per year are usedin the analysis. To make sure these data are independent, a48-h time window was applied for the selection of the yearlymaxima.

86 S. Wang et al. / Ocean Modelling 25 (2008) 83–94
2.5. Statistical analysis
A key purpose for this study is to establish the significance levelof any changes for the extreme events in the future projection.Considering that extreme events in the control and future runare generally not normally distributed, the Wilcoxon rank sum testis applied to the future and present day of annual extreme events.The null hypothesis is that the present day and future extremeevents are drawn from the same population. A lower value of theconfidence level (P-value) (10%) means that this null hypothesisis rejected and the difference between the future and present dayextreme events are statistically significant.
3. Validation of the storm surge using reanalysis winds
3.1. Station data analysis
For the 2002 storm surge event, Fig. 2 shows the simulatedand observed surge for 4 selected stations (St. Mary’s, Newlyn,Holyhead and Bangor – see Fig. 1). The model is clearly reproduc-ing both the magnitude and time of surge events in general.Agreement is better at the Newlyn and St. Mary’s stations, whichare less influenced by the topographic and dynamical effects ofthe semi-enclosed Irish Sea basin. However, some extreme surges,in particular a large event on the 22–23 January, were underesti-mated by up to 20 cm in the simulation, even at these stations.For Holyhead and Bangor, there is still a high degree of consis-tency between the modelled and observed time series, but theamplitude of the surge is systematically underestimated at bothstations.
The accuracy of the simulation may be compromised by theuse of 6-h ERA-40 data to drive the ocean model; this frequencyis too low to capture the full effects of fast-moving cyclone sys-tems across the narrow Irish Sea basin. Another factor is the accu-racy of the ERA-40 10-m wind speed. From Flather et al. (1998),the model was found to be capable of capturing the extremestorm surge events when the precise wind forcing was used at6-h resolution. The coarse resolution of ERA40 data is sufficientfor the general large scale system. However, the coarse resolutionERA40 data lack detailed local information, particularly for thestrong wind speed events. Caires and Sterl (2003) validated the
Fig. 2. The simulated and observed surge for (a) St. M
ERA40 wind speed against buoy, ERS-1, and Topex altimeter mea-surements. They found that the high wind speed is underesti-mated. Comparing the ERA-40 data with synoptic surfaceobservations, we find that the reanalysis wind strengths in thiscase are biased low, in general, but the bias is particularly evidentfor the strongest winds. Both of these factors will lead to weakersurges in the simulation compared with the observations. An-other issue is the resolution of the ocean model; at approximately7 km it is too coarse to capture the detailed flow in the Irish Seainshore region, particularly in the North Channel (Jones and Da-vies, 2006).
According to the research of Lowe et al. (2001), along the southIrish Sea coast the surge height is dominated by the invertedbarometer effect, with the wind forcing providing only 16% ofthe surge height. In the north Irish Sea, on the other hand, the windforcing contributes 72% of the surge height. A sensitivity study wascarried out in which the ERA-40 winds were modified to providebetter agreement with synoptic observations; the results con-firmed that the wind bias is the main reason that the model per-forms better in the south Irish Sea (not shown).
For the 12-year simulation run (1990–2002), the hourly ob-served surge data from the British Oceanographic Data Center for8 stations were used for validation. Summary statistics are listedin Table 1: the standard deviation error (STD), the root-mean-square error (RMSE), the RMS difference between the observedand simulated surges, and the correlation coefficient.
STD ¼
ffiffiffiffiffiffiffiffiffiffiffiffiffiffiffiffiffiffiffiffiffiffiffiffiffiffiffiffiffiffiffiffiffiffiffiffiffiffiffiffiffiffiffiffiffiffiffiffiffiffiffiffiffiffiffiffiffiPNi¼1ððYi � �YÞ � ðXi � �XÞÞ2
N
sð2Þ
RMSE ¼
ffiffiffiffiffiffiffiffiffiffiffiffiffiffiffiffiffiffiffiffiffiffiffiffiffiffiffiffiffiffiffiPNi¼1ðYi � XiÞ2
N
sð3Þ
RMS difference ¼
ffiffiffiffiffiffiffiffiffiffiffiffiffiffiffiffiPNi¼1Y2
i
N
s�
ffiffiffiffiffiffiffiffiffiffiffiffiffiffiffiffiPNi¼1X2
i
N
sð4Þ
where Y is the modeled series, X is the observed series, �Y and �X arethe mean value of simulated and observed series, N is the number ofthe data of the series. For Bangor, the hourly data only cover about 5years; data for the other stations cover at least 7 years.
In the Irish Sea, the simulated surges have a relatively large er-ror in the northern end compared to the south. The correlation
ary’s, (b) Newlyn, (c) Holyhead and (d) Bangor.

Table 1Error statistics of the simulated and observed surge elevation at different stations(heights are in cm)
Sample size RMSE STD RMS difference Correlation
St. Mary’s 70494 9.42 9.41 �1.16 0.75Portpatrick 103280 12.83 12.6 4.07 0.75Port Erin 62069 12.25 12.03 3.7 0.73Port Ellen 97514 13.01 12.85 4.8 0.75Fishguard 106900 9.05 8.7 0.77 0.84Newlyn 108646 9.52 9.36 �0.48 0.76Holyhead 79716 10.31 10.23 2.15 0.80Bangor 46738 12.32 12.07 3.3 0.71
S. Wang et al. / Ocean Modelling 25 (2008) 83–94 87
coefficients are generally high for all the stations. Both the RMSEand STD figures show that the model is able to reproduce the surgevariability for the decade simulated here with reasonable accuracy(order of 10 cm) in this region. The small difference between theRMSE and STD indicate that the mean values of observation andsimulation for the whole simulation period are very close, the sim-ulation results have a good agreement with the observation.
To investigate extreme surge events, Fig. 3 shows the histogramdistributions for the same four stations. For moderate surges, themodel simulation is quite reasonable, while for the maximumsurge there is an underestimation for all stations although agree-ment with observations is quite good for Newlyn. This is not sur-prising, in view of the underestimated wind speed and spatialbias of ERA40 data, but the relatively coarse horizontal resolutionof the ocean model may also be a factor, as discussed above. Thesimulation of the higher storm surge events in the south Irish
Fig. 3. Histogram distribution of the surge events for (a)
Sea area (Fig. 3a and b ) is much better than in the north IrishSea area (Fig. 3c and d).
3.2. Spatial variation comparison
The aim of the 12-year simulation was to evaluate the capabil-ity of the model to perform long climate simulations. To facilitatecomparison with the satellite altimetry data for the period1993–2001, ROMS output from a small inner domain (49–55�Nand 1–12�W) was saved. As the satellite data are weekly averagesthe ROMS output was similarly converted.
The spatial and temporal variability of both sets of data werecompared for the period 1993–2001 over the ocean area adjacentto Ireland, stratified into latitude/longitude bins as indicated inTable 2. Time series for the western area are shown in Fig. 4.The ROMS model is in good agreement with the satellite-deriveddata in this domain. In the southern area the results are similarbut agreement is poor for the northern domain (not shown).These results are also confirmed in the scatterplots shown inFig. 5.
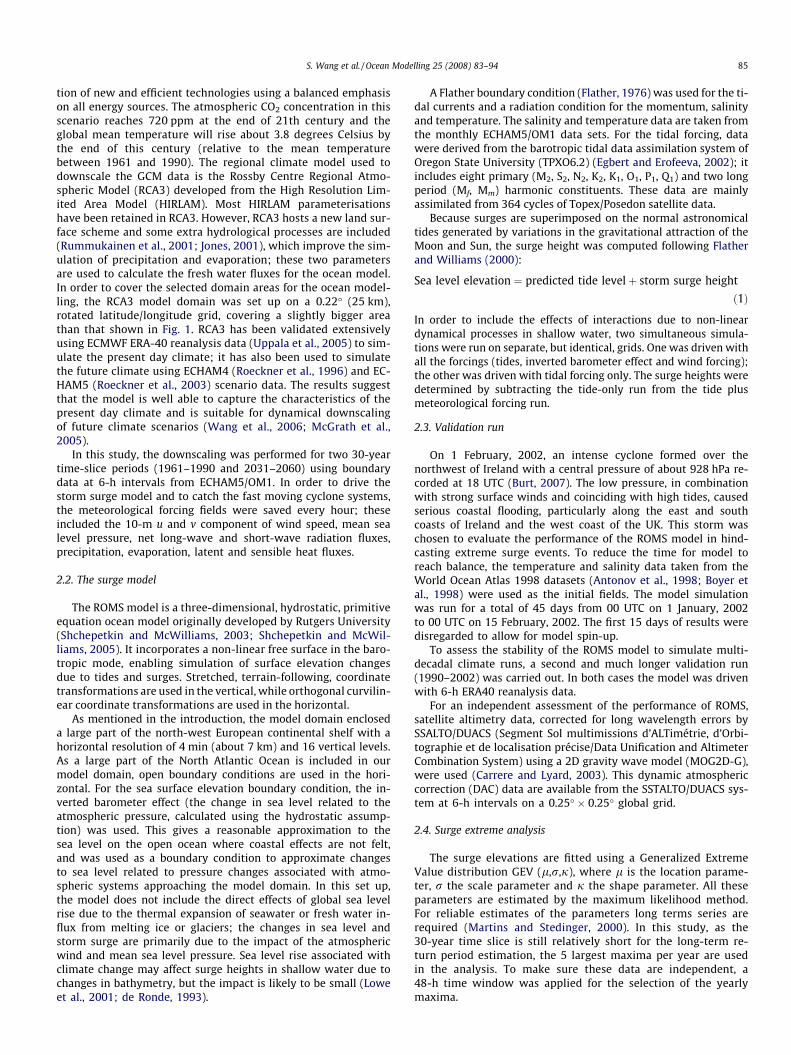
The correlation coefficient and RMS difference fields (Fig. 6aand b) show similar features from year to year. High correlationsare observed in the southern part of the domain, with valuesexceeding 0.7 around much of Ireland, and more than 0.9 off thesouthwest coast. The RMS difference fields show a similar pattern,with values of 4–12 cm around the coasts and over most of thearea, apart from the extreme north and northwest.
Low correlations and high RMS values north of Ireland indicatea systematic difference between the two sets of data in this area.
St. Mary’s, (b) Newlyn, (c) Holyhead and (d) Bangor.

Table 2Differences between ROMS and satellite-derived data (units are in cm)
Area Latitude (�N) Longitude (�W) RMS difference R2 Bias
North 56.6–57.1 8–9 13.0 0.25 4.1West 51.6–52.3 10.6–11.6 4.4 0.87 4.3South 50–50.6 8–9 8.1 0.70 �0.4
Fig. 5. Scatterplots of ROMS surge and DAC data for the north (a), south (b) andwest (c) regions defined in Table 2.
88 S. Wang et al. / Ocean Modelling 25 (2008) 83–94
The consistency of the spatial patterns from year to year points to-wards a bathymetric effect. This may be due to the bathymetry inthe ROMS model having insufficiently high resolution or accuracyin the area adjacent to the Erris–Slyne trough off the north-westof Ireland. It could also be due to inconsistencies in the bathymetryused in the models.
Generally, the above analysis shows that the ROMS model iscapable of reproducing storm surge events with reasonable accu-racy, supporting its use as a suitable tool in climate change studies.
4. The impact of climate change on storm surge
4.1. Station data analysis
Ireland is particularly exposed to Atlantic storms due to itslocation on the west of Europe. To evaluate the impact of achanging climate on future storm surges, statistics of originaltime series were created for 13 coastal sites. The results for thesesites are summarized in Table 3, which shows the simulatedchanges (2031–2060 relative to 1961–1990) in surge heights.The range 50–100 cm is chosen as being typical of surges associ-ated with coastal flooding in Ireland (Flather et al., 1998). The re-sults show increases in the frequency of such occurrences in allcases in the future simulation, especially along the west coastof Ireland (more than 30% increase in some cases). There are sim-ilar changes in the extremes (99% percentile); with the exceptionof Cork all show increases. For the maximum surge height, thechanges are more variable but some sites show a large increase
Fig. 4. Time series of (a) dynamic atmospheric correction (DAC), calculated by the MOGROMS model; (c) DAC-ROMS residuals. Data shown are weekly data from the West regi
(e.g. Galway). To investigate the significance of the high surgeevents, the Wilcoxon rank sum test is applied to the high surgeevents ( surge height higher than 50 cm) between the controlrun and future projection. The P values indicate that the changesof a few the stations are significant at 10% level, while most ofstations are non-significant.
2D-G model for correction of altimetric sea level anomalies; (b) surge generated byon (see Table 3) from January 1993 to December 2001.
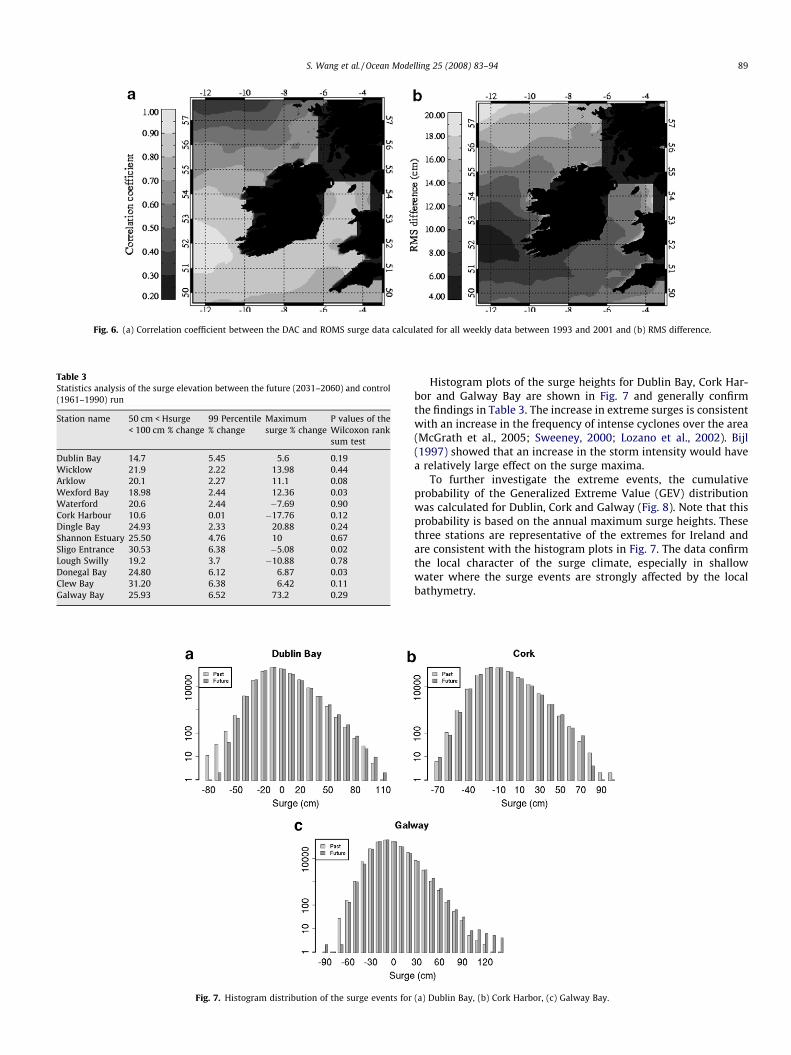
Fig. 6. (a) Correlation coefficient between the DAC and ROMS surge data calculated for all weekly data between 1993 and 2001 and (b) RMS difference.
Table 3Statistics analysis of the surge elevation between the future (2031–2060) and control(1961–1990) run
Station name 50 cm < Hsurge< 100 cm % change
99 Percentile% change
Maximumsurge % change
P values of theWilcoxon ranksum test
Dublin Bay 14.7 5.45 5.6 0.19Wicklow 21.9 2.22 13.98 0.44Arklow 20.1 2.27 11.1 0.08Wexford Bay 18.98 2.44 12.36 0.03Waterford 20.6 2.44 �7.69 0.90Cork Harbour 10.6 0.01 �17.76 0.12Dingle Bay 24.93 2.33 20.88 0.24Shannon Estuary 25.50 4.76 10 0.67Sligo Entrance 30.53 6.38 �5.08 0.02Lough Swilly 19.2 3.7 �10.88 0.78Donegal Bay 24.80 6.12 6.87 0.03Clew Bay 31.20 6.38 6.42 0.11Galway Bay 25.93 6.52 73.2 0.29
Fig. 7. Histogram distribution of the surge events for
S. Wang et al. / Ocean Modelling 25 (2008) 83–94 89
Histogram plots of the surge heights for Dublin Bay, Cork Har-bor and Galway Bay are shown in Fig. 7 and generally confirmthe findings in Table 3. The increase in extreme surges is consistentwith an increase in the frequency of intense cyclones over the area(McGrath et al., 2005; Sweeney, 2000; Lozano et al., 2002). Bijl(1997) showed that an increase in the storm intensity would havea relatively large effect on the surge maxima.
To further investigate the extreme events, the cumulativeprobability of the Generalized Extreme Value (GEV) distributionwas calculated for Dublin, Cork and Galway (Fig. 8). Note that thisprobability is based on the annual maximum surge heights. Thesethree stations are representative of the extremes for Ireland andare consistent with the histogram plots in Fig. 7. The data confirmthe local character of the surge climate, especially in shallowwater where the surge events are strongly affected by the localbathymetry.
(a) Dublin Bay, (b) Cork Harbor, (c) Galway Bay.

Fig. 8. Cumulative probability distribution of the annual extreme surge for (a) Dublin Bay, (b) Cork Harbor, (c) Galway Bay.
90 S. Wang et al. / Ocean Modelling 25 (2008) 83–94
4.2. The spatial distribution analysis
4.2.1. The wind speed and mean sea level pressureAs discussed above, the wind speed and mean sea level pressure
are two main factors for generating the storm surge. Changes (%) inthe annual mean wind speed (Fig. 9) are relatively small; there isan increasing tendency along the west and north-west coast of Ire-land and part of the UK coast, but a decrease over the open sea inthe ROMS integration area. These results are similar to the findingsin Debernard et al. (2002), which concludes that the largestchanges are expected in high latitude areas.
For the difference changes of mean sea level pressure (PMSL)(Fig. 10), the distribution pattern shows an increase around Irelandand to the south, and a decrease to the northwest. This is consis-
Fig. 9. Relative changes between future and control run periods for the annualmean wind speed (%).
tent with an increase in the frequency of intense cyclones overthe area in the future.
While the annual mean wind speed does not change much, it isinteresting to investigate the variation in the maximum speeds,which are often implicated in the strongest surges. Fig. 11 showsthe relative change in the 10-year and 50-year return values.Around the northern coast of Ireland, the 10-year return valuehas increased 6–10% (Fig. 11a). For the 50-year return value (Fig.11b), the spatial pattern is similar, with a slightly higher increasearound the northern area. In both cases there is a slight decreasealong the south coast. Stratification of the data by season showsthat the increase in winds occurs mainly in winter; summer valuesshow a slight decrease. The significant test also reveals that thereare rather small significant changes in the annual extreme wind
Fig. 10. Bias between future and control run for the annual mean sea level pressure(Pa).

Fig. 11. Relative change in the 10-year (a) and 50-year (b) return values of annual maximum wind speed between the future and past control run (%). The P values of theWilcoxon rank sum test between the control and future extreme wind speed simulations are shown in (c).
S. Wang et al. / Ocean Modelling 25 (2008) 83–94 91
speed (Fig. 11c). Only a few locations along west Irish coast are sig-nificant at the 10% level.
4.2.2. The extreme value analysis of the surge height from the controlrun
Apart from the wind speed, the wind direction is also a veryimportant factor in the generation of extreme surges. Along the
Fig. 12. The 10-year (a) and 50-year return values of the
west coast of Ireland the prevailing westerly and southwesterlywinds are associated with the strongest surges. However, overthe Irish Sea, the tidal streams are propagated from both the northand south and meet southwest of the Isle of Man, enhancing surgeheights around this area. The 10-year return value of the extremestorm surge from the control run shows that the maximum surgeheights occurred in the Solway Firth area (Fig. 12a), similar to
annual maximum surge height for the control run.

Fig. 13. Relative change in the 10-year (a) and 50-year (b) return values of annual maximum storm surge between the future and past control run (%). The P values of theWilcoxon rank sum test between the control and future extreme surge height simulations are shown in (c).
92 S. Wang et al. / Ocean Modelling 25 (2008) 83–94
the findings of Flather et al. (1998). The 50-year return value ofsurge heights from the ROMS simulation is shown in Fig. 12b.The spatial distribution is very similar to Flather’s equivalentmap (Flather, 1987) which is based on a sample of 16 storms con-strained by observations. These results show that the ROMS modelis capable of producing reliable surge extremes when it is forced bysuitable meteorological fields.
4.2.3. The effect of future scenario changes on the storm surgeextremes
The relative changes of the 10-year and 50-year return period ofthe surge heights between the future and control simulation showthat along most of the Irish coastline the trend is for increasingsurge height (Fig. 13a and b). However, the spatial pattern of thechange is far from uniform. It is interesting to compare the changeswith the corresponding changes in extreme wind speed (Fig. 11).There is some correlation between changes in the maximum windspeed and changes in extreme surge heights but this does not ap-ply everywhere; in the 50-year return values (Fig. 13b) the ex-treme storm surge heights decreased along the north coast whilethe maximum wind speed increased; changes in the wind directionmay be a factor in this case. Due the complex bathmetry in the con-tinental shelf area, some non-local surge propagating along thecoast also caused the discrepancy between the surge height andwind speed. The significant test results show that large fractionof the extreme surge heights in the southern Irish sea area are sig-nificant at 10% level, while almost non-significant in the northern
area, which is totally different from the extreme wind speeddistribution.
As discussed before, there is a strong seasonal variation for themaximum wind speed. This will have a strong impact on the ex-treme storm surges. Fig. 14a–d show the 10-year return value ofthe annual extreme storm surge distribution for the four seasons.In general these show increases in winter and spring, and de-creases in summer and autumn.
5. Conclusions and discussion
Coastal flooding and coastal erosion are issues with seriouseconomic and social impacts. Recent studies have aimed atunderstanding and quantifying changes in the surge climatologyand, in particular, surge extremes. Such studies usually requiremodel simulations extending over many decades. An initialrequirement is to validate the capability of the model to realis-tically reproduce the storm surges and to evaluate whether themodel performance is robust over runs of decadal duration.
In this study, a regional ocean model ROMS was firstly validatedagainst observation in a short and long term study. For the shortterm validation, the ROMS model is capable of reproducing the gen-eral surge variation, especially in the south Irish Sea. However, dueto the systematic under-prediction of the wind strengths in the ERA-40 data and the coarse temporal frequency (6-h) of the driving data,the simulated surge in the north Irish Sea has a relatively large error.To improve the accuracy of the simulations, and especially to cap-

Fig. 14. Relative change of 10-year return value of seasonal maximum storm surge between the future and past control run (%). (a) Spring, (b) Summer, (c ) Autumn, (d)Winter.
S. Wang et al. / Ocean Modelling 25 (2008) 83–94 93
ture the peak values, it is important to have accurate wind data fordriving the model.
For the long-term validation run, comparison against stationdata show that the model is able to reproduce the surge variabilitywith reasonable accuracy (order of 10 cm) over the chosen area. Italso performs well when validated against satellite altimetry datacorrected with the MOG2D-G model; time series values from bothdata sets show high correlation around Irish coastal areas and theIrish Sea, except in the northwest region. These results show thatthe ROMS model is reliable and suitable for studies of surge clima-tology in Irish waters.
For the climate change study, the ROMS model was run for two30 year time-slice periods (1961–1990 and 2031–2060), forced byhourly meteorological data produced by dynamically downscalingECHAM5/OM1 A1B scenario data using the Rossby Center Regionalclimate model.
Analysis of the results shows that storm surge heights in the range50–100 cm are increasing in frequency around all Irish coastal areas;up to 20% in the west and northwest. There is also a significant in-crease in the height of the extreme surges along the west and eastcoasts, with most of the extreme surges occurring in wintertime.Changes in extreme surge heights also appear to be related tochanges in extreme wind speeds and mean sea level pressure. Thereare also significant changes in the return values of surge heights.
This study has been based on a single future scenario from aGCM. One single simulation only can provide one possible basicinformation set. However, SRES A1B scenario is one of the reason-able IPCC scenarios. Therefore, this single simulation still can pro-
vide us with some useful information. We can get basic idea abouthow the storm surge changes under future projection. Consideringthat the uncertainty in the atmospheric forcing data will be re-flected in the surge outputs, the study needs to be repeated usingother GCM scenario data to qualify this uncertainty.
Acknowledgement
This work was carried out under the Community ClimateChange Consortium for Ireland (C4I) Project, funded by the follow-ing Irish agencies: Environmental Protection Agency (under theNational Development Plan), Met Éireann, Sustainable Energy Ire-land, and the Higher Education Authority. The work was also sup-ported by the CosmoGrid project, funded under the Programme forResearch in Third Level Institutions (PRTLI) administered by theIrish Higher Education Authority under the National DevelopmentPlan and with partial support from the European Regional Develop-ment Fund. Dynamic Atmospheric Corrections are produced by CLSSpace Oceanography Division using the MOG2D model from Legos.The altimeter products were produced by SSALTO/DUACS anddistributed by AVISO, with support from CNES. The tide gauge dataare provided by the British Oceanographic Data Center.
References
Antonov, J.I., Levitus, S., Boyer, T.P., Conkright, M.E., O’Brien, T.D., Stephens, C., 1998.World Ocean Atlas 1998 Vol. 1: Temperature of the Atlantic Ocean. NOAA AtlasNESDIS 27. US Government Printing Office, Washington, D.C.

94 S. Wang et al. / Ocean Modelling 25 (2008) 83–94
Boyer, T.P., Levitus, S., Antonov, J.I., Conkright, M.E., O’Brien, T., Stephens, C., 1998.World Ocean Atlas 1998 Vol. 4: Salinity of the Atlantic Ocean. NOAA AtlasNESDIS 30. US Government Printing Office, Washington, DC.
Bijl, W., 1997. Impact of wind climate change on the surge in the Southern NorthSea. Climate Res. 8, 45–59.
Burt, S., 2007. The lowest of the lows: extremes of barometric pressure in the BritishIsles, Part 1- the deepest depressions. Weather 62 (1), 4–14.
Caires, S., Sterl, A., 2003. Validation of ocean wind and wave data using triplecollocation. J. Geophys. Res. C 108 (3), 3098. doi:10.1029/2002JC001491.
Carrere, L., Lyard, F., 2003. Modeling the barotropic response of the global ocean toatmospheric wind and pressure forcing – comparisons with observations. Geo.Res. Lett. 30 (6), 1275.
Debernard, J., Satra, O., Roed, L.P., 2002. Future wind, wave and storm surge climatein the northern North Atlantic. Climate Res. 23, 39–49.
de Ronde, J.G., 1993. What will happen to the Netherlands if sea level riseaccelerates. In: Warrick, R.A., Barow, E.M., Wiegley, T.M.L. (Eds.), Climate andsea level change: observation, projection and implication. Cambridge UniversityPress, Cambridge, pp. 322–335.
Egbert, G.D., Erofeeva, S.Y., 2002. Efficient inverse modeling of barotropic oceantides. J. Atmos. Oceanic Technol. 19, 183–204.
Flather, R.A., 1976. A tidal model of the northwest European continental shelf. Mem.Soc. Roy.Sci. Leige, Ser. 6 (10), 141–164.
Flather, R.A., 1987. Estimates of extreme conditions of tide and surge using anumerical model of the Northwest European continental shelf. Estuarine Coast.Shelf Sci. 24, 69–93.
Flather, R.A., 2000. Existing operational oceanography. Coastal Eng. 41, 13–40.Flather, R.A., Smith, J.A., 1998. First estimates of changes in extreme storm surge
elsvations due to the doubling of CO2. Global Atmos. Ocean Syst. 6, 193–208.Flather, R.A., Williams, J.A., 2000. Climate change efffects on the storm surge:
methodologies and results. In: Beersma, J., Agnew, M., Viner, D., and Hulme, M.,(Eds.), Climate scenarios for water-related and coastal impact. Norwich:CRU,ECLAT-2 Workshop Report No. 3. pp. 66–78.
Flather, R.A., Smith, J., Richards, J., Bell, C., Blackman, D., 1998. Direct estimates ofthe extreme surge elevation from a 40 year numerical model simulation andfrom observation. Global Atmos. Ocean Syst. 6, 165–176.
IPCC, 2000. Special Report on Emission Scenarios. Cambridge University Press, UK.IPCC, 2007. Summary for Policymakers. In: Solomon, S., Qin, D., Manning, M., Chen,
Z., Marquis, M., Averyt, K.B., Tignor, M., Miller, H.L., (Eds.), Climate Change 2007:The Physical Science Basis. Contribution of Working Group I to the FourthAssessment Report of the Intergovernmental Panel on Climate Change.Cambridge University Press, Cambridge, United Kingdom and New York, NY,USA.
Jones, C., 2001. A brief description of RCA2. SWECLIM Newsl. 11, 9–14.Jones, J.E., Davies, A., 2006. Application of a finite element model (TELEMAC) to
computing the wind induced response of the Irish sea. Continental Shelf Res.,1519–1541.
Kauker, F., Langenberg, H., 2000. Two models for the climate change relateddevelopment of sea levels in the North Sea – a comparison. Climate Res. 15, 61–67.
Li, M., Zhong, L., Boicourt, W.C., Zhang, S., Zhang, D., 2006. Hurricane-induced stormsurges, currents and destratification in semi-enclosed bay. Geophys. Res. Lett.33, L02604. doi:10.1029/2005GL024992.
Lozano, I., Devoy, R., May, W., Andersen, U., 2002. Storminess and associatedcyclone tracks along the Atlantic Coastlines of Europe: evolution during the lastsix decades and modelling an CO2-induced climate scenario. AmericanGeophysical Union.
Lowe, J.A., Gregory, J.M., Flather, R.A., 2001. , Changes in the occurrence of stormsurges around the United Kingdom under a future climate scenario using adynamic storm surge model driven by the Hadley Centre climate models.Climate Dyn. 18, 179–188.
Martins, E.S., Stedinger, J.R., 2000. Generalized maximum-likelihood extreme-valuequantiule estimators for hydrological data. Water Resorce Res. 36,737–744.
McGrath,R., Nishimura, L., Nolan, P., Ratnam, J.V., Semmler, T., Sweeney, C.,Wang, S.,2005. Community climate change consortium for Ireland (C4I) 2004 annualreport, Met Eireann, Dublin, Ireland, pp. 1–118.
McRobie, A., Spencer, T., Gerritsen, H., 2005. The big flood: North Sea storm surge.Phil. Trans. R. Soc. Lond. A 363, 1263–1270.
Rahmstorf, S., 2007. A semi-empirical approach to projecting future sea-level rise.Science 315, 368–370.
Roeckner, E., Arpe, K., Bengsson, L., Christoph, M., Claussen, M., Duemenil, L., Esch,M., Giorgetta, M., Schlese,U., Schulzweida,U., Giorgetta, M., Schlese, U., 1996.The Atmospheric General Circulation Model ECHAM-4: Model Description andSimulation of Present-Day-Climate, Max-Planck Institute for Meteorology,Report No. 218, Hamburg, Germany, pp. 1–90.
Roeckner, E., Bauml, G., Bonaventura, L., Brokopf, R., Esch, M.,Giorgetta, M.,Hagemannn, S., Kirchner, I., Kornblueh, L, Manzini, E., Rhodin, A., Schlese, U.,Schulzweida, U., Tompkins, A., 2003.The Atmospheric General CirculationModel ECHAM5 Part I: Model Description, Max-Planck Institute forMeteorology, Report No. 349, Hamburg, Germany, pp. 1–127.
Rummukainen, M., Räisänen, J., Bringfelt, B., Ullerstig, A., Omstedt, A., Willén, U.,Hansson, U., Jones, C., 2001. A regional climate model for northern Europe:model description and results from the downscaling of two GCM controlsimulations. Climate Dyn. 17, 339–359.
Shchepetkin, A.F., McWilliams, J.C., 2003. A method for computing horizontalpressure-gradient force in an oceanic model with a nonaligned verticalcoordinate. J. Geophys. Res. 108 (C3), 3090. doi:10.1029/2001JC001047.
Shchepetkin, A.F., McWilliams, J.C., 2005. The regional oceanic modeling system(ROMS): a split-explicit, free-surface, topography-following-coordinate oceanicmodels. Ocean Modell. 9, 347–404.
Sweeney, J., 2000. A three century storm climatology of Dublin. Irish Geogr. 33, 1–14.
Uppala, S.M., Kållberg, P.M., Simmons, A.J., Andrae, U., Bechtold, V., Fiorino, M.,Gibson, J., Haseler, J., Hernandez, A., Kelly, G., Li, X., Onogi, K., Saarinen, S., Sokka,N., Allan, R., Andersson, E., Arpe, K., Balmaseda, M., Beljaars, A., Berg, L., Bidlot, J.,Bormann, N., Caires, S., Dethof, A., Dragosavac, M., Fisher, M., Fuentes, M.,Hagemann, S., Hólm, E., Hoskins, B., Isaksen, L., Janssen, P., McNally, A., Mahfouf,J., Jenne, R., Morcrette, J., Rayner, N., Saunders, R., Simon, P., Sterl, A., Trenberth,K., Untch, A., Vasiljevic, D., Viterbo, P., Woollen, J., 2005. The ERA-40 reanalysis.Quart. J. Roy. Meteorol. Soc. 131, 2961–3012.
Wang, S., McGrath, R., Semmler, T., Sweeney, C., 2006. Validation of simulatedpatterns over Ireland for the period 1961–2000. Int. J. Climatol. 26, 251–266.
WASA, 1998. changing waves storms in the northeast Atlantic ocean. Bull. Am.Meteorol. Soc. 79, 741–760.
Wells, N., 1997. Atmosphere and Ocean: A Physical Introduction. John Wiley andSons Ltd.
Woth, K., Weisse, R., Storch, H., 2005. Climate change and North Sea storm surgeextreme: an ensemble study of storm surge extremes expected in an changedclimate projected by four different regional climate model, Ocean Dyndoi:10.1007/s10236-005-0024-3.
Wolf, J., Flather, R.A., 2005. Modelling waves and surges during the 1953 storm. Phil.Trans. R. Soc. A, 1572.