ocean currents. 2 currents surface currents in the oceans are driven by winds. the major surface...
TRANSCRIPT

OCEAN CURRENTS

2
Currents• Surface currents in the oceans are driven by winds. The
major surface circulation patterns at sea are the result of the prevailing winds in the atmosphere.
• Prevailing winds in the atmosphere drive surface currents in the oceans in predictable patterns.
• Because the density of the water is about 1000 times greater than the density of the air, the motion in the water will continue even when there is no wind because of the water’s inertia.
• Surface circulation is a response to the long-term average atmospheric circulation.

3
Gyres
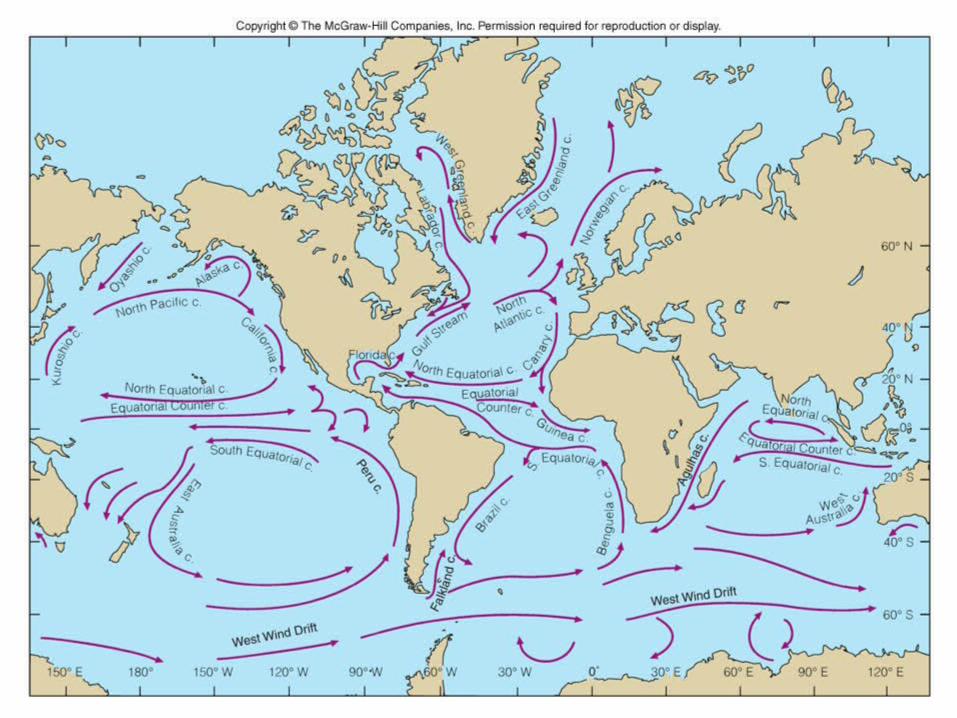
• Large circular surface currents called gyres dominate the wind-driven surface circulation in each hemisphere.
• The major gyres in the Northern Hemisphere rotate clockwise, while in the Southern Hemisphere they rotate counterclockwise.

4

5

6
Wind-driven transport and resulting surface currents in an ocean bounded by land to the east and westCurrents form large oceanic gyres that rotate clockwise in the north and counterclockwise in the south

7
Ocean Currents
• In the North Pacific the surface circulation is dominated by a clockwise rotating gyre formed by:– a. the North Equatorial Current,– b. the Kuroshio Current,– c. the North Pacific Current, and– d. the California Current.
• This gyre is driven by the northeast trade winds and the westerlies.

8

9
Ocean Currents- Pacific
• Further north, in the North Pacific, there is a smaller counterclockwise rotating gyre formed by:– a. the North Pacific Current,– b. the Alaska Current, and– c. the Oyashio Current.
• There is very little exchange of water between the Arctic Ocean and the North Pacific through the Bering Strait.

10

11
Ocean Currents- Pacific
• In the South Pacific, the surface circulation is dominated by a counterclockwise-rotating gyre formed by:– a. the South Equatorial Current,
– b. the East Australia Current,
– c. the northern edge of the West Wind Drift, and
– d. the Peru Current.
• This gyre is derived by the southeast trade winds and the westerlies.

12

13
Ocean Currents- Atlantic
• In the North Atlantic, there is a similar clockwise rotating gyre formed by:– a. the North Equatorial Current,– b. the Gulf Stream,– c. the North Atlantic Current, and– d. the Canary Current.

14

15
Ocean Currents- Atlantic
• In the South Atlantic, the counterclockwise rotating gyre is formed by:– a. the South Equatorial Current,– b. the Brazil Current,– c. the northern edge of the West Wind
Drift, and– d. the Benguela Current.
16
17
Ocean Currents- Indian• Because the Indian Ocean is primarily a Southern
Hemisphere ocean, its surface circulation is dominated by a counterclockwise rotating gyre formed by:– a. the South Equatorial Current,– b. the Agulhas Current,– c. the northern edge of the West Wind
Drift, and– d. the West Australia Current.
• The waters north of the equator in the Indian Ocean move to the east in the summer and to the west in the winter with the seasonal changes in monsoon winds.

18

19
Ocean Currents- Polar
• Without any continents to block its flow, the West Wind Drift is the only continuous current flowing around the globe. It moves from west to east around Antarctica.
• Flow in the Arctic Ocean is dominated by a large clockwise gyre. This gyre is not centered on the North Pole. It is displaced toward the Canadian Basin
• Water flows out of the Arctic Ocean on either side of Greenland into the North Atlantic.

20

21

22
Eddies
• Currents do not generally flow in smooth curves or straight lines. Current paths will meander and sometimes close on themselves to form eddies.

23
Figure 8.7

24
Satellite image of warm and cold eddies spinning of the Gulf Stream

25
Satellite view of solar reflection of off eddies in the Mediterranean

26
Geostrophic Flow

27
Sargasso Sea

28
Patterns of global circulation
• Circulation patterns have changed with time in response to changing configurations of continents, climate patterns, and atmospheric circulation.
• Studies of fossil organisms in marine sediments show that the temperature of the North Atlantic Ocean has varied during glacial and interglacial periods.
• These changes have been related to Milankovitch cycles.

29
Milankovitch cycles
• The position and orientation of Earth with respect to the sun change in a predictable fashion. This changes the distribution and intensity of solar radiation reaching the surface of Earth that influences climate and ocean circulation
• These cyclical changes are known as Milankovitch cycles, named after a Serbian mathematician who studied them

30
Milankovitch cycles
• The Milankovitch cycles are driven by variations that include:– a. changes in the shape of Earth’s orbit from
elliptical to more circular with a period of about 100,000 years,
– b. changes in the tilt of Earth’s axis of rotation from 22° to 24.5° with a period of 41,000 years
– c. the precession, or circular revolution, of Earth’s axis of rotation with a period of
about 23,000 years.• There seems to be a time lag between the
occurrence of minimum levels of solar radiation and minimum water temperatures.

31
Milankovitch Cycle

32
Milankovitch Cycle

33
Milankovitch Cycle

34
Recent Climate Change
• The recent history of climate changes and water temperature fluctuations includes:– a. minimum incoming solar radiation values about
23,000 years ago,– b. maximum land ice and minimum water
temperatures about 17,000 years ago,– c. a return to high solar radiation values about
12,000 years ago with a rapid warming of the water, – d. the appearance of a mini-ice age, called the
Younger Dryas event, about 11,000 years ago in the Northern Hemisphere that lasted about 700 years.

35
Measuring Currents
• Currents can be measured using either stationary instruments or instruments designed to float and move along with the current.
• Moving water at any depth can be monitored using specially designed buoys or floats whose density can be changed to keep the instrument at a specific depth. Data from the instrument can then be relayed to a ship.
• Buoys can also be instrumented to measure other physical properties of the water such as temperature.

36

37

38

39
El Niño • The prevailing southeast trade winds that create the
nearly permanent zone of divergence and upwelling along the west coast of South America occasionally fail and the upwelling ceases.
• This situation is called the El Niño and is characterized by abnormally high sea surface temperatures in the eastern Pacific.
• The El Niño is often followed by abnormally cold periods called La Niña that can also strongly affect atmospheric circulation.

40
El Niño• Along the western coast of South America off Ecuador
and Peru, the southeast trade winds drive water away from the land, creating a nearly constant region of divergence with upwelling water rich in nutrients.
• These cold waters are extremely productive with dense populations of plankton that support a large and valuable food chain.
• Periodically, roughly every three to eight years, the trade winds will break down and the divergence will stop.

41
a)Normal conditions January 1997
b) El Niño conditions November 1997
c) End of El Niño and the beginning of
a normal cycle in March 1998

42
Changes in sea surface temperatures from normal off
the coast of Peru Higher values indicate an El Niño

43
El Niño’s effects: (1) Huge areas of warm water drift east. (2) Storms then follow, drenching California and more of South America’s west coast. (3) The jet stream sometimes splits in two, leaving the Pacific Northwest dry, with mild temperatures, and the Northeast warm.

44
Could El Niño be causing more frequent hurricanes and
other severe storms? Yes, say some researchers
Some scientists even link the recent onslaught of El Niños to the specter of global warming. In the last 20 years, the world has experienced five El Niños—well above the historical norm of one every four to seven years. Might the greenhouse effect be responsible?El Niño acts as a kind of distributor of global warming. When carbon dioxide in the atmosphere absorbs radiation from space, Graham’s global warming theory goes, it transfers this extra energy to the oceans in the form of heat. As the equatorial Pacific warms, the extra energy accelerates the “hydrologic cycle” of convection and precipitation—and speeds up the El Niño rhythm by throwing more heat and moisture into the atmosphere. El Niño, in turn, spreads that heat virtually across the globe, upsetting weather patterns in ways ranging from mildly amusing (January sellouts of Bermuda shorts in the Northeast) to devastating (African droughts and famine).
45
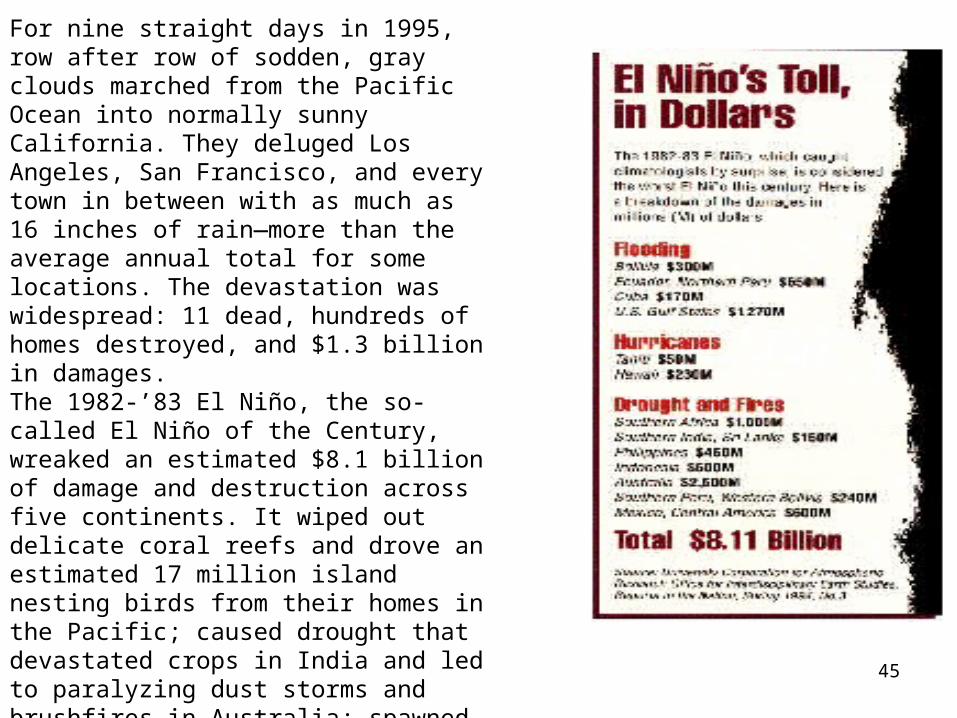
For nine straight days in 1995, row after row of sodden, gray clouds marched from the Pacific Ocean into normally sunny California. They deluged Los Angeles, San Francisco, and every town in between with as much as 16 inches of rain—more than the average annual total for some locations. The devastation was widespread: 11 dead, hundreds of homes destroyed, and $1.3 billion in damages.The 1982-’83 El Niño, the so-called El Niño of the Century, wreaked an estimated $8.1 billion of damage and destruction across five continents. It wiped out delicate coral reefs and drove an estimated 17 million island nesting birds from their homes in the Pacific; caused drought that devastated crops in India and led to paralyzing dust storms and brushfires in Australia; spawned a rash of cyclones that left 25,000 Tahitians homeless; and dumped an incredible 100 inches of rain in six months in some areas of Ecuador, creating inland lakes where previously there had been desert.
46
La Niña
• Colder years often follow these periods of abnormally warm temperatures.
• These cold periods have been called La Niña, or “the girl.”
• The La Niña will cause a strengthening of the trade winds with a decrease in precipitation on the eastern side of the basin and a corresponding increase on the western side.