occurrence of manganese in drinking water and manganese control
DESCRIPTION
Occurrence of Manganese in Drinking Water and Manganese Control reference bookTRANSCRIPT
7/21/2019 Occurrence of Manganese in Drinking Water and Manganese Control
http://slidepdf.com/reader/full/occurrence-of-manganese-in-drinking-water-and-manganese-control 1/463
Occurrence of Manganese
in Drinking Waterand Manganese Control
Subject Area:High-Quality Water

7/21/2019 Occurrence of Manganese in Drinking Water and Manganese Control
http://slidepdf.com/reader/full/occurrence-of-manganese-in-drinking-water-and-manganese-control 2/463
7/21/2019 Occurrence of Manganese in Drinking Water and Manganese Control
http://slidepdf.com/reader/full/occurrence-of-manganese-in-drinking-water-and-manganese-control 3/463
Occurrence of Manganese
in Drinking Water
and Manganese Control
©2006 AwwaRF. All Rights Reserved.

7/21/2019 Occurrence of Manganese in Drinking Water and Manganese Control
http://slidepdf.com/reader/full/occurrence-of-manganese-in-drinking-water-and-manganese-control 4/463
About the Awwa Research Foundation
The Awwa Research Foundation (AwwaRF) is a member-supported, international, nonprofit organizationthat sponsors research to enable water utilities, public health agencies, and other professionals to providesafe and affordable drinking water to consumers.
The Foundation’s mission is to advance the science of water to improve the quality of life. To achievethis mission, the Foundation sponsors studies on all aspects of drinking water, including supply andresources, treatment, monitoring and analysis, distribution, management, and health effects. Fundingfor research is provided primarily by subscription payments from approximately 1,000 utilities, consultingfirms, and manufacturers in North America and abroad. Additional funding comes from collaborativepartnerships with other national and international organizations, allowing for resources to be leveraged,expertise to be shared, and broad-based knowledge to be developed and disseminated. Governmentfunding serves as a third source of research dollars.
From its headquarters in Denver, Colorado, the Foundation’s staff directs and supports the efforts ofmore than 800 volunteers who serve on the board of trustees and various committees. These volunteersrepresent many facets of the water industry, and contribute their expertise to select and monitor researchstudies that benefit the entire drinking water community.
The results of research are disseminated through a number of channels, including reports, the Web site,conferences, and periodicals.
For subscribers, the Foundation serves as a cooperative program in which water suppliers unite to pooltheir resources. By applying Foundation research findings, these water suppliers can save substantialcosts and stay on the leading edge of drinking water science and technology. Since its inception, AwwaRFhas supplied the water community with more than $300 million in applied research.
More information about the Foundation and how to become a subscriber is available on the Webat www.awwarf.org.
©2006 AwwaRF. All Rights Reserved.
7/21/2019 Occurrence of Manganese in Drinking Water and Manganese Control
http://slidepdf.com/reader/full/occurrence-of-manganese-in-drinking-water-and-manganese-control 5/463
Occurrence of Manganese
in Drinking Water
and Manganese Control
Prepared by:Paul M. Kohl
Philadelphia Water Department, Philadelphia, PA 19107
and
Steven J. Medlar Camp Dresser & McKee Inc. (CDM), Philadelphia, PA 19102
Jointly sponsored by:Awwa Research Foundation6666 West Quincy Avenue, Denver, CO 80235-3098
and
U.S. Environmental Protection AgencyWashington D.C.
Published by:
©2006 AwwaRF. All Rights Reserved.

7/21/2019 Occurrence of Manganese in Drinking Water and Manganese Control
http://slidepdf.com/reader/full/occurrence-of-manganese-in-drinking-water-and-manganese-control 6/463
DISCLAIMER
This study was jointly funded by the Awwa Research Foundation (AwwaRF) and the U.S. Environmental Protection
Agency (USEPA) under Cooperative Agreement No. R-82940901. AwwaRF and USEPA assume no responsibility
for the content of the research study reported in this publication or for the opinions or statements of fact expressed
in the report. The mention of trade names for commercial products does not represent or imply the approval or
endorsement of AwwaRF or USEPA. This report is presented solely for informational purposes.
Copyright © 2006
by Awwa Research Foundation
All Rights Reserved
Printed in the U.S.A.
©2006 AwwaRF. All Rights Reserved.
7/21/2019 Occurrence of Manganese in Drinking Water and Manganese Control
http://slidepdf.com/reader/full/occurrence-of-manganese-in-drinking-water-and-manganese-control 7/463
v
CONTENTS
TABLES ................................................................................................................................ ix
FIGURES............................................................................................................................... xi
FOREWORD......................................................................................................................... xv
ACKNOWLEDGMENTS ..................................................................................................... xvii
EXECUTIVE SUMMARY ................................................................................................... xix
CHAPTER 1 INTRODUCTION........................................................................................... 1Overview of the Project ............................................................................................. 1
Research Tasks............................................................................................... 1Highlights of This Report’s Organization...................................................... 2
Brief Background on Manganese in Drinking Water ................................................ 3Overview of Manganese Chemistry and Treatment ...................................... 3
The Problem with Manganese ....................................................................... 4Regulatory Considerations for Mn................................................................. 4Overview and Purpose of Research Tasks................................................................. 5
Initial Surveys ................................................................................................ 5Detailed Surveys ............................................................................................ 6Distribution System Occurrence Sampling.................................................... 7Case Study I: Pilot-Scale Research................................................................ 8Case Study II: Full-Scale WTP Research ...................................................... 8Cost Analysis ................................................................................................. 9
CHAPTER 2 LITERATURE REVIEW ................................................................................ 11Introduction................................................................................................................ 11The Problem: Reduction in Drinking Water Quality................................................. 12Regulatory Background ............................................................................................. 13
Regulation of Mn in Drinking Water............................................................. 13 Non-Drinking-Water Regulation of Mn ........................................................ 14
Health Effects............................................................................................................. 16Absorption and Pharmacokinetics ................................................................. 16Acute, Sub-Chronic, and Chronic Toxicity ................................................... 17Central Nervous System Toxicity.................................................................. 18Epidemiological Studies ................................................................................ 19Essentiality..................................................................................................... 19
Chemistry................................................................................................................... 20Biochemical Phenomena................................................................................ 23Speciation....................................................................................................... 24
Analytical Techniques ............................................................................................... 26Treatment and Removal Technology......................................................................... 28
In Situ Treatment ........................................................................................... 29Biological Treatment ..................................................................................... 31Chemical Oxidation Followed by Physical Separation ................................. 33Oxide-Coated Media...................................................................................... 40
©2006 AwwaRF. All Rights Reserved.
7/21/2019 Occurrence of Manganese in Drinking Water and Manganese Control
http://slidepdf.com/reader/full/occurrence-of-manganese-in-drinking-water-and-manganese-control 8/463
vi
Physical Separation........................................................................................ 43
Ion Exchange ................................................................................................. 46
Incidental Precipitation .................................................................................. 46
Sequestering Agents....................................................................................... 46Miscellaneous Issues Regarding Treatment Technologies ............................ 47
CHAPTER 3 METHODS AND MATERIALS .................................................................... 49
Literature Review....................................................................................................... 49Initial Surveys ............................................................................................................ 49
Identifying Potential Survey Utilities ............................................................ 49
Initial Survey Instrument ............................................................................... 51
Miscellaneous Considerations ....................................................................... 51
Analysis of Initial Survey Data...................................................................... 52Detailed Surveys ........................................................................................................ 52
Selecting Utilities for Detailed Surveys......................................................... 52
Detailed Survey Instrument ........................................................................... 52Distribution System Occurrence Sampling................................................................ 53
Purpose of Sampling...................................................................................... 53
Selection of Utilities ...................................................................................... 53Sampling Methodology.................................................................................. 54
General WQ Parameters Sampling and Analysis .......................................... 55
Metals Sample Collection.............................................................................. 55Metals Analysis.............................................................................................. 57
Comments on Handling of Non-Detect (ND) Data Values (aka the Playbook) 58
Case Study I: Pilot-Scale Research for Manganese Control...................................... 59
Purpose of Pilot Testing................................................................................. 59Case Study Objectives ................................................................................... 59
Pilot Plant Description and Standard Operating Procedures ......................... 60Case Study II: Comparison of Anthracite and GAC filters for Manganese Removal
in a Full-Scale WTP...................................................................................... 62Cost Model................................................................................................................. 63
Consumer Benefit .......................................................................................... 63
Utility Costs ................................................................................................... 65
Basic Assumptions......................................................................................... 65References for the Cost Model ...................................................................... 66
CHAPTER 4 RESULTS AND DISCUSSION...................................................................... 67Initial Surveys ............................................................................................................ 67
Demographics of Utilities Participating in Initial Survey.............................. 68
Self-Reported Mn Concentrations ................................................................. 71
Utility Responses to Other Questions in Initial Surveys ............................... 75Detailed Surveys ........................................................................................................ 77
Demographics of Utilities Participating in Detailed Surveys ........................ 78Self-Reported Water Quality and Mn Concentration Data............................ 80
Customer Complaint Tracking and Assessment............................................ 92
Seasonal Distribution System Occurrence Sampling ................................................ 93Overall Findings............................................................................................. 93
Introduction.................................................................................................... 94
©2006 AwwaRF. All Rights Reserved.
7/21/2019 Occurrence of Manganese in Drinking Water and Manganese Control
http://slidepdf.com/reader/full/occurrence-of-manganese-in-drinking-water-and-manganese-control 9/463
vii
Distribution System Seasonal Sampling Results ........................................... 95Distribution System Seasonal Sampling Correlation Analysis...................... 106
Case Study I: Pilot-Scale Research for Manganese Control...................................... 118Background.................................................................................................... 118IOCME Mn Control....................................................................................... 119The Ability of an OCM Filter (IOCME) to Control Mn after Loss of Chlorine 123Mn Migration in an OCM Filter Media ......................................................... 135Using Percent Removal to Analyze Case Study I Data ................................. 136Control of Mn with pH .................................................................................. 136Control of Oxidized Mn (via Ozone) with pH............................................... 137EH as Predictive Tool for Reduction of Mn ................................................... 138
Case Study II: Full-Scale WTP Research on Manganese Removal .......................... 138Cost Model................................................................................................................. 142
Using and Interpreting the Cost Tables ......................................................... 142Significance of Benefit Relative to Manganese Concentration ..................... 143
CHAPTER 5 CONCLUSIONS ............................................................................................. 151Introduction................................................................................................................ 151
Initial Survey.............................................................................................................. 151Detailed Survey.......................................................................................................... 152Seasonal Occurrence Sampling.................................................................................. 153Case Study I ............................................................................................................... 154Case Study II.............................................................................................................. 154Cost Model................................................................................................................. 155
CHAPTER 6 RECOMMENDATIONS TO UTILITIES ...................................................... 157Operational................................................................................................................. 157
Treat Mn at the Source................................................................................... 157Induced Oxide Coated Media Effect.............................................................. 158
Ozone ............................................................................................................. 158Mn Effluent Water Quality Goal ............................................................................... 159
Water Quality Goal ........................................................................................ 159Friendly Quote ............................................................................................... 159
Mn Testing................................................................................................................. 159MDL or RL .................................................................................................... 160Wet Chemical Testing.................................................................................... 160Mn Filtering ................................................................................................... 160
Additional Research................................................................................................... 160Conceptualization of the Utilities Water Distribution System .................................. 160
REFERENCES ...................................................................................................................... 163
ABBREVIATIONS ............................................................................................................... 179
APPENDICES A–G (ON CD-ROM PACKAGED WITH THE PRINTED REPORT)
APPENDIX A: INITIAL AND DETAILED SURVEY INSTRUMENTS.......................... 185
©2006 AwwaRF. All Rights Reserved.

7/21/2019 Occurrence of Manganese in Drinking Water and Manganese Control
http://slidepdf.com/reader/full/occurrence-of-manganese-in-drinking-water-and-manganese-control 10/463
viii
APPENDIX B: PROTOCOL FOR SEASONAL DISTRIBUTION SYSTEM TESTING,CASE STUDY I, AND CASE STUDY II................................................................. 195
APPENDIX C: DETAILED SURVEY DATA .................................................................... 221
APPENDIX D: DISTRIBUTION SYSTEM SEASONAL TESTING DATA .................... 227
APPENDIX E: CASE STUDY I DATA .............................................................................. 391
APPENDIX F: CASE STUDY II DATA ............................................................................. 415
APPENDIX G: COST BENEFIT ANALYSIS MODELS................................................... 425
©2006 AwwaRF. All Rights Reserved.
7/21/2019 Occurrence of Manganese in Drinking Water and Manganese Control
http://slidepdf.com/reader/full/occurrence-of-manganese-in-drinking-water-and-manganese-control 11/463
ix
TABLES
2.1 Drinking water limits for manganese (mg/L) ............................................................ 15
2.2 Dietary reference intakes: intakes recommended for individuals.............................. 20
2.3 Manganese compounds of common valence states ................................................... 22
2.4 Analytical methods for determining manganese in water and environmental samples 27
2.5 Theoretical reaction stoichiometry for manganese (II).............................................. 33
3.1 Items shipped to each utility participating in the seasonal sampling study ............... 55
3.2 Reference half-cell potential ...................................................................................... 62
4.1 Facilities providing Mn concentration data in initial surveys.................................... 71
4.2 Maximum source water Mn concentrations reported in initial survey ...................... 73
4.3 Mn concentrations in distribution system water, from initial surveys....................... 74
4.4 Facilities providing Mn concentration data in detailed surveys ................................ 81
4.5 Analysis of source and finished water Mn concentration data from detailed surveys 87
4.6 U.S. region, source water type, and Mn treatment type for utilities participating in distribution system occurrence sampling for Mn................. 94
4.7 Record of utility participation in distribution system Mn occurrence sampling ....... 95
4.8 Results of correlation plots of Mn with other water quality parameters.................... 109
4.9 Number of occurrences of “near” Mn concentrations being more than “entry”........ 115
4.10 Condition of flow at sample tap for entry and near sample taps ............................... 116
4.11 Mass capture rate and % removal of Mn for IOCME process once chlorine isterminated ..................................................................................................... 125
4.12 Fe loading onto filters ................................................................................................ 135
4.13 Avg. percent Mn removal by GAC and dual media filters depending uponapplied chlorine............................................................................................. 136
4.14 Three no-chlorine filter samples that controlled chlorine.......................................... 137
4.15 Cost table for CGS treatment..................................................................................... 145
4.16 Cost table for direct filtration treatment..................................................................... 146
©2006 AwwaRF. All Rights Reserved.

7/21/2019 Occurrence of Manganese in Drinking Water and Manganese Control
http://slidepdf.com/reader/full/occurrence-of-manganese-in-drinking-water-and-manganese-control 12/463
x
4.17 Cost table for manganese greensand treatment.......................................................... 147
4.18 Cost table for membrane treatment............................................................................ 148
©2006 AwwaRF. All Rights Reserved.
7/21/2019 Occurrence of Manganese in Drinking Water and Manganese Control
http://slidepdf.com/reader/full/occurrence-of-manganese-in-drinking-water-and-manganese-control 13/463
xi
FIGURES
4.1 Geographic distribution of U.S. utilities participating in initial survey (n = 217)....... 68
4.2 Types of source water treated by facilities in initial survey (n = 242) ...................... 69
4.3 Facilities in initial surveys grouped by treatment type (n = 242) .............................. 70
4.4 Type of primary coagulant used to treat water (n = 242) .......................................... 71
4.5 Box-and-whiskers plot of average source water Mn concentration data frominitial surveys, showing mean, median, and percentile ranges ..................... 72
4.6 Box-and-whiskers plot of average finished water Mn data from initial surveys....... 73
4.7 Primary disinfectant at initial survey facilities (n = 242) .......................................... 75
4.8 Facilities grouped by oxidant and oxidant combination within WTP ....................... 76
4.9 Geographic distribution of detailed surveys in U.S. .................................................. 78
4.10 Types of source water treated by facilities in detailed survey (n = 52) ..................... 79
4.11 Facilities in detailed surveys grouped by treatment type (n = 52)............................. 79
4.12 Type of primary coagulant used to treat water in detailed surveys (n = 52) ............. 80
4.13 Correlation analysis of finished water Mn concentrations to specific waterquality parameters, from detailed surveys .................................................... 83
4.14 Results of distribution system seasonal Mn occurrence sampling forUtility 2 (data presented as mean and ± σ of triplicate samples)................... 98
4.15 Results of distribution system seasonal Mn occurrence sampling forUtility 9 (data presented as mean and ± σ of triplicate samples).................. 99
4.16 Results of distribution system seasonal Mn occurrence sampling forUtility 22 (data presented as mean and ± σ of triplicate samples)................ 100
4.17 Results of distribution system seasonal Mn occurrence sampling forUtility 269 (data presented as mean and ± σ of triplicate samples).............. 101
4.18 Individual water quality parameters associated with Mn concentrations fromdistribution system sampling ......................................................................... 103
4.19 Individual water quality parameters associated with Mn concentrations fromdistribution system sampling (continued)...................................................... 104
©2006 AwwaRF. All Rights Reserved.
7/21/2019 Occurrence of Manganese in Drinking Water and Manganese Control
http://slidepdf.com/reader/full/occurrence-of-manganese-in-drinking-water-and-manganese-control 14/463
xii
4.20 Individual water quality parameters associated with Mn concentrations fromdistribution system sampling (continued)...................................................... 105
4.21 Seasonal distribution system testing: correlation of total Mn to various water quality parameters collected at the entry, near, mid, and far points of the distributionsystem ............................................................................................................ 107
4.22 Total Mn versus apparent color. The solid regression line is for all data, thesecond, dashed regression omits the single data point at 25 color units and0.131 mg/L Mn. ............................................................................................ 110
4.23 Particulate Mn as a function of apparent color. The second, dashed regressionline omits the single data point at 25 color units and 0.131 mg/L Mn. ........ 110
4.24 Mn that passes through a 0.22-µm filter as a function of Mn that passes through a30-kDa filter.................................................................................................. 111
4.25 Seasonal distribution system testing: correlation of manganese concentration (total
and dissolved) at the far point to the entry point (total) of the distributionsystem. .......................................................................................................... 112
4.26 Seasonal distribution system testing: correlation of manganese concentration (totaland dissolved) at the far point to the entry point (total) of the distributionsystem. ........................................................................................................... 113
4.27 Seasonal distribution system testing: Dissolved manganese at the distributionsystem far point as a function of the entry point............................................ 114
4.28 Seasonal distribution system testing: Dissolved manganese at the distributionsystem far point as a function of the entry point........................................... 114
4.29 Seasonal distribution system testing: correlation of total and dissolved manganeseat the distribution system near point to the entry poiny, and 1:1 linereference line................................................................................................. 116
4.30 Seasonal distribution system testing: correlation of total and dissolved manganeseat the distribution system near point to the entry point, and 1:1 linereference line.................................................................................................. 117
4.31 Seasonal distribution system testing: correlation of particulate manganese at thedistribution system near point to the entry point, and 1:1 line reference line. 117
4.32 Pilot plant filter effluent Mn concentration as a function of temperature:
Coagulation pH 6.5 for filtration pH of 6.5, 7.0, 7.5, 8.0, and 8.5 (±0.25)with a free chlorine residual of 0.4 mg/L or greater ..................................... 120
©2006 AwwaRF. All Rights Reserved.
7/21/2019 Occurrence of Manganese in Drinking Water and Manganese Control
http://slidepdf.com/reader/full/occurrence-of-manganese-in-drinking-water-and-manganese-control 15/463
xiii
4.33 Pilot plant filter effluent Mn concentration as a function of temperature:
Coagulation pH 6.5, filtration pH 6.5 ( 0.25) with a free chlorineresidual of 0.4 mg/L or greater. ..................................................................... 121
4.34 Pilot plant filter effluent Mn concentration as a function of temperature:
Coagulation pH 6.5, filtration pH 7.0 ( 0.25) with a free chlorine
residual of 0.4 mg/L or greater. .................................................................... 121
4.35 Pilot plant filter effluent Mn concentration as a function of temperature:
Coagulation pH 6.5, filtration pH 7.5 ( 0.25) with a free chlorineresidual of 0.4 mg/L or greater ...................................................................... 122
4.36 Pilot plant filter effluent Mn concentration as a function of free chlorine
concentration: Coagulation pH 6.5, filtration pH 6.5 ( 0.25) fortemperature greater than 8°C. ........................................................................ 123
4.37 Belmont pilot plant; Mn and EH as a function of time. Effect of chlorine loss
and pH on Mn control. .................................................................................. 127
4.38 Belmont pilot plant; Mn and EH as a function of time. Effect of chlorine lossand pH on Mn control. .................................................................................. 128
4.39 Baxter pilot plant; Mn and EH as a function of time. Effect of chlorine lossand pH on Mn control. .................................................................................. 129
4.40 Belmont pilot plant; Mn and EH as a function of time. Effect of chlorine lossand pH on Mn control. .................................................................................. 130
4.41 Belmont pilot plant; Mn and EH as a function of time. Effect of chlorine loss
and pH on Mn control. .................................................................................. 131
4.42 Baxter pilot plant; Mn and EH as a function of time. Effect of chlorine lossand pH on Mn control. .................................................................................. 132
4.43 Belmont pilot plant; Mn and EH as a function of time. Effect of chlorine lossand pH on Mn control ................................................................................... 133
4.44 September 2004 full-scale Case Study II sample event............................................. 140
4.45 November 2004 full-scale Case Study II sample event ............................................. 141
4.46 December 2004 full-scale Case Study II sample event ............................................. 141
©2006 AwwaRF. All Rights Reserved.

7/21/2019 Occurrence of Manganese in Drinking Water and Manganese Control
http://slidepdf.com/reader/full/occurrence-of-manganese-in-drinking-water-and-manganese-control 16/463
xiv
©2006 AwwaRF. All Rights Reserved.
7/21/2019 Occurrence of Manganese in Drinking Water and Manganese Control
http://slidepdf.com/reader/full/occurrence-of-manganese-in-drinking-water-and-manganese-control 17/463
xv
FOREWORD
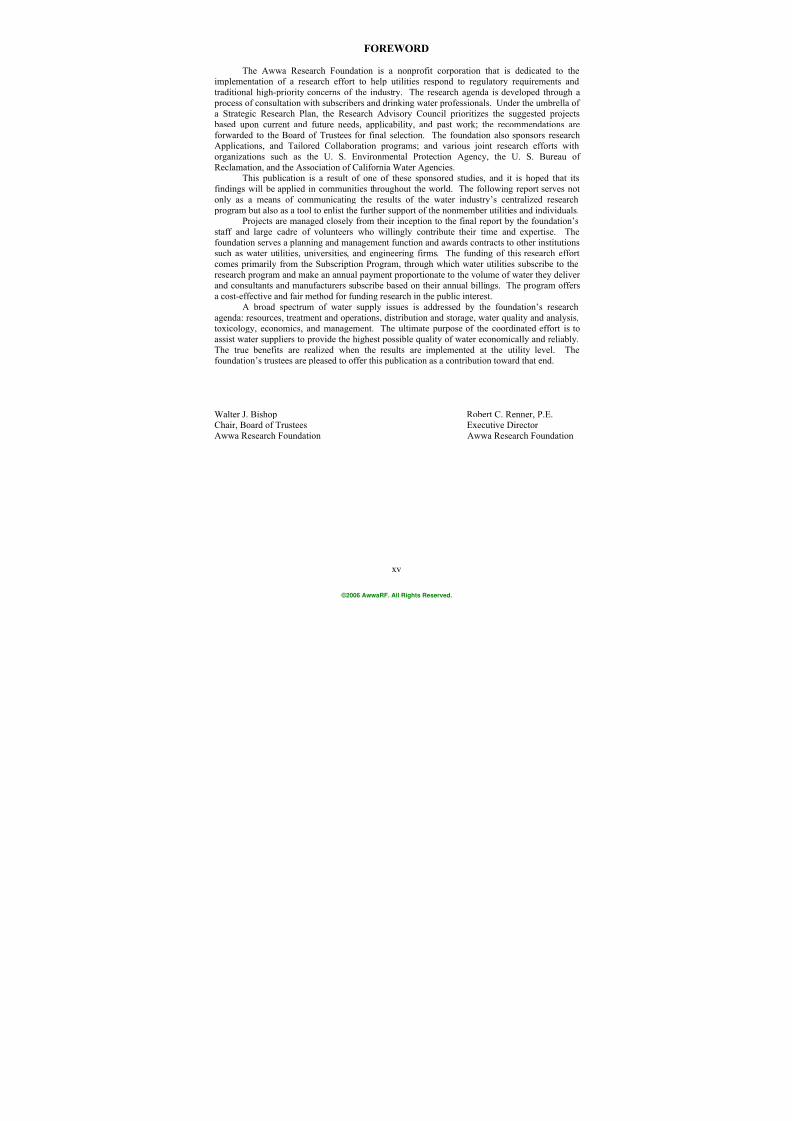
The Awwa Research Foundation is a nonprofit corporation that is dedicated to theimplementation of a research effort to help utilities respond to regulatory requirements andtraditional high-priority concerns of the industry. The research agenda is developed through a process of consultation with subscribers and drinking water professionals. Under the umbrella ofa Strategic Research Plan, the Research Advisory Council prioritizes the suggested projects based upon current and future needs, applicability, and past work; the recommendations areforwarded to the Board of Trustees for final selection. The foundation also sponsors researchApplications, and Tailored Collaboration programs; and various joint research efforts withorganizations such as the U. S. Environmental Protection Agency, the U. S. Bureau ofReclamation, and the Association of California Water Agencies.
This publication is a result of one of these sponsored studies, and it is hoped that itsfindings will be applied in communities throughout the world. The following report serves notonly as a means of communicating the results of the water industry’s centralized research program but also as a tool to enlist the further support of the nonmember utilities and individuals.
Projects are managed closely from their inception to the final report by the foundation’sstaff and large cadre of volunteers who willingly contribute their time and expertise. Thefoundation serves a planning and management function and awards contracts to other institutionssuch as water utilities, universities, and engineering firms. The funding of this research effortcomes primarily from the Subscription Program, through which water utilities subscribe to theresearch program and make an annual payment proportionate to the volume of water they deliverand consultants and manufacturers subscribe based on their annual billings. The program offersa cost-effective and fair method for funding research in the public interest.
A broad spectrum of water supply issues is addressed by the foundation’s researchagenda: resources, treatment and operations, distribution and storage, water quality and analysis,toxicology, economics, and management. The ultimate purpose of the coordinated effort is toassist water suppliers to provide the highest possible quality of water economically and reliably.The true benefits are realized when the results are implemented at the utility level. Thefoundation’s trustees are pleased to offer this publication as a contribution toward that end.
Walter J. Bishop Robert C. Renner, P.E.Chair, Board of Trustees Executive DirectorAwwa Research Foundation Awwa Research Foundation
©2006 AwwaRF. All Rights Reserved.

7/21/2019 Occurrence of Manganese in Drinking Water and Manganese Control
http://slidepdf.com/reader/full/occurrence-of-manganese-in-drinking-water-and-manganese-control 18/463
xvi
©2006 AwwaRF. All Rights Reserved.

7/21/2019 Occurrence of Manganese in Drinking Water and Manganese Control
http://slidepdf.com/reader/full/occurrence-of-manganese-in-drinking-water-and-manganese-control 19/463
xvii
ACKNOWLEDGMENTS
The authors of this report recognize and appreciate the cooperation and participation ofthe organizations and utilities that were involved in this project:
All 242 utilities that participated in this studyPhiladelphia Water DepartmentWest Virginia American Water Works, Sandra Johnson
The 242 utilities are not named in this report as part of the participation agreementestablished at the initiation of the project. When this project started, security concerns were prevalent and it was thought that utilities would be reluctant to participate. Therefore, it wasagreed that process information and water quality data would not be associated with waterutility’s name and location, therefore a numbering system was used instead. To all those utilitiesthat participated, the principle investigators (PIs) hereby acknowledge you, in anonymity, withheart felt gratitude.
The help and advice provided by AwwaRF project manager Linda Reekie and the ProjectAdvisory Committee (PAC) – including David Chang, Golden State Water Company, ChristyMuhlen, U.S. Environmental Protection Agency, Office of Research and Development, andSteve Schindler, New York City Department of Environmental Protection – are trulyappreciated.
The authors would like to thank our Technical Advisory Committee members, DavidDixon (Univ. of Melbourne), Phillippe Daniel (CDM), Chris Schultz (CDM), and Philip Singer(Univ. of North Carolina).
The authors would lastly like to thank those who helped conduct interviews, run the pilot plants, analyze samples, interpret data, write sections of the report, keep us on schedule, and signthe contracts. Thanks to Amit Sen (CDM) and Steven Pugsley (PWD); John Consolvo, NicoleCharlton, Matthew Smith, Doug Crawshaw, Shawn Garner, Philip Godorov, Gary Burlingame,and Juliana Appiah (PWD); Nick Maxin, Larry Smith, Theodore Schlette, Mack Rugg, MilesEhrlich, and Christina Davis (CDM); David Hambly (Anthratec Western Inc.), and Fred Pontius(Pontius Consultants).
©2006 AwwaRF. All Rights Reserved.

7/21/2019 Occurrence of Manganese in Drinking Water and Manganese Control
http://slidepdf.com/reader/full/occurrence-of-manganese-in-drinking-water-and-manganese-control 20/463
xviii
©2006 AwwaRF. All Rights Reserved.
7/21/2019 Occurrence of Manganese in Drinking Water and Manganese Control
http://slidepdf.com/reader/full/occurrence-of-manganese-in-drinking-water-and-manganese-control 21/463
xix
EXECUTIVE SUMMARY
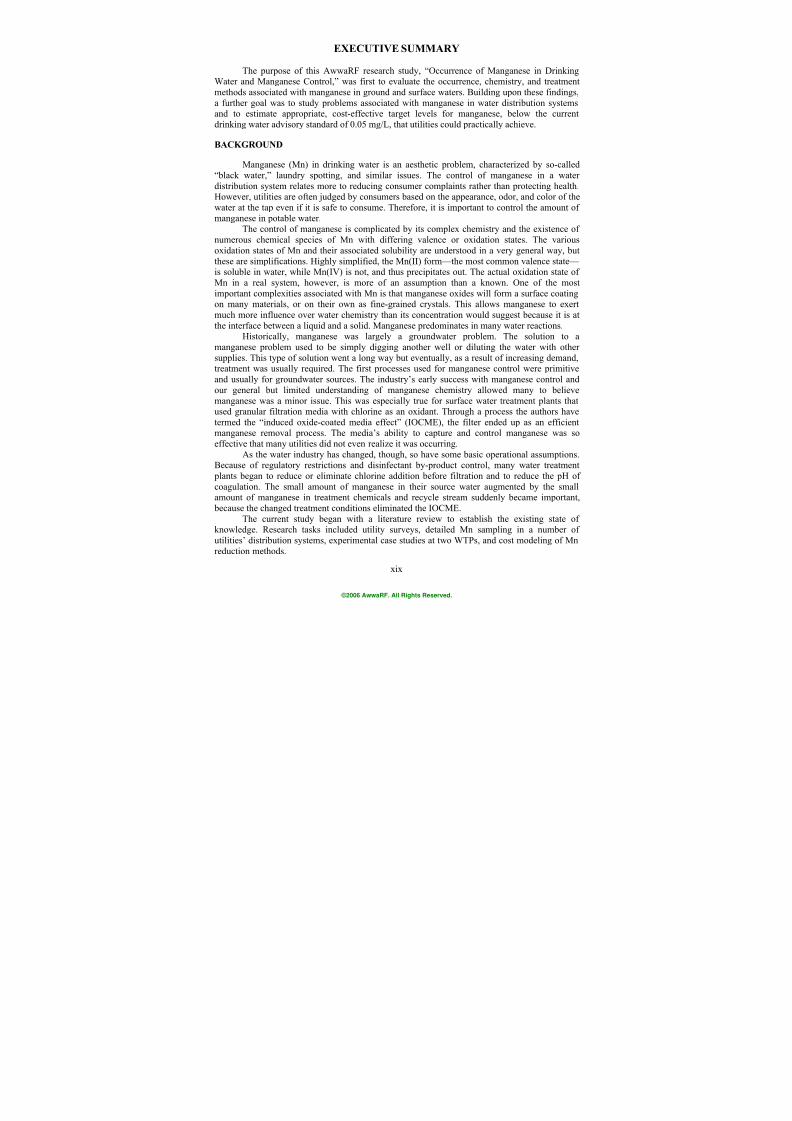
The purpose of this AwwaRF research study, “Occurrence of Manganese in DrinkingWater and Manganese Control,” was first to evaluate the occurrence, chemistry, and treatmentmethods associated with manganese in ground and surface waters. Building upon these findings,a further goal was to study problems associated with manganese in water distribution systemsand to estimate appropriate, cost-effective target levels for manganese, below the currentdrinking water advisory standard of 0.05 mg/L, that utilities could practically achieve.
BACKGROUND
Manganese (Mn) in drinking water is an aesthetic problem, characterized by so-called“black water,” laundry spotting, and similar issues. The control of manganese in a waterdistribution system relates more to reducing consumer complaints rather than protecting health.However, utilities are often judged by consumers based on the appearance, odor, and color of thewater at the tap even if it is safe to consume. Therefore, it is important to control the amount ofmanganese in potable water.
The control of manganese is complicated by its complex chemistry and the existence of
numerous chemical species of Mn with differing valence or oxidation states. The variousoxidation states of Mn and their associated solubility are understood in a very general way, butthese are simplifications. Highly simplified, the Mn(II) form—the most common valence state— is soluble in water, while Mn(IV) is not, and thus precipitates out. The actual oxidation state ofMn in a real system, however, is more of an assumption than a known. One of the mostimportant complexities associated with Mn is that manganese oxides will form a surface coatingon many materials, or on their own as fine-grained crystals. This allows manganese to exertmuch more influence over water chemistry than its concentration would suggest because it is atthe interface between a liquid and a solid. Manganese predominates in many water reactions.
Historically, manganese was largely a groundwater problem. The solution to amanganese problem used to be simply digging another well or diluting the water with other
supplies. This type of solution went a long way but eventually, as a result of increasing demand,treatment was usually required. The first processes used for manganese control were primitiveand usually for groundwater sources. The industry’s early success with manganese control andour general but limited understanding of manganese chemistry allowed many to believemanganese was a minor issue. This was especially true for surface water treatment plants thatused granular filtration media with chlorine as an oxidant. Through a process the authors havetermed the “induced oxide-coated media effect” (IOCME), the filter ended up as an efficientmanganese removal process. The media’s ability to capture and control manganese was soeffective that many utilities did not even realize it was occurring.
As the water industry has changed, though, so have some basic operational assumptions.Because of regulatory restrictions and disinfectant by-product control, many water treatment
plants began to reduce or eliminate chlorine addition before filtration and to reduce the pH ofcoagulation. The small amount of manganese in their source water augmented by the smallamount of manganese in treatment chemicals and recycle stream suddenly became important, because the changed treatment conditions eliminated the IOCME.
The current study began with a literature review to establish the existing state ofknowledge. Research tasks included utility surveys, detailed Mn sampling in a number ofutilities’ distribution systems, experimental case studies at two WTPs, and cost modeling of Mnreduction methods.
©2006 AwwaRF. All Rights Reserved.
7/21/2019 Occurrence of Manganese in Drinking Water and Manganese Control
http://slidepdf.com/reader/full/occurrence-of-manganese-in-drinking-water-and-manganese-control 22/463
xx
SURVEYS
We interviewed many drinking water utilities over a wide geographic area to explore theindustry’s general understanding of manganese (i.e., issues, treatment, and occurrence). Wefound that few utilities fully understand the chemistry, treatment, and problems associated withmanganese. This is not surprising, as Mn chemistry is very complex and the understanding of therealm of chemical/biological interactions within the distribution system is an emerging issue.
The trends in water treatment—with greater emphasis on aesthetic issues—are making water professionals more and more aware of Mn.
Mn was an issue in every area we looked at, but not every utility within each area had Mnissues. There are many sources of Mn; source water, component of an added chemical or animpurity in an added chemical, resuspended or solubilized in sediment, recycled in a side stream process, or leached from oxide-coated filter media. There was also a wide range in the severity ofand response to Mn issues, with some utilities having operational alarms if Mn was greater than15 µg/L while others allowed concentrations of up to 300 µg/L (but always within the regulatorylimit for their state).
The survey was executed in such a way as to gain input from at least one utility that useseach type of Mn treatment technique that we identified. From the survey data we discerned that,
Mn-specific treatment processes work very well. Problems associated with certain treatmenttechniques are those that occur when a process was designed primarily for something else andwas forced, by necessity, to handle Mn as well. While utilities told many successful stories oftreatment for Mn, not all have been successful.
We found that even though the addition of potassium permanganate is a frequently usedtechnique to control manganese, most of the utilities that control manganese do so with chlorineand a filter media. Of interest is that many places that use ozone for disinfection and/or oxidationdo not control manganese with it; they rely on other processes to control Mn. These findingsallowed the researchers to see that simply oxidizing Mn is not the whole story of Mn treatment because both KMnO4 and O3 oxidize Mn.
One of the most counter-intuitive survey findings was that the utilities that have the most
problems dealing with manganese are not those with the highest influent Mn concentrations.Instead, it is those that have a markedly variable amount of Mn in their influent water. Thoseutilities that have high influent Mn have specific Mn treatment and it usually works well. Theones with variable or intermediate Mn loading are often not prepared to handle it and thereforeMn passes through treatment directly into the distribution system. From the analysis of reportedinfluent Mn concentrations, the researchers found that a ratio of maximum Mn to average Mnconcentration greater than 10:1 resulted in obvious Mn problems.
DISTRIBUTION SYSTEM OCCURRENCE SAMPLING
We looked at several different drinking water utilities’ distribution systems to see if the
amount of manganese in the distribution system water was related to how much Mn was intreated water at the plant effluent. The simple answer is yes they are related, the more manganeseadded the more manganese will be found in the distribution system. However, the further thedistance from the water treatment plant the less manganese is found in the water. Manganese istherefore accumulated within the distribution system. Even if only a small amount of manganeseis added to the system, it will accumulate and under the correct conditions resuspend. Thisimplies that if a water treatment plant fails to control manganese during an episode of high
©2006 AwwaRF. All Rights Reserved.
7/21/2019 Occurrence of Manganese in Drinking Water and Manganese Control
http://slidepdf.com/reader/full/occurrence-of-manganese-in-drinking-water-and-manganese-control 23/463
xxi
manganese loading, or if manganese is only moderately treated over a long period of time, it willeventually be noticed by the consumer.
Both high and low concentrations of manganese in treated water resulted in deposition ofmanganese oxides in the pipe and on pipeline surfaces. Bacteria associated with biochemical Mndeposition have been isolated in systems that have no chlorine or in which the chlorine residualdissipates before the end of the distribution system. Chemical deposition occurs when Mn(II)enters the distribution system and is oxidized to Mn(IV) by chlorine used for disinfection.Manganese deposition generally decreases with distance from the treatment plant. The progression of deposition through the distribution system is generally affected by theconcentration of Mn and the capacity of the pipeline surface to adsorb the manganese oxide. Thiscapacity depends on the average water velocity, which determines the shear force and the widthof the boundary layer within which the manganese oxide remains protected. Once the capacity ofthe pipeline is exceeded or when higher flow rates occur, manganese oxide coating will detach(until equilibrium is reached) and sediment will suspend, causing deterioration in water quality atthe tap.
Mn speciation testing was conducted via filtration with a 0.22-µm filter and 30-kiloDalton filter to separate particulate, colloidal, and truly dissolved fractions of Mn. We rarelyfound colloidal manganese in the distribution systems and when we did, it was concentrated in
the plant effluent and associated with the use of polyphosphates. Therefore the use of 0.22-µmfilter is sufficient to measure dissolved manganese in distribution systems.
CASE STUDIES
The case study work looked into the limits of the induced oxide-coated media effect(IOCME). When dissolved manganese in the water is loaded onto a granular media filter in the presence of chlorine, an oxide coating is established. This oxide coating then becomes anefficient adsorption site for other dissolved manganese and the adsorbed manganese is thenoxidized to manganese dioxide (MnO2). This process is very effective but we know little aboutit. It works so well over such a wide range of conditions that it calls little attention to itself and
sometimes goes unnoticed.Removal of manganese relies on the combination of two independent mechanisms which
are interrelated—oxidation and adsorption. The parameters that control these processes overlap.The pH of the filtered water is the most significant water quality parameter these two processesshare. The higher the pH, the more rapid the oxidation process and the greater the adsorptioncapacity of the oxide-coated media. Another water quality parameter that affects both processes, but not so obviously, is temperature—the warmer the water, the more rapid the oxidation processand, seemingly, the greater the media adsorptive capacity. A water quality parameter that seemsto be paramount in oxidation with a secondary effect on adsorption is the presence of freechlorine. Free chlorine oxidizes adsorbed manganese and converts it to MnO2, thus yieldingmore sites for future adsorption. This increases the adsorptive capacity. IOCME can occur even
when there is no free chlorine residual leaving the filter. Free chlorine must be present andavailable when manganese is adsorbed onto the media surface. This explains why granularactivated carbon (GAC) can be used as a media for IOCME in the presence of chlorine, eventhough GAC dechlorinates water.
IOCME is a self-regenerative process and, as such, requires both chlorine andmanganese. If there is no manganese in the filter influent water, there is not likely to be anavailable coating of MnO2. If there is no chlorine, then the surface chemistry changes and Mn isreleased back into the water. Therefore, intermittent use of IOCME is not recommended. MnO2
©2006 AwwaRF. All Rights Reserved.
7/21/2019 Occurrence of Manganese in Drinking Water and Manganese Control
http://slidepdf.com/reader/full/occurrence-of-manganese-in-drinking-water-and-manganese-control 24/463
xxii
is an essential catalyst for the oxidation of Mn(II). For such cases of periodic use there has beensuccess in manganese control if all manganese is converted to MnO2 prior to filtration. The filtermust then have a high enough oxidation-reduction potential (ORP) or there must be enough Ca
2+
for the manganese oxide to remain stable.Our research using ozone indicated that if enough ozone was used to produce MnO2,
simply having excess dissolved oxygen (DO) in the water was sufficient to prevent subsequentreduction, that is DO above saturation which is often the case when ozonating the water. If highlevels of manganese are present and excess ozone is used, colloidal manganese can be formed. Itis important to understand this for two reasons. This colloidal manganese is of a size that makesit hard to remove by filtration; therefore it may pass through treatment and enter into thedistributions system. Also if a utility ozonated the water and then tested for dissolved Mn using a0.22 µm filter, it may presume that oxidation of Mn was not successful, when it was. The authors believe that although the formation of colloidal Mn from ozonation is a possibility and examplesof this phenomenon exist, the amount of manganese and ozone required to produce it areunlikely to occur in most applications.
The amount of manganese present in the water is also a factor in understanding how bestto control manganese. For the most part, as long as there is some manganese and the quantity ofDBPs formed is not an issue, then IOCME works well. However, if the manganese treatment
process selected by a utility involves oxidation in bulk water, a good understanding of reactionkinetics is required; the more manganese the better, as the reactions will proceed faster and theoverall removal will be more effective. The most successful methods used to control Mninvolved the use of both an oxidant and a contact media.
COST MODELS
The main purpose of the cost model was to quantify the approximate economics ofconstructing and operating a treatment facility to produce water with a manganese concentrationless than 0.05 milligrams per liter.
Reduction of manganese at the water treatment plant makes sense. The utility will most
likely end up saving money through less flushing and fewer customer service calls. However,this is hard to quantify. The main societal advantage is that for every dollar spent by the utility,the overall benefit to the customer is higher. It makes more economic sense for the utility tocontrol manganese than it does for each customer to deal with the manganese in the drinkingwater. In the work we have done to date, all the utilities that we spoke to agree with this. It is better to control manganese in a cost-effective manner than to simply do nothing until thecustomer calls.
The cost associated with improving removal, via operational changes, is small ascompared to the capital cost associated with changing the primary Mn treatment. It cost more tostart to treat for Mn than it does to improve upon existing treatment. Therefore the reluctance totreat for Mn is often the reluctance to build new treatment, not to optimize existing treatment.
Therefore, the change in a utility’s internal goal from 0.05 mg/L to any other, has less to do withaesthetics or customer complaints than it has to do with the threshold limit for which they willhave to build new treatment.
CONCLUSIONS AND RECOMMENDATIONS
The results from this research program indicate that problems associated with manganeseare much more common than previously thought. Geographically, manganese can occur,
©2006 AwwaRF. All Rights Reserved.

7/21/2019 Occurrence of Manganese in Drinking Water and Manganese Control
http://slidepdf.com/reader/full/occurrence-of-manganese-in-drinking-water-and-manganese-control 25/463
xxiii
virtually throughout the world and be present in both ground and surface waters. Reliabletreatment processes are available to economically reduce source water manganese to well belowthe present US drinking water standard, SMCL, of 0.05 mg/L. Our research suggests that a moreappropriate target level for Mn to minimize consumer problems would be 0.02 mg/L. Thesurveys conducted during this study indicated that a standard of 0.05 mg/L Mn was notsufficiently low to ensure minimal consumer complaints. Most existing treatment plants designedto reduce Mn can be modified, usually with operating chemistry, to produce water with amanganese concentration considerably below the current standard.
©2006 AwwaRF. All Rights Reserved.

7/21/2019 Occurrence of Manganese in Drinking Water and Manganese Control
http://slidepdf.com/reader/full/occurrence-of-manganese-in-drinking-water-and-manganese-control 26/463
xxiv
©2006 AwwaRF. All Rights Reserved.
7/21/2019 Occurrence of Manganese in Drinking Water and Manganese Control
http://slidepdf.com/reader/full/occurrence-of-manganese-in-drinking-water-and-manganese-control 27/463
1
CHAPTER 1
INTRODUCTION
This report documents the research and findings of AwwaRF Project No. 2863,“Occurrence of Manganese in Drinking Water and Benefits of Enhanced Manganese Control,”an effort begun in early 2003 to advance the water industry’s understanding of the control and
regulation of manganese. Historically, because of the “dirty water” problems and laundryspotting it can cause, manganese has been regulated more as an aesthetic problem than a healthissue. In the absence of urgent public health reasons to set science-backed control levels, themanganese concentrations allowed or recommended in potable water have often been determinedin a highly subjective manner and left, until recently, unreviewed for decades. In today’s waterindustry, however, with its increased drive for aesthetic quality and consumer satisfaction, thequestion of how to control manganese, and how much, at what cost, is gaining in importance.
This introduction gives an overview of the project as a whole, a brief background onmanganese in relation to drinking water treatment and regulation, and an introduction to each ofthe main research tasks accomplished for this project.
OVERVIEW OF THE PROJECT
The purpose of the research conducted under this project was to further ourunderstanding of the occurrence and control of manganese (Mn) in drinking water—from sourcewater to the treatment process to the distribution systems that deliver water directly toconsumers. This overall goal encompassed a number of more specific objectives, including:
• Correlating not only total Mn concentrations but the concentrations of individualchemical species of Mn to several water quality parameters
• Determining whether specific Mn concentrations in treated water (at the planteffluent) relate to consumer acceptability
• Assessing the costs and benefits of implementing control strategies that reduce Mn to below the current regulatory level
• Investigating the effect of certain plant operation parameters on the Mn removal process that is accomplished by oxide-coated filtration.
This final report presents and interprets existing and new data and offers practicalrecommendations that will help utilities make optimum decisions about manganese control.Moreover, it is a step towards developing more scientific basis upon which future manganeseregulation can rely.
Research Tasks
At the outset of the project, the authors conducted an extensive literature review to moreclearly identify what was known and not known about manganese in drinking water, and to setthe stage for the research. Hundreds of papers, texts, and reports were reviewed. In Chapter 2 wehave attempted to summarize the pertinent existing knowledge in some detail. While papers onthe occurrence, chemistry, and treatment of Mn are most relevant to the current project, we havealso summarized medical literature that has helped shape the developing consensus that Mn is anaesthetic, rather than health-related, problem.
©2006 AwwaRF. All Rights Reserved.
7/21/2019 Occurrence of Manganese in Drinking Water and Manganese Control
http://slidepdf.com/reader/full/occurrence-of-manganese-in-drinking-water-and-manganese-control 28/463
2
The new research for this project was conducted in a series of logical steps that startedwith data-gathering surveys of water utilities and culminated with observational andexperimental case studies involving field testing. While being necessarily limited to thoseutilities that were both experiencing Mn problems and had the time and resources to participatein the project, the research team attempted to evaluate as many different treatment processes andrepresentative geographical areas as possible. The main research tasks were:
•
Initial Surveys —surveys of 242 water treatment facilities conducted by telephone
• Detailed Surveys —in-depth surveys of 52 treatment facilities, conducted by telephoneand by the utilities’ reporting of existing data
• Distribution System Occurrence Sampling —quality-controlled sample gathering fromthe distribution systems of 12 water utilities, and analysis of the samples formanganese occurrence and speciation
• Case Study I —controlled experimentation on manganese removal by varying specific parameters in a pilot-plant facility at the Philadelphia Water Department
• Case Study II —field research at an operating full-scale conventional treatment plantin West Virginia to evaluate the efficacy of the oxide-coated-media effect in
removing Mn with granular activated carbon vs. anthracite filters• Cost Analysis —comparison of order-of-magnitude capital and operating costs foralternative treatment processes that can accomplish Mn removal
Highlights of This Report’s Organization
The chapters of this report follow the sequence of (1) Introduction, (2) Literature Review,(3) Methods & Materials, (4) Results and Discussion, (5) Summary and Conclusions, and (6)Recommendations to Utilities.
The Literature Review chapter serves in a sense as an expanded Introduction, presentinga more in-depth background on current industry concerns, concepts, and solutions regardingmanganese. The References section at the end of this report gives full citations to references
cited in the literature review and throughout this document.Since each of the research tasks listed above followed its own distinct method and
produced its own uniquely structured set of data, for ease of organization the authors havedivided each of Chapters 3, 4, and 5 into subsections covering these tasks in order. Chapter 6attempts to distill the most important and clearest findings of the project as a whole into usefulrecommendations.
During the conduct of the project so much data was generated that only a selected portionis presented in the text of this report. Additional detailed data has been compiled into extensiveappendices supplied on CD-ROM. Appendices A and B give more detail on the materials andmethods discussed in Chapter 3. Appendices C through F provide more detailed data from thesurveys, sampling and case studies, and Appendix G supplies detailed cost analysis tables and
charts.
©2006 AwwaRF. All Rights Reserved.
7/21/2019 Occurrence of Manganese in Drinking Water and Manganese Control
http://slidepdf.com/reader/full/occurrence-of-manganese-in-drinking-water-and-manganese-control 29/463
3
BRIEF BACKGROUND ON MANGANESE IN DRINKING WATER
Overview of Manganese Chemistry and Treatment
Mn is an essential trace element for both plants and animals. Chemically it occurs inseveral species with different valence states (+2, +3, +4, +5, +6, +7), often represented by roman
numerals. For this study we will focus on Mn(II), Mn(IV), and Mn(VII). The key significance ofMn speciation in relation to drinking water is that both Mn(II) and Mn(VII) are soluble in waterwhile Mn(IV) is not. Manganese is most stable in its +2 valence state; therefore most naturallyoccurring manganese is dissolved Mn(II). The next most common species is the particulate stateof Mn(IV). To remove Mn from water one usually tries to convert it into an insoluble state andremove it physically; that is, converting Mn(II) or Mn(VII) into Mn(IV). This means eitheroxidizing Mn(II) to MnO2(s), or else reducing MnO4
– permanganate ions to MnO2(s), where the
(s) notation indicates solid form. It is important to note that stoichiometric manganese dioxide,MnO2, is extremely rare if it exists at all. Though we will refer to MnO 2 or manganese dioxidefrequently, in reality it is a nonstoichiometric oxide solid of Mn. The common property of mostMn dioxides is that they are black.
Treatment of water to remove Mn may be categorized into four distinct, yet somewhatinterrelated, approaches:
• Oxidizing the manganese (usually at elevated pH) using chlorine, potassium permanganate, air, or ozone with subsequent settling and/or filtration.
• Relying on the adsorbance of and catalytic oxidation of manganese—Mn(II)oxidizing to Mn(IV)—on the oxide-coated filter media itself. The pH must becontrolled and an oxidant such as potassium permanganate or chlorine must be present. Examples of this type of filter would be (1) manganese greensand and (2)those plants that rely on the addition of a small dose of chlorine just prior to filtrationto maintain a coating of manganese dioxide.
•
True ion exchange, which relies on the exchange of divalent manganese cations withsome other cation, usually sodium. Ion exchange relies on the manganese all being inthe dissolved, Mn(II).
• Using membrane filters to remove all particulate manganese, MnO2; or, if themanganese is dissolved, using reverse osmosis (RO). The selection of the appropriatemembrane filter type depends on the valance state of the Mn.
The first two types of processes are by far the most commonly used, although all four areaddressed in this study.
For the second example of the second process given above, a word of elaboration is inorder. A filter media that is covered with a manganese dioxide will adsorb Mn(II) directly onto
its surface. Once there, it can be quickly oxidized to Mn(IV) in the presence of chlorine. The newMn dioxide will become a new site for additional Mn(II) adsorption. This process is similarenough to the process of Mn removal with manganese greensand that some refer to it as theinduced greensand effect (IGE). However, it is more complicated than that and there is nogreensand involved, so the authors have used a more generic term, the induced oxide-coated
media effect (IOCME).For the most part, manganese chemistry for the purposes of water treatment can be
usefully simplified, as it was in the preceding explanation. Yet problems exist with this
©2006 AwwaRF. All Rights Reserved.
7/21/2019 Occurrence of Manganese in Drinking Water and Manganese Control
http://slidepdf.com/reader/full/occurrence-of-manganese-in-drinking-water-and-manganese-control 30/463
4
simplification. The detailed chemistry is more complex; in fact, far more complex than we
currently understand. For example, under certain conditions (usually high oxidation conditions)
MnO2(s) can be formed in such small clumps as to be colloidal. These colloidal particles do notsettle and are sometimes hard to capture on a filter. Sometimes too much oxidant is added to a
process and soluble MnO4 – is passed out into the distribution system. Sometimes MnO2 is
reduced to Mn(II), becomes soluble and passes into the distribution system. Certain bacteria
utilize metabolic pathways to change the valence states of Mn. These and other facts make the behavior of Mn in drinking water a more complicated phenomenon and can make one-size-fits-
all “cookbook” control solutions elusive.
The Problem with Manganese
Although research data is continually being developed, it appears that Mn has no negative
health effects at the levels commonly found in drinking water. However, the long-recognized
aesthetic problems caused by Mn are a continuing source of concern for customers and for waterutilities. Problems associated with Mn include water discoloration (usually black or dark red),
clothes and fixture staining, turbid water, sediments, and, at very high levels, metallic taste.
Household problems only occur when the manganese is in the particulate or oxidized
form. If the Mn remains soluble it will pass through undetected by the human eye. The problemis that Mn usually does not stay dissolved in the oxidizing environments of our water distribution
systems. Even if the Mn did remain dissolved until reaching a customer’s home, the clothes forwhich it causes the biggest problem (whites) are often washed with bleach (NaOCl), an oxidizer.
In such a chemical environment, the Mn precipitates directly onto the surface of the clothing,
leaving small black dots. While these dots can often be removed by washing the clothes with a
reducing agent, the idea of bleaching and then reducing each load of white laundry can quickly become asinine.
There are many sources of manganese. Manganese may enter a water supply from a
surface water or groundwater source, from the treatment chemicals being used, as a contaminantin treatment chemical or internally from a recycle stream. The occurrence of Mn in a particular
utility’s source water may be episodic, such as during reservoir turnover, or it may be persistent,as in many systems whose main source is groundwater wells. Manganese may seem ubiquitous
because there are enough sources and enough variability in concentrations to confound simple
explanation.
Regulatory Considerations for Mn
The current U.S. EPA secondary standard, or SMCL, for Mn is 0.05 milligrams per liter
(mg/L). Most states have adopted this standard, although a few regulate both iron and manganesewith a combined standard of either 0.3 or 0.5 mg/L for these elements. Some states enforce the
secondary standards as a primary standard.
The standard for Mn of 0.05 mg/L was established subjectively over 40 years ago(1962)—and later adopted without change by EPA (1979)—as the level at which most
consumers will avoid household problems with discoloration or staining. It first appeared in a
United States Public Health Service (USPHS) publication of 1943 in combination with iron (Fe),it suggested the combination of Fe and Mn should not exceed 0.3 mg/L. Prior to this the USPHS
(1925) listed "Iron (Fe) should not exceed 0.3 p.p.m." and made no mention of Mn. However,
as consumer expectations for water quality, often based on aesthetics, increase, the public
perception that a particular water is acceptable decreases. Thus the historical standard of 0.05
©2006 AwwaRF. All Rights Reserved.
7/21/2019 Occurrence of Manganese in Drinking Water and Manganese Control
http://slidepdf.com/reader/full/occurrence-of-manganese-in-drinking-water-and-manganese-control 31/463
5
mg/L may not be low enough to ensure consumer satisfaction. Some utilities today are targeting
0.015 mg/L as the concentration at which minimal consumer problems will develop, and are
maintaining distribution system Mn well below that level.In light of the above, several regulatory-related questions helped drive and focus the
research for this project. These included:
• How prevalent is Mn in drinking water distribution systems?
•
Should the concentrations of particular Mn chemical species be targeted for control,
in addition to—or instead of—total Mn? How can a utility analytically separatedissolved from particulate Mn?
• Are the current treatment processes commonly used for Mn reduction adequate to produce water with Mn at levels below the regulatory standard of 0.05 mg/L?
• What would be the capital and operating cost implications of treating water to achieve
Mn levels less than 0.05 mg/L?
• At what Mn level might household problems be completely eliminated?
OVERVIEW AND PURPOSE OF RESEARCH TASKS
As mentioned above, before the main investigative work of the project began, a literature
review updated the project team about the state of knowledge on Mn in drinking water, and the
gaps in that knowledge, so as to best focus the new research efforts.
The following overview of the research tasks undertaken during the project discusses the primary activities and goals of each task and briefly sketches the methods used. It conveys an
understanding of the logical sequence of the work and some of the difficulties involved in
developing not only reliable data but also practical recommendations for handling the real butsometimes elusive problem of Mn in drinking water. Throughout the project, the research team
acknowledged the importance of both anecdotal reports from participating water utilities and
“hard” scientific data, and attempted to derive useful analysis and conclusions from both.
Initial Surveys
The participation of water utilities being central to the project’s success, the research
team gave considerable thought to how best to elicit useful data from them. The initial surveyswere designed as a telephone interview between a member of the research team and a utility
representative that had a good understanding of Mn concerns. The purpose of the initial surveys
was to develop a geographically diverse database of information about manganese problems, andto find utilities that were willing to participate further in the project.
The initial survey questionnaires were designed to obtain the most useful information in
the least amount of time. Before actual surveys began, the principal investigators (PIs) of the
project conducted a formal training program with the interviewers and ran through dressrehearsals. The PIs then participated in a series of trial run interviews with utilities to ensure that
interviewers were including follow-up questions appropriately. The actual conduct of the
surveys varied from 15 minutes to over two hours, depending on the extent of Mn issues at that particular facility. An interview form was completed for each facility water source or treatment
plant.
The scope of the initial surveys was to determine the extent of Mn occurrence, identifytypes of treatment systems for Mn, ask about problems associated with Mn, obtain limited water
©2006 AwwaRF. All Rights Reserved.
7/21/2019 Occurrence of Manganese in Drinking Water and Manganese Control
http://slidepdf.com/reader/full/occurrence-of-manganese-in-drinking-water-and-manganese-control 32/463
6
quality data, and determine if the utility was willing to participate in further research (Mn
sampling and analysis or a more detailed interview). We obtained Consumer Confidence Reports
(CCR) for each utility interviewed and requested specific analytical data as available.Interviewers also visited the Web sites of those utilities that had them, and added any
supplemental information available on the Web sites to the utility file.
In all 348 utilities, some having multiple water sources or treatment plants (facilities),
were identified as systems that may have Mn issues and thus potential candidates for initialsurveys. Of these 242 facilities were determined to have Mn levels justifying further discussion.
Therefore, 242 initial facility surveys were conducted. Each utility was asked if they would be
willing to participate in a more detailed survey; most agreed.Data from the initial surveys was input into a database that allowed the project team to
review the information and draw useful conclusions. The surveys were not designed to provide a
statistically reliable analysis of Mn occurrence geographically, but rather a reasonable crosssection of the types of sources, problems, and treatment systems associated with Mn. To respect
the confidentiality of individual utility information, we have used identification numbers rather
than names in reporting the results. In most cases the location of the utility is not essential tounderstanding the usefulness of the data. Where appropriate we did identify geographical
location and, in a few critical instances, we have named the utility (with permission).
The research team found during the initial surveys that utility self-knowledge of Mn problems is not always clear-cut. Many utilities do not perceive that they have a manganese problem since the Mn is removed incidental to treatment for some other more primary problem,
such as turbidity removal or disinfection. Also, in most cases utilities are able to lower the Mn
concentration to a level below the secondary standard or to sequester the Mn and reducehousehold problems. Many utilities feel there is no Mn problem as long as the concentration
leaving the plant is below the secondary standard. As we will discuss later, these assumptions are
not necessarily true. Consequently, one of the challenges in conducting the initial surveys was touncover Mn problems in utilities that did not recognize some of the subtle issues surrounding Mn
problems.
Detailed Surveys
Once the initial surveys were completed, 52 detailed interviews were conducted with
utilities that clearly were experiencing Mn treatment or system problems and that were willing tospend the time for the interview and to send additional analytical data for inclusion in the
research database. Of the 52 detailed surveys, 10 were conducted with utilities outside the United
States. The purpose of the detailed surveys was to obtain more specific information in threeareas: (1) the source of the Mn, (2) the manner in which the problem was resolved, if any, and
(3) the type of treatment process or chemical addition that was used relative to the Mn. The
detailed surveys were also used to identify systems willing to participate in the next phase of the
project—taking seasonal distribution system samples for Mn speciation analysis.
The detailed surveys collected considerable information about the distribution system,types of complaints if any, treatment chemicals used, and levels of Mn in the distribution system.
We were particularly interested in those systems that were at or close to the regulatory limit of0.05 mg/L for Mn, but were still experiencing discoloration or sediment problems. Each utility
was asked to complete a detailed water quality table with historical data for such parameters as
raw, treated, and distribution system Mn; pH; color; TOC; iron; turbidity; alkalinity; hardness;calcium; and conductivity. For each treatment plant we identified each unit process in the train
along with pertinent design and operating criteria. We also explored target treatment goals and
©2006 AwwaRF. All Rights Reserved.
7/21/2019 Occurrence of Manganese in Drinking Water and Manganese Control
http://slidepdf.com/reader/full/occurrence-of-manganese-in-drinking-water-and-manganese-control 33/463
7
any other information that would help to shed light on Mn issues. In many cases the detailed
survey for a particular utility required more than one telephone interview since there was not
always a single person knowledgeable about all the problems associated with Mn or all thecomponents of the distribution system. The detailed surveys provided some extremely useful
information.
Through the detailed survey interviews, the research team selected 12 utilities for the next
project phase, Mn occurrence sampling and testing. The utilities selected had to have: (1) thewillingness to participate, since considerable time and cost were involved, (2) the technical
resources to conduct sampling and analysis, and (3) a Mn issue or distribution system issue that
might translate to distribution system problem.
Distribution System Occurrence Sampling
The purpose of Mn occurrence sampling in utilities’ water distribution systems was to
begin to study the relevant chemical details of Mn in the water as it might affect householdconsumers. This task thus measured not just total Mn concentrations, but concentrations of
dissolved versus non-dissolved chemical species of Mn—roughly, Mn(II) vs. Mn(IV).
Distribution system water samples were taken from 12 facilities. Samples were taken at four
locations in each system: entry point (i.e., plant effluent), near the source (i.e., near the planteffluent), at the mid-point in the distribution system, and at the end of the distribution system.
Each location was sampled seasonally to measure the effects of temperature. This temperaturewas achieved both geographical and climatically. The samples were physically taken by the
participating utility and sent to the PI’s laboratory—the Philadelphia Water Department Bureau
of Laboratory Services (PWD-BLS)—for Mn analysis as well as measurement of several other
parameters.This task analyzed the distribution system for total Mn, colloidal Mn, and dissolved Mn.
To accomplish this, before sending the samples to Philadelphia the utilities processed the raw
samples through a set of fine filters that left each sub-sample containing a relevant Mn fraction.Each utility filtered portions of the sample first through a 0.22-micron filter and then through a
30,000-Dalton (30-kDa) ultrafilter. The Mn concentration in the unfiltered sample is total Mn.The Mn concentration after 0.22-micron filtering is considered the dissolved fraction, and the
concentration after 30-kDa filtering is considered the “truly dissolved” fraction. The difference
between the 0.22-micron and 30-kDa filtered samples is Mn in colloidal suspension, andsimilarly the difference between the concentrations in the unfiltered and 0.22-micron samples is
the particulate Mn fraction. The two filter sizes were selected on the basis of the literature
review and consideration of the practical aspects of field filtration of analytical samples.In addition to the samples sent for Mn analysis, each utility conducted its own field
sampling and testing at each site for chlorine, pH, temperature, and several other values to
determine if a correlation existed among total, colloidal, or dissolved Mn and any other
analytical parameters. All the water quality data gathered during this task were plotted against
total and dissolved Mn concentrations. For each plot, correlation coefficients were calculated.The data generated by this task were used to evaluate Mn as water traveled through the
distribution system and to determine if there were any trends in the speciation of Mn with time.In addition the research team also wanted to explore whether any of the other water quality
parameters either affected or correlated with the concentrations of Mn reported, or to the
speciation of the Mn.
©2006 AwwaRF. All Rights Reserved.
7/21/2019 Occurrence of Manganese in Drinking Water and Manganese Control
http://slidepdf.com/reader/full/occurrence-of-manganese-in-drinking-water-and-manganese-control 34/463
8
Case Study I: Pilot-Scale Research
The purpose of Case Study I was to use the pilot plant facilities at the Philadelphia WaterDepartment (PWD) to conduct research on alternative methods and operating procedures forreducing Mn in a surface water supply. More specifically, this case study tested the operational boundaries of Mn control via oxide-coated media. The setting of a pilot plant allowed for thetype of controlled experimentation that is difficult to perform at a full-scale WTP relied on by
customers for consistently high-quality water.PWD has two substantial pilot plants available for research, one at the Baxter Water
Treatment Plant and the other at the Belmont WTP. The two pilot plants have similar processtrains but different source waters. The process trains include flash mixing, tapered flocculation,sedimentation, intermediate ozonation, and filtration. Of the six filters per plant, four containdual media coal-over-sand and two contain granular activated carbon (GAC). The pilot plants aredesigned to closely parallel full-scale plant operation of a conventional and modifiedconventional water treatment plant. No intermediate pumping occurs from flash mixing throughfiltration. The plants are equipped with on-line, continuous monitors for turbidity, particlecounts, filter head loss, pH, flow, and ozone concentration. Operating variations can be obtained by taking units from service, changing flow rate, or bypassing units. The pilot plants are fully
supported by the analytical services of the PWD-BLS.The operating variables studied in this task were pH, chlorine application point and dose,
ozone, coagulant concentration, and filter media type. The pilot plant was used to determine ifozone or chlorine alone or in some combination could be used to control Mn without sacrificingother water quality. Another purpose was to explore the sensitivity of Mn reduction to pH,taking into account seasonal and temperature variations. The research evaluated a comparison offilter media with and without pre-chlorine addition. We wanted to determine if there was anelution effect of Mn from filter media that had been precoated with manganese dioxide, if the preoxidant ahead of the filters were suddenly terminated.
This particular phase of the research went very well. The limits of the IOCME werediscerned for both pilot plants. IOCME is a robust treatment process but it does have limits,
mostly associated with temperature and pH. Once established the oxide-coated media is stableas long as the redox-potential does not change significantly.
Case Study II: Full-Scale WTP Research
The purpose of Case Study II was to evaluate the full-scale efficacy of Mn removal usingthe induced oxide-coated media effect on GAC at an operating WTP. The oxide-coated media process is known to work on sand and anthracite filters that have a free chlorine residual in theeffluent. However, a GAC filter will consume the chlorine so there will be no chlorine residual inthe effluent. Yet an induced oxide-coated media was established and Mn was removed.
A water treatment plant in West Virginia agreed to participate in this study. The facility
uses flash mixing, flocculation, sedimentation, and filtration of a surface water supply source thatcontains variable and elevated levels of Mn. One of the treatment plant’s 12 filters is ananthracite coal filter; the rest are GAC, providing a somewhat unusual opportunity forcomparison. The plant has successfully reduced Mn by controlling the pH going on the filtersalong with the addition of chlorine.
Therefore the major part of the research effort was a success. However, as with mostfull-scale endeavors the control of certain variables and the retrieval of all pertinent informationwas difficult. This has a lot to do with the need to keep the process optimized regardless of the
©2006 AwwaRF. All Rights Reserved.
7/21/2019 Occurrence of Manganese in Drinking Water and Manganese Control
http://slidepdf.com/reader/full/occurrence-of-manganese-in-drinking-water-and-manganese-control 35/463
9
experiments being conducted and the amount and availability of staff; along with the often notdata friendly distributed control systems.
A comment about the prevalence of research on IOCME is that the process works welland can be happening without the facility knowing it. Changes in the water treatment industryare forcing operational changes that would reduce the robustness of the process, taking some bysurprise. There is an already existing body of information on classic Mn removal processes andmany of the operational pit falls, especially for smaller system, have already been worked out.Yet, it would be an oversimplification to say that there is no new and vital information to beobtained. Our research was focused on larger scale.
Cost Analysis
In the cost analysis, a cost model and tables were developed to give utilities anapproximate comparison of the capital and operating costs of various treatment methodologiesfor reducing Mn. The bases of this comparison are national average treatment costs and are notadjusted for geographically specific unit costs. However, the tables should be accurate for costcomparisons. Cost comparison tables were developed for three sizes of treatment plants: 1 mgd,10 mgd, and 100 mgd. The tables are based on the cost to reduce Mn from an assumed raw water
level of 0.5 mg/L down to one of four finished water concentrations: the current regulatorystandard of 0.05 mg/L, or alternatively to 0.02 mg/L, 0.015 mg/L, or 0.01 mg/L. In some casesthe capital cost to reduce Mn to levels well below the regulatory standard is the same as the costto just meet the standard since the type of process, e.g. membranes, will inherently remove theMn to levels below detection. In those cases the operating cost is usually for additional analyticaltesting that may be required to ensure that the lower level is being met.
The types of treatment processes included in the cost analysis include conventionaltreatment with coagulation, flocculation, sedimentation and dual media filtration, direct filtration,lime softening, advanced clarification, membrane filtration, manganese greensand filtration,diatomaceous earth filtration, and ion exchange. The capital costs presented are for the treatment plant as if it were constructed only for the removal of Mn; that is, a new plant using a particular
technology but constructed specifically for Mn. Obviously, in many cases Mn might beincidental to other water quality problems and some processes, such as conventional treatment oreven lime softening, would only be used for Mn if some other water issue were also present.Other processes, such as manganese greensand, might be selected solely on the basis of reducingMn. All the operating costs presented in the tables relate to the incremental cost for reducing Mn.In some cases this incremental cost is for additional monitoring, reporting, or testing and foradditional chemical doses, if necessary. In some cases the filter run time may be reduced andmore frequent backwashing required.
©2006 AwwaRF. All Rights Reserved.

7/21/2019 Occurrence of Manganese in Drinking Water and Manganese Control
http://slidepdf.com/reader/full/occurrence-of-manganese-in-drinking-water-and-manganese-control 36/463
10
©2006 AwwaRF. All Rights Reserved.
7/21/2019 Occurrence of Manganese in Drinking Water and Manganese Control
http://slidepdf.com/reader/full/occurrence-of-manganese-in-drinking-water-and-manganese-control 37/463
11
CHAPTER 2
LITERATURE REVIEW
At the outset of the current project, an extensive review of the existing literature onmanganese in drinking water helped the principal investigators understand the state ofknowledge on the subject and guide the ensuing new research efforts. For this review the PIs
requested the assistance of the independent consultant Fred Pontius, since his literaturecompilation for the previous AwwaRF Project No. 2691, Manganese Control and Related Issues
(Casale, LeChevallier, and Pontius 2002) was so thorough and since that project led to thecreation of this one. This chapter incorporates and adapts much of the previously reviewedmaterial, and expands on it.
The PIs of the current project wanted to suggest that Mn does not appear to be harmful tohealth at the levels typically found in raw water, and that the Mn-related issues of most concernto utilities are, in fact, aesthetic. Because the PIs are not qualified to make statements about theoverall health implications of Mn they have devoted a significant portion of the literature reviewto health. This review covers a selection of the literature on medical aspects, some of whichentered into the USEPA’s 2003 decision not to pursue a health-related regulation for Mn.
However, this does not make Mn immune to the topic of sensational articles. For example in arecent media release by the title “Does Manganese Inhaled from the Shower Represent a PublicHealth Threat?” says that it is the first study to show the potential for permanent brain damagefrom breathing vaporized manganese (Wake Forest 2005).
INTRODUCTION
The first reported case of manganese-related water quality problems in the United Stateswas in 1898, when a well water supply for a New England mill contained so much Mn that thewell had to be abandoned (Weston 1909). The well extended below a peaty layer overlyingwater-bearing sand, from which Mn was suspected to have leached into the groundwater.
Manganese is an abundant metallic element that constitutes about 0.1% of the earth’s
crust. The elemental form of Mn does not occur naturally in the environment, but Mn is acomponent of over 100 minerals. Manganese oxide, manganese carbonate, and manganesesilicate are a few of the most common mineral forms.
Manganese occurs naturally in soil, air, water, and food at low levels. Deutsch, Hoffman,and Ortner (1997) even found Mn concentrations ranging from 0.3 to 11.3 µg/L in rain and snowsamples in Darmstadt, Germany. In groundwaters, Mn concentrations depend upon the mineralcomposition of the alluvium, the pH, and redox potential (Troester 1998). Manganese ingroundwater wells may initially be low and remain low for many years, but then unexpectedlyincrease until the water quality becomes unacceptable (Viraraghavan et al. 1987).
Biologically, Mn is essential for the proper function of several enzymes and is necessaryfor normal bone structure and brain function. Although manganese is an essential trace element
in humans, exposure to high levels of it can have adverse neurological effects. The USEPA(2004) put it this way “Adverse health effects can be caused by inadequate intake or overexposure. Mn deficiency in humans is thought to be rare because Mn is present in manycommon foods. Many of the reports of adverse effect from Mn exposure in humans are frominhalation exposure in occupational settings”.
Manganese concentrations at or even below the current USEPA Secondary MaximumContaminant Level (SMCL) of 0.05 mg/L can create problems for drinking water providers by
©2006 AwwaRF. All Rights Reserved.
7/21/2019 Occurrence of Manganese in Drinking Water and Manganese Control
http://slidepdf.com/reader/full/occurrence-of-manganese-in-drinking-water-and-manganese-control 38/463
12
causing customer dissatisfaction, including complaints about plumbing fixture and laundrystaining, discolored water, and taste and odor problems.
THE PROBLEM: REDUCTION IN DRINKING WATER QUALITY
Excessive Mn in water entering the distribution system is undesirable because it results inMn deposition on pipe surfaces and poor aesthetic quality. Deposition of iron and manganese
precipitates in the distribution system can reduce pipe diameter and eventually clog the pipe(Kothari 1988, Costello 1984).
Consumers are inconvenienced by the presence of high concentrations of Mn in drinkingwater. The most common effects are purple-black discoloration of laundered clothes and plumbing fixtures; peculiar-tasting tea, coffee, and other heated beverages made with tap water;swimming pools that look uninvitingly dirty because of the presence of dark manganese oxidesand turbidity (Moore 1977, Hagopian 1975). Iron and manganese can impart a metallic or bittertaste to water and can foul home water softeners, reducing softener efficiency (Kothari 1988).
Dirty-water problems caused by Mn sometimes coincide with an increase in the Mnconcentration of the source water, but typically the cause of dirty water is not so obvious.Anderson, Row, and Sindelar (1973) conducted iron and manganese studies of Nebraska water
supplies, concluding that Mn problems may be encountered in a water supply that meets therecommended limit of 0.05 mg/L. They cited the case of Grand Island, Neb., which experiencedserious problems with a well water supply having an average Mn concentration of 0.04 mg/L.
The most extensive studies to date of Mn deposition in a drinking water distributionsystem have been conducted in Australia by L.I. Sly and colleagues (Sly and Arunpairojana1987; Sly, Arunpairojana, and Hodgkinson 1988b; Sly, Hodgkinson, and Arunpairojana 1990;Dixon et al. 1989). Dixon et al. (1989) noted that in regions of Australia where laundry staininghas been severe, the concentration of Mn in the water supply did not exceed 0.05 mg/L. Dirtywater and staining were the result of a buildup of Mn within the distribution system occurringover a long period of time, followed by a change in conditions which caused its sudden release(Sly, Hodgkinson, and Arunpairojana 1988a). Twort (1963) indicated that Mn causes a black
slime to be deposited in distribution system pipes. These deposits can periodically slough off andappear at the consumer’s tap. The slime deposits can also restrict water flow in pipelinesresulting in head loss due to increased frictional forces at the surface (Sly, Hodgkinson, andArunpairojana 1990). Deposits in water mains can be resuspended by increased flow rates,thereby causing high turbidities (Kothari 1988).
Manganese deposition in distribution systems can occur at concentrations as low as 0.02mg/L (Sly, Hodgkinson, and Arunpairojana 1989; Bean 1974; Griffin 1960). Because of this,Sly, Hodgkinson, and Arunpairojana (1989) argued that the drinking water guideline level forMn should be lowered from 0.05 mg/L to 0.01 mg/L.
Biochemical manganese oxidation and deposition can occur in areas of the distributionsystem with insufficient chlorination to control biofilm growth. This microbial deposition results
from accumulation of Mn by manganese-oxidizing budding hyphal bacteria such asPedomicrobium manganicum and Metallogenium sp. (Sly, Arunpairojana, and Hodgkinson1988b; Sly, Hodgkinson, and Arunpairojana 1990; Tyler and Marshall 1967). Thesemicroorganisms were shown to be the dominant Mn-depositing bacteria in high-water-velocityconditions (Sly, Hodgkinson, and Arunpairojana 1988a). Dirty water of microbial origin wasfound to be localized and caused by sporadic sloughing during periods of increased flow rates orintermittent chlorination of areas usually free of chlorine. Dirty water sediments of microbial
©2006 AwwaRF. All Rights Reserved.
7/21/2019 Occurrence of Manganese in Drinking Water and Manganese Control
http://slidepdf.com/reader/full/occurrence-of-manganese-in-drinking-water-and-manganese-control 39/463
13
origin may be readily distinguished from chemical deposits by the presence of budding hyphal bacteria.
Mn can support the growth of microorganisms such as Clonothrix and Crenothrix.Manganese and iron serve as electron donors for these and other autotrophic bacteria (Wong1984). Mn-utilizing bacteria occurring in drinking water distribution system biofilms includePseudomonas, Arthrobacter, Hyphomicrobium, and Sphaerotilus discophorus (CCMS 1987).These bacteria have been found in distribution systems with Mn at concentrations between 0.01and 0.05 mg/L. The presence of these and other oxidizing bacteria may lead to black-water problems (Percival, Walker, and Hunter 2000).
Increasing chlorination at the treatment plant will not reduce Mn deposition whenexcessive Mn(II) continues to enter the distribution system. On the contrary, increasedchlorination may considerably worsen chemical oxidation and deposition and cause more seriouswidespread dirty water because the rate of chemical deposition is considerably greater thanmicrobial deposition (Sly, Hodgkinson, and Arunpairojana 1990).
REGULATORY BACKGROUND
Regulation of Mn in Drinking Water
The 1962 U.S. Public Health Service (USPHS 1962) standards included a drinking waterguideline for manganese; it was 0.05 mg/L, based solely on controlling aesthetic water quality problems caused by Mn. In 1977, the USEPA issued a proposed rule for manganese under theSafe Drinking Water Act (SDWA) for a non-enforceable Secondary Maximum ContaminantLevel (SMCL) of 0.05 mg/L (USEPA 1977a). The following justification was provided by theagency for this proposed level:
Manganese, like iron, produces discoloration in laundered goods and impairs thetaste in drinking water and beverages, including tea and coffee. At concentrationsin excess of 0.05 mg/L, manganese can occasionally cause buildup of coatings in
distribution piping which can slough off and cause brown spots in laundry itemsand unaesthetic black precipitates. Manganese can usually be removed from water by the same process used for iron removal.
It should be noted that at approximately the same time, Stiles (1978) estimated that 20 percent of U.S. municipal water sources contained Mn above 0.05 mg/L, with small systems being the most vulnerable to these problems. No public comments were submitted on USEPA’s1977 proposed SMCL for manganese. From the time the SMCL was finalized by USEPA in1979 at 0.05 mg/L (USEPA 1979) until the writing of this report in 2005, the regulatoryguideline has remained unchanged.
Between 1979 and 1998, manganese in drinking water received very little regulatoryattention because it was not thought to pose a major risk to human health. However, in 1998, Mnwas included on USEPA’s Drinking Water Contaminant Candidate List (DWCCL) as aregulatory determination priority contaminant (USEPA 1998a). SDWA Section 1412(b)(1)(A)specifies that the determination to regulate a contaminant on the DWCCL must be based on afinding that each of the following criteria are met:
©2006 AwwaRF. All Rights Reserved.
7/21/2019 Occurrence of Manganese in Drinking Water and Manganese Control
http://slidepdf.com/reader/full/occurrence-of-manganese-in-drinking-water-and-manganese-control 40/463
14
• The contaminant may have adverse effects on the health of persons,
• The contaminant is known to occur or there is substantial likelihood that thecontaminant will occur in public water systems with a frequency and at levels of public health concern, and
• In the sole judgment of the [USEPA] Administrator, regulation of such contaminant presents a meaningful opportunity for health risk reduction for persons served by
public water systems.
USEPA evaluated available data regarding the occurrence, health effects, and control ofMn in drinking water for a regulatory determination to address the above three statutory criteria(USEPA 2001a, 2001b). However, because Mn is generally not considered to be very toxic wheningested with the diet, and because drinking water accounts for a relatively small proportion ofMn intake, USEPA concluded that setting an enforceable National Primary Drinking WaterRegulation (NPDWR) for Mn was unwarranted at this time because it would not likely present ameaningful opportunity for health risk reduction for persons served by public water systems. A preliminary determination from USEPA to this effect was published June 3, 2002 (USEPA 2002)and a final determination was published July 18, 2003 (USEPA 2003). USEPA has, though,decided to develop a Drinking Water Advisory for Manganese (Pontius 2004).
Besides the U.S. federal government, numerous other governmental and inter-governmental agencies have issued regulatory guidelines or limits for Mn in drinking water. Forinstance, the World Health Organization (WHO) also recommends a manganese concentration ofnot greater than 0.05 mg/L. Comparable recommended limits for Mn have been esta blished byvarious international and state drinking water agencies (see examples in Table 2.1). In general,these guidelines are based on ensuring the aesthetic quality of drinking water, and are not health- based limits. A few states, however, have adopted enforceable limits for Mn.
Non-Drinking-Water Regulation of Mn
Manganese and manganese compounds are regulated under several U.S. federal programs
in addition to the SDWA (USEPA 2000). Discharge of Mn to surface waters is regulated as totalMn under the National Pollutant Discharge Elimination System (NPDES). Both Mn and Mncompounds are listed as Hazardous Air Pollutants under section 112(b) of the Clean Air Act andare subject to Best Available Control Technology limits (USEPA 2000). The ComprehensiveEnvironmental Response, Compensation, and Liability Act (CERCLA or “Superfund”) includesMn compounds as hazardous substances, although no reporting thresholds are assigned to this broad class (USEPA 1998b).
Manganese is also a Toxic Release Inventory (TRI) chemical. The TRI was established by the Emergency Planning and Community Right-to-Know Act (EPCRA), which requirescertain industrial sectors to publicly report the environmental release or transfer of chemicalsincluded in this inventory (USEPA 1998b). Mn and some of its compounds are also listed as air
contaminants by the Occupational Safety and Health Administration (OSHA). This listingestablishes permissible exposure limits (PELs) for various Mn compounds to regulate workplaceexposure (ATSDR 2000).
©2006 AwwaRF. All Rights Reserved.
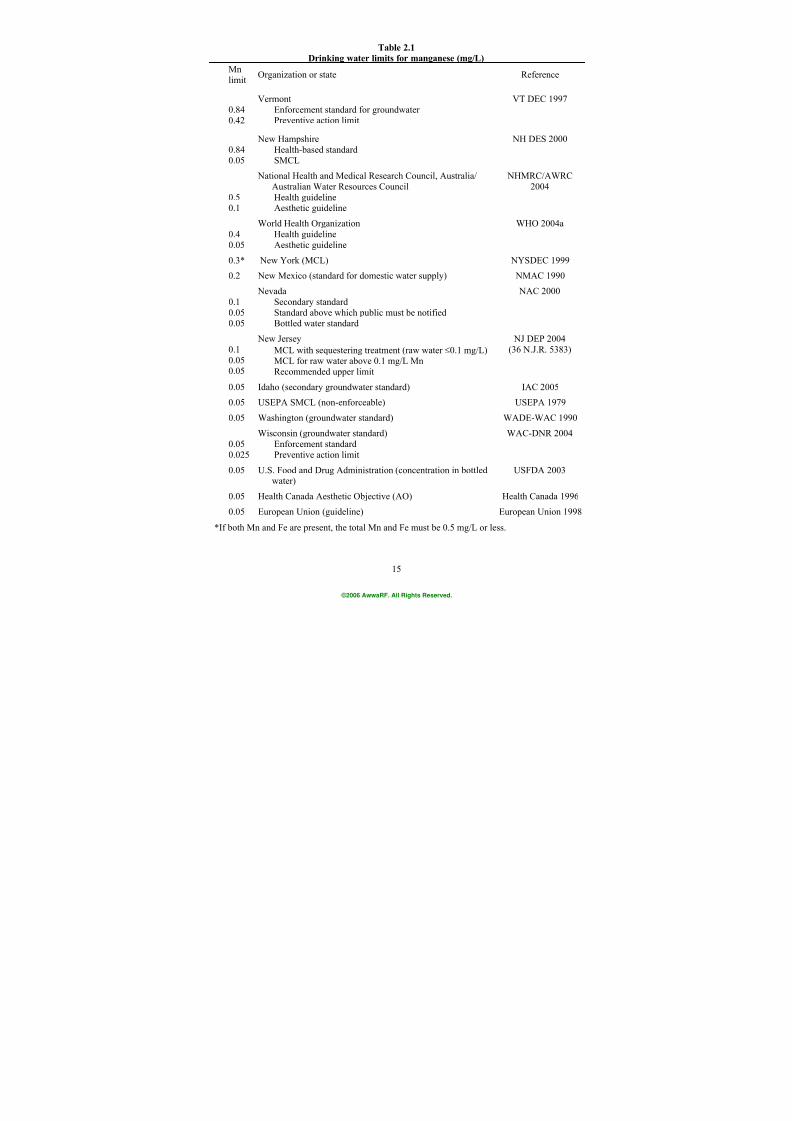
7/21/2019 Occurrence of Manganese in Drinking Water and Manganese Control
http://slidepdf.com/reader/full/occurrence-of-manganese-in-drinking-water-and-manganese-control 41/463
15
Table 2.1
Drinking water limits for manganese (mg/L)
Mnlimit
Organization or state Reference
0.84
0.42
VermontEnforcement standard for groundwater
Preventive action limit
VT DEC 1997
0.840.05
New HampshireHealth-based standardSMCL
NH DES 2000
0.50.1
National Health and Medical Research Council, Australia/Australian Water Resources CouncilHealth guidelineAesthetic guideline
NHMRC/AWRC2004
0.40.05
World Health Organization
Health guidelineAesthetic guideline
WHO 2004a
0.3* New York (MCL) NYSDEC 1999
0.2 New Mexico (standard for domestic water supply) NMAC 1990
0.10.050.05
NevadaSecondary standardStandard above which public must be notifiedBottled water standard
NAC 2000
0.10.050.05
New Jersey
MCL with sequestering treatment (raw water ≤0.1 mg/L) MCL for raw water above 0.1 mg/L MnRecommended upper limit
NJ DEP 2004(36 N.J.R. 5383)
0.05 Idaho (secondary groundwater standard) IAC 2005
0.05 USEPA SMCL (non-enforceable) USEPA 1979
0.05 Washington (groundwater standard) WADE-WAC 1990
0.050.025
Wisconsin (groundwater standard)Enforcement standardPreventive action limit
WAC-DNR 2004
0.05 U.S. Food and Drug Administration (concentration in bottledwater)
USFDA 2003
0.05 Health Canada Aesthetic Objective (AO) Health Canada 1996
0.05 European Union (guideline) European Union 1998
*If both Mn and Fe are present, the total Mn and Fe must be 0.5 mg/L or less.
©2006 AwwaRF. All Rights Reserved.
7/21/2019 Occurrence of Manganese in Drinking Water and Manganese Control
http://slidepdf.com/reader/full/occurrence-of-manganese-in-drinking-water-and-manganese-control 42/463
16
OSHA has set limits of 5 mg/m³ for fume and 0.2 mg/m³ for particulate matter as theaverage amounts of Mn permissible in workplace air over an 8-hour workday (OSHA 1998).Similarly, the American Conference of Governmental Industrial Hygienists (ACGIH) has set alimit of 1 mg/m³ for manganese fume and 0.2 mg/m³ for the average amount of Mn, eitherelemental or as inorganic compounds, that can be present in the air over an 8-hour workday(ACGIH 1998). The National Institute for Occupational Safety and Health (NIOSH) lists theairborne concentration Immediately Dangerous to Life or Health (IDLHs) for manganesecompounds (as Mn) at 500 mg Mn/m3 (NIOSH 2002).
HEALTH EFFECTS
As mentioned previously, manganese in drinking water is largely an aesthetic problemrather than a health problem, and based on a body of available research the USEPA has declinedto issue an enforceable health-based regulatory limit on Mn. “There were no studies found thatreported exposure to elevated inorganic manganese with cancer in humans. Cancer studies inanimals have provided equivocal results. Therefore, there are little data to suggest that inorganicmanganese is carcinogenic” (USEPA 2004). However, various aspects of the literature about thehealth effects of Mn may be of interest to the drinking water industry.
In 1973, the Food and Nutrition Board of the National Research Council (NRC)determined an “estimated safe and adequate daily dietary intake” of Mn to be 2 to 5 mg/day foradults (USEPA 1975). The average daily consumption of Mn from food for humans wasestimated to be from 3 to 7 mg (NAS 1973). In 1977, an NRC assessment of Mn in drinkingwater was published (USEPA 1977b), they concluded that ingestion of Mn in moderate excess ofthe normal dietary level of 3 to 7 mg/day was not considered to be harmful.
Although Mn is an essential trace element required for normal growth and health inhumans and animals, exposure to high levels of Mn can result in toxicity. (For instance, areported outbreak of manganism—i.e., manganese poisoning—in Japan was attributed to thedrinking of well water containing about 14 mg/L of Mn.) Manganese toxicity varies with theroute of exposure, chemical species, age, sex, and animal species. Comprehensive reviews of Mn
health effects and Mn’s role in biological processes are available (Mergler 1999, Sigel and Sigel2000).
Absorption and Pharmacokinetics
Manganese is absorbed via oral or inhalation routes. The adrenal glands regulate theconcentration of Mn in the blood. Aschner (2000) reviews Mn speciation in the blood and thetransport kinetics of Mn into the central nervous system. Although Mn may be distributed to thetissues, most of the excess is discharged via the bile or by other gastrointestinal routes. Mnconcentrates in mitochondria and organs with high mitochondrial density, such as the liver, pancreas, kidney, adrenal glands, and intestines (Hudnell and Mergler 1999). Inorganic
manganese excretion is almost exclusively fecal; whereas organic forms are excreted in bothfeces and urine (USEPA 1975). Diets associated with higher Mn intake include food such aswhole-grain cereals, nuts, green leafy vegetables, and tea.
The biochemical role of Mn is to serve as an activator of several enzymes includinghydrolase, kinases, decarboxylases, and transferases. Mn is also required for the activity of threemetalloenzymes: arginase, pyruvate carboxylase, and mitochondrial superoxide dismutase(Welder 1994). It has also been determined that Mn uptake into the central nervous system is
©2006 AwwaRF. All Rights Reserved.
7/21/2019 Occurrence of Manganese in Drinking Water and Manganese Control
http://slidepdf.com/reader/full/occurrence-of-manganese-in-drinking-water-and-manganese-control 43/463
17
increased in individuals with iron deficiency anemia (Aschner and Aschner 1991; Aschner,Vrana, and Zheng 1999).
Acute, Sub-Chronic, and Chronic Toxicity
The representative oral LD50 values for rats are 410 to 475 mg Mn/kg for manganesechloride, 379 to 750 mg Mn/kg for potassium permanganate, and 2,197 mg Mn/kg for
manganese dioxide (Holbrook et al. 1975, Kostial et al. 1978, Smyth et al. 1969, Shigan andVitvitskaia 1971). USEPA’s Integrated Risk Information System (IRIS) database lists a total oralreference dose (RfD) for Mn of 0.14 mg/kg/day (USEPA 1996). The RfD is an estimate of dailyexposure that is likely to be without appreciable risk of deleterious health effects during alifetime. This RfD of 0.14 mg/kg/day translates to a drinking water lifetime health advisory of300 µg/L (USEPA 2004). This limit was derived using a 70 Kg adult, 20% intake from drinkingwater, 2L per day of water consumed and a modifying value of 3. It is important to note thathealth advisory is not a regulatory limit and is to be used as guidance by public health officialsduring emergencies or episodic events. Concentrations below the health advisory are expected to be with out adverse effects on both health and aesthetics.
However, in a chapter of a book on occupational medicine Hudnell and Mergler (1999),
using the USEPA’s IRIS database as the source, published an RfD of 200 µg/L (which wesuppose to be a health advisory and not an RfD). In the field of public health physicians aregreatly trusted (as well they should be) so a physician in your community may present the 200µg/L as the appropriate value to guard public health based on a medical text as opposed to thecurrent USEPA lifetime health advisory of 300 µg/L. A community’s health department is oftena good source of clarity on such matters and they will have access to the current health advisorylevels.
To continue with the theme of changing standards for Mn, the World Health Organization(WHO) listed a limit of 0.5 mg/L (WHO 1993) is adequate to guard public health. Howeverwithin that publication they calculated a 0.4 mg/L drinking water limit based on 12 mg/day safeexposure, 60 Kg adult, 20% intake through drinking water and an uncertainty factor of 3. They
also said that no single study is suitable for calculating a guideline value. In 2004 the WHO(2004a, 2004b) revised their limit from 0.5 to 0.4 mg/L.
Several oral studies conducted in rodents identified biochemical changes in the brainfollowing administration of manganese chloride tetrahydrate in drinking water (Chandra andShukla 1981; Lai, Leung, and Lim 1981; Lai et al. 1982; Leung, Lai, and Lim 1981). Therelevance of these biochemical changes to humans has been challenged since rodents do notexhibit the same neurological deficits following exposure to Mn. Marsden and Jenner (1987)hypothesized that the ability of certain drugs to induce Parkinsonism in primates, but not inrodents, is due to the relative lack of neuromelanin in rodents. Because Mn selectivelyaccumulates in pigmented regions of the brain, this species difference is fundamentallyimportant. A study performed in a group of four Rhesus monkeys showed muscular weakness
and rigidity of the lower limbs after 18-month exposure to 6.9 mg Mn/Kg-day (Gupta, Murphy,and Chandra 1980). Histological analysis showed degenerated neurons in the substantia nigraand scanty neuromelanin granules in other pigmented cells. While this study demonstratedneurotoxicity resulting from excessive exposure to Mn, the exact mechanism is not clear.
Oral exposure studies conducted in animals have demonstrated subchronic toxicityincluding hematological changes, alteration of liver enzyme activities, decreased rate of bodyweight gain, decreased absolute and relative liver weights, and histopathological changes in livertissue following exposure to inorganic manganese compounds (Shukla, Sigh, and Chandra 1978;
©2006 AwwaRF. All Rights Reserved.
7/21/2019 Occurrence of Manganese in Drinking Water and Manganese Control
http://slidepdf.com/reader/full/occurrence-of-manganese-in-drinking-water-and-manganese-control 44/463
18
Hietanen, Kilpio, and Savolainen 1981; Leung et al. 1982; Komura and Sakamoto 1991; NTP1993).
Central Nervous System Toxicity
Couper (1837) first recognized the toxic capacity of manganese. Since then, numerousdescriptions of manganese poisoning (manganism) have been detailed (Rodier 1955; Schuler et
al. 1957; Tanaka and Lieben 1969; Smyth et al. 1973; Cook, Fahn, and Brait 1974; Chandra,Shukla, and Srivastava 1981; Roels et al. 1999; Ferraz et al. 1988; Iregren 1990; Wennberg et al.1991; Chia et al. 1993; Mergler et al. 1994; Chu et al. 1995; Lucchini et al. 1995, 1997, 1999).The signs and symptoms of manganism present a variety of neurological and behavior symptomsthat are related to the three functional areas of the nervous system (cerebellum, cerebral cortex,and corpus striatum).
• Cerebellum regulates muscle coordination. These symptoms include asthenia(weakness/fatigue), gait deficits, loss of balance on rising, slurred speech, difficultieswith fine movements, limb stiffness, tremor, micrographia (cramped handwriting),and dysdiadochokinesia (inability to perform alternating coordinated movements).
•
Cerebral cortex enables higher intellectual and emotional functions. Symptomsinclude somnolence (sleepiness), decreased libido, memory and intellectual deficits,nervousness, decreased mental capacity, aggressive behavior, bizarre compulsiveacts, emotional lability, hallucinations, flight of ideas, and sensory deficits.
• Corpus striatum (basal nuclei or basal ganglia) regulates body and limp posture andmuscle tone, which provide the foundation for movements. Symptoms include bradykinesia (too few and slow associative movements), postural problems, maskedfacies (tight, unemotional facial expression), and dystonia (inability to maintain proper body posture and tone).
Other associated symptoms include urinary problems, cramps, difficulties in swallowing,
and headaches. Individuals with manganese poisoning can exhibit any combination of thesesymptoms. Symptoms are usually progressive and only partially reversible following cessation ofexposure (Huang et al. 1993, 1998; Nelson et al. 1993; Meco et al. 1994; McMillan 1999).
“The neurotoxicity of Mn in adults with occupational inhalation exposure is wellestablished (Agency for Toxic Substances and Disease Registry 2001; Cook et al 1974; Roels etal 1999). . . In contrast, findings from studies of environmental exposure to Mn are limited(Hudnell 1999, Mergler 1999 Mergler and Baldwin 1997)” (Wasserman et al 2006). Thereforethey (Wasserman et al) conducted a study in Araihazar Bangladesh to look at the possibleconsequences of human exposure to Mn via drinking water. In that study children (and mothers)were tested for intellectual functions and Mn exposure. They confined the study to those wellsthat had < 10 µg/L of arsenic. They indicated that there was a relationship between Mn exposure
and reduced intellectual function. They concluded that in both Bangladesh and the UnitedStates, some children are at risk of Mn-induced neurotoxicity. To put the findings of this study in perspective, the strongest correlations to better scores in intellectual function were from those a)with a more educated mother; b) that lived in more adequate dwelling; c) that had access totelevision; d) that were taller; e) that had larger head circumference. Also the average Mnconcentration was high 793 µg/L with the children being put into four groups those withexposure to <200 µg/L, 200 to 499 µg/L, 500 to 999 µg/L and greater than 1,000 µg/L.
©2006 AwwaRF. All Rights Reserved.
7/21/2019 Occurrence of Manganese in Drinking Water and Manganese Control
http://slidepdf.com/reader/full/occurrence-of-manganese-in-drinking-water-and-manganese-control 45/463
19
Epidemiological Studies
An epidemiological study of Mn in drinking water was performed in three communitiesin northwest Greece that use well water (Kondakis et al. 1989). Drinking water Mn
concentrations ranged from 3.6 to 14.6 μg/L (area A), 81.6 to 252.6 μg/L (area B), and 1,600 to
2,300 μg/L (area C). The population of each community ranged between 3,200 and 4,350 people.Study subjects included individuals over the age of 50 drawn from a random sample of 10 percent of all households. Each community was similar with respect to social and dietarycharacteristics. Dietary manganese was not reported in the study, but the authors indicated thatmost of the food was purchased from markets and was expected to be comparable for all threestudy areas. Chemical characteristics of the well water were reported to be within EconomicCommunity (EC) standards with the exception of hardness.
Whole blood and hair Mn concentrations were determined. Whole blood Mn levels were
comparable between the test groups, but Mn in hair was 3.51, 4.49, and 10.99 μg/g dry weightfor areas A, B, and C, respectively. The study showed that lifetime consumption of drinkingwater containing naturally high concentrations of Mn leads to increased Mn retention asdemonstrated by the concentration of Mn in hair. Neurological examinations were alsoconducted that evaluated the presence and severity of 33 neurological symptoms (such asweakness/fatigue, gait disturbances, tremors, and dystonia). Significant differences in the meanneurological scores for the C and A groups were observed. The authors suggested that at Mnconcentrations of approximately 2 mg/L, some neurological impairment might be apparent in people over 50 years of age.
Studies comparing human breast milk and infant formulas have also investigated oral Mn
exposure. Human breast milk is relatively low in Mn (7 to 15 μg/L), whereas levels in infant
formulas are much higher (50 to 300 μg/L) (Collipp, Chen, and Maitinsky 1983). Collipp and
colleagues found that learning-disabled children had Mn concentrations in hair (0.434 μg/g)
significantly greater than those of normal children (0.268 μg/g). Other studies have alsoassociated Mn intake in infants with elevated levels of Mn in hair and learning disabilities inchildren (USEPA 1993, Pihl and Parkes 1977). Although these studies do not demonstratecausality, further investigation of Mn intake by infants and any correlation with learningdisabilities is warranted, as is study of the potential contribution of Mn in drinking water toinfant formula.
Essentiality
Manganese is an essential element to a wide variety of organisms, including bacteria, plants, birds, and mammals. In humans, the divalent manganese ion activates many enzymereactions involved in carbohydrate breakdown and in the metabolism of organic acids, nitrogen,and phosphorus. Typical Western diets contain from <1 to >10 mg Mn per day (Greger 1999)with even higher Mn intake associated with vegetarian diets (USEPA 2004). Mn deficiency is
associated with growth retardation, changes in circulating high density lipid cholesterol andglucose levels, impaired growth, and reproductive failure, as well as ataxia and skeletalabnormalities in neonates (i.e., babies generally less than one month old) (Freeland-Graves andLlanes 1994). Also described were several disease states associated with low levels of serummanganese: epilepsy, exocrine pancreatic insufficiency, multiple sclerosis, cataracts, andosteoporosis. Although these conditions correlate with low manganese serum levels, a causalrelationship has not been demonstrated.
©2006 AwwaRF. All Rights Reserved.
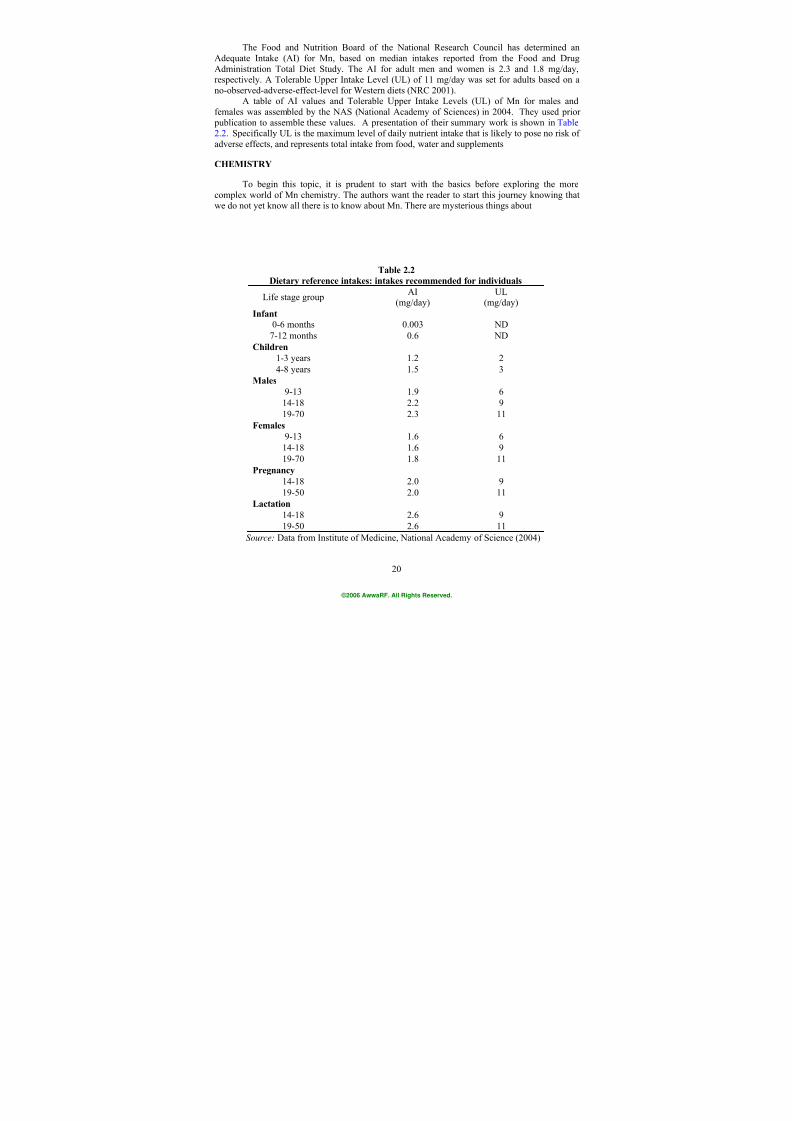
7/21/2019 Occurrence of Manganese in Drinking Water and Manganese Control
http://slidepdf.com/reader/full/occurrence-of-manganese-in-drinking-water-and-manganese-control 46/463
20
The Food and Nutrition Board of the National Research Council has determined anAdequate Intake (AI) for Mn, based on median intakes reported from the Food and DrugAdministration Total Diet Study. The AI for adult men and women is 2.3 and 1.8 mg/day,respectively. A Tolerable Upper Intake Level (UL) of 11 mg/day was set for adults based on ano-observed-adverse-effect-level for Western diets (NRC 2001).
A table of AI values and Tolerable Upper Intake Levels (UL) of Mn for males andfemales was assembled by the NAS (National Academy of Sciences) in 2004. They used prior publication to assemble these values. A presentation of their summary work is shown in Table 2.2. Specifically UL is the maximum level of daily nutrient intake that is likely to pose no risk of adverse effects, and represents total intake from food, water and supplements
CHEMISTRY
To begin this topic, it is prudent to start with the basics before exploring the morecomplex world of Mn chemistry. The authors want the reader to start this journey knowing thatwe do not yet know all there is to know about Mn. There are mysterious things about
Table 2.2
Dietary reference intakes: intakes recommended for individuals
Life stage groupAI
(mg/day)UL
(mg/day)
Infant
0-6 months 0.003 ND
7-12 months 0.6 ND
Children
1-3 years 1.2 24-8 years 1.5 3
Males
9-13 1.9 6
14-18 2.2 9
19-70 2.3 11
Females
9-13 1.6 6
14-18 1.6 9
19-70 1.8 11
Pregnancy
14-18 2.0 9
19-50 2.0 11
Lactation
14-18 2.6 9
19-50 2.6 11
Source: Data from Institute of Medicine, National Academy of Science (2004)
©2006 AwwaRF. All Rights Reserved.
7/21/2019 Occurrence of Manganese in Drinking Water and Manganese Control
http://slidepdf.com/reader/full/occurrence-of-manganese-in-drinking-water-and-manganese-control 47/463
21
how Mn behaves, which can be frustrating to the scientifically minded. A college chemistrytextbook (Bailar et al. 1978) gives some of the basics:
Manganese is widely distributed on Earth and is the eleventh most abundantelement (0.0095%). Its primary ore is the mineral known as pyrolusite, MnO2
·
xH2O. Manganese imparts hardness and strengthens steel and is also used in otheralloys, for example manganese bronze (copper and manganese) and anonconducting alloy (with nickel and copper) called manganin. Manganese is asilvery metal with a slightly pink appearance. It has several allotropic forms thatvary in brittleness and ductility, it corrodes in moist air. Manganese is one of theessential trace elements for both plants and animals, and manganese sulfate isadded to some fertilizers. Compounds are known containing manganese inoxidation states +2, +3, +4, +5, +6, and +7. Compounds in the +3 and +5 statesare not common. Manganese is most stable in its +2 state, Mn(II). Mn(IV) oxide,or manganese dioxide, MnO2, is the most abundant ore from which compounds ofthe metal are obtained. Stoichiometric1 manganese dioxide is extremely rare, if itexists at all. Analysis of the material found in nature as well as of that prepared inthe laboratory shows a Mn to O ratio of 1 to 1.85 (approximately). X-ray analysis
shows that this material has the crystal structure calculated for puremanganese(IV) dioxide, but that several percent of the oxygen atoms are missing,leaving holes in the crystal lattice. Oxides ions from adjacent sites are able tomove into these holes, thus leaving new holes; this process makes the oxideconductive. It is both the oxidizing power and conductivity of manganese(IV)oxide that makes it valuable in dry cell batteries. The most interesting aspect ofmanganese chemistry is the behavior of manganese compounds and ions inoxidation-reduction reactions.
Of particular interest in this long reference is that Mn is not a simple element that makesup simple compounds. It can change oxidation states and therefore chemical properties. The
solid form of Mn oxide is also an oxidizing agent and a cation exchange agent, not an inert solid.Then if one puts this complex element into real settings the chemistry gets even more complex.For example, Bratina says that although Mn is a minor chemical constituent of marine water andfreshwater, the oxides of manganese may play a pivotal role in aquatic geochemical cycles. Thecentral role for manganese oxides is due to their remarkable surface area and charge distribution,which make them a potentially rich reservoir of adsorbed metals. Hydrous manganese oxides areoften present in amorphous or microcrystalline forms which have surface areas as high as 300m2/g. (Bratina et al. 1998). Post (1999) writes that “because Mn oxide minerals commonly occuras coatings and fine-grained aggregates with large surfaces areas, they exert chemical influencefar out of proportion to their concentration.” He adds because of the large tunnels in todorokite(common mineral of Mn) it is of interest for use as a catalyst and as a cation exchange agent.
Also for another one of the common minerals, birnessite; the “birnessite-group minerals havelayer structures and readily undergo oxidation reduction and cation-exchange reactions and playa major role in controlling groundwater chemistry.”
1 Stoichiometry is the branch of chemistry that deals with the proportions of chemical analysis. Astoichiometric molecule of MnO2 means that there are two atoms of oxygen for each atom of Mn. Nonstoichiometricmeans that the molecule is not actually in those exact proportions.
©2006 AwwaRF. All Rights Reserved.
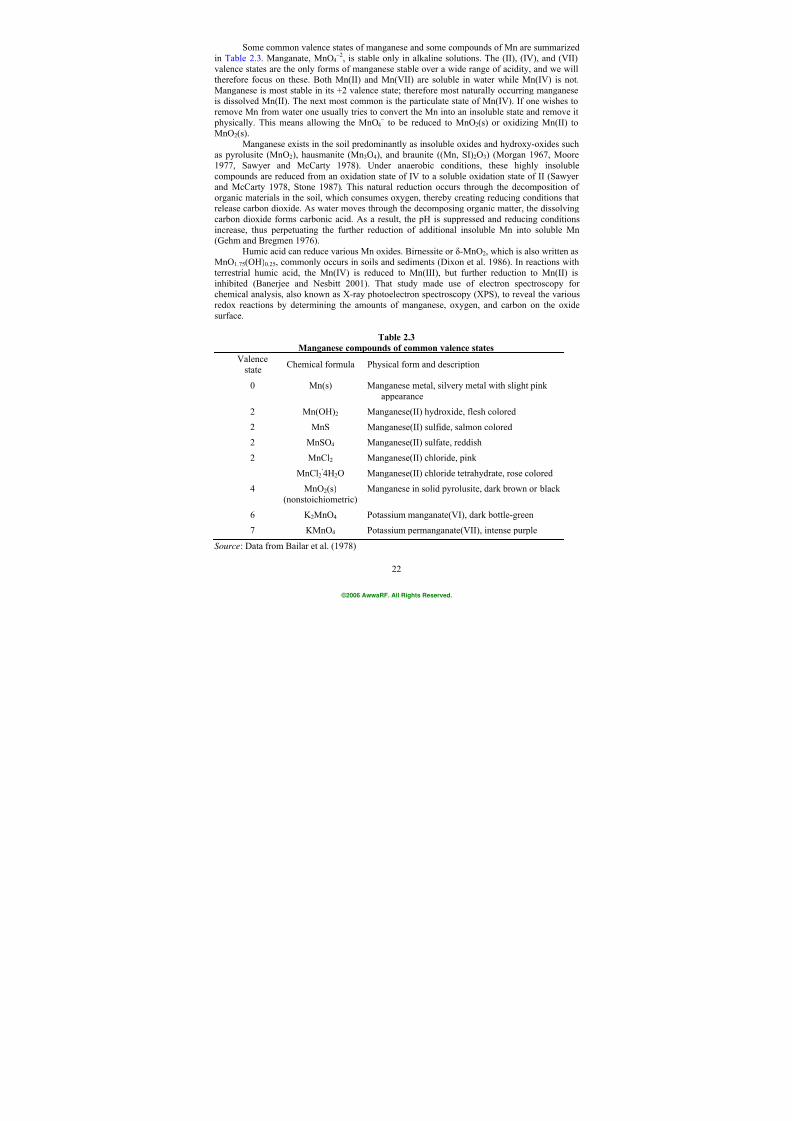
7/21/2019 Occurrence of Manganese in Drinking Water and Manganese Control
http://slidepdf.com/reader/full/occurrence-of-manganese-in-drinking-water-and-manganese-control 48/463
22
Some common valence states of manganese and some compounds of Mn are summarizedin Table 2.3. Manganate, MnO4
–2, is stable only in alkaline solutions. The (II), (IV), and (VII)valence states are the only forms of manganese stable over a wide range of acidity, and we willtherefore focus on these. Both Mn(II) and Mn(VII) are soluble in water while Mn(IV) is not.Manganese is most stable in its +2 valence state; therefore most naturally occurring manganeseis dissolved Mn(II). The next most common is the particulate state of Mn(IV). If one wishes toremove Mn from water one usually tries to convert the Mn into an insoluble state and remove it physically. This means allowing the MnO4
– to be reduced to MnO2(s) or oxidizing Mn(II) toMnO2(s).
Manganese exists in the soil predominantly as insoluble oxides and hydroxy-oxides suchas pyrolusite (MnO2), hausmanite (Mn3O4), and braunite ((Mn, SI)2O3) (Morgan 1967, Moore1977, Sawyer and McCarty 1978). Under anaerobic conditions, these highly insolublecompounds are reduced from an oxidation state of IV to a soluble oxidation state of II (Sawyerand McCarty 1978, Stone 1987). This natural reduction occurs through the decomposition oforganic materials in the soil, which consumes oxygen, thereby creating reducing conditions thatrelease carbon dioxide. As water moves through the decomposing organic matter, the dissolvingcarbon dioxide forms carbonic acid. As a result, the pH is suppressed and reducing conditionsincrease, thus perpetuating the further reduction of additional insoluble Mn into soluble Mn
(Gehm and Bregmen 1976).Humic acid can reduce various Mn oxides. Birnessite or δ-MnO2, which is also written as
MnO1.75(OH)0.25, commonly occurs in soils and sediments (Dixon et al. 1986). In reactions withterrestrial humic acid, the Mn(IV) is reduced to Mn(III), but further reduction to Mn(II) isinhibited (Banerjee and Nesbitt 2001). That study made use of electron spectroscopy forchemical analysis, also known as X-ray photoelectron spectroscopy (XPS), to reveal the variousredox reactions by determining the amounts of manganese, oxygen, and carbon on the oxidesurface.
Table 2.3
Manganese compounds of common valence states
Valencestate
Chemical formula Physical form and description
0 Mn(s) Manganese metal, silvery metal with slight pinkappearance
2 Mn(OH)2 Manganese(II) hydroxide, flesh colored
2 MnS Manganese(II) sulfide, salmon colored
2 MnSO4 Manganese(II) sulfate, reddish
2 MnCl2
MnCl2
·
4H2O
Manganese(II) chloride, pink
Manganese(II) chloride tetrahydrate, rose colored4 MnO2(s)
(nonstoichiometric)Manganese in solid pyrolusite, dark brown or black
6 K 2MnO4 Potassium manganate(VI), dark bottle-green
7 KMnO4 Potassium permanganate(VII), intense purple
Source: Data from Bailar et al. (1978)
©2006 AwwaRF. All Rights Reserved.
7/21/2019 Occurrence of Manganese in Drinking Water and Manganese Control
http://slidepdf.com/reader/full/occurrence-of-manganese-in-drinking-water-and-manganese-control 49/463
23
The inhibition was ascribed to the formation of exceptionally strong complexes between Mn(III)and the humic acid, which restricted metal dissolution by blocking access to the oxygen sites onthe oxide surface, along lines postulated elsewhere (Stumm 1995). A similar result was obtainedin studies of the reductive dissolution of δ-MnO2 by oxalate (Banerjee and Nesbitt 1999). Dixonet al. (2006) indicated in their Cooperative Research Center (CRC) report that although they arefairly convinced that Mn(III) also exists in aqueous form, the sensitivity of the availableanalytical techniques is not yet good enough to prove it, or at least not their collectivesatisfaction.
The introduction of the idea of the soluble but oxidized species, i.e. Mn(III), challengesour understanding to date. A presentation at the AWWA WQTC in Quebec 2005 said that theyfound it on filter media. They suggest that Mn oxide covering the filter media in an IOCMEfilter is not solely made of Mn(IV) oxides but is an equilibrium mix of Mn(IV) and Mn(III). TheMn(III) stays adsorbed to the filter media when chlorine is present but that it is replaced bycations like Fe+3 or Al+3 when it is not (Gabelich, et al 2005). An ongoing AwwaRF project2951, with John Tobiason as the PI, is looking into the existence of Mn(III) in IOCME filtermedia as well.
Biochemical Phenomena
The occurrence of Mn in source water supplies is largely dependent on biological activity(Griffin 1960; Wong 1984; Nealson and Myers 1992; Carlson, Knocke, and Gertig 1997; Bratinaet al. 1998). The Mn biogeochemical cycle involves two groups of bacteria, each utilizing adifferent form of Mn. The reducing (often anaerobic) bacteria utilize solid MnO2 in the place ofO2 during respiration. This process releases soluble Mn(II)into the environment. The oxidizing bacteria (e.g. Metallogenium sp.) utilize soluble Mn(II)for energy and produce MnO2 (solid). The precipitated manganese dioxide solid settles to the bottom of the body of water, thus perpetuatingthis cycle.
The direction of manganese cycling depends upon the dissolved oxygen conditions in thewater column. When adequate dissolved oxygen is available, aerobic conditions predominate and
MnO2 is formed and precipitates from the water column. When conditions are anaerobic,Mn(II)is formed and released into the water column.
Understanding the predominant direction of this cycle in a source water supply is vital forcontrolling Mn. Dissolved oxygen levels predict the direction of these reactions. Carlson,Knocke, and Gertig (1997) found that dissolved oxygen levels correlated with total Mn levelsand the partitioning of Mn between dissolved and solid species. They determined that for a particular reservoir supply, at dissolved oxygen levels less than 3 mg/L, dissolved Mn wasdetected, and when dissolved oxygen fell to less than 2 mg/L, Mn levels increased. The degree ofstratification within an impounded water supply is another influential factor. When aerobicmetabolic activity depletes the dissolved oxygen in the hypolimnion (the water immediatelyabove the sediment), Mn enters the water column.
Zaw and Chiswell (1995) reached conclusions somewhat contradictory to theconventional understanding of reservoir phenomena. Typically, manganese in the lower reservoirlevel is predominantly in the soluble form. Using XPS, samples of the North Pine Dam reservoirnear Brisbane, Australia, were analyzed. Oxidized (particulate) manganese, Mn(IV), predominated in the reservoir’s upper layer or epilimnion, whereas both dissolved manganese,Mn(II), and particulate manganese were present in the middle and lower reservoir layers(metalimnion and hypolimnion, respectively). Data presented by Zaw and Chiswell stronglysupported the conclusion that particulate Mn dominates the entire water column.
©2006 AwwaRF. All Rights Reserved.
7/21/2019 Occurrence of Manganese in Drinking Water and Manganese Control
http://slidepdf.com/reader/full/occurrence-of-manganese-in-drinking-water-and-manganese-control 50/463
24
The work done by Bratina et al. (1998) revealed that manganese can be reduced bymicrobes even in oxic regions. The presence of microbes (Carnobacterium) and particulate Mnseemed to be required for this process. Even when thermodynamic stability of Mn(II) or Mn(IV)can be predicted, the change between these states is very slow and often requires a catalyst— meaning that Mn in source water tends to stay in whatever state it is in unless mediated by amicrobial process. Usually the reduction of MnO2 requires direct cell contact with the oxidewhich serves as the terminal electron acceptor, as is the case with Geobacter metallireducens (anobligate anaerobe) and Shewanella putrefaciens (a facultative anaerobe), but MnO2 can also bereduced indirectly by microbial metabolites such as sulfides and organic acids. This is believedto be the case with the genus Carnobacterium, where MnO2 is reduced incidentally more alongthe lines of fermentation (lactic acid) than respiration. The benefit may be that nutrients capturedon the surface of MnO2 are released and become available during reduction.
Overall, Bratina et al.’s (1998) work revealed findings similar to Carlson’s work(Carlson, Knocke, Gertig, 1997) inasmuch as the highest concentration of Mn(II) was in theanaerobic zone below the oxic zone as it would be expected both thermodynamically andmicrobiologically.
Speciation
Speciation of an element is the determination of the individual physicochemical forms ofthat element which together make up its total concentration in a sample. Speciation is sometimesnecessary to understand the fate, toxicity, and biological activity of trace metals and their counterions in natural waters. Techniques used for speciation of Mn may be divided into three maingroups: physical separation, chemical speciation, and computer modeling.
Physical separation techniques are used to separate “soluble” from “insoluble” forms ofMn. Several investigators have described procedures for physically dividing the forms of Mninto operationally-defined size classes by ultrafiltration of water through different filter sizes(Balikungeri, Robin, and Haerdi 1985; Chiswell and Zaw 1991; Laxen, Davison, and Woof1984). Carlson, Knocke, and Gertig (1997) present a fractionation procedure using two filtration
steps, a technique we also used in the current project. The water sample is initially filteredthrough a 0.2-µm filter to remove particulate metal species. The filtrate is then passed through anultrafilter (30,000-Dalton molecular weight cutoff [MWCO]) to separate the colloidal anddissolved species. The ultrafilter MWCO must be small enough to capture the smallest metalcolloid. The optimum ultrafilter pore size can be dependent upon water quality conditions. Mncan form complexes with natural organic matter (NOM) (Borg 1987, Krom 1978). Therefore, theultrafilter MWCO must be large enough to ensure no significant removal of NOM. Ultrafiltrationhas the advantage of being a simple technique to operate but has limitations, including theexpense, the potential for sample contamination, and the possibility of dissociation of largemolecules (Chiswell and Mokhtar 1986, Florence 1982).
By this method three relevant fractions of Mn species can be quantified: particulate,
colloidal, and truly dissolved. (In practice, the initial filtration that separates out the particulateMn leaves a fraction that is called “dissolved,” but which actually consists of both colloidal and“truly dissolved” Mn.) Speciation is done by making three analytical measurements and twocalculations as follows.
©2006 AwwaRF. All Rights Reserved.
7/21/2019 Occurrence of Manganese in Drinking Water and Manganese Control
http://slidepdf.com/reader/full/occurrence-of-manganese-in-drinking-water-and-manganese-control 51/463
25
• Total Mn concentration (by measurement): is all the Mn present in the sample.
• Particulate Mn (by calculation): is solid Mn dioxide that can be filtered out bystandard filtration (e.g. 0.2 µm). Calculated by subtracting dissolved from total.
• Dissolved Mn (by measurement): is the Mn present in the filtrate after standardfiltration.
• Colloidal (by calculation): is the solid Mn dioxide that passed through the 0.2-µm
filter but not through the ultrafilter. Calculated by subtracting truly dissolved fromdissolved .
• Truly dissolved (by measurement): is that which remains in the filtrate afterultrafiltration, and is assumed to be Mn(II).
Chemical speciation measurements of a metal require selective analytical techniques.Very few techniques can respond to only one particular species of an element in solution, andanalytical techniques for chemical speciation of Mn are limited (Chiswell and Mokhtar 1986).
Ion selective electrodes (ISEs) may be constructed that respond only to the Mn(II)(aq).The sensitivity is limited (~0.5 mg/L) and the method is subject to interferences, and suchelectrodes are not generally available commercially.
Anodic stripping voltammetry (ASV) is used to determine the complexation capacity ofnatural waters for manganese (Kalavska 1991, Florence 1982, Chiswell and Mokhtar 1986). Thismethod distinguishes between “labile” and “bound” metal species. Following a sample titration,the bound metal is determined as the difference between total and labile metal and the strength ofthe bound metal-complexes can be determined mathematically. Based on the total amount ofmetal, and the strength of the complexes, a chemical-equilibrium speciation computer programcan be used to more specifically determine the metal’s chemical speciation in the water. Theanalytical technique itself, however, is not species-specific, and is subject to interference byorganic compounds present in natural waters. Potential drawbacks to the use of this method inthe water treatment industry include the amount of time required to perform the analysis (usuallyonly one sample can be titrated per day) and the low ionic strength of fresh water. This method is better suited to marine waters that naturally contain electrolytes (required for anyelectrochemical analysis of a water sample). ASV, as well as potentiometric stripping analysis(PSA) and differential pulse polarography (DPP), have been applied to determine Mn in naturalwaters, but these methods suffer from interferences and are limited in their ability to speciate Mn(Chiswell and Mokhtar 1986).
Electron paramagnetic/spin resonance spectroscopy (EPR/ESR) is an important techniquefor studying the formation of complexes between ligands and a metal ion. Because Mn(II) givesa good EPR spectrum, the technique has been widely used (Chiswell and Mokhtar 1986, 1987;Carpenter 1983), but it is costly and not generally available except in certain researchlaboratories. Ion exchange/chelating columns have also been used to separate Mn(II)(aq) fromcolloidal Mn (Chiswell and Mokhtar 1986, Florence 1982, Kalavska 1991).
Computer modeling to determine Mn speciation based on solubility relationships is possible, but may not bear resemblance to reality (Florence 1982). Modeling is most useful whenapplied to speciation of Mn under equilibrium conditions. A few studies have applied computermodels to seawater speciation (Carpenter 1983; Kumar 1985; Turner, Whitfield, and Dickson1981).
©2006 AwwaRF. All Rights Reserved.
7/21/2019 Occurrence of Manganese in Drinking Water and Manganese Control
http://slidepdf.com/reader/full/occurrence-of-manganese-in-drinking-water-and-manganese-control 52/463
26
ANALYTICAL TECHNIQUES
Inorganic Mn in water may either be analyzed directly, or, if the concentration of Mn istoo low, a concentration step (e.g., evaporation, extraction, and binding to a resin) may benecessary (detection limits ranging from 0.005 µg/L to 50 µg/L). In all cases, acid is added to thesample to prevent precipitation of Mn and adsorption of Mn to the walls of the sample container.
Analytical methods for Mn in water and other environmental samples are summarized in
Table 2.4. The table lists the method name and the “generalized” detection limits which are theMethod Detection Limits (MDLs). The MDL is the lowest possible limit the method can detect.It represents an idealized situation and does not represent normal operating conditions. The termreporting limit (RL) (not used in the table) refers to the lowest level the analyst is able to report.The RL is often taken as the lowest calibration standard but some analysts present the MDL asthe lowest limit even if a particular run was not calibrated down to that level. The term IDL, orinstrument detection limit, is mentioned in the table. This is the lowest limit the instrument can produce and is always lower than the MDL. We chose to use the term “generalized” detectionlimit, because MDL depends on the instrument and the analyst, so it can vary.
Colorimetric methods for manganese oxidize the Mn to permanganate by reagents suchas bismuthate, periodate, and persulphate, and then measure absorbance of the 528-nm charge-
transfer band of permanganate. The method is suitable for determinations in the 50-µg/L range(Marczenko 1986, APHA 1998). Chiswell, Rauchle, and Pascoe (1990) review in detailspectrophotometric methods that use organic color-forming reagents.
Chiswell and O’Halloran (1991) developed a colorimetric method for measurement of
Mn by chelation with the reagent α,β,γ,δ-tetrakis(4-carboxyphenyl)porphine [T(4-CP)P]. Thismethod has a manganese detection limit of 10 µg/L. It has been successfully applied todetermine Mn in lake water and can be used either for batch analysis in the laboratory or in anautoanalyzer unit (Aldridge et al. 1989).
Deutsch, Hoffman, and Ortner (1997) investigated Mn(II) concentrations in rain andsnow samples using a sensitive ion chromatographic (IC) method. A photometric procedure based on the oxidation of Leucomalchite Green (LMG) to Malachite Green (MG) by
permanganate (MnO4 – ) was adapted to a flow-through IC system. A detection limit of 1 µg/LMn(II) was achieved.
Beklemishev, Stoyan, and Dolmanova (1997) developed a catalytic kinetic method tomeasure Mn concentrations in tap and river water. Their analytical method relies on an indicatorreaction that is catalyzed by Mn(II)—specifically, the oxidation of 3,3',5,5'-tetramethylbenzidine[TMB] by potassium periodate [KIO4]—and is carried out on the surface of a paper-basedsorbent. The Mn-containing sample and TMB are preconcentrated onto filter paper, KIO4 isadded to catalyze oxidation, and the absorbance is measured. This technique has a lowerdetection limit (0.005 µg/L) than do other established methods and is transportable, allowing it to be used for rapid field tests.
The American Society for Testing and Materials (ASTM) lists three methods for
determining the concentration of Mn in water (ASTM 2002): AA, direct (flame) (D858–02A);AA, chelation-extraction (using flame or graphite furnace) (D858–02B); and AA, graphitefurnace (D858–02C). An ASTM colorimetric method based on persulfate oxidation wasdiscontinued in 1988. The colorimetric method was published in its entirety in the 1988 Annual
Book of ASTM Standards, Volume 11.01.Determination of Mn levels in soils, sludges, or other solid wastes requires an acid
extraction/digestion step prior to analysis. Method details vary with the specific characteristics of
©2006 AwwaRF. All Rights Reserved.
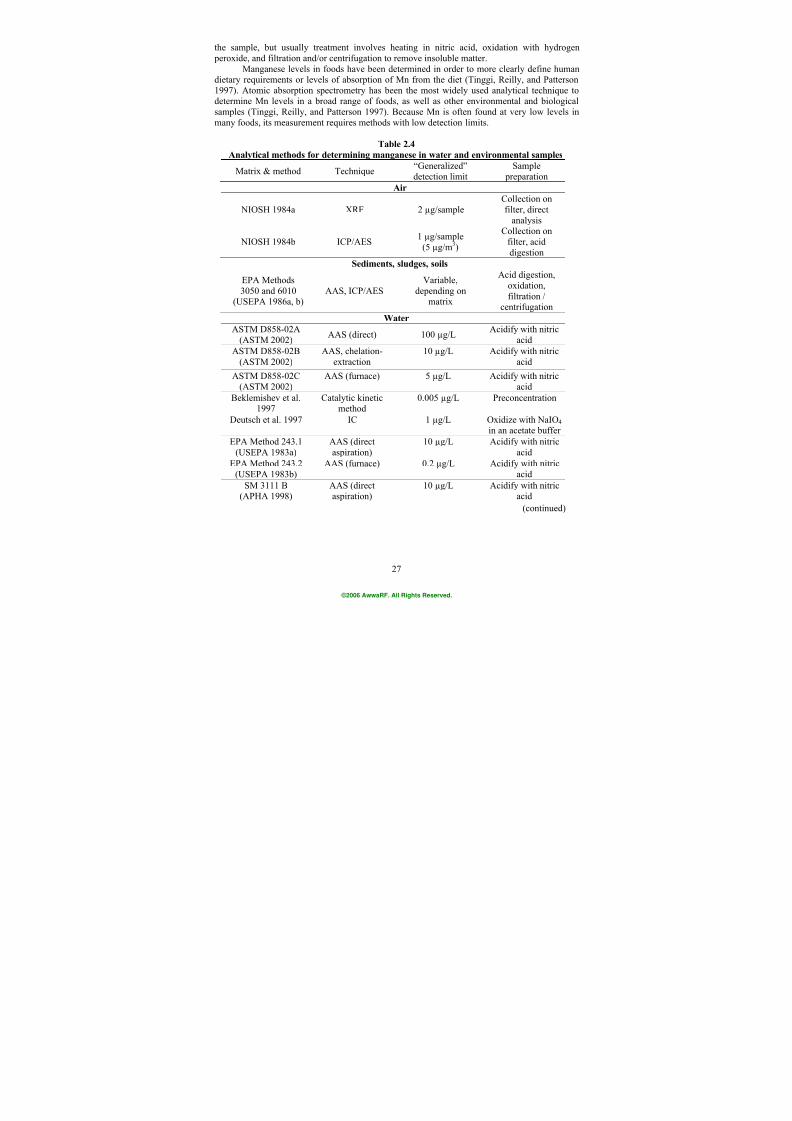
7/21/2019 Occurrence of Manganese in Drinking Water and Manganese Control
http://slidepdf.com/reader/full/occurrence-of-manganese-in-drinking-water-and-manganese-control 53/463
27
the sample, but usually treatment involves heating in nitric acid, oxidation with hydrogen peroxide, and filtration and/or centrifugation to remove insoluble matter.
Manganese levels in foods have been determined in order to more clearly define humandietary requirements or levels of absorption of Mn from the diet (Tinggi, Reilly, and Patterson1997). Atomic absorption spectrometry has been the most widely used analytical technique todetermine Mn levels in a broad range of foods, as well as other environmental and biologicalsamples (Tinggi, Reilly, and Patterson 1997). Because Mn is often found at very low levels inmany foods, its measurement requires methods with low detection limits.
Table 2.4
Analytical methods for determining manganese in water and environmental samples
Matrix & method Technique“Generalized”detection limit
Sample preparation
Air
NIOSH 1984a XRF 2 µg/sampleCollection onfilter, direct
analysis
NIOSH 1984b ICP/AES 1 µg/sample(5 µg/m
3)
Collection onfilter, aciddigestion
Sediments, sludges, soils
EPA Methods3050 and 6010
(USEPA 1986a, b) AAS, ICP/AES
Variable,depending on
matrix
Acid digestion,oxidation,filtration /
centrifugation
Water
ASTM D858-02A(ASTM 2002)
AAS (direct) 100 µg/LAcidify with nitric
acid
ASTM D858-02B(ASTM 2002)
AAS, chelation-extraction
10 µg/L Acidify with nitricacid
ASTM D858-02C(ASTM 2002)
AAS (furnace) 5 µg/L Acidify with nitricacid
Beklemishev et al.1997
Catalytic kineticmethod
0.005 µg/L Preconcentration
Deutsch et al. 1997 IC 1 µg/L Oxidize with NaIO4 in an acetate buffer
EPA Method 243.1(USEPA 1983a)
AAS (directaspiration)
10 µg/L Acidify with nitricacid
EPA Method 243.2
(USEPA 1983b)
AAS (furnace) 0.2 µg/L Acidify with nitric
acidSM 3111 B
(APHA 1998)AAS (directaspiration)
10 µg/L Acidify with nitricacid
(continued)
©2006 AwwaRF. All Rights Reserved.
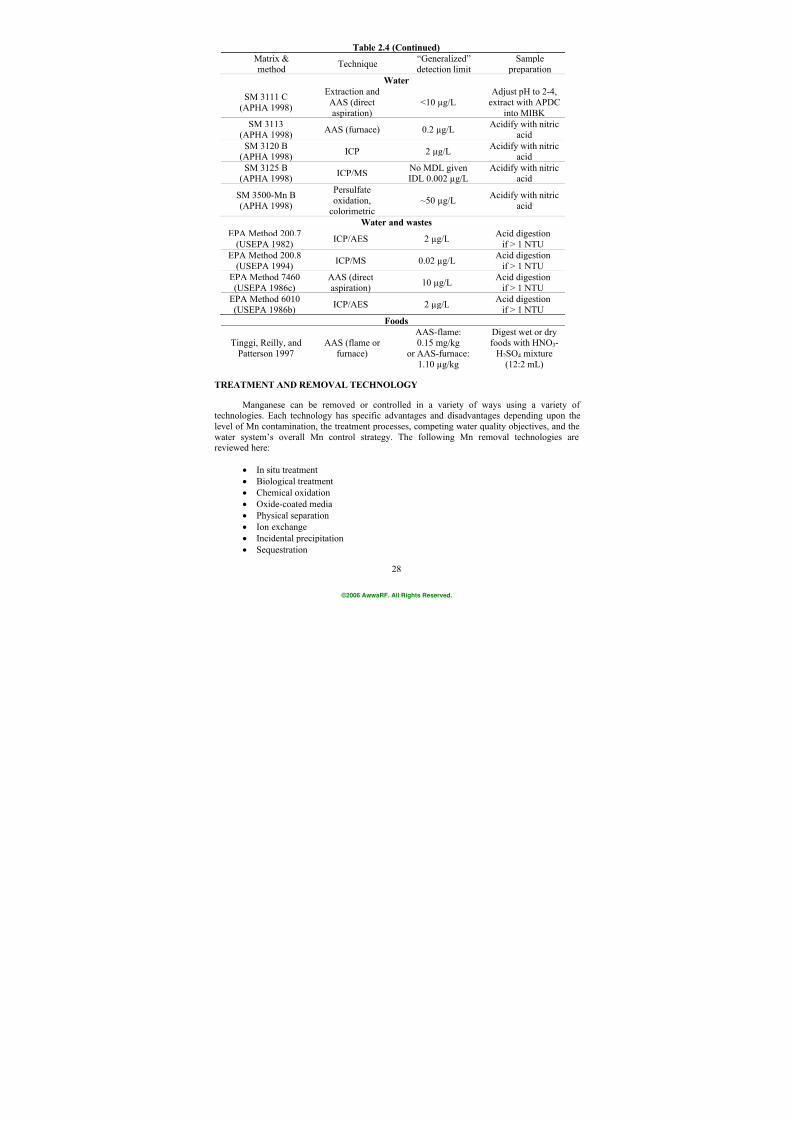
7/21/2019 Occurrence of Manganese in Drinking Water and Manganese Control
http://slidepdf.com/reader/full/occurrence-of-manganese-in-drinking-water-and-manganese-control 54/463
28
Table 2.4 (Continued)
Matrix &method
Technique“Generalized”detection limit
Sample preparation
Water
SM 3111 C(APHA 1998)
Extraction andAAS (directaspiration)
<10 µg/LAdjust pH to 2-4,
extract with APDCinto MIBK
SM 3113(APHA 1998)
AAS (furnace) 0.2 µg/LAcidify with nitric
acid
SM 3120 B(APHA 1998)
ICP 2 µg/LAcidify with nitric
acid
SM 3125 B(APHA 1998)
ICP/MS No MDL givenIDL 0.002 µg/L
Acidify with nitricacid
SM 3500-Mn B(APHA 1998)
Persulfateoxidation,
colorimetric~50 µg/L
Acidify with nitricacid
Water and wastes
EPA Method 200.7(USEPA 1982) ICP/AES 2 µg/L Acid digestionif > 1 NTU
EPA Method 200.8(USEPA 1994)
ICP/MS 0.02 µg/LAcid digestion
if > 1 NTU
EPA Method 7460(USEPA 1986c)
AAS (directaspiration)
10 µg/LAcid digestion
if > 1 NTU
EPA Method 6010(USEPA 1986b)
ICP/AES 2 µg/LAcid digestion
if > 1 NTU
Foods
Tinggi, Reilly, and
Patterson 1997
AAS (flame or
furnace)
AAS-flame:0.15 mg/kg
or AAS-furnace:1.10 µg/kg
Digest wet or dryfoods with HNO3-
H2SO4 mixture(12:2 mL)
TREATMENT AND REMOVAL TECHNOLOGY
Manganese can be removed or controlled in a variety of ways using a variety oftechnologies. Each technology has specific advantages and disadvantages depending upon thelevel of Mn contamination, the treatment processes, competing water quality objectives, and thewater system’s overall Mn control strategy. The following Mn removal technologies arereviewed here:
• In situ treatment
•
Biological treatment
• Chemical oxidation
• Oxide-coated media
• Physical separation
• Ion exchange
• Incidental precipitation
• Sequestration
©2006 AwwaRF. All Rights Reserved.
7/21/2019 Occurrence of Manganese in Drinking Water and Manganese Control
http://slidepdf.com/reader/full/occurrence-of-manganese-in-drinking-water-and-manganese-control 55/463
29
In Situ Treatment
In situ treatment is a process by which Mn is encouraged to remain in an oxidized formso that it does not become mobile. The idea is to control Mn issues by preventing Mn fromentering the treatment facility or well.
Aeration of surface water sources, aeration of ground waters, and adsorption andoxidation are effective in situ treatment technologies for Mn. Though slow, rates of Mn(II)
oxidation observed in natural waters are typically orders of magnitude faster than the rate ofMn(II) oxidation in homogeneous solutions. The enhanced rate of Mn(II) oxidation in naturalwaters is thought to be due to bacterial oxidation. Davies and Morgan (1989) note that thecatalytic effect of metal oxide surfaces may also be important. They examined the rates ofoxidation of Mn(II) to Mn(III) and Mn(IV) in the presence of goethite, lepidocrocite, silica, andalumina, using a surface complex formation model to describe adsorption of Mn(II) to the oxidesurfaces. All of these solids were found to enhance the rate of Mn(II) oxidation.
Aeration
Aeration techniques can be a beneficial surface water management practice for Mn
(Bernhardt 1967; Geney 1986, 1988, 1992; van der Tak, Snyder, and Martens 1992). Reservoirscan periodically experience episodes when anaerobic conditions are present in the bottom layerof the impoundment and excessive levels of soluble iron and manganese can be released into thewater column. Chiswell (1998) reviews Mn speciation in surface reservoirs, noting that artificialaeration prevents the introduction of soluble Mn spikes into the raw water of the treatment plant,as long as the intake is above the aeration depth. Chiswell et al. (1992) examined Mn overseveral years in a number of dams and streams, using electron paramagnetic resonance (EPR)spectroscopy and selective-pore-size membrane filtration techniques. They concluded thatvirtually all of the soluble manganese is present as simple Mn(II) ions; manganese complexationdoes not appear to play a major role in freshwater chemistry.
Hickman et al. (2001) reported on lake monitoring at Black Shoals reservoir in Rockdale
County, Ga. from February thru September 2000 relative to iron and manganese concentrationsat three locations and various depths. The reservoir is dimitic. One purpose of the evaluation wasto analyze aeration requirements to alleviate iron and manganese problems associated with thecycling of metals from the sediments. Reservoir turnover in the spring and fall will create serious problems for a prospective treatment. At Black Shoals Lake a properly designed lake aerationsystem might alleviate these surges and provide a uniform influent water quality into thetreatment plant.
The Black Shoals Lake dam was filled in 1998, stores 4,870 million gallons, and has asurface area of 654 acres and an average depth of 23 feet. High iron and manganese are typicallyassociated with anoxic conditions at the water/sediment interface where iron and manganese arereduced from the bottom deposits into the reservoir water. Decaying algae from the reservoir
surface can settle to the bottom, creating an oxygen demand resulting in anoxic conditions.The study reported that when the reservoir was stratified the iron concentration in thehypolimnion was as high as 22 mg/L and the Mn was less than 2.5 mg/L. The highest Mnconcentrations were close to the water/sediment interface. The required oxygen demand for lakeaeration was calculated on the basis of the accumulation rate of chlorine demand. The reservoiroxygen demand was calculated on the basis that each 1 mg/L of chlorine demand is equivalent to0.226 mg/L of oxygen demand. The total calculated oxygen required by Black Shoals Lake wasapproximately 5,200 kg O2/day. The study recommended hypolimnion aerators of the Twin Full-
©2006 AwwaRF. All Rights Reserved.
7/21/2019 Occurrence of Manganese in Drinking Water and Manganese Control
http://slidepdf.com/reader/full/occurrence-of-manganese-in-drinking-water-and-manganese-control 56/463
30
Lift design. The total installed cost was estimated to be $2.5M, with maintenance at $65,000 peryear and operation at $100,000 per year.
Hypolimnetic Systems
Conventional diffused aeration systems use rising air bubbles to pump low-oxygen bottom water to the surface so that natural re-aeration processes can occur. Hypolimnetic
aeration systems allow aeration of the low dissolved oxygen layer without disturbing the naturalstratification of the reservoir. Hypolimnetic systems may be used to aerate water within the sametemperature gradient, thereby preventing mixing of the thermal layers. Alternatively, lake
aeration systems such as the SolarBee® may be used to provide aeration as well as mixing of thewater body, thereby maintaining dissolved oxygen levels throughout the water column. Utilitiesthat correctly size and operate these aeration systems can benefit from improved Mn control,frequently realize benefits in control of taste and odor problems as well, and can dramaticallyreduce treatment chemical costs. Van der Tak, Snyder, and Martens (1992) suggested that lakeaeration can be an effective control measure for Mn, but all areas of the sediment/water interfacenear the drinking water supply intake must be adequately aerated.
While successful in some instances, reservoir aeration should not be viewed as a panacea
for manganese problems. Chiswell and Mokhtar (1990) reported that installation of a reservoiraeration system in the Hinze Reservoir near Brisbane, Australia, destratified the reservoir andindeed changed the nature and concentration of Mn in the water column. However, based on twoyears of testing, reservoir destratification with air was found to increase the concentration of Mnin the water column and was more of a detriment than a benefit. Jung (2004) of the East BayMUD in California has also been tracking the use of a hypolimnetic oxygenation system (HOS)in that agency’s Upper San Leandro and Sobrante reservoirs for three years. The HOS delivers asmall flow of oxygen (not air) under pressure, at the bottom of the reservoir. The system wasinstalled to control algae that were causing taste and odor (T&O) problems, with Mn control being incidental to that. The system is successful in creating saturated and supersaturated DOlevels within the reservoir, and the amount Mn entering the water treatment plants is lower than
in the two years prior to installation. It effectively reduced the T&O (blue-green) algae, but in thesecond year of operation, it seems to have created an environment that favored filter-cloggingalgae (Cratium). East Bay MUD recently reduced the amount of oxygen transferred, so that onlythe lower stratum of the lake is saturated with DO. Clearly, the effectiveness of reservoir aerationfor Mn control will be site specific.
Groundwater in situ
Water systems with wells drawing groundwater containing soluble Mn can have production capacity losses. Zienkiewicz (1985) reported on the Vyredox method for removingMn from groundwater at the source, in the ground, before the water is drawn to the well. This is
an in situ method that works by raising the redox potential in the ground around a well with periodic recharges of aerated water using specially engineered conditioning equipment andrecharge wells. Oxygen in the recharge water acts as a catalyst to begin a biochemical reactionthat transforms Mn from its soluble form to insoluble compounds that are kept in the groundaway from the well. Braester and Martinell (1988) described and formulated mathematically the phenomena involved in the Vyredox process, including flow, transport, chemical reactions, and bacteriological processes.
©2006 AwwaRF. All Rights Reserved.
7/21/2019 Occurrence of Manganese in Drinking Water and Manganese Control
http://slidepdf.com/reader/full/occurrence-of-manganese-in-drinking-water-and-manganese-control 57/463
31
Biological Treatment
Biological treatment for Mn is essentially a filtration process that takes advantage of theoxidizing ability of certain bacteria and their ability to assimilate Mn. Usually applied as a pretreatment for wells, this process attempts to promote the selective growth of beneficial bacteria. Since the bacteria are aerobic the technology employed is simply a surface to grow onand air to make sure there is oxygen in the water. The oxidized metal must be later removed by
physical separation or by removal of bacteria that have accumulated the metal.Biological filtration processes are not typical in the United States, but they are common
in Europe. The first facilities for the biological removal of iron and manganese were built inGermany more than 100 years ago (Charlottengurg, in 1874) and in the United States (AtlanticHighland, NJ, in 1893) (O’Connor 1971).
Large bacterial populations can be established in filters that oxidize iron and manganeseand precipitate the metals in the surrounding filter medium. These processes are generally rapid,occurring more quickly than physical/chemical treatment processes. The cost of a biologicaloxidation plant may be considerably less than the cost of a conventional chemicaloxidation/filtration system, and pilot studies are typically conducted to demonstrate theeffectiveness of the process for a particular water (Larson 1995; Yannoni, Kinsley, and Marston
1999).Bacteria capable of removing Mn include Sphaerotilus, Leptothrix, Crenothrix,
Siderocapsa, Siderocystis, Hyphomicrobium, and Metallogenium (Mouchet 1992). Theseorganisms remove Mn through the following processes: (1) intercellular oxidation by enzymaticaction, (2) adsorption of dissolved Mn at the surface of the cell membranes, and (3) extracellularoxidation by catalytic action of excreted polymers (Czekalla, Mevius, and Hanert 1985;Schweisfurth 1972; Ghiorse 1984; Gounot, Di Ruggiero, and Haroux, C. 1988; Rittmann andSnoeyink 1984; Sokolova-Dubinina 1979; Vandenabeele et al. 1992). Sphaerotilus and Leptothrix transform Mn(II) to Mn(IV) (Mulder and van Veen 1983). Generally, thesemanganese dioxide precipitates have better structures than those produced by physical-chemical processes and are more likely to be removed in the filter (Czekalla, Mevius, and Hanert 1985;
Tuschewitzki and Dott 1983; Hatva et al. 1985).Specific operating conditions are required to establish the necessary microbial
populations to successfully remove Mn as follows: (1) full aerobic conditions must prevailwithin the biofilter, (2) dissolved oxygen levels must be greater than 5 mg/L, (3) the pH must be7.5 or greater, and (4) a redox potential of 300 to 400 mV must be achieved (Mouchet 1992). Ifnecessary, the water should be aerated in pretreatment to produce appropriate dissolved oxygenlevels. In addition, the source water must not contain substances toxic to the bacteria, includingchlorine (from pretreatment of backwash water), hydrogen sulfide (levels must be less than 0.01mg/L), heavy metals, ammonia nitrogen, phosphates, organics, or hydrocarbons (Sommerfeld1999).
Iron can also be removed through biological processes, although the operating conditions
differ from those for Mn removal (Cameron 1996, Sommerfeld 1999). Bacteria commonly usedfor iron removal are Gallionella, Leptothrix, Crenothrix, and Siderocapsa. Operating conditionsrequire (1) pH between 6.5 and 7.2
2 (2) dissolved oxygen levels of 5 to 25 mg/L, and (3)
temperatures of 10° to 25oC. The same toxicity restrictions apply for the iron- and manganese-removal bacteria. Generally, if both iron and manganese bio-removal processes are used, they are
2 Seemingly contradictory, pH above 7.2 generally does not adversely affect removal, the mechanism ofremoval may change from biological to chemical.
©2006 AwwaRF. All Rights Reserved.
7/21/2019 Occurrence of Manganese in Drinking Water and Manganese Control
http://slidepdf.com/reader/full/occurrence-of-manganese-in-drinking-water-and-manganese-control 58/463
32
done in tandem with the iron-removal stage first. Typical treatment protocol would have initialaeration with biological filtration for iron removal, secondary aeration and pH adjustment, biological filtration for Mn removal, and finally appropriate post-treatment such as disinfection.According to Smith (1993), who visited such plants in Europe, German plants typically add asmuch oxygen as possible to enhance Fe removal. In France, utilities try to zero in on a veryspecific range of dissolved oxygen, usually below saturation. The German biological processmay verge on chemical process as a result of all the oxygen that is added, while the French istruly biological. In the specific plants visited by Smith the metal loading was much higher inGermany than France. When establishing a biological filtration process for Fe removal the biofilm was established and stable within days. However, when developing one that would alsoremove Mn, the startup time was much longer—weeks to months. It seemed to take longer forthe correct bacteria to be of a sufficient population to be effective.
Bouwer and Crowe (1988) suggested that biological Mn removal is closely associatedwith nitrification. Both nitrifying and Mn-oxidizing bacteria obtain similar amounts of freeenergy from their respective oxidants, both use oxygen as an electron acceptor and carbondioxide as a carbon source, and they may be expected to have similar growth rates (Rittmann andSnoeyink 1984). Because of these similarities, the conditions that permit nitrifiers to accumulatemay also allow Mn oxidizers to accumulate as well.
Shorney et al. (1998) reported on pilot studies of enhanced Mn removal in a biologicallyactive filter at the Lincoln, Neb., water system. The treatment plants used aeration andchlorination combined with sand filtration at one plant and in-line filtration with ozone and dualmedia filtration at a second plant. Mn had been an ongoing issue and the utility set a goal of 20µg/L in the treated water. However, meeting this goal has been a challenge at the sand filtration plant, and pilot plant studies were subsequently conducted at both treatment plants. A method forcontrolling oxidation/reduction environments within a biologically active filter was developed bymaintaining a continuously regenerated oxide-coated surface for trace soluble Mn control in theupper layer of the filters and simultaneously maintaining biological activity for AOC control inthe lower layer of the filters. The Mn removal by filtration was improved by chlorine addition.As the chlorine dose was increased, up to a maximum of 1.4 mg/L as Cl 2, more Mn was
removed. However, as the chlorine dose increased, microbial activity decreased. The sourcewater Mn at the two plants varied from 30 µg/L to over 140 µg/L, and the goal of 20 µg/L wasmet using chlorine alone. At a lower chlorine dose (0.3 mg/L) the Mn removal was reduced butthe biological activity in the pilot filter was not totally compromised. A portion of the upper filtermedia was precoated with manganese oxide by soaking in a solution of 100 mg/L of potassium permanganate for over 20 hours. The precoating yielded effective Mn removal in the absence ofchlorine addition during the three months of pilot testing without affecting microbial activity inthe lower filter layers.
Schulz et al. (1999) reported on a series of pilot plant tests at Lake Havasu City, Ariz.The groundwater supply for Lake Havasu City contains Mn between 1.0 and 1.2 mg/L. Pilot plant studies were conducted related to the construction of a new 26-mgd treatment plant
designed primarily for Mn, but also in anticipation that the wells may eventually be deemedunder the direct influence of surface water. Processes evaluated included manganese greensandfiltration, electromedia filtration, biological filtration, and ozone followed by low head automatic backwash filters. The target level of Mn during the study was 0.05 mg/L, which was achieved byall the processes. However, the biological Mn process (IDI Mangazur) had the lowest 15-yearcycle cost for a 26-mgd facility. The estimated construction cost for the plant was estimated to be$0.50/gallon with supporting facilities.
©2006 AwwaRF. All Rights Reserved.
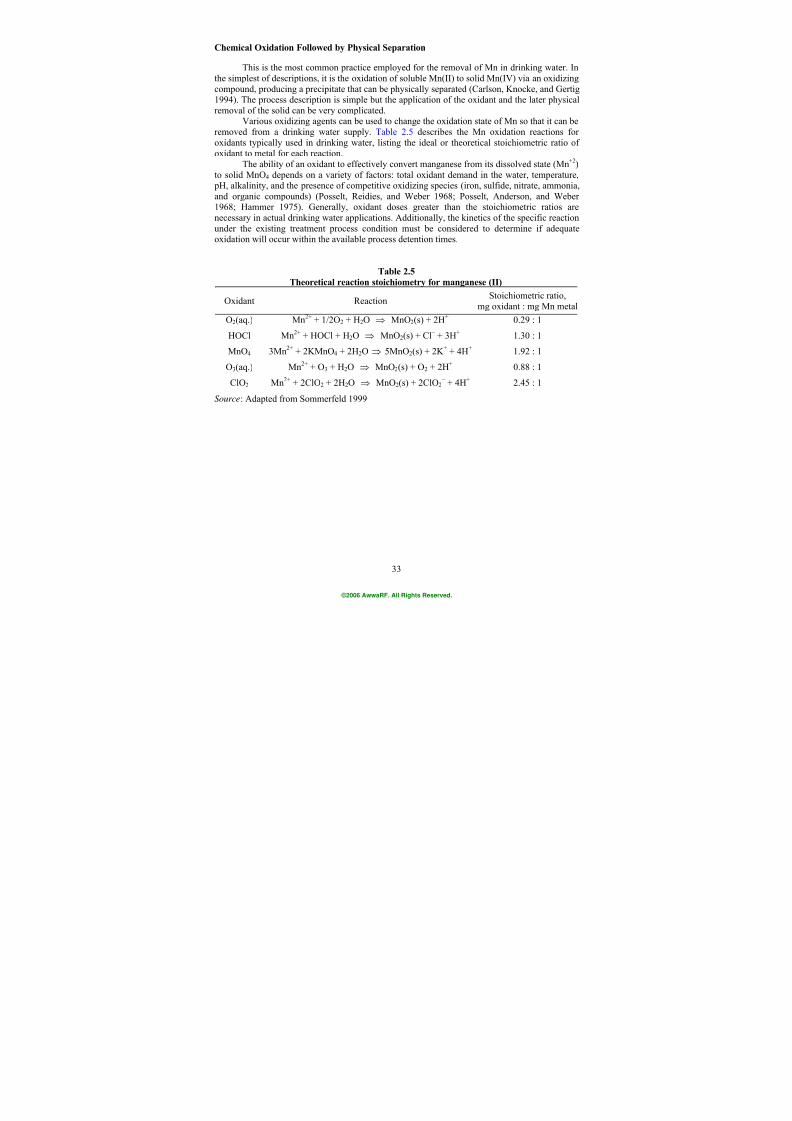
7/21/2019 Occurrence of Manganese in Drinking Water and Manganese Control
http://slidepdf.com/reader/full/occurrence-of-manganese-in-drinking-water-and-manganese-control 59/463
33
Chemical Oxidation Followed by Physical Separation
This is the most common practice employed for the removal of Mn in drinking water. Inthe simplest of descriptions, it is the oxidation of soluble Mn(II) to solid Mn(IV) via an oxidizingcompound, producing a precipitate that can be physically separated (Carlson, Knocke, and Gertig1994). The process description is simple but the application of the oxidant and the later physicalremoval of the solid can be very complicated.
Various oxidizing agents can be used to change the oxidation state of Mn so that it can beremoved from a drinking water supply. Table 2.5 describes the Mn oxidation reactions foroxidants typically used in drinking water, listing the ideal or theoretical stoichiometric ratio ofoxidant to metal for each reaction.
The ability of an oxidant to effectively convert manganese from its dissolved state (Mn+2
)to solid MnO4 depends on a variety of factors: total oxidant demand in the water, temperature, pH, alkalinity, and the presence of competitive oxidizing species (iron, sulfide, nitrate, ammonia,and organic compounds) (Posselt, Reidies, and Weber 1968; Posselt, Anderson, and Weber1968; Hammer 1975). Generally, oxidant doses greater than the stoichiometric ratios arenecessary in actual drinking water applications. Additionally, the kinetics of the specific reactionunder the existing treatment process condition must be considered to determine if adequate
oxidation will occur within the available process detention times.
Table 2.5
Theoretical reaction stoichiometry for manganese (II)
Oxidant ReactionStoichiometric ratio,
mg oxidant : mg Mn metal
O2(aq.) Mn2+
+ 1/2O2 + H2O ⇒ MnO2(s) + 2H+ 0.29 : 1
HOCl Mn2+ + HOCl + H2O ⇒ MnO2(s) + Cl – + 3H+ 1.30 : 1
MnO4 3Mn
2+ + 2KMnO
4 + 2H
2O ⇒ 5MnO
2(s) + 2K
+ + 4H
+ 1.92 : 1
O3(aq.) Mn2+
+ O3 + H2O ⇒ MnO2(s) + O2 + 2H+ 0.88 : 1
ClO2 Mn2+
+ 2ClO2 + 2H2O ⇒ MnO2(s) + 2ClO2 – + 4H
+ 2.45 : 1
Source: Adapted from Sommerfeld 1999
©2006 AwwaRF. All Rights Reserved.
7/21/2019 Occurrence of Manganese in Drinking Water and Manganese Control
http://slidepdf.com/reader/full/occurrence-of-manganese-in-drinking-water-and-manganese-control 60/463
34
The following equations depict the three-step reaction process for the oxidation of Mn inwater. This reaction is neither a first- nor second-order reaction but rather an autocatalyticreaction. The final reaction step is pH-dependent.
Mn(II) + O2 ⇒ MnO2(s) (slow) (2.1)
Mn(II) + MnO2(s) ⇒ Mn(II)·MnO2 (fast) (2.2)
Mn(II) MnO2 + ½O2 ⇒ 2MnO2(s) (very slow) (2.3)
The kinetics of oxidation are very important. Knocke et al. (1990) did seminal work inthis area and presented information about the kinetics of oxidation, mostly in the bulk water phase. However, the concentrations of Mn used to do this research were higher than one mightfind typically, so Gregory and Carlson (2003) conducted research using lower concentrations ofMn. They found that the reaction kinetics were even slower than Knocke predicted. They alsofound that for ozone, when the initial Mn concentration was low (60 and 200 µg/L) a finalresidual of <10 µg/L was not achievable and in many cases permanganate was formed.
Because of its adsorptive properties, manganese dioxide accelerates the removal ofMn(II) from solution and causes the mixed oxide to form. It is the presence of this manganesedioxide on filter media that makes the removal of Mn(II) during oxide-coated media filtration soeffective. Later in this chapter there will be a more detailed discussion of this process.
The presence of organic material can complicate the oxidation and removal of Mn. Theorganic matter influences Mn oxidation through one or more of the following three strategies:
• Changing the nature of the oxidant
• Changing the speciation of the metal
• Competition with the metal for the oxidant
Aeration can be an effective oxidation process for iron removal, but it is generally noteffective for oxidation of Mn (Griffin 1960, Stumm and Lee 1961). It is possible to oxidize Mn by air, but that is a slow process and requires alkaline pH conditions above 9.5 (Morgan andStumm 1964, Weber 1972). Highly alkaline conditions are not prevalent in most drinking watertreatment processes, except in water-softening operations, which require highly alkaline pHconditions.
Raveendran, Ashworth, and Chatelier (2001) evaluated alternative methods for oxidizingand removing Mn from the South Gippsland Region Water Authority (SQRWA) in Australia,which owns and operates 10 water treatment plants that experience reoccurring Mn problems.Methods examined included aeration, chlorine, sodium hypochlorite, and potassium permanganate. The researchers concluded that reservoir aeration might be considered as primarytreatment, but would likely not oxidize all of the reservoir Mn and that oxidizing agents wouldstill be required at the treatment plants. Potassium permanganate as an oxidizing agent was foundto be very effective for converting soluble Mn to the insoluble form, but if the source-water Mnconcentration fluctuated significantly, adjusting the permanganate dose was operationallydifficult. High pH, above 8, resulted in improved Mn removal by subsequent filtration, but alumcoagulation at the higher pH would be difficult. SGRWA found adequate Mn removal when theyraised the pH up to 7.5 to 8.0 with a detention time of 10 minutes before alum addition.
Once adequately oxidized from a soluble form to an insoluble form, Mn can be removedfrom water by physical separation. In cases where there is a large enough quantity of Mn, asignificant percentage of it is removed by settling. That which is not removed by settling (orclarification in general) is removed by filtration. Complications occur in these unit processes
©2006 AwwaRF. All Rights Reserved.
7/21/2019 Occurrence of Manganese in Drinking Water and Manganese Control
http://slidepdf.com/reader/full/occurrence-of-manganese-in-drinking-water-and-manganese-control 61/463
35
when sludges and backwash waters are recycled and Mn reenters the treatment process. Also,under certain conditions, the particulate Mn formed is not easily removed by filters and it passesthrough. There is also the simple matter of filter capacity. The filer may only be able to hold somuch Mn and may require backwashing on the basis of Mn loading as opposed to other moretypical scenarios.
The following discussion reviews details of chemical oxidation using various differentoxidizers.
Chemical Oxidation by Chlorine
Chlorine oxidizes Mn much less efficiently than it oxidizes iron. Alkaline pH conditionsand dosages well above the stoichiometric requirements are needed to produce effective rates ofMn oxidation (Griffin 1960; Knocke, Hoehn, and Sinsabaugh 1987; Knocke et al. 1990). Mn(II)oxidation is extremely slow under neutral or acidic pH conditions.
Hao, Davis, and Chang (1991) reported on the mechanism of soluble Mn oxidation to theinsoluble Mn(IV) form with chlorine. Experimentally, ratios of chlorine to Mn(II) of 0.8 to 3.8were investigated. At an experimental pH of 8, the time for Mn(II) to convert to MnO 2 wassignificantly reduced as the ratio of chlorine to manganese increased. However, even at a
chlorine to manganese ratio of 3.8, over 100 minutes was required for 1.0 mg/L of Mn(II) to befully oxidized. The rate of Mn oxidation greatly depends on the pH of the solution, and mostimportantly on the dose of chlorine. A model was developed based on homogenous Mn(II)oxidation and heterogeneous Mn(II) adsorption/ oxidation onto MnO2. The addition of MnO2 accelerated the oxidation of Mn(II), as did excess chlorine.
Knocke et al. (1990) found that even at dosages 4 times greater than stoichiometricrequirements for free chlorine, a minimum of a 3-hour contact time was necessary to achieve thereduction in the soluble Mn concentration from 1.0 mg/L to 0.7 mg/L at pH 7.0. When pH wasincreased to 9.0, Mn(II) was effectively oxidized within 1 hour to below the SMCL of 0.05mg/L. Temperature also influences Mn(II) oxidation. When temperature was reduced from 25°Cto 14°C, comparable Mn(II) oxidation was not possible even if reaction time was increased by a
factor of three or four.Knocke, Hamon, and Thompson (1988) also observed that the presence of fulvic acids
inhibited the rate of Mn(II) oxidation by free chlorine. However, effective removal was stillobserved at a pH of 9.0 and dissolved organic carbon (DOC) concentrations up to 5.0 mg/L.Manganese removal is significantly enhanced when free chlorine is used in combination withoxide-coated filter media (Weng, Hoven, and Schwartz 1986; Knocke, Hamon, and Thompson1988).
For facilities that do not practice breakpoint chlorination and maintain a chloramineresidual as the preoxidant, Mn removal is generally not effective. The oxidation rate ofchloramines is too slow to be useful in water treatment processes for the removal of Mn(Kawamura 2000).
Chemical Oxidation by Potassium Permanganate
Potassium permanganate has diverse applications in drinking water treatment to controltaste and odor, remove iron and manganese, function as a bactericide and algaecide, andregenerate greensand or pyrolusite filter beds (Humphrey and Eikleberry 1962, Spicher andSkrinde 1963, Ficek and Waer 1993). Potassium permanganate was recognized in the 1960s as being a general and economical solution to the problem of iron and manganese removal
©2006 AwwaRF. All Rights Reserved.
7/21/2019 Occurrence of Manganese in Drinking Water and Manganese Control
http://slidepdf.com/reader/full/occurrence-of-manganese-in-drinking-water-and-manganese-control 62/463
36
(Robinson, Breland, and Dixon 1967). Typical permanganate dosages range from 0.5 to 2.0 ppm(as KMnO4) depending on the oxidant demand in the source water and the available contact time.Potassium permanganate has been demonstrated to oxidize a wide variety of substances underacid, neutral, or alkaline conditions (Kolthoff and Belcher 1957). This list includes sulfide,sulfite, thiosulfate, cyanide, iron, manganese, chromium, and numerous organic compounds suchas organic acids, alcohols, aldehydes, ketones, phenols, and some nitrogen compounds.Permanganate does not, however, oxidize ammonia to nitrogen or nitrogen oxides.
For Mn control, Knocke et al. (1990) established permanganate effectiveness over a widerange of temperature and pH conditions. More importantly, the rate of permanganate oxidation issignificant for the detention times observed in drinking water treatment facilities. For a pH rangeof 5.5 to 9.0, Mn oxidation by permanganate at 105 percent of the stoichiometric requirement forMn(II) occurs within 60 seconds (temperature 25°C and <1.0 mg/L DOC). When the temperaturewas reduced to 7°C at pH 5.5, complete oxidation of Mn occurred within 60 seconds and at 2°Cit occurred within 120 seconds. These researchers also indicated that the presence of DOC (up to10 mg/L) decreased the rate of Mn(II) oxidation, but it was still relatively short (<1–2 minutes)at 25°C and pH 7.0.
The use of potassium permanganate to oxidize and remove Mn(II) must be preciselyoptimized, and the applied permanganate must completely oxidize the source water Mn(II)
without allowing excess permanganate to be present. If excess permanganate is present in awater that has little to no oxidant demand, it may persist through the drinking water treatment process. The permanganate, Mn(VII), will then later reduce to Mn(IV) allowing MnO2(s) to beformed in or pass into the distribution system. Usually the presence of a filter media will allowfor the presence of an adsorption surface and this usually controls the passage of Mn. Howeverwhen Carlson, Knocke, and Gertig (1994) were trying to optimize KMnO4 addition for soft, lowTOC waters (i.e., waters with low oxidant demand), they found Mn was able to pass through thefilters. They noted that the destabilization of colloidal MnO2(s) is influenced by Ca
2+
concentration and therefore oxidized Mn will pass through the filters more easily in soft waters.Knowing that oxidation and removal of Mn in low-hardness, low-alkalinity, and low-pH
waters can be difficult, Lauf (1995) developed a mathematical model to predict optimum
conditions for Mn removal. It is based on the filterability index (FI) concept. The FI is definedas the ratio of the time required to filter 200 mL of treated water to the time required to filter 200mL of deionized water using a 0.22-micron filter for both. The closer the FI is to 1, the morefavorable the Mn removal. Major factors affecting the FI are the oxidant dose, initial Mnconcentration, pH, hardness, coagulant dose, and coagulant type. For low-hardness waters,knowing the fraction of dissolved Mn will enable optimization of potassium permanganate. Insoft waters, adding calcium may aid in Mn oxidation and removal.
An additional benefit of using potassium permanganate in the pretreatment of drinkingwater is that it can also oxidize certain THM precursors (Colthurst and Singer 1982). Themanganese dioxide precipitate that is generated by the reduction of permanganate can adsorbTHM precursors.
Ballantyne et al. (2002) considered alternative measures to reduce Mn levels in theDistrict Municipality of Muskova MacTier treatment plant in Ontario, Canada. The conventionaltreatment plant (flash mixing, flocculation, sedimentation, filtration) treating the MacTierreservoir water could not reduce the Mn levels to acceptable levels. The raw water Mn was about0.44 mg/L and plant could only lower the Mn to about 0.38 mg/L. Manganese in the treatedwater created black water and discoloration problems in the distribution system. A study wasconducted to determine the cause of the Mn problems and evaluate potential changes to thetreatment process that would eliminate system problems. These included elevated pH and
©2006 AwwaRF. All Rights Reserved.
7/21/2019 Occurrence of Manganese in Drinking Water and Manganese Control
http://slidepdf.com/reader/full/occurrence-of-manganese-in-drinking-water-and-manganese-control 63/463
37
aeration and/or oxidation with the chemicals available at the MacTier treatment plant. Thesechemicals were chlorine, air (aeration), lime, and carbon dioxide. Potassium permanganate,which was not available at the plant, was only to be considered if other available treatmentoptions were not successful.
Bench-scale tests were conducted from September to November 2001. Aeration of theraw water prior to conventional treatment did not help in the removal of Mn unless very longoxidation times (over 60 minutes) were provided. This was considered to be uneconomical. Theraw water TOC averaged 5.3 mg/L during the study. Pre-chlorination was evaluated but achlorine dose of 10 mg/L was necessary to oxidize the Mn to acceptable levels. The highchlorine dose, however, created unacceptable disinfection byproduct levels and was notconsidered an acceptable alternative. Alkaline conditions at pH values over 10 did not improvethe removal of Mn in the conventional treatment process. Potassium permanganate was tested ata dose of between 0.25 mg/L and 4.0 mg/L. Potassium permanganate was the only oxidant thatcould substantially reduce Mn levels and it was able to reduce raw water Mn from 0.36 mg/L toless than 0.05 mg/L in bench-scale tests. The permanganate dose also had a distinct effect on theresidual color in the treated water.
Chemical Oxidation by Ozonation
Ozone used in preoxidation for water treatment processes allows the removal of inorganiccompounds such as iron and manganese (Seby et al. 1995). The extremely fast kinetics of ironoxidation result in the preferential oxidation of uncomplexed Fe(II) over Mn(II) (Stoebner andRollag 1981, Knocke et al. 1990). Although ozone may be utilized for iron and manganeseoxidation, ozonation is not frequently practiced due to greater capital costs than other availablemethods, as well as the risk of completely oxidizing the manganese to permanganate with aresult of pink effluent water.
Netzer and Bowers (1975) discussed the potential for excessive ozone doses to cause theformation of permanganate. Long, Hulsey, and Hoehn (1999) reviewed water quality problemsthat can occur when pre-ozonation is used to oxidize Mn. Most likely, if either oxidized or
reduced Mn concentrations in the raw or settled water exceed 0.1 mg/L, permanganate wouldform at concentrations sufficiently high to create problems, especially if the ozone dosages arehigh enough to achieve pathogen inactivation.
Knocke et al. (1990) found that ozone oxidized uncomplexed Mn(II) more effectivelythan organically complexed Mn(II). Additionally, ozone oxidation occurred more effectivelyunder acidic conditions than basic. They found that although alkalinity conditions did notsignificantly influence the rate of Mn(II) oxidation, pH was a factor in the decomposition ofozone. They found that the concentration of soluble Mn decreased at pH 5.13 for the first 60seconds, but at pH 6.35, there was no additional decrease in soluble Mn after 30 seconds. Nowelland Hoigne (1987) also found that Mn reacts directly with ozone and is not an initiator ofhydroxyl radicals. The decomposition of ozone is initiated by hydroxide ions (Hoigne and Bader
1977, Staehelin and Hoigne 1983). An increase in pH increases the rate of ozone decay, therebyreducing the effective ozone dose.
Seby et al. (1995) studies the reactivity of ozone and Mn over a wide pH range. Theycharacterized oxidized Mn species as permanganate ion at pH = 2, and manganese dioxide at pH= 4 to 8. They also said that it was difficult to determine species because of secondary reactions,the main one being the interaction between indigo (used to determine ozone concentration) andMnO2, which will oxidize the indigo and return to Mn(II).
©2006 AwwaRF. All Rights Reserved.
7/21/2019 Occurrence of Manganese in Drinking Water and Manganese Control
http://slidepdf.com/reader/full/occurrence-of-manganese-in-drinking-water-and-manganese-control 64/463
38
In pilot studies at Snowbird, Utah, Nieminski and Evans (1995) found that an ozone doseof 2 mg/L, contacted with the water for 1 minute prior to filtration, was optimum for iron andmanganese removal from 0.4 mg/L and 40 µg/L, respectively, to below detection limits. Studiesat Moscow, Idaho, found that ozone doses varying from 2.8 mg/L to 8.8 mg/L would be neededto oxidize Mn concentrations ranging from 0.5 mg/L to 1.2 mg/L, with a reaction time of at least30 seconds (Furgason and Day 1975a, 1975b). Ozonation was found by Domonkos and Varszegi(1994) to be the best alternative for the Budapest Waterworks to oxidize iron and Mn using anozone dose of 0.9 to 1.2 mg/L with a hydraulic residence time of 7 to 8 minutes.
Oxidation of Mn(II) by ozone was inhibited by the presence of humic materials (Paillardet al. 1989, Knocke et al. 1990, Reckhow et al. 1991). Knocke et al. (1990) determined that therequired ozone dose ranged from 2 to 5 times the theoretical stoichiometric ratio if humic carbonwas present. These increases were due to competition between the Mn and the humic carbon forthe oxidant. However, Reckhow et al. (1991) found that Mn oxidation by ozone was lessinhibited by the presence of organic carbon than was the oxidation of iron.
These studies also demonstrated that bicarbonate had an influence under humicconditions (Paillard et al. 1989, Knocke et al. 1990, Reckhow et al. 1991). Specifically, Reckhowet al. (1991) and Paillard et al. (1989) said that the inhibition of humic carbon on the oxidation ofMn is reduced at elevated bicarbonate concentrations (0.5 to 4.0 meq/L). Yet the increase in
bicarbonate alkalinity from 50 mg/L to 200 mg/L did not result in acceleration of the Mnoxidation in the absence of organic matter. However, in the presence of organic matter, higher bicarbonate levels created conditions that resulted in more complete oxidation of the Mn after thecomplete decay of the applied ozone. This suggests that bicarbonate ion stabilizes ozone (byquenching the hydroxyl radicals), and thereby lowers the ozone dose required to achieve a givendegree of Mn oxidation, or that more bicarbonate allows for a more stable MnO2 molecule. BothCarlson, Knocke, and Gertig (1994) and Jenkins (1974) demonstrated that Ca
2+ makes a more for
stable MnO2 that is more readily captured by filter media.Gregory and Carlson (2001) studied oxidation of Mn(II) by ozone with respect to natural
organic matter (NOM) and initial Mn(II) concentrations using post-ozonation dissolved Mnresiduals as the metric. For an initial Mn(II) concentration of 200 µg/L, dissolved Mn residuals
<10µg/L were attainable only in the absence of NOM. The presence of NOM complicates theuse of ozone for Mn(II) removal by increasing dosage requirements. Legube et al. (1989) foundthat Mn oxidation by ozone was partially inhibited by fulvic acid, particularly in the absence of bicarbonate ions.
McKnight et al. (1993) preferred application of ozone to the settled water for Mnoxidation. These authors contended that high ozone doses required to oxidize Mn in raw waterapplications are detrimental to coagulation and that oxidized Mn forms a small pinfloc that doesnot settle well and is difficult to remove by filtration. Ozone oxidation practices can provideadditional Mn removal benefits if the application point of ozone is moved from the raw water tothe settled water. Since there is reduced oxidant demand in the settled water, competition isreduced, lower ozone doses can be applied, and the potential to encourage the formation of
pinfloc is reduced. Additional cost savings can be realized by the reduced size of the ozonegenerator and application facilities.
Wilczak et al. (1993) evaluated Mn control during ozonation of water containing organiccompounds. Pilot plant testing of Delaware River water was conducted using four preoxidants(potassium permanganate, chlorine, chlorine dioxide, and ozone) followed by clarification anddual media anthracite-sand filtration. As the ozone dose was increased the formation of MnO2 increased until at high ozone doses (over 3.8 mg/L O3), permanganate was formed, causing acharacteristic pink color. Addition of KMnO4 after ozonation but prior to coagulation
©2006 AwwaRF. All Rights Reserved.
7/21/2019 Occurrence of Manganese in Drinking Water and Manganese Control
http://slidepdf.com/reader/full/occurrence-of-manganese-in-drinking-water-and-manganese-control 65/463
39
considerably improved the removal of soluble manganese. The application of ozone alone maynot always result in the removal of soluble Mn to acceptable levels.
O’Brien et al. (1996) reported on removal of Mn using ozone oxidation and polymer-assisted filtration. The research was conducted at the 50-mgd Lincoln, Neb., treatment plant,which draws water from wells along the Platte River. The plant process includes ozonationfollowed by dual media filtration. Although the plant consistently produces water with Mn lessthan 0.050 mg/L, distribution system problems and consumer complaints persisted. Anionic andnonionic filter aid polymers were not successful in helping the removal of Mn in the ozone/dualmedia filtration plant even though the Mn was oxidized into an insoluble form. It was postulatedthat cationic filter aids would be more effective since colloidal Mn tends to exhibit a slightlynegative charge. Consequently, the study evaluated the performance of four cationic filter aid polymers that could potentially maintain a filtered water Mn concentration less than 0.020 mg/L.The researchers also investigated the impact of filter media conditioning by presoaking filtermedia in concentrated potassium permanganate and chlorine or by the addition of filter aid polymer during the later stages of backwashing. Applied ozone dose varied from 0.5 to 3 mg/L.Dissolved Mn concentrations were analyzed based on filtering samples through 0.22-micronnylon filter disks. Filter aid polymers were added just prior to the pilot filters after ozonation.The study concluded that staining problems were experienced in Lincoln even when the Mn
standard of 0.05 mg/L was met. A level of 0.020 mg/L was necessary to control consumer problems from staining. Addition of a cationic filter aid polymer improved filter performance inremoving Mn, but there was no significant difference in the four cationic filter polymers tested.
Research was conducted at the Philadelphia Water Department (PWD) into using ozoneto achieve Cryptosporidium inactivation (Kim et al. 2001, CDM 2000). Results of this studyindicated that when ozone was applied at levels required to meet the anticipated inactivation, Mnconcentrations were lower through biologically active filters (i.e., no applied chlorine) than whenno ozone was applied. However the use of ozone did not always controlled Mn to below theSMCL of 0.05 mg/L. Control of Mn was best achieved with chlorine. Also the old media filtercontrolled Mn better than the new media filter in all cases. This encouraged PED to conductmore studies into the control of Mn.
Kohl, Kim, and Charlton (2002) examined the limitations of ozone for removing Mn incomparative studies at PWD. Ozone, without the addition of any chlorine prior to filtration, wasnot able to control the source water Mn down to the utility’s goal of 0.015 mg/L. Ozone didchange the nature of the total Mn from primarily “dissolved” to a “particulate” form. Filtereffluent Mn was in dissolved form, implying that Mn(IV) was entering the filter while onlyMn(II) left the filter.
Other conclusions from the PWD research suggested that the low doses of ozone requiredfor 3-log Giardia inactivation were generally not effective for Mn control (unable to produce Mnoxides) and that the hydraulic residence times tested in the ozone contactors had little effect onMn removal. At the higher doses of ozone (1.5 mg/L), Mn was effectively controlled in colderwater (less than 12°C), but not when the water temperature exceeded about 18°C. As source
water TOC increased, the Mn removal efficiency, using only intermediate ozone decreased.Chlorine applied to the filter performed better for Mn removal than intermediate ozonation alone.The researchers concluded that ozone as a replacement for filter-applied chlorine may not beviable.
Lefebvre and Deguin (1997) examined bromate ion formed by oxidation of watercontaining bromide ion, along with the removal of triazines and/or Mn. Under identicalconditions of ozonation, BrO3
– formation was specific for each water and depended on parameters such as total organic carbon, UV absorbance at 254 nm, applied ozone, and ozone
©2006 AwwaRF. All Rights Reserved.
7/21/2019 Occurrence of Manganese in Drinking Water and Manganese Control
http://slidepdf.com/reader/full/occurrence-of-manganese-in-drinking-water-and-manganese-control 66/463
40
residual. Mn oxidation by ozone appeared to be achieved without high bromate formation.Indeed, the presence of Mn hindered BrO3
– formation.
Chemical Oxidation by Chlorine Dioxide
Chlorine dioxide can be used in drinking water treatment for disinfection, DBP reduction,and taste and odor control as well as oxidation of Mn(II) and subsequent removal of manganese
dioxide (Griffin 1960). The mechanism of oxidation of Mn by chlorine dioxide is similar to itsoxidation by potassium permanganate (Knocke et al. 1990). Reaction rates for oxidation withchlorine dioxide are similar to permanganate. Rates increase when pH increases and decrease inthe presence of organic carbon. When humic carbon is present, improved Mn(II) oxidation isobserved when the pH is increased. Temperature <10°C is a limiting factor to Mn oxidation(Knocke, Hoehn, and Sinsabaugh 1987).
In the presence of reduced Mn, chlorine dioxide is not completely reduced to chloride ion(Cl
– ); rather, it is only reduced to chlorite (ClO2
– ). When the oxidative capacity is limited in this
manner, a transfer of only one electron rather than five occurs. The Stage 1 D/DBP Rule(USEPA 1998c) sets an MCL for chlorite at 1.0 mg/L. Because only a small portion of theoxidizing capacity of chlorine dioxide is utilized in this reaction, the stoichiometric dosage for
Mn(II) oxidation is very high (Table 2.4) and the application of chlorine dioxide for Mn(II)oxidation is limited (Knocke et al. 1990).
Chemical Oxidation by Hydrogen Peroxide
Knocke et al. (1987, 1990) found that no reaction occurred between Mn(II) and hydrogen peroxide over the pH range of 5.5 to 8.5.
Oxide-Coated Media
Manganese Greensand
Manganese greensand is a purple-black granular filter medium processed from glauconitesand. Glauconite is synthetically coated with a thin layer of manganese dioxide, MnO2(s). Thesecoated sand particles have a distinct green color, thus the name greensand. Glauconite media hasan effective size of 0.30 to 0.35 mm, a uniformity coefficient of less than 1.60, and a specificgravity of approximately 2.4 (Sommerfeld 1999).
Prior to use, greensand must be conditioned by soaking in a potassium permanganate orchlorine solution. This strong oxidizing solution converts the manganous ion (Mn2+) surfacecoating into manganese dioxide, MnO2(s). Once greensand filters are appropriately conditioned,manganese and iron removal occurs through both filtration and adsorption. Generally, it takesseveral weeks of operation for new greensand filters to achieve optimum removal efficiencies(Wormald and Clark 1994). Greensand filters are best applied in groundwater systems with iron
and manganese concentrations below 5 mg/L. The capacity of greensand for manganese is about0.09 pounds per cubic foot, and the amount of potassium permanganate required for regenerationis 0.18 pounds per cubic foot. Greensand loading rates should be between 3 to 5 gpm/sf with backwash at 8 gpm/sf. Maximum pressure drop across the media should be kept to less than 6 to8 psi to avoid degradation of the greensand (Griffin 1960).
Richards and Foellmi (1985) found through pilot testing that chemical oxidation with both chlorine and potassium permanganate followed by manganese greensand pressure filters,that were continuously regenerated, was the most cost-effective treatment process for Mn
©2006 AwwaRF. All Rights Reserved.
7/21/2019 Occurrence of Manganese in Drinking Water and Manganese Control
http://slidepdf.com/reader/full/occurrence-of-manganese-in-drinking-water-and-manganese-control 67/463
41
removal at Hibbing, Minnesota. The source water at Hibbing which is in the heart ofMinnesota’s iron mining region had elevated Fe and Mn. The full-scale Mn removal operationwas fairly large with an average treatment of 1.9 MGD and a design maximum of 3.2 MGD.
The operation of a greensand treatment facility typically involves the use of an oxidant prior to filtration, which is referred to as continuous regeneration. Iron and manganese that have been oxidized into insoluble forms are removed by physical filtration mechanisms. Mn that hasnot been oxidized into an insoluble form is adsorbed onto the MnO2(s) surface of the greensand particle. If potassium permanganate is used as the oxidant, proper dosage must be applied so thatexcess residual does not pass through the filter and cause an effluent that is pink in color.
In the process termed “intermediate regeneration,” preoxidation occurs with aeration,which is only effective for iron. The particulate iron is removed by filtration, with the remainingdissolved Mn adsorbed onto a fully regenerated MnO2(s) coating. Intermediate regeneration practices have an advantage when raw water constituents, such as organic carbon, ammonia, andhydrogen sulfide, interfere with the preoxidation or filtration processes for Mn removal(Sommerfeld 1999).
A third operational mode using greensand involves oxidation of iron by aeration,followed by a chlorine feed at a sufficient dose to continuously regenerate the Mn coating on themedia. Manganese is then removed by adsorption. In this mode, the chlorine feed must
adequately control both the continuous regeneration of the media and meet the other chemicaldemands of the water to provide the desired free chlorine residual in the filter effluent.
Regardless of the mode of operation, the manganese oxide material acts as a catalyst providing the necessary oxygen for the oxidation reaction of soluble iron and manganese. Theremoval mechanisms involved in greensand applications are both adsorption and oxidation. Afterthe initial removal of Mn from the water by absorption of the divalent species, the sloweroxidation process (Equation 2.3) occurs. Removal rates are 0.01 pound of Mn(II) and 0.13 poundof Fe(II) per cubic foot of filter media and the removal capacity increases with increasingsolution pH (Moore 1977).
Pyrolusite
Manganese and iron can also be removed from solution by adsorption on a packed bed ofgranular pyrolusite (McGhee 1991). Pyrolusite is the mineral form of MnO2(s). It is mined in theUnited States, Australia, Brazil, and South Africa. The ore is crushed into specific sizes neededfor filters used in potable water treatment. Since the individual pieces of pyrolusite media areactually MnO2, it is not necessary to develop a manganese dioxide coating on the media particlesas is required with greensand-type filters.
Pyrolusite filters are typically a blend of pyrolusite and sand. The range of this blend isfrom 10% pyrolusite / 90% sand to 50% pyrolusite / 50% sand (percent by volume (Sommerfeld1999). The necessary ratio of pyrolusite to sand will depend on the levels of iron and manganesethat need to be removed from the raw water. Depending upon source water quality, aeration can
be used to remove unwanted gases (hydrogen sulfide) and to oxidize iron. Typically, chlorine isfed at a sufficient level to keep the pyrolusite continuously regenerated. If preoxidation withchlorine is not desired due to minimizing disinfection byproduct formation, intermediateregeneration practices are used and regeneration occurs when chlorinated water is used for filter backwash.
Since pyrolusite has a high specific gravity (approximately 4.0), pyrolusite filters requirehigher backwash flow to fluidize the bed and provide necessary cleaning. Generally, air scour isalso used in the backwash to adequately clean these filters. Since this media does not have a
©2006 AwwaRF. All Rights Reserved.
7/21/2019 Occurrence of Manganese in Drinking Water and Manganese Control
http://slidepdf.com/reader/full/occurrence-of-manganese-in-drinking-water-and-manganese-control 68/463
42
simple coating of manganese dioxide, air scour during backwash can provide excellent resultswithout significant changes to the particle size, shape, or removal capacity. Air scour also aids inkeeping the pyrolusite and sand a homogenous mixture.
A benefit to the use of pyrolusite media is that comparatively higher filtration rates are possible with this application. Generally, filtration rates associated with greensand processes arelimited to 3 to 5 gpm/sf, but with pyrolusite, filtration rates of 10 to 15 gpm/sf have beenachieved (Odell and Cyr 1998). The increased filtration rate reduces filter size and constructioncosts.
Induced Oxide-Coated Media Effect (IOCME)
Soluble Mn may also be removed by absorption onto manganese oxide-coated filtermedia, with subsequent oxidation by free chlorine. Dr. Knocke termed the “induced greensandeffect.” For various reason this research team used the term induced oxide-coated media effect.
The rate of soluble Mn(II) uptake on Mn oxide-coated media is increased with anincrease in the number of sorption sites, increased solution pH, and the presence of free chlorine(Knocke, Hamon, and Thompson 1988; Knocke, Occiano, and Hungate 1990). Davies andMorgan (1989) examined the rates of oxidation of Mn(II) to Mn(IV) in the presence of goethite,
lepidocrocite, silica, and alumina. Goethite and lepidocrocite are oxides of iron. Adsorptiveuptake of Mn(II) on each of these substances depended greatly on pH, it rapidly increases withincreasing pH over a narrow range. The half-life for adsorption was generally less than 5minutes. However, the kinetics of Mn(II) adsorption are rapid compared to rates of Mn(II)oxidation, which generally are very slow (half-life greater than 60 minutes).
Removal of soluble Mn(II) by Mn oxide-coated media has been found to be a dependabletechnique under a wide range of filter influent conditions (Hargette and Knocke 2001). There aretwo potential modes of operation for an oxide-coated filter: (1) intermittent regeneration and (2)continuous regeneration. In the intermittent regeneration mode, the filter media adsorbsdissolved Mn in the absence of a strong oxidant. The adsorptive capacity is periodicallyregenerated by the addition of chlorine or potassium permanganate. With continuous
regeneration, free chlorine is continuously applied to oxidize the adsorbed Mn to the insolublemanganese dioxide form. Merkle et al. (1996, 1997) developed techniques for characterizingsurface coatings of filter media and a process model for soluble Mn(II) removal by oxide-coatedmedia. The model relies on continuous regeneration of filter media with free chlorine, andaccounts for Mn removal over a wide range of process variables for both natural and syntheticmedia.
Catalytic oxidation on manganese dioxide–coated filter media has developed as animportant treatment method for Mn removal in both conventional and natural glauconitefiltration plants. Addition of chlorine prior to filtration is a basic premise of catalytic oxidation.However, the increasingly stringent disinfection byproduct regulations coupled with regulatory pressure to reduce the use of free chlorine has motivated utilities to optimize treatment for Mn
reduction, and in some cases seek alternative treatment methods.Charlton et al. (2002) reported on the pilot testing conducted at the PWD relative to
disinfection byproduct control and simultaneous Mn removal. The Mn originates from the sourcewater, from the potassium permanganate added to the source water for algae and T&O control,and from the ferric chloride used as the primary coagulant. Removal of Mn has been effective atPhiladelphia’s full-scale plants because they achieve IOCME by adding chlorine to the settledwater prior to dual media filtration. However, free chlorine increases the formation ofdisinfection byproducts.
©2006 AwwaRF. All Rights Reserved.
7/21/2019 Occurrence of Manganese in Drinking Water and Manganese Control
http://slidepdf.com/reader/full/occurrence-of-manganese-in-drinking-water-and-manganese-control 69/463
43
The pilot testing was conducted over four seasons at Philadelphia’s Baxter treatment plant (drawing from the Delaware River) and simultaneously at the Belmont treatment plant(which draws from the Schuylkill River). At a low pH of about 6.5 (suggested as a target pH forenhanced coagulation), Mn control was not obtained until the chlorine dose was at 0.5 mg/Labove that which was required to achieve breakpoint. Essentially the same result was noted at alower pH of 5.8. Increasing the pH to just over 7 allowed for Mn control at much lower chlorinedoses, as low as 0.5 mg/L below breakpoint. When the water temperature was less than 10oC, theeffectiveness of Mn removal was hampered even when the applied chlorine dose exceeded 1.0mg/L above breakpoint. A relationship was demonstrated between breakpoint chlorination, pH,and manganese removal. Charlton et al (2002) concluded that breakpoint chlorination can beused to establish a balance between disinfection byproduct formation and Mn control.
In addition to influencing the oxidation of manganese in solution, the sorption of Mn(II)onto MnO2(s) has been demonstrated to be pH-dependent (Morgan and Stumm 1964). The ratioof Moles of Mn(II) removed from solution in relation to the Moles of MnO2 already present (as acoating on sand particles) increased from <0.2 at pH 4.5, to 0.5 at pH 7, to 0.8 at pH 8. Theeffect of pH was also observed in filters with large amounts of surface oxide coating (Knocke etal. 1988; Knocke, Occiano, and Hungate 1990). They found that highly oxidized forms of Mn,[MnO1.8(s) to MnO2(s)] of the oxide coating had an increased soluble Mn(II) removal capacity,
which was reduced when acidic pH (<6.5) conditions prevailed. They also found that a decreasein either solution pH or free chlorine concentration in the filter-applied water will adverselyaffect the ability of the surface oxide coating to promote efficient Mn removal.
Coffey, Gallagher, and Knocke (1993) developed models to predict design parametersand operational conditions needed to implement oxide-coated media as a treatment process forsoluble manganese removal. They used two separate models one to predict the continuousremoval of Mn in the presence of free chlorine (continuous regeneration (or Nakanishi) model),and another to predict the eventual breakthrough of soluble manganese without oxidant addition(intermittent regeneration model). The Nakanishi model was found to be helpful for predictingthe removal of soluble manganese. A linear-adsorption isotherm effectively predicts the performance of oxide-coated filters operating in an intermittent regeneration mode and is useful
for treatment plants that cannot apply chlorine continuously to their filter-applied water.
Physical Separation
As mentioned previously, once solid Mn has been formed it must be removed by a physical separation process. In conventional treatment plants this is both the settling basin andthe filter.
Filtration Processes
Oxidized Mn may be removed by granular media filters. Sommerfeld (1996) discusses
the chemistry of Mn removal employing oxidation and/or adsorption followed by granular mediafiltration. Jenkins (1974) derived a mathematical-chemical relationship to predict the mosteffective concentrations of Ca
2+ as a filter aid for removal of colloidal Mn oxides. The
concentration of calcium necessary to cause effective removal of Mn was shown to bestoichiometric with the oxide concentration.
Bratby (1988) described laboratory and pilot studies to define the optimum conditions forMn removal and washwater recovery at the Serra Azul direct filtration plant in Belo Horizonte,Brazil. The inverted sequence of chemical addition of chlorine, ferric chloride, lime, was found
©2006 AwwaRF. All Rights Reserved.
7/21/2019 Occurrence of Manganese in Drinking Water and Manganese Control
http://slidepdf.com/reader/full/occurrence-of-manganese-in-drinking-water-and-manganese-control 70/463
44
to offer definite advantages for Mn oxidation. Neither the use of polyelectrolytes nor therecycling of filter washwater was found to be advantageous.
Dissolved Air Flotation
Although not specifically an iron or manganese removal technique, dissolved air flotationcan remove the precipitates formed following the oxidation of soluble iron and manganese
(Sommerfeld 1999). Dissolved air flotation is generally more effective on waters with low ratherthan high Mn concentrations.
Roscoe (2002) reported on Mn problems at the North East Water (NEW), Australia townsof Benalla, Tungamah, and St. James. Black-water events from Mn were periodically a major problem. At times the Mn concentration in the finished water exceeded the Australian guidelineof 0.1 mg/L. Consumer confidence was diminished as a consequence of the black-water problems.
Until 1998 the town of Benalla was supplied from a surface water reservoir with waterthat only received chlorination. In December 1998 a new treatment plant was commissioned witha capacity of 19 ML per day using dissolved air flotation. The plant used liquid alum as the primary coagulant, LT20 polymer as the flocculation aid, and soda ash for pH correction. The
filtered water was disinfected with chlorine at a residual of 0.2 to 0.5 mg/L. The plant was alsocapable of adding powdered activated carbon, potassium permanganate, and aqueous ammonia.
In October 1999 after 10 months of operation the daily demand on the plant significantlyincreased, causing oxidized deposits of Mn on the supply pipelines to be scoured into thedistribution system, resulting in serious consumer complaints about black water from themanganese. Potential solutions considered by the utility included optimizing the currentcoagulant and aids, pretreatment with potassium permanganate, alternative coagulants, andimplementing different detention times and alternative disinfection treatment and processes. Theaverage raw water Mn concentration at the Benalla plant was 0.08 mg/L with virtually all of theMn passing into the distribution system. After conducting a series of jar tests, potassium permanganate was introduced into the raw water to oxidize the soluble manganese. First the
permanganate was added to the raw water, and then the pH was raised to 8.0 with soda ash,followed by a retention time of 5 to 20 minutes. Subsequently alum was added at a pH of 5.5 to7.5 followed by flocculation and dissolved air flotation. The full-scale plant results were poor. Itwas concluded that a longer oxidation contact tank would be needed which would require majorcapital works improvement.
Additional jar testing on PACl (polyaluminum chlorohydrate) suggested that changingthe coagulant might significantly improve the removal of Mn in the DAF process. Once the full-scale plant change had been implemented, the total soluble Mn was reduced from over 0.08mg/L to less than 0.02 mg/L. Based on both jar tests and full-scale testing, PACl was an effectivecoagulant for removing Mn as compared to aluminum sulfate. The PACl performed 95 percent better than the alum alone even with a preoxidant. The change to PACl produced a treated water
quality well below the Australian guideline of 0.1 mg/L of manganese, and significantly reduced black-water complaints. Additional research is needed to determine exactly how PACl removesMn.
Membrane Processes
Schneider, Johns, and Huehmer (2001) studied the application of oxidation followed bymicrofiltration on three types of surface water: the Eagle River in Colorado, the Tygart River
©2006 AwwaRF. All Rights Reserved.
7/21/2019 Occurrence of Manganese in Drinking Water and Manganese Control
http://slidepdf.com/reader/full/occurrence-of-manganese-in-drinking-water-and-manganese-control 71/463
45
impoundment in West Virginia, and the Alcovy River in Georgia. Preoxidants investigatedincluded chlorine, ozone, hydrogen peroxide, chlorine dioxide, and potassium permanganate.The membranes studied had pore openings of 0.1 and 0.2 µm. The raw water Mn ranged from0.1 mg/L to 0.3 mg/L in the three supplies. Using the appropriate preoxidant, the filtered waterMn could be reduced to less than 0.025 mg/L. No significant difference was reported betweenthe 0.1-µm and 0.2-µm microfilters in terms of Mn concentration in the filtrate. The researchersreported that ozone and chlorine dioxide performed best as preoxidants. Hydrogen peroxide didnot sufficiently oxidize the Mn while chlorine required a reaction time of over 100 minutes forMn oxidation to produce a filtrate less than 0.05 mg/L. These authors concluded thatoxidation/microfiltration is an effective process for the removal of Mn from surface water.
Pilot studies at Lake Havasu City, Ariz., found that ultrafiltration using a membrane witha molecular weight cutoff of 100,000 Daltons was not successful for removing Mn (Schulz et al.1999). No preoxidant was used and the researchers postulated that ultrafiltration might beappropriate if a strong preoxidant was used prior to filtration. During the study the membranesirreversibly fouled.
Iron and Mn may cause problems with reverse osmosis, nanofiltration, andelectrodialysis/electrodialysis reversal membrane systems. However, if the metals are maintainedin a reduced or dissolved state, they cause little problem with reverse osmosis and nanofiltration
systems. Addition of acid prevents metal oxide precipitation that occurs in the presence ofoxygen or at elevated pH
Mann et al. (2002) reported on a comprehensive study at the Sweetwater Authority,Richard A. Reynolds Groundwater Demineralization Facility, National City, Calif. which usesreverse osmosis to treat local groundwater. When certain alluvial wells containing iron andmanganese were used, rapid fouling of the reverse osmosis membranes was experienced. Thealluvial wells contained iron ranging from 0.42 to 2.9 mg/L and manganese from 0.06 to 1.90mg/L. The study investigated the pretreatment processes of oxidation and removal of iron andmanganese by a combination of aeration and low pressure membrane filtration usingmicrofiltration or ultrafiltration in parallel. The study evaluated the operation of the ROmembranes with and without pretreatment. The RO system was designed to treat well water
containing 600 to 800 mg/L of dissolved solids.Aeration was chosen as the oxidation process preceding prefiltration, since air was
expected to oxidize the iron and leave the Mn in solution, and since the use of a chemical oxidantwould require close control and removal of its residuals. The study evaluated prefiltration withmicrofilters having a pore size of 0.1 microns and ultrafilters with a pore size of 0.015 microns.Microfiltration alone could not meet the performance goal of a minimum of 30 days without theneed for cleaning. Ultrafiltration did meet the process and operating requirements after switchingto cross flow operation, adding a sulfuric acid cleaning step, and reducing the flux loading to lessthan 54 gfd. Unexpected water quality variations may cause dramatic fouling of the membranes but test data suggested that aeration followed by low-pressure membrane filtration appeared to be an effective method for the removal of iron and manganese prior to reverse osmosis treatment
(Mann et al. 2002).Iron and manganese can foul electrodialysis/electrodialysis reversal systems because
electrodialysis product water does not pass through the membrane. Provisions must be made inthe pretreatment design to exclude unwanted colloids and organic carbon in the feedwater(Conlon 1990). Electrodialysis feedwater systems normally require pretreatment if the sourcewater contains iron concentrations >0.3 mg/L or manganese >0.1 mg/L. Pretreatment techniquescan include oxidation followed by granular media filtration, oxidation followed by manganesegreensand filtration, or cation exchange softeners.
©2006 AwwaRF. All Rights Reserved.
7/21/2019 Occurrence of Manganese in Drinking Water and Manganese Control
http://slidepdf.com/reader/full/occurrence-of-manganese-in-drinking-water-and-manganese-control 72/463
46
Ion Exchange
The free cations of iron and manganese can be removed using zeolite processes. As waterflows through the zeolite medium, cationic exchange occurs. Backwashing the zeolite, typicallywith a brine solution prepared from sodium chloride (NaCl), removes the iron, manganese, andhardness cations that have accumulated. After regeneration, the zeolite medium is rinsed withclean water to remove residual brine prior to returning the process to service.
The use of oxidation practices prior to zeolite softening is not recommended for iron andmanganese removal because the zeolite process requires the iron and manganese to be in acationic form and not in an oxidized, insoluble form. Additionally, the accumulation of solid ironand manganese oxides can clog and plug the zeolite medium (Sommerfeld 1999).
Incidental Precipitation
Lime (CaO) or soda ash (Na2CO3) treatment is effective for removing both iron andmanganese because it raises the pH to a level at which iron and manganese are insoluble(Ferguson and Given 1976). Softening processes are especially effective for pre-aerated waterswith pH above 9.5 and an alkalinity above 20 mg/L. Manganese will not precipitate at pH less
≤8.8, but at pH 9.4 to 9.8 manganese was removed at 98% to 100% (Kawamura 1991). Sincelime softening is more expensive than other iron and manganese removal processes, limesoftening would typically only be used if significant softening of the water is required in additionto iron and manganese removal (Wormald and Clark 1994, Benefield and Morgan 1990,Sommerfeld 1999).
Aziz and Smith (1992) conducted batch experiments using dolomitic limestone, gravel,and crushed red brick to remove Mn. At a final pH value of 8.5, limestone gave 95% removal ofMn, crushed brick gave 82% removal, and gravel gave about 60% removal. Mn removal usingaeration and settling with no solid media was <15%. The results indicated that rough solid mediaand the presence of carbonate are beneficial in the precipitation of Mn from water. These mediaare low cost and may be suitable for rural water treatment in developing countries. Subsequent
laboratory-scale filtration studies found good Mn removal using limestone media at an input pHof 7 and a manganese concentration of 1 mg/L (Aziz and Smith 1996).
Sequestering Agents
Sequestering can be used to control aesthetic water quality problems associated with Mn.However, sequestering is not a removal technique (Knocke, Hoehn, and Sinsabaugh 1987;Knocke et al. 1990; Carlson, Knocke, and Gertig 1997). Sequestering agents will keepmanganese in a form that generally will not cause consumer problems. Sequestering agentsessentially keep manganese in solution by preventing soluble manganese from oxidizing to aninsoluble form, or by inhibiting colloidal manganese from forming larger colloids.
Use of sequestering agents to control negative aesthetic effects is generally applicable towater containing less than 2 mg/L of iron and manganese (Kawamura 2000). To be effective,iron and manganese must be in the bicarbonate form. Sequestering agents include compoundssuch as sodium silicate, trisodium phosphate, hexametaphosphate, and zinc orthophosphate. The proper dosage of sequestering chemicals must be determined based on water qualitycharacteristics and the manufacturer’s recommendations. A typical hexametaphosphate doserequired to control 1 mg/L of iron would be approximately 2 mg/L. However, the industryapproach is to limit hexametaphosphate doses to 4 mg/L, since it can promote biological growth
©2006 AwwaRF. All Rights Reserved.
7/21/2019 Occurrence of Manganese in Drinking Water and Manganese Control
http://slidepdf.com/reader/full/occurrence-of-manganese-in-drinking-water-and-manganese-control 73/463
47
in the distribution system. Successful use of a sequestering agent will depend on theconcentrations of iron and manganese, the amount of hardness in the water, and the detentiontime through the distribution system.
Polyphosphates can be used as sequestering agents for the control of Mn, as sequestering prevents oxidation. Mn is held in solution so that precipitation in the drinking water distributionsystem is prevented or delayed. Sequestering of iron differs from Mn in that the iron is oxidized(typically with chlorine) to a colloidal ferric form. Sodium silicate or a polyphosphate can beused as an iron sequestering agent to stabilize colloidal iron in a form that is too small to causeany apparent color or turbidity. Sodium silicate, however, has not been successful forsequestering Mn (Sommerfeld 1999).
The use of a sequestering process is only applicable to cold waters, as these agents losetheir dispersing properties in water that is heated or boiled (Kawamura 2000). Another importantissue that must be considered in the use of sequestering agents is that the use of polyphosphatecan increase the nutrient level in the drinking water. Increased phosphate may support theregrowth of bacteria, increase HPC counts, or have an adverse effect on the level of phosphate inthe community’s wastewater discharge. The use of sodium silicate will increase drinking watersodium levels, which may be of concern for individuals on sodium-restricted diets.
Miscellaneous Issues Regarding Treatment Technologies
Changing Process pH
Changing process pH and oxidation practices can have a direct, negative impact on Mnremoval strategies. If Mn is oxidized completely before the coagulation process, effectiveremoval is possible, especially if the MnO2(s) remains stable. However, if Mn is oxidized afterthe coagulation process, the pH depression associated with enhanced coagulation can affect theefficiency of the removal process. The extent that Mn removal is affected is dependent onsolution pH, temperature, oxidant type and concentration, and contact time. If potassium permanganate, chlorine dioxide, or ozone is applied before coagulation, the oxidation rate is fast
enough that complete reaction can occur in the contact time available before coagulation(typically less than 5 minutes) even at pH values as low as 4.5 (Knocke et al. 1990). The impactof the low oxidizing power of chlorine and the short contact time associated with most enhancedcoagulation practices makes Mn removal in the bulk water by chlorine ineffective. Mostconventional water treatment plants have less than 2 hours of chlorine contact time between thecoagulation and filtration processes.
USEPA (1999) provides guidance for the development of a Mn removal strategy withenhanced coagulation. A utility should (1) document Mn concentration and fractionation(particulate, colloidal, and dissolved); (2) identify unambiguous finished water Mn goals; and (3)optimize processes with respect to oxidation, adsorption, and coagulant purity.
Manganese Contamination of Ferric Salts
Manganese contained in many ferric salts that are used in water treatment is also a potential problem in that it can introduce additional Mn beyond what is found in the sourcewater. If a utility switches from low doses of ferric or alum to high doses of ferric, the coagulantitself may significantly increase the amount of dissolved Mn added to the water stream. In anenhanced coagulation study, Mn contamination of liquid ferric chloride resulted in soluble Mnconcentrations up to 0.5 mg/L (Crozes et al. 1996). The greater the amount of Mn in the water
©2006 AwwaRF. All Rights Reserved.

7/21/2019 Occurrence of Manganese in Drinking Water and Manganese Control
http://slidepdf.com/reader/full/occurrence-of-manganese-in-drinking-water-and-manganese-control 74/463
48
stream does not necessarily preclude effective Mn removal, but efficient Mn removal at thereduced pH and lower oxidant conditions typical of enhanced coagulation (one of the reasons forincrease coagulant feed) becomes more difficult. The introduction of Mn via a coagulant is evenmore pronounced for utilities that once used a Mn free product. For these utilities, the Mn is not just increased; it sort of just appears, often taking them by complete surprise. This is discussedin this report’s utility survey, Chapter 4.
Residual Management
Mn removed in sedimentation and filtration processes is ultimately directed to plantresiduals. Mn and iron associated with sludge will be release from sludge blankets if anaerobicconditions develop, which often happens in manually cleaned sedimentation basins, and theresulting total Mn concentration applied to the filters can exceed that in the raw water (Hoehn, Novak, and Cumbie 1987; Trace Inorganic Substances Committee 1987; Cornwell and Lee1993). Release of Mn into the water column is also expected from sludge that accumulates in backwash water holding tanks and other facilities used to hold or handle treatment plantresiduals. An optimized coagulation study conducted in 1996 of a 6.4-mgd surface watertreatment plant in Pennsylvania demonstrated that iron and manganese were released from
coagulation and backwash residuals and that operational difficulties resulted from this release(Casale, LeChevallier, and Pontius 2002).
For drinking water treatment plants that recycle supernatant from clarifiers, holdingtanks, and sludge press facilities, the contribution of Mn from recycled water can be significant.Ibrahim, Crossland, and Dixon (1997) determined levels of Mn in drinking water plant recyclestreams and found 0.07 to 1.90 mg/L in gravity thickener decant and 3.3 to 68.0 mg/L in sludge press decant. Preventing accumulated sludge from turning anaerobic, balancing recycled water toa small portion of the total plant flow, and maintaining adequate Mn oxidation/adsorption practices can minimize recycled manganese impacts.
©2006 AwwaRF. All Rights Reserved.
7/21/2019 Occurrence of Manganese in Drinking Water and Manganese Control
http://slidepdf.com/reader/full/occurrence-of-manganese-in-drinking-water-and-manganese-control 75/463
49
CHAPTER 3
METHODS AND MATERIALS
The research conducted for this study was performed using several different methodssuited to the diverse tasks outlined in Chapter 1. Existing literature was examined, surveys weretaken, field samples were collected and tested, experiments were conducted, and costs were
modeled and analyzed. The methods followed for these tasks are fairly distinct from each otherand are therefore each described separately. This breakdown by research task is also followed forChapters 4 (Results and Discussion) and 5 (Summary and Conclusions), rather than trying to fitthe diverse data sets and task results into one continuous narrative.
The headings in this and the following chapters thus follow the specific tasks completed.The PIs began this research with a literature review, as presented in Chapter 2. The next step wasto collect data using initial and detailed surveys. After the detailed utility surveys, the researchteam collected samples from water utility distribution systems for chemical and physicalanalysis, including quantitative speciation of manganese. Experimental case studies exploredtreatment options for Mn, and a cost analysis explored the fiscal implications of treatment.
LITERATURE REVIEW
The literature review was conducted to update the PIs on current understanding anddevelopments in Mn treatment, occurrence, chemistry, problems, and related areas. The literaturereview also served as a source of utility contacts for the initial survey part of this project.
The techniques used to identify references were primarily database searches, libraryreviews, association inquiries, university sources, personal contacts, and known thesis publications. The searches revealed hundreds of relevant references. The investigators collectedas many as possible (although some were unobtainable) and considered the literature reviewsufficiently complete and current to meaningfully advance the project goals. The lengthy list ofinitial references was narrowed down to identify those articles and documents that provided themost pertinent information. This smaller list of detailed references was read by the PIs,
summarized, and subsequently used as part of the literature review presented in Chapter 2,augmenting previous review efforts.
INITIAL SURVEYS
The initial surveys were conducted to help the researchers determine the depth and breadth of utility experience with manganese issues, problems, and experiences. A manganeseissue is defined as any problem associated with the treatment, sequestration, or occurrence of Mnthat could or does result in a distribution system problem. Distribution problems could be in theconsumers’ homes or associated with the operation of the distribution system, such as flushing.The collection of this information was focused on utilities that had reported Mn problems in the
literature, had constructed a treatment plant to remove Mn, or were known to the PIs as locationswhere Mn was a potential problem.
Identifying Potential Survey Utilities
A list of potential survey utilities was assembled to ensure that we contacted utilities thatwere representative of surface waters and groundwaters; diverse geographical regions; small,medium, and large utilities; and at least one of each of the commonly used Mn control
©2006 AwwaRF. All Rights Reserved.
7/21/2019 Occurrence of Manganese in Drinking Water and Manganese Control
http://slidepdf.com/reader/full/occurrence-of-manganese-in-drinking-water-and-manganese-control 76/463
50
technologies. Both domestic and international input provided the benefit of utility contacts thatwere using different approaches to Mn problems, as well as exposure to new technology.International input was solicited from Canada, Western Europe, Australia, and the UK.
The purpose of the initial surveys was to confirm that the utility had a problem associatedwith Mn, and ascertain the nature of the problem and the approach to mitigation of the problem.The utility location and specific data associated with the interviews were maintained inconfidential files. Consequently, the results of the surveys are presented in this report genericallyand in summarized tables. The list of potential utilities to be contacted for the initial surveys wasgenerated from several sources, as follows.
• Personal contacts. Co-PI Steven Medlar provided a list of 86 utilities having Mnissues that he and others in the consulting firm CDM have worked with in the past.Additional utilities were provided by personal contacts of the project technicaladvisory group (TAG) and project advisory committee (PAC) members. Severaladditional contacts were made through networking at AwwaRF and AWWAconferences.
• Manufacturers’ installation lists. Hungerford and Terry provided an installation listof several hundred facilities around the U.S. that have greensand filters. Several otherwater treatment equipment manufacturers’ Web sites—namely Filtronics, ONDEO(Mangazur biological process), and Osmonics (membrane filtration)—provided thenames of utility installations that were also contacted. Some manufacturers wereresponsive to our requests for installation locations and data, while others werereluctant to provide the information. The purpose of obtaining the information wasneither to judge the appropriateness of the application nor to disclose proprietaryinformation.
• United States Geological Survey (USGS) and United States Environmental Protection
Agency (USEPA) Web sites. The USGS National Stream Water-Quality Monitoring Network (WQN) provides Mn data from river samples throughout the U.S., andvarious USGS published reports present studies of groundwater Mn measurementsfrom test wells. We combined this USGS data with USEPA data to identify likelyutility prospects for the study. The USEPA Safe Drinking Water Information System(SDWIS) Web site lists every public water system; this was searched for potentialutilities along rivers or around aquifers where the USGS data indicated the potentialfor elevated Mn concentrations.
• California manganese occurrence data. The State of California Department of HealthServices has a published list of all utilities in California that have reported a sourcewater Mn concentration greater than 0.50 mg/L from 1994 through 2002. This listincludes 213 systems from 41 counties.
• General Internet search. We used several Internet search engines to find documentscontaining such key words as Mn, treatment, drinking water, etc., as well as specificstate names. This search uncovered many utilities that post their ConsumerConfidence Reports (CCRs) on their Web sites, and was useful in identifying utilitiesin areas of the country where we did not have personal contacts.
• Literature search articles. Several of the articles found in the literature search task ofthis project provided names of specific communities that had Mn in the water or wereusing a specific technology for Mn treatment.
©2006 AwwaRF. All Rights Reserved.
7/21/2019 Occurrence of Manganese in Drinking Water and Manganese Control
http://slidepdf.com/reader/full/occurrence-of-manganese-in-drinking-water-and-manganese-control 77/463
51
Using the above criteria we identified 348 utilities. The project goal was to complete 100initial surveys through direct telephone contact with the utility. Some of the utilities had multiplewater sources or multiple (i.e. discrete) water treatment plants (facilities). Of the 348 potentialutilities, 158 were contacted. Those 158 utilities represented a far greater number of facilities.Therefore if a utility had more than one facility that was determined to have Mn levels justifyingfurther discussion, a separate initial survey was conducted. Each survey represented a discretewater treatment plant. From the 158 participating utilities, we collected 242 initial surveys. Theresults and geographical distribution of the surveys are given in Chapter 4.
The PIs felt that a reasonable representation of Mn occurrence and problems wasobtained using this approach. A secondary purpose of the surveys was to obtain utilityinformation for subsequent detailed interviews. It was not to obtain a representative statisticaldistribution of Mn issues and occurrence in the United States or elsewhere.
Initial Survey Instrument
Based on the investigators’ understanding of Mn in water treatment and from insightgained through the literature search, the PIs conducted a series of meetings and workshops withthe research team to develop the initial survey content and form. The survey was intended to be a
means by which we could gather and normalize available data. The survey was conducted bytelephone using a carefully devised survey protocol designed to elicit useful information in a brief contact and maintain consistency in the types of information gathered from the variousutilities. The information obtained built upon the existing experience of the project teammembers (retrospective data) about Mn issues, problems, occurrence, treatment, and associatedcause-and-effect relationships.
Specific survey questions were designed to gather information concerning source watertype and treatment method used, including chemical addition, individual unit operations,frequency of Mn testing in the raw, finished, and distribution system waters, average minimumand maximum Mn concentrations, and the Mn analytical method(s) used. A copy of the initialsurvey instrument is included in Appendix A. The survey was designed to be completed in less
than 20 minutes, although many took less time. Each utility was asked to provide a copy of itsConsumer Confidence Report or a Web site address to obtain a copy of the report. Survey participants were asked about their willingness to participate in a future, detailed survey, ifrequested.
Five members of the research team were trained by the PIs prior to conducting thesurveys to minimize variance in the survey-taking practices. Completed surveys were punctuallytyped and submitted electronically to the project data manager for entry into a database. Thedatabase served to track task progress as well as being used for data analysis.
Miscellaneous Considerations
Each survey was facility specific. A facility was defined as a treatment plant, chemicalfeed system, or source of supply if no treatment was provided, that had a discrete connection tothe distributions system. For example if a water treatment plant had vastly different treatmenttrains but the combined effluent connected to the distribution system in one place it wasconsidered one facility. If a utility had three separate water treatment plants that connected to anindependent (or somewhat independent) distribution system, then each facility was eligible forthe survey.
©2006 AwwaRF. All Rights Reserved.
7/21/2019 Occurrence of Manganese in Drinking Water and Manganese Control
http://slidepdf.com/reader/full/occurrence-of-manganese-in-drinking-water-and-manganese-control 78/463
52
The sizes of utilities that were surveyed ranged from large utilities serving several millioncustomers to small communities with less than 1,000 people. The size of utility often influencesthe approach to Mn control: large utilities may invest substantially in new unit treatment processes to control source-water Mn, while smaller utilities may choose to add a sequesteringagent post-treatment or find an entirely new water source with low Mn concentrations.
Analysis of Initial Survey Data
After entry into a database, the information gathered from the initial survey wasexamined to determine the typical ranges of source water Mn seen by the utilities and correlatethis with source water type and certain water quality parameters. It was used as the basis forselection of detailed survey participation. The PI’s used it as the initial source to discern theindustry’s general awareness of Mn and the implications of Mn control.
DETAILED SURVEYS
Selecting Utilities for Detailed Surveys
The project PIs and core working group met at least monthly to review completed initialsurveys, and from these surveys, select utilities for further in-depth study. The investigatorslooked for facilities with substantial challenges related to Mn removal problems or occurrence.
As with the initial survey, criteria for detailed survey facilities included fairrepresentation of surface and groundwaters, a breadth of Mn removal technologies, utility size,and geographic distribution throughout the United States.
Detailed Survey Instrument
The detailed survey focused on four specific areas of interest: source water, treatment,distribution system, and customer satisfaction. The source water questions probed specific issuessuch as reservoir turnover or seasonal changes. The treatment questions were designed to probe
utility water quality goals, recycle streams, and fate of solids. The distribution system section ofthe survey investigated size, detention time, materials, oxidant residuals, and flushing programs.The customer satisfaction section reviewed the tracking and follow-up of customer complaints.A utility’s ability to offer differentiable customer complaint information was one of our criteriafor further investigation. In addition to the survey questionnaire, the utilities were asked to provide annual water quality data for 20 specific water quality parameters, collected in the rawwater, finished water, and distribution system. A separate spreadsheet was sent electronically toeach participating utility for the respondent to return when completed. The detailed surveyinstrument and water quality data spreadsheet are included in Appendix A. NOTE: In AppendixA, only the raw water quality data (WQ) sheet is shown as the finished and distribution WQ datasheets are simply duplicates of it.
The detailed survey was also conducted by telephone, usually by the same individual whocompleted the initial facility survey. Advance contacts were made to determine utilitywillingness to participate, and to give the utility personnel time to gather relevant information prior to the survey interview and ascertain the most appropriate contact person for specificsurvey questions. The survey interviews typically took about one hour to conduct, but theutility’s overall participation required about two additional hours to compile information andwater quality data and forward it to the research team.
©2006 AwwaRF. All Rights Reserved.
7/21/2019 Occurrence of Manganese in Drinking Water and Manganese Control
http://slidepdf.com/reader/full/occurrence-of-manganese-in-drinking-water-and-manganese-control 79/463
53
Fifty two detailed interviews were conducted with utilities that clearly were experiencingMn treatment or system problems. They were willing to spend the time for the interview and tosend additional analytical data for inclusion in the research database. Of the 52 detailed surveys,10 were conducted with utilities outside the United States. The purpose of the detailed surveyswas to obtain more specific information in three areas: (1) the source of the Mn, (2) the mannerin which the problem was resolved, if any, and (3) the type of treatment process or chemicaladdition that was used relative to the Mn. The detailed surveys were also used to identifysystems willing to participate in the next phase of the project—taking seasonal distributionsystem samples for Mn speciation analysis. We also explored, through the survey questions, theadequacy of the present USEPA secondary standard for Mn of 0.05 mg/L.
The survey takers were trained by the PIs to maintain uniformity in eliciting responses.The completed survey response was typed and sent to the PIs. Also, a 1-page summary coversheet was created for entry into the database. The utilities usually submitted the water qualitydata electronically at a later date.
DISTRIBUTION SYSTEM OCCURRENCE SAMPLING
Purpose of Sampling
One of the main research efforts associated with this project was the determination ofhow much Mn was present in the distribution systems in those utilities that had reported Mnissues. We knew that some utilities that have source water Mn, and treat for it, still have Mnissues in the distribution system. We also knew that Mn can become a problem with consumerseven if the Mn leaving a treatment plant is below the secondary standard, and that Mn can precipitate within system piping over time and then be resuspended during hydraulic transients.Consequently, our interest was related to systems that were producing water from the source ortreatment plant that contained an identifiable concentration of Mn, even if it was below the present secondary standard. However, we did not know how much Mn would be found in adistribution system at any given time compared to the concentration of Mn entering the system.
In addition we did not know how the speciation of the Mn between the particulate and solubleforms would change as the water flowed through the piping network. We did suspect that therewere various influences on the speciation of Mn, including residence time, pH, temperature,cation and anion matrix, organic concentration, and biological activity. We asked utilities tosample their distribution system water once a quarter for a full year, in order to capture seasonalvariations.
Samples were taken seasonally starting in the winter of 2004 ending in the winter of2005, representing five seasonal sample sets. Samples were sent to the Philadelphia WaterDepartment Bureau of Laboratory Services (PWD-BLS) for metals analysis, alkalinity, arsenic,calcium, hardness, total iron/manganese, colloidal iron/manganese, dissolved iron/manganese,and sodium. The utilities themselves were to analyze the water for general WQ parameters and
when they were not capable of doing certain analysis in-house they sent sample water to acontract laboratory.
Selection of Utilities
The basis of utility selection for this task had much to do with willingness andenthusiasm. The demands placed on the utility to conduct this sampling were substantial. Fromthe pool of willing utilities, 12 were chosen for system sampling and analysis. The utilities
©2006 AwwaRF. All Rights Reserved.
7/21/2019 Occurrence of Manganese in Drinking Water and Manganese Control
http://slidepdf.com/reader/full/occurrence-of-manganese-in-drinking-water-and-manganese-control 80/463
54
selected conformed to the concepts of reasonable geographical and demographic distribution, avariety of treatment processes, both ground and surface water, and both large and small systems.The cooperation from the 12 utilities that participated in the sampling program was excellent.
The sample locations were selected by the utility on the basis of proximity to the sourceand accessibility. Samples were to be taken from the distribution systems at three locationsdefined as near, mid, and far, in reference to their distance from the treatment plant. The teamrecognized that each utility has different hydraulic considerations, flow patterns, and retentiontimes, so no attempt was made to normalize the sampling events from utility to utility. Rather theinvestigators attempted to determine, for each particular utility, how the Mn leaving the source ortreatment plant was behaving relative to concentration and speciation. The utilities themselveswere asked to pick the locations they defined as near, mid, and far; these points were often thesame as those chosen by the utilities for impending DBP rules. The utilities were asked to collectwater samples, conduct field measurements, perform filtrations, and conduct some laboratoryanalyses. Unfiltered and filtered samples were then sent to the PWD-BLS for metals analysis.
Sampling Methodology
Sampling Materials
Prior to initiation of the seasonal testing at each of the 12 utilities, staff in the metalslaboratory of the PWD-BLS water quality laboratory packed and shipped all supplies necessaryfor the collection of samples for general water quality parameters and metals. The contents ofeach package are listed in Table 3.1. An instructional DVD, explaining the sampling process forcollection of the metals samples, was filmed at PWD and included in the shipment of samplingsupplies.
Grab samples for turbidity, alkalinity, UV254, color, ORP, and conductivity werecollected in 1-L Nalgene (Nalge Nunc International, Rochester, N.Y.) high-density polyethylene(HDPE) bottles. Metals samples were collected in 250-mL Nalgene HDPE bottles. The metalssamples were sub-sampled into 60-mL polyethylene (PE) bottles from SCP Science (Baie
D’Urfé, P.Q.). Filtered metals samples were filtered through Millipore Millex-GS 0.22-µm filters(Millipore Corp., Billerica, Mass.), with mixed cellulose ester (MCE) membranes. The filterswere attached to 60-mL plastic Becton-Dickson (Franklin Lakes, N.J.) syringes. A MilliporeAmicon stirred-cell ultrafiltration kit was used to further fractionate an aliquot of each sub-sample. Millipore YM30 UF regenerated cellulose filters were used for filtration in theultrafiltration cell. These filters have a size exclusion fraction of 30 kDa. High purity nitrogen(N2) gas supplied pressure within the ultrafiltration chamber for filtration.
Presently, many utilities use 0.45-µm filters for separating particulate and non-particulateMn. However, separation of truly dissolved from particulate Mn may likely require a finer porosity. Therefore, we selected 0.22 µm and 30 kDa as research sizes for this study. The 0.22-µm filter is a size that most utilities treating for Mn could easily incorporate into an analytical
program. On the other hand the 30-kDa requires special equipment and considerably more time.For this research it was felt that the 30 kDa was a reasonable size that would give good assurancethat the filtered water sample only contained dissolved Mn
Preservation, Reagents, and Standards
Samples for metals analysis were preserved with 0.25 mL of trace metal grade nitric acid(HNO3) at PWD-BLS, not in the field. This made sample collection and shipping easier.
©2006 AwwaRF. All Rights Reserved.
7/21/2019 Occurrence of Manganese in Drinking Water and Manganese Control
http://slidepdf.com/reader/full/occurrence-of-manganese-in-drinking-water-and-manganese-control 81/463
55
Analysis of samples for As, Na, Mn, Ca, and Mg was performed at PWD-BLS using anAgilent HP4500 inductively coupled plasma–mass spectrometer ICP-MS (Agilent Technologies,Inc., Palo Alto, Calif.). The following isotopes of each analyte were measured: As 75, Na 23, Mn55, Ca 44, and Mg 24. Analysis of samples for Fe was performed using a Leeman Labs Profileinductively coupled plasma–atomic emission spectrometer ICP-AES (Teledyne TechnologiesInc., Los Angeles, Calif.). Iron emission was measured at 259.9 nm. Ultrapure argon gas wassupplied to both instruments for plasma generation and to serve as a cooling gas. Standards weremade in a solution of 1% HNO3 that was prepared using Milli-Q water and concentrated tracemetal grade HNO3. High-concentration stock standards were diluted to prepare calibration andexternal (second source) standards. A blank and four standards were used for each calibrationcurve. The calibration ranges were as follows (in µg/L): As (1 to100), Na (50 to 5,000), Mn (10to 1,000), Ca and Mg (100 to 10,000), and Fe (10 to1,000). Internal standards were used tomonitor and account for drifts in instrument response on the ICP-MS. The standards used asinternal standards were Scandium at mass 45 (for Na, Ca, Mg, and Mn) and Yttrium at mass 89(for As).
Table 3.1
Items shipped to each utility participating in the seasonal sampling study Item Manufacturer or source Purpose
1-L HDPE bottles Nalgene General WQ parameter samples250-mL HDPE bottles Nalgene Metals grab samples60-mL PE bottles SCP Science Metals sub-samplesPlastic 60-mL syringe Becton-Dickson 0.22-µm filtration0.22-µm filters Millipore FiltrationUltrafiltration kit Millipore Ultrafiltration30-kDa filters Millipore UltrafiltrationDVD PWD Sample collection demoChain of custody sheets PWD Sample tracking
Field data sheets PWD Field WQ data
General WQ Parameters Sampling and Analysis
Sampling and analysis of general water quality parameters was performed by eachrespective utility. For the parameters measured in the field (free and total chlorine, pH,temperature, and dissolved oxygen), PWD supplied a field data sheet for recording all data andQC measures. These sheets were returned to PWD and reviewed by project staff.
Metals Sample Collection
Sampling for metals analysis was also conducted by the individual utilities. However,following collection of the samples for metals, utilities returned the samples to the PWD-BLS for processing and analysis. Details on the sampling and sample preparation protocol followed byutilities are included in Appendix B, and summarized in the following.
A diagram depicting the sample collection scheme for metals samples is shown inAppendix B, Figure B.1. In addition to the distribution water samples, each utility collected
©2006 AwwaRF. All Rights Reserved.
7/21/2019 Occurrence of Manganese in Drinking Water and Manganese Control
http://slidepdf.com/reader/full/occurrence-of-manganese-in-drinking-water-and-manganese-control 82/463
56
blank samples. Deionized (DI) water was used to generate the field, 0.22-µm, pre-ultrafiltration,and post-ultrafiltration blanks, for each seasonal sampling event.
Metals samples were collected in triplicate at each location. These were grab samples thatwere collected in 250-mL HDPE bottles. Each bottle was labeled with location information, dateand time of collection, and replicate number (1, 2, or 3). New bottles were used with eachsampling and at each location. Sample collectors were instructed to rinse each bottle severaltimes with sample water before collecting the actual sample.
Following collection of the triplicate grab samples, each replicate was sub-sampled for“total” (unfiltered), “dissolved” (<0.22 µm), and “truly dissolved” (<30 kDa) metals, accordingto the terminology introduced in Chapters 1 and 2. As shown in the diagram in Appendix B, thisresulted in the collection of 9 samples from each location (3 total, 3 dissolved, and 3 trulydissolved). These sub-samples were collected in 60-mL polyethylene bottles. The total metalssample was an unfiltered aliquot of the grab sample, poured from the 250-mL bottle directly intoa sub-sample bottle. Prior to each collection of unfiltered sample, an aliquot of the grab samplewas used to rinse and condition the sample bottle. The “dissolved” sample was an aliquot ofwater from the 250-mL bottle that was filtered through a 0.22-µm filter. Prior to collecting thisfiltered sample, a small aliquot was wasted through the syringe and filter, to condition thesyringe and filter with sample water. This waste was collected in the actual sample bottle so that
the bottle was also rinsed with an aliquot of sample water before an actual sample was collected.The “truly dissolved” sample was collected in two steps. The first step was identical to thecollection of the dissolved sample. Following filtration of this sample through the 0.22-µm filter,this 0.22-µm-filtered sample was further filtered through the 30-kDa filter. An initial aliquot waswasted in order to rinse and condition the filter. The waste was collected in the actual sample bottle so that the bottle was also rinsed before sample collection.
Before initial use, each 30-kDa ultrafilter was soaked in DI water for one hour. Thiswater was changed three times during the hour-long soak. Between all samples, the ultrafiltrationcell was rinsed with 50 to100 mL DI water. Between 25 to 50 mL DI water was also filteredthrough the system after each sample to rinse the system and the filter. Sample was collected by pouring the 50 mL of prefiltered (0.22-µm) sample into the ultrafiltration cell. The cell was
capped and pressurized with approximately 10 psi N2 gas. Approximately 10 mL of sample wascollected into the sample bottle for rinsing/conditioning the sample bottle before collecting actualsample. The remainder of the sample within the ultrafiltration cell was then collected in thesample bottle.
These sub-sample bottles were labeled with sample type, location, date, time, andreplicate number. Chain of custody sheets were supplied to each utility. Detailed samplecollection information was recorded on these sheets and returned with the samples to PWD.Samples shipped to PWD for metals analysis were assigned sample identification numbers by thePWD-BLS Central Receiving Unit (CRU) and logged into the department’s LIMS (LaboratoryInformation Management System).
Following entry in the LIMS, samples were taken to the metals laboratory and acid
preserved with HNO3 to a pH less than 2. (Acidification displaces dissolved metals that haveadsorbed to the sample container walls, returning the cations to the bulk sample solution).Following acidification, samples were held at least 16 hours and the pH was checked to verifythat it was less than 2.
©2006 AwwaRF. All Rights Reserved.
7/21/2019 Occurrence of Manganese in Drinking Water and Manganese Control
http://slidepdf.com/reader/full/occurrence-of-manganese-in-drinking-water-and-manganese-control 83/463
57
Metals Analysis
Samples were analyzed for As, Na, Mn, and hardness (Ca and Mg) using inductivelycoupled plasma–mass spectrometry (ICP-MS), based on EPA Method 200.8. A brief descriptionof the analytical process, as described in the Standard Operating Procedure for Method 200.8,Revision 5.4, follows.
Sample material in solution is introduced by pneumatic nebulization into a radio-
frequency plasma where energy transfer processes cause desolvation, atomization, andionization. The ions are extracted from the plasma through a differentially pumped vacuuminterface and separated on the basis of their mass-to-charge ratio by a quadrupole massspectrometer having a minimum resolution capability of 1 amu peak width at 5% peak height.The ions transmitted through the quadrupole are detected by an electron multiplier and the ioninformation is processed by a data handling system. Interferences relating to the technique arerecognized and corrected. Such corrections include compensation for isobaric elementalinterferences and from polyatomic ion interferences derived from the plasma gas, reagents, orsample matrix. Instrumental drift as well as suppressions or enhancements of instrumentresponse caused by the sample matrix are corrected for by the use of internal standards.
The samples were analyzed for Fe levels using inductively coupled plasma–atomic
emission spectrometry (ICP-AES), based on EPA Method 200.7. Iron measurements wereinitially made using ICP-MS, but it was discovered that the interference equation that correctsfor the common calcium oxide interference (Ca40O16) at the iron mass (56) was not adequate forthe low levels of Fe in most of these samples. A brief description of the analytical process, asdescribed in the Standard Operating Procedure for Method 200.7, Revision 4.4, follows.
The Leeman Labs Profile ICP-AES is a sequential instrument. The instrument measurescharacteristic atomic-line emission spectra by optical spectrometry. Samples are nebulized andthe resulting aerosols are transported to the plasma torch. Element-specific emission spectra are produced by a radio-frequency inductively coupled plasma. The spectra are dispersed by agrating spectrometer, and the intensities of the line spectra are monitored at specific wavelengths by a photosensitive device. Photocurrents from the photosensitive device are processed and
controlled by a computer system. A background correction technique compensates for variable background contribution to the determination of analytes. The background is measured adjacentto an analyte wavelength during analysis.
With both methods, quality control was monitored throughout the analysis. Followingcalibration, the calibration standards were analyzed as samples and required to be accurate within±10% of the expected concentration. Following these checks, a second source standard wasanalyzed to verify that the calibration standards were accurate. The second source standards wererequired to be accurate within ±10% of the expected concentration. Throughout each analysis,one sample in every 10 was analyzed in duplicate. The relative percent difference betweenduplicate measurements was required to be <20%. Additionally, one sample in every 10 wasspiked with known amounts of the method analytes, and recoveries of the spiked amounts were
required to be within ±30% of the expected concentration. Internal standards were monitoredthroughout analysis by ICP-MS, and used to correct analyte measurements for instrumental drift.Each internal standard response was required to be within 60% to 125% of the response at the beginning of the analysis. If a sample measurement was outside of the calibration range, anadditional standard outside of the calibration range was run to ensure that the instrumentresponse was linear and accurate at the sample level. Alternatively, if a sample contained ananalyte at a level significantly greater than the highest calibration standard, the sample was
©2006 AwwaRF. All Rights Reserved.
7/21/2019 Occurrence of Manganese in Drinking Water and Manganese Control
http://slidepdf.com/reader/full/occurrence-of-manganese-in-drinking-water-and-manganese-control 84/463
58
reanalyzed with a dilution factor adequate for bringing the sample’s level to within an acceptablerange.
Comments on Handling of Non-Detect (ND) Data Values (aka the Playbook)
To maintain statistical consistency in analysis, presentation, and interpretation of datafrom the research, both in the occurrence sampling task and other experimental tasks, we chose a
specific method of handling “non-detect” (or ND) data; i.e., values less than the detection limit.The process of handling ND data depended on the purpose for which the data was to be used, thenumeric value of the method detection limit (MDL, or the reporting limit, RL), and the source ofthe data.
It is important to note that there were many sources of data for this project. Much of theself-reported data from the utilities was taken at face value. The analytical results sent on to us by the utilities did not always include data on analytical precision.
Mathematical Manipulation
When performing statistical evaluation of data, such as averaging, we used the MDL for
all ND data. We prefer this conservative method; however, it may overestimate a sampleconcentration.
The analytical data generated by PWD-BLS has MDL values of <0.001 mg/L for Mn,and <0.005 mg/L for Fe. Therefore, for all [Mn] <0.001 mg/L we used the value of 0.001 mg/L,and for all [Fe] <0.005 we use 0.005 mg/L, for ND data values. However, not all data used in thisreport were generated by BLS. The MDL or RL presented by the source of the data was used.
The handling of triplicate analysis using this method was done using the above described procedure. For example, if a triplicate sample was analyzed for Mn using a method with an MDL= 0.001 mg/L for which results were ND, ND, and 0.004 mg/L, then the average result of ourcalculation would be (0.001 + 0.001 + 0.004) / 3 = 0.002 mg/L. If the results from the triplicatesamples were all ND then the average would be 0.001 mg/L; yet if this set of data is referred to
in the text the average would be presented as below the detection limit or at “<0.001 mg/L.”Some special cases of water quality data analyzed by outside laboratories, and submittedfor use in this project, have much higher reporting limits than the in-house analysis. In somecases we were forced to discard the data, such as that from a utility which listed an iron MDL of<0.100 mg/L. Using this MDL would greatly skew the data set. In another case, a utility listed<0.040 mg/L as the detection limit, and in this case we chose to include the data, using the value0.040 mg/L (Fe) in our calculations.
Data Presentation
When we present the data in the text or in a table, we list the actual analytical result. Forexample, an ND Mn sample will be written as “<0.001 mg/L.”
For statistical values derived from multiple analyses, data presentation is handled in thefollowing way: if all values are ND, then the average is presented as “below the detection limit,”and if any one of the analytical values is detectable, then the MDL is used for calculation and presentation of all the ND data points. The average will therefore always be greater than thedetection limit. A zero is not used in a tabular data presentation.
©2006 AwwaRF. All Rights Reserved.
7/21/2019 Occurrence of Manganese in Drinking Water and Manganese Control
http://slidepdf.com/reader/full/occurrence-of-manganese-in-drinking-water-and-manganese-control 85/463
59
Graphing
When possible the ND data is presented as the MDL with a note on the chart or graph anda legend entry of hash marks to call it out. Sometimes the MDL may be so low that the valuemay appear to be zero on a chart or graph.
Graphical Presentation of Manipulated Data
For cases where the average value is used in a graphic, the above listed graphing ruleapplies. If all the analytical values are ND, then the MDL value appears on that graph.
For example, if a triplicate sample is analyzed for Mn (MDL = 0.001 mg/L) and results invalues of ND, ND, and 0.004 mg/L, it will appear on a figure as a 0.002 mg/L data point or bar,while values of ND, ND, ND would appear on the figure as a 0.001 mg/L point or bar with hashmarks and a note in the graph or chart legend. There should be no data point represented as azero.
CASE STUDY I: PILOT-SCALE RESEARCH FOR MANGANESE CONTROL
Purpose of Pilot Testing
To achieve very low Mn concentrations in finished water, the Philadelphia WaterDepartment relies upon contact oxidation and adsorption on oxide-coated filter media in the presence of a pre-filter free chlorine residual. Strategies to reduce disinfection by-productformation such as use of alternative disinfectants, reduction of chlorine residuals, and delayingthe point of chlorination downstream in the treatment process may impede the existing Mnremoval mechanisms. The pilot plant investigations conducted at PWD as part of this projectwere designed to characterize the effects of pH, pre-filter chlorine, coagulant type, filter media,and seasonal raw water quality on the ability to remove and retain Mn. The complete Case StudyI protocol can be found in Appendix B. A summary of it follows.
Case Study Objectives
Case Study I had four major investigational objectives, plus two minor objectives, onlythe first two were used to write the report:
• Investigation 1. Study the effect of pH on Mn control using ferric chloride as the primary coagulant, and intermediate ozone to oxidize the Mn. This was done in orderto minimize or eliminate the concentration of soluble Mn applied to the filters.(PWD’s current ferric chloride product, from Eaglebrook Inc., Mattson, Ill., containssome Mn). A range of filtration pH values from 6.5 to 9.0 were tested. Each of two parallel trains was filtered through one dual media filter with pre-filter chlorine, one
dual media filter without chlorine, and one GAC filter without chlorine.• Investigation 2. Characterize the Mn retention of a previously chlorinated manganese
oxide–coated filter bed upon cessation of pre-filter chlorine, over a range of filtration pH levels from 6.5 to 8.5. This investigation was performed with ferric chloridecoagulation.
©2006 AwwaRF. All Rights Reserved.
7/21/2019 Occurrence of Manganese in Drinking Water and Manganese Control
http://slidepdf.com/reader/full/occurrence-of-manganese-in-drinking-water-and-manganese-control 86/463
60
Pilot Plant Description and Standard Operating Procedures
The PWD has two pilot plants, each located at a full-scale water treatment plant. These plants draw water from two different river sources, the Schuylkill River and the Delaware River.A schematic of the Belmont WTP pilot plant is presented in Appendix B, Figure B.2.
The pilot plants draw water from the river source without any pretreatment. About 20gpm of river water enters a 600-gallon raw water basin that provides about 30 minutes of contact
time to model pretreatment chemical addition.The water is pumped and split into two parallel 8-gpm process trains. First the flow enters
two small rapid-mix basins, followed by two (Belmont pilot) or five (Baxter pilot) flocculation basins, with a “tapered” floc mixing scheme. The water then flows through a lamella plate,upflow clarifier for settling; the full-scale plants have gravity settling basins.
Depending on the investigation protocol, the settled water from one of the two processtrains may enter an 8-column, counter current, intermediate ozone contactor. Ozone is typicallyadded in the first column only, and then quenched, if necessary, in the last column.
The settled water, or post ozone contact water if required in the investigation, is thenfiltered by gravity. Each train has two dual media filters (21 in. anthracite and 9 in. sand) and one biologically active GAC filter (29-in. depth).
Online monitors measure raw water turbidity and flow; flocculation pH; sedimentation pH, turbidity, and particle counts; filter head loss, turbidity, and particle counts; intermediateozone residual in various locations throughout the columns; plus ozone feed gas and off-gasconcentrations. All online data is recorded at 2-minute intervals in a PC-based data logger.
The Case Study I schedule ran from March 2004 to February 2005. At least two of theinvestigations were repeated twice to obtain seasonal data.
• Chemical doses will be established based on previous testing experience, full scale plant operations, and jar testing in accordance with the judgment of the pilot plantstaff.
• Both Train A and Train B will be in service with equal influent flow of 8 gpm to each
train. Both pilot plants will run at 8 gpm through flocculation and waste 2 gpm beforesedimentation.
• Rapid mixing and flocculation will be set to optimized G-values as determined from previous investigations. The flocculation basins have tapered mixing intensities.
• The coagulation and filtration pH will be varied as described above.
• For Investigations 1 and 3, intermediate ozone will be used with eight contactcolumns, providing a total hydraulic residence time (HRT) of 17 minutes at 6 gpm.- Apply an ozone dose of 2 mg/L or more as needed to yield a measurable ozone
residual at the outlet of the final contact column in an attempt to oxidize all theMn.
- Apply sodium hydroxide for pH adjustment, if necessary, at the influent to the 7th
column to achieve the targeted filtration pH.- Quench the ozone residual with sodium bisulfite, applied at the inlet to the 8th
column such that an ozone residual of >0.0 but <0.1 mg/L remains at the outlet bottom tap of the 8th column. This trace ozone residual will verify that there is nocarry over of reducing agent (sodium metabisulfite) into the filters.
• Train A will provide settled/ozonated water to dual media Filters A-1 and A-2 andGAC Filter A.
©2006 AwwaRF. All Rights Reserved.
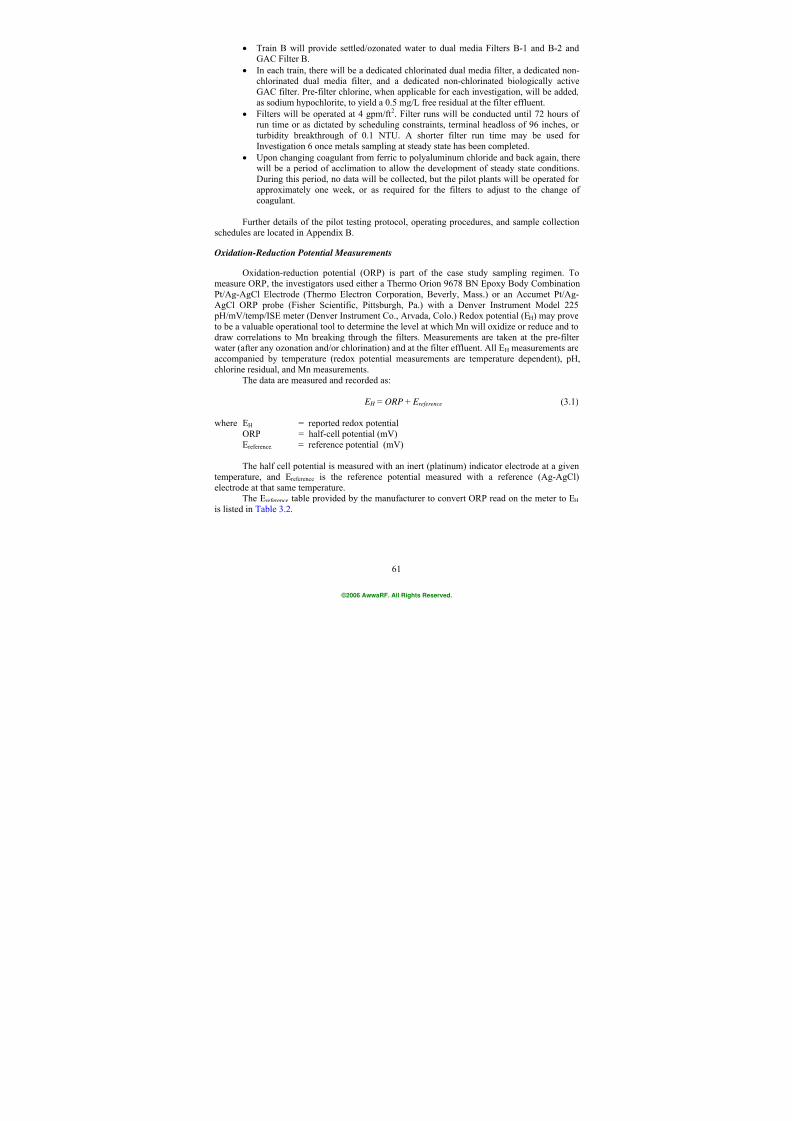
7/21/2019 Occurrence of Manganese in Drinking Water and Manganese Control
http://slidepdf.com/reader/full/occurrence-of-manganese-in-drinking-water-and-manganese-control 87/463
61
• Train B will provide settled/ozonated water to dual media Filters B-1 and B-2 andGAC Filter B.
• In each train, there will be a dedicated chlorinated dual media filter, a dedicated non-chlorinated dual media filter, and a dedicated non-chlorinated biologically activeGAC filter. Pre-filter chlorine, when applicable for each investigation, will be added,as sodium hypochlorite, to yield a 0.5 mg/L free residual at the filter effluent.
•
Filters will be operated at 4 gpm/ft
2
. Filter runs will be conducted until 72 hours ofrun time or as dictated by scheduling constraints, terminal headloss of 96 inches, orturbidity breakthrough of 0.1 NTU. A shorter filter run time may be used forInvestigation 6 once metals sampling at steady state has been completed.
• Upon changing coagulant from ferric to polyaluminum chloride and back again, therewill be a period of acclimation to allow the development of steady state conditions.During this period, no data will be collected, but the pilot plants will be operated forapproximately one week, or as required for the filters to adjust to the change ofcoagulant.
Further details of the pilot testing protocol, operating procedures, and sample collectionschedules are located in Appendix B.
Oxidation-Reduction Potential Measurements
Oxidation-reduction potential (ORP) is part of the case study sampling regimen. Tomeasure ORP, the investigators used either a Thermo Orion 9678 BN Epoxy Body CombinationPt/Ag-AgCl Electrode (Thermo Electron Corporation, Beverly, Mass.) or an Accumet Pt/Ag-AgCl ORP probe (Fisher Scientific, Pittsburgh, Pa.) with a Denver Instrument Model 225 pH/mV/temp/ISE meter (Denver Instrument Co., Arvada, Colo.) Redox potential (EH) may proveto be a valuable operational tool to determine the level at which Mn will oxidize or reduce and todraw correlations to Mn breaking through the filters. Measurements are taken at the pre-filterwater (after any ozonation and/or chlorination) and at the filter effluent. All EH measurements are
accompanied by temperature (redox potential measurements are temperature dependent), pH,chlorine residual, and Mn measurements.
The data are measured and recorded as:
E H = ORP + E reference (3.1)
where EH = reported redox potentialORP = half-cell potential (mV)Ereference. = reference potential (mV)
The half cell potential is measured with an inert (platinum) indicator electrode at a given
temperature, and Ereference is the reference potential measured with a reference (Ag-AgCl)electrode at that same temperature.
The Ereference table provided by the manufacturer to convert ORP read on the meter to EH is listed in Table 3.2.
©2006 AwwaRF. All Rights Reserved.
7/21/2019 Occurrence of Manganese in Drinking Water and Manganese Control
http://slidepdf.com/reader/full/occurrence-of-manganese-in-drinking-water-and-manganese-control 88/463
62
CASE STUDY II: COMPARISON OF ANTHRACITE AND GAC FILTERS FOR
MANGANESE REMOVAL IN A FULL-SCALE WTP
The Huntington Water Treatment Plant treats water for drinking-water compliance usingtraditional treatment techniques. Prior to the D/DBP Rule they coagulated at an elevated pH andrelied on GAC filtration to reduce taste and odor compounds. They have changed theiroperational practices to remove more TOC via coagulation and moved the initial point of
chlorination further back into their water treatment process.Water from the Ohio River is pumped into a holding reservoir where solids are allowed
to settle. Following the initial settling of solids, sulfuric acid (to enhance removal of TOC incoagulation), ferric sulfate (coagulant) and a polymer coagulant aid are added at the mixing tank,
Table 3.2
Reference half-cell potential
Temperature(°C)
Ereference half-cell potential(mV)
10 21420 204
25 19930 194
Source: Thermo Electron Corporation (2003)
before the water splits into two settling basins. In each of the settling basins, there are fourflocculation chambers consisting of baffling, settling, and plate settlers. As the water leaves thesedimentation basin, sodium hydroxide is added to increase the pH to around 7.0, followed byaddition of a filter aid and chlorine. The addition of 2 mg/L chlorine prior to filtration aids in Mnoxidation and subsequent removal through filtration. To remove taste and odor causing organics,the plant has historically used GAC media in all twelve of the filter basins. Recently, one of theGAC filters was replaced with anthracite. Depending on other water quality parameters,
occasionally some Mn (which may remain dissolved) passes through the filter even with theraising of pH and addition of chlorine. The Mn that passes through the filters manifests itself inincreased turbidity in the clearwell. There is no chlorine residual leaving the GAC filters.
Comparing the levels of Mn in the sedimentation effluent to the effluents of the anthracitefilter and an adjacent GAC filter will directly evaluate the performance of the two media typeson Mn removal ability. The experiment will limit media type as the only variable.
A detailed description of the Case Study II protocol and schematics of the HuntingtonWTP unit operations and sampling locations are presented in Appendix B.
The case study protocol calls for continuous measurement of Mn at the filter influent, theeffluent of one anthracite filter, the effluent of one GAC filter, and the combined effluent of all12 of the plant’s filters. Online Mn measurements were obtained with a Tytronics Sentinel online
analyzer (Galvanic Applied Sciences USA Inc., Lowell, Mass.).Grab samples collected throughout the plant process will be analyzed on site for Mn with
the Hach DR/2400 spectrophotometer (Hach Co., Loveland, Colo.) using the 1-2-(Pyridylazo)-2- Naphthol PAN method (low range). These grab samples will also be analyzed on site for pH,alkalinity, free and total chlorine, and conductivity.
Additional samples will be collect at points through out the plant process, with portionsfiltered, and shipped to Philadelphia Water Department, Bureau of Laboratory Services (PWD-BLS) for metals analysis. These unfiltered (total) metals samples were analyzed for Mn, Fe, Na,
©2006 AwwaRF. All Rights Reserved.
7/21/2019 Occurrence of Manganese in Drinking Water and Manganese Control
http://slidepdf.com/reader/full/occurrence-of-manganese-in-drinking-water-and-manganese-control 89/463
63
P, Ca, Mg, by ICP-AES and ICP-MS, as described earlier. Hardness as CaCO3 will be calculatedfrom the calcium and magnesium values. For iron and manganese, the samples will be filtered atthe plant through a 0.22-µm filter, and a 30-kDa filter, for determining dissolved and “trulydissolved” fractions, and analyzed by PWD-BLS.
The reliability of the PAN method will be confirmed by comparing results with theresults obtained by ICP-AES analysis at PWD-BLS.
COST MODEL
The purpose of the cost model is to provide utilities a guideline for comparing the capitaland operating costs for various treatment technologies for Mn. The tables are not designed as anestimating tool for new facilities but rather as a cost comparison. Out of necessity, the tables,located in Chapter 4, present overall national costs rather than geographical specific estimates.This section describes how the tables were calculated and the basic assumptions that went intothe tables.
Consumer Benefit
The consumer benefit with any of the secondary standards is very difficult to quantify,since the acceptable level of a particular contaminant will vary with the individual. Therefore,the research team developed a set of assumptions that judgmentally seemed reasonable as bothtypical and representative of many water utilities in the United States. The assumptions thatformed the basis of the tables are as follows:
• The influent Mn concentration is about 0.5 mg/L. Naturally, this concentration willvary with source and utility location. However, the costs associated with a plantconstructed for raw water Mn between approximately 0.2 mg/L and 2.0 mg/L will beabout the same. Once raw water Mn exceeds 2 to 5 mg/L, some “direct filtration” processes would be stressed and, probably not applicable.
•
Treated water target concentrations were selected as 0.05 mg/L, the present USEPAsecondary standard, 0.02 mg/L, 0.015 mg/L, and 0.01 mg/L. The value of 0.02 mg/Lwas selected as a level that would significantly reduce Mn problems compared to the present standard but would not necessarily completely eliminate some householddifficulties. The value of 0.01 mg/L represents a very low target level of Mn thatmight be set by utilities that wished to achieve the very highest water quality relativeto Mn. The value of 0.015 mg/L is quite simply the value between 0.02 mg/L and0.010 mg/L.
• All costs are presented in US dollars based on 2005 estimates
• The per capita consumption used for the tables (and consequently population served)is 378 liters per day (L/d) or 100 gallons per capita per day (gpcd). Per capita
consumption will vary geographically and with type of community. Although theindustry consensus seems to be that the per capita consumption may be less than 100gpcd, overall national figures suggest that this estimate is reasonable when onedecides plant production by population served. We do recognize that per capitaconsumption will vary from over 400 gpcd in the arid southwest to less that 40 gpcdin the cooler northeast.
• Unaccounted water is taken as 15 percent of plant production. Unaccounted water forthis study was taken as the difference between water produced by a plant and the
©2006 AwwaRF. All Rights Reserved.
7/21/2019 Occurrence of Manganese in Drinking Water and Manganese Control
http://slidepdf.com/reader/full/occurrence-of-manganese-in-drinking-water-and-manganese-control 90/463
64
water billed to consumers. Therefore, unaccounted water would include systemleakage, fire use, hydrant flushing, etc. Again, this figure of 15 percent will vary withutility. Fifteen percent was selected as a reasonable estimate for a well maintaineddistribution system and generally represents the target used by many state regulatoryagencies.
• The three plant sizes of 1 mgd, 10 mgd, and 100 mgd (3.8, 38, and 380 ML/d) wereselected as a broad range in plant sizes that cover the majority of utilities that mayhave Mn problems. The initial and detailed surveys, supported by the literaturesearch, indicate that the majority of utilities that do have Mn issues are relativelysmall systems producing less than 2 to 3 mgd. Comparatively, fewer systems over100 mgd must remove Mn with notable exceptions such as the City of Philadelphia.
• The industrial consumption was taken as 10 percent of the water remaining afterremoving an allowance for unaccounted for water. The 10 percent estimate wasselected as a reasonable allowance for cost comparison purposes. Some utilities willhave very little industry while other systems will be dominated by industrialdemands. Industrial impacts of Mn were not a factor in the cost tables since mostindustries that might require Mn reduction would provide their own in-housetreatment system.
•
Using all these assumptions, we calculated the population that would be served bytreatment plants having capacities of 1 mgd, 10 mgd and 100 mgd as 7,650 persons,76,500 persons, and 765,000 persons, respectively. These population estimates servedas the foundation for the cost benefit analysis included on the tables.
• An estimate was made relative to the number of persons who may experience Mn problems at the present regulatory standard of 0.05 mg/L. The standard was originallydeveloped to represent a concentration where “most” consumers would not have Mn problems in the home. However, the actual number in a particular distribution systemis very difficult to quantify. For the cost tables we conservatively assumed thatapproximately 1 percent of the residential population served would experience somestaining, discoloration or sediment problems annually. Therefore, the affected population for a system population of 7,650 persons would be 77 people per year, fora system serving a population of 76,500 persons would be 765 per year, and for asystem serving a population of 765,000 would be 7,650 per year.
• The most difficult assumption is estimating the cost to an individual consumer if problems in the household are experienced with Mn. The impact was assessed on the basis of individually, rather that on households since all residents of a particularhouse or apartment complex would likely be affected. Some of the costs can bequantified such as lost or destroyed clothes, cleaning of dishwashers and clotheswashers, use of non chlorine detergent, purchase of bottled water, telephone calls tothe water supplier, purchase of special reducing chemicals, precipitation in toilets andshortened fixture life, attendance at meetings, etc. Some of the problems cannot bequantified such as aggravation, and loss of consumer confidence. Taking all thesefactors into consideration the research team felt that a reasonable allowance for costassociated with Mn problems at the regulatory standard of 0.05 mg/L would be about$150 per consumer per year for those consumers that do have problems. Therefore,the annual cost impact to consumers for a 1 mgd plant serving a population of 7,650 persons would be about $11,600 per year. The cost to reduce this cost to consumerswill depend on the type of treatment process (if any) that is presently used. The total
©2006 AwwaRF. All Rights Reserved.
7/21/2019 Occurrence of Manganese in Drinking Water and Manganese Control
http://slidepdf.com/reader/full/occurrence-of-manganese-in-drinking-water-and-manganese-control 91/463
65
annual cost impact to consumers for a 10 mgd treatment plant serving a population of76,500 persons would be about $115,000 per year. The total annual cost impact toconsumers for a 100 mgd treatment plant serving about 765,000 persons would beabout $1,150,000 per year.
• The cost to benefit analysis was based on population served and a fixed, per personimpact, i.e., cost. This makes the annual impact constant irrespective of the type oftreatment process that may be used. This makes sense because, regardless of themeans by which one achieves the goal, the goal is achieved and the benefit realized.If a utility has system specific information relative to the basic model assumptions, itwill be able to generate a more representative model. For the cost to benefit model theestimate to achieve a certain level of Mn in the water leaving a treatment plantincludes the capital cost for a new or upgraded facility and the additional operatingcost to achieve the lower Mn level. The cost to benefit numbers included on the tablesassume a raw water Mn concentration of 0.5 mg/L and a finished water Mn targetgoal that has been reduced from 0.05 mg/L to 0.015 mg/L.
• The cost to benefit ratio presented in the tables is calculated on the basis of the cost tothe utility to reduce Mn levels to a lower goal compared to the cost that the customerspends to receive water with Mn at a certain level. It might be pointed out that ifwater is produced at a particular plant that contains less Mn (i.e., from 0.05 mg/L to0.015 mg/L), there will not necessarily be a cost benefit to the utility, but rather to theindividual consumers. It is possible that consumers will use more water, purchase less bottled water and demand less utility time for complaints, but these costs are nebulousat best.
Utility Costs
The utility cost assumptions are also presented in the Chapter 4 tables. These cost tablesare based on either constructing a new plant or upgrading an existing facility to produce water ata lower Mn level. The costs include construction of a new plant or, in the case of upgrading, the
costs associated with adding a chlorine or potassium permanganate feed system. The specificchemicals would be sodium hypochlorite or dry potassium permanganate solubilized. Capitalcosts do not include raw and finished water pumps, equipment superstructure, standby power,land, legal, engineering or contingencies. Equipment life was taken as 20 years. Costs includeequipment and piping, process tanks, chemical feed storage and equipment, operating labor andmaintenance, plant power, reporting, and costs for chemicals. In many cases, only a nominaloperating cost is associated with a lower Mn target because the process inherently will achievevery low treated water concentration anyway. An example would be lime or ion exchangesoftening, which usually reduces Mn as the process softens the water. Therefore, the additionalcost for a lower Mn target may primarily be for increased sampling and monitoring andreporting.
Basic Assumptions
All the basic assumptions are tabulated above. These assumptions should be reasonablefor comparing relative impacts of treating water to Mn levels below the regulatory level of 0.05mg/L. Since many of the impacts from Mn are very difficult to quantify, each utility shouldconduct an assessment relative to the benefits that may be achieved from dealing with thissecondary issue. The concept that water with a manganese concentration of 0.05 mg/L will likely
©2006 AwwaRF. All Rights Reserved.

7/21/2019 Occurrence of Manganese in Drinking Water and Manganese Control
http://slidepdf.com/reader/full/occurrence-of-manganese-in-drinking-water-and-manganese-control 92/463
66
cause system problems is valid and supported by this study. Therefore, each utility that has Mneither in the raw water or contained in the treatment chemicals might use the cost tables toevaluate the potential benefit to consumers of targeting as low a manganese level as possible.
References for the Cost Model
The references used for the cost model are included in the References section. However,
it should be indicated that published references of Mn removal costs are at best, sparse. Reliancewas made on in-house cost information available to the project team and individual experience at particular utilities.
©2006 AwwaRF. All Rights Reserved.
7/21/2019 Occurrence of Manganese in Drinking Water and Manganese Control
http://slidepdf.com/reader/full/occurrence-of-manganese-in-drinking-water-and-manganese-control 93/463
67
CHAPTER 4
RESULTS AND DISCUSSION
As mentioned earlier, the organization of this chapter will again follow the sequence ofthe six primary research tasks performed during the project. Since each task used methods andgathered data substantially distinct from those of the other tasks, results will be presented in
several ways, with each data set discussed in its own subsection. Overall these results combine tohelp elucidate a larger picture of the occurrence and control of manganese in drinking water.The initial data sets resulting from this research were gained via surveys. First were the
initial surveys; these were brief conversations with utilities, with all data being self-reported,mostly over the telephone. The initial survey results can be thought of as a broad but shallowdata set. Next were the detailed surveys. These, conducted with a subset of the utilities from theinitial survey, again produced self-reported, but much more in-depth, data. The detailed surveyresults can be thought of as a narrow but deep data set.
The next data set was produced by the seasonal sampling program for Mn and itschemical species in drinking water distribution systems. Water samples were collected in thedistribution systems of 12 facilities. The water was then sent to Philadelphia for metals analysis
while split samples were analyzed for other water quality parameters by the utility.There were two experimental case studies on treatment and removal of Mn, one done by pilot plant work and the other using a full-scale water treatment plant, each of which resulted inits own data set.
The last section of the results and discussion is based on a cost analysis model producedto compare the costs of installing or enhancing Mn treatment to reach various concentrations ofMn at or below the current USEPA regulatory level of 0.05 mg/L.
INITIAL SURVEYS
The initial surveys were conducted to help the researchers determine the depth, breadth,and trends of water utilities’ experience in manganese control. The collection of this information
was focused on known places with Mn issues. In order to understand this analysis it is importantto know that the initial surveys were not a scientifically random sampling of water utilities thatcan be used to generate statistically significant projections about the water industry as a whole. Itwas, rather, a focused survey to look into the specific experiences of a number of utilities that wesuspected would have Mn issues.
Our goal was to complete at least 100 surveys. Knowing this we had a goal of gettingcontact information for over 200; we assumed that only about 50% of the utilities contactedwould respond favorably to our request for information. It turned out that we were wrong, theindustry response was overwhelmingly favorable and our success rate was over 90%. Theindustry felt comfortable talking about Mn issues. Therefore, we did not need all 200 potentialcandidates based on response rate. However, we had certain demographic criteria (geographic,
Mn technology, source water, population, etc.) and we ended up increasing our pool of potentialcandidates to 348. From this pool, we connected with 158 utilities and from these participatingutilities we conducted 242 initial surveys. Each survey is facility-specific, and in some cases autility that has several discrete facilities gave information for more than one facility. Since theresearch was distribution system–centric, we defined a discrete facility as one that had its ownconnection to the distribution system. Initial surveys were done only for facilities that had possible Mn issues. That is to say, we did not complete a separate initial survey for each possible facility, but only for those that helped tell some aspect of the story of Mn in drinking water.
©2006 AwwaRF. All Rights Reserved.
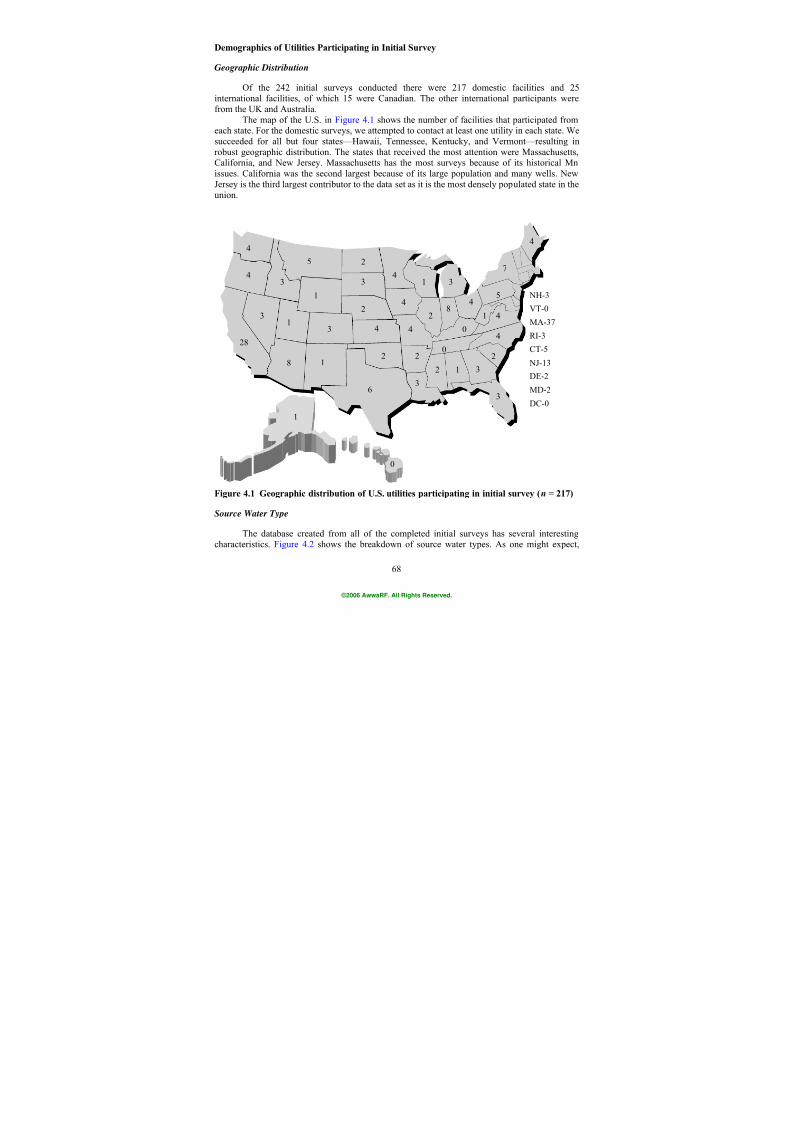
7/21/2019 Occurrence of Manganese in Drinking Water and Manganese Control
http://slidepdf.com/reader/full/occurrence-of-manganese-in-drinking-water-and-manganese-control 94/463
68
Demographics of Utilities Participating in Initial Survey
Geographic Distribution
Of the 242 initial surveys conducted there were 217 domestic facilities and 25international facilities, of which 15 were Canadian. The other international participants werefrom the UK and Australia.
The map of the U.S. in Figure 4.1 shows the number of facilities that participated fromeach state. For the domestic surveys, we attempted to contact at least one utility in each state. Wesucceeded for all but four states—Hawaii, Tennessee, Kentucky, and Vermont—resulting inrobust geographic distribution. The states that received the most attention were Massachusetts,California, and New Jersey. Massachusetts has the most surveys because of its historical Mnissues. California was the second largest because of its large population and many wells. NewJersey is the third largest contributor to the data set as it is the most densely populated state in theunion.
28
8 1
6
3
3
0
1
3
2
31
2
4
2
4
4
1 3
28
4
4
2
3
2 1 3
3
0
4
2
0
41
5
7
DC-0
DE-2
4
VT-0
NH-3
MA-37
4
4
5
CT-5
RI-3
NJ-13
1
MD-2
Figure 4.1 Geographic distribution of U.S. utilities participating in initial survey ( n = 217)
Source Water Type
The database created from all of the completed initial surveys has several interestingcharacteristics. Figure 4.2 shows the breakdown of source water types. As one might expect,
©2006 AwwaRF. All Rights Reserved.
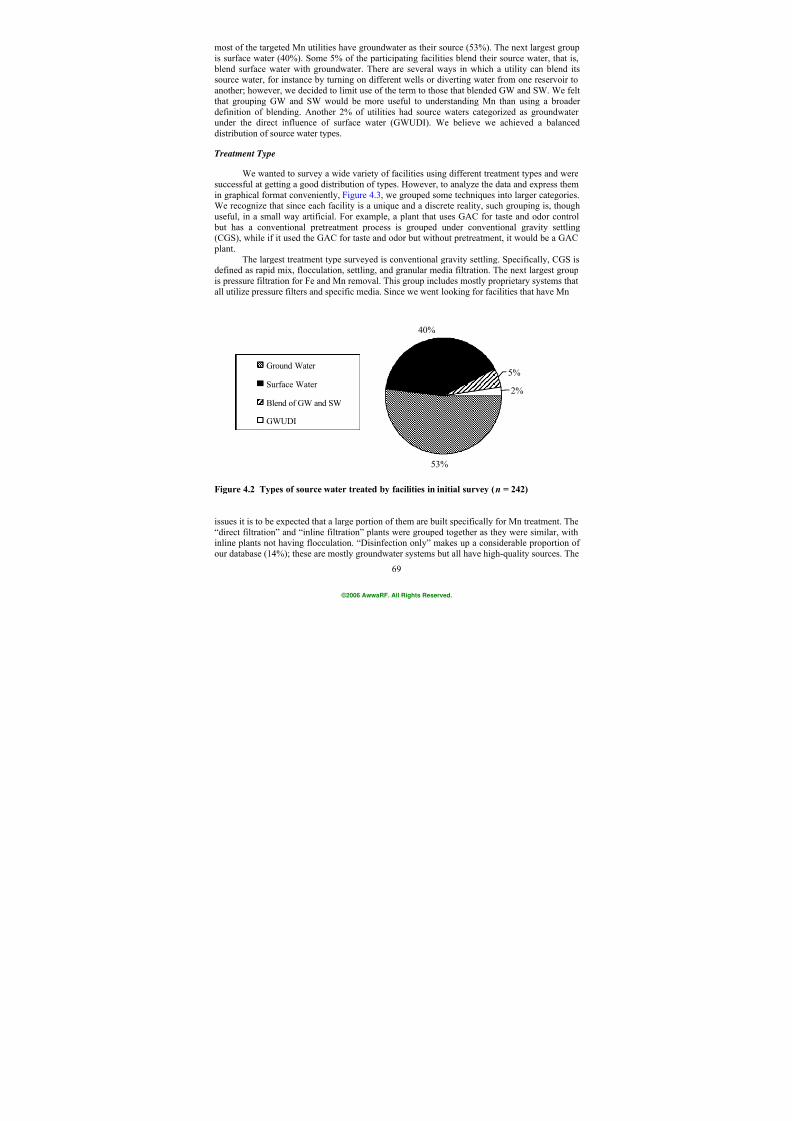
7/21/2019 Occurrence of Manganese in Drinking Water and Manganese Control
http://slidepdf.com/reader/full/occurrence-of-manganese-in-drinking-water-and-manganese-control 95/463
69
most of the targeted Mn utilities have groundwater as their source (53%). The next largest groupis surface water (40%). Some 5% of the participating facilities blend their source water, that is, blend surface water with groundwater. There are several ways in which a utility can blend itssource water, for instance by turning on different wells or diverting water from one reservoir toanother; however, we decided to limit use of the term to those that blended GW and SW. We feltthat grouping GW and SW would be more useful to understanding Mn than using a broaderdefinition of blending. Another 2% of utilities had source waters categorized as groundwaterunder the direct influence of surface water (GWUDI). We believe we achieved a balanceddistribution of source water types.
Treatment Type
We wanted to survey a wide variety of facilities using different treatment types and weresuccessful at getting a good distribution of types. However, to analyze the data and express themin graphical format conveniently, Figure 4.3, we grouped some techniques into larger categories.We recognize that since each facility is a unique and a discrete reality, such grouping is, thoughuseful, in a small way artificial. For example, a plant that uses GAC for taste and odor control but has a conventional pretreatment process is grouped under conventional gravity settling
(CGS), while if it used the GAC for taste and odor but without pretreatment, it would be a GAC plant.
The largest treatment type surveyed is conventional gravity settling. Specifically, CGS isdefined as rapid mix, flocculation, settling, and granular media filtration. The next largest groupis pressure filtration for Fe and Mn removal. This group includes mostly proprietary systems thatall utilize pressure filters and specific media. Since we went looking for facilities that have Mn
53%
40%
5%
2%
Ground Water
Surface Water
Blend of GW and SW
GWUDI
Figure 4.2 Types of source water treated by facilities in initial survey ( n = 242)
issues it is to be expected that a large portion of them are built specifically for Mn treatment. The“direct filtration” and “inline filtration” plants were grouped together as they were similar, withinline plants not having flocculation. “Disinfection only” makes up a considerable proportion ofour database (14%); these are mostly groundwater systems but all have high-quality sources. The
©2006 AwwaRF. All Rights Reserved.
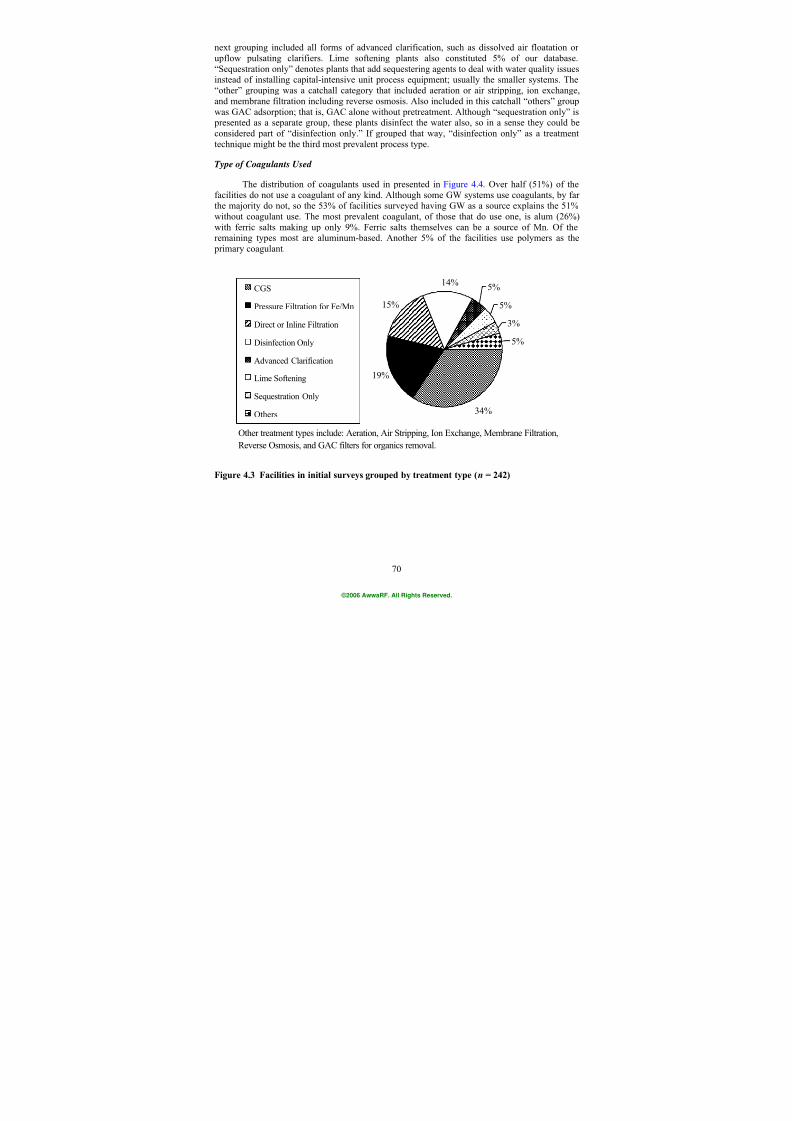
7/21/2019 Occurrence of Manganese in Drinking Water and Manganese Control
http://slidepdf.com/reader/full/occurrence-of-manganese-in-drinking-water-and-manganese-control 96/463
70
next grouping included all forms of advanced clarification, such as dissolved air floatation orupflow pulsating clarifiers. Lime softening plants also constituted 5% of our database.“Sequestration only” denotes plants that add sequestering agents to deal with water quality issuesinstead of installing capital-intensive unit process equipment; usually the smaller systems. The“other” grouping was a catchall category that included aeration or air stripping, ion exchange,and membrane filtration including reverse osmosis. Also included in this catchall “others” groupwas GAC adsorption; that is, GAC alone without pretreatment. Although “sequestration only” is presented as a separate group, these plants disinfect the water also, so in a sense they could beconsidered part of “disinfection only.” If grouped that way, “disinfection only” as a treatmenttechnique might be the third most prevalent process type.
Type of Coagulants Used
The distribution of coagulants used in presented in Figure 4.4. Over half (51%) of thefacilities do not use a coagulant of any kind. Although some GW systems use coagulants, by farthe majority do not, so the 53% of facilities surveyed having GW as a source explains the 51%without coagulant use. The most prevalent coagulant, of those that do use one, is alum (26%)with ferric salts making up only 9%. Ferric salts themselves can be a source of Mn. Of the
remaining types most are aluminum-based. Another 5% of the facilities use polymers as the primary coagulant.
34%
19%
15%
14%5%
5%
3%
5%
CGS
Pressure Filtration for Fe/Mn
Direct or Inline Filtration
Disinfection Only
Advanced Clarification
Lime Softening
Sequestration Only
Others
Other treatment types include: Aeration, Air Stripping, Ion Exchange, Membrane Filtration,
Reverse Osmosis, and GAC filters for organics removal.
Figure 4.3 Facilities in initial surveys grouped by treatment type ( n = 242)
©2006 AwwaRF. All Rights Reserved.
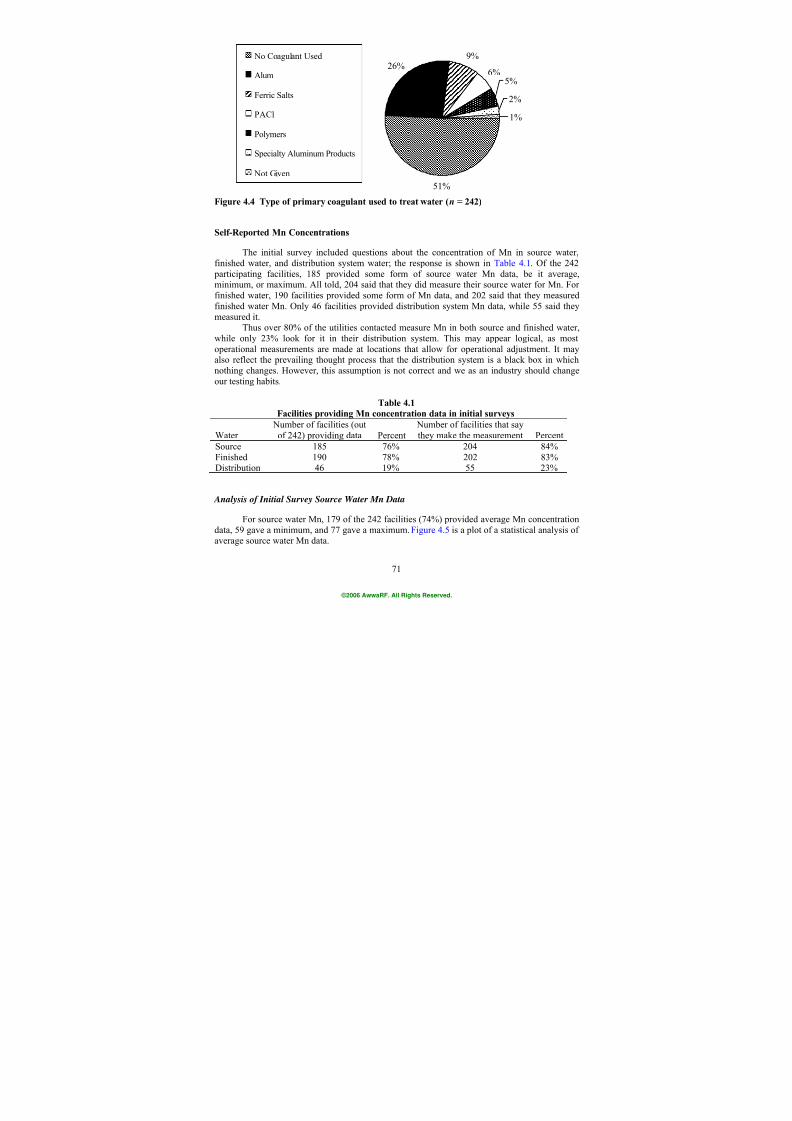
7/21/2019 Occurrence of Manganese in Drinking Water and Manganese Control
http://slidepdf.com/reader/full/occurrence-of-manganese-in-drinking-water-and-manganese-control 97/463
71
51%
26%9%
6%5%
2%
1%
No Coagulant Used
Alum
Ferric Salts
PACl
Polymers
Specialty Aluminum Products
Not Given
Figure 4.4 Type of primary coagulant used to treat water ( n = 242)
Self-Reported Mn Concentrations
The initial survey included questions about the concentration of Mn in source water,finished water, and distribution system water; the response is shown in Table 4.1. Of the 242 participating facilities, 185 provided some form of source water Mn data, be it average,minimum, or maximum. All told, 204 said that they did measure their source water for Mn. Forfinished water, 190 facilities provided some form of Mn data, and 202 said that they measuredfinished water Mn. Only 46 facilities provided distribution system Mn data, while 55 said theymeasured it.
Thus over 80% of the utilities contacted measure Mn in both source and finished water,while only 23% look for it in their distribution system. This may appear logical, as mostoperational measurements are made at locations that allow for operational adjustment. It may
also reflect the prevailing thought process that the distribution system is a black box in whichnothing changes. However, this assumption is not correct and we as an industry should changeour testing habits.
Table 4.1
Facilities providing Mn concentration data in initial surveys
Water Number of facilities (out
of 242) providing data Percent Number of facilities that saythey make the measurement Percent
Source 185 76% 204 84%Finished 190 78% 202 83%Distribution 46 19% 55 23%
Analysis of Initial Survey Source Water Mn Data
For source water Mn, 179 of the 242 facilities (74%) provided average Mn concentrationdata, 59 gave a minimum, and 77 gave a maximum. Figure 4.5 is a plot of a statistical analysis ofaverage source water Mn data.
©2006 AwwaRF. All Rights Reserved.
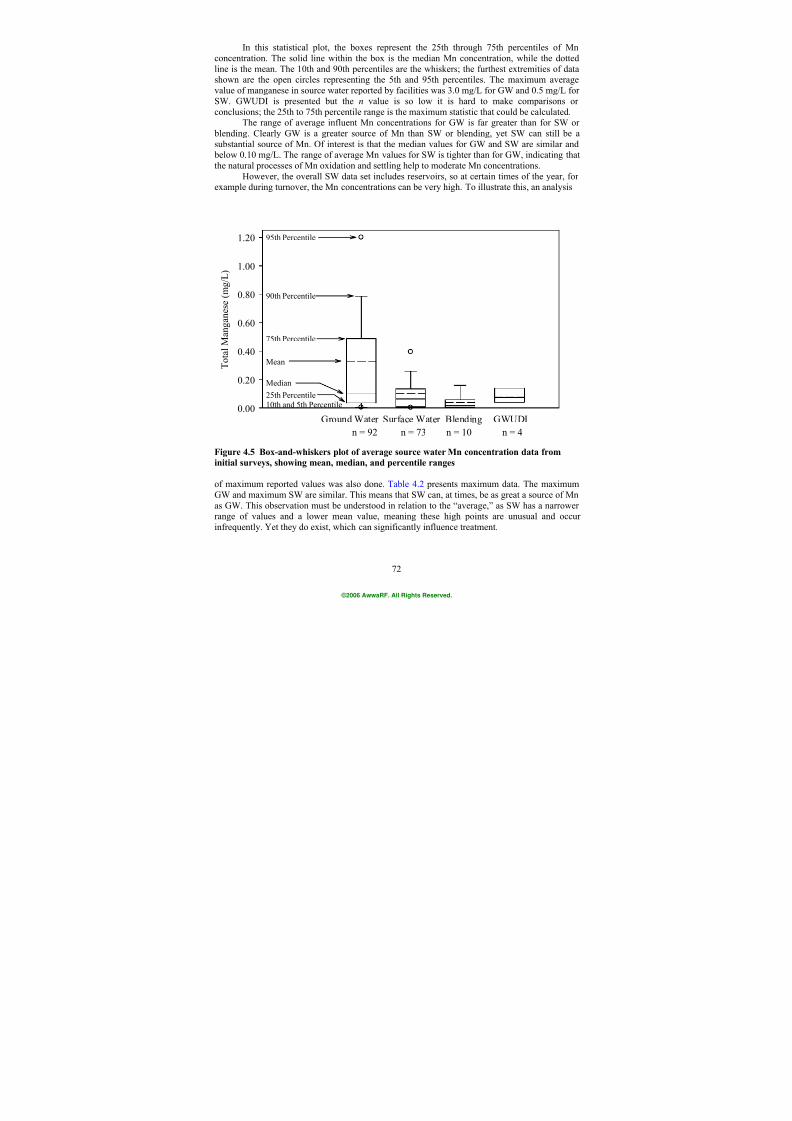
7/21/2019 Occurrence of Manganese in Drinking Water and Manganese Control
http://slidepdf.com/reader/full/occurrence-of-manganese-in-drinking-water-and-manganese-control 98/463
72
In this statistical plot, the boxes represent the 25th through 75th percentiles of Mnconcentration. The solid line within the box is the median Mn concentration, while the dottedline is the mean. The 10th and 90th percentiles are the whiskers; the furthest extremities of datashown are the open circles representing the 5th and 95th percentiles. The maximum averagevalue of manganese in source water reported by facilities was 3.0 mg/L for GW and 0.5 mg/L forSW. GWUDI is presented but the n value is so low it is hard to make comparisons orconclusions; the 25th to 75th percentile range is the maximum statistic that could be calculated.
The range of average influent Mn concentrations for GW is far greater than for SW or blending. Clearly GW is a greater source of Mn than SW or blending, yet SW can still be asubstantial source of Mn. Of interest is that the median values for GW and SW are similar and below 0.10 mg/L. The range of average Mn values for SW is tighter than for GW, indicating thatthe natural processes of Mn oxidation and settling help to moderate Mn concentrations.
However, the overall SW data set includes reservoirs, so at certain times of the year, forexample during turnover, the Mn concentrations can be very high. To illustrate this, an analysis
Ground Water Surface Water Blending GWUDI
T o t a l M a n g a n e s e ( m g / L )
0.00
0.20
0.40
0.60
0.80
1.00
1.20
n = 92 n = 73 n = 10 n = 4
90th Percentile
Mean
Median
10th and 5th Percentile
75th Percentile
25th Percentile
95th Percentile
Figure 4.5 Box-and-whiskers plot of average source water Mn concentration data from
initial surveys, showing mean, median, and percentile ranges
of maximum reported values was also done. Table 4.2 presents maximum data. The maximumGW and maximum SW are similar. This means that SW can, at times, be as great a source of Mnas GW. This observation must be understood in relation to the “average,” as SW has a narrowerrange of values and a lower mean value, meaning these high points are unusual and occurinfrequently. Yet they do exist, which can significantly influence treatment.
©2006 AwwaRF. All Rights Reserved.
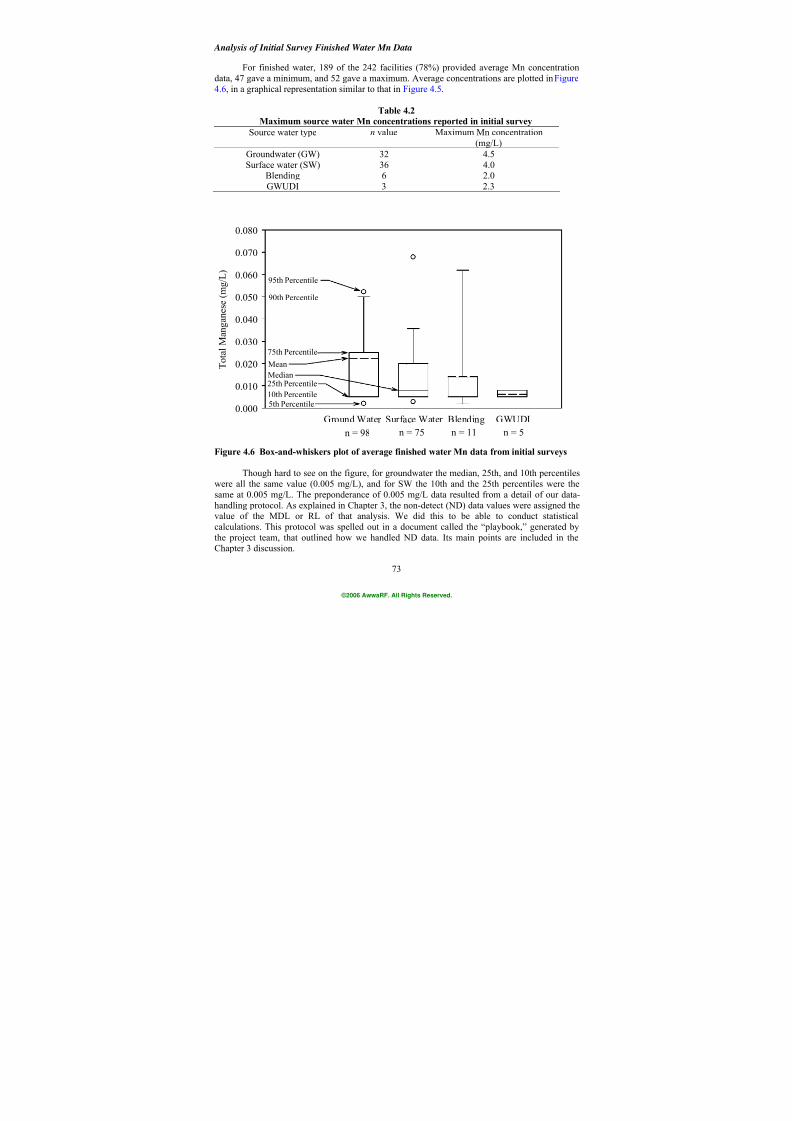
7/21/2019 Occurrence of Manganese in Drinking Water and Manganese Control
http://slidepdf.com/reader/full/occurrence-of-manganese-in-drinking-water-and-manganese-control 99/463
73
Analysis of Initial Survey Finished Water Mn Data
For finished water, 189 of the 242 facilities (78%) provided average Mn concentrationdata, 47 gave a minimum, and 52 gave a maximum. Average concentrations are plotted in Figure 4.6, in a graphical representation similar to that in Figure 4.5.
Table 4.2
Maximum source water Mn concentrations reported in initial surveySource water type n value Maximum Mn concentration
(mg/L)
Groundwater (GW) 32 4.5Surface water (SW) 36 4.0
Blending 6 2.0GWUDI 3 2.3
Ground Water Surface Water Blending GWUDI
T o t a l M a n g a n e s e ( m g / L )
0.000
0.010
0.020
0.030
0.040
0.050
0.060
0.070
0.080
n = 98 n = 75 n = 11 n = 5
90th Percentile
Mean
Median
5th Percentile
75th Percentile
25th Percentile
95th Percentile
10th Percentile
Figure 4.6 Box-and-whiskers plot of average finished water Mn data from initial surveys
Though hard to see on the figure, for groundwater the median, 25th, and 10th percentileswere all the same value (0.005 mg/L), and for SW the 10th and the 25th percentiles were thesame at 0.005 mg/L. The preponderance of 0.005 mg/L data resulted from a detail of our data-handling protocol. As explained in Chapter 3, the non-detect (ND) data values were assigned thevalue of the MDL or RL of that analysis. We did this to be able to conduct statisticalcalculations. This protocol was spelled out in a document called the “playbook,” generated bythe project team, that outlined how we handled ND data. Its main points are included in theChapter 3 discussion.
©2006 AwwaRF. All Rights Reserved.
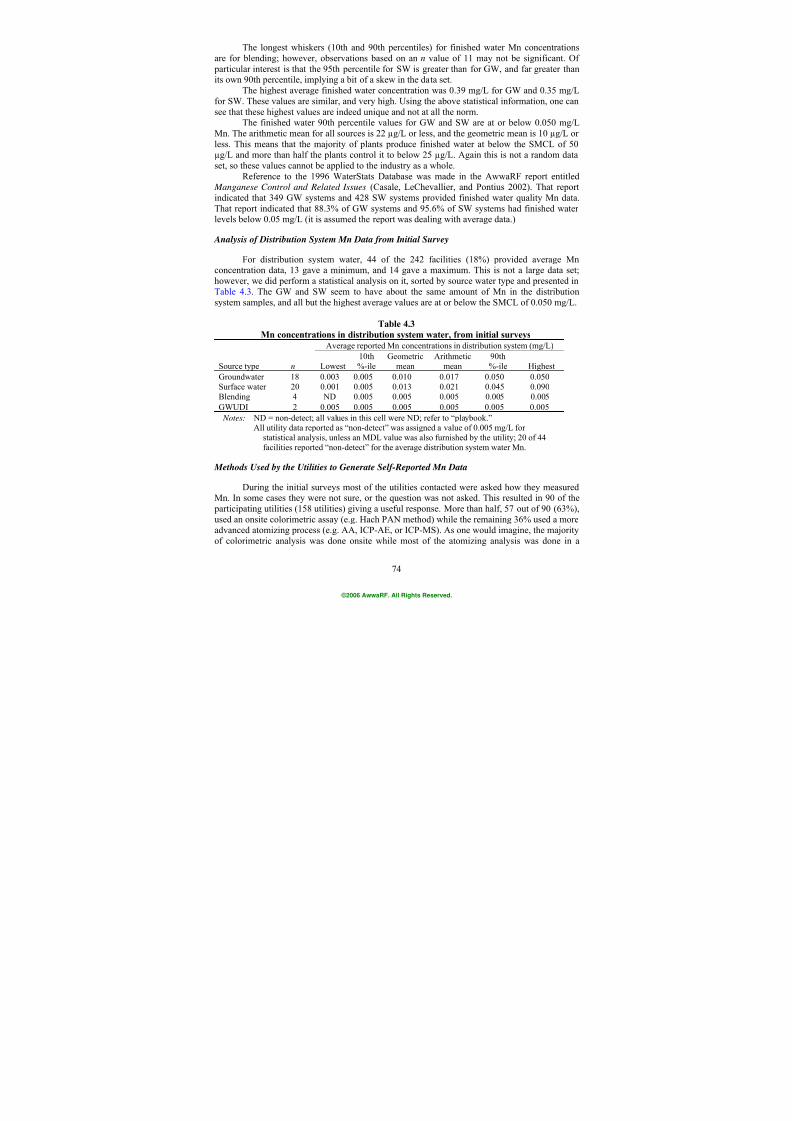
7/21/2019 Occurrence of Manganese in Drinking Water and Manganese Control
http://slidepdf.com/reader/full/occurrence-of-manganese-in-drinking-water-and-manganese-control 100/463
74
The longest whiskers (10th and 90th percentiles) for finished water Mn concentrationsare for blending; however, observations based on an n value of 11 may not be significant. Of particular interest is that the 95th percentile for SW is greater than for GW, and far greater thanits own 90th percentile, implying a bit of a skew in the data set.
The highest average finished water concentration was 0.39 mg/L for GW and 0.35 mg/Lfor SW. These values are similar, and very high. Using the above statistical information, one cansee that these highest values are indeed unique and not at all the norm.
The finished water 90th percentile values for GW and SW are at or below 0.050 mg/LMn. The arithmetic mean for all sources is 22 µg/L or less, and the geometric mean is 10 µg/L orless. This means that the majority of plants produce finished water at below the SMCL of 50µg/L and more than half the plants control it to below 25 µg/L. Again this is not a random dataset, so these values cannot be applied to the industry as a whole.
Reference to the 1996 WaterStats Database was made in the AwwaRF report entitled Manganese Control and Related Issues (Casale, LeChevallier, and Pontius 2002). That reportindicated that 349 GW systems and 428 SW systems provided finished water quality Mn data.That report indicated that 88.3% of GW systems and 95.6% of SW systems had finished waterlevels below 0.05 mg/L (it is assumed the report was dealing with average data.)
Analysis of Distribution System Mn Data from Initial Survey
For distribution system water, 44 of the 242 facilities (18%) provided average Mnconcentration data, 13 gave a minimum, and 14 gave a maximum. This is not a large data set;however, we did perform a statistical analysis on it, sorted by source water type and presented inTable 4.3. The GW and SW seem to have about the same amount of Mn in the distributionsystem samples, and all but the highest average values are at or below the SMCL of 0.050 mg/L.
Table 4.3
Mn concentrations in distribution system water, from initial surveys
Average reported Mn concentrations in distribution system (mg/L)
Source type n Lowest10th%-ile
Geometricmean
Arithmeticmean
90th%-ile Highest
Groundwater 18 0.003 0.005 0.010 0.017 0.050 0.050Surface water 20 0.001 0.005 0.013 0.021 0.045 0.090Blending 4 ND 0.005 0.005 0.005 0.005 0.005
GWUDI 2 0.005 0.005 0.005 0.005 0.005 0.005
Notes: ND = non-detect; all values in this cell were ND; refer to “playbook.”All utility data reported as “non-detect” was assigned a value of 0.005 mg/L for
statistical analysis, unless an MDL value was also furnished by the utility; 20 of 44facilities reported “non-detect” for the average distribution system water Mn.
Methods Used by the Utilities to Generate Self-Reported Mn Data
During the initial surveys most of the utilities contacted were asked how they measuredMn. In some cases they were not sure, or the question was not asked. This resulted in 90 of the participating utilities (158 utilities) giving a useful response. More than half, 57 out of 90 (63%),used an onsite colorimetric assay (e.g. Hach PAN method) while the remaining 36% used a moreadvanced atomizing process (e.g. AA, ICP-AE, or ICP-MS). As one would imagine, the majorityof colorimetric analysis was done onsite while most of the atomizing analysis was done in a
©2006 AwwaRF. All Rights Reserved.
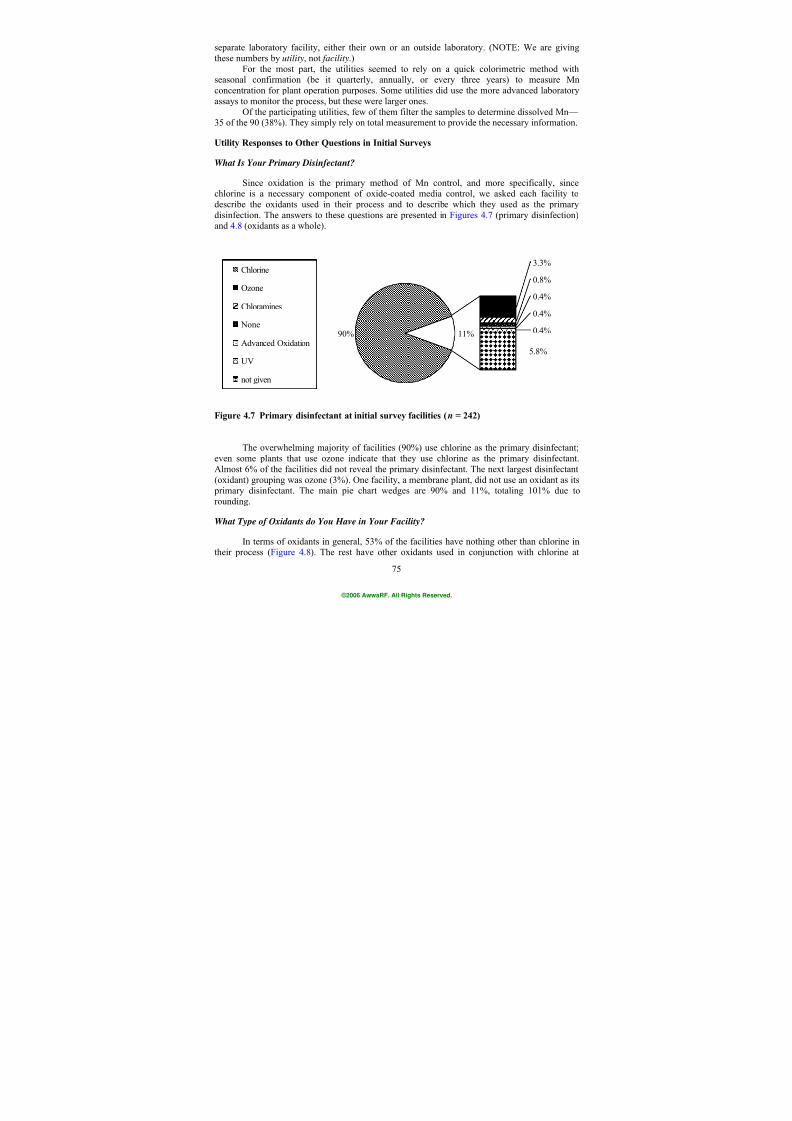
7/21/2019 Occurrence of Manganese in Drinking Water and Manganese Control
http://slidepdf.com/reader/full/occurrence-of-manganese-in-drinking-water-and-manganese-control 101/463
75
separate laboratory facility, either their own or an outside laboratory. (NOTE: We are givingthese numbers by utility, not facility.)
For the most part, the utilities seemed to rely on a quick colorimetric method withseasonal confirmation (be it quarterly, annually, or every three years) to measure Mnconcentration for plant operation purposes. Some utilities did use the more advanced laboratoryassays to monitor the process, but these were larger ones.
Of the participating utilities, few of them filter the samples to determine dissolved Mn— 35 of the 90 (38%). They simply rely on total measurement to provide the necessary information.
Utility Responses to Other Questions in Initial Surveys
What Is Your Primary Disinfectant?
Since oxidation is the primary method of Mn control, and more specifically, sincechlorine is a necessary component of oxide-coated media control, we asked each facility todescribe the oxidants used in their process and to describe which they used as the primarydisinfection. The answers to these questions are presented in Figures 4.7 ( primary disinfection)and 4.8 (oxidants as a whole).
90% 11%
5.8%
3.3%
0.8%
0.4%
0.4%
0.4%
Chlorine
Ozone
Chloramines
None
Advanced Oxidation
UV
not given
Figure 4.7 Primary disinfectant at initial survey facilities ( n = 242)
The overwhelming majority of facilities (90%) use chlorine as the primary disinfectant;even some plants that use ozone indicate that they use chlorine as the primary disinfectant.Almost 6% of the facilities did not reveal the primary disinfectant. The next largest disinfectant(oxidant) grouping was ozone (3%). One facility, a membrane plant, did not use an oxidant as its primary disinfectant. The main pie chart wedges are 90% and 11%, totaling 101% due torounding.
What Type of Oxidants do You Have in Your Facility?
In terms of oxidants in general, 53% of the facilities have nothing other than chlorine intheir process (Figure 4.8). The rest have other oxidants used in conjunction with chlorine at
©2006 AwwaRF. All Rights Reserved.
7/21/2019 Occurrence of Manganese in Drinking Water and Manganese Control
http://slidepdf.com/reader/full/occurrence-of-manganese-in-drinking-water-and-manganese-control 102/463
76
various locations for various purposes. The largest other oxidant reported was KMnO4 (29%).Some 5% of the facilities used both chlorine and ozone, while 4% use chlorine and chlorinedioxide. Since we targeted facilities that might have Mn issues and since chlorine dioxide andozone share about the same percentage, it was deduced that utilities were just as ready to useozone as chlorine dioxide for Mn control. Similar to the primary disinfection question, 6% didnot reveal the oxidants used in their processes. One facility (a membrane filtration plant)indicated that they did not use an oxidant.
The significance of this is that over 90% of the facilities currently have the ability tooxidize Mn. More important is that most have chlorine, a critical component of the inducedoxide-coated media effect (IOCME). The oxidation process must be followed by some sort of physical separation and IOCME requires filter media.
Do You Have a Manganese Problem?
We asked all the utility participants to answer the question, “Do you consider yourself tohave a Mn problem/issue?” Of the facilities, 125 indicated that they did not have a Mn problemwhile 117 indicated that they did. That translates into 52% “no” and 48% “yes.” Since we weretargeting facilities with Mn issues, we were somewhat disconcerted with more “no” than “yes”
responses.
53%
29%5%
4%
3%
0%
6%
Chlorine only
Chlorine and potassium permanganate
Chlorine and ozone
Chlorine and chlorine dioxide
More than two oxidants
No oxidant used
Not reported
Figure 4.8 Facilities grouped by oxidant and oxidant combination within WTP ( n = 242)
Although we did not intend this to be a trick question, we did leave it open ended. One ofthe ideas of the project was to get a feel for what people perceived about Mn and Mn-related
problems. If a utility has the Mn issue under control, then the issue may be perceived to nolonger be a problem. Sometimes Mn has been an issue for such a long time that the facility nolonger considers it an issue. A great story is that of a pumping station operator who has to put on boots to inspect a certain area of the station, and has been doing it for so long that he no longerconsiders a foot of water on the floor an issue. The initial survey was not a sophisticated psychological tool with repeat or confirming questions, though, so only so much can be gleanedfrom this analysis.
©2006 AwwaRF. All Rights Reserved.
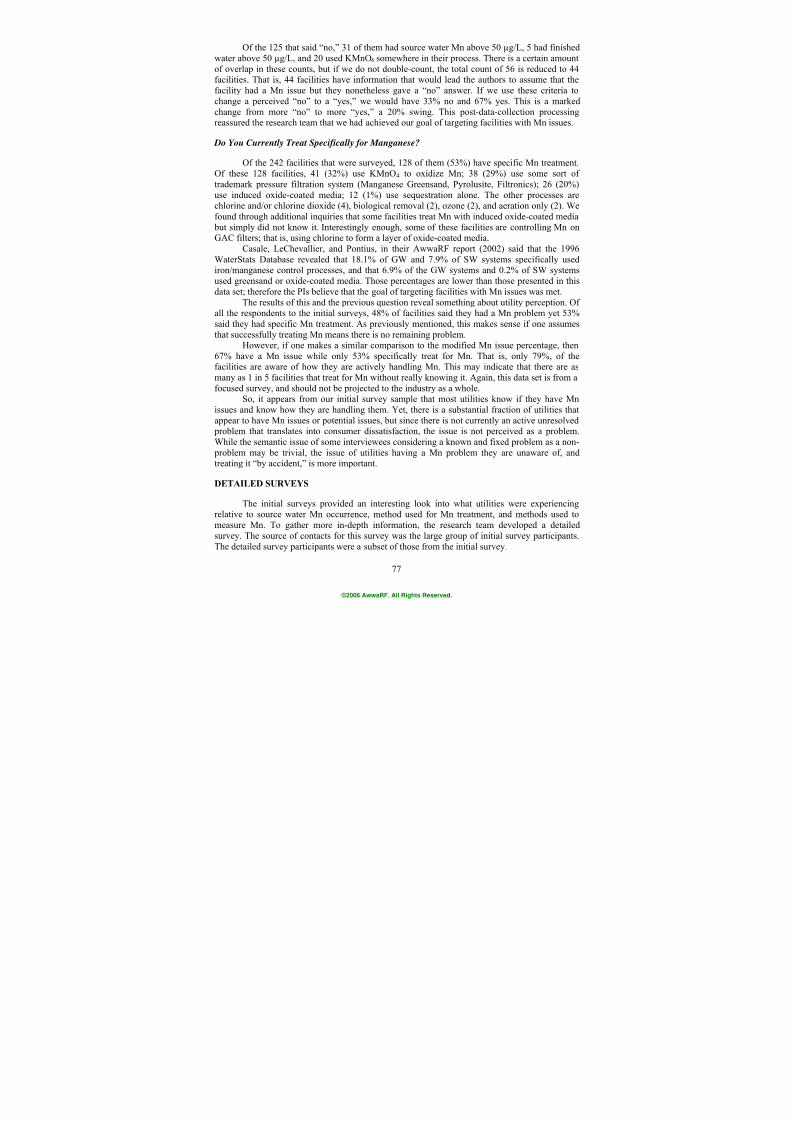
7/21/2019 Occurrence of Manganese in Drinking Water and Manganese Control
http://slidepdf.com/reader/full/occurrence-of-manganese-in-drinking-water-and-manganese-control 103/463
77
Of the 125 that said “no,” 31 of them had source water Mn above 50 µg/L, 5 had finishedwater above 50 µg/L, and 20 used KMnO4 somewhere in their process. There is a certain amountof overlap in these counts, but if we do not double-count, the total count of 56 is reduced to 44facilities. That is, 44 facilities have information that would lead the authors to assume that thefacility had a Mn issue but they nonetheless gave a “no” answer. If we use these criteria tochange a perceived “no” to a “yes,” we would have 33% no and 67% yes. This is a markedchange from more “no” to more “yes,” a 20% swing. This post-data-collection processingreassured the research team that we had achieved our goal of targeting facilities with Mn issues.
Do You Currently Treat Specifically for Manganese?
Of the 242 facilities that were surveyed, 128 of them (53%) have specific Mn treatment.Of these 128 facilities, 41 (32%) use KMnO4 to oxidize Mn; 38 (29%) use some sort oftrademark pressure filtration system (Manganese Greensand, Pyrolusite, Filtronics); 26 (20%)use induced oxide-coated media; 12 (1%) use sequestration alone. The other processes arechlorine and/or chlorine dioxide (4), biological removal (2), ozone (2), and aeration only (2). Wefound through additional inquiries that some facilities treat Mn with induced oxide-coated media but simply did not know it. Interestingly enough, some of these facilities are controlling Mn on
GAC filters; that is, using chlorine to form a layer of oxide-coated media.Casale, LeChevallier, and Pontius, in their AwwaRF report (2002) said that the 1996
WaterStats Database revealed that 18.1% of GW and 7.9% of SW systems specifically usediron/manganese control processes, and that 6.9% of the GW systems and 0.2% of SW systemsused greensand or oxide-coated media. Those percentages are lower than those presented in thisdata set; therefore the PIs believe that the goal of targeting facilities with Mn issues was met.
The results of this and the previous question reveal something about utility perception. Ofall the respondents to the initial surveys, 48% of facilities said they had a Mn problem yet 53%said they had specific Mn treatment. As previously mentioned, this makes sense if one assumesthat successfully treating Mn means there is no remaining problem.
However, if one makes a similar comparison to the modified Mn issue percentage, then
67% have a Mn issue while only 53% specifically treat for Mn. That is, only 79%, of thefacilities are aware of how they are actively handling Mn. This may indicate that there are asmany as 1 in 5 facilities that treat for Mn without really knowing it. Again, this data set is from afocused survey, and should not be projected to the industry as a whole.
So, it appears from our initial survey sample that most utilities know if they have Mnissues and know how they are handling them. Yet, there is a substantial fraction of utilities thatappear to have Mn issues or potential issues, but since there is not currently an active unresolved problem that translates into consumer dissatisfaction, the issue is not perceived as a problem.While the semantic issue of some interviewees considering a known and fixed problem as a non- problem may be trivial, the issue of utilities having a Mn problem they are unaware of, andtreating it “by accident,” is more important.
DETAILED SURVEYS
The initial surveys provided an interesting look into what utilities were experiencingrelative to source water Mn occurrence, method used for Mn treatment, and methods used tomeasure Mn. To gather more in-depth information, the research team developed a detailedsurvey. The source of contacts for this survey was the large group of initial survey participants.The detailed survey participants were a subset of those from the initial survey.
©2006 AwwaRF. All Rights Reserved.
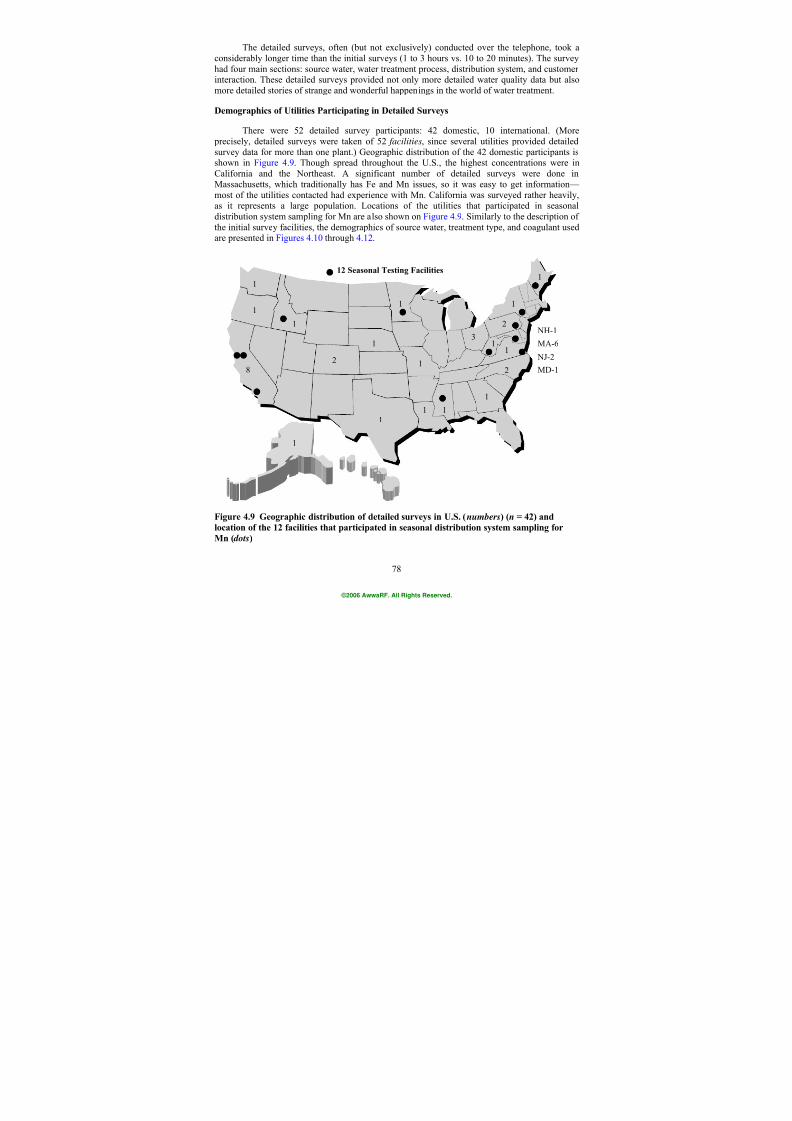
7/21/2019 Occurrence of Manganese in Drinking Water and Manganese Control
http://slidepdf.com/reader/full/occurrence-of-manganese-in-drinking-water-and-manganese-control 104/463
78
The detailed surveys, often (but not exclusively) conducted over the telephone, took aconsiderably longer time than the initial surveys (1 to 3 hours vs. 10 to 20 minutes). The surveyhad four main sections: source water, water treatment process, distribution system, and customerinteraction. These detailed surveys provided not only more detailed water quality data but alsomore detailed stories of strange and wonderful happenings in the world of water treatment.
Demographics of Utilities Participating in Detailed Surveys
There were 52 detailed survey participants: 42 domestic, 10 international. (More precisely, detailed surveys were taken of 52 facilities, since several utilities provided detailedsurvey data for more than one plant.) Geographic distribution of the 42 domestic participants isshown in Figure 4.9. Though spread throughout the U.S., the highest concentrations were inCalifornia and the Northeast. A significant number of detailed surveys were done inMassachusetts, which traditionally has Fe and Mn issues, so it was easy to get information— most of the utilities contacted had experience with Mn. California was surveyed rather heavily,as it represents a large population. Locations of the utilities that participated in seasonaldistribution system sampling for Mn are also shown on Figure 4.9. Similarly to the description ofthe initial survey facilities, the demographics of source water, treatment type, and coagulant used
are presented in Figures 4.10 through 4.12.
82
1
1
1
3
1 1
1
2
11
2
1
NJ-2
1
MA-6
1
1
12 Seasonal Testing Facilities
1
MD-1
1
1
NH-1
Figure 4.9 Geographic distribution of detailed surveys in U.S. ( numbers) ( n = 42) and
location of the 12 facilities that participated in seasonal distribution system sampling for
Mn ( dots)
©2006 AwwaRF. All Rights Reserved.
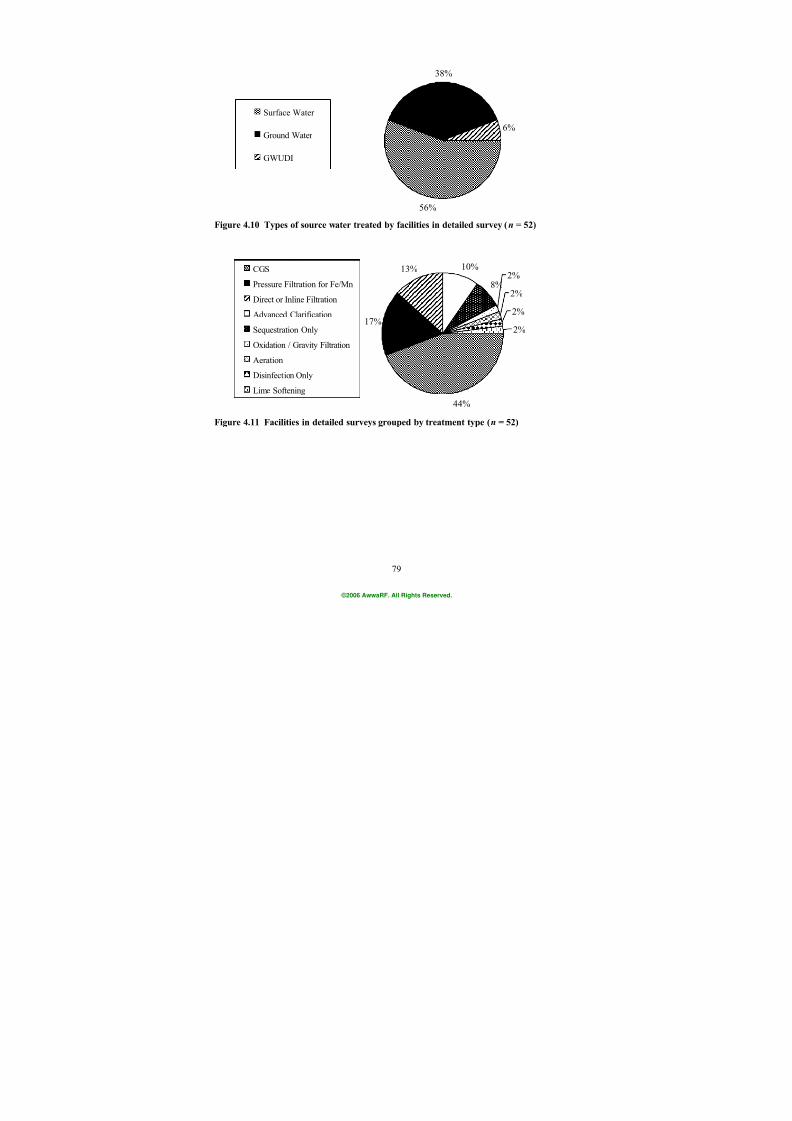
7/21/2019 Occurrence of Manganese in Drinking Water and Manganese Control
http://slidepdf.com/reader/full/occurrence-of-manganese-in-drinking-water-and-manganese-control 105/463
79
56%
38%
6%
Surface Water
Ground Water
GWUDI
Figure 4.10 Types of source water treated by facilities in detailed survey ( n = 52)
44%
17%
13% 10%
8%2%
2%
2%
2%
CGS
Pressure Filtration for Fe/Mn
Direct or Inline Filtration
Advanced Clarification
Sequestration Only
Oxidation / Gravity Filtration
Aeration
Disinfection Only
Lime Softening
Figure 4.11 Facilities in detailed surveys grouped by treatment type ( n = 52)
©2006 AwwaRF. All Rights Reserved.
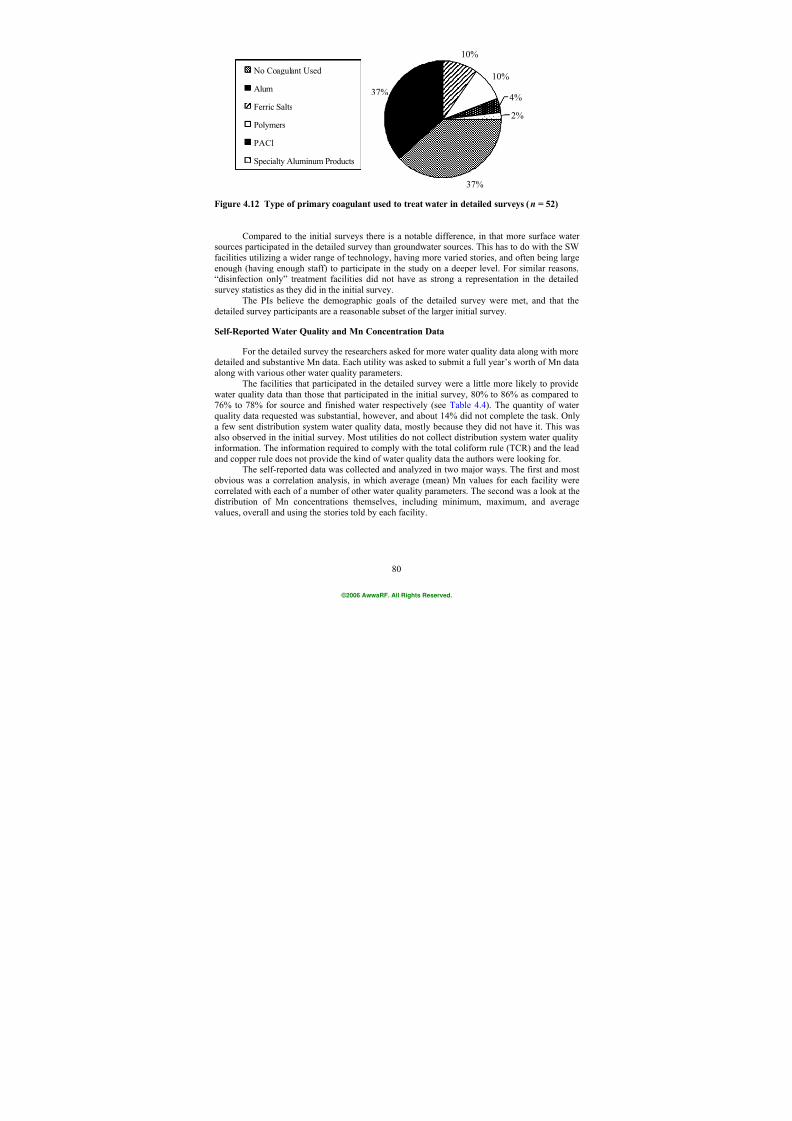
7/21/2019 Occurrence of Manganese in Drinking Water and Manganese Control
http://slidepdf.com/reader/full/occurrence-of-manganese-in-drinking-water-and-manganese-control 106/463
80
37%
37%
10%
10%
4%
2%
No Coagulant Used
Alum
Ferric Salts
Polymers
PACl
Specialty Aluminum Products
Figure 4.12 Type of primary coagulant used to treat water in detailed surveys ( n = 52)
Compared to the initial surveys there is a notable difference, in that more surface watersources participated in the detailed survey than groundwater sources. This has to do with the SWfacilities utilizing a wider range of technology, having more varied stories, and often being largeenough (having enough staff) to participate in the study on a deeper level. For similar reasons,“disinfection only” treatment facilities did not have as strong a representation in the detailedsurvey statistics as they did in the initial survey.
The PIs believe the demographic goals of the detailed survey were met, and that thedetailed survey participants are a reasonable subset of the larger initial survey.
Self-Reported Water Quality and Mn Concentration Data
For the detailed survey the researchers asked for more water quality data along with moredetailed and substantive Mn data. Each utility was asked to submit a full year’s worth of Mn dataalong with various other water quality parameters.
The facilities that participated in the detailed survey were a little more likely to providewater quality data than those that participated in the initial survey, 80% to 86% as compared to76% to 78% for source and finished water respectively (see Table 4.4). The quantity of waterquality data requested was substantial, however, and about 14% did not complete the task. Onlya few sent distribution system water quality data, mostly because they did not have it. This wasalso observed in the initial survey. Most utilities do not collect distribution system water qualityinformation. The information required to comply with the total coliform rule (TCR) and the leadand copper rule does not provide the kind of water quality data the authors were looking for.
The self-reported data was collected and analyzed in two major ways. The first and mostobvious was a correlation analysis, in which average (mean) Mn values for each facility werecorrelated with each of a number of other water quality parameters. The second was a look at thedistribution of Mn concentrations themselves, including minimum, maximum, and averagevalues, overall and using the stories told by each facility.
©2006 AwwaRF. All Rights Reserved.
7/21/2019 Occurrence of Manganese in Drinking Water and Manganese Control
http://slidepdf.com/reader/full/occurrence-of-manganese-in-drinking-water-and-manganese-control 107/463
81
Water Quality Parameter and Mn Concentration Correlations
The authors were hoping to find a profound correlation between annual water quality dataand the Mn concentration. For each facility, an average of each non-Mn water quality parameter(on an annual basis) was determined, as well as the average total Mn concentration. This annualaverage Mn concentration was then plotted as a function of one annual average water quality parameter at a time. Therefore, each facility contributed one data point per plot. We did this for
source water, finished water, and distribution system water.A significant drawback for this type of analysis is that the water quality data was supplied
on an annual basis and it was not sent as coupled data. So, correlating a specific Mnconcentration with a specific value of another water quality parameter taken at the same timewas not possible. (Collection and analysis of such coupled data, however, was done as part ofthis research project in the seasonal occurrence sampling of distribution systems, discussed laterin this chapter.)
In the correlation analysis, 16 se parate plots were created for each water type (source,finished, and distribution system water). Figure 4.13 is an example of the analysis, done forfinished water. All three sets of plots can be found in Appendix C. Each plot contains the n valuealong with the R
2 value of the regression analysis.
Table 4.4
Facilities providing Mn concentration data in detailed surveys
Water Number of facilities that provided data Percent out of 52
Source 42 80%Finished 45 86%Distribution 12 23%
For the 16 source water correlation plots, none of the R 2 values were above 0.50, saveone, dissolved oxygen (DO). It had an R 2 of 0.64 but n value was 10 which is low. However,the trend makes sense as there was more Mn associated with lower D.O. Likewise the 16
finished water plots had low R 2 values. There was one with an R 2 of 0.798 (Mn as a function ofDO), but this too had a low n (n = 6). These two correlations seem to indicate that the oxidationreduction potential as characterized by DO could be significant. If more DO data was suppliedthere could have been more conclusive comments made.
For the 16 distribution system plots, where self-reported data was scarce, the highest n value plot (n = 13) was total Mn as a function of pH, yielding a very low R 2 of 0.056. Thedistribution turbidity plot has n = 11 with an R 2 of 0.405. There is another plot with a fairly highR
2(R
2 = 0.60) but the n value is so extremely low (n=4) that it is difficult to infer much meaning.
This parameter was Total Mn as a function of apparent color. Of interest is that this parameterhas the strongest correlation in the seasonal distribution sampling data, presented later.
When looking at all the utilities at once, with annual data being summarized into one
average value, there were no strong correlations. Mn concentration cannot be predicted by asingle water quality parameter.
©2006 AwwaRF. All Rights Reserved.

7/21/2019 Occurrence of Manganese in Drinking Water and Manganese Control
http://slidepdf.com/reader/full/occurrence-of-manganese-in-drinking-water-and-manganese-control 108/463
82
©2006 AwwaRF. All Rights Reserved.
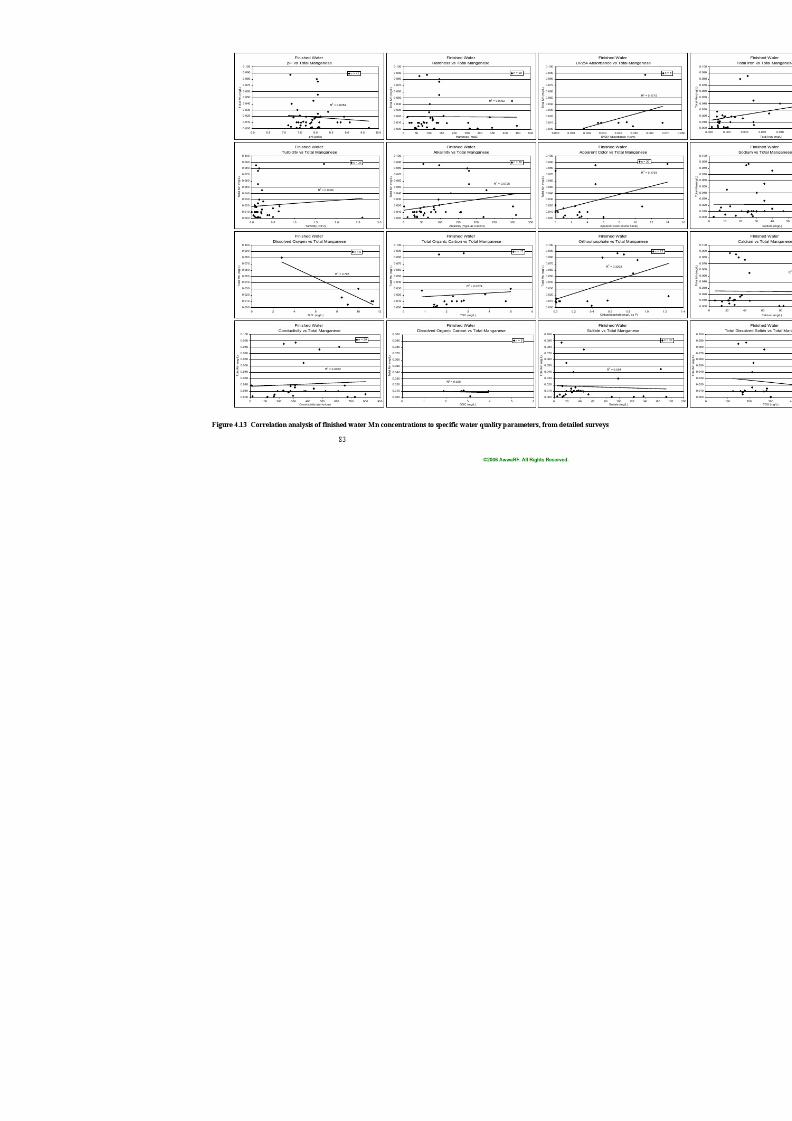
7/21/2019 Occurrence of Manganese in Drinking Water and Manganese Control
http://slidepdf.com/reader/full/occurrence-of-manganese-in-drinking-water-and-manganese-control 109/463

7/21/2019 Occurrence of Manganese in Drinking Water and Manganese Control
http://slidepdf.com/reader/full/occurrence-of-manganese-in-drinking-water-and-manganese-control 110/463
84
©2006 AwwaRF. All Rights Reserved.
7/21/2019 Occurrence of Manganese in Drinking Water and Manganese Control
http://slidepdf.com/reader/full/occurrence-of-manganese-in-drinking-water-and-manganese-control 111/463
85
Analysis of Ratios of Max to Average Mn Concentrations
Overall Explanation of Table 4.5 . A year’s worth of total self-reported Mn data from thedetailed surveys was sorted into minimum, average, and maximum for each facility, as shown inTable 4.5. This was done for source water and for finished water. A ratio of max to average Mnconcentration was generated for each set; that is, the maximum value divided by the average.
This was done to get an idea of how large a difference there was between the average conditionand a large excursion. Also, the percentage of Mn removal (from source to finished water) basedon average data was calculated. The left-hand box of Table 4.5 is utility description information;each facility that also participated in the seasonal distribution system testing for Mn is identifiedwith an “X.” The middle box is source water information and the third is finished water, with thefar right-hand box being percent Mn removal during treatment.
At the bottom of several of the columns are totals. There are 44 separate facilitiesrepresented on the table, representing 44 of the 52 detailed surveys—those that reportedsufficient Mn data for this analysis. Two of them are entered twice (i.e., ID Nos. 2 and 2a, also28 and 28a; see below), so there is a possible total of 46 data points per column. At bottom rightthere is also a matrix of counts above 0.050 mg/L and at or below 0.020 mg/L for the finished
water values. Note that not every utility that participated in the detailed survey provided min,max, and average data. Fields were left blank where no data was offered. All of this data is presented in Table 4.5 along with each utility’s n values denoting the total number of Mnconcentrations reported for source and finished water.
The analysis of the table can be done from left to right for overall treatment analysis or itcan be analyzed vertically, looking for high and low values. The table is color-coded to aid inanalysis. Utilities that have no in-plant Mn treatment or that use sequestering alone wereidentified with a pink box. A utility that has a raw water Max:Avg ratio greater than 10 wasidentified by brown shading and those that have a finished water Max:Avg ratio greater than 10are shaded in blue. Yellow shading was used to identify finished water concentrations that wereless than or equal to 20 µg/L, while a finished water value of greater than 50 µg/L was left white
but boxed with a black border. Aqua green shading is used to identify facilities that use KMnO4 alone to control Mn.
Utility 2 is listed twice as 2 and 2a because one treatment process (i.e., 2) is used all yearlong while 2a is used only part of the year, yet both processes are within one treatment plant andenter the same distribution system. Utility 5 has two distinct process trains within the onetreatment plant but since they are both used constantly the plant overall is thought of as one process. Utility 28 is listed twice (as 28 and 28a) because it has two distinct sources of water yetthe same treatment train, so data was generated for each source and compared to the commonfinished water.
Looking at the n values on Table 4.5 can tell you something about the size of the data setand also something about the utility. Certain utilities provided more than one year’s worth of
data. For example the highest n was 1,885 (source) and 2,382 (finished) from a UK facility,which represents at least 3 years’ worth of data So this utility collects a little under two Mnsamples per day of source water and over two per day of finished. The next highest n value was904 (source) and 908 (finished) for Utility 400; this utility intends to measure Mn three times aday and almost achieved it (which would be 1,095), less monitoring on weekends. The sourcewater n value for Utility 2 is only 5 while it is 365 for finished. This utility controls Mn using asample location within the process, both north and south, measured daily. They have several
©2006 AwwaRF. All Rights Reserved.
7/21/2019 Occurrence of Manganese in Drinking Water and Manganese Control
http://slidepdf.com/reader/full/occurrence-of-manganese-in-drinking-water-and-manganese-control 112/463
86
wells so they only measure source Mn occasionally. Utility No. 3 gave us two years’ worth ofsource water data so their n = 730 means they actually sample daily, yet they only gave us onedata point for finished water. As is to be expected, not all facilities gave us the n value used togenerate the statistics they gave us. About 1/3 of the utilities measure Mn about once a day (i.e.,n > 300), indicating that they seem to really need to keep an eye on things. Those that do nothave a problem or seem to be able to control Mn consistently have an n value of 12 to 52,indicating weekly or monthly analysis.
Looking at Max:Avg Ratios in Table 4.5. Of the 39 facility source waters that have aMax:Avg ratio, 19 of them, or about 50%, have a ratio <2.5 (see the first part of the last columnin the source water box). These facilities report that Mn treatment was usually not a problem forthem because the Mn coming in was fairly constant. This was true even for a utility that had veryhigh source water Mn concentrations. For example, utility #281 has 2.1 mg/L of Mn on averagewith a maximum of 4.5 mg/L, yet they consistently remove it.
The brown-shaded group of five utilities (13% of the 39) have a Max:Avg source waterratio greater than 10 (i.e., maximum value at least 10 times greater than the average value). Frominformation obtained via the detailed survey, they all consider Mn to be difficult to treat eventhough some of their maximum values are not as high as some other utilities’ average values.They suffer under variable influent conditions. Most of these are SW plants, with only one true
GW plant. For some the maximum value appears for only two weeks a year, for example atreservoir turnover. For the GW plant, it occurs when water demand requires them to access watersupplies that they know have Mn. In such cases, with high values for small periods of time, theseutilities are faced with the dilemma of the cost of increased Mn treatment vs. its infrequent use.How are they to justify the cost? Currently they simply seem to suffer through. Once a spike inMn occurs the utility tries to do what it can to treat the Mn within the treatment plant, but mostlythey rely on distribution system flushing.
The next column of Max:Avg ratios for source water—that is, the very last column in thesource water box of the table—lists those whose ratio is 7.5 or more. Besides the five utilitieswith a >10 ratio, there are five additional utilities that fit into this category, for a total of 10utilities (25%). These too suffer with variable Mn influent.
Of the five utilities that have a source water ratio >10, three of them also have a finishedwater ratio >10. And for those 10 utilities with a source water ratio of 7.5 or more, six of themalso have a finished water ratio greater than 7.5. This illustrates that influent variability is morelikely than not to be transferred to finished water variability.
The Max:Avg ratio is a helpful tool. A designer can consider it when designing a WTP,asking if the Mn is a constant problem or a periodic one. This consideration can be used incosting out Mn treatment and including a certain amount of additional capacity or technologywhen warranted. It can also help an operator understand the inherent difficulty he or she isfacing.
©2006 AwwaRF. All Rights Reserved.
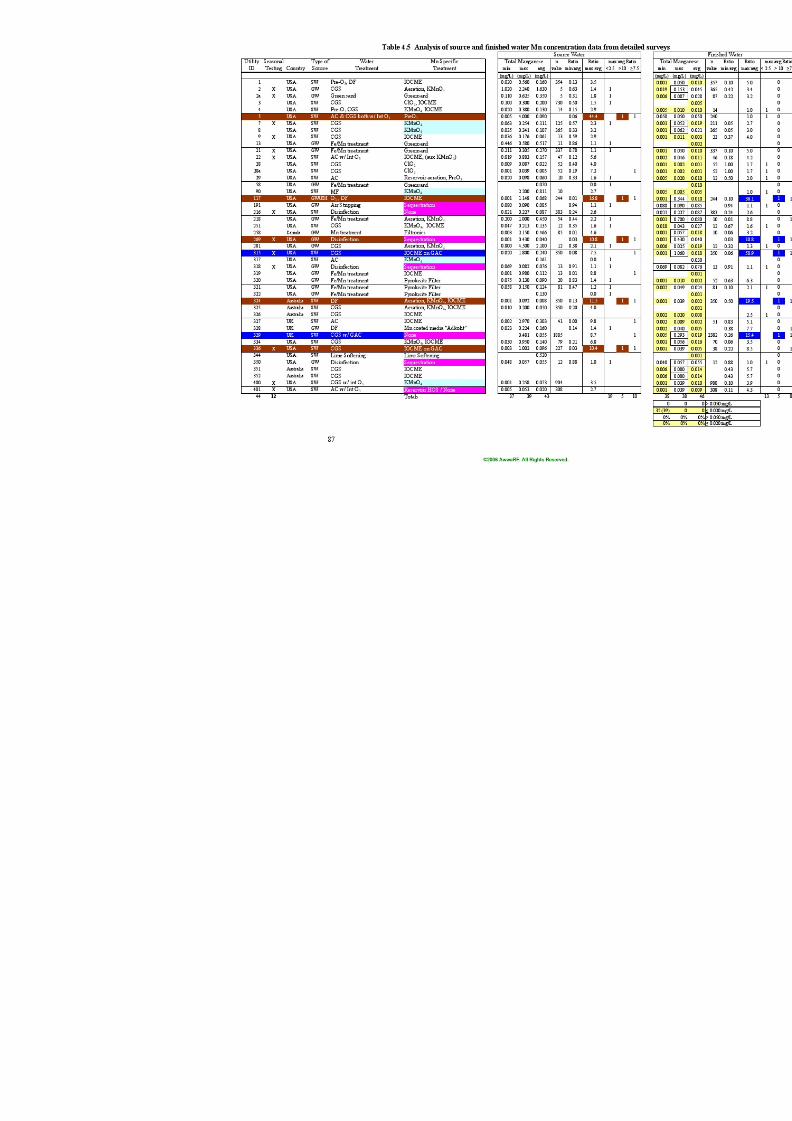
7/21/2019 Occurrence of Manganese in Drinking Water and Manganese Control
http://slidepdf.com/reader/full/occurrence-of-manganese-in-drinking-water-and-manganese-control 113/463

7/21/2019 Occurrence of Manganese in Drinking Water and Manganese Control
http://slidepdf.com/reader/full/occurrence-of-manganese-in-drinking-water-and-manganese-control 114/463
88
©2006 AwwaRF. All Rights Reserved.
7/21/2019 Occurrence of Manganese in Drinking Water and Manganese Control
http://slidepdf.com/reader/full/occurrence-of-manganese-in-drinking-water-and-manganese-control 115/463
89
Looking at the Individual Utilities That Were Highlighted in Table 4.5 . Utility #5 hasseveral reservoirs, and turnover can really change the amount of Mn in the water. They recentlyupgraded the plant, so they use both the older conventional side and the upgraded advanceclarifier side. The large change in influent water quality, both Mn and algae, is handled with pre-ozone. Since the change in source water quality was integrated into the design, there is enoughozone and enough contact time for the Mn to be changed to MnO2 and settled out. The effluentMn concentration is always below their reporting limit of 50 µg/L but no specific numericalconcentrations were provided. So, without more specific data, we entered the reporting limit asthe value on Table 4.5. Therefore, the overall percent removal shown on the table appears low(44%), though it is likely higher in reality.
Utility #117 has had a history of Mn issues. The issues were severe enough that thisutility had to change from the use of biologically active filtration (BAF) after ozone to usingchlorine on the filters to get the remaining Mn out of solution. The high finished water Mn value(maximum) may be an artifact of water quality data prior to the conversion because the processseems to be working now. Keep in mind that the chemistry of Mn is not simple, so the use ofchlorine on the filter may or may not constitute IOCME as listed on the table, since the Mn mayalready be Mn(IV). If so, then the chlorine keeps the Mn(IV) in that state, preventing it fromreducing to Mn(II), or it may be a real IOCME where Mn(II) is captured on the media and
converted to Mn(IV). It is the PIs’ belief that there is not enough ozone or time to oxidize all theMn so that the process at this plant is an actual IOCME. This is also a direct filtration plant; thereis no solid separation step prior to filtration.
Utility #269 is a GW system that has a history of Mn issues. They rely on a notoriouswell, known to have high Mn, simply to meet water supply demands during the hot season. Sincethe Mn control method is sequestration only, all the Mn that comes out of the well goes into thedistribution system. They have Mn complaints. The distribution system is routinely flushed tocontrol Mn.
Utility #315 uses IOCME but on GAC media, applying chlorine and NaOH prior tofiltration. They use this process routinely, and it works most of the time. However, backwashing practices and media age seem to have an impact on process robustness. Also the application of
NaOH prior to filtration can be problematic—sometimes too much, sometimes not enough— especially when source water alkalinity changes. The source water is a river that receives acidmine drainage (AMD); therefore, depending on precipitation, the alkalinity can change as well asthe overall Mn concentrations. This is much less predictable than even a reservoir turnover event.
Utility #336 also uses the IOCME on GAC media. However, they use it seasonally anddo not apply chlorine to the filters regularly. They have been successful at taking the peak out ofthe Mn spike that occurs at reservoir turnover, but there is still a fair amount of variability intheir finished water values. Prior to instituting this chlorination of GAC filter process full-scale,they tested it on pilot scale. There they showed that they could reasonably expect to remove 50%of the influent Mn. The treatment plant has also discovered that their new (recently built)sedimentation basins were not effectively cleared of solids, which resulted in Mn pass-through
via reduction of MnO2 to Mn(II) from anaerobic sediment. So, the load that caused thedistribution system problem actually came from internal plant sources. Improvements insediment removal led to overall improvements. Mn data associated with the distribution system problem is not contained in table 4.5.
Utility #324 is an Australian facility that treats water from a dammed reservoir. Turnoverdoes not seem to be an issue and they aerate the reservoir, yet there is variability within the Mn
©2006 AwwaRF. All Rights Reserved.
7/21/2019 Occurrence of Manganese in Drinking Water and Manganese Control
http://slidepdf.com/reader/full/occurrence-of-manganese-in-drinking-water-and-manganese-control 116/463
90
influent concentrations, although the maximum value is low. The water is very low in alkalinityand hardness, so the first step is addition of carbonate via lime (recarbonation). It is a directfiltration plant so all Mn removal is done on the filters. The pH of coagulation and filtration isvery high, at 9.2, so Mn precipitation is promoted. Even though the influent and effluent Mnconcentrations are quite variable, the finished water is always below 50 µg/L, and it is 2 µg/L onaverage. This utility does not monitor customer complaints, but their client, the town council,does. However, the authors are under the impression they do not have any complaints.
Utility #329 is a UK facility that treats a lowland river supply. They did not specificallytreat for Mn. They are a conventional gravity settling (CGS) plant that uses GAC filtersfollowing clarification; even so they remove about half of the influent Mn. This was notsufficient for them, so they are planning on installing a specific Mn control process. They aregoing to have granular media filter with alkali and chlorine feeds (pH 7.5, and 2 to 2.5 mg/Lrespectively), which we would refer to as IOCME. They have an internal Mn goal of <25 µg/Lfor 99% of the time to prevent Mn buildup in pipes, thereby reducing dir ty water complaints.
Looking at Mn-Specific Treatment Techniques in Table 4.5. Five of the seven utilitiesthat have no Mn-specific treatment process (pink shading) remove no Mn at all. The other tworemove 55% and 65% of Mn. The difference is that those two plants have more water treatment processes than the other five, implying that if one treats the water for turbidity or DOC removal
one can expect about a 50% reduction in Mn.Preozonation was the specific Mn treatment process used for two facilities (Utilities #5
and #29). Their removal percentages were 44% (which may be falsely low) and 83%,respectively. The inclusion of pre-ozonation improves removal from the “no treatment” level ofaround 50% to a little above it. Both rely on sedimentation for Mn removal.
The use of KMnO4 alone to control Mn is not the most effective technique listed. Thoseutilities that use it achieve between 80% and 86% removal. One of the utilities (#90) that participated in the detailed survey uses KMnO4 to oxidize Mn(II) to Mn(IV), then removes it viamembranes. The process requires KMnO4, because if Mn is not oxidized it can pass through themembrane. This process removes 99% of the Mn.
Chlorine dioxide (ClO2) alone, i.e., without other Mn control processes, seems to control
Mn. The utility that used ClO2, followed by sedimentation, removed over 95% of the influent Mnfrom one water source and 81% from the other but always to a low level, (maximum was lessthan 2 µg/L). Chlorine dioxide oxidizes Mn well and it is faster than ozone.
Utilities that coupled KMnO4 with other technologies get better removal than if it is usedalone. For two GW treatment plants, the combination of aeration and KMnO 4 was very effective.These plants have a lot of Mn coming in and have processes set up to contact the Mn withKMnO4. On average, Utility #2 removed 97% of the influent Mn but they still have Mn issues.These issues are associated with plant hydraulics; at high demand times the oxidation andsettling times are reduced so much that Mn removal is no longer effective. This can be seen inthe maximum finished water value (153 µg/L). Utility #281 has a lot of iron and Mn coming in,and the water is always so cold that they heat it up via a heat exchanger in a boiler room. The
concentrations and the heat force removal kinetics to a very favorable level. This facilityremoves 99% of influent Mn and has less than 20 µg/L on average with a maximum of 25 µg/L.
Utility #218 also uses aeration and KMnO4 (and chlorine) but only removes 82% ofinfluent Mn. Utility #218 treats groundwater from six wells via aeration, sedimentation,filtration, and disinfection. They aerate the water, then they add KMnO4 and chlorine in thesedimentation basin with about 1 hour of contact time. They quench the chlorine prior to
©2006 AwwaRF. All Rights Reserved.
7/21/2019 Occurrence of Manganese in Drinking Water and Manganese Control
http://slidepdf.com/reader/full/occurrence-of-manganese-in-drinking-water-and-manganese-control 117/463
91
filtration with ammonia so there is no IOCME. They used to add NaOH to sedimentation basineffluent to raise the pH but stopped because of operational problems. Overfeed resulted in filtermedia grain size growing because of the collection of metals. They may have internal Mn issuesas the sedimentation basin is cleaned manually once a quarter (they are planning on installingremoval equipment). The chlorine and permanganate may be sufficient to keep all the Mnoxidized. The primary purpose of their treatment is to control Fe, with Mn being a side issue. Allof their complaints to date have been red water, never black water. Therefore, 82% Mn removalis acceptable to them.
The use of oxide-coated media (either greensand or similar) and induced oxide-coatedmedia (IOCME) were the most prevalent techniques used, and the most effective. When thesetechniques were employed alone or in concert with others, the removal was generally above90%. In cases where the removal was not above 90%, other factors could explain why. Forexample, at Utility #117, the average source is 68 µg/L and finished water average is 10 µg/L sothe percentage is mathematically low but really the process is quite effective. Two of the threefacilities that used both KMnO4 and IOCME, Utility #251 and Utility #334, had 80% and 89%removal, respectively. Utility #251 has internal recycling of sediment decant, so the loading ofMn on the system is higher than indicated by source water. The effluent concentrations are low,always <50 µg/L, so the process works. Utility #334 also has an internal recycle of Mn via
settling lagoon recycle, but this is usually low and they have an average effluent of 0.02 mg/L.So the below 90% removal (by 1%) is mathematical.
Interestingly enough, Utility #334 does not consider itself to be a true IOCME plant eventhough they carry a free chlorine residual across the filters (1.0 to 1.2 mg/L at filter effluent) at a pH of 6.6. Historically the pretreatment free chlorine residual carried across the sedimentation basin with a contact time of 4 to 6 hours removed all the Mn. They do have Mn on the anthracite but not on the lower layers of sand below it. Once they reduced chlorine across the plant anddelayed the initial point of application for DBP reduction, they had Mn problems. They are nowusing KMnO4 to preoxidize the Mn and remove it by settling. The sand below the filters may yetturn black.
Oxide-coated media Mn-specific treatment via greensand, Pyrolusite, and Filtronic’s
version of greensand all were successful at removing Mn. The finished water effluent Mnconcentrations (average) were consistently low, however, there were high maximum values. Infact several facilities had maximum values above 50 µg/L. The media is capable of producing alow level of Mn but the run length depends upon what level of Mn the operator is comfortablewith. The lower the maximum level allowed out of the process, the more backwashing andreconditioning one must do, and the overall cost of treatment increases.
This is one of the main differences between this type of greensand treatment and IOCME.The IOCME process is constantly being reconditioned, as long as Mn and chlorine are fed intothe filter. Since it is usually an ancillary process, the reconditioning does not increase overalloperational cost. It is reasonable to assume that the manganese greensand facilities can operate to produce low maximum values too, but it simply takes mor e time and money.
Looking at Finished Water Values i n Table 4.5 . In looking at finished water values thatare summarized in the bottom box, 33 of the utilities had an average finished water effluent Mnconcentration of 20 µg/L or less, while 9 (actually 8 as Utility #28 is counted twice) had amaximum of 20 µg/L or less. This indicates that it is possible for most of these utilities (75%) toachieve an average finished water effluent concentration of <0.020 mg/L, yet only 20% of themcould always be under it. Some 32 facilities have a minimum Mn effluent concentration <20
©2006 AwwaRF. All Rights Reserved.
7/21/2019 Occurrence of Manganese in Drinking Water and Manganese Control
http://slidepdf.com/reader/full/occurrence-of-manganese-in-drinking-water-and-manganese-control 118/463
92
µg/L. Some utilities reported no minimum, but if one looks at the average for these and if it is<20 µg/L then the minimum must be ≤ 20 µg/L, and the count goes from 32 to 39, as noted inthe table by parentheses. This means that 39 of our 44 facilities are capable at some time withinthe year of controlling Mn to below 20 µg/L. Conversely, only five facilities have minimum Mnabove 20 µg/L. Of those five, one is only 1 µg/L above 20 (it has no Mn-specific treatment), andthe other is an artifact of the utility’s supplying data at a <50 µg/L reporting limit. So only threeof the five values are real, and of those three, all of them at sequestering plants. This stresses the point that plants that use sequestration are always adding Mn into the distribution system. Allother treatment techniques have periods of little to no Mn entering the system.
The eight utilities that have finished water Mn concentrations below 20 µg/L at all timesdo not have distribution system Mn problems. Many of them did at one time, but once Mntreatment was optimized they no longer have an issue.
Five facilities (11%) had an average effluent Mn concentration above 50 µg/L, and 16(43%) (or 17, counting 2 and 2a separately) had a maximum above 50 µg/L. Of the five withaverage Mn greater than 50 µg/L, three were sequestration plants, one had no specific Mntreatment, and one was “just not all that” successful at Mn treatment. For these facilities,exceeding the federal secondary standard (SMCL) was not a violation; their state rules eitheraccepted higher Mn with sequestration or allowed for a combination of both Fe and Mn.
Although in compliance, these systems were not without customer issues, which in many casesseems to have a greater impact on facility response than the regulations themselves, especiallysecondary ones. For example, one of the utilities, which relies on a sequestering agent only, wasflushing Mn from the system using a fire hydrant. This flushing was being done at night. Thecrew was called back to the hydrant the next day because the street was so dirty from all the black Mn sediment dumped onto it, an impressive example of system buildup. They used broomsand shovels to clean the area.
Customer Complaint Tracking and Assessment
One of the sections in the detailed survey focused on customer interactions. We asked
four specific questions about this. (Refer to detailed survey form in Appendix A.) Of the 52detailed surveys completed, 49 (94%) of the facilities track customer complaints, and 44 (85%)can differentiate one type of complaint from another, such as color vs. taste & odor vs. pressure,etc. Of the respondents, 43 indicated that they follow up with complaints and 40 (77%) test forMn.
In retrospect, the authors feel that this survey instrument was not the best tool to gatherthis information. The interrelations of water treatment staff, distribution staff, and administrativestaff along with the wide range of response to complaints was too complex to be assessed bythese questions. As one might imagine, there was a wide range of ability to track and respond tocomplaints. As can be seen in the data just mentioned, almost everyone tracks complaints. Thethree that indicated they did not were courageous in admitting that they did not track them. In
two cases the utility responds to complaints as they happen (e.g. flushing) but makes no record ofit. In one case the complaints are handled by another entity so the utility could only answer with“no” they did not. With almost everyone saying yes to each question, the differentiationanticipated was not seen.
The best picture of the utilities’ process regarding complaints was seen in the commentsection associated with the questions. For example, in the United Kingdom (UK) customercomplaints are maintained in computerized files and are part of the regulatory environment, i.e.,
©2006 AwwaRF. All Rights Reserved.
7/21/2019 Occurrence of Manganese in Drinking Water and Manganese Control
http://slidepdf.com/reader/full/occurrence-of-manganese-in-drinking-water-and-manganese-control 119/463
93
they are audited by regulators. In Australia the local town council or other public service entity
tracks complaints and interfaces with the utility. In the U.S. the utility does this themselves. The
larger systems use computer databases to look at records (some have regional call centers) while
the smaller ones may keep a log book or have no record at all. The small systems seem torespond to individual complaints individually, with the response they think will fix the problem.
The large ones also respond, but try to see if there are trends or larger reasons for the complaint.
The comment section also revealed that, for the most part, Mn was not the most prevalentcomplaint. Even when dirty water was an issue it was often associated with hydraulic
disturbances and lumped in with Fe. This is logical, and relative to addressing the complaint,
correct. It just limits the use of such information for the purposes of this study.Some 77% of the respondents indicated they tested for Mn in association with
complaints. When asked about it more specifically, however, the answer tended to switch to an
indication that they could test for Mn if they needed to, but to their best recollection they havenever actually tested for Mn even with dirty water complaints. They usually flush the system in
the area of complaint and only if the issue persists do they test for Mn. The PIs wonder if the
wording of the survey form or questions could have been ambiguous and sometimes
misinterpreted so that a utility answering that “we test for Mn” might not have been clearlyintended to be implying that it was a test specifically in the distribution system and specifically
in response to a complaint.Ultimately the authors were not able to make a connection between customer complaints
and Mn treatment, though some specific utilities could anecdotally tell us that after installation of
Mn treatment they had fewer customer complaints.
SEASONAL DISTRIBUTION SYSTEM OCCURRENCE SAMPLING
Overall Findings
An analysis of the overall data set produced by this research task yielded the following
observations.
• The concentration of Mn always decreased along the length of the distribution
system. In the rare cases where it did not, other system anomalies could explain why
it did not.
• The greater the Mn concentration entering the system, the greater the drop across the
system implying the drop in Mn was a function of the amount of Mn entering thesystem not the amount in the distribution system itself. This also reveals that the more
Mn entering the distribution system the greater the accumulation of Mn within the
distribution system.
• The dissolved Mn concentration always decreased at a greater rate than the totalconcentration, revealing a conversion of Mn(II) to Mn(IV).
•
Rarely was colloidal Mn found in the distribution system. It only occurred indistribution systems with high Mn concentrations and where phosphates were being
added either as a sequestering agent or as a corrosion inhibitor.
• The lack of colloidal Mn implies that the 0.22 µm filter is sufficient to determine
dissolved and particulate Mn concentration under most conditions. Since filtrationwith a 0.22 µm filter is significantly easier than a 30K Dalton this is a welcome
observation.
©2006 AwwaRF. All Rights Reserved.
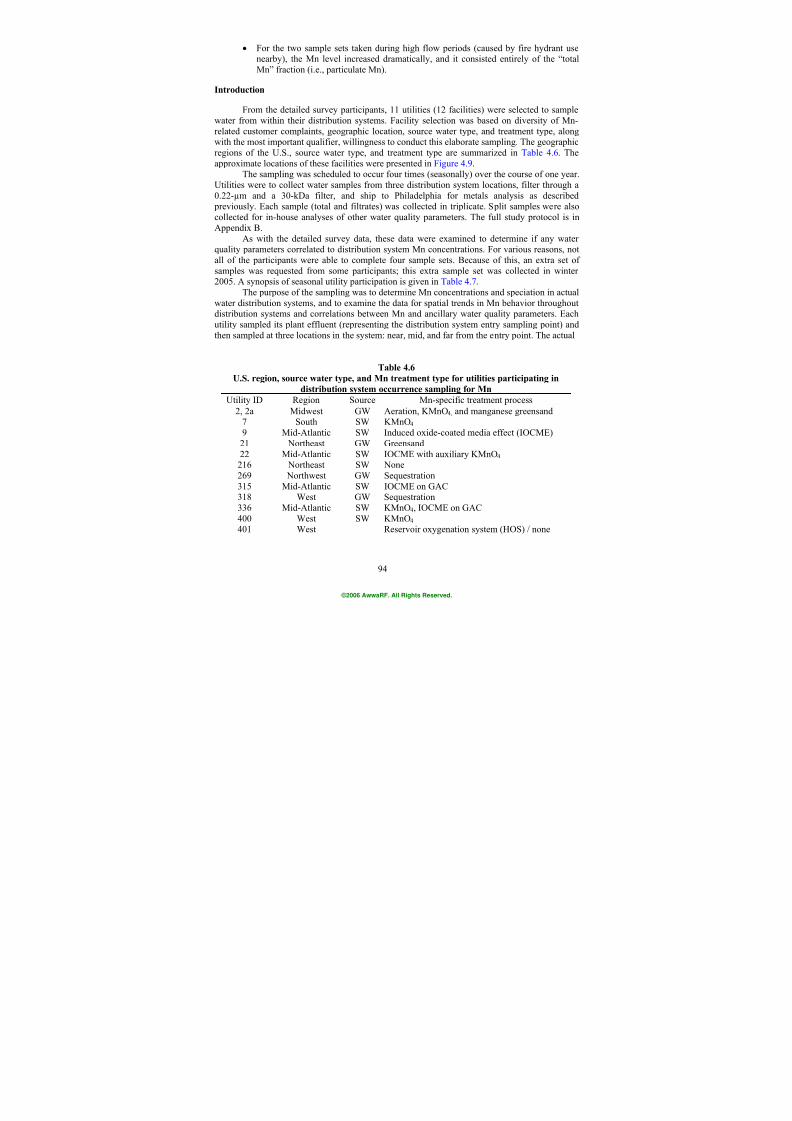
7/21/2019 Occurrence of Manganese in Drinking Water and Manganese Control
http://slidepdf.com/reader/full/occurrence-of-manganese-in-drinking-water-and-manganese-control 120/463
94
• For the two sample sets taken during high flow periods (caused by fire hydrant usenearby), the Mn level increased dramatically, and it consisted entirely of the “totalMn” fraction (i.e., particulate Mn).
Introduction
From the detailed survey participants, 11 utilities (12 facilities) were selected to sample
water from within their distribution systems. Facility selection was based on diversity of Mn-related customer complaints, geographic location, source water type, and treatment type, alongwith the most important qualifier, willingness to conduct this elaborate sampling. The geogra phicregions of the U.S., source water type, and treatment type are summarized in Table 4.6. Theapproximate locations of these facilities were presented in Figure 4.9.
The sampling was scheduled to occur four times (seasonally) over the course of one year.Utilities were to collect water samples from three distribution system locations, filter through a0.22-µm and a 30-kDa filter, and ship to Philadelphia for metals analysis as described previously. Each sample (total and filtrates) was collected in triplicate. Split samples were alsocollected for in-house analyses of other water quality parameters. The full study protocol is inAppendix B.
As with the detailed survey data, these data were examined to determine if any waterquality parameters correlated to distribution system Mn concentrations. For various reasons, notall of the participants were able to complete four sample sets. Because of this, an extra set ofsamples was requested from some participants; this extra sample set was collected in winter2005. A synopsis of seasonal utility participation is given in Table 4.7.
The purpose of the sampling was to determine Mn concentrations and speciation in actualwater distribution systems, and to examine the data for spatial trends in Mn behavior throughoutdistribution systems and correlations between Mn and ancillary water quality parameters. Eachutility sampled its plant effluent (representing the distribution system entry sampling point) andthen sampled at three locations in the system: near, mid, and far from the entry point. The actual
Table 4.6
U.S. region, source water type, and Mn treatment type for utilities participating in
distribution system occurrence sampling for Mn
Utility ID Region Source Mn-specific treatment process
2, 2a Midwest GW Aeration, KMnO4, and manganese greensand7 South SW KMnO4 9 Mid-Atlantic SW Induced oxide-coated media effect (IOCME)21 Northeast GW Greensand22 Mid-Atlantic SW IOCME with auxiliary KMnO4 216 Northeast SW None
269 Northwest GW Sequestration315 Mid-Atlantic SW IOCME on GAC318 West GW Sequestration336 Mid-Atlantic SW KMnO4, IOCME on GAC400 West SW KMnO4 401 West Reservoir oxygenation system (HOS) / none
©2006 AwwaRF. All Rights Reserved.
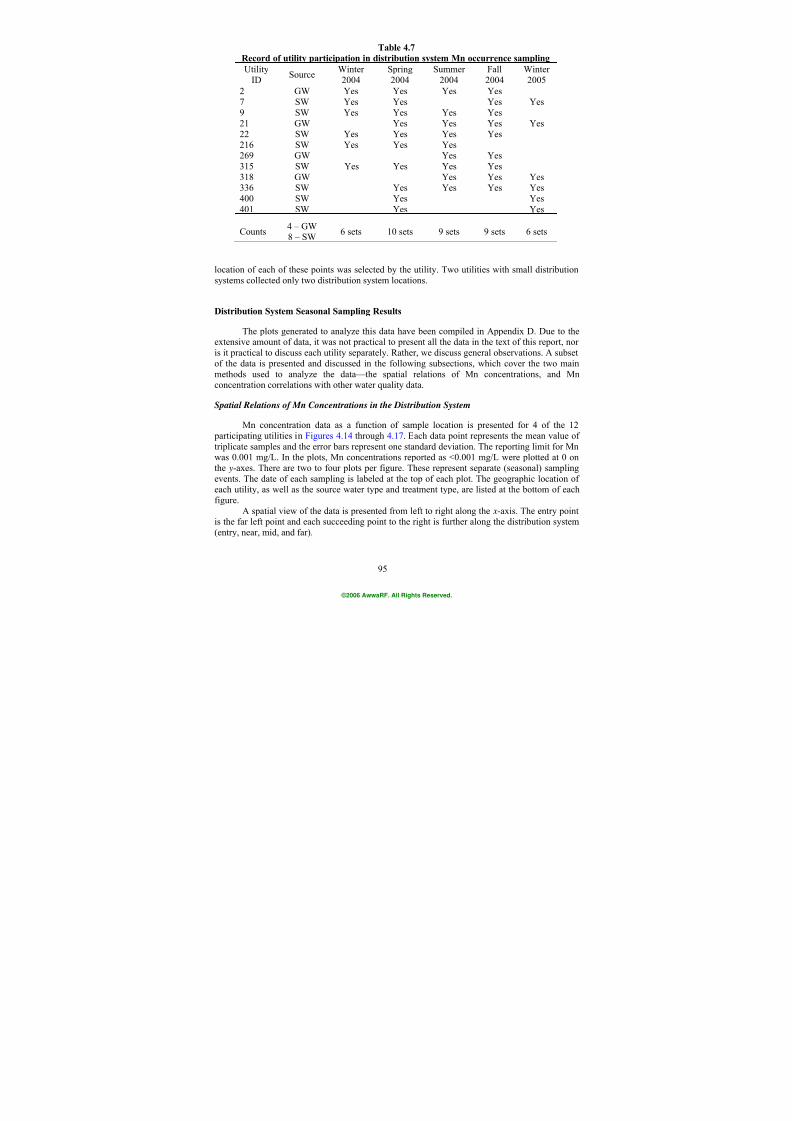
7/21/2019 Occurrence of Manganese in Drinking Water and Manganese Control
http://slidepdf.com/reader/full/occurrence-of-manganese-in-drinking-water-and-manganese-control 121/463
95
Table 4.7
Record of utility participation in distribution system Mn occurrence sampling
UtilityID
SourceWinter2004
Spring2004
Summer2004
Fall2004
Winter2005
2 GW Yes Yes Yes Yes7 SW Yes Yes Yes Yes9 SW Yes Yes Yes Yes21 GW Yes Yes Yes Yes22 SW Yes Yes Yes Yes216 SW Yes Yes Yes269 GW Yes Yes315 SW Yes Yes Yes Yes318 GW Yes Yes Yes336 SW Yes Yes Yes Yes400 SW Yes Yes401 SW Yes Yes
Counts4 – GW
8 – SW6 sets 10 sets 9 sets 9 sets 6 sets
location of each of these points was selected by the utility. Two utilities with small distributionsystems collected only two distribution system locations.
Distribution System Seasonal Sampling Results
The plots generated to analyze this data have been compiled in Appendix D. Due to theextensive amount of data, it was not practical to present all the data in the text of this report, nor
is it practical to discuss each utility separately. Rather, we discuss general observations. A subsetof the data is presented and discussed in the following subsections, which cover the two mainmethods used to analyze the data—the spatial relations of Mn concentrations, and Mnconcentration correlations with other water quality data.
Spatial Relations of Mn Concentrations in the Distribution System
Mn concentration data as a function of sample location is presented for 4 of the 12 participating utilities in Figures 4.14 through 4.17. Each data point represents the mean value oftriplicate samples and the error bars represent one standard deviation. The reporting limit for Mnwas 0.001 mg/L. In the plots, Mn concentrations reported as <0.001 mg/L were plotted at 0 onthe y-axes. There are two to four plots per figure. These represent separate (seasonal) sampling
events. The date of each sampling is labeled at the top of each plot. The geographic location ofeach utility, as well as the source water type and treatment type, are listed at the bottom of eachfigure.
A spatial view of the data is presented from left to right along the x-axis. The entry pointis the far left point and each succeeding point to the right is further along the distribution system(entry, near, mid, and far).
©2006 AwwaRF. All Rights Reserved.
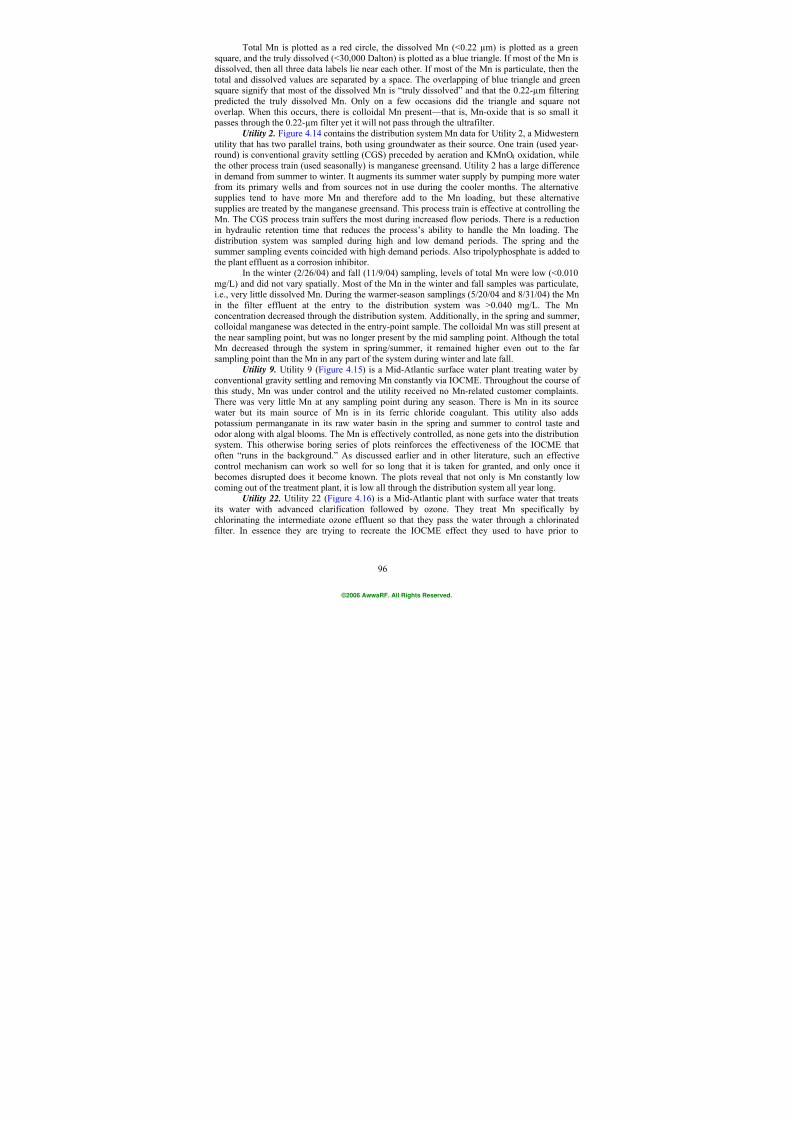
7/21/2019 Occurrence of Manganese in Drinking Water and Manganese Control
http://slidepdf.com/reader/full/occurrence-of-manganese-in-drinking-water-and-manganese-control 122/463
96
Total Mn is plotted as a red circle, the dissolved Mn (<0.22 µm) is plotted as a greensquare, and the truly dissolved (<30,000 Dalton) is plotted as a blue triangle. If most of the Mn isdissolved, then all three data labels lie near each other. If most of the Mn is particulate, then thetotal and dissolved values are separated by a space. The overlapping of blue triangle and greensquare signify that most of the dissolved Mn is “truly dissolved” and that the 0.22-µm filtering predicted the truly dissolved Mn. Only on a few occasions did the triangle and square notoverlap. When this occurs, there is colloidal Mn present—that is, Mn-oxide that is so small it passes through the 0.22-µm filter yet it will not pass through the ultrafilter.
Utility 2 . Figure 4.14 contains the distribution system Mn data for Utility 2, a Midwesternutility that has two parallel trains, both using groundwater as their source. One train (used year-round) is conventional gravity settling (CGS) preceded by aeration and KMnO4 oxidation, whilethe other process train (used seasonally) is manganese greensand. Utility 2 has a large differencein demand from summer to winter. It augments its summer water supply by pumping more waterfrom its primary wells and from sources not in use during the cooler months. The alternativesupplies tend to have more Mn and therefore add to the Mn loading, but these alternativesupplies are treated by the manganese greensand. This process train is effective at controlling theMn. The CGS process train suffers the most during increased flow periods. There is a reductionin hydraulic retention time that reduces the process’s ability to handle the Mn loading. The
distribution system was sampled during high and low demand periods. The spring and thesummer sampling events coincided with high demand periods. Also tripolyphosphate is added tothe plant effluent as a corrosion inhibitor.
In the winter (2/26/04) and fall (11/9/04) sampling, levels of total Mn were low (<0.010mg/L) and did not vary spatially. Most of the Mn in the winter and fall samples was particulate,i.e., very little dissolved Mn. During the warmer-season samplings (5/20/04 and 8/31/04) the Mnin the filter effluent at the entry to the distribution system was >0.040 mg/L. The Mnconcentration decreased through the distribution system. Additionally, in the spring and summer,colloidal manganese was detected in the entry-point sample. The colloidal Mn was still present atthe near sampling point, but was no longer present by the mid sampling point. Although the totalMn decreased through the system in spring/summer, it remained higher even out to the far
sampling point than the Mn in any part of the system during winter and late fall.Utility 9. Utility 9 (Figure 4.15) is a Mid-Atlantic surface water plant treating water by
conventional gravity settling and removing Mn constantly via IOCME. Throughout the course ofthis study, Mn was under control and the utility received no Mn-related customer complaints.There was very little Mn at any sampling point during any season. There is Mn in its sourcewater but its main source of Mn is in its ferric chloride coagulant. This utility also adds potassium permanganate in its raw water basin in the spring and summer to control taste andodor along with algal blooms. The Mn is effectively controlled, as none gets into the distributionsystem. This otherwise boring series of plots reinforces the effectiveness of the IOCME thatoften “runs in the background.” As discussed earlier and in other literature, such an effectivecontrol mechanism can work so well for so long that it is taken for granted, and only once it
becomes disrupted does it become known. The plots reveal that not only is Mn constantly lowcoming out of the treatment plant, it is low all through the distribution system all year long.
Utility 22. Utility 22 (Figure 4.16) is a Mid-Atlantic plant with surface water that treatsits water with advanced clarification followed by ozone. They treat Mn specifically bychlorinating the intermediate ozone effluent so that they pass the water through a chlorinatedfilter. In essence they are trying to recreate the IOCME effect they used to have prior to
©2006 AwwaRF. All Rights Reserved.

7/21/2019 Occurrence of Manganese in Drinking Water and Manganese Control
http://slidepdf.com/reader/full/occurrence-of-manganese-in-drinking-water-and-manganese-control 123/463
97
upgrading to intermediate ozone. In all but the spring (4/20/04) sampling, the total Mn level inthe plant effluent entering the distribution system was >0.01 mg/L. As with Utility 2, the Mnlevel generally decreased through the distribution system. Unlike Utility 2, there was no colloidalMn fraction. All Mn passing through the 0.22-µm filter also passed through the 30-kDa filter. Inthe three cases in which the entry Mn was >0.01 mg/L, there were only particulate and trulydissolved fractions. In the April sampling, the entry Mn was approximately 0.005 mg/L, anddecreased only slightly to 0.003 mg/L at the farthest sampling point. During this springsampling, all of the Mn present both at the entry to the distribution system and throughout thedistribution system was truly dissolved.
Utility 269. Utility 269 (Figure 4.17) is a groundwater facility in the Northwest that uses polyphosphates to sequester Mn. Note that the y-axis in these plots extends to 0.25 mg/L for thesummer and 0.20 mg/L for the winter. There were only two seasons sampled by this utility and, because the system is small, one sampling point was eliminated. Mn entering the distributionsystem was between 0.15 and 0.2 mg/L. Colloidal Mn was present at all three sampling locationsin the summer samples. In contrast to this, in the winter, only the entry sample point shows anyevidence of having colloidal Mn. In both sample sets, the use of polyphosphates maintained aMn residual of approximately 0.1 mg/L at the farthest sampling point.
©2006 AwwaRF. All Rights Reserved.
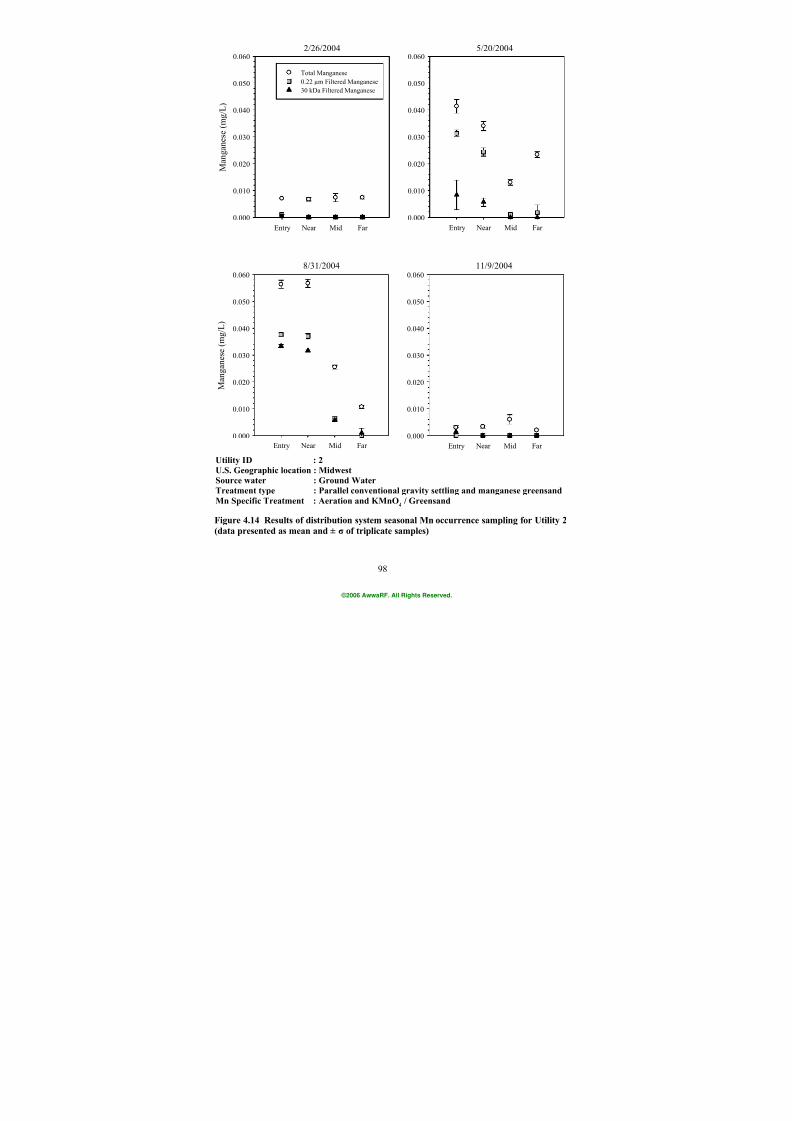
7/21/2019 Occurrence of Manganese in Drinking Water and Manganese Control
http://slidepdf.com/reader/full/occurrence-of-manganese-in-drinking-water-and-manganese-control 124/463
98
2/26/2004
Entry Near Mid Far
M a n g a n e s e ( m g / L )
0.000
0.010
0.020
0.030
0.040
0.050
0.0605/20/2004
Entry Near Mid Far
0.000
0.010
0.020
0.030
0.040
0.050
0.060
11/9/2004
Entry Near Mid Far
0.000
0.010
0.020
0.030
0.040
0.050
0.060
Total Manganese
0.22 µm Filtered Manganese
30 kDa Filtered Manganese
8/31/2004
Entry Near Mid Far
M a n g a n e s e ( m g / L )
0.000
0.010
0.020
0.030
0.040
0.050
0.060
Utility ID : 2
U.S. Geographic location : Midwest
Source water : Ground Water
Treatment type : Parallel conventional gravity settling and manganese greensand
Mn Specific Treatment : Aeration and KMnO4 / Greensand
Figure 4.14 Results of distribution system seasonal Mn occurrence sampling for Utility 2
(data presented as mean and ± σ of triplicate samples)
©2006 AwwaRF. All Rights Reserved.
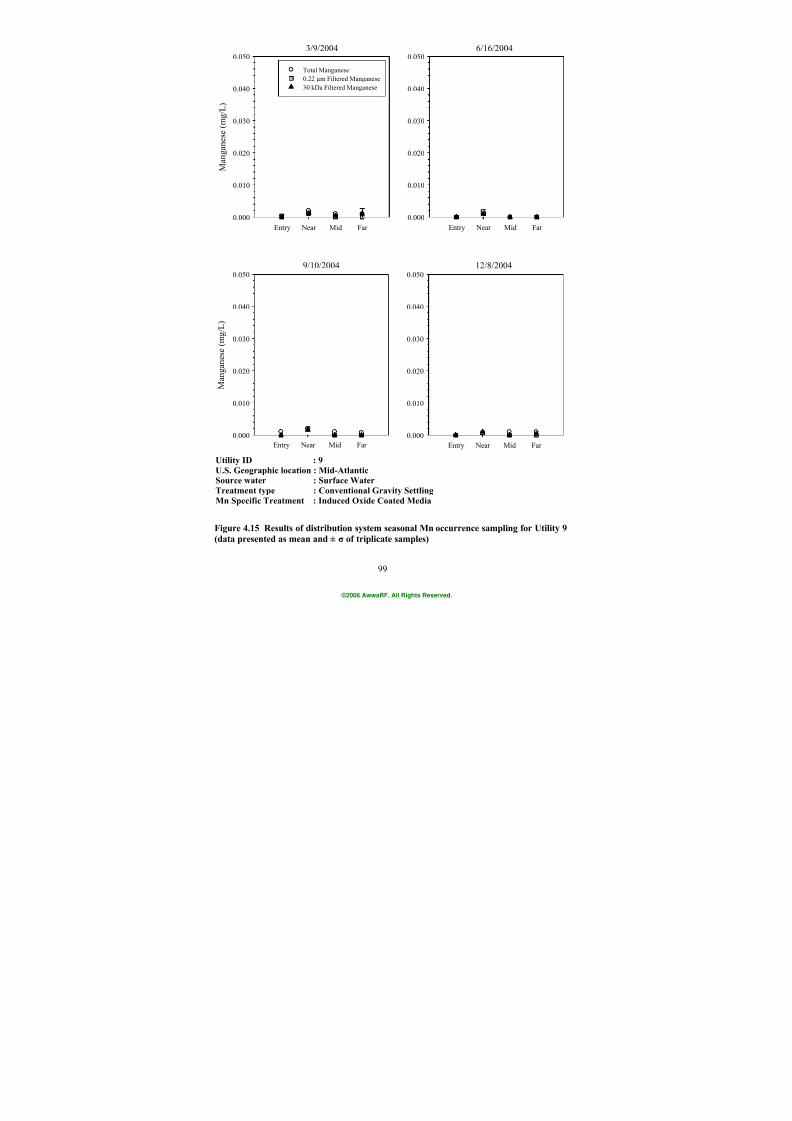
7/21/2019 Occurrence of Manganese in Drinking Water and Manganese Control
http://slidepdf.com/reader/full/occurrence-of-manganese-in-drinking-water-and-manganese-control 125/463
99
3/9/2004
Entry Near Mid Far
M a n g a n e s e ( m g / L )
0.000
0.010
0.020
0.030
0.040
0.0506/16/2004
Entry Near Mid Far
0.000
0.010
0.020
0.030
0.040
0.050
12/8/2004
Entry Near Mid Far
0.000
0.010
0.020
0.030
0.040
0.050
Total Manganese
0.22 µm Filtered Manganese
30 kDa Filtered Manganese
9/10/2004
Entry Near Mid Far
M a n g a n e s e ( m g / L )
0.000
0.010
0.020
0.030
0.040
0.050
Utility ID : 9
U.S. Geographic location : Mid-Atlantic
Source water : Surface Water
Treatment type : Conventional Gravity Settling
Mn Specific Treatment : Induced Oxide Coated Media
Figure 4.15 Results of distribution system seasonal Mn occurrence sampling for Utility 9
(data presented as mean and ± σ of triplicate samples)
©2006 AwwaRF. All Rights Reserved.
7/21/2019 Occurrence of Manganese in Drinking Water and Manganese Control
http://slidepdf.com/reader/full/occurrence-of-manganese-in-drinking-water-and-manganese-control 126/463
100
1/24/2004
Entry Near Mid Far
M a n g a n e s e ( m g / L )
0.000
0.010
0.020
0.030
0.040
0.0504/20/2004
Entry Near Mid Far
0.000
0.010
0.020
0.030
0.040
0.050
11/12/2005
Entry Near Mid Far
0.000
0.010
0.020
0.030
0.040
0.050
Total Manganese
0.22 µm Filtered Manganese
30 kDa Filtered Manganese
8/27/2004
Entry Near Mid Far
M a n g a n e s e ( m g / L )
0.000
0.010
0.020
0.030
0.040
0.050
Utility ID : 22
U.S. Geographic location : Mid-Atlantic
Source water : Surface water
Treatment type : Advanced clarification with intermediate ozone
Mn Specific Treatment : Induced oxide coated media - auxiliary KMnO4
Figure 4.16 Results of distribution system seasonal Mn occurrence sampling for Utility 22
(data presented as mean and ± σ of triplicate samples)
©2006 AwwaRF. All Rights Reserved.
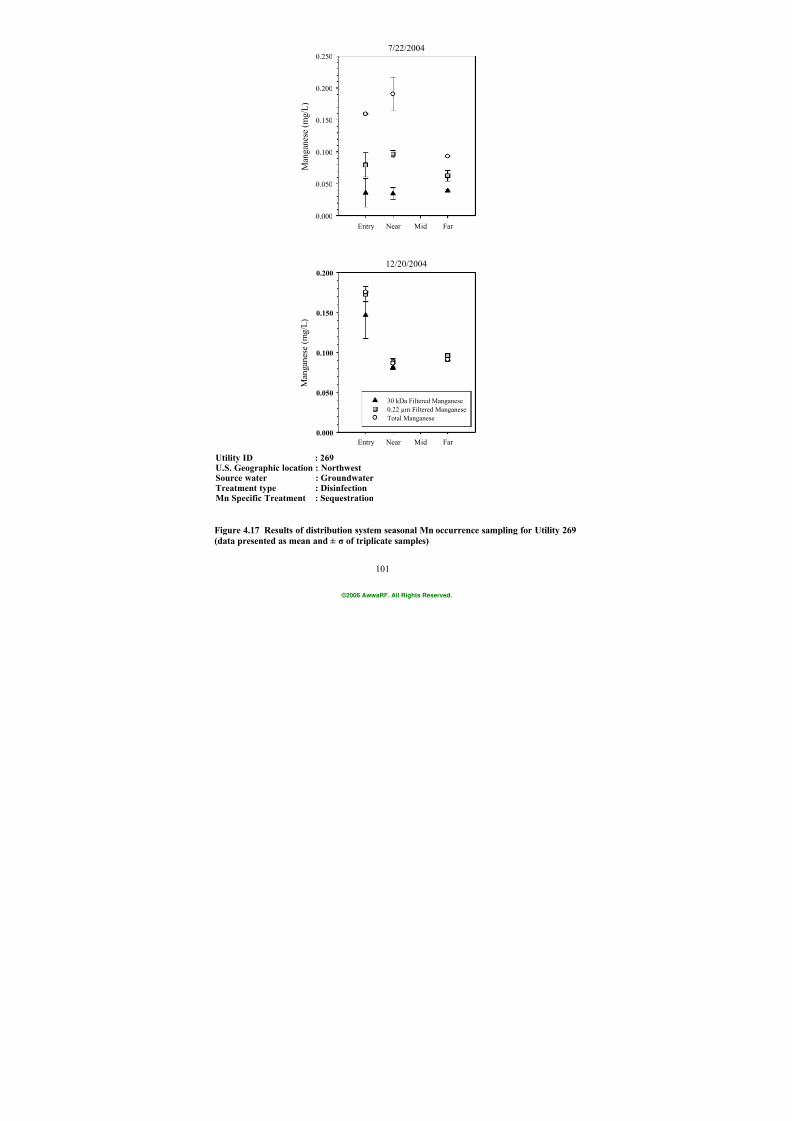
7/21/2019 Occurrence of Manganese in Drinking Water and Manganese Control
http://slidepdf.com/reader/full/occurrence-of-manganese-in-drinking-water-and-manganese-control 127/463
101
7/22/2004
Entry Near Mid Far
M a n g a n e s e ( m g / L )
0.000
0.050
0.100
0.150
0.200
0.250
12/20/2004
Entry Near Mid Far
M a n g a n e
s e ( m g / L )
0.000
0.050
0.100
0.150
0.200
30 kDa Filtered Manganese
0.22 µm Filtered Manganese
Total Manganese
Utility ID : 269U.S. Geographic location : Northwest
Source water : GroundwaterTreatment type : DisinfectionMn Specific Treatment : Sequestration
Figure 4.17 Results of distribution system seasonal Mn occurrence sampling for Utility 269
(data presented as mean and ± σ of triplicate samples)
©2006 AwwaRF. All Rights Reserved.
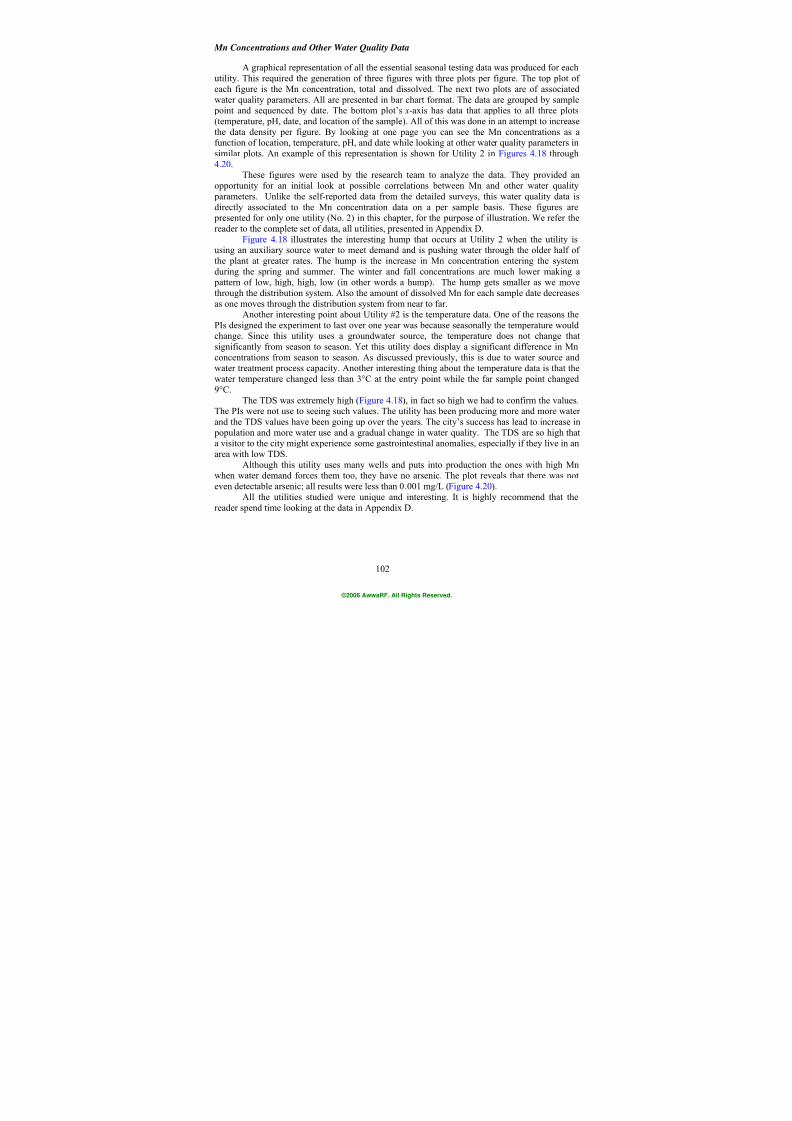
7/21/2019 Occurrence of Manganese in Drinking Water and Manganese Control
http://slidepdf.com/reader/full/occurrence-of-manganese-in-drinking-water-and-manganese-control 128/463
102
Mn Concentrations and Other Water Quality Data
A graphical representation of all the essential seasonal testing data was produced for eachutility. This required the generation of three figures with three plots per figure. The top plot ofeach figure is the Mn concentration, total and dissolved. The next two plots are of associatedwater quality parameters. All are presented in bar chart format. The data are grouped by sample point and sequenced by date. The bottom plot’s x-axis has data that applies to all three plots
(temperature, pH, date, and location of the sample). All of this was done in an attempt to increasethe data density per figure. By looking at one page you can see the Mn concentrations as afunction of location, temperature, pH, and date while looking at other water quality parameters insimilar plots. An example of this representation is shown for Utility 2 in Figures 4.18 through4.20.
These figures were used by the research team to analyze the data. They provided anopportunity for an initial look at possible correlations between Mn and other water quality parameters. Unlike the self-reported data from the detailed surveys, this water quality data isdirectly associated to the Mn concentration data on a per sample basis. These figures are presented for only one utility (No. 2) in this chapter, for the purpose of illustration. We refer thereader to the complete set of data, all utilities, presented in Appendix D.
Figure 4.18 illustrates the interesting hump that occurs at Utility 2 when the utility isusing an auxiliary source water to meet demand and is pushing water through the older half ofthe plant at greater rates. The hump is the increase in Mn concentration entering the systemduring the spring and summer. The winter and fall concentrations are much lower making a pattern of low, high, high, low (in other words a hump). The hump gets smaller as we movethrough the distribution system. Also the amount of dissolved Mn for each sample date decreasesas one moves through the distribution system from near to far.
Another interesting point about Utility #2 is the temperature data. One of the reasons thePIs designed the experiment to last over one year was because seasonally the temperature wouldchange. Since this utility uses a groundwater source, the temperature does not change thatsignificantly from season to season. Yet this utility does display a significant difference in Mn
concentrations from season to season. As discussed previously, this is due to water source andwater treatment process capacity. Another interesting thing about the temperature data is that thewater temperature changed less than 3°C at the entry point while the far sample point changed9°C.
The TDS was extremely high (Figure 4.18), in fact so high we had to confirm the values.The PIs were not use to seeing such values. The utility has been producing more and more waterand the TDS values have been going up over the years. The city’s success has lead to increase in population and more water use and a gradual change in water quality. The TDS are so high thata visitor to the city might experience some gastrointestinal anomalies, especially if they live in anarea with low TDS.
Although this utility uses many wells and puts into production the ones with high Mn
when water demand forces them too, they have no arsenic. The plot reveals that there was noteven detectable arsenic; all results were less than 0.001 mg/L (Figure 4.20).
All the utilities studied were unique and interesting. It is highly recommend that thereader spend time looking at the data in Appendix D.
©2006 AwwaRF. All Rights Reserved.
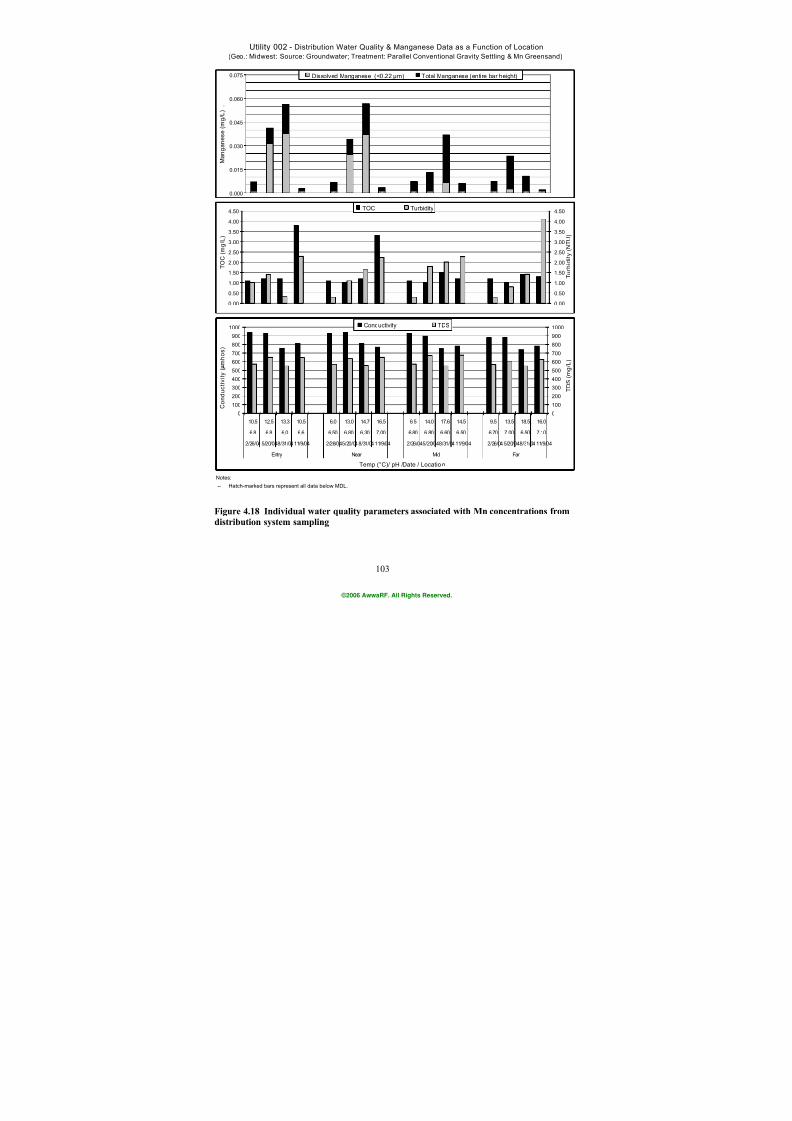
7/21/2019 Occurrence of Manganese in Drinking Water and Manganese Control
http://slidepdf.com/reader/full/occurrence-of-manganese-in-drinking-water-and-manganese-control 129/463
103
Utility 002 - Distribution Water Quality & Manganese Data as a Function of Location
(Geo.: Midwest; Source: Groundwater; Treatment: Parallel Conventional Gravity Settling & Mn Greensand)
Notes:
-- Hatch-marked bars represent all data below MDL.
0.00
0.50
1.00
1.50
2.00
2.50
3.00
3.50
4.00
4.50
T O C
( m g / L )
0.00
0.50
1.00
1.50
2.00
2.50
3.00
3.50
4.00
4.50
T u r b i d i t y ( N T U )
TOC Turbidity
0
100
200
300
400
500
600
700
800
900
1000
10.5 12.5 13.3 10.5 6.0 13.0 14.7 16.5 6.5 14.0 17.6 14.5 9.5 13.5 18.5 16.0
6.8 6.8 6.0 6.6 6.50 6.80 6.30 7.00 6.80 6.80 6.60 6.50 6.70 7.00 6.50 7.10
2/26/04 5/20/048/31/04 11/9/04 2/26/045/20/04 8/31/04 11/9/04 2/26/045/20/048/31/04 11/9/04 2/26/04 5/20/048/31/04 11/9/04
Entry Near Mid Far
Temp (°C)/ pH /Date / Locatio n
C o n d u c t i v i t y ( m h o s )
0
100
200
300
400
500
600
700
800
900
1000
T D S ( m g / L )
Conductivity TDS
0.000
0.015
0.030
0.045
0.060
0.075
M a n g a n e s e ( m g / L ) .
Dissolved Manganese (<0.22 µm) Total Manganese (entire bar height)
Figure 4.18 Individual water quality parameters associated with Mn concentrations from
distribution system sampling
©2006 AwwaRF. All Rights Reserved.
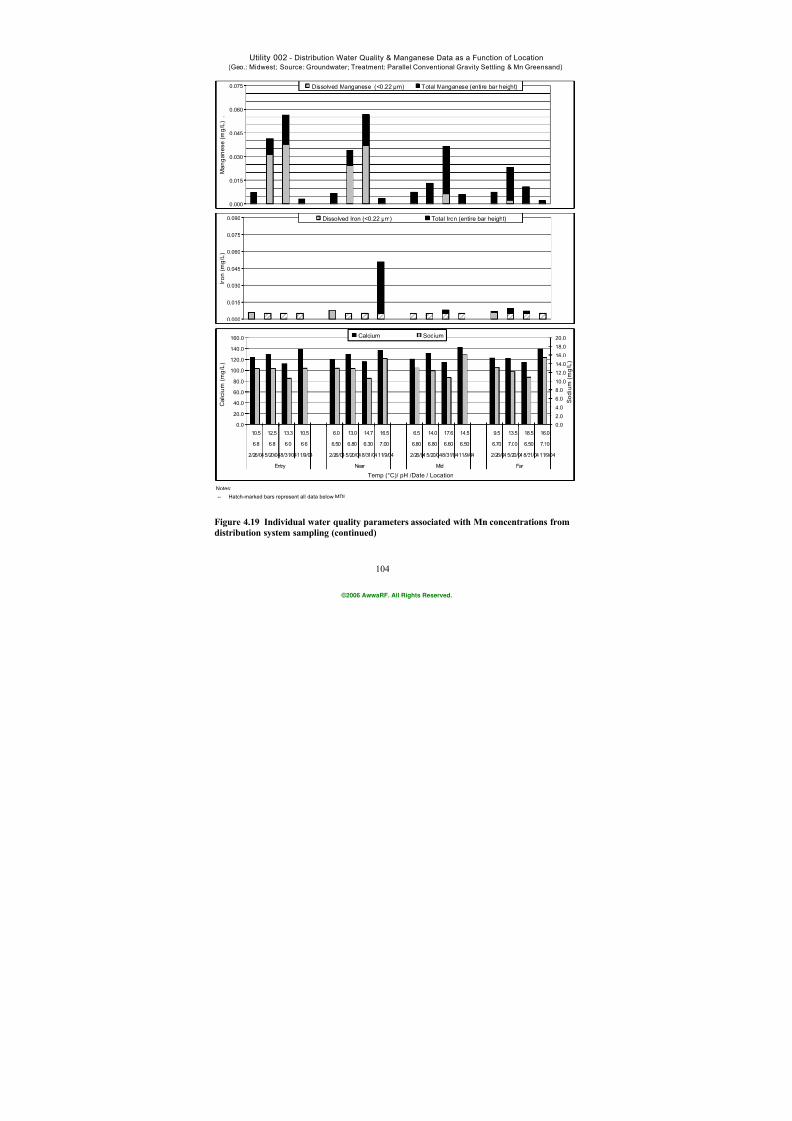
7/21/2019 Occurrence of Manganese in Drinking Water and Manganese Control
http://slidepdf.com/reader/full/occurrence-of-manganese-in-drinking-water-and-manganese-control 130/463
104
Utility 002 - Distribution Water Quality & Manganese Data as a Function of Location
(Geo.: Midwest; Source: Groundwater; Treatment: Parallel Conventional Gravity Settling & Mn Greensand)
Notes:
-- Hatch-marked bars represent all data below MDL.
0.0
20.0
40.0
60.0
80.0
100.0
120.0
140.0
160.0
10.5 12.5 13.3 10.5 6.0 13.0 14.7 16.5 6.5 14.0 17.6 14.5 9.5 13.5 18.5 16.0
6.8 6.8 6.0 6.6 6.50 6.80 6.30 7.00 6.80 6.80 6.60 6.50 6.70 7.00 6.50 7.10
2/26/04 5/20/048/31/0411/9/04 2/26/04 5/20/04 8/31/04 11/9/04 2/26/04 5/20/048/31/0411/9/04 2/26/04 5/20/04 8/31/04 11/9/04
Entry Near Mid Far
Temp (°C)/ pH /Date / Location
C a l c i u m ( m
g / L )
0.0
2.0
4.0
6.0
8.0
10.0
12.0
14.016.0
18.0
20.0
S o d i u m ( m
g / L )
Calcium Sodium
0.000
0.015
0.030
0.045
0.060
0.075
0.090
I r o n ( m g / L )
Dissolved Iron (<0.22 µm) Total Iron (entire bar height)
0.000
0.015
0.030
0.045
0.060
0.075
M a n g a n e s e ( m g / L ) .
Dissolved Manganese (<0.22 µm) Total Manganese (entire bar height)
Figure 4.19 Individual water quality parameters associated with Mn concentrations from
distribution system sampling (continued)
©2006 AwwaRF. All Rights Reserved.
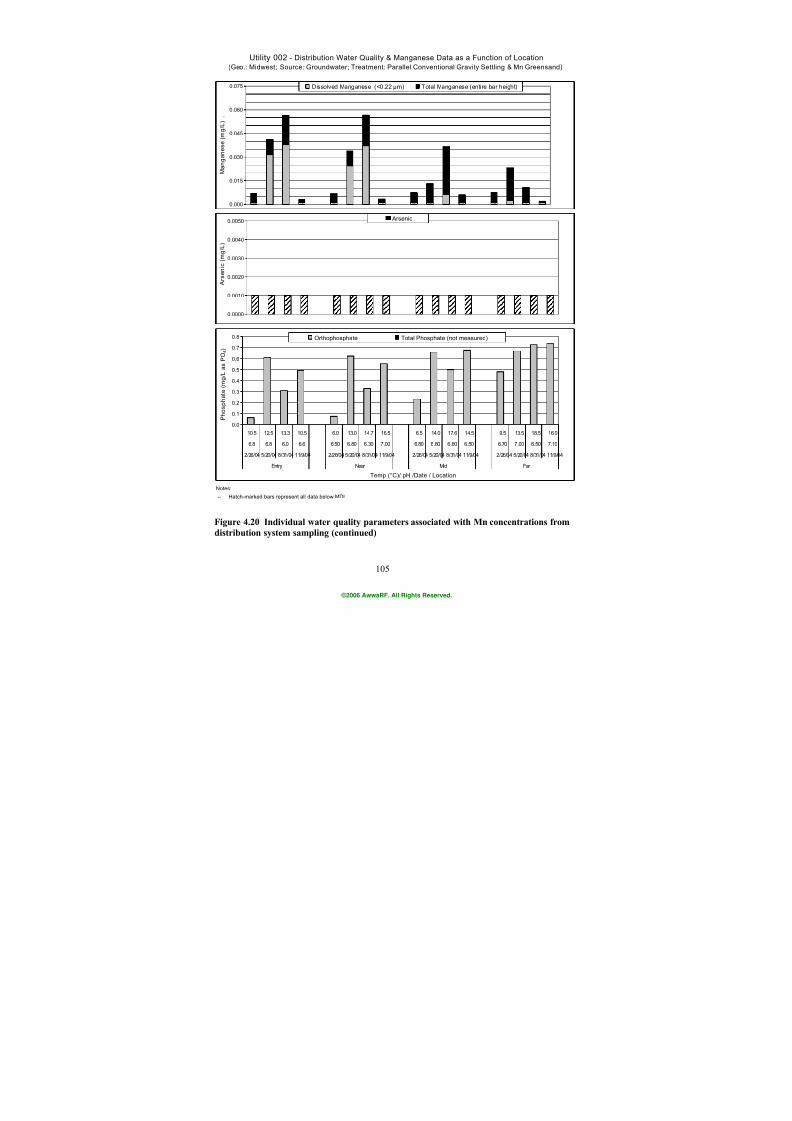
7/21/2019 Occurrence of Manganese in Drinking Water and Manganese Control
http://slidepdf.com/reader/full/occurrence-of-manganese-in-drinking-water-and-manganese-control 131/463
105
Utility 002 - Distribution Water Quality & Manganese Data as a Function of Location
(Geo.: Midwest; Source: Groundwater; Treatment: Parallel Conventional Gravity Settling & Mn Greensand)
Notes:
-- Hatch-marked bars represent all data below MDL.
0.0
0.1
0.2
0.3
0.4
0.5
0.6
0.7
0.8
10.5 12.5 13.3 10.5 6.0 13.0 14.7 16.5 6.5 14.0 17.6 14.5 9.5 13.5 18.5 16.0
6.8 6.8 6.0 6.6 6.50 6.80 6.30 7.00 6.80 6.80 6.60 6.50 6.70 7.00 6.50 7.10
2/26/04 5/20/04 8/31/04 11/9/04 2/26/04 5/20/04 8/31/04 11/9/04 2/26/04 5/20/04 8/31/04 11/9/04 2/26/04 5/20/04 8/31/04 11/9/04
Entry Near Mid Far
Temp (°C)/ pH /Date / Location
P h o s p h a t e ( m g / L a s P O
4 )
Orthophosphate Total Phosphate (not measured)
0.0000
0.0010
0.0020
0.0030
0.0040
0.0050
A r s e n i c ( m g / L )
Arsenic
0.000
0.015
0.030
0.045
0.060
0.075
M a n g a n e s e ( m g / L ) .
Dissolved Manganese (<0.22 µm) Total Manganese (entire bar height)
Figure 4.20 Individual water quality parameters associated with Mn concentrations from
distribution system sampling (continued)
©2006 AwwaRF. All Rights Reserved.
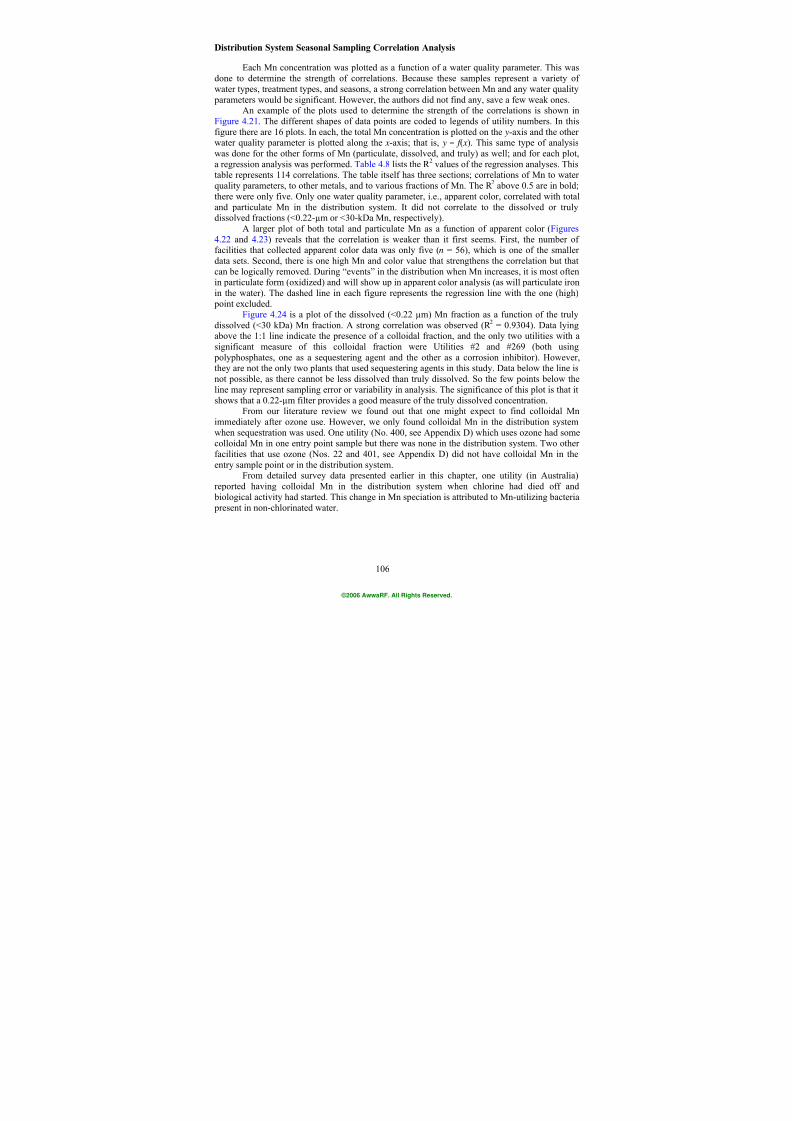
7/21/2019 Occurrence of Manganese in Drinking Water and Manganese Control
http://slidepdf.com/reader/full/occurrence-of-manganese-in-drinking-water-and-manganese-control 132/463
106
Distribution System Seasonal Sampling Correlation Analysis
Each Mn concentration was plotted as a function of a water quality parameter. This wasdone to determine the strength of correlations. Because these samples represent a variety ofwater types, treatment types, and seasons, a strong correlation between Mn and any water quality parameters would be significant. However, the authors did not find any, save a few weak ones.
An example of the plots used to determine the strength of the correlations is shown in
Figure 4.21. The different shapes of data points are coded to legends of utility numbers. In thisfigure there are 16 plots. In each, the total Mn concentration is plotted on the y-axis and the otherwater quality parameter is plotted along the x-axis; that is, y = f ( x). This same type of analysiswas done for the other forms of Mn (particulate, dissolved, and truly) as well; and for each plot,a regression analysis was performed. Table 4.8 lists the R
2 values of the regression analyses. This
table represents 114 correlations. The table itself has three sections; correlations of Mn to waterquality parameters, to other metals, and to various fractions of Mn. The R 2 above 0.5 are in bold;there were only five. Only one water quality parameter, i.e., apparent color, correlated with totaland particulate Mn in the distribution system. It did not correlate to the dissolved or trulydissolved fractions (<0.22-µm or <30-kDa Mn, respectively).
A larger plot of both total and particulate Mn as a function of apparent color (Figures
4.22 and 4.23) reveals that the correlation is weaker than it first seems. First, the number offacilities that collected apparent color data was only five (n = 56), which is one of the smallerdata sets. Second, there is one high Mn and color value that strengthens the correlation but thatcan be logically removed. During “events” in the distribution when Mn increases, it is most oftenin particulate form (oxidized) and will show up in apparent color analysis (as will particulate ironin the water). The dashed line in each figure represents the regression line with the one (high) point excluded.
Figure 4.24 is a plot of the dissolved (<0.22 µm) Mn fraction as a function of the trulydissolved (<30 kDa) Mn fraction. A strong correlation was observed (R 2 = 0.9304). Data lyingabove the 1:1 line indicate the presence of a colloidal fraction, and the only two utilities with asignificant measure of this colloidal fraction were Utilities #2 and #269 (both using
polyphosphates, one as a sequestering agent and the other as a corrosion inhibitor). However,they are not the only two plants that used sequestering agents in this study. Data below the line isnot possible, as there cannot be less dissolved than truly dissolved. So the few points below theline may represent sampling error or variability in analysis. The significance of this plot is that itshows that a 0.22-µm filter provides a good measure of the truly dissolved concentration.
From our literature review we found out that one might expect to find colloidal Mnimmediately after ozone use. However, we only found colloidal Mn in the distribution systemwhen sequestration was used. One utility (No. 400, see Appendix D) which uses ozone had somecolloidal Mn in one entry point sample but there was none in the distribution system. Two otherfacilities that use ozone (Nos. 22 and 401, see Appendix D) did not have colloidal Mn in theentry sample point or in the distribution system.
From detailed survey data presented earlier in this chapter, one utility (in Australia)reported having colloidal Mn in the distribution system when chlorine had died off and biological activity had started. This change in Mn speciation is attributed to Mn-utilizing bacteria present in non-chlorinated water.
©2006 AwwaRF. All Rights Reserved.
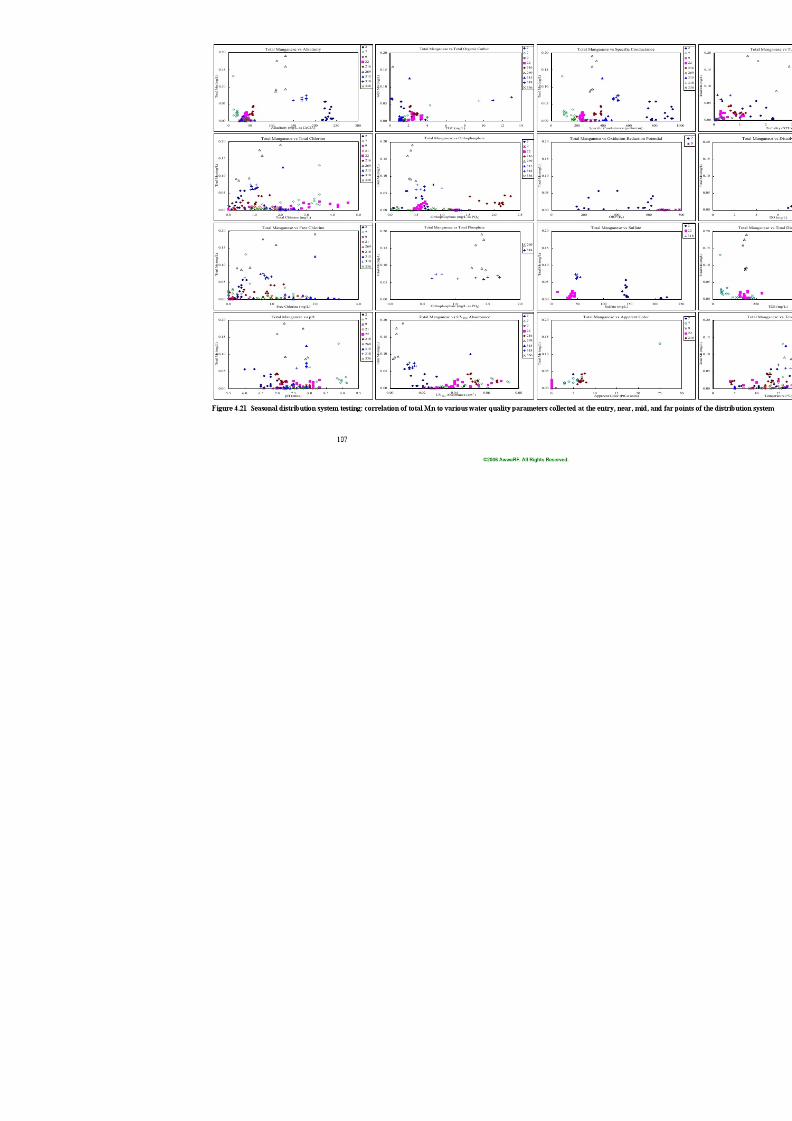
7/21/2019 Occurrence of Manganese in Drinking Water and Manganese Control
http://slidepdf.com/reader/full/occurrence-of-manganese-in-drinking-water-and-manganese-control 133/463

7/21/2019 Occurrence of Manganese in Drinking Water and Manganese Control
http://slidepdf.com/reader/full/occurrence-of-manganese-in-drinking-water-and-manganese-control 134/463
108
©2006 AwwaRF. All Rights Reserved.
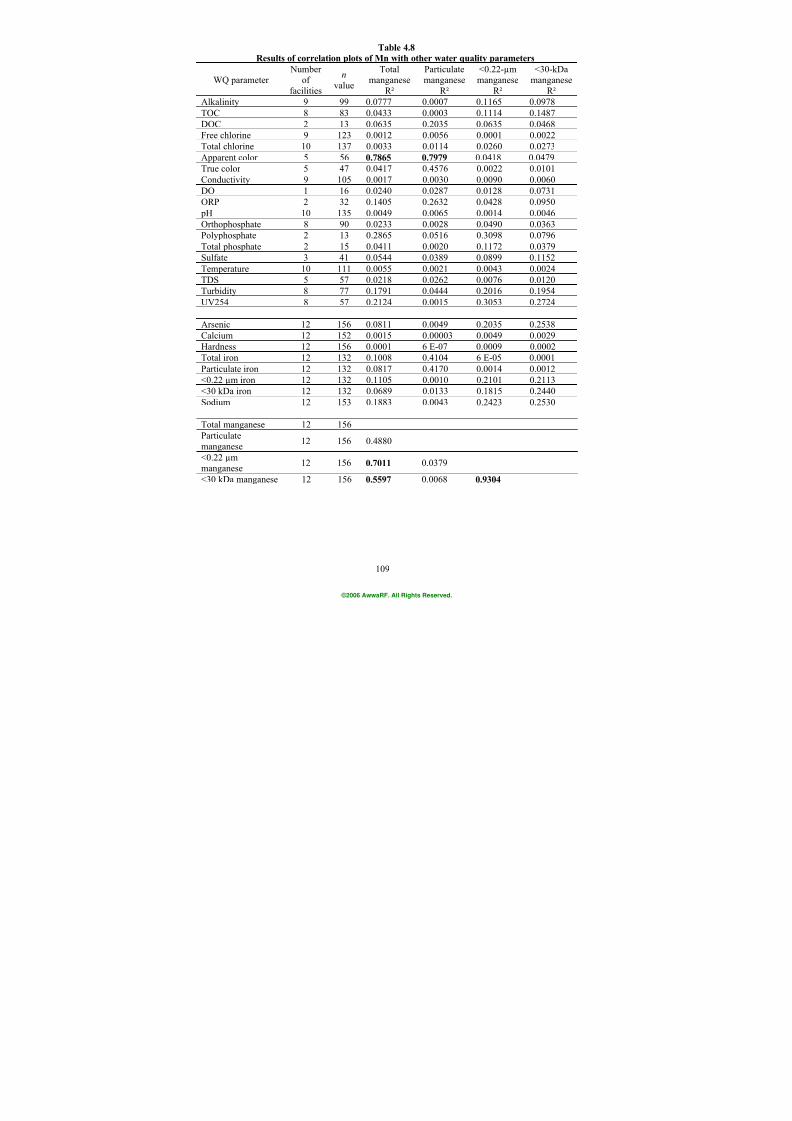
7/21/2019 Occurrence of Manganese in Drinking Water and Manganese Control
http://slidepdf.com/reader/full/occurrence-of-manganese-in-drinking-water-and-manganese-control 135/463
109
Table 4.8
Results of correlation plots of Mn with other water quality parameters
WQ parameter Number
offacilities
n
value
Totalmanganese
R²
Particulatemanganese
R²
<0.22-µmmanganese
R²
<30-kDamanganese
R²
Alkalinity 9 99 0.0777 0.0007 0.1165 0.0978
TOC 8 83 0.0433 0.0003 0.1114 0.1487
DOC 2 13 0.0635 0.2035 0.0635 0.0468
Free chlorine 9 123 0.0012 0.0056 0.0001 0.0022
Total chlorine 10 137 0.0033 0.0114 0.0260 0.0273
Apparent color 5 56 0.7865 0.7979 0.0418 0.0479
True color 5 47 0.0417 0.4576 0.0022 0.0101
Conductivity 9 105 0.0017 0.0030 0.0090 0.0060
DO 1 16 0.0240 0.0287 0.0128 0.0731
ORP 2 32 0.1405 0.2632 0.0428 0.0950
pH 10 135 0.0049 0.0065 0.0014 0.0046
Orthophosphate 8 90 0.0233 0.0028 0.0490 0.0363
Polyphosphate 2 13 0.2865 0.0516 0.3098 0.0796Total phosphate 2 15 0.0411 0.0020 0.1172 0.0379
Sulfate 3 41 0.0544 0.0389 0.0899 0.1152
Temperature 10 111 0.0055 0.0021 0.0043 0.0024
TDS 5 57 0.0218 0.0262 0.0076 0.0120
Turbidity 8 77 0.1791 0.0444 0.2016 0.1954
UV254 8 57 0.2124 0.0015 0.3053 0.2724
Arsenic 12 156 0.0811 0.0049 0.2035 0.2538
Calcium 12 152 0.0015 0.00003 0.0049 0.0029
Hardness 12 156 0.0001 6 E-07 0.0009 0.0002
Total iron 12 132 0.1008 0.4104 6 E-05 0.0001Particulate iron 12 132 0.0817 0.4170 0.0014 0.0012
<0.22 µm iron 12 132 0.1105 0.0010 0.2101 0.2113
<30 kDa iron 12 132 0.0689 0.0133 0.1815 0.2440
Sodium 12 153 0.1883 0.0043 0.2423 0.2530
Total manganese 12 156
Particulatemanganese
12 156 0.4880
<0.22 µmmanganese
12 156 0.7011 0.0379
<30 kDa manganese 12 156 0.5597 0.0068 0.9304
©2006 AwwaRF. All Rights Reserved.
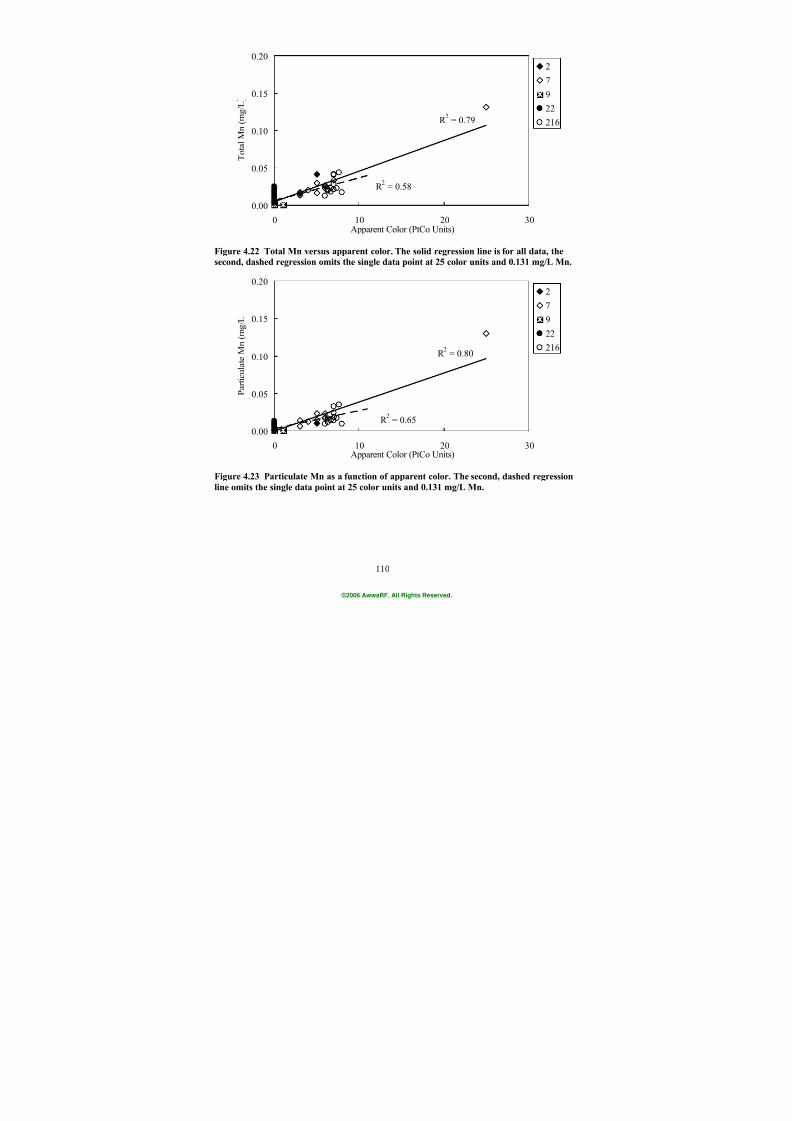
7/21/2019 Occurrence of Manganese in Drinking Water and Manganese Control
http://slidepdf.com/reader/full/occurrence-of-manganese-in-drinking-water-and-manganese-control 136/463
110
R 2 = 0.79
R 2 = 0.58
0.00
0.05
0.10
0.15
0.20
0 10 20 30Apparent Color (PtCo Units)
T o t a l M n ( m
g / L
2
7
9
22
216
Figure 4.22 Total Mn versus apparent color. The solid regression line is for all data, the
second, dashed regression omits the single data point at 25 color units and 0.131 mg/L Mn.
R
2
= 0.80
R 2 = 0.65
0.00
0.05
0.10
0.15
0.20
0 10 20 30Apparent Color (PtCo Units)
P a r t i c u l a t e M n ( m g / L
2
7
9
22
216
Figure 4.23 Particulate Mn as a function of apparent color. The second, dashed regressionline omits the single data point at 25 color units and 0.131 mg/L Mn.
©2006 AwwaRF. All Rights Reserved.
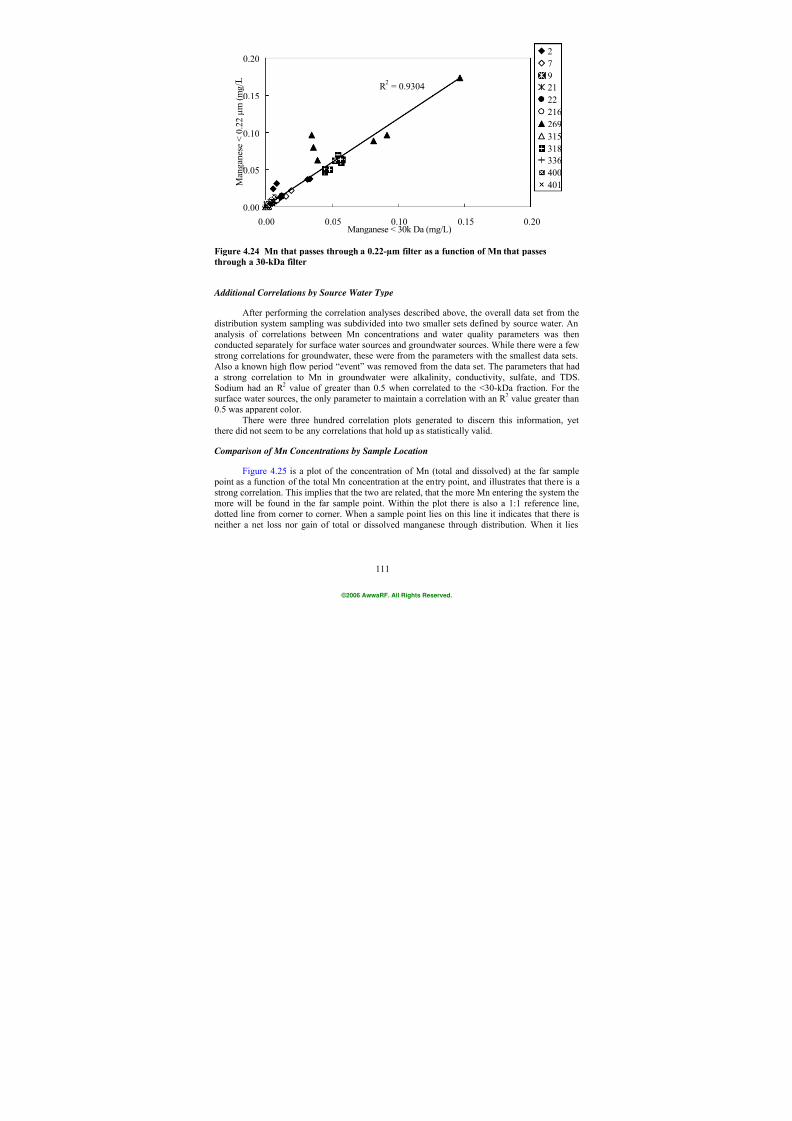
7/21/2019 Occurrence of Manganese in Drinking Water and Manganese Control
http://slidepdf.com/reader/full/occurrence-of-manganese-in-drinking-water-and-manganese-control 137/463
111
R 2 = 0.9304
0.00
0.05
0.10
0.15
0.20
0.00 0.05 0.10 0.15 0.20Manganese < 30k Da (mg/L)
M a n g a n e s e < 0 . 2 2
µ m ( m g /
2
7
9
21
22
216
269
315
318
336
400
401
Figure 4.24 Mn that passes through a 0.22-µm filter as a function of Mn that passes
through a 30-kDa filter
Additional Correlations by Source Water Type
After performing the correlation analyses described above, the overall data set from thedistribution system sampling was subdivided into two smaller sets defined by source water. Ananalysis of correlations between Mn concentrations and water quality parameters was thenconducted separately for surface water sources and groundwater sources. While there were a few
strong correlations for groundwater, these were from the parameters with the smallest data sets.Also a known high flow period “event” was removed from the data set. The parameters that hada strong correlation to Mn in groundwater were alkalinity, conductivity, sulfate, and TDS.Sodium had an R
2 value of greater than 0.5 when correlated to the <30-kDa fraction. For the
surface water sources, the only parameter to maintain a correlation with an R 2 value greater than0.5 was apparent color.
There were three hundred correlation plots generated to discern this information, yetthere did not seem to be any correlations that hold up as statistically valid.
Comparison of Mn Concentrations by Sample Location
Figure 4.25 is a plot of the concentration of Mn (total and dissolved) at the far sample point as a function of the total Mn concentration at the entry point, and illustrates that there is astrong correlation. This implies that the two are related, that the more Mn entering the system themore will be found in the far sample point. Within the plot there is also a 1:1 reference line,dotted line from corner to corner. When a sample point lies on this line it indicates that there isneither a net loss nor gain of total or dissolved manganese through distribution. When it lies
©2006 AwwaRF. All Rights Reserved.
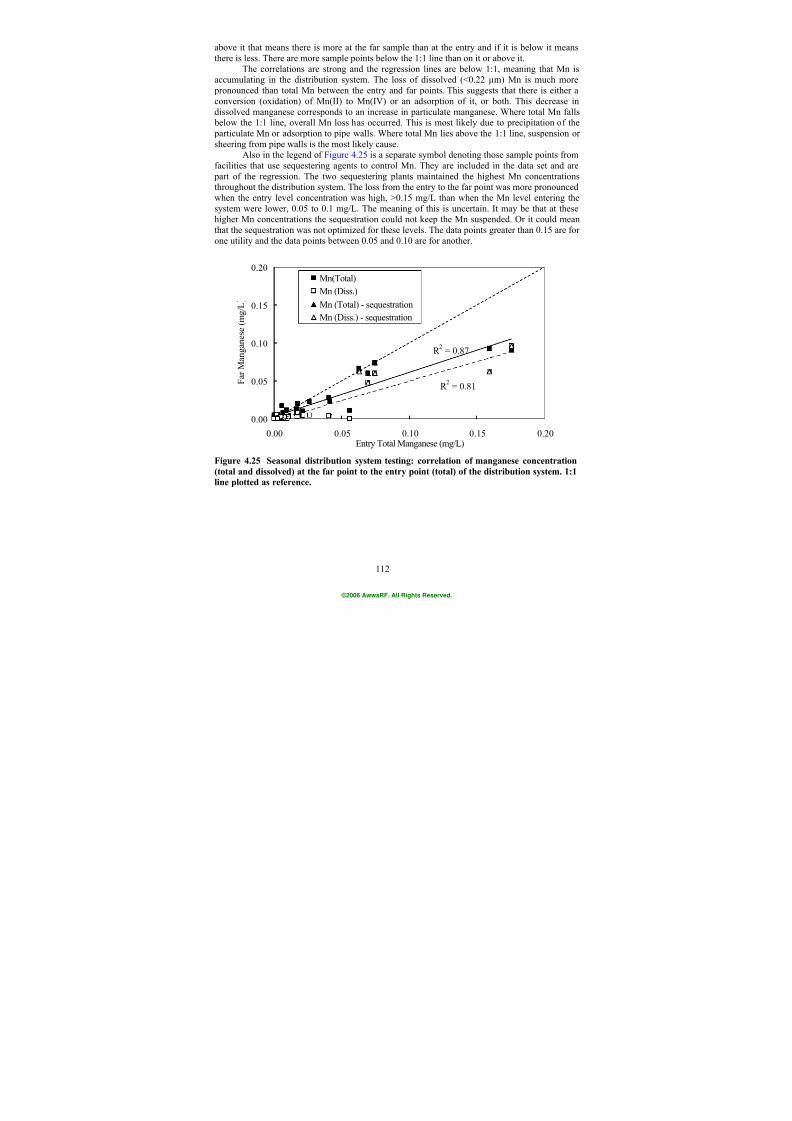
7/21/2019 Occurrence of Manganese in Drinking Water and Manganese Control
http://slidepdf.com/reader/full/occurrence-of-manganese-in-drinking-water-and-manganese-control 138/463
112
above it that means there is more at the far sample than at the entry and if it is below it meansthere is less. There are more sample points below the 1:1 line than on it or above it.
The correlations are strong and the regression lines are below 1:1, meaning that Mn isaccumulating in the distribution system. The loss of dissolved (<0.22 µm) Mn is much more pronounced than total Mn between the entry and far points. This suggests that there is either aconversion (oxidation) of Mn(II) to Mn(IV) or an adsorption of it, or both. This decrease indissolved manganese corresponds to an increase in particulate manganese. Where total Mn falls below the 1:1 line, overall Mn loss has occurred. This is most likely due to precipitation of the particulate Mn or adsorption to pipe walls. Where total Mn lies above the 1:1 line, suspension orsheering from pipe walls is the most likely cause.
Also in the legend of Figure 4.25 is a separate symbol denoting those sample points fromfacilities that use sequestering agents to control Mn. They are included in the data set and are part of the regression. The two sequestering plants maintained the highest Mn concentrationsthroughout the distribution system. The loss from the entry to the far point was more pronouncedwhen the entry level concentration was high, >0.15 mg/L than when the Mn level entering thesystem were lower, 0.05 to 0.1 mg/L. The meaning of this is uncertain. It may be that at thesehigher Mn concentrations the sequestration could not keep the Mn suspended. Or it could meanthat the sequestration was not optimized for these levels. The data points greater than 0.15 are for
one utility and the data points between 0.05 and 0.10 are for another.
R 2 = 0.87
R 2 = 0.81
0.00
0.05
0.10
0.15
0.20
0.00 0.05 0.10 0.15 0.20Entry Total Manganese (mg/L)
F a r M a n
g a n e s e ( m g / L
Mn(Total)
Mn (Diss.)
Mn (Total) - sequestration
Mn (Diss.) - sequestration
Figure 4.25 Seasonal distribution system testing: correlation of manganese concentration
(total and dissolved) at the far point to the entry point (total) of the distribution system. 1:1line plotted as reference.
©2006 AwwaRF. All Rights Reserved.
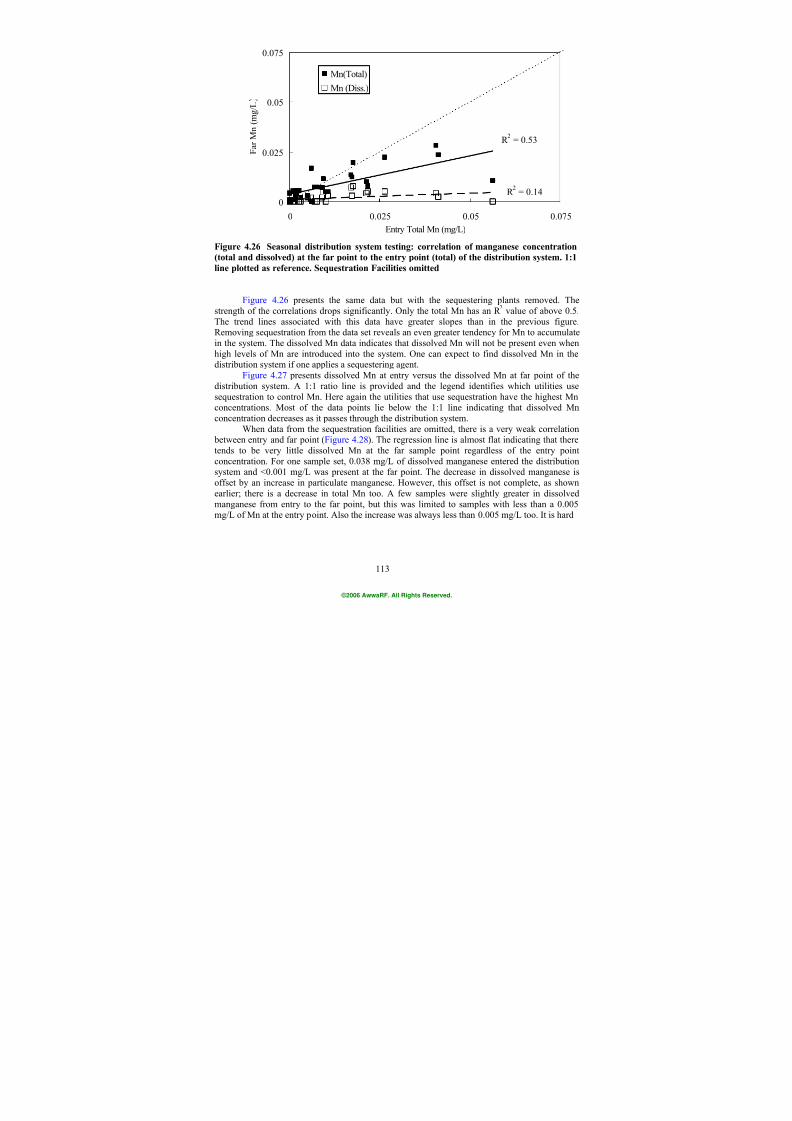
7/21/2019 Occurrence of Manganese in Drinking Water and Manganese Control
http://slidepdf.com/reader/full/occurrence-of-manganese-in-drinking-water-and-manganese-control 139/463
113
R 2 = 0.53
R 2 = 0.14
0
0.025
0.05
0.075
0 0.025 0.05 0.075
Entry Total Mn (mg/L)
F a r M n ( m
g / L
Mn(Total)
Mn (Diss.)
Figure 4.26 Seasonal distribution system testing: correlation of manganese concentration
(total and dissolved) at the far point to the entry point (total) of the distribution system. 1:1
line plotted as reference. Sequestration Facilities omitted
Figure 4.26 presents the same data but with the sequestering plants removed. Thestrength of the correlations drops significantly. Only the total Mn has an R 2 value of above 0.5.The trend lines associated with this data have greater slopes than in the previous figure.Removing sequestration from the data set reveals an even greater tendency for Mn to accumulatein the system. The dissolved Mn data indicates that dissolved Mn will not be present even when
high levels of Mn are introduced into the system. One can expect to find dissolved Mn in thedistribution system if one applies a sequestering agent.Figure 4.27 presents dissolved Mn at entry versus the dissolved Mn at far point of the
distribution system. A 1:1 ratio line is provided and the legend identifies which utilities usesequestration to control Mn. Here again the utilities that use sequestration have the highest Mnconcentrations. Most of the data points lie below the 1:1 line indicating that dissolved Mnconcentration decreases as it passes through the distribution system.
When data from the sequestration facilities are omitted, there is a very weak correlation between entry and far point (Figure 4.28). The regression line is almost flat indicating that theretends to be very little dissolved Mn at the far sample point regardless of the entry pointconcentration. For one sample set, 0.038 mg/L of dissolved manganese entered the distribution
system and <0.001 mg/L was present at the far point. The decrease in dissolved manganese isoffset by an increase in particulate manganese. However, this offset is not complete, as shownearlier; there is a decrease in total Mn too. A few samples were slightly greater in dissolvedmanganese from entry to the far point, but this was limited to samples with less than a 0.005mg/L of Mn at the entry point. Also the increase was always less than 0.005 mg/L too. It is hard
©2006 AwwaRF. All Rights Reserved.
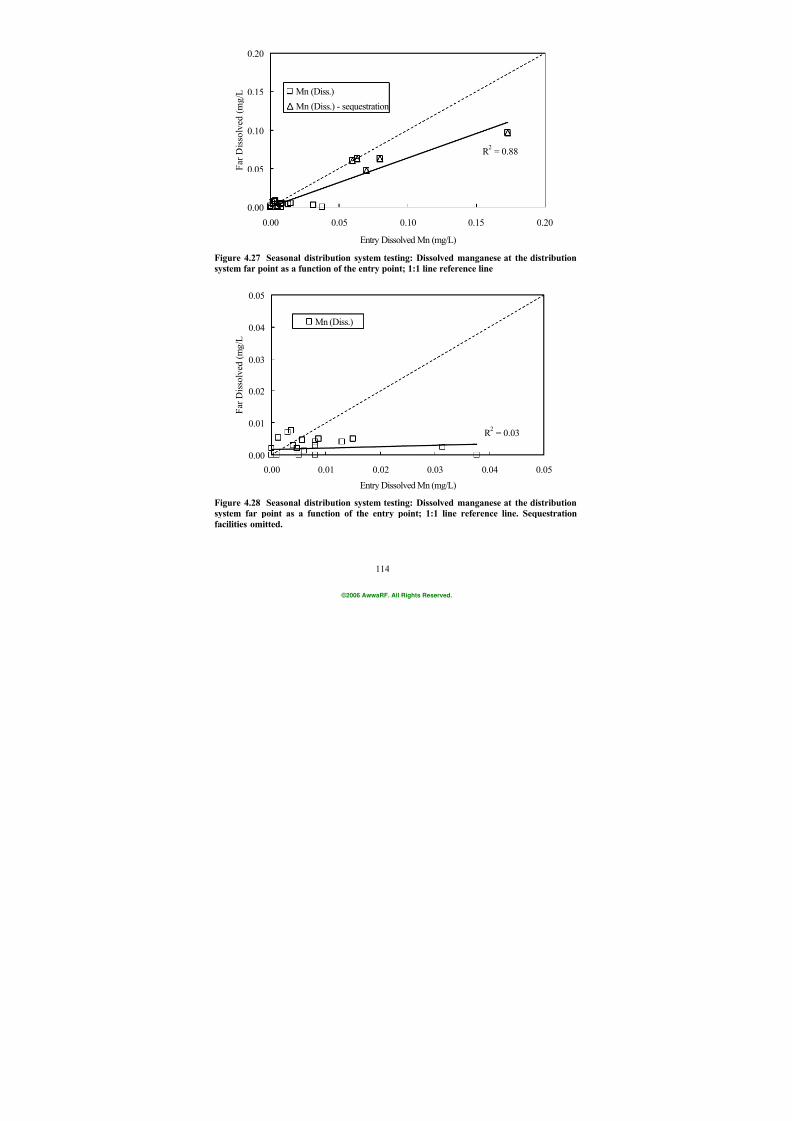
7/21/2019 Occurrence of Manganese in Drinking Water and Manganese Control
http://slidepdf.com/reader/full/occurrence-of-manganese-in-drinking-water-and-manganese-control 140/463
114
R 2 = 0.88
0.00
0.05
0.10
0.15
0.20
0.00 0.05 0.10 0.15 0.20
Entry Dissolved Mn (mg/L)
F a r D i s s o l v e d
( m g / L Mn (Diss.)
Mn (Diss.) - sequestration
Figure 4.27 Seasonal distribution system testing: Dissolved manganese at the distribution
system far point as a function of the entry point; 1:1 line reference line
R 2 = 0.03
0.00
0.01
0.02
0.03
0.04
0.05
0.00 0.01 0.02 0.03 0.04 0.05
Entry Dissolved Mn (mg/L)
F a r D i s s o l v e d ( m g / L
Mn (Diss.)
Figure 4.28 Seasonal distribution system testing: Dissolved manganese at the distribution
system far point as a function of the entry point; 1:1 line reference line. Sequestration
facilities omitted.
©2006 AwwaRF. All Rights Reserved.
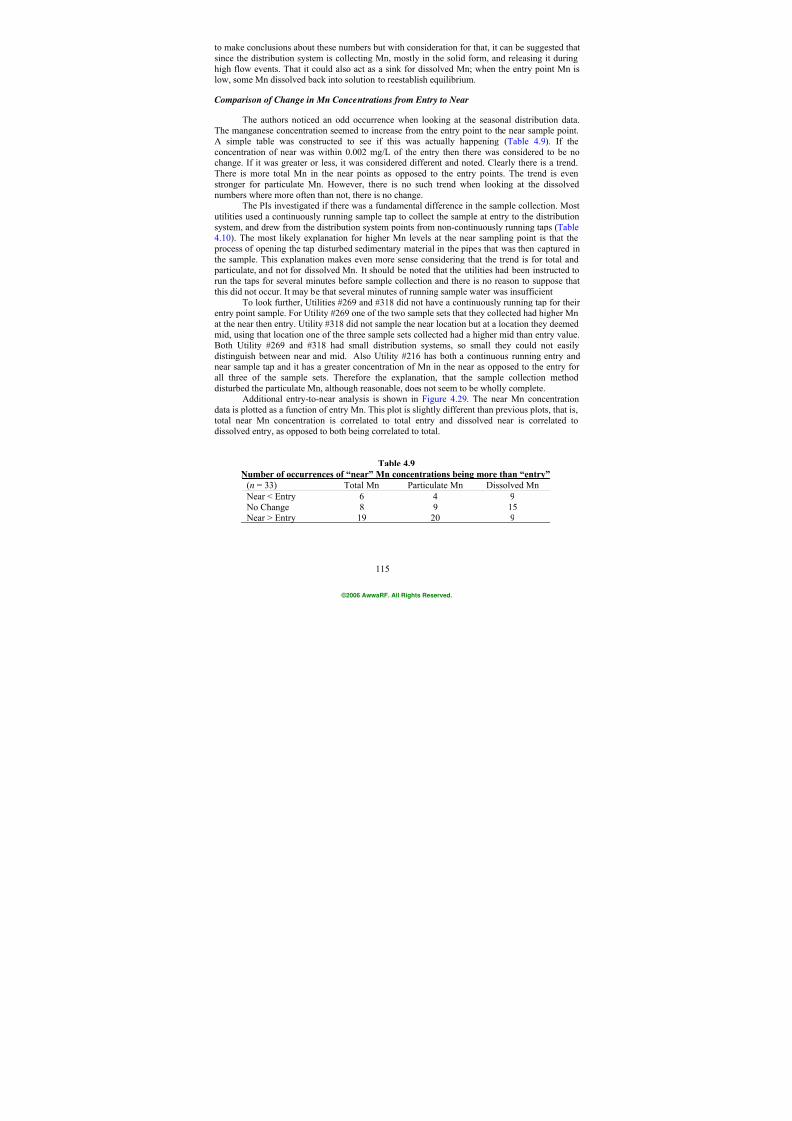
7/21/2019 Occurrence of Manganese in Drinking Water and Manganese Control
http://slidepdf.com/reader/full/occurrence-of-manganese-in-drinking-water-and-manganese-control 141/463
115
to make conclusions about these numbers but with consideration for that, it can be suggested thatsince the distribution system is collecting Mn, mostly in the solid form, and releasing it duringhigh flow events. That it could also act as a sink for dissolved Mn; when the entry point Mn islow, some Mn dissolved back into solution to reestablish equilibrium.
Comparison of Change in Mn Concentrations from Entry to Near
The authors noticed an odd occurrence when looking at the seasonal distribution data.The manganese concentration seemed to increase from the entry point to the near sample point.A simple table was constructed to see if this was actually happening (Table 4.9). If theconcentration of near was within 0.002 mg/L of the entry then there was considered to be nochange. If it was greater or less, it was considered different and noted. Clearly there is a trend.There is more total Mn in the near points as opposed to the entry points. The trend is evenstronger for particulate Mn. However, there is no such trend when looking at the dissolvednumbers where more often than not, there is no change.
The PIs investigated if there was a fundamental difference in the sample collection. Mostutilities used a continuously running sample tap to collect the sample at entry to the distributionsystem, and drew from the distribution system points from non-continuously running taps (Table
4.10). The most likely explanation for higher Mn levels at the near sampling point is that the process of opening the tap disturbed sedimentary material in the pipes that was then captured inthe sample. This explanation makes even more sense considering that the trend is for total and particulate, and not for dissolved Mn. It should be noted that the utilities had been instructed torun the taps for several minutes before sample collection and there is no reason to suppose thatthis did not occur. It may be that several minutes of running sample water was insufficient
To look further, Utilities #269 and #318 did not have a continuously running tap for theirentry point sample. For Utility #269 one of the two sample sets that they collected had higher Mnat the near then entry. Utility #318 did not sample the near location but at a location they deemedmid, using that location one of the three sample sets collected had a higher mid than entry value.Both Utility #269 and #318 had small distribution systems, so small they could not easily
distinguish between near and mid. Also Utility #216 has both a continuous running entry andnear sample tap and it has a greater concentration of Mn in the near as opposed to the entry forall three of the sample sets. Therefore the explanation, that the sample collection methoddisturbed the particulate Mn, although reasonable, does not seem to be wholly complete.
Additional entry-to-near analysis is shown in Figure 4.29. The near Mn concentrationdata is plotted as a function of entry Mn. This plot is slightly different than previous plots, that is,total near Mn concentration is correlated to total entry and dissolved near is correlated todissolved entry, as opposed to both being correlated to total.
Table 4.9
Number of occurrences of “near” Mn concentrations being more than “entry”(n = 33) Total Mn Particulate Mn Dissolved Mn
Near < Entry 6 4 9 No Change 8 9 15 Near > Entry 19 20 9
©2006 AwwaRF. All Rights Reserved.
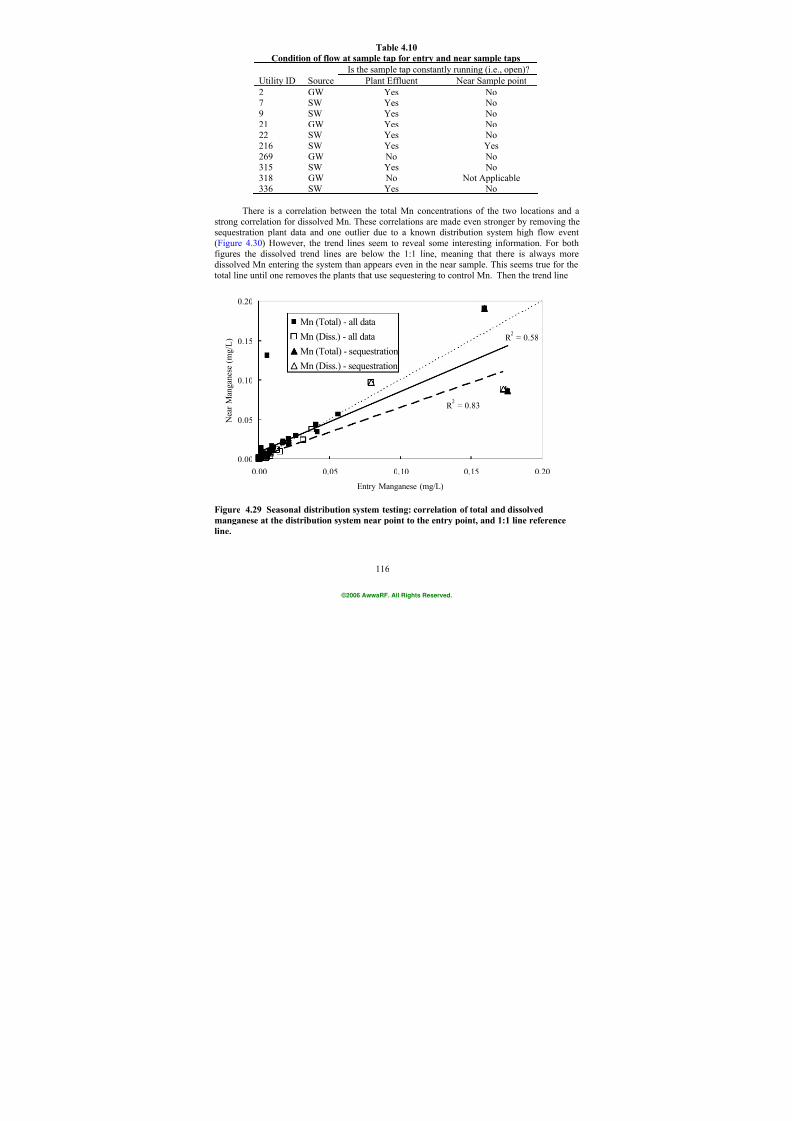
7/21/2019 Occurrence of Manganese in Drinking Water and Manganese Control
http://slidepdf.com/reader/full/occurrence-of-manganese-in-drinking-water-and-manganese-control 142/463
116
Table 4.10
Condition of flow at sample tap for entry and near sample taps
Is the sample tap constantly running (i.e., open)?
Utility ID Source Plant Effluent Near Sample point
2 GW Yes No7 SW Yes No9 SW Yes No21 GW Yes No22 SW Yes No216 SW Yes Yes269 GW No No315 SW Yes No318 GW No Not Applicable336 SW Yes No
There is a correlation between the total Mn concentrations of the two locations and astrong correlation for dissolved Mn. These correlations are made even stronger by removing thesequestration plant data and one outlier due to a known distribution system high flow event(Figure 4.30) However, the trend lines seem to reveal some interesting information. For bothfigures the dissolved trend lines are below the 1:1 line, meaning that there is always moredissolved Mn entering the system than appears even in the near sample. This seems true for thetotal line until one removes the plants that use sequestering to control Mn. Then the trend line
R 2 = 0.58
R 2 = 0.83
0.00
0.05
0.10
0.15
0.20
0.00 0.05 0.10 0.15 0.20Entry Manganese (mg/L)
N e a r M a n g a n e s e ( m
g / L )
Mn (Total) - all data
Mn (Diss.) - all data
Mn (Total) - sequestration
Mn (Diss.) - sequestration
Figure 4.29 Seasonal distribution system testing: correlation of total and dissolved
manganese at the distribution system near point to the entry point, and 1:1 line reference
line.
©2006 AwwaRF. All Rights Reserved.
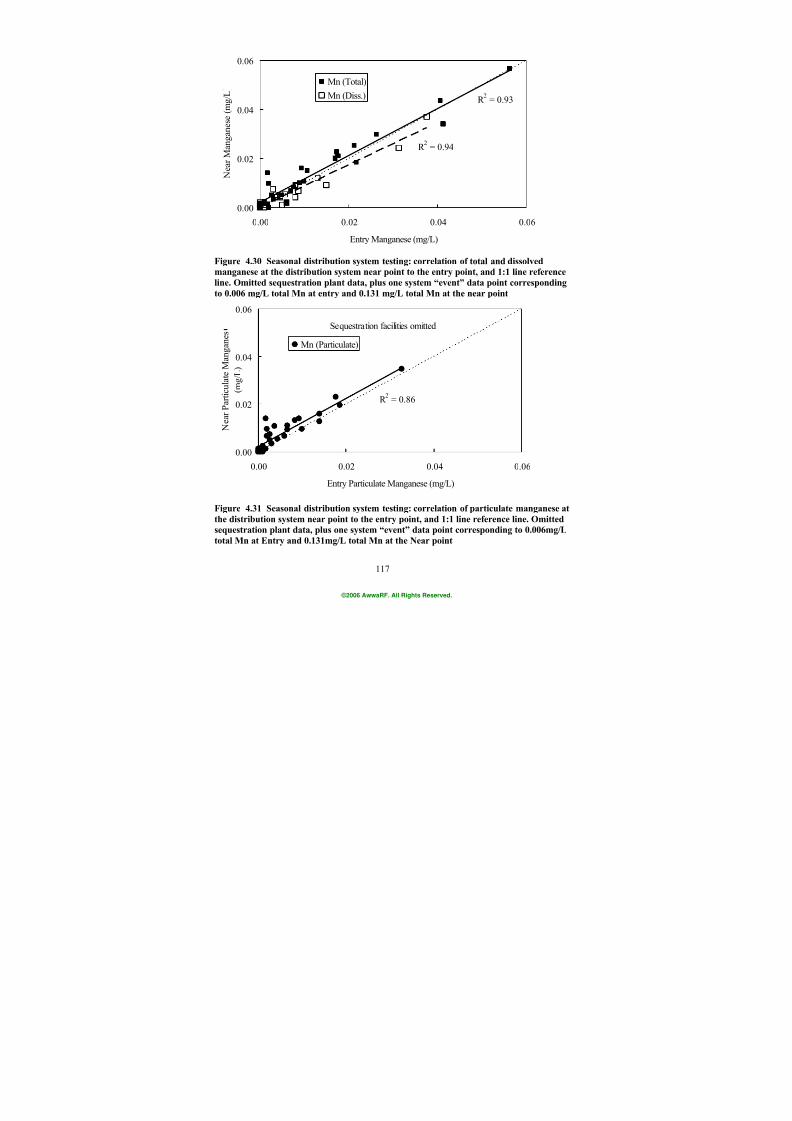
7/21/2019 Occurrence of Manganese in Drinking Water and Manganese Control
http://slidepdf.com/reader/full/occurrence-of-manganese-in-drinking-water-and-manganese-control 143/463
117
R 2 = 0.93
R 2 = 0.94
0.00
0.02
0.04
0.06
0.00 0.02 0.04 0.06
Entry Manganese (mg/L)
N e a r M a n g a n e s e
( m g / L
Mn (Total)
Mn (Diss.)
Figure 4.30 Seasonal distribution system testing: correlation of total and dissolved
manganese at the distribution system near point to the entry point, and 1:1 line reference
line. Omitted sequestration plant data, plus one system “event” data point corresponding
to 0.006 mg/L total Mn at entry and 0.131 mg/L total Mn at the near point
Sequestration facilities omitted
R 2 = 0.86
0.00
0.02
0.04
0.06
0.00 0.02 0.04 0.06
Entry Particulate Manganese (mg/L)
N e a r P a r t i c u l a t e M a n
g a n e s
( m g / L )
Mn (Particulate)
Figure 4.31 Seasonal distribution system testing: correlation of particulate manganese at
the distribution system near point to the entry point, and 1:1 line reference line. Omitted
sequestration plant data, plus one system “event” data point corresponding to 0.006mg/L
total Mn at Entry and 0.131mg/L total Mn at the Near point
©2006 AwwaRF. All Rights Reserved.
7/21/2019 Occurrence of Manganese in Drinking Water and Manganese Control
http://slidepdf.com/reader/full/occurrence-of-manganese-in-drinking-water-and-manganese-control 144/463
118
seems to be 1:1, that is, the total Mn concentration remains about the same from entry to near (noloss of Mn). As discussed previously, a stable or constant total Mn concentration combined witha decrease of dissolved Mn indicates an increase in particulate Mn.
Therefore, one more data analysis was performed. The particulate Mn concentrations fornear and entry (without sequestration) are plotted in Figure 4.31. All the data points are on orabove the line. There is more particulate Mn in the near sample than in the entry sample. Eventhough this increase is small, it is consistent. This increase in particulate Mn represents theconversion of soluble Mn to insoluble Mn.
Overall
All of this implies that there is an overall process of conversion of dissolved to particulateand then later a settling of the particulate Mn (loss of total Mn). The settled Mn can then besuspended in high flow periods (high total Mn events).
The authors do not believe this explains the fate and transport of all the Mn that enters thedistribution system; however, we do believe it is the predominant fate for distribution systemsthat maintain a chlorine residual of some kind. There were no samples taken from a system thathad demonstrable biological activity.
CASE STUDY I: PILOT-SCALE RESEARCH FOR MANGANESE CONTROL
The overall occurrence study is augmented by additional Mn-specific research. Thisresearch was done on pilot scale using surface water as the source.
Background
The Philadelphia Water Department (PWD) has two pilot-scale research facilities, one onthe Delaware River and one on the Schuylkill River. During certain ozone related work it wasnoticed that Mn can bleed through the filters. This was new to PWD since Mn had never been anissue.
At full-scale, PWD produces finished water with Mn concentrations mostly of non-detect(<0.001 mg/L), even though there is Mn in source water and in the coagulant. PWD chlorinateswith free chlorine prior to filtration and has substantial amounts of Mn in the sedimentation basineffluent. PWD unknowingly relied upon induced oxide-coated media effect (IOCME).
Prior to the initiation of this research project several observations were made at pilotscale about the ability of certain filters to control Mn. Filters without chlorine could not controlMn. Chlorine alone was not always sufficient to control Mn. The lower the pH of filtration, theless stable the IOCME process was. If the water was very cold the IOCME process was notstable even with significant amounts of free chlorine. If an oxide-coated media (OCM) filter wasoperated without chlorine, Mn would be removed at the beginning of the run but later it wouldcome out in concentrations often higher than it was coming into it. When using ozone, particulate Mn would be formed and enter the filter, and for filters without chlorine, dissolvedMn would exit the filter. The amount of ozone used and the ozone contact time seemed to havean impact on the ability of the filters to control Mn.
These observations led to much discussion and experimentation, and ultimately thisresearch project. The control of Mn via IOCME, or induced greensand effect as per Knocke’s
©2006 AwwaRF. All Rights Reserved.
7/21/2019 Occurrence of Manganese in Drinking Water and Manganese Control
http://slidepdf.com/reader/full/occurrence-of-manganese-in-drinking-water-and-manganese-control 145/463
119
AwwaRF report (1990), was very effective, yet it had limits. Dr. Knocke let PWD know that at pHs lower than 5.8 the Mn(II) would not adsorb onto the Mn oxide-coated media, stopping the process. He also described the process as working with 1 mg/L free chlorine residual in filtereffluent. So PWD began testing the limits of the IOCME process and evaluating its stability.
PWD found out that the amount of chlorine required to control Mn was less than the prescribed 1.0 mg/L. For example, at a pH of 6.5, if a chlorine dose of 0.5 mg/L (greater than breakpoint) was applied, then Mn would be controlled. The reason we specified “greater than breakpoint” was to ensure that there was a free chlorine residual being applied to the filters. Itturned out that it was not even necessary to have a free chlorine residual leaving the filter for theIOCME process to work, however, free chlorine was required to be fed onto the filter. If the pHof filtration was raised from 6.5 to 7.0, the process was more robust. This trend continued foreach increase in pH. It was discovered that a filter will continue to control Mn for a period oftime after chlorine was turned off, and that the higher the pH the longer it would control it. It wasalso noted that particulate Mn could be retained on a filter and remain stable (that is not turn to“dissolved”) by controlling the filtration pH even without chlorine. This observation seemed to be related to the presence of dissolved oxygen in the water at levels above saturation.
IOCME Mn Control
Temperature and pH Constraints on IOCME
Figure 4.32 is a compilation of IOCME filter effluent Mn data as a function oftemperature. There were 149 discrete filter runs for water that had been coagulated with ferric
salts at a pH of 6.5 (±0.25), with a free chlorine residual of greater than 0.40 mg/L (the freechlorine target was 0.5 mg/L). This plot illustrates that as the water gets colder, the ability of theIOCME process to control Mn decreases. If the water temperature is above 10°C, then 0.5 mg/Lof free chlorine leaving the filters is sufficient to control Mn. It is not until the water temperaturedrops below 10°C that control becomes more variable. For example, at a filtration pH of 6.5
(diamonds) and a temperature of 7.0°C, Mn in the filter effluent was below 15 µg/L for only oneof the four runs and it was always above 10 µg/L. The observation that IOCME is affected bytemperature makes sense to the PIs as it is an oxidation process which is limited by reactionkinetics.
©2006 AwwaRF. All Rights Reserved.
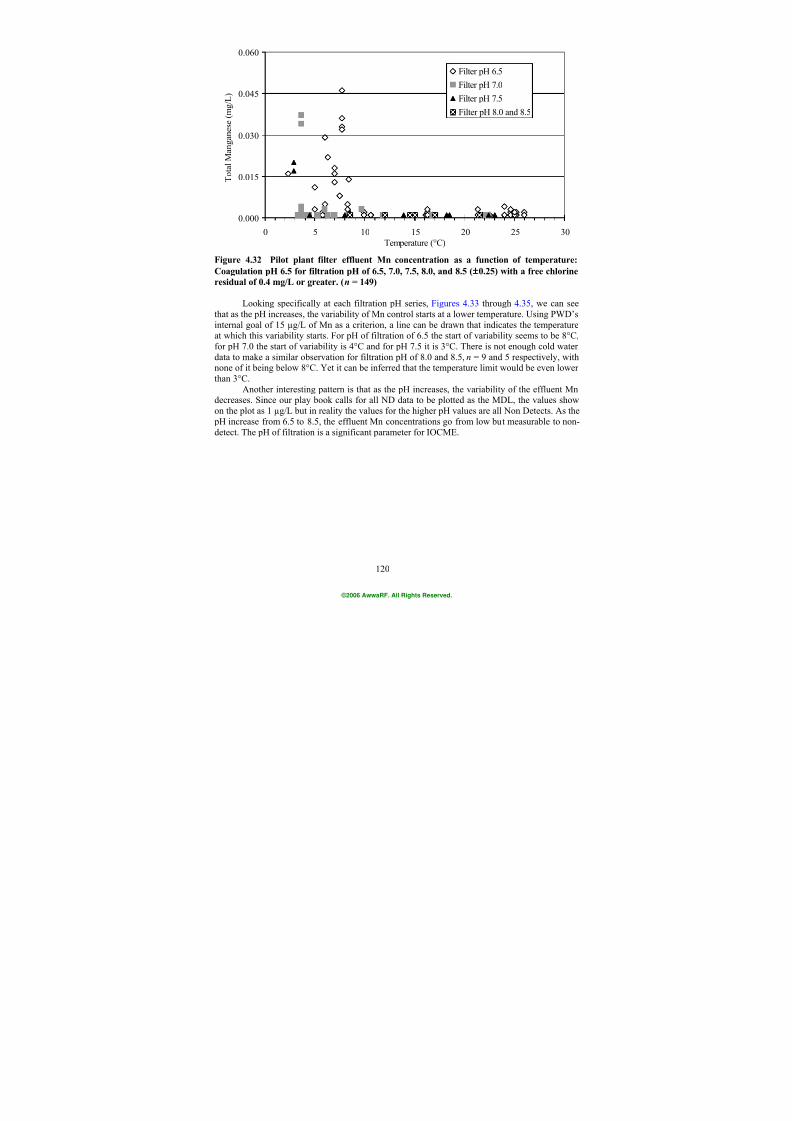
7/21/2019 Occurrence of Manganese in Drinking Water and Manganese Control
http://slidepdf.com/reader/full/occurrence-of-manganese-in-drinking-water-and-manganese-control 146/463
120
0.000
0.015
0.030
0.045
0.060
0 5 10 15 20 25 30
Temperature (°C)
T o t a l M a n g a n e s e ( m g / L )
Filter pH 6.5
Filter pH 7.0
Filter pH 7.5
Filter pH 8.0 and 8.5
Figure 4.32 Pilot plant filter effluent Mn concentration as a function of temperature:
Coagulation pH 6.5 for filtration pH of 6.5, 7.0, 7.5, 8.0, and 8.5 ( 0.25) with a free chlorine
residual of 0.4 mg/L or greater. ( n = 149)
Looking specifically at each filtration pH series, Figures 4.33 through 4.35, we can seethat as the pH increases, the variability of Mn control starts at a lower temperature. Using PWD’sinternal goal of 15 µg/L of Mn as a criterion, a line can be drawn that indicates the temperatureat which this variability starts. For pH of filtration of 6.5 the start of variability seems to be 8°C,for pH 7.0 the start of variability is 4°C and for pH 7.5 it is 3°C. There is not enough cold water
data to make a similar observation for filtration pH of 8.0 and 8.5, n = 9 and 5 respectively, withnone of it being below 8°C. Yet it can be inferred that the temperature limit would be even lowerthan 3°C.
Another interesting pattern is that as the pH increases, the variability of the effluent Mndecreases. Since our play book calls for all ND data to be plotted as the MDL, the values showon the plot as 1 µg/L but in reality the values for the higher pH values are all Non Detects. As the pH increase from 6.5 to 8.5, the effluent Mn concentrations go from low but measurable to non-detect. The pH of filtration is a significant parameter for IOCME.
©2006 AwwaRF. All Rights Reserved.
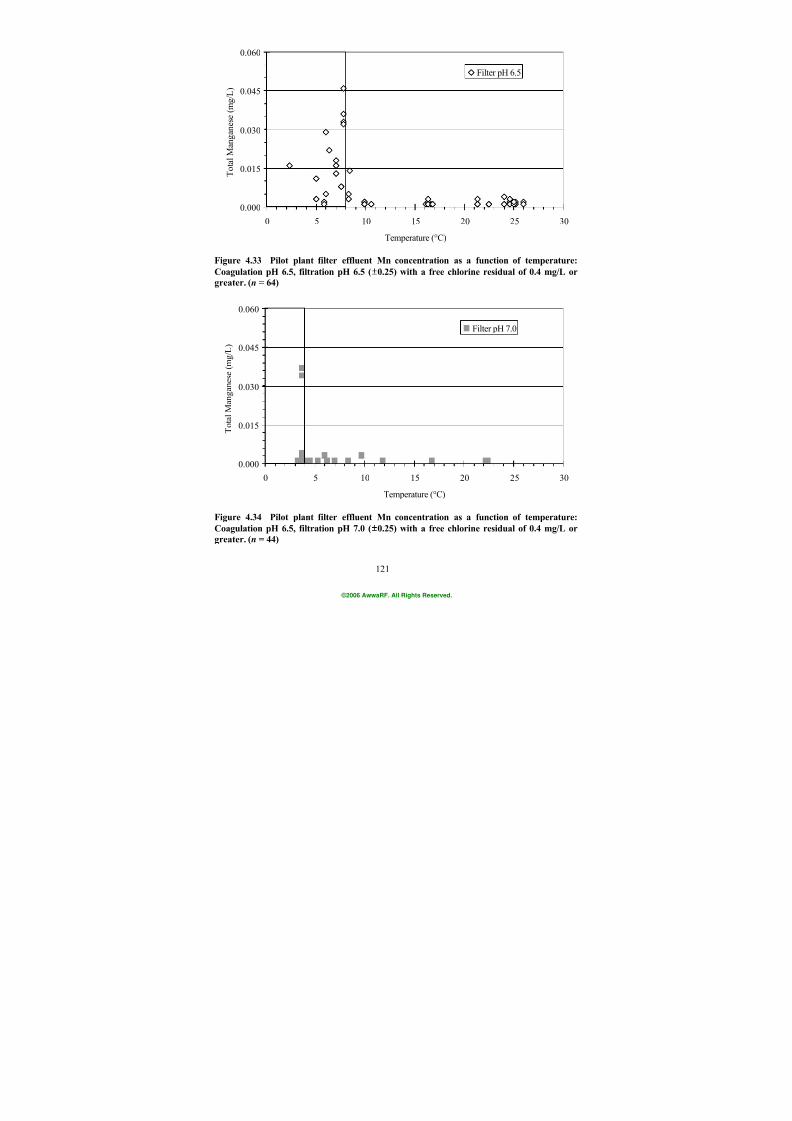
7/21/2019 Occurrence of Manganese in Drinking Water and Manganese Control
http://slidepdf.com/reader/full/occurrence-of-manganese-in-drinking-water-and-manganese-control 147/463
121
0.000
0.015
0.030
0.045
0.060
0 5 10 15 20 25 30
Temperature (°C)
T o t a l M a n g a n e s e
( m g / L )
Filter pH 6.5
Figure 4.33 Pilot plant filter effluent Mn concentration as a function of temperature:
Coagulation pH 6.5, filtration pH 6.5 ( 0.25) with a free chlorine residual of 0.4 mg/L or
greater. ( n = 64)
0.000
0.015
0.030
0.045
0.060
0 5 10 15 20 25 30
Temperature (°C)
T o t a l M a n g a n e s e ( m g / L )
Filter pH 7.0
Figure 4.34 Pilot plant filter effluent Mn concentration as a function of temperature:
Coagulation pH 6.5, filtration pH 7.0 ( 0.25) with a free chlorine residual of 0.4 mg/L or
greater. ( n = 44)
©2006 AwwaRF. All Rights Reserved.
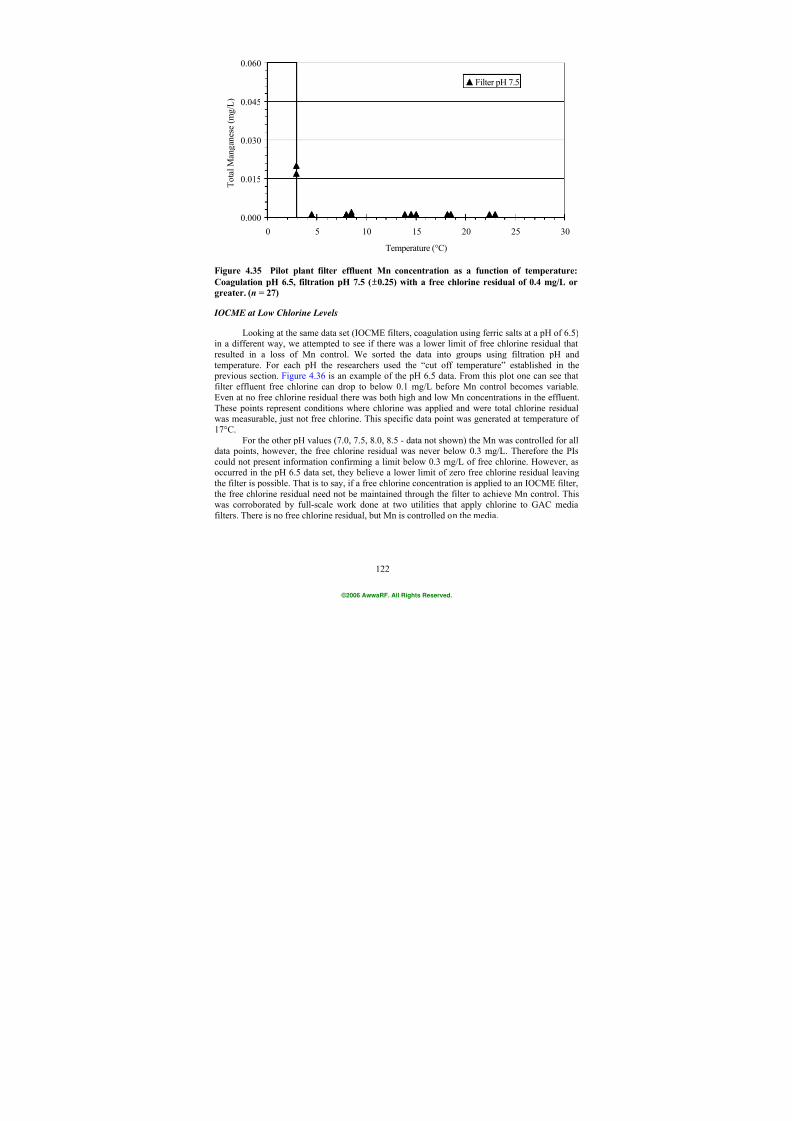
7/21/2019 Occurrence of Manganese in Drinking Water and Manganese Control
http://slidepdf.com/reader/full/occurrence-of-manganese-in-drinking-water-and-manganese-control 148/463
122
0.000
0.015
0.030
0.045
0.060
0 5 10 15 20 25 30
Temperature (°C)
T o t a l M a n g a n e s e ( m
g / L )
Filter pH 7.5
Figure 4.35 Pilot plant filter effluent Mn concentration as a function of temperature:
Coagulation pH 6.5, filtration pH 7.5 ( 0.25) with a free chlorine residual of 0.4 mg/L or
greater. ( n = 27)
IOCME at Low Chlorine Levels
Looking at the same data set (IOCME filters, coagulation using ferric salts at a pH of 6.5)in a different way, we attempted to see if there was a lower limit of free chlorine residual that
resulted in a loss of Mn control. We sorted the data into groups using filtration pH andtemperature. For each pH the researchers used the “cut off temperature” established in the previous section. Figure 4.36 is an example of the pH 6.5 data. From this plot one can see thatfilter effluent free chlorine can drop to below 0.1 mg/L before Mn control becomes variable.Even at no free chlorine residual there was both high and low Mn concentrations in the effluent.These points represent conditions where chlorine was applied and were total chlorine residualwas measurable, just not free chlorine. This specific data point was generated at temperature of17°C.
For the other pH values (7.0, 7.5, 8.0, 8.5 - data not shown) the Mn was controlled for alldata points, however, the free chlorine residual was never below 0.3 mg/L. Therefore the PIscould not present information confirming a limit below 0.3 mg/L of free chlorine. However, as
occurred in the pH 6.5 data set, they believe a lower limit of zero free chlorine residual leavingthe filter is possible. That is to say, if a free chlorine concentration is applied to an IOCME filter,the free chlorine residual need not be maintained through the filter to achieve Mn control. Thiswas corroborated by full-scale work done at two utilities that apply chlorine to GAC mediafilters. There is no free chlorine residual, but Mn is controlled on the media.
©2006 AwwaRF. All Rights Reserved.
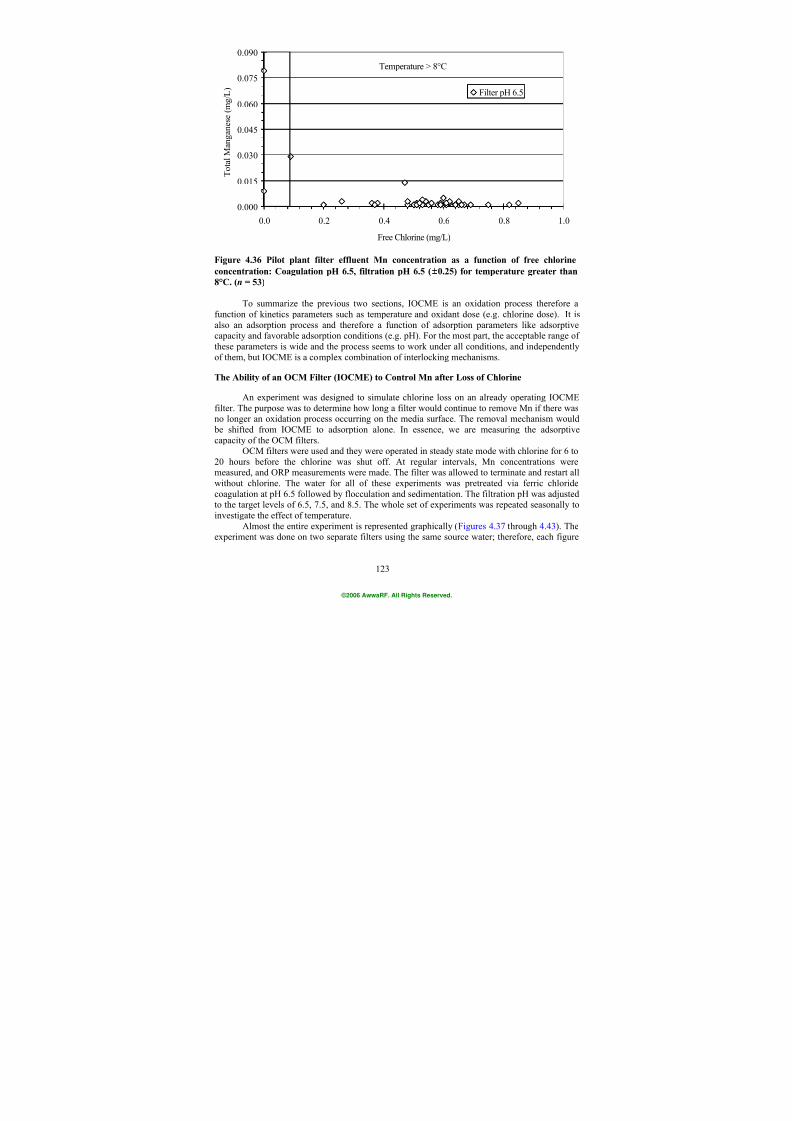
7/21/2019 Occurrence of Manganese in Drinking Water and Manganese Control
http://slidepdf.com/reader/full/occurrence-of-manganese-in-drinking-water-and-manganese-control 149/463
123
0.000
0.015
0.030
0.045
0.060
0.075
0.090
0.0 0.2 0.4 0.6 0.8 1.0
Free Chlorine (mg/L)
T o t a l M a n g a n e s e
( m g / L )
Filter pH 6.5
Temperature > 8°C
Figure 4.36 Pilot plant filter effluent Mn concentration as a function of free chlorine
concentration: Coagulation pH 6.5, filtration pH 6.5 ( 0.25) for temperature greater than
8°C. ( n = 53)
To summarize the previous two sections, IOCME is an oxidation process therefore afunction of kinetics parameters such as temperature and oxidant dose (e.g. chlorine dose). It isalso an adsorption process and therefore a function of adsorption parameters like adsorptivecapacity and favorable adsorption conditions (e.g. pH). For the most part, the acceptable range ofthese parameters is wide and the process seems to work under all conditions, and independently
of them, but IOCME is a complex combination of interlocking mechanisms.
The Ability of an OCM Filter (IOCME) to Control Mn after Loss of Chlorine
An experiment was designed to simulate chlorine loss on an already operating IOCMEfilter. The purpose was to determine how long a filter would continue to remove Mn if there wasno longer an oxidation process occurring on the media surface. The removal mechanism would be shifted from IOCME to adsorption alone. In essence, we are measuring the adsorptivecapacity of the OCM filters.
OCM filters were used and they were operated in steady state mode with chlorine for 6 to20 hours before the chlorine was shut off. At regular intervals, Mn concentrations were
measured, and ORP measurements were made. The filter was allowed to terminate and restart allwithout chlorine. The water for all of these experiments was pretreated via ferric chloridecoagulation at pH 6.5 followed by flocculation and sedimentation. The filtration pH was adjustedto the target levels of 6.5, 7.5, and 8.5. The whole set of experiments was repeated seasonally toinvestigate the effect of temperature.
Almost the entire experiment is represented graphically (Figures 4.37 through 4.43). Theexperiment was done on two separate filters using the same source water; therefore, each figure
©2006 AwwaRF. All Rights Reserved.
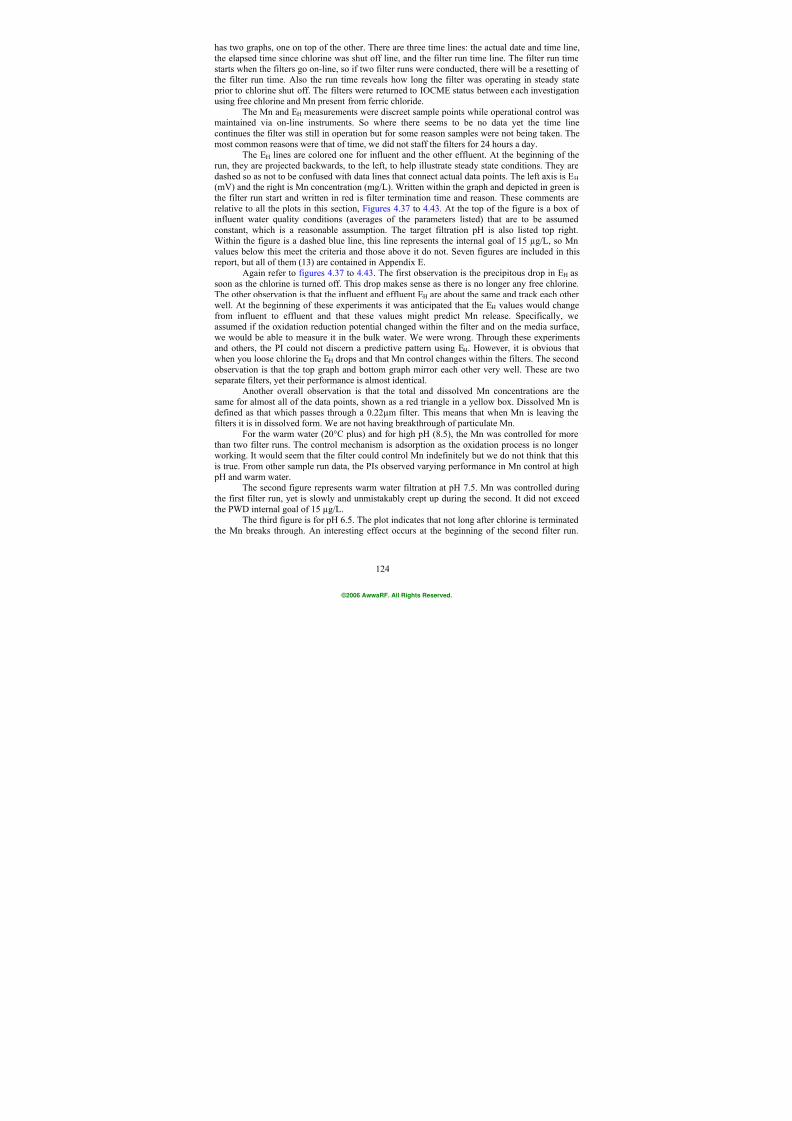
7/21/2019 Occurrence of Manganese in Drinking Water and Manganese Control
http://slidepdf.com/reader/full/occurrence-of-manganese-in-drinking-water-and-manganese-control 150/463
124
has two graphs, one on top of the other. There are three time lines: the actual date and time line,the elapsed time since chlorine was shut off line, and the filter run time line. The filter run timestarts when the filters go on-line, so if two filter runs were conducted, there will be a resetting ofthe filter run time. Also the run time reveals how long the filter was operating in steady state prior to chlorine shut off. The filters were returned to IOCME status between each investigationusing free chlorine and Mn present from ferric chloride.
The Mn and EH measurements were discreet sample points while operational control wasmaintained via on-line instruments. So where there seems to be no data yet the time linecontinues the filter was still in operation but for some reason samples were not being taken. Themost common reasons were that of time, we did not staff the filters for 24 hours a day.
The EH lines are colored one for influent and the other effluent. At the beginning of therun, they are projected backwards, to the left, to help illustrate steady state conditions. They aredashed so as not to be confused with data lines that connect actual data points. The left axis is E H (mV) and the right is Mn concentration (mg/L). Written within the graph and depicted in green isthe filter run start and written in red is filter termination time and reason. These comments arerelative to all the plots in this section, Figures 4.37 to 4.43. At the top of the figure is a box ofinfluent water quality conditions (averages of the parameters listed) that are to be assumedconstant, which is a reasonable assumption. The target filtration pH is also listed top right.
Within the figure is a dashed blue line, this line represents the internal goal of 15 µg/L, so Mnvalues below this meet the criteria and those above it do not. Seven figures are included in thisreport, but all of them (13) are contained in Appendix E.
Again refer to figures 4.37 to 4.43. The first observation is the precipitous drop in EH assoon as the chlorine is turned off. This drop makes sense as there is no longer any free chlorine.The other observation is that the influent and effluent EH are about the same and track each otherwell. At the beginning of these experiments it was anticipated that the EH values would changefrom influent to effluent and that these values might predict Mn release. Specifically, weassumed if the oxidation reduction potential changed within the filter and on the media surface,we would be able to measure it in the bulk water. We were wrong. Through these experimentsand others, the PI could not discern a predictive pattern using EH. However, it is obvious that
when you loose chlorine the EH drops and that Mn control changes within the filters. The secondobservation is that the top graph and bottom graph mirror each other very well. These are twoseparate filters, yet their performance is almost identical.
Another overall observation is that the total and dissolved Mn concentrations are thesame for almost all of the data points, shown as a red triangle in a yellow box. Dissolved Mn isdefined as that which passes through a 0.22µm filter. This means that when Mn is leaving thefilters it is in dissolved form. We are not having breakthrough of particulate Mn.
For the warm water (20°C plus) and for high pH (8.5), the Mn was controlled for morethan two filter runs. The control mechanism is adsorption as the oxidation process is no longerworking. It would seem that the filter could control Mn indefinitely but we do not think that thisis true. From other sample run data, the PIs observed varying performance in Mn control at high
pH and warm water.The second figure represents warm water filtration at pH 7.5. Mn was controlled during
the first filter run, yet is slowly and unmistakably crept up during the second. It did not exceedthe PWD internal goal of 15 µg/L.
The third figure is for pH 6.5. The plot indicates that not long after chlorine is terminatedthe Mn breaks through. An interesting effect occurs at the beginning of the second filter run.
©2006 AwwaRF. All Rights Reserved.
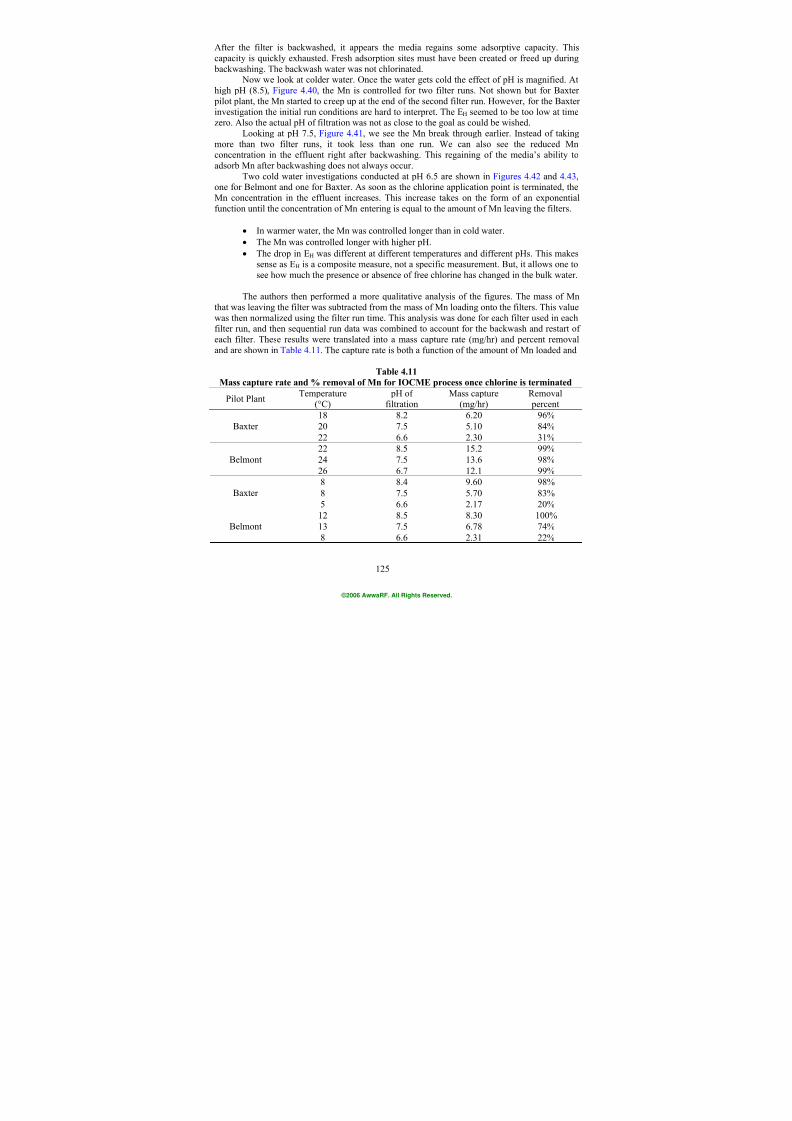
7/21/2019 Occurrence of Manganese in Drinking Water and Manganese Control
http://slidepdf.com/reader/full/occurrence-of-manganese-in-drinking-water-and-manganese-control 151/463
125
After the filter is backwashed, it appears the media regains some adsorptive capacity. Thiscapacity is quickly exhausted. Fresh adsorption sites must have been created or freed up during backwashing. The backwash water was not chlorinated.
Now we look at colder water. Once the water gets cold the effect of pH is magnified. Athigh pH (8.5), Figure 4.40, the Mn is controlled for two filter runs. Not shown but for Baxter pilot plant, the Mn started to creep up at the end of the second filter run. However, for the Baxterinvestigation the initial run conditions are hard to interpret. The EH seemed to be too low at timezero. Also the actual pH of filtration was not as close to the goal as could be wished.
Looking at pH 7.5, Figure 4.41, we see the Mn break through earlier. Instead of takingmore than two filter runs, it took less than one run. We can also see the reduced Mnconcentration in the effluent right after backwashing. This regaining of the media’s ability toadsorb Mn after backwashing does not always occur.
Two cold water investigations conducted at pH 6.5 are shown in Figures 4.42 and 4.43, one for Belmont and one for Baxter. As soon as the chlorine application point is terminated, theMn concentration in the effluent increases. This increase takes on the form of an exponentialfunction until the concentration of Mn entering is equal to the amount of Mn leaving the filters.
• In warmer water, the Mn was controlled longer than in cold water.
•
The Mn was controlled longer with higher pH.
• The drop in EH was different at different temperatures and different pHs. This makessense as EH is a composite measure, not a specific measurement. But, it allows one tosee how much the presence or absence of free chlorine has changed in the bulk water.
The authors then performed a more qualitative analysis of the figures. The mass of Mnthat was leaving the filter was subtracted from the mass of Mn loading onto the filters. This valuewas then normalized using the filter run time. This analysis was done for each filter used in eachfilter run, and then sequential run data was combined to account for the backwash and restart ofeach filter. These results wer e translated into a mass capture rate (mg/hr) and percent removaland are shown in Table 4.11. The capture rate is both a function of the amount of Mn loaded and
Table 4.11
Mass capture rate and % removal of Mn for IOCME process once chlorine is terminated
Pilot PlantTemperature
(°C) pH of
filtrationMass capture
(mg/hr)Removal percent
18 8.2 6.20 96%
20 7.5 5.10 84%Baxter
22 6.6 2.30 31%
22 8.5 15.2 99%
24 7.5 13.6 98%Belmont
26 6.7 12.1 99%8 8.4 9.60 98%
8 7.5 5.70 83%Baxter
5 6.6 2.17 20%
12 8.5 8.30 100%
13 7.5 6.78 74%Belmont
8 6.6 2.31 22%
©2006 AwwaRF. All Rights Reserved.

7/21/2019 Occurrence of Manganese in Drinking Water and Manganese Control
http://slidepdf.com/reader/full/occurrence-of-manganese-in-drinking-water-and-manganese-control 152/463
126
the amount captured. Since loading was always slightly different, the mass capture rate isempirical.
The Belmont pilot plant had more success at removing Mn even though the loading wasslightly higher there than at the Baxter pilot plant. For all warm water runs at the Belmont Plant,the percent removal was 98% to 99% for all pH values while it ranged from 31% to 96% forBaxter. In the cold water, a similar trend was established. The PIs have no mechanisticexplanation for this. One interesting water quality difference between the two rivers is theamount of alkalinity; there is more of it at Belmont.
The higher the pH of filtration, the greater the mass rate of capture and the higher the percent removal; and the colder the water, the lower the capture rate and percent removal. Forthe Baxter pilot plant, there was one filter run with a negative capture rate. This happened in coldwater at low pH conditions but did not happen at the Belmont pilot plant. The negative capturerate indicates that Mn was not only passing through the filter but some of the Mn that was on thefilter was leaving.
A filter that is used to control Mn in the IOCME mode will continue to control Mn evenif chlorine is lost. The length of time that this process will work depends on the temperature and pH of the water.
©2006 AwwaRF. All Rights Reserved.
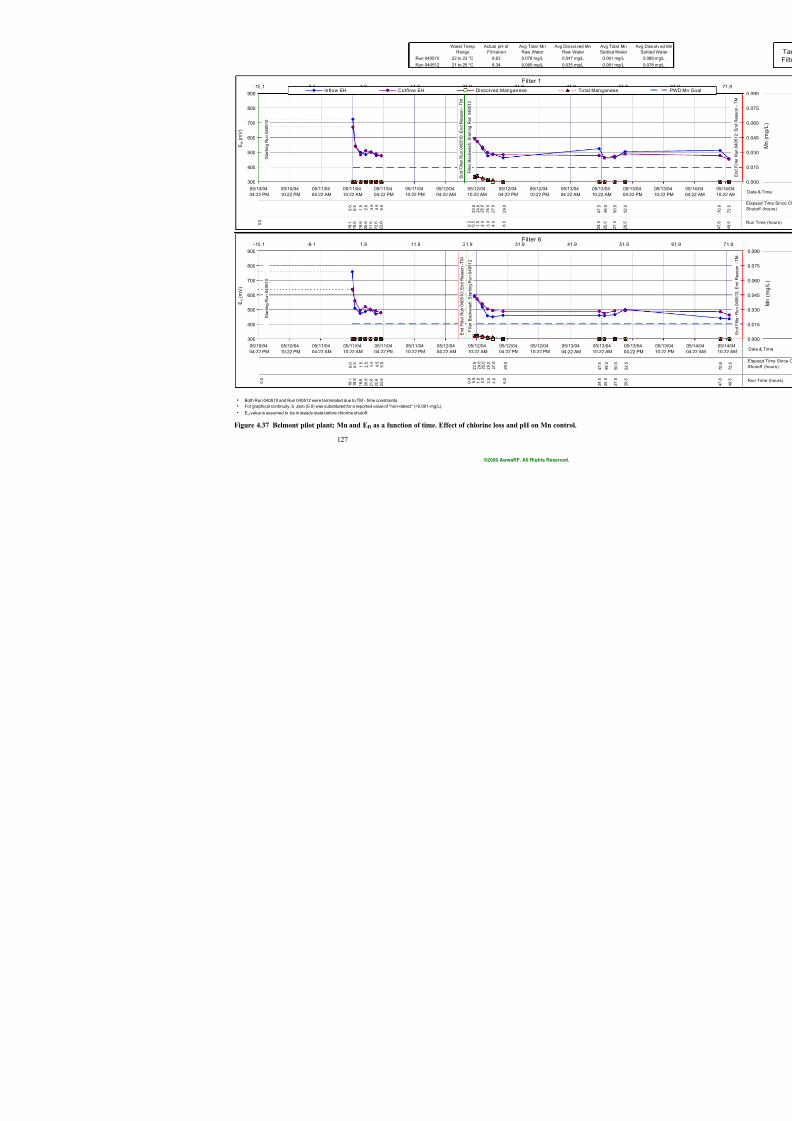
7/21/2019 Occurrence of Manganese in Drinking Water and Manganese Control
http://slidepdf.com/reader/full/occurrence-of-manganese-in-drinking-water-and-manganese-control 153/463
127
Water Temp
Range
Actual pH of
Filtration
Avg Total Mn
Raw Water
Avg Dis sol ved Mn
Raw Water
Avg
Set
Run 040510 22 to 23 °C 8.63 0.078 mg/L 0.047 mg/L 0
Run 040512 21 to 25 °C 8.34 0.065 mg/L 0.035 mg/L 0
h
h
h EH value is assumed to be in steady state before chlorine shutoff.
For graphical continuity, a zero (0.0) was substituted for a reported value of "non-detect" (<0.001-mg/L).
Both Run 040510 and Run 040512 were terminated due to TM - time constraints.
Filter 1
4 8 5
4 7 . 5
2 9 . 0
2 7 . 0
2 6 . 0
2 5 . 0
2 . 5
1 . 5
3 . 5 4 . 5 5 . 5
2 3 . 5
2 4 . 0
0 . 0 0 . 5
2 5 5
2 4 . 5
6 . 0
4 . 0
3 . 0
2 . 0
1 . 0
0 . 5
1 8 . 1
1 8 . 6
1 9 . 6
2 0 . 6
2 1 . 6
2 2 . 6
2 3 . 6
300
400
500
600
700
800
900
05/10/04
04:22 PM
05/10/04
10:22 PM
05/11/04
04:22 AM
05/11/04
10:22 AM
05/11/04
04:22 PM
05/11/04
10:22 PM
05/12/04
04:22 AM
05/12/04
10:22 AM
05/12/04
04:22 PM
05/12/04
10:22 PM
05/13/04
04:22 AM
05/13/0
10:22 A
E H
( m V )
-18.1 -8.1 1.9 11.9 21.9 31.9 41.9Inflow EH Outflow EH Dissolved Manganese Total Manga
F i l t e r B a c k w a s h ,
S t a r t i n g R u n
0 4 0 5 1 2
E n d F i l t e r R u n 0 4 0 5 1 0 ; E n d R e a
s o n - T M
0 . 0
S t a r t i n g R u n 0 4 0 5 1 0
0 . 0
Filter 6
4 8 5
4 7 . 5
2 9 . 0
2 7 . 0
2 6 . 0
2 5 . 0
2 . 5
1 . 5
3 . 5 4 . 5 5 . 5
2 3 . 5
2 4 . 0
0 . 0 0 . 5
2 5 5
2 4 . 5
6 . 0
4 . 0
3 . 0
2 . 0
1 . 0
0 . 5
1 8 . 1
1 8 . 6
1 9 . 6
2 0 . 6
2 1 . 6
2 2 . 6
2 3 . 6
300
400
500
600
700
800
900
05/10/04
04:22 PM
05/10/04
10:22 PM
05/11/04
04:22 AM
05/11/04
10:22 AM
05/11/04
04:22 PM
05/11/04
10:22 PM
05/12/04
04:22 AM
05/12/04
10:22 AM
05/12/04
04:22 PM
05/12/04
10:22 PM
05/13/04
04:22 AM
05/13/
10:22 A
E H
( m V )
-18.1 -8.1 1.9 11.9 21.9 31.9 41.9
F i l t e r B a c k w a s h ,
S t a r t i n g R u n 0 4 0 5 1 2
E n d F i l t e r R u n 0 4 0 5 1 0 ; E n d R e a s o n - T M
0 . 0
S t a r t i n g R u n 0 4 0 5 1 0
0 . 0
Figure 4.37 Belmont pilot plant; Mn and EH as a function of time. Effect of chlorine loss and pH on Mn control.
©2006 AwwaRF. All Rights Reserved.
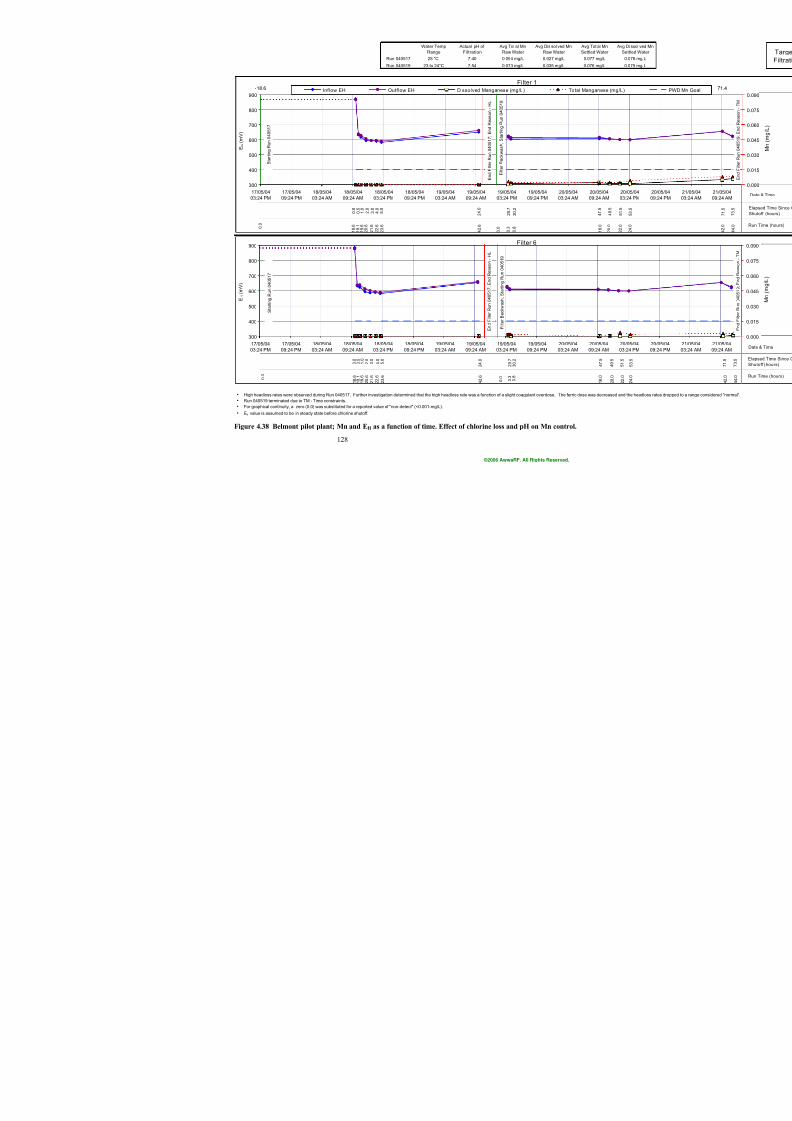
7/21/2019 Occurrence of Manganese in Drinking Water and Manganese Control
http://slidepdf.com/reader/full/occurrence-of-manganese-in-drinking-water-and-manganese-control 154/463
128
Water Temp
Range
Actual pH of
Filtration
Avg Tot al Mn
Raw Water
Avg Dis sol ved Mn
Raw Water
Avg Tot al M
Settled Wate
Run 040517 25 °C 7.40 0.094 mg/L 0.027 mg/L 0.077 mg/L
Run 040519 23 to 24°C 7.54 0.073 mg/L 0.035 mg/L 0.076 mg/L
h
h
h
h
Run 040519 terminated due to TM - Time constraints.
High headloss rates were observed during Run 040517. Further investigation determined that the high headloss rate was a function of a slight coagulant overdose. The ferric dose was dec
EH value is assumed to be in steady state before chlorine shutoff.
For graphical continuity, a zero (0.0) was substituted for a reported value of "non-detect" (<0.001-mg/L).
Filter 1
4 7 . 5
3 0 . 2
2 4 . 0
0 . 5
0 . 0
2 9 . 7
5 . 0
4 . 0
3 . 0
1 . 0 2 . 0
0 . 8
4 2 . 6
2 3 . 6
2 2 . 6
2 1 . 6
2 0 . 6
1 9 . 6
1 9 . 1
1 8 . 6
0 . 3
1 8 . 0
300
400
500
600
700
800
900
17/05/04
03:24 PM
17/05/04
09:24 PM
18/05/04
03:24 AM
18/05/04
09:24 AM
18/05/04
03:24 PM
18/05/04
09:24 PM
19/05/04
03:24 AM
19/05/04
09:24 AM
19/05/04
03:24 PM
19/05/04
09:24 PM
20/05/04
03:24 AM
20/05/0
09:24 AM
E H
( m V )
-18.6 -8.6 1.4 11.4 21.4 31.4 41.4Inflow EH Outflow EH Dissolved Manganese (mg/L) Total Manganese
S t a r t i n g R u n 0 4 0 5 1 7
0 . 0
E n d F i l t e r R u n 0 4 0 5 1 7 ; E n d R e a s o n - H L
0 . 0
F i l t e r B a c k w a s h ,
S t a r t i n g R u n
0 4 0 5 1 9
Filter 6
0 . 5
0 . 0
2 9 . 7
5 . 0
4 . 0
3 . 0
1 . 0 2 . 0
2 4 . 0
3 0 . 2
4 7 . 5
2 3 . 6
2 2 . 6
2 1 . 6
2 0 . 6
1 9 . 6
1 9 . 1
1 8 . 6
0 . 3
4 2 . 6
0 . 8
1 8 . 0
300
400
500
600
700
800
900
17/05/04
03:24 PM
17/05/04
09:24 PM
18/05/04
03:24 AM
18/05/04
09:24 AM
18/05/04
03:24 PM
18/05/04
09:24 PM
19/05/04
03:24 AM
19/05/04
09:24 AM
19/05/04
03:24 PM
19/05/04
09:24 PM
20/05/04
03:24 AM
20/05/04
09:24 AM
E H
( m V )
F i l t e r B a c k w a s h ,
S t a r t i n g R u n 0 4 0 5 1 9
E n d F i l t e r R u n 0 4 0 5 1 7 ; E n d R e a s o n - H L
0 . 0
0 . 0
S t a r t i n g R u n 0 4 0 5 1 7
Figure 4.38 Belmont pilot plant; Mn and EH as a function of time. Effect of chlorine loss and pH on Mn control.
©2006 AwwaRF. All Rights Reserved.
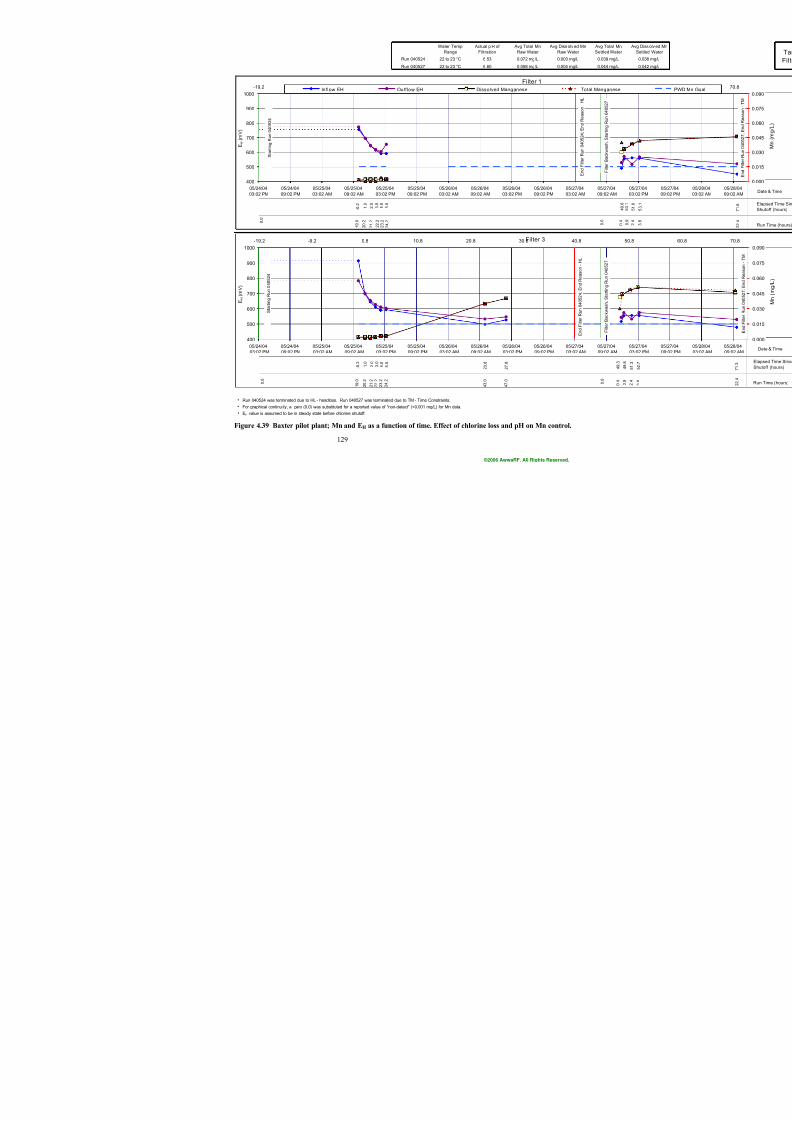
7/21/2019 Occurrence of Manganese in Drinking Water and Manganese Control
http://slidepdf.com/reader/full/occurrence-of-manganese-in-drinking-water-and-manganese-control 155/463
129
Water Temp
Range
Actual p H of
Filtration
Avg Total Mn
Raw Water
Avg Diss olv ed Mn
Raw Water
Avg T
Settle
Run 040524 22 to 23 °C 6.53 0.072 mg/L 0.003 mg/L 0.03
Run 040527 22 to 23 °C 6.60 0.058 mg/L 0.004 mg/L 0.04
h
h For graphical continu ity, a zero (0.0) was substituted for a reported value of "non-detect" (<0.001 mg/L) for Mn data.
h EH value is assumed to be in steady state before chlorine shutoff.
Run 040524 was terminated due to HL - headloss. Run 040527 was terminated due to TM - Time Constraints.
Filter 1
1 . 0
- 0 . 2
5 . 0
4 . 0
2 . 0 3 . 0
2 3 . 2
2 2 . 2
2 1 . 2
2 0 . 2
2 4 . 2
1 9 . 0
400
500
600
700
800
900
1000
05/24/04
03:02 PM
05/24/04
09:02 PM
05/25/04
03:02 AM
05/25/04
09:02 AM
05/25/04
03:02 PM
05/25/04
09:02 PM
05/26/04
03:02 AM
05/26/04
09:02 AM
05/26/04
03:02 PM
05/26/04
09:02 PM
05/27/04
03:02 AM
05/2
09:0
E H
( m V )
-19.2 -9.2 0.8 10.8 20.8 30.8 40.8Inflow EH Outflow EH Dissolved Manganese Total Mang
0 . 0
0 . 0
F i l t e r B a c k w a s h
S t a r t i n g R u n
0 4 0 5 2 7
E n d F i l t e r R u n 0 4 0 5 2 4 ; E n d R e
a s o n - H L
S t a r t i n g R u n 0 4 0 5 2 4
Filter 3
3 . 0
2 . 0
4 . 0 5 . 0
2 3 . 8
- 0 . 2
1 . 0
2 7 . 8
1 9 . 0
2 0 . 2
2 1 . 2
2 2 . 2
2 3 . 2
2 4 . 2
4 3 . 0
4 7 . 0
400
500
600
700
800
900
1000
05/24/04
03:02 PM
05/24/04
09:02 PM
05/25/04
03:02 AM
05/25/04
09:02 AM
05/25/04
03:02 PM
05/25/04
09:02 PM
05/26/04
03:02 AM
05/26/04
09:02 AM
05/26/04
03:02 PM
05/26/04
09:02 PM
05/27/04
03:02 AM
05/2
09:0
E H
( m V )
-19.2 -9.2 0.8 10.8 20.8 30.8 40.8
0 . 0
0 . 0
E n d F i l t e r R u n 0 4 0 5 2 4 ; E n d R e a s o n - H L
F i l t e r B a c k w a s h
S t a r t i n g R u n 0 4 0 5 2 7
S t a r t i n g R u n 0 4 0 5 2 4
Figure 4.39 Baxter pilot plant; Mn and EH as a function of time. Effect of chlorine loss and pH on Mn control.
©2006 AwwaRF. All Rights Reserved.
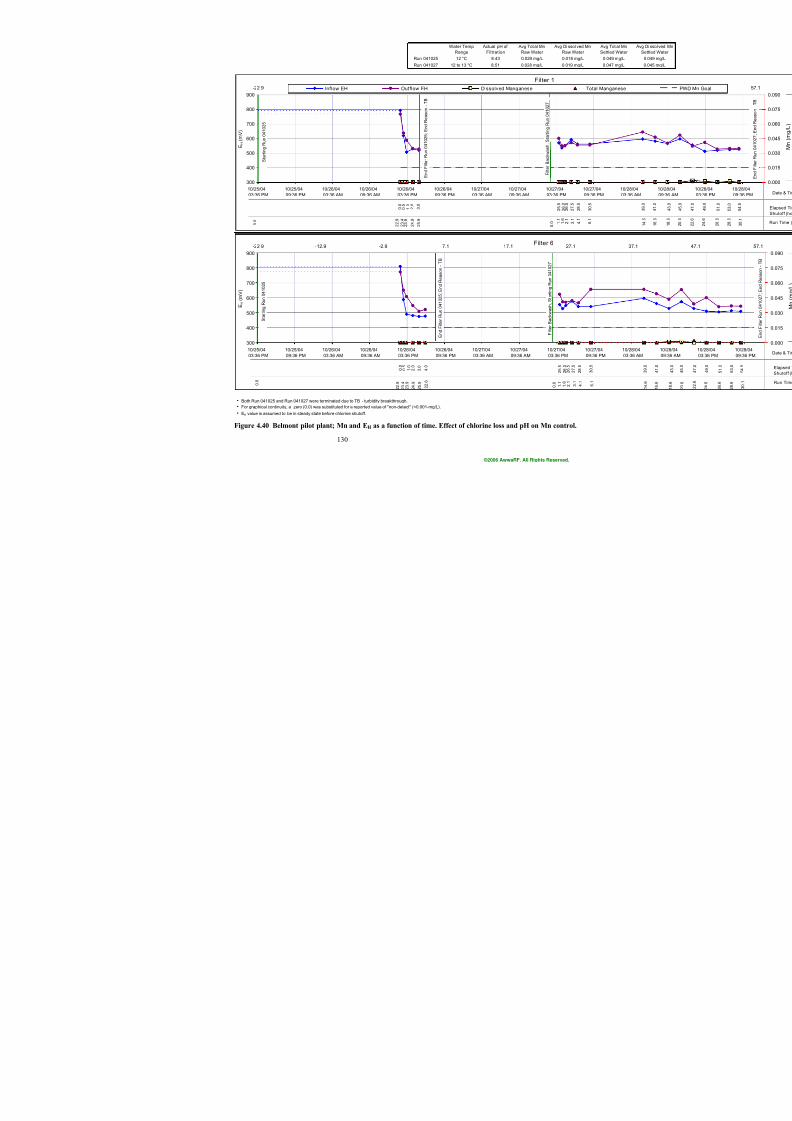
7/21/2019 Occurrence of Manganese in Drinking Water and Manganese Control
http://slidepdf.com/reader/full/occurrence-of-manganese-in-drinking-water-and-manganese-control 156/463
130
Water Temp
Range
Actual pH of
Filtration
Avg Tot al Mn
Raw Water
Avg Di ssol ved Mn
Raw Water
Av
Se
Run 041025 12 °C 8.43 0.029 mg/L 0.018 mg/L 0
Run 041027 12 to 13 °C 8.51 0.028 mg/L 0.019 mg/L 0
h
h
h
For graphical continuity, a zero (0.0) was substituted for a reported value of "non-detect" (<0.001-mg/L).
Both Run 041025 and Run 041027 were terminated due to TB - turbidity breakthrough.
EH value is assumed to be in steady state before chlorine shutoff.
Filter 6
0 . 5
0 . 0
2 6 . 5
2 6 . 0
4 . 0
3 . 0
1 . 0 2 . 0
2 7 . 5
2 8 . 5
3 0 . 5
2 5 . 5
2 2 . 6
2 5 . 9
2 4 . 9
2 3 . 9
2 3 . 4
2 2 . 9
1 . 6 2 . 1 3 . 1 4 . 1
6 . 1
1 . 1
300
400
500
600
700
800
900
10/25/04
03:36 PM
10/25/04
09:36 PM
10/26/04
03:36 AM
10/26/04
09:36 AM
10/26/04
03:36 PM
10/26/04
09:36 PM
10/27/04
03:36 AM
10/27/04
09:36 AM
10/27/04
03:36 PM
10/27/04
09:36 PM
E H
( m V )
-22.9 -12.9 -2.9 7.1 17.1 27.1
F i l t e r B a c k w a s h ,
S t a r t i n g R u n 0 4 1 0 2 7
E n d F i l t e r R u n 0 4 1 0 2 5 ; E n d R e a s o n - T B
0 . 0
S t a r t i n g R u n 0 4 1 0 2 5
0 . 0
Filter 1
0 . 5
0 . 0
2 6 . 5
2 6 . 0
3 . 0
1 . 0 2 . 0
2 7 . 5
2 8 . 5
3 0 . 5
2 5 . 5
2 5 . 9
2 4 . 9
2 3 . 9
2 3 . 4
2 2 . 9
1 . 6 2 . 1 3 . 1 4 . 1
6 . 1
1 . 1
300
400
500
600
700
800
900
10/25/04
03:36 PM
10/25/04
09:36 PM
10/26/04
03:36 AM
10/26/04
09:36 AM
10/26/04
03:36 PM
10/26/04
09:36 PM
10/27/04
03:36 AM
10/27/04
09:36 AM
10/27/04
03:36 PM
10/27/04
09:36 PM
E H
( m V )
-22.9 -12.9 -2.9 7.1 17.1 27.1Inflow EH Outflow EH Dissolved Manganese Total Ma
F i l t e r B a c k w a s h ,
S t a r t i n g R u n
0 4 1 0 2 7
E n d F i l t e r R u n 0 4 1 0 2 5 ; E n d R e
a s o n - T B
0 . 0
S t a r t i n g R u n 0 4 1 0 2 5
0 . 0
Figure 4.40 Belmont pilot plant; Mn and EH as a function of time. Effect of chlorine loss and pH on Mn control.
©2006 AwwaRF. All Rights Reserved.
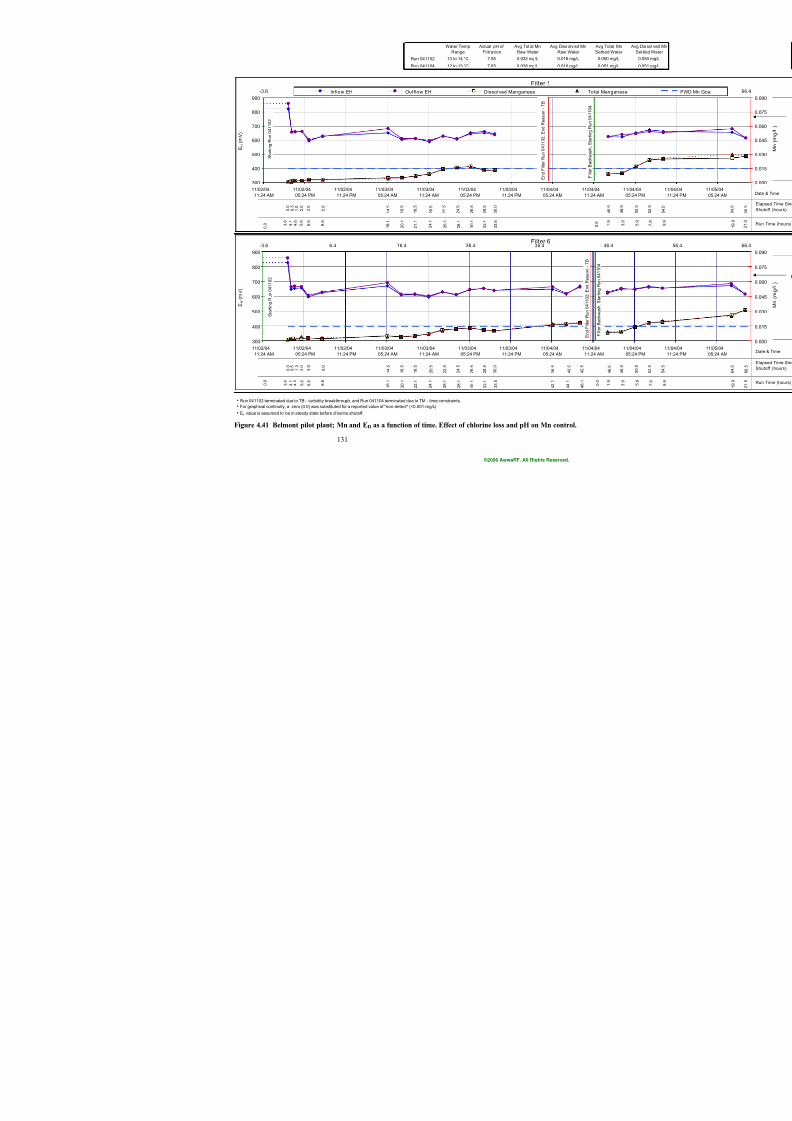
7/21/2019 Occurrence of Manganese in Drinking Water and Manganese Control
http://slidepdf.com/reader/full/occurrence-of-manganese-in-drinking-water-and-manganese-control 157/463
131
Water Temp
Range
Actual pH of
Filtration
Avg Tot al Mn
Raw Water
Avg Diss olv ed Mn
Raw Water
Avg T
Settle
Run 041102 13 to 14 °C 7.55 0.032 mg/L 0.018 mg/L 0.05
Run 041104 12 to 13 °C 7.65 0.038 mg/L 0.018 mg/L 0.05
h
h
hEH value is assumed to be in steady state before chlorine shutoff.
For graphical continuity, a zero (0.0) was substituted for a reported value of "non-detect" (<0.001-mg/L).
Run 041102 terminated due to TB - turbidity breakthrough, and Run 041104 terminated due to TM - time constraints.
Filter 1
1 8 . 5
3 0 . 0
2 8 . 5
2 6 . 5
2 4 . 5
2 . 0
1 . 0
3 . 0
5 . 0
1 4 . 5
2 0 . 5
2 2 . 5
0 . 0 0 . 5
1 6 . 5
2 1 . 1
3 3 . 6
3 2 . 1
3 0 . 1
2 8 . 1
2 6 . 1
2 4 . 1
3 . 6 4 . 1 4 . 6 5 . 6
6 . 6
8 . 6
1 8 . 1
2 0 . 1
300
400
500
600
700
800
900
11/02/04
11:24 AM
11/02/04
05:24 PM
11/02/04
11:24 PM
11/03/04
05:24 AM
11/03/04
11:24 AM
11/03/04
05:24 PM
11/03/04
11:24 PM
11/04/04
05:24 AM
11/04/04
11:24 AM
E H
( m V )
-3.6 6.4 16.4 26.4 36.4 4Inflow EH Outflow EH Dissolved Manganese Total Ma
F i l t e r B a c k w a s h ,
S t a r t i n g R u n 0
4 1 1 0 4
E n d F i l t e r R u n 0 4 1 1 0 2 ; E n d R e a
s o n - T B
0 . 0
S t a r t i n g R u n 0 4 1 1 0 2
0 . 0
Filter 6
1 8 . 5
4 2 . 5
4 0 . 5
3 8 . 5
3 0 . 0
2 8 . 5
2 6 . 5
2 4 . 5
2 . 0
1 . 0
3 . 0
5 . 0
1 4 . 5
2 0 . 5
2 2 . 5
0 . 0 0 . 5
1 6 . 5
2 2 . 1
4 6 . 1
4 4 . 1
4 2 . 1
3 3 . 6
3 2 . 1
3 0 . 1
2 8 . 1
2 6 . 1
2 4 . 1
3 . 6 4 . 1 4 . 6 5 . 6 6 . 6
8 . 6
1 8 . 1
2 0 . 1
300
400
500
600
700
800
900
11/02/04
11:24 AM
11/02/04
05:24 PM
11/02/04
11:24 PM
11/03/04
05:24 AM
11/03/04
11:24 AM
11/03/04
05:24 PM
11/03/04
11:24 PM
11/04/04
05:24 AM
11/04/04
11:24 AM
E H
( m V )
-3.6 6.4 16.4 26.4 36.4 4
F i l t e r B a c k w a s h ,
S t a r t i n g R u n 0 4 1 1 0 4
E n d F i l t e r R u n 0 4 1 1 0 2 ; E n d R e a s o n - T B
0 . 0
S t a r t i n g R u n 0 4 1 1 0 2
0 . 0
Figure 4.41 Belmont pilot plant; Mn and EH as a function of time. Effect of chlorine loss and pH on Mn control.
©2006 AwwaRF. All Rights Reserved.
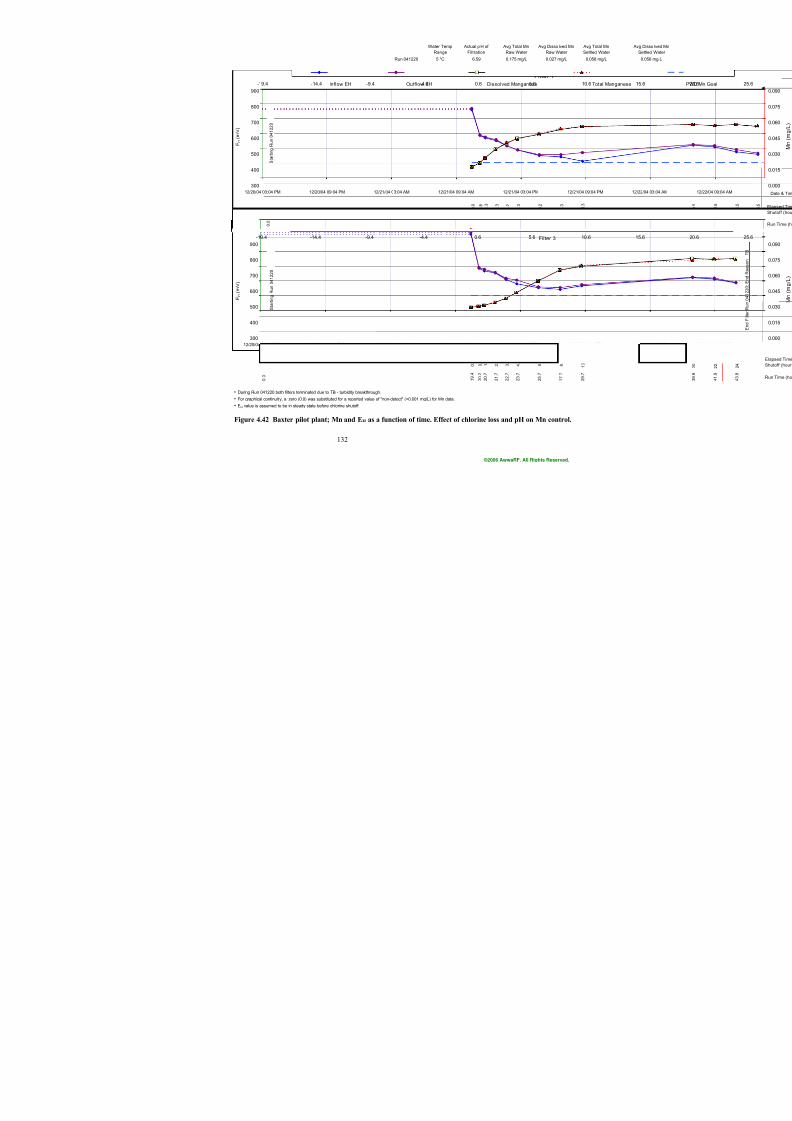
7/21/2019 Occurrence of Manganese in Drinking Water and Manganese Control
http://slidepdf.com/reader/full/occurrence-of-manganese-in-drinking-water-and-manganese-control 158/463
132
Water Temp
Range
Actual p H of
Filtration
Avg Total Mn
Raw Water
Avg Disso lved Mn
Raw Water
Avg Total M
Settled Wat
Run 041220 5 °C 6.59 0.175 mg/L 0.027 mg/L 0.058 mg/L
h
h
h
For graphical continuit y, a zero (0.0) was substituted for a reported value of "non-detect" (<0.001 mg/L) for Mn data.
During Run 041220 both filters terminated due to TB - turbidity breakthrough.
EH value is assumed to be in steady state before chlorine shutoff.
Filter 1
1 0 . 3
8 . 3
0 . 8
0 . 0
6 . 2
4 . 3
3 . 2
1 . 3
2 . 3
2 9 . 7
2 7 . 7
2 5 . 7
2 3 . 7
2 2 . 7
2 1 . 7
2 0 . 7
2 0 . 2
1 9 . 4
300
400
500
600
700
800
900
12/20/04 03:04 PM 12/20/04 09:04 PM 12/21/04 03:04 AM 12/21/04 09:04 AM 12/21/04 03:04 PM 12/21/04 09:04 PM
E H
( m V )
-19.4 -14.4 -9.4 -4.4 0.6 5.6 10.6Inflow EH Outflow EH Dissolved Manganese Total M
S t a r t i n g R u n 0 4 1 2 2 0
0 . 0
2 . 3
1 . 3
3 . 2
4 . 3
6 . 2
0 . 0
0 . 8
8 . 3
1 0 . 3
1 9 . 4
2 0 . 2
2 0 . 7
2 1 . 7
2 2 . 7
2 3 . 7
2 5 . 7
2 7 . 7
2 9 . 7
300
400
500
600
700
800
900
12/20/04 03:04 PM 12/20/04 09:04 PM 12/21/04 03:04 AM 12/21/04 09:04 AM 12/21/04 03:04 PM 12/21/04 09:04 PM
E H
( m V )
-19.4 -14.4 -9.4 -4.4 0.6 5.6 10.6
S t a r t i n g R u n 0 4 1 2 2 0
0 . 0
Filter 3
Figure 4.42 Baxter pilot plant; Mn and EH as a function of time. Effect of chlorine loss and pH on Mn control.
©2006 AwwaRF. All Rights Reserved.
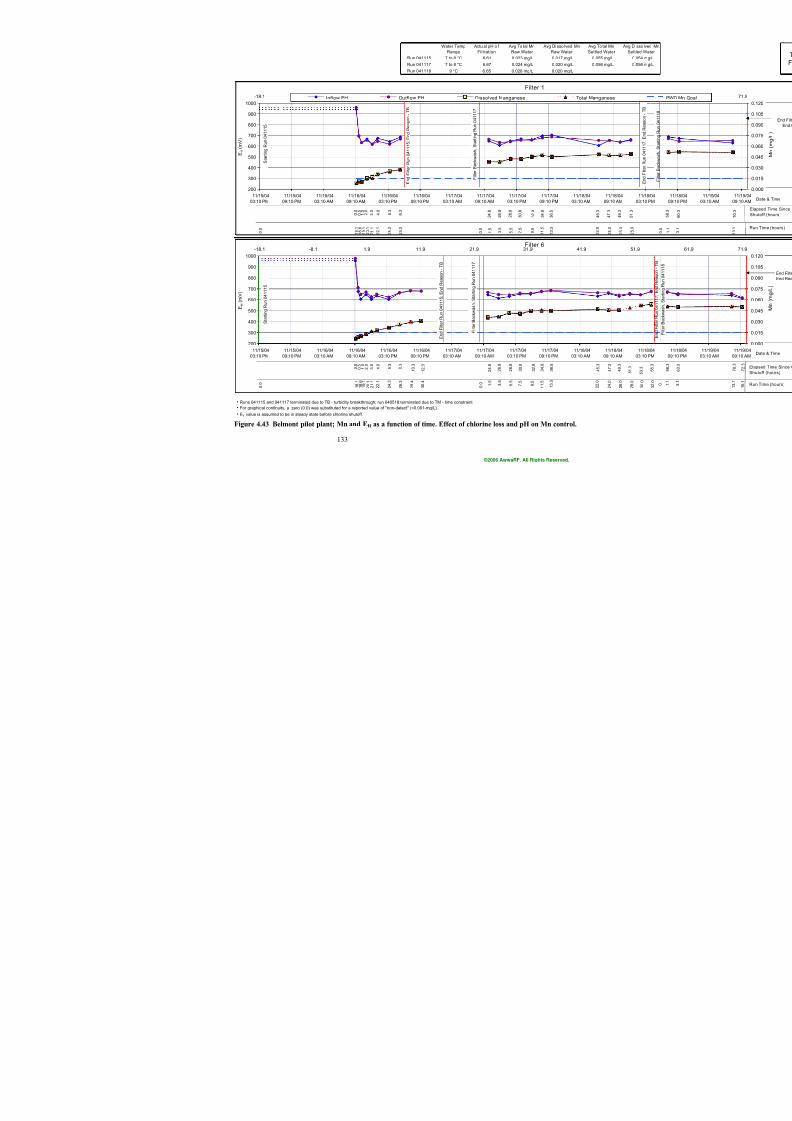
7/21/2019 Occurrence of Manganese in Drinking Water and Manganese Control
http://slidepdf.com/reader/full/occurrence-of-manganese-in-drinking-water-and-manganese-control 159/463
133
Water Temp
Range
Actu al pH o f
Filtration
Avg To tal Mn
Raw Water
Avg Di sso lved Mn
Raw Water
Avg To ta
Settled W
Run 041115 7 to 8 °C 6.61 0.023 mg/L 0.017 mg/L 0.055 m
Run 041117 7 to 8 °C 6.67 0.024 mg/L 0.020 mg/L 0.056 m
Run 041118 9 °C 6.65 0.028 mg/L 0.020 mg/L
h
h
hEH value is assumed to be in steady state before chlorine shutoff.
For graphical continuity, a zero (0.0) was substituted for a reported value of "non-detect" (<0.001-mg/L).
Runs 041115 and 041117 terminated due to TB - turbidity breakthrough; run 040518 terminated due to TM - time constraint.
Filter 1
4 5 . 3
3 6 . 5
3 4 . 8
3 2 . 8
3 0 . 8
2 8 . 8
2 6 . 8
2 4 . 8
2 . 0
1 . 0
3 . 0
4 . 0
6 . 3
0 . 0 0 . 5
8 . 3
2 2 . 0
1 3 . 3
1 1 . 5
9 . 5
7 . 5
5 . 5
3 . 5
1 . 5
1 8 . 1
1 8 . 6
1 9 . 1
2 0 . 1
2 1 . 1
2 2 . 1
2 4 . 3
2 6 . 3
200
300
400
500
600
700
800
900
1000
11/15/04
03:10 PM
11/15/04
09:10 PM
11/16/04
03:10 AM
11/16/04
09:10 AM
11/16/04
03:10 PM
11/16/04
09:10 PM
11/17/04
03:10 AM
11/17/04
09:10 AM
11/17/04
03:10 PM
11/17/04
09:10 PM
11/18/04
03:10 AM
0
E H
( m V )
-18.1 -8.1 1.9 11.9 21.9 31.9 41.9Inflow EH Outflow EH Dissolved Manganese Total Mangan
F i l t e r B a c k w a s h ,
S t a r t i n g R u n 0 4 1 1 1 7
E n d F i l t e r R u n 0 4 1 1 1 5 ; E n d R e a s o n
- T B
0 . 0
S t a r t i n g R u n 0 4 1 1 1 5
0 . 0
Filter 6
8 . 3
0 . 5
0 . 0
1 2 . 3
6 . 3
4 . 0
3 . 0
1 . 0 2 . 0
2 4 . 8
2 6 . 8
2 8 . 8
3 0 . 8
3 2 . 8
3 4 . 8
3 6 . 5
4 5 . 3
1 0 . 3
2 6 . 3
2 4 . 3
2 2 . 1
2 1 . 1
2 0 . 1
1 9 . 1
1 8 . 6
1 8 . 1
3 0 . 4
1 . 5
3 . 5
5 . 5
7 . 5
9 . 5
1 1 . 5
1 3 . 3
2 2 . 0
2 8 . 4
200
300
400
500
600
700
800
900
1000
11/15/04
03:10 PM
11/15/04
09:10 PM
11/16/04
03:10 AM
11/16/04
09:10 AM
11/16/04
03:10 PM
11/16/04
09:10 PM
11/17/04
03:10 AM
11/17/04
09:10 AM
11/17/04
03:10 PM
11/17/04
09:10 PM
11/18/04
03:10 AM
1
0
E H
( m V )
-18.1 -8.1 1.9 11.9 21.9 31.9 41.9
F i l t e r B a c k w a s h ,
S t a r t i n g R u n 0 4 1 1 1 7
E n d F i l t e r R u n 0 4 1 1 1 5 ; E n d R e a s o n - T B
0 . 0
S t a r t i n g R u n 0 4 1 1 1 5
0 . 0
Figure 4.43 Belmont pilot plant; Mn and EH as a function of time. Effect of chlorine loss and pH on Mn control.
©2006 AwwaRF. All Rights Reserved.

7/21/2019 Occurrence of Manganese in Drinking Water and Manganese Control
http://slidepdf.com/reader/full/occurrence-of-manganese-in-drinking-water-and-manganese-control 160/463
134
©2006 AwwaRF. All Rights Reserved.
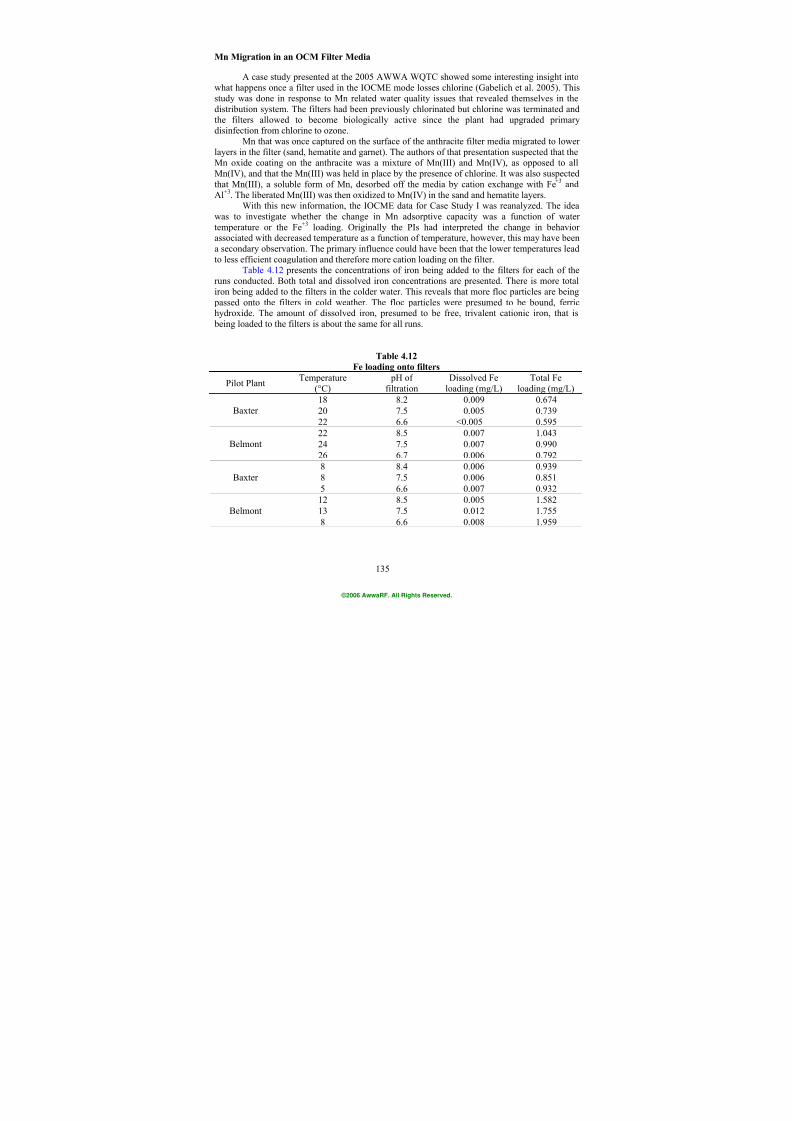
7/21/2019 Occurrence of Manganese in Drinking Water and Manganese Control
http://slidepdf.com/reader/full/occurrence-of-manganese-in-drinking-water-and-manganese-control 161/463
135
Mn Migration in an OCM Filter Media
A case study presented at the 2005 AWWA WQTC showed some interesting insight intowhat happens once a filter used in the IOCME mode losses chlorine (Gabelich et al. 2005). Thisstudy was done in response to Mn related water quality issues that revealed themselves in thedistribution system. The filters had been previously chlorinated but chlorine was terminated and
the filters allowed to become biologically active since the plant had upgraded primarydisinfection from chlorine to ozone.
Mn that was once captured on the surface of the anthracite filter media migrated to lowerlayers in the filter (sand, hematite and garnet). The authors of that presentation suspected that theMn oxide coating on the anthracite was a mixture of Mn(III) and Mn(IV), as opposed to allMn(IV), and that the Mn(III) was held in place by the presence of chlorine. It was also suspectedthat Mn(III), a soluble form of Mn, desorbed off the media by cation exchange with Fe
+3 and
Al+3
. The liberated Mn(III) was then oxidized to Mn(IV) in the sand and hematite layers.With this new information, the IOCME data for Case Study I was reanalyzed. The idea
was to investigate whether the change in Mn adsorptive capacity was a function of watertemperature or the Fe
+3 loading. Originally the PIs had interpreted the change in behavior
associated with decreased temperature as a function of temperature, however, this may have beena secondary observation. The primary influence could have been that the lower temperatures leadto less efficient coagulation and therefore more cation loading on the filter.
Table 4.12 presents the concentrations of iron being added to the filters for each of theruns conducted. Both total and dissolved iron concentrations are presented. There is more totaliron being added to the filters in the colder water. This reveals that more floc particles are being passed onto the filters in cold weather. The floc particles were presumed to be bound, ferrichydroxide. The amount of dissolved iron, presumed to be free, trivalent cationic iron, that is being loaded to the filters is about the same for all runs.
Table 4.12Fe loading onto filters
Pilot PlantTemperature
(°C) pH of
filtrationDissolved Fe
loading (mg/L)Total Fe
loading (mg/L)
18 8.2 0.009 0.674
20 7.5 0.005 0.739Baxter
22 6.6 <0.005 0.595
22 8.5 0.007 1.043
24 7.5 0.007 0.990Belmont
26 6.7 0.006 0.792
8 8.4 0.006 0.939
8 7.5 0.006 0.851Baxter5 6.6 0.007 0.932
12 8.5 0.005 1.582
13 7.5 0.012 1.755Belmont
8 6.6 0.008 1.959
©2006 AwwaRF. All Rights Reserved.
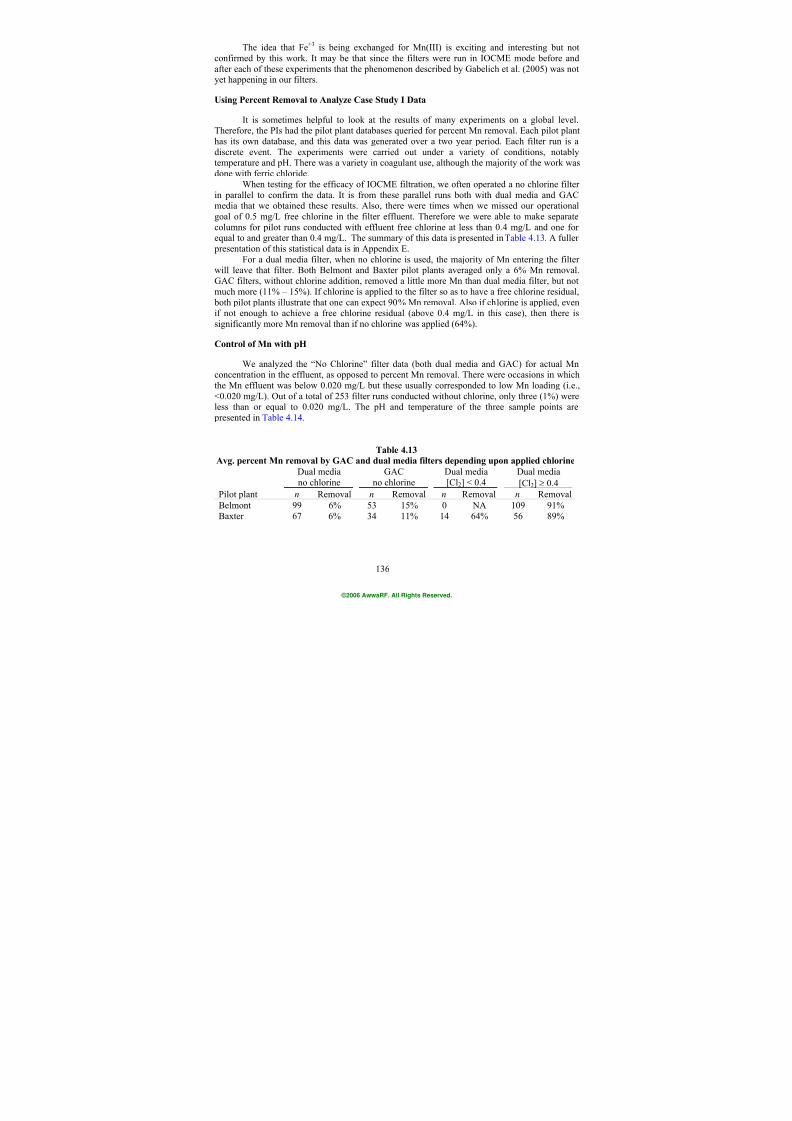
7/21/2019 Occurrence of Manganese in Drinking Water and Manganese Control
http://slidepdf.com/reader/full/occurrence-of-manganese-in-drinking-water-and-manganese-control 162/463
136
The idea that Fe+3 is being exchanged for Mn(III) is exciting and interesting but notconfirmed by this work. It may be that since the filters were run in IOCME mode before andafter each of these experiments that the phenomenon described by Gabelich et al. (2005) was notyet happening in our filters.
Using Percent Removal to Analyze Case Study I Data
It is sometimes helpful to look at the results of many experiments on a global level.Therefore, the PIs had the pilot plant databases queried for percent Mn removal. Each pilot planthas its own database, and this data was generated over a two year period. Each filter run is adiscrete event. The experiments were carried out under a variety of conditions, notablytemperature and pH. There was a variety in coagulant use, although the majority of the work wasdone with ferric chloride.
When testing for the efficacy of IOCME filtration, we often operated a no chlorine filterin parallel to confirm the data. It is from these parallel runs both with dual media and GACmedia that we obtained these results. Also, there were times when we missed our operationalgoal of 0.5 mg/L free chlorine in the filter effluent. Therefore we were able to make separatecolumns for pilot runs conducted with effluent free chlorine at less than 0.4 mg/L and one for
equal to and greater than 0.4 mg/L. The summary of this data is presented in Table 4.13. A fuller presentation of this statistical data is in Appendix E.
For a dual media filter, when no chlorine is used, the majority of Mn entering the filterwill leave that filter. Both Belmont and Baxter pilot plants averaged only a 6% Mn removal.GAC filters, without chlorine addition, removed a little more Mn than dual media filter, but notmuch more (11% – 15%). If chlorine is applied to the filter so as to have a free chlorine residual, both pilot plants illustrate that one can expect 90% Mn removal. Also if chlorine is applied, evenif not enough to achieve a free chlorine residual (above 0.4 mg/L in this case), then there issignificantly more Mn removal than if no chlorine was applied (64%).
Control of Mn with pH
We analyzed the “No Chlorine” filter data (both dual media and GAC) for actual Mnconcentration in the effluent, as opposed to percent Mn removal. There were occasions in whichthe Mn effluent was below 0.020 mg/L but these usually corresponded to low Mn loading (i.e.,<0.020 mg/L). Out of a total of 253 filter runs conducted without chlorine, only three (1%) wereless than or equal to 0.020 mg/L. The pH and temperature of the three sample points are presented in Table 4.14.
Table 4.13
Avg. percent Mn removal by GAC and dual media filters depending upon applied chlorine
Dual mediano chlorine GACno chlorine Dual media[Cl2] < 0.4 Dual media[Cl2] ≥ 0.4
Pilot plant n Removal n Removal n Removal n Removal
Belmont 99 6% 53 15% 0 NA 109 91%Baxter 67 6% 34 11% 14 64% 56 89%
©2006 AwwaRF. All Rights Reserved.
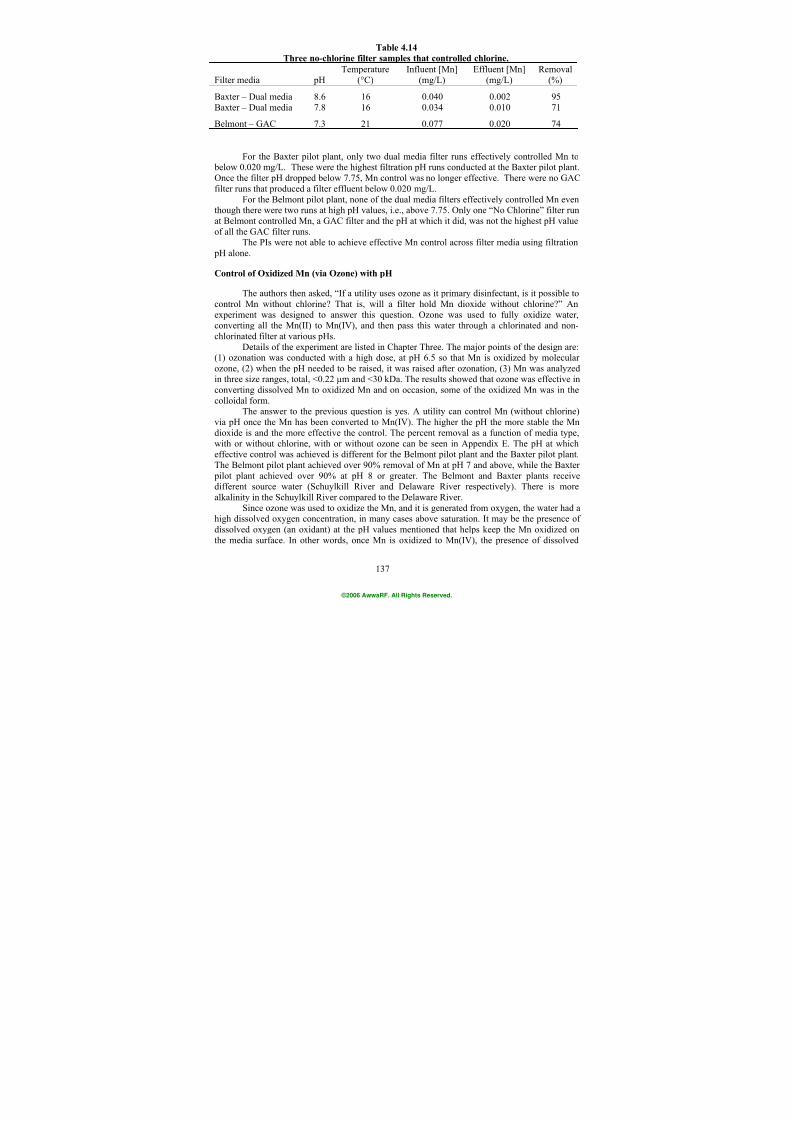
7/21/2019 Occurrence of Manganese in Drinking Water and Manganese Control
http://slidepdf.com/reader/full/occurrence-of-manganese-in-drinking-water-and-manganese-control 163/463
137
Table 4.14
Three no-chlorine filter samples that controlled chlorine.
Temperature Influent [Mn] Effluent [Mn] RemovalFilter media pH (°C) (mg/L) (mg/L) (%)
Baxter – Dual media 8.6 16 0.040 0.002 95Baxter – Dual media 7.8 16 0.034 0.010 71
Belmont – GAC 7.3 21 0.077 0.020 74
For the Baxter pilot plant, only two dual media filter runs effectively controlled Mn to below 0.020 mg/L. These were the highest filtration pH runs conducted at the Baxter pilot plant.Once the filter pH dropped below 7.75, Mn control was no longer effective. There were no GACfilter runs that produced a filter effluent below 0.020 mg/L.
For the Belmont pilot plant, none of the dual media filters effectively controlled Mn eventhough there were two runs at high pH values, i.e., above 7.75. Only one “No Chlorine” filter runat Belmont controlled Mn, a GAC filter and the pH at which it did, was not the highest pH valueof all the GAC filter runs.
The PIs were not able to achieve effective Mn control across filter media using filtration pH alone.
Control of Oxidized Mn (via Ozone) with pH
The authors then asked, “If a utility uses ozone as it primary disinfectant, is it possible tocontrol Mn without chlorine? That is, will a filter hold Mn dioxide without chlorine?” Anexperiment was designed to answer this question. Ozone was used to fully oxidize water,converting all the Mn(II) to Mn(IV), and then pass this water through a chlorinated and non-chlorinated filter at various pHs.
Details of the experiment are listed in Chapter Three. The major points of the design are:
(1) ozonation was conducted with a high dose, at pH 6.5 so that Mn is oxidized by molecularozone, (2) when the pH needed to be raised, it was raised after ozonation, (3) Mn was analyzedin three size ranges, total, <0.22 µm and <30 kDa. The results showed that ozone was effective inconverting dissolved Mn to oxidized Mn and on occasion, some of the oxidized Mn was in thecolloidal form.
The answer to the previous question is yes. A utility can control Mn (without chlorine)via pH once the Mn has been converted to Mn(IV). The higher the pH the more stable the Mndioxide is and the more effective the control. The percent removal as a function of media type,with or without chlorine, with or without ozone can be seen in Appendix E. The pH at whicheffective control was achieved is different for the Belmont pilot plant and the Baxter pilot plant.The Belmont pilot plant achieved over 90% removal of Mn at pH 7 and above, while the Baxter
pilot plant achieved over 90% at pH 8 or greater. The Belmont and Baxter plants receivedifferent source water (Schuylkill River and Delaware River respectively). There is morealkalinity in the Schuylkill River compared to the Delaware River.
Since ozone was used to oxidize the Mn, and it is generated from oxygen, the water had ahigh dissolved oxygen concentration, in many cases above saturation. It may be the presence ofdissolved oxygen (an oxidant) at the pH values mentioned that helps keep the Mn oxidized onthe media surface. In other words, once Mn is oxidized to Mn(IV), the presence of dissolved
©2006 AwwaRF. All Rights Reserved.
7/21/2019 Occurrence of Manganese in Drinking Water and Manganese Control
http://slidepdf.com/reader/full/occurrence-of-manganese-in-drinking-water-and-manganese-control 164/463
138
oxygen, at slightly elevated pH values (7 at Belmont, 8 at Baxter), is enough to keep the Mnoxidized. Oxygen by itself, under these conditions, would not have enough oxidative power toconvert Mn(II) to Mn(IV) but seems to have enough oxidative power to prevent Mn(IV) from being reduced to Mn(II). Since the experiment was not set up to study the effects of oxygen onMn control there is limited data available and these conclusions are speculative.
EH as Predictive Tool for Reduction of Mn
From previous pilot plant work (Kohl 2002) it was shown that even if Mn entered a filtercompletely oxidized, i.e., Mn(IV), without chlorination (and at pH 6.5) it would leave the filterin soluble form, Mn(II). This led the team to investigate the use of EH to determine if thereduction of Mn(IV) to Mn(II) in the filter was measurable. After 2 years of attempts, it wasdetermined that EH could not be used as a predictive tool. There is Mn reduction occurring withinthe filter but this reduction could not be correlated to bulk water EH. Both reduction andoxidation seem to take place on the filter media surface so that the overall change in bulk waterORP, as measured by EH, did not change enough or consistently enough to be predictive.
CASE STUDY II: FULL-SCALE WTP RESEARCH ON MANGANESE REMOVAL
A full scale test was conducted at one of the participating facilities. The facility examinedits ability to control Mn across GAC filters in comparison to anthracite filters using chlorine and pH. The experiments as conceived were not fully realized; therefore, a certain amount of the datacollected is not included in this report, and the analysis of the data was limited. The results ofeach of the experiments along with a process flow chart are included in Appendix F, and severalvery interesting observations can be made.
Background
The full-scale facility was designed as a conventional water treatment plant used to treatsurface water. It was also designed to control taste and odor issues, and as such, was fitted withGAC filters that treated high pH water. When Stage 1 D/DBP rule came into effect, the plant hadto lower the pH of coagulation (to allow for the removal of TOC) and limit prechlorination. Thishas changed the effectiveness of the sedimentation basin to control Mn. Also, the source waterfrom the river seems to have more Mn spikes, a cumulative result of acid mine drainage.
Results and conclusions
Figure 4.44 presents a full-scale WTP sampling event. The sampling locations and timeare shown on the x-axis. Mn data was collected using three separate means. The trianglesrepresent the ICP-MS data which is considered to be the most accurate. The other two data
points are Mn concentrations gathered using on-site, colorimetric analytical methods. Thesquares present bench top analysis using PAN, and the diamonds are on-line data points. Thegraphic shows the Mn concentration at three sampling times for each unit process. The units process from left to right represent source water to finished drinking water. The two filtereffluent data sets are for separate filters being operated in parallel. The pretreatment consisted ofcoagulation/flocculation followed by sedimentation. The pH is raised at the sedimentation basineffluent with NaOH and chlorine as added via NaOCl to control Mn across the filters. Because of
©2006 AwwaRF. All Rights Reserved.
7/21/2019 Occurrence of Manganese in Drinking Water and Manganese Control
http://slidepdf.com/reader/full/occurrence-of-manganese-in-drinking-water-and-manganese-control 165/463
139
these chemical additions the sedimentation basin effluent was sampled separately from the filterinfluent. This plant uses ICOME but since most of the filters are GAC (11 out of 12) this isunique. They have rebuilt one filter with anthracite media to determine if Mn control is betterwith a different media.
This experiment was conducted three times, as shown in Figures 4.44 through 4.46. In allthree cases both the anthracite and the GAC filters controlled Mn. Chlorine residual was always present in the anthracite filter effluent but was not detected in the GAC filter effluent. Based onthis information and previous information, the PIs determined that free chlorine residual does notneed to be maintained across a filter to achieve IOCME.
The September experiment was the first one done by the utility. As is expected with thefirst run of an experiment, several experimental bugs were worked out. For example, thefiltration pH changed during the experiment (raised from 6.5 to 7.4). This change wasunintended by the utility’s researcher but it happened none the less.
For the December experiment the total Mn concentration increased after filtration, (i.e.,the clear well samples were greater than the filter effluent samples), this did not happen inSeptember (except for one sample) or in November. The pH in the clear well was about 7.4 forall three experiments. The reason for this increase is unknown and is unexpected. There are acouple possible explanations and they are: (1) since only two of the 12 filters were being
monitored, it could be that other filters were passing Mn; (2) a shift in upstream pH could haveallowed for the release of Mn that had coated the clear well walls; (3) some Mn was somehowstirred up in the clear well. All of this is conjecture, but it is interesting to note that the Mnconcentrations are not as static as we may believe.
An incidental observation made from these experiments pertains to the method used tomeasure Mn. Our survey work revealed that, for those utilities that measure Mn, most use a bench type, colorimetric process. For these three experiments, the on-line meter and the benchscale analysis, both colorimetric methods, did not measure the Mn accurately, as compared to theICP-MS. Not only were the values different but they were different in different ways dependingon the sample location. For example, for the sedimentation basin effluent and filter influentsamples, the ICP-MS measurements indicated that there was more Mn in the water than the other
two methods, and just the opposite once the water had been filtered, i.e., the ICP-MS methodrevealed less Mn than the other two methods. The colorimetric methods under-represented theMn concentrations for some samples and over represented it for others. The colorimetricmethods are subject to positive and a negative interference. This experiment was not set up toanalyze the efficacy of different Mn measurement methods, so the work needed to identify theinterferences and to make quantitative conclusions was not done. However, the implication ofthe qualitative conclusion is still profound; the on-site method most commonly used to measureMn, and therefore, monitor the control process, has both positive and negative interferences.Specifically from the three experiments shown here, the use of the PAN method gave differentresults than the ICP-MS and indicated that the plant was not operating as well as it really was.
In defense of the PAN method. From the detailed survey questions and from
conversations with other Mn researchers, the bench top PAN method is regarded as accurate. Ithas even been demonstrated as accurate by other researchers, who were looking to reduce thecost of analysis by performing more Mn analysis using bench scale units as opposed to analyzingsamples with more advanced laboratory equipment. They conducted side by side analysis anddeem two methods similar enough to continue with the bench unit alone.
©2006 AwwaRF. All Rights Reserved.
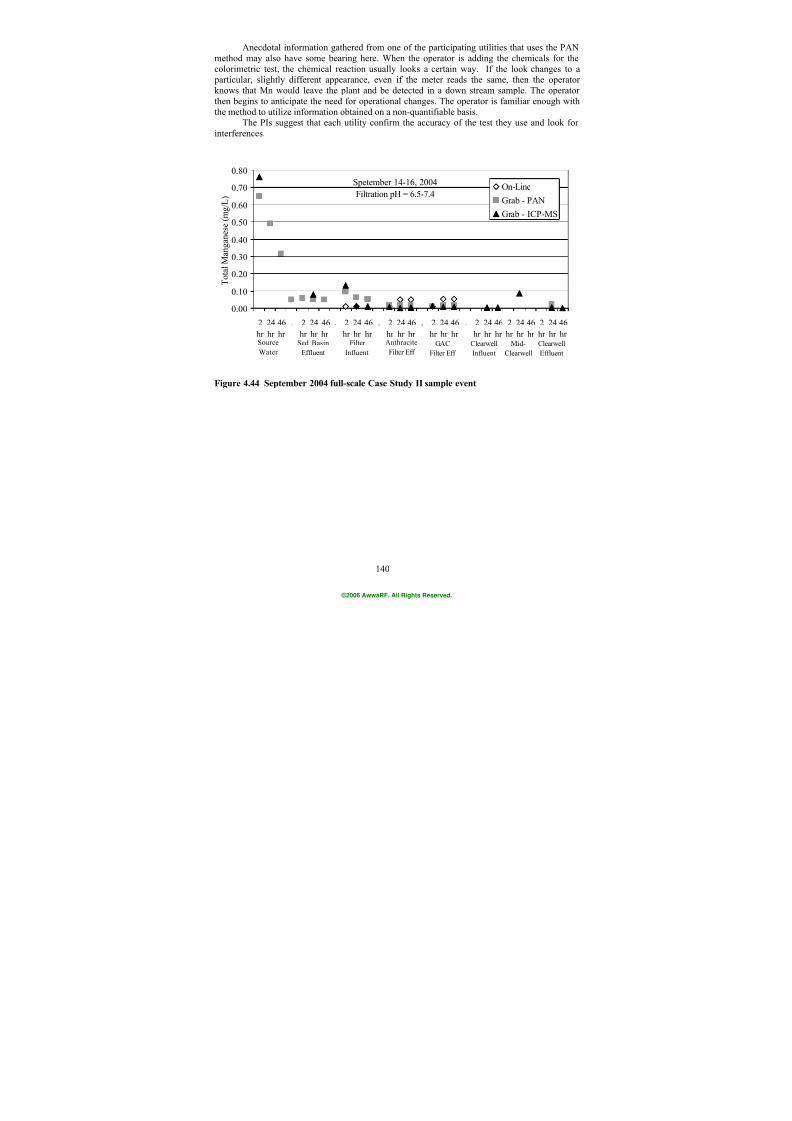
7/21/2019 Occurrence of Manganese in Drinking Water and Manganese Control
http://slidepdf.com/reader/full/occurrence-of-manganese-in-drinking-water-and-manganese-control 166/463
140
Anecdotal information gathered from one of the participating utilities that uses the PANmethod may also have some bearing here. When the operator is adding the chemicals for thecolorimetric test, the chemical reaction usually looks a certain way. If the look changes to a particular, slightly different appearance, even if the meter reads the same, then the operatorknows that Mn would leave the plant and be detected in a down stream sample. The operatorthen begins to anticipate the need for operational changes. The operator is familiar enough withthe method to utilize information obtained on a non-quantifiable basis.
The PIs suggest that each utility confirm the accuracy of the test they use and look forinterferences.
Spetember 14-16, 2004
Filtration pH = 6.5-7.4
0.00
0.10
0.20
0.30
0.40
0.50
0.60
0.70
0.80
2
hr
24
hr
46
hr
. 2
hr
24
hr
46
hr
. 2
hr
24
hr
46
hr
. 2
hr
24
hr
46
hr
. 2
hr
24
hr
46
hr
. 2
hr
24
hr
46
hr
2
hr
24
hr
46
hr
2
hr
24
hr
46
hr
T o t a l M a n g a n
e s e ( m g / L )
On-Line
Grab - PAN
Grab - ICP-MS
Source
Water
Sed Basin
Effluent
Anthracite
Filter Eff
GAC
Filter Eff
Filter
Influent
Clearwell
Influent
Mid-
Clearwell
Clearwell
Effluent
Figure 4.44 September 2004 full-scale Case Study II sample event
©2006 AwwaRF. All Rights Reserved.
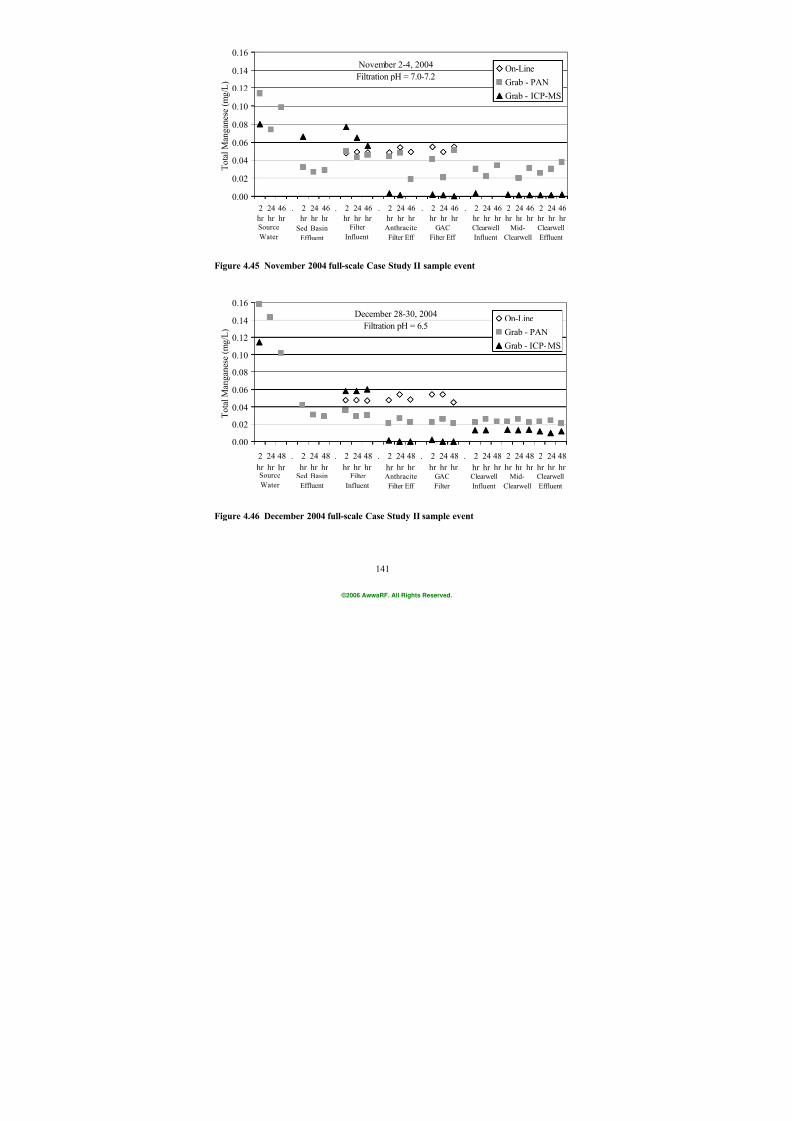
7/21/2019 Occurrence of Manganese in Drinking Water and Manganese Control
http://slidepdf.com/reader/full/occurrence-of-manganese-in-drinking-water-and-manganese-control 167/463
141
November 2-4, 2004
Filtration pH = 7.0-7.2
0.00
0.02
0.04
0.06
0.08
0.10
0.12
0.14
0.16
2
hr
24
hr
46
hr
. 2
hr
24
hr
46
hr
. 2
hr
24
hr
46
hr
. 2
hr
24
hr
46
hr
. 2
hr
24
hr
46
hr
. 2
hr
24
hr
46
hr
2
hr
24
hr
46
hr
2
hr
24
hr
46
hr
T o t a l M a n g a n e
s e ( m g / L )
On-Line
Grab - PAN
Grab - ICP-MS
Source
Water
Sed Basin
Effluent
Anthracite
Filter Eff
GAC
Filter Eff
Filter
Influent
Clearwell
Influent
Mid-
Clearwell
Clearwell
Effluent
Figure 4.45 November 2004 full-scale Case Study II sample event
December 28-30, 2004
Filtration pH = 6.5
0.00
0.02
0.04
0.06
0.08
0.10
0.12
0.14
0.16
2
hr
24
hr
48
hr
. 2
hr
24
hr
48
hr
. 2
hr
24
hr
48
hr
. 2
hr
24
hr
48
hr
. 2
hr
24
hr
48
hr
. 2
hr
24
hr
48
hr
2
hr
24
hr
48
hr
2
hr
24
hr
48
hr
T o t a l M a n g a n e s e
( m g / L )
On-Line
Grab - PAN
Grab - ICP-MS
SourceWater
Sed BasinEffluent
AnthraciteFilter Eff
GACFilter
FilterInfluent
ClearwellInfluent
Mid-Clearwell
ClearwellEffluent
Figure 4.46 December 2004 full-scale Case Study II sample event
©2006 AwwaRF. All Rights Reserved.
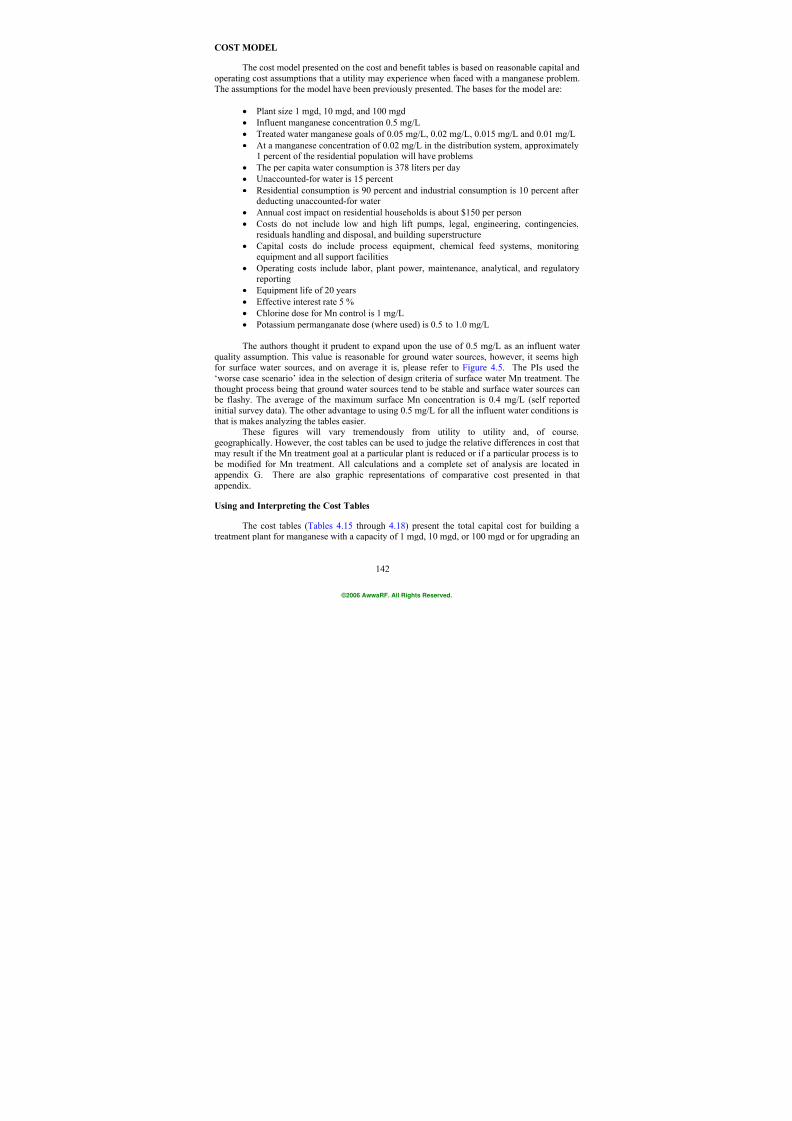
7/21/2019 Occurrence of Manganese in Drinking Water and Manganese Control
http://slidepdf.com/reader/full/occurrence-of-manganese-in-drinking-water-and-manganese-control 168/463
142
COST MODEL
The cost model presented on the cost and benefit tables is based on reasonable capital andoperating cost assumptions that a utility may experience when faced with a manganese problem.The assumptions for the model have been previously presented. The bases for the model are:
• Plant size 1 mgd, 10 mgd, and 100 mgd
•
Influent manganese concentration 0.5 mg/L
• Treated water manganese goals of 0.05 mg/L, 0.02 mg/L, 0.015 mg/L and 0.01 mg/L
• At a manganese concentration of 0.02 mg/L in the distribution system, approximately1 percent of the residential population will have problems
• The per capita water consumption is 378 liters per day
• Unaccounted-for water is 15 percent
• Residential consumption is 90 percent and industrial consumption is 10 percent afterdeducting unaccounted-for water
• Annual cost impact on residential households is about $150 per person
• Costs do not include low and high lift pumps, legal, engineering, contingencies,
residuals handling and disposal, and building superstructure• Capital costs do include process equipment, chemical feed systems, monitoring
equipment and all support facilities
• Operating costs include labor, plant power, maintenance, analytical, and regulatoryreporting
• Equipment life of 20 years
• Effective interest rate 5 %
• Chlorine dose for Mn control is 1 mg/L
• Potassium permanganate dose (where used) is 0.5 to 1.0 mg/L
The authors thought it prudent to expand upon the use of 0.5 mg/L as an influent water
quality assumption. This value is reasonable for ground water sources, however, it seems highfor surface water sources, and on average it is, please refer to Figure 4.5. The PIs used the‘worse case scenario’ idea in the selection of design criteria of surface water Mn treatment. Thethought process being that ground water sources tend to be stable and surface water sources can be flashy. The average of the maximum surface Mn concentration is 0.4 mg/L (self reportedinitial survey data). The other advantage to using 0.5 mg/L for all the influent water conditions isthat is makes analyzing the tables easier.
These figures will vary tremendously from utility to utility and, of course,geographically. However, the cost tables can be used to judge the relative differences in cost thatmay result if the Mn treatment goal at a particular plant is reduced or if a particular process is to be modified for Mn treatment. All calculations and a complete set of analysis are located in
appendix G. There are also graphic representations of comparative cost presented in thatappendix.
Using and Interpreting the Cost Tables
The cost tables (Tables 4.15 through 4.18) present the total capital cost for building atreatment plant for manganese with a capacity of 1 mgd, 10 mgd, or 100 mgd or for upgrading an
©2006 AwwaRF. All Rights Reserved.
7/21/2019 Occurrence of Manganese in Drinking Water and Manganese Control
http://slidepdf.com/reader/full/occurrence-of-manganese-in-drinking-water-and-manganese-control 169/463
143
existing plant. Two capital costs are presented, the total cost to build the facility and the portionof the capital cost that is associated with manganese treatment only. For example, the cost toconstruct a manganese greensand plant (assuming only manganese is present and not iron), is thesame as the cost allocated for manganese removal. On the other hand the allocated cost formanganese removal with a lime softening plant is negligible since the softening process wouldremove manganese incidental to the removal of hardness. The annual capital recovery associatedwith manganese removal is calculated on the basis of the capital cost associated with themanganese removal taken over a 20 year period at 5 percent interest. Therefore, the annual payment to construct a 1 mgd, manganese greensand treatment plant would be about $60,200while the annual capital cost associated with a lime softening plant would be zero, since thesoftening plant would be designed for hardness and the manganese removal secondary.
The operating costs provided in the tables include the additional expenses associated withremoving manganese from 0.05 mg/L to the various target goals. Included in the costs arechemicals, labor, additional monitoring and reporting. For example, the total annual operatingcost to reduce raw water manganese from a concentration of 0.5 mg/L to 0.05 mg/L, for a 1 mgdmanganese greensand facility, would be about $40,000. If the manganese goal from the plantwere decreased to 0.02 mg/L, the annual cost would increase by approximately $7,000 to$47,000 per year. The additional cost would be for more frequent filter backwashing, additional
monitoring and an increase in chemical feed. Again, it should be emphasized that these costsshould be used to compare treatment approaches and not to estimate the absolute costs to a utilityif a manganese treatment plant were to be constructed or an existing plant modified.
The annual total cost presented in the tables is the sum of the annual capital recovery costassociated with manganese and the total annual operating cost associated with that particulartype of treatment process. The annual impact is calculated on the basis of the estimated cost tothe residential consumers using the assumptions listed previously (i.e., $150 per year per affectedresident). The cost to benefit ratio compares the annual total cost to the annual impact. The benefit as defined in this study was based on the reduction in consumer problems associated withmanganese when the concentration of the treated water was reduced from 0.05 mg/L to the targetgoal. Therefore, the cost to benefit ratio for a finished water manganese concentration of 0.05
mg/L is not applicable. The ratio is applicable at target manganese concentrations of 0.02 mg/L,0.015 mg/L and 0.01 mg/L. In all cases, as the size of the plant increases the cost to benefit ratiodecreases, meaning that a larger plant realizes more benefit than a smaller plant. This is logicalsince the cost and complexity of a larger plant are less than a smaller facility. The technologiesthat treat manganese as incidental to the process have a very low cost to benefit ratio becausevery little capital costs were incurred.
Significance of Benefit Relative to Manganese Concentration
A complete set of tables is located in Appendix G. The cost for treating water does notseem to vary significantly depending on the source of Mn. Most treatment processes rely on
converting the dissolved, soluble Mn to the less soluble, particulate form for subsequentseparation using filtration or clarification. Some processes rely on attachment and thenoxidation, such as manganese greensand, in most cases the Mn is oxidized and then removed.Two processes which can remove dissolved Mn directly are ion exchange and membranes.
For the purpose of the cost model, specific costs associated with utility expenses as aconsequence of elevated Mn were not included other than the actual operating and capital costsassociated with treatment. Therefore, the cost tables presented in this report tend to understate
©2006 AwwaRF. All Rights Reserved.

7/21/2019 Occurrence of Manganese in Drinking Water and Manganese Control
http://slidepdf.com/reader/full/occurrence-of-manganese-in-drinking-water-and-manganese-control 170/463
144
the actual costs to utilities associated with Mn. Interviews conducted with utilities during thisresearch indicated that utilities experiencing Mn problems recognized an associated cost, whichcould be quite significant. However, only direct consumer costs are included as a comparison totreatment costs.
The cost to benefit ratios presented in Appendix G, Figures G.1 and G.2 r ange from a lowof 0.75 to a high of 18.0. A ratio less that 1.0 indicates that the cost associated with producingwater, with less Mn than the existing 0.05 mg/L level, is justified on the basis that the moneysaved by the consumer is greater than the money spent by the utility. A cost to benefit ratiogreater than 1.0 suggests that savings to the consumer is less than the cost to the utility, andtherefore implementation on a cost basis may not be justified. It is important to note that in allcases the utility is spending money and the consumer is saving money. The ratio is simply amethod to compare the two values. In terms of social policy, the lower the ratio, the morefavorable the economics, allowing for the great good to come at a lower cost. Ratios above 1 donot imply that consumer benefit is less, it simply implies that it comes at a greater cost to theutility. Several treatment technologies, including CGS, direct filtration, lime softening, advancedclarification, and membranes (Mn removal incidental to membranes employed for othertreatment requirements) fall below the 1.0 cost to benefit ratio, especially for plant at or above 10mgd capacity.
©2006 AwwaRF. All Rights Reserved.
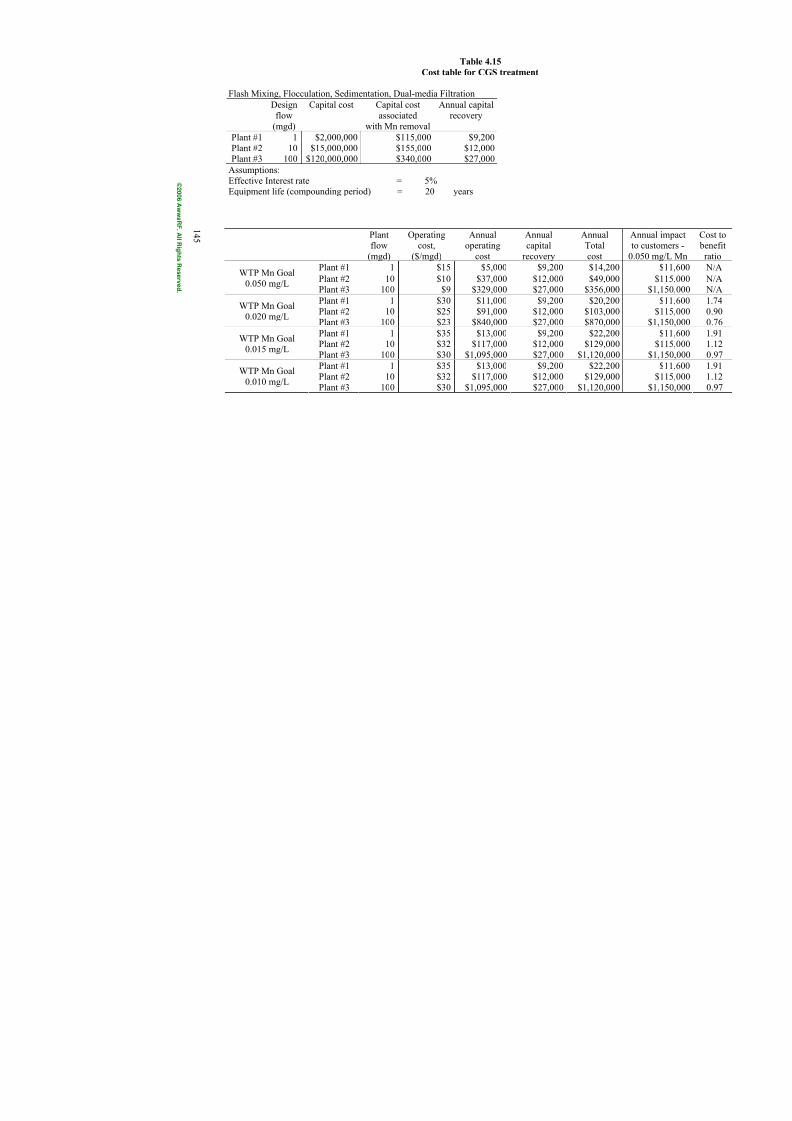
7/21/2019 Occurrence of Manganese in Drinking Water and Manganese Control
http://slidepdf.com/reader/full/occurrence-of-manganese-in-drinking-water-and-manganese-control 171/463
1
4 5
Table 4.15
Cost table for CGS treatment
Flash Mixing, Flocculation, Sedimentation, Dual-media Filtration
Design
flow(mgd)
Capital cost Capital cost
associatedwith Mn removal
Annual capital
recovery
Plant #1 1 $2,000,000 $115,000 $9,200Plant #2 10 $15,000,000 $155,000 $12,000Plant #3 100 $120,000,000 $340,000 $27,000
Assumptions:Effective Interest rate = 5%Equipment life (compounding period) = 20 years
Plantflow
(mgd)
Operatingcost,
($/mgd)
Annualoperating
cost
Annualcapital
recovery
AnnuaTotalcost
Plant #1 1 $15 $5,000 $9,200 $14,2
Plant #2 10 $10 $37,000 $12,000 $49,0WTP Mn Goal
0.050 mg/LPlant #3 100 $9 $329,000 $27,000 $356,0
Plant #1 1 $30 $11,000 $9,200 $20,2Plant #2 10 $25 $91,000 $12,000 $103,0
WTP Mn Goal0.020 mg/L
Plant #3 100 $23 $840,000 $27,000 $870,0
Plant #1 1 $35 $13,000 $9,200 $22,2Plant #2 10 $32 $117,000 $12,000 $129,0
WTP Mn Goal0.015 mg/L
Plant #3 100 $30 $1,095,000 $27,000 $1,120,0Plant #1 1 $35 $13,000 $9,200 $22,2Plant #2 10 $32 $117,000 $12,000 $129,0
WTP Mn Goal0.010 mg/L
Plant #3 100 $30 $1,095,000 $27,000 $1,120,0
© 2 0 0 6 A wwaR F .
A l l R i gh t sR eser ved .
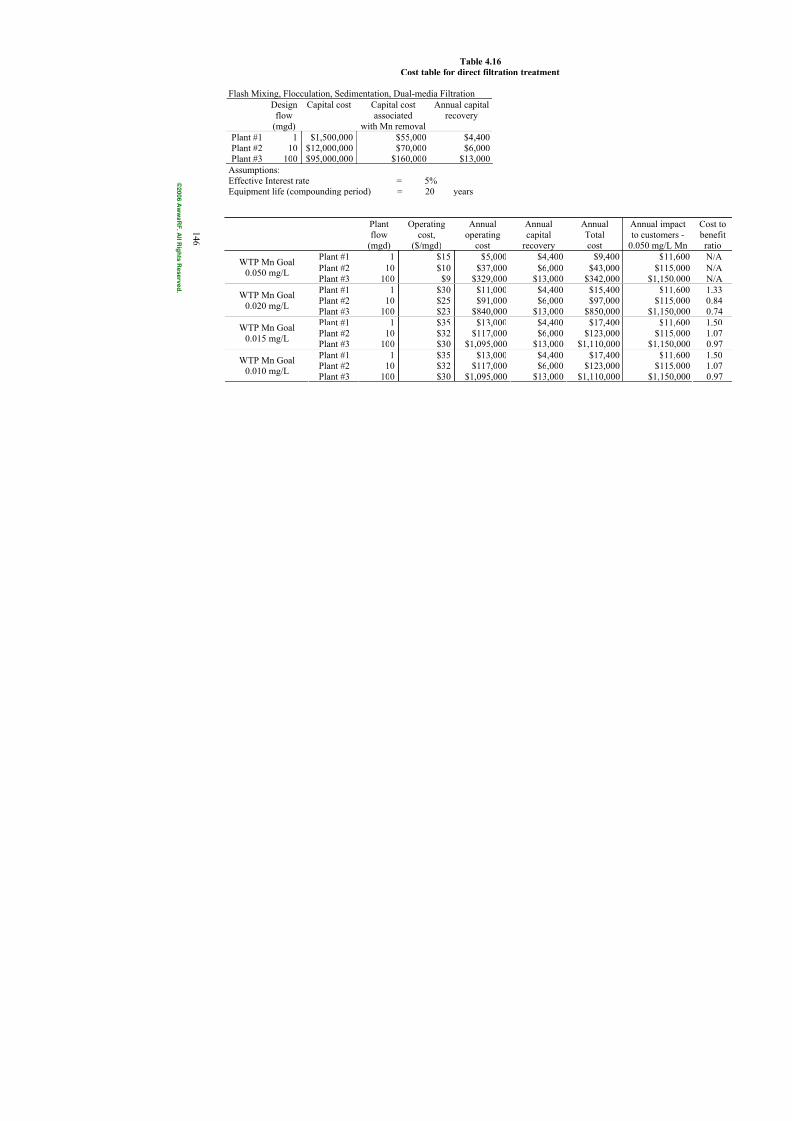
7/21/2019 Occurrence of Manganese in Drinking Water and Manganese Control
http://slidepdf.com/reader/full/occurrence-of-manganese-in-drinking-water-and-manganese-control 172/463
1 4 6
Table 4.16
Cost table for direct filtration treatment
Flash Mixing, Flocculation, Sedimentation, Dual-media Filtration
Design
flow(mgd)
Capital cost Capital cost
associatedwith Mn removal
Annual capital
recovery
Plant #1 1 $1,500,000 $55,000 $4,400Plant #2 10 $12,000,000 $70,000 $6,000Plant #3 100 $95,000,000 $160,000 $13,000
Assumptions:Effective Interest rate = 5%Equipment life (compounding period) = 20 years
Plant
flow(mgd)
Operating
cost,($/mgd)
Annual
operatingcost
Annual
capitalrecovery
Annua
Totalcost
Plant #1 1 $15 $5,000 $4,400 $9,4
Plant #2 10 $10 $37,000 $6,000 $43,0WTP Mn Goal
0.050 mg/LPlant #3 100 $9 $329,000 $13,000 $342,0
Plant #1 1 $30 $11,000 $4,400 $15,4Plant #2 10 $25 $91,000 $6,000 $97,0
WTP Mn Goal0.020 mg/L
Plant #3 100 $23 $840,000 $13,000 $850,0
Plant #1 1 $35 $13,000 $4,400 $17,4Plant #2 10 $32 $117,000 $6,000 $123,0
WTP Mn Goal0.015 mg/L
Plant #3 100 $30 $1,095,000 $13,000 $1,110,0
Plant #1 1 $35 $13,000 $4,400 $17,4Plant #2 10 $32 $117,000 $6,000 $123,0
WTP Mn Goal0.010 mg/L
Plant #3 100 $30 $1,095,000 $13,000 $1,110,0
© 2 0 0 6 A wwaR F .
A l l R i gh t sR eser ved .
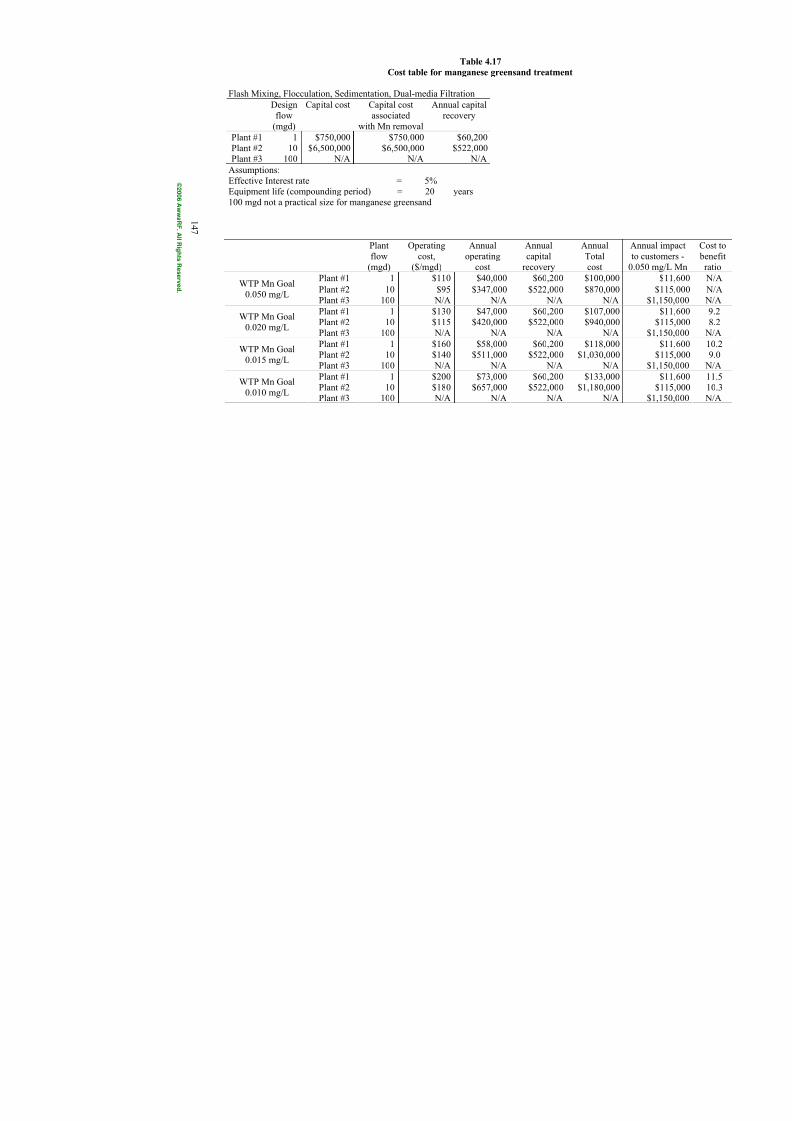
7/21/2019 Occurrence of Manganese in Drinking Water and Manganese Control
http://slidepdf.com/reader/full/occurrence-of-manganese-in-drinking-water-and-manganese-control 173/463
1 4 7
Table 4.17
Cost table for manganese greensand treatment
Flash Mixing, Flocculation, Sedimentation, Dual-media Filtration
Design
flow(mgd)
Capital cost Capital cost
associatedwith Mn removal
Annual capital
recovery
Plant #1 1 $750,000 $750,000 $60,200Plant #2 10 $6,500,000 $6,500,000 $522,000Plant #3 100 N/A N/A N/A
Assumptions:Effective Interest rate = 5%Equipment life (compounding period) = 20 years100 mgd not a practical size for manganese greensand
Plantflow
(mgd)
Operatingcost,
($/mgd)
Annualoperating
cost
Annualcapital
recovery
AnnuaTotalcost
Plant #1 1 $110 $40,000 $60,200 $100,0
Plant #2 10 $95 $347,000 $522,000 $870,0WTP Mn Goal
0.050 mg/LPlant #3 100 N/A N/A N/A N
Plant #1 1 $130 $47,000 $60,200 $107,0Plant #2 10 $115 $420,000 $522,000 $940,0
WTP Mn Goal0.020 mg/L
Plant #3 100 N/A N/A N/A N
Plant #1 1 $160 $58,000 $60,200 $118,0
Plant #2 10 $140 $511,000 $522,000 $1,030,0WTP Mn Goal
0.015 mg/LPlant #3 100 N/A N/A N/A N
Plant #1 1 $200 $73,000 $60,200 $133,0Plant #2 10 $180 $657,000 $522,000 $1,180,0
WTP Mn Goal0.010 mg/L
Plant #3 100 N/A N/A N/A N
© 2 0 0 6 A wwaR F .
A l l R i gh t sR eser ved .
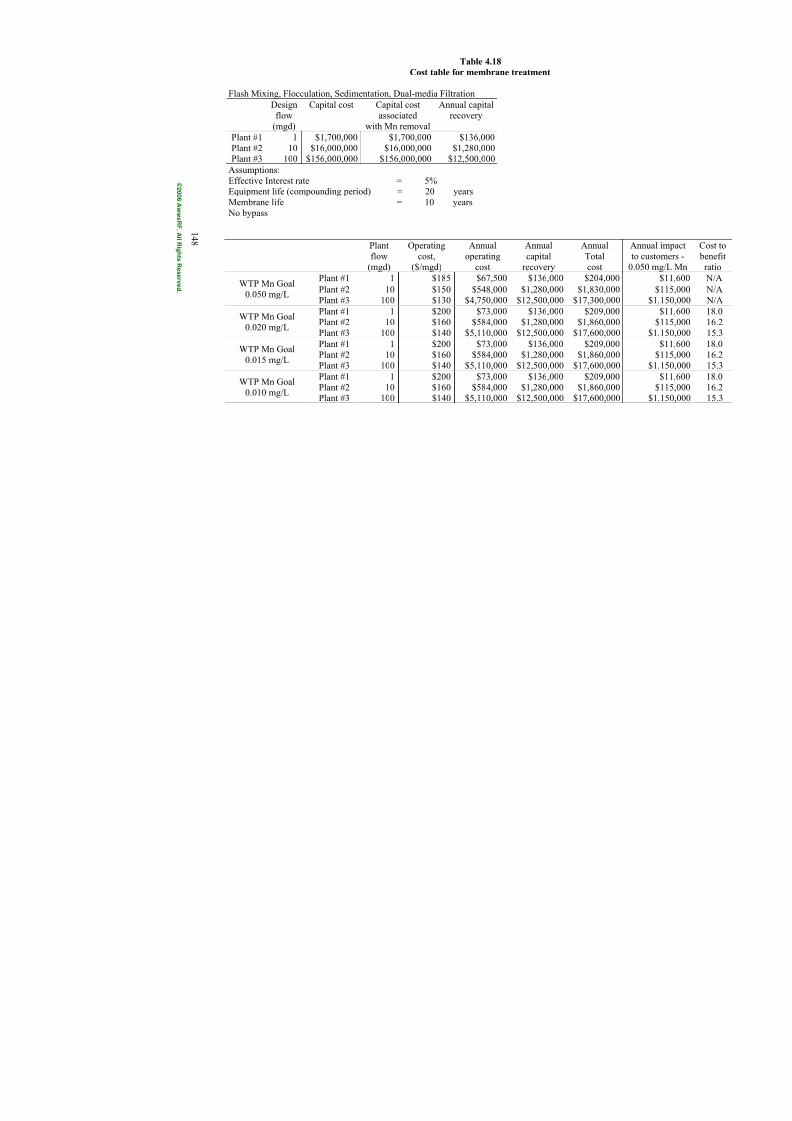
7/21/2019 Occurrence of Manganese in Drinking Water and Manganese Control
http://slidepdf.com/reader/full/occurrence-of-manganese-in-drinking-water-and-manganese-control 174/463
1 4 8
Table 4.18
Cost table for membrane treatment
Flash Mixing, Flocculation, Sedimentation, Dual-media Filtration
Design
flow(mgd)
Capital cost Capital cost
associatedwith Mn removal
Annual capital
recovery
Plant #1 1 $1,700,000 $1,700,000 $136,000Plant #2 10 $16,000,000 $16,000,000 $1,280,000Plant #3 100 $156,000,000 $156,000,000 $12,500,000
Assumptions:Effective Interest rate = 5%Equipment life (compounding period) = 20 yearsMembrane life = 10 years No bypass
Plantflow
(mgd)
Operatingcost,
($/mgd)
Annualoperating
cost
Annualcapital
recovery
AnnuaTotalcost
Plant #1 1 $185 $67,500 $136,000 $204,0
Plant #2 10 $150 $548,000 $1,280,000 $1,830,0WTP Mn Goal
0.050 mg/LPlant #3 100 $130 $4,750,000 $12,500,000 $17,300,0
Plant #1 1 $200 $73,000 $136,000 $209,0Plant #2 10 $160 $584,000 $1,280,000 $1,860,0
WTP Mn Goal0.020 mg/L
Plant #3 100 $140 $5,110,000 $12,500,000 $17,600,0
Plant #1 1 $200 $73,000 $136,000 $209,0
Plant #2 10 $160 $584,000 $1,280,000 $1,860,0WTP Mn Goal
0.015 mg/LPlant #3 100 $140 $5,110,000 $12,500,000 $17,600,0
Plant #1 1 $200 $73,000 $136,000 $209,0Plant #2 10 $160 $584,000 $1,280,000 $1,860,0
WTP Mn Goal0.010 mg/L
Plant #3 100 $140 $5,110,000 $12,500,000 $17,600,0
© 2 0 0 6 A wwaR F .
A l l R i gh t sR eser ved .
7/21/2019 Occurrence of Manganese in Drinking Water and Manganese Control
http://slidepdf.com/reader/full/occurrence-of-manganese-in-drinking-water-and-manganese-control 175/463
149
The SMCL is intended to prevent household problems for the majority of consumers.Based on the initial and detailed surveys, and supported by the occurrence sampling, the level of0.05 mg/L for manganese may not be sufficiently low to insure an acceptable water quality mostof the time. In fact, the interviews conducted during this research strongly suggest that manyconsumers, perhaps the majority, will experience episodic difficulties if the Mn concentration inthe household water remains at 0.05 mg/l. The target concentration of either 0.02 or 0.015 mg/L,is a more reasonable level given increasing consumer expectations. Manganese is not a primarystandard, thus, there may be some industry complacency.
Therefore, as with any aesthetic contaminant, the benefit is difficult to quantify from the perspective of benefit to the utility. There is a cost benefit to the consumer since discoloration,sediment and staining from manganese can, indeed, cost money. As can be seen from the costtables, the economic benefit to a utility from implementing more stringent control of manganeseis nominal, although there may be such things as less system flushing, etc. Consumers tend to judge the overall quality of the healthfulness of tap water on the basis of appearance and taste.Consequently, aesthetics of water are very important in maintaining consumer confidence andsupport. It is suggested that each utility that deals with manganese establish a good monitoring program that truly tracks the concentration of manganese in the distribution system andconsumer complaints associated with the manganese.
Many systems that have Mn problems are small groundwater utilities that may not havethe financial resources to support additional treatment beyond that required for public health. Thedifference in costs associated with capital improvement and operational improvement should beclearly understood. For example, a small utility may be, because of limited financial resources,less likely to build new treatment. So if a new well is dug or an old one starts to have more Mn,the utility is less likely to build Mn specific treatment, then it is to blend the water and hope forthe best. However, if that utility, albeit small, already has Mn treatment, it is not restricted by therelatively small amount of additional cost associated with treating to a level below the SMCL, ifit sees it as in it best interest.
In another example, a large water utility that had relied on well water for most of itexistence is now struggling to meet demand and has dug new well, a well with Mn. This utility
is reluctant to treat this new well for Mn, although it is an issue, simply because they have nohistory of doing so. In this example, the obstacle is not financial, because it is a city that hasresources, it is institutional inertia. In both cases the biggest obstacle to lowering Mnconcentrations in the drinking water is the initial capital cost, not the operating cost.
©2006 AwwaRF. All Rights Reserved.

7/21/2019 Occurrence of Manganese in Drinking Water and Manganese Control
http://slidepdf.com/reader/full/occurrence-of-manganese-in-drinking-water-and-manganese-control 176/463
150
©2006 AwwaRF. All Rights Reserved.
7/21/2019 Occurrence of Manganese in Drinking Water and Manganese Control
http://slidepdf.com/reader/full/occurrence-of-manganese-in-drinking-water-and-manganese-control 177/463
151
CHAPTER 5
CONCLUSIONS
INTRODUCTION
As with the other chapters this will follow the sequence of the major investigations.However, each section will include knowledge gained during all the investigations.
INITIAL SURVEY
Most utilities are aware of whether or not they have a Mn issue. The strongest source ofMn feedback comes from their customers. Since Mn is an aesthetic issue, the first people tonotice problems are the consumers.
Most utilities are quite capable of dealing with Mn. However, if there is no history ofcustomer complaints regarding Mn, the utility may be unaware of latent Mn issues. Specifically,if a utility controls Mn without recognizing the mechanism, say, by way of induced-oxide coated
media effect (IOCME) then a Mn problem may occur if that process is disturbed. Thisdisturbance is more likely to occur today than in previous years, since many utilities are seekingways to reduce DBPs. In many instances, the initial point of chlorine application is being movedfurther back in the process, and in some cases this initial point of chlorination is after the filterseliminating the benefits of IOCME.
Mn is an issue for both surface water and groundwater systems. Most utilities measure both source water and finished water for Mn while few routinely measure the Mn in distributionsystem. The utilities that routinely sample and monitor Mn are those utilities that experiencecomplaints. Our initial survey results indicated that less than one quarter actually sampledistribution system Mn concentration. This may reflect a prevailing thought process that thedistribution system concentration is equal to the finished water concentration. This thought
process is incorrect.On a side note, there are utilities whose source water is affected by acid mine drainage
(AMD), that used to have only a little Mn or only a few episodes, however, now seem to havemore Mn and more frequent episodes. Such utilities are working with their watershedassociations as best they can to combat the trend of increased Mn occurrence in source water.
The analysis of the finished water concentration of the surveyed facilities revealed thatfor all source waters and all treatment types, the average amount of Mn is 22 µg/L in the treatedwater leaving the plant. The 90th percentile of the data was below 50 µg/L. Currently, Mn is being controlled at many utilities to below the SMCL, yet customer complaints still exist. Thissuggests that utilities respond to Mn issues as part of customer service as opposed to regulatorycompliance.
Pressure filtration for iron and Mn removal is used in many smaller systems especiallythose with groundwater sources. This treatment process becomes prohibitively expensive as thesystem size increases. Pressure filtration is designed to primarily remove iron and Mn, thereforeif other treatment requirements are imposed on a utility, then that utility has to utilize additionalunit processes. This need for additional treatment tends to move the process selection processaway from treatment for iron and Mn removal only, and toward alternative processes for whichiron and Mn is removed (or reduced) subsequent to (or in addition to) the primary design. Forlarger water treatment plants, particularly those that rely on surface water, several unit processes
©2006 AwwaRF. All Rights Reserved.
7/21/2019 Occurrence of Manganese in Drinking Water and Manganese Control
http://slidepdf.com/reader/full/occurrence-of-manganese-in-drinking-water-and-manganese-control 178/463
152
are usually required. From the results of our survey, the control of Mn often dictates the design parameters of at least one of them.
In some cases water treatment plants create their own Mn problem through addition ofMn either by adding chemicals containing Mn, by recycling water from solids handling facilities,or from sub-optimal sedimentation solids removal.
Although sequestration is an acceptable Mn treatment technique, it is not always effectivefor several reasons. Sequestering agents degrade within the distribution system so if the detentiontime in a system is long the effectiveness of sequestration decreases. More importantly, thechemistry of sequestration is much more complex than it appears. If too little sequesteringchemical is added, then Mn is not completely sequestered; if too much is added, previouslyformed Mn coating on the pipes may be released. Some utilities intentionally overdose thesequestering agent to ‘clean the pipes’. And according to survey participants, ‘all vendorsrecommend a slight overdose of the chemical for the reason that 95% of the dose will be used tosequester hardness (i.e., calcium, and magnesium)’. Careful consideration of dose is importantand therefore optimization is required. Optimization usually occurs at the initiation of the use ofsequestering agents. Optimization is often done with the help of the product’s manufacturer who provides useful advice. This optimization is acceptable and applicable only if the utility’s process remains constant all year long. The most important reason sequestering agents are not
heavily used is that they do not remove the Mn. Sequestration and corrosion inhibition are notthe same process and use different chemical agents, but since phosphate is commonly used for both, some confusion exists within the industry.
DETAILED SURVEY
There appears to be no strong correlations between source water or finished water Mnconcentrations and other water quality parameters. Although useful information relative tooptimizing treatment for Mn in a particular case can be concluded from water quality parameters,these cannot be used to predict the likelihood nor the magnitude of Mn to be expected in thedistribution system. Even iron (Fe), which often co-exists with Mn did not correlate to Mn. This
specific correlation did not work because the relative amounts of each are so variable, i.e., theyare not proportionally related even though they often occur together.
The many treatment processes used to treat water and those used specifically to controlMn work best under constant loading, even when this loading is very high. Variable loading isdifficult to handle, and those facilities that have a maximum to average concentration ratio ofgreater than 7.5 report trouble with Mn episodes. Mn concentration variability in the sourcewater will, more likely than not, result in finished water Mn variability.
KMnO4 is a very powerful and effective oxidant that will quickly convert Mn(II) toMn(IV) and when used in conjunction with other processes it was highly effective (e.g., pressurefiltration). However when followed by settling alone (either conventional or advancedclarification plants) utilities averaged 83% removal of Mn through the treatment process, with a
finished water concentration of 0.020 mg/L. It was also determined that removal of Mn viasettling need to be monitored and controlled, when it was not, Mn events occurred. Survey resultindicated that KMnO4 is often used to treat Mn but it was not always the most effective.
The survey data indicated that IOCME may be the best process for removing Mn, withfinished water averaging 0.007 mg/L. However, IOCME requires chlorine, and thus is limited inmany cases by DBP formation considerations. Also, the increased pH needed to optimize the process may require chemical feed systems and additional chemical cost. The most attractive
©2006 AwwaRF. All Rights Reserved.
7/21/2019 Occurrence of Manganese in Drinking Water and Manganese Control
http://slidepdf.com/reader/full/occurrence-of-manganese-in-drinking-water-and-manganese-control 179/463
153
aspect of IOCME is that it seems to work without monitoring as long as there is chlorine (andMn) present and the pH is above 5.8.
There is not a lot of Mn entering the distribution systems in the utilities surveyed, almostalways less than 50 µg/L. Seventy two percent (72%) of the surveyed utilities have less than 20µg/L of Mn entering the distribution system.
Almost every water utility surveyed has some form of customer complaint tracking(94%). All respond to complaints. However, few have actually tested for Mn in response tocomplaints. Often, there is a general understanding that the response to a dirty water complaintis flushing. Therefore, confirmation that the source of the complaint is Mn, Fe, or both is oftennot considered important.
SEASONAL OCCURRENCE SAMPLING
Both high and low concentrations of manganese in treated water result in either chemicalor biochemical deposition of manganese oxides on pipeline surfaces. Biochemical depositionoccurs in systems that have no chlorine or the chlorine residual dies off before the end of thedistribution system. Chemical deposition occurs when Mn (II) enters the distribution system andis oxidized to Mn (IV) by chlorine used for disinfection. Manganese deposition generally
decreases with distance from the treatment plant. The progression of deposition through thedistribution system is generally affected by the concentration of manganese and the capacity ofthe pipeline surface to adsorb the manganese oxide. This capacity depends on the average watervelocity, which determines the shear force and the width of the boundary layer within which themanganese oxide remains protected. Once the capacity of the pipeline is exceeded or whenhigher flow rates occur, manganese oxide coating will detach until equilibrium is reached, possibly causing deterioration in water quality at the tap. Evidence of this was gathered fromsome excursion sampling, when a distribution system’s Mn concentration was 5 to 10 timeshigher than the Mn entering the system.
There were no strong correlations between Mn concentration and other water quality parameters within a distribution system. Therefore, no surrogate water quality parameter was
found. The study suggests that there is no substitute for Mn sampling nor is there a good predictor of Mn concentration. The parameter with the most promise of producing a strongcorrelation was apparent color. The occurrence of Mn within the distribution system is a functionof how much Mn enters from the source. It is also a function of the local conditions, mostnotably the velocity since it stirs up the settled particulate Mn. The predominance of MnO2 during these high velocity (re-suspension) episodes adds to the availability of adsorption sitesand an increase in catalytic action thereby decreasing the concentration of any soluble Mn.Therefore, at high flow conditions MnO2 is the predominant form of Mn, and this causes coloredwater. This is advantageous for flushing because Mn is removed from the distribution systemwhen local velocities increase. Yet it can detrimental because this suspension of Mn particlesincreases complaints as it is highly visible.
The need to define Mn speciation after ozone is based on informing the operator whetheror not the ozone process has oxidized the Mn. If colloidal Mn is formed and the water tested viaa 0.22 µm filter it would seem as if there was dissolved Mn ergo not enough oxidant present.This would be a misinterpretation of the reality of the situation. The PIs took this one stepfurther and tested to see how far into a distribution system colloidal Mn could be found. In thisstudy, only the facilities that use sequestration to control Mn problems had colloidal Mn in theirdistribution system. The study did not indicate that ozone use results in colloidal Mn in the
©2006 AwwaRF. All Rights Reserved.
7/21/2019 Occurrence of Manganese in Drinking Water and Manganese Control
http://slidepdf.com/reader/full/occurrence-of-manganese-in-drinking-water-and-manganese-control 180/463
154
distribution system. The application of ozone can create colloidal Mn, but at the ozone dosesused in the drinking water industry, this does not seem to be an issue.
CASE STUDY I
Under certain raw water conditions, IOCME did not maintain Mn below acceptablelevels. Factors which influenced this were dose of chlorine and filtration pH. The ability of the
filters to remove Mn was, as expected, also influenced by seasonal temperature variations.Between the tested pH values of 6.5 and 8.5, the lower the pH, the less reliable the process of Mnremoval. Mn oxidizes more readily at elevated pH. Also, the ratio of soluble Mn to particulateMn will vary with raw water conditions and with coagulant dose. Particulate Mn will becoagulated, settled and filtered, while soluble Mn must be oxidized either in the pretreatment basins or through IOCME on the media grains, if not it will pass through the treatment process.The oxidation reaction of Mn is a kinetic one (i.e., time and temperature dependent); the colderthe water the slower the reaction and, consequently, the process of Mn removal is less efficientwhen the raw water is colder in the winter.
The use of ozone to control Mn was possible even if no chlorine was applied to the filter.When ozone was applied to the incoming water, the Mn was oxidized from the soluble to the
insoluble form and subsequently removed by filtration. Any Mn that was not oxidized by theozone passed through the filters, unless chlorine was applied to the filters. It is possible to applyozone to water and not convert the Mn to the particulate form. In order for Mn to be oxidized itmust have sufficient contact with molecular ozone. Since ozone is very reactive and isscavenged there must be enough ozone applied to overcome this competition. Lowering the pHof ozonation helps to promote the presence of molecular ozone by having less scavenging byOH-. For this research a pH of 6.45 was chosen to accomplish this.
Another benefit of using ozone to oxidize Mn from Mn(II) to Mn (IV) is that there is anoverall increase in oxidation reduction potential (ORP), making the capture of MnO2 moresuccessful. That is, once particulate Mn is produced it can remain stable in the filter. Wehypothesize that the presence of dissolved oxygen, at or above saturation, after the water has
been ozonated was enough to keep it in this oxidized form. Empirical evidence also indicatedthat more alkalinity in the water lead to better control of Mn using ozone. This we believe to be aresult of MnO2 stability, as opposed to ozone interaction, as Ca2+ is itself, an ozone scavenger. Itis possible to combine the use of ozone and free chlorine. The dose need for both would bereduced as compared to the use of either alone.
The research conducted for the Case Study I demonstrated that a nominal dose ofchlorine applied to the settled water will generate a manganese dioxide coating on filter mediagrains. The manganese dioxide coating will further enhance Mn removal by adsorbing dissolvedMn and then providing further oxidation and removal. This observation should not be unique tothe type of raw river water at Philadelphia but rather should be applicable to many waters thatuse conventional treatment and chlorinate the water just prior to filtration.
CASE STUDY II
Although not necessarily recommended as a permanent solution for Mn reduction, theuse of GAC in the IOCME mode is feasible (two of the participating utilities use this technique).That is by increasing pH and applying chlorine, the GAC filter will develop a layer of oxidecoated media, and Mn is controlled. An interesting side effect of such use can be the changing ofthe density of the media. This change is more profound for GAC than for anthracite. Over time,
©2006 AwwaRF. All Rights Reserved.
7/21/2019 Occurrence of Manganese in Drinking Water and Manganese Control
http://slidepdf.com/reader/full/occurrence-of-manganese-in-drinking-water-and-manganese-control 181/463
155
through the back washing process, heavier oxide coated media will migrate to the bottom of thefilter. This by itself is not bad unless the utility is using the GAC as an absorbing medium fororganics removal. In this case, the adsorbed organic material can leach back into solution as thespent GAC moves to the end of the contactor. Basically the migration of the GAC disrupts theadsorbance isotherm and shortens the life span of the GAC as an adsorber.
The easy to use, on-site, bench top technique for the analysis of Mn has long beenaccepted as useful and reasonably accurate for process control work. However, at the lowconcentrations of Mn targeted during this study, the method seemed to be problematic having both positive and negative interferences. In two of the three data sets, the bench top analysisunder predicted performance and did not reflect the actual variability of water quality measured.The on-line Mn monitor was not successfully used in this research project.
COST MODEL
The interviews conducted during this research strongly suggest that many consumers, perhaps the majority, will experience episodic difficulties if the Mn concentration in thehousehold water remains at 0.05 mg/L. From the work completed for this study, the investigators believe that a 0.02 mg/L Mn target reasonably balances benefits to the cost of producing water at
a low Mn concentration. Some utilities, such as the Philadelphia Water Department, haveestablished an even lower internal goal of 0.015 mg/L.
The cost to benefit ratios in Appendix G tables and figures suggest that several treatmenttechnologies can cost effectively remove manganese in drinking water, based on the models andassumptions developed for this study. A complicating factor is that many states do not enforcethe secondary standards and rely on consumer pressure to drive utility action. Many utilities aresensitive to public pressure, but still have difficulty justifying treatment costs on the basis ofreducing consumer complaints if it means producing water at a lower standard than the minimumrequired. The intangible costs to both utilities and customers, although difficult to quantify,would strongly suggest that most customers would be willing to pay an additional price for waterif the water were aesthetically acceptable the majority of the time. Today, many people have
become much more sensitive to aesthetic water quality and tend to judge the quality of servicethat a utility is providing on the basis of water palatability. In addition, many consumers todaytend to equate the safety of water with taste, odor, and appearance.
Many systems that have Mn problems are small groundwater utilities that may not havethe financial resources to support new treatment especially if that new treatment is to treat water beyond that required for public health. Even larger systems may not respond to the need foradditional Mn treatment if that additional treatment requires the building of new treatment.Utilities are more likely to accept small increases in operational cost than they are to incur capitaldebt to improve upon parameters that meet existing suggested limits.
Since the Safe Drinking Water Act was signed in 1974, there have been numerousregulations and standards that have been implemented to deal with such issues as disinfection
byproducts, synthetic organics, radionuclides and metals; very nominal attention has been givento the impacts and reasonableness of the secondary standards including Mn. This research hasconcluded that the Mn standard of 0.05 mg/l, as it now exists, is not adequate to controlconsumer complaints associated with household problems. Yet, the cost of treating water to alower level than the SMCL is not justified solely on the basis of cost savings to the consumer ascompared to the capital and operating treatment costs. However, many utilities do operate theirtreatment facilities to produce as low a Mn concentration as affordably possible. There seems to
©2006 AwwaRF. All Rights Reserved.

7/21/2019 Occurrence of Manganese in Drinking Water and Manganese Control
http://slidepdf.com/reader/full/occurrence-of-manganese-in-drinking-water-and-manganese-control 182/463
156
be a general recognition that if water contains Mn at the SMCL, there will be many consumercomplaints and problems.
©2006 AwwaRF. All Rights Reserved.
7/21/2019 Occurrence of Manganese in Drinking Water and Manganese Control
http://slidepdf.com/reader/full/occurrence-of-manganese-in-drinking-water-and-manganese-control 183/463
157
CHAPTER 6
RECOMMENDATIONS TO UTILITIES
OPERATIONAL
Treat Mn at the Source
It is the opinion of the PIs that controlling Mn prior to the distribution system is the bestoption. The distribution system will adsorb Mn over a long period of time and will release itfrom time to time as conditions dictate. However, the frequency and intensity of this release will be less if less Mn enters the distribution system. Once the water enters the distribution systemthere is very little that can be done to control it.
Sequestering agents if used properly can control Mn. However, the use of sequesteringagents is more complex than most people are led to believe. Establishing the correct chemistry isoften difficult because of constantly changing water quality and conditions in the distributionsystem. In many distribution systems, what is just right for near may not be right for far, andwhat is just right for far may not be right for near. Even with the correct chemistry, if Mn enters
the home where laundry is being done with hot water and bleach, the sequestration breaks down.This will release Mn(II) that will then be oxidized to Mn(IV) directly on the material surface,making black spots.
The amount of Mn present and the frequency of its presence in the water are the mainfactors in selecting the best method of control (as well as understanding how Mn control occurs).Oddly enough, the more Mn, and the more constant its presence, the simpler the design and themore effective the operation will be. The oxidation of Mn is a kinetic reaction so the more Mn,the more oxidation will occur. The less advantageous aspect of this is that the treatment costmoney and some utilities are so used to having little to no treatment that even this modest stepseems extremely expensive. Under constant Mn loading, consider using a Mn specific filtermedia – either self-generated induced oxide coated media (IOCM) or proprietary filter media.
The use of KMnO4 to oxidize Mn is effective under these conditions too but it requiresmonitoring as well as good settled solids control.
The selection of treatment options for other scenarios becomes harder as the Mnconcentration decreases and become less frequent. The main driving force is economic. Effecttreatment, built for only occasional use, is inherently expensive. When the capacity of treatmentsystems, sized to handle a specific loads, is exceeded, Mn pass through occurs. For thesesituations the most effect process was the IOCME. This process has a large capacity and isalways active. The prerequisites for this process are: granular filter media, chlorine, and Mn (atleast enough to have an oxide coating on media). The down side of this is the continued relianceon the DBP forming chlorine within the treatment process. Even if a treatment plant converts toozone disinfection the use of IOCME can keep the treated water Mn free.
Distribution systems that experience a seasonal change in delivered water volumes haveadditional Mn issues. During periods of low flow, the Mn loading into the system seems to below enough so as to have no effect on the water quality; however, as the flow rate increases thesystem’s ability to hold a specific amount of Mn decreases. The Mn is then released and thecustomers see it. The problem can be severely exacerbated when the seasonal change in flow isgreat and the low flow period allows for sections of the distribution to have no chlorine. Thesezones become biologically active and the mechanisms of Mn oxidation reduction change. Evenmore Mn is released than predicted by the increase in water velocity alone.
©2006 AwwaRF. All Rights Reserved.
7/21/2019 Occurrence of Manganese in Drinking Water and Manganese Control
http://slidepdf.com/reader/full/occurrence-of-manganese-in-drinking-water-and-manganese-control 184/463
158
Induced Oxide Coated Media Effect
Control of Mn by way of IOCME is so effective that we know little about it. It works sowell over such a wide range of conditions that it calls little attention to itself. If not for the workof Dr. Knocke et. al. much of what little we know would be still be a mystery.
However, when we do approach the limits of the effectiveness of IOCM, we get aglimpse at how complex it is. The effectiveness of IOCM results from the combination of two
mechanisms which are interrelated – oxidation and adsorption. The parameters that control these processes overlap. The pH of the filtered water is the most significant water quality parameterthese two processes share. The higher the pH, the more rapid the oxidation process, and thehigher the pH, the greater the adsorption capacity of the oxide coated media. Another waterquality parameter that affects both processes, but no so obviously, is temperature. The warmerthe water, the more rapid the oxidation process, and the greater the media adsorptive capacitywill be. For temperatures above 10°C, IOCME worked very well. For temperatures below 8°C(free chlorine residual leaving the filter in excess of 0.4 mg/L), the pH had to be greater than 6.5for IOCME to be reliable. IOCME was effective for water temperatures down to 3°C as long asthe pH was raised to 8.0 or above.
A water quality parameter that seems to only be important to oxidation but has an effect
on adsorption is free chlorine. The presence of free chlorine oxidizes the adsorbed Mn andconverts it to MnO2 thus yielding more sites for future adsorption, thereby increasing theadsorptive capacity. Free chlorine is required to be present and available when Mn is adsorbedonto the media surface. However, IOCM can occur even when there is no free chlorine residualleaving the filter. This explains why GAC can be used as a media for IOCM. Although theeffect of each parameter on the separate process is related, it is not proportional. For example,water temperature is much more significant to the oxidation process than the adsorption process.Utilities should expect reduced Mn control across IOCM filters in colder water and to offset thisreduced performance by increasing the pH and/or increasing chlorine.
Ozone
If a utility uses intermediate ozone and has intermittent Mn issues, it should considerapplying more ozone during the high Mn event so that all the Mn is MnO2. The oxidation ofMn(II) to Mn(IV) requires the presence of molecular ozone. In the application of ozone there iseither not enough ozone applied, or it is applied in such a scavenger rich environment thatmolecule ozone is in solution for only a short period of time. One may wish to speciate theozonation process effluent using 30K Dalton filters to see if oxidation is complete. The presenceof colloidal Mn indicates there has been enough oxidant used. The presence of colloidal Mn inthe distribution system was not found to be an issue for the utilities that participated in this study.Once the Mn(IV) is formed, granular filter media seems to be able to retain it in. The presenceof dissolved oxygen above saturation seemed to be enough to keep it stable on the media. Pilot
results indicated that the higher the pH the more stable the filtration process and better Mncapture even without chlorine.The other consideration is to simply keep a filter in the IOCME mode to capture Mn even
if ozone is used. For one utility, the filter that used to be operated in IOCME mode (albeitunknowingly) was the source of distribution system Mn occurrence. The Mn appeared once the plant converted to ozone disinfection and stopped chlorinating the filters. The utility eventuallyreplaced the media as opposed to continued chlorine application.
©2006 AwwaRF. All Rights Reserved.
7/21/2019 Occurrence of Manganese in Drinking Water and Manganese Control
http://slidepdf.com/reader/full/occurrence-of-manganese-in-drinking-water-and-manganese-control 185/463
159
MN EFFLUENT WATER QUALITY GOAL
Water Quality Goal
The authors are not suggesting that the USEPA change the current SMCL. Our findingsindicate that the SMCL was rarely the basis for utility action. The wide range of responses to thefederal SMCL by the individual states further illustrates the variety of opinions about the Mn
SMCL. However, the authors have, after some consideration, come to the conclusion that mostutilities would be well served to adopt a finished water Mn goal of 0.02 mg/L. This level isachievable and measurable. While achieving the goal does not guarantee a worry-free life, itseverely limits the distribution system’s ability to accumulate troublesome levels of Mn.
Friendly Quote
When discussing Mn treatment our Australian friend, who indicated he was quoting theEnglish, said “Do not be greedy.” By this he meant that when one is treating for the removal ofMn, go ahead and plan, build and operate for it. Although Mn removal can be achievedincidentally by a unit process, if the process is not designed and operated for it, then there will be
occasions that Mn control is lost. Also, the operation of a unit process can be severely restrictedif it has multiple functions. Therefore, at times, when a seemingly simple solution to a problemcannot be made because of incidental implications, one may feel the pinch. Worse yet, oneforgets the incidental implications and makes a decision that results in system upset. Thesentiment is valid (a bit harsh) and if used wisely (gently) will enable the utility to best discernhow to handle their Mn issues.
When one builds in more treatment and has more testing, one is spending more money, ismore likely to be successful at treatment, and the community is likely to benefit. The utility isless likely to have customer complaints associated with Mn and therefore reduce costs associatedwith those complaints.
The cost model shows how much less consumers would have to spend for each dollar
spent by the utility. The idea is sort of communal in as much as the centralized entity betters thelife of the community at a cost to itself. It is not so much that reducing the Mn levels pays foritself by reducing the utilities expenses, although there is some benefit. The utility treats thewater to a level that improves the overall water quality for the community even though it doesnot “have to.”
To better understand the Australian mindset the PIs encourage the reader to study thewater quality system in that country. The government has not established itself as the championof the people by mandating water quality standards so much as it has set itself up as the mediator between consumers and utilities, giving the consumer a way of asking for water qualityimprovements to be made and an ability to understand what that will cost them.
MN TESTING
Mn analysis is thought to be simple, and it can be. There are several techniquesavailable. Choosing one is not complicated, but it is important. There are several aspects thatshould be considered before applying a specific technique.
©2006 AwwaRF. All Rights Reserved.
7/21/2019 Occurrence of Manganese in Drinking Water and Manganese Control
http://slidepdf.com/reader/full/occurrence-of-manganese-in-drinking-water-and-manganese-control 186/463
160
MDL or RL
The method detection limit (more importantly the reporting limit) of the analysis being performed for your utility is very important. On several occasions, utilities provided the PIs withMn concentration below detection limits. This may have given some a good feeling or evensatisfied some internal requirement. However, the ND or “<” symbol are hard to use for dataanalysis and therefore have limited use, especially if the reporting limit is high. For example,
<50 µg/L lets the utility know that Mn is below the SMCL but little else. Most analysis canachieve a much better resolution. The PIs recommend you look at Mn at 0.010 mg/L or less.
Wet Chemical Testing
It is acceptable to use wet chemical assays for routine operational work, but always havea series of confirmatory analytical assays. As with any measurement system, it is best to knowthe limits of the method.
Mn Filtering
For this project 0.45µm, 0.22µm, and 30 K Dalton filters were used. It is the PIs opinionthat 0.22µm filters offer the best choice. Although it makes little difference between the filtersfor Mn, with Fe it does, and since Fe and Mn often occur together it was thought best that0.22µm filters be used. The appearance of colloidal Mn is not common and usually associatedwith ozonation, high Mn levels within a system that uses a chelating agent or has lost all chlorineresidual at the end of the system. So unless you have these conditions, there is no need to use the30 K Dalton filter as it requires significant effort. However, to be certain about levels that aretruly dissolved, using the 30K Dalton filter is a good choice.
ADDITIONAL RESEARCH
The PIs would like to know if the presence of saturated dissolved oxygen is chemically
(thermodynamically) capable of keeping MnO2 as a solid on a filter surface once it has beencaptured.
The use of apparent color to discern the concentration of Mn has merit and it may be prudent to look into its use more substantially.
The PIs want to know if the soil chemistry associated with the reduction of MnO2 iscongruent with aqueous chemistry by investigating the intermediate step of Mn(III) in theoxidation–reduction process. It is still a mystery to the PIs as to how a filter is able to captureoxidized Mn yet release dissolved Mn. Is this process biological, chemical, or a combination of both?
CONCEPTUALIZATION OF THE UTILITIES WATER DISTRIBUTION SYSTEM
In the not too distant past and in the minds of many consumers, a distribution system wasnothing more than a clean vessel (in some minds sterile) used to hold and deliver water. It isclean, but not sterile and it has films and sediments. The water industry has known this and hasacted on this knowledge. This is simply one more of those occasions. The distribution system isnot an inert unit process but an interactive one. There are many physical and biochemical processes at work within them.
©2006 AwwaRF. All Rights Reserved.

7/21/2019 Occurrence of Manganese in Drinking Water and Manganese Control
http://slidepdf.com/reader/full/occurrence-of-manganese-in-drinking-water-and-manganese-control 187/463
161
Therefore, the utility should increase its knowledge of how it is working and whathappens as water passes through it. The PIs do not want utilities to become alarmed about theirsystems or even give the impression that systems change radically every hour. For the most part,the changes are subtle and complex. The PIs simply urge utilities to start the process of looking(observing and noting).
As a practical suggestion, use existing DBP sites and sample specifically for Fe and Mn.Use a method that has the level of detection suited for the utility’s purpose. If the utility’slaboratory or contract laboratory cannot measure to a level that is low enough to analyze thedata, do not waste time and money. Once utilities have sampled for a while, integrate theanalysis with the utility’s understanding of the actual water flow.
The PIs are of the opinion that long term studies with repeat analysis are more suited tothis type of research, as opposed to a broad search for many things over a short period of time.
For utilities that have occasional black water complaints, note them, locate them, get flowdata relative to them (i.e., flushing or fire) and analyze the water for Fe and Mn. If this processis followed over a long period of time, a utility may see where Mn builds up.
©2006 AwwaRF. All Rights Reserved.

7/21/2019 Occurrence of Manganese in Drinking Water and Manganese Control
http://slidepdf.com/reader/full/occurrence-of-manganese-in-drinking-water-and-manganese-control 188/463
162
©2006 AwwaRF. All Rights Reserved.
7/21/2019 Occurrence of Manganese in Drinking Water and Manganese Control
http://slidepdf.com/reader/full/occurrence-of-manganese-in-drinking-water-and-manganese-control 189/463
163
REFERENCES
ACGIH. 1998. TLV-Threshold limit values and biological exposure indices for 1996-1997.American Conference of Governmental Industrial Hygienists. Cincinnati, OH.
Agency for Toxic Substances and Disease Registry (ATSDR). 2000. Toxicological profile formanganese (update). Draft for public comment. Atlanta: Agency for Toxic Substancesand Disease Registry.
Aldridge, P., B. Chiswell, M.K. Leigh, K.R. O'Halloran, and M. Pascoe. 1989. Water, Journal of
the Australian Water and Wastewater Association, 15(6): 35-37.Anderson, D.R., D.D. Row, and Gary E. Sindelar. 1973. Iron and Manganese Studies of
Nebraska Water Supplies. Journal AWWA, 65(10):635-641.APHA. 1998. Standard Methods for the Examination of Water and Wastewater. 20th edition.
American Public Health Association, Washington, DC.Aschner, M. 2000. Manganese: Brain Transport and Emerging Research Needs. Environ. Health
Perspectives, 108(Supp 3):429-432.Aschner, M. and J.L. Aschner. 1991. Manganese Neurotoxicity: Cellular Effects and Blood-
Brain Transport. Neurosci. Behav. Rev., 15:33-340.Aschner, M., K.E. Vrana, and W. Zheng. 1999. Manganese Uptake and Distribution in the
Central Nervous System (CNS). NeuroToxicology, 20(2-3):173-180.ASTM. 2002. Standard Test Methods for Manganese in Water. D858–02. Annual Book of ASTM
Standards, Vol. 11.02. West Conshohocken, PA: ASTM.Aziz, H.A., and P.G. Smith. 1992. The Influence of pH and Coarse Media on Manganese
Precipitation from Water. Water Research, 26(6):853-855.Aziz, H.A., and P.G. Smith. 1996. Removal of Manganese from Water Using Crushed Dolomite
Filtration Technique. Water Research, 30(2):489-492.Bailar, John C. Therald Moeller, Jacob Kleinberg, Cyrus O. Guss, Mary E. Castellion, Clyde
Metzl 1978. Chemistry Academic Press New York, New YorkBalikungeri, A., D. Robin, and W. Haerdi. 1985. Manganese in natural waters I. Speciation of
manganese in running waters and sediments. International Journal of EnvironmentalAnalytical Chemistry, 19:227-241.
Ballantyne, L., G. Bache, D. Currie, and A. Smith. 2002. “Waking Up to Manganese”: Dealingwith a Sudden Raw Water Quality Change. Proceedings 2002 AWWA Annual
Conference. New Orleans. AWWA, Denver.Banerjee, D., and Nesbitt, H.W. 1999. Oxidation of aqueous Cr(III) at birnessite surfaces:
Constraints on reaction mechanism. Geochim. Cosmochim. Acta, 63: 1671-1687.Banerjee, D., and Nesbitt, H.W. 2001. XPS study of dissolution of birnessite by humate with
constraints on reaction mechanism . Geochim. Cosmochim. Acta, 65: 1703-1714.Bean, E.L. 1974. Potable water-quality goals. Journal AWWA, 66:221-230.Beklemishev, M.K., T.A. Stoyan, and I.F. Dolmanova. 1997. Sorption-catalytic determination of
manganese directly on a paper-based chelating sorbent. Analyst , 122:1161-1165.
Benefield, L.D., and J.M. Morgan. 1990. Chapter 10, Chemical Precipitation. In: Water Quality
and Treatment . 4th Edition. Edited by F.W. Pontius. New York: McGraw-Hill, Inc.Bernhardt, H. 1967. Aeration of Wahnback Reservoir without Changing the Temperature
Profile. Jour. AWWA, 59(8):943.Borg, H. 1987. Fractionation of Metals in Water, Sediment, and Soil Systems (Edited by L.
Landner). Berlin: Springer-Verlag.Bouwer, E.J. and P.B. Crowe. 1988. Biological Processes in Drinking Water Treatment. Jour.
AWWA, 80(9):82-93.
©2006 AwwaRF. All Rights Reserved.
7/21/2019 Occurrence of Manganese in Drinking Water and Manganese Control
http://slidepdf.com/reader/full/occurrence-of-manganese-in-drinking-water-and-manganese-control 190/463
164
Braester, C., and R. Martinell. 1988. Modelling of Flow and Transport Processes in Vyredox and Nitredox Subsurface Treatment Plant. Water Science and Technology 20(3):165-172.
Bratby, J.R. 1988. Optimizing Manganese Removal and Washwater Recovery at a DirectFiltration Plant in Brazil. Jour. AWWA, 80(12):71-81.
Bratina, B.J., B.S. Stevenson, W. J. Green, T.M. Schmidt, 1998. Manganese reduction bymicrobes from oxic regions of the lake Vanda (Antarctica) water column. Applied
Environmental Microbiology 64(10), 3791 – 3797.Cameron, I. 1996. Biological Iron and Manganese Removal: An Untapped Potential. Water, J.
of the Australian Water and Wastewater Association, 23(3):25-28.Carlson, K.H., W.R. Knocke, and K.R. Gertig. 1994. Modeling Manganese Oxidation with
Potassium Permanganate. In: Proceedings 1994 AWWA Annual Conference, New York .Denver, CO: AWWA.
Carlson, K.H., W.R. Knocke, and K.R. Gertig. 1997. Optimizing treatment through Fe and Mnfractionation. Journal AWWA, 89(4):162-171.
Carpenter, R. 1983. Quantitative electron spin resonance (ESR) determinations of forms andtotal amounts of Mn in aqueous environmental samples. Geochimica et Cosmochimica
Acta, 47:875-885.Casale, R.J., M.W. LeChevallier, and F.W. Pontius. 2002. Manganese Control and Related
Issues. AwwaRF Report No. 90896. Denver, CO: AWWA Research Foundation andAWWA.
[CCMS] Committee on the Challenges of Modern Society. 1987. Drinking Water Microbiology. J. Environ. Pathol. Toxicol. Oncol. 7:1.
CDM .2000. Philadelphia Water Department, Water Treatment Plant Optimization and
Advanced Treatment Pilot Studies, Phase II Report . Philadelphia, Pa.: Camp Dresser &McKee.
Chandra, S.V., and G.S. Shukla. 1981. Concentrations of Striatal Catecholamines in Rats GivenManganese Chloride Through Drinking Water. J. Neurochem., 36(2):683-687.
Chandra, S.V., G.S. Shukla, and R.S. Srivastava. 1981. An Exploratory Study of ManganeseExposure to Welders. Clin. Toxicol., 18:417-423.
Charlton, N., E. Tikos, L. Gaffney, and P. Kohl. 2002. Breakpoint Breakdown: Optimization ofManganese Removal to Very Low Levels with Oxide-Coated Filter Media. Proceedings
2002 AWWA Water Quality Technology Conference. Chia, S.E., S. Foo, S.L. Gan, J. Jeyaratnam, and C.S. Tian. 1993. Neurobehavioural Functions
Among Workers Exposed to Manganese Ore. Scand. J. Work. Environ. Health, 19:264-270.
Chiswell, B. 1998. Speciation of Manganese in Water Storages. Lithology and Mineral
Resources, 33(5):491-495.Chiswell, B., and M.B. Mokhtar. 1986. The Speciation of Manganese in Freshwaters. Talanta,
33(8):669-677.Chiswell, B., and M.B. Mokhtar, 1987. Speciation of Manganese in Fresh Water—I. Use of EPR
Studies. Talanta, 34(3):307-311.Chiswell, B. and M.B. Mokhtar. 1990. Some Effects of Dam Destratification Upon Manganese
Speciation. In: Surface and Colloid Chemistry in Natural Waters and Water Treatment ,Edited by R. Beckett. New York: Plenum Press.
Chiswell, B. and K.R. O’Halloran. 1991. Comparison of Three Colorimetric Methods for theDetermination of Manganese in Freshwaters. Talanta, 38(6):641-647.
Chiswell, B., G. Rauchle, and M. Pascoe. 1990. Spectrophotometric Methods for theDetermination of Manganese. Talanta, 37(2):237-259.
©2006 AwwaRF. All Rights Reserved.
7/21/2019 Occurrence of Manganese in Drinking Water and Manganese Control
http://slidepdf.com/reader/full/occurrence-of-manganese-in-drinking-water-and-manganese-control 191/463
165
Chiswell, B. and M. Zaw. 1991. Lake destratification and speciation of iron and manganese. Environmental Monitoring and Assessment , 19:433-447.
Chiswell, B., D.R. Dixon, G. Hamilton, L.I. Sly, and T.D. White. 1992. Manganese Speciation inSurface Waters. Chemistry in Australia. Aquatic Chemistry Supplement . August 1992. pg 22.
Chu, N.S., F.H. Hochberg, D.B. Caine, and C. W. Olanow. 1995. Neurotoxicology ofManganese. Handbook of Neurotoxicology, Edited by L.W. Chang and R.S. Dyer. HongKong: Marcel Dekker Inc.
Coffey, B.M., D.L. Gallagher, and W.R. Knocke, 1993. Modeling Soluble Manganese Removal by Oxide-Coated Filter Media. Journal of Environmental Engineering, 119(4):679-693.
Collipp, P.J., S.Y. Chen, and S. Maitinsky. 1983. Manganese in infant formulas and learningdisability. Ann. Nutr. Metab., 27(6):488-494.
Colthurst, J.M. and P.C. Singer. 1982. Removing trihalomethane precursors by permanganateoxidation and manganese dioxide adsorption. Jour. AWWA, 74(2):78-83.
Conlon, W.J. 1990. Chapter 11, Membrane Processes. In: Water Quality and Treatment . 4th Edition. Edited by F.W. Pontius. New York: McGraw-Hill, Inc.
Cook, D.G., S. Fahn, and K. Brait. 1974. Chronic Manganese Intoxication. Arch. Neurol.,30:59-64.
Cornwell, D.A., and R.G. Lee. 1993. Impacts of Recycle Stream on Finished Water Quality. In:Proceedings 1993 AWWA Annual Conference, San Antonio, TX . Denver, CO: AWWA.
Costello, J.J. 1984. Postprecipitation in Distribution Systems. Journal AWWA, 76(11):46-49.Couper, J. 1837. On the Effects of Black Oxide of Manganese when Inhaled into the Lungs. Br.
Ann. Med. Pharm., 1:41-42.Crozes, G., P. White, D. Gray, and T.R. Shepherd. 1996. Dealing with the Side Effects of
Implementing Enhanced Coagulation for DBP Control. In: Proceedings 1996 AWWA
Annual Conference, Toronto, Ontario, Canada. Denver, CO: AWWA.Czekalla, C., W. Mevius, and H. Hanert. 1985. Quantitative Removal of Iron and Manganese by
Microorganisms in Rapid Sand Filters (in Situ Investigations). Water Supply, 3:111-123.Davies, S.H.R., and J.J. Morgan. 1989. Manganese(II) oxidation kinetics on metal oxide
surfaces. Journal of Colloid and Interface Science, 129:63-77.Deutsch, F., P. Hoffman, and H.M. Ortner. 1997. Analytical characterization of manganese in
rainwater and snow samples. Fresenius J. Anal. Chem., 357:105-111.Dixon, J.B., D.C. Golden, G. A. Uzochukwu, and C. S. Chen. 1986. Soil Manganese Oxide
Minerals in Soil Colloids, Structures and Associations. In Soil Aggregates. Edited byM.H.B. Hayes and A. Herbillon. NATO workshop. Ghent, Belgium, September 3-7,1984.
Dixon, D.R., L.I. Sly, T.D. Waite, B. Chiswell, and G.E. Batley. 1989. Manganese Removal: AModel of Cooperative Research. Water , February, 32-34.
Dixon, D., N. Anderson, B. Bolto, B. Chiswell, L Sly, T. Hurse, K Craig, G Hamilton, B.Hutchinson, C. West, and R. Woolley. 2006. The Removal of Manganese from Drinking
Waters. Research Report No. 26. Salisbury Australia: CRC for Water Quality andTreatment
Domonkos, L. and C. Varszegi. 1994. New Pilot Plant Studies at the Budapest Waterworks.Ozone Science and Engineering, 16:26-40.
European Union. 1998. COUNCIL DIRECTIVE 98/83/EC of 3 November 1998 on the qualityof water intended for human consumption Official Journal of the European Communities.
©2006 AwwaRF. All Rights Reserved.
7/21/2019 Occurrence of Manganese in Drinking Water and Manganese Control
http://slidepdf.com/reader/full/occurrence-of-manganese-in-drinking-water-and-manganese-control 192/463
166
Ferguson, J.F., and D.N. Given. 1976. Chemical Precipitation in Water Softening and Iron andManganese Removal. Proceedings Eighteenth Annual Public Water Supply Engineers'
Conference--Water Treatment, Part I ; Champaign, IL AWWA: Denver.Ferraz, H.B., P.H.F. Bertolucci, J.S. Pereira, J.C.G. Lima, and L.A.D. Andrade. 1988. Chronic
Exposure to the Fungicide Maneb may Produce Symptoms and Signs of CNS ManganeseIntoxication. Neurol., 38:550-553.
Ficek, K.J. and M.A. Waer. 1993. The Application of Potassium Permanganate for theProduction of Quality Water. Proc. Of the Fifth National Conference on Drinking Water,
Winnipeg, Manitoba. Denver, CO: AWWA. Pg 205-219.Florence, T.M. 1982. The speciation of trace elements in water. Talanta, 29:345-364.Freeland-Graves, J. and C. Llanes. 1994. Models to Study Manganese Deficiency. In:
Manganese in Health and Disease. Edited by D.J. Klimis-Tavantzis. Boca Raton, FL:CRC Press.
Furgason, R.R., and R.O. Day. 1975a. Iron and Manganese Removal with Ozone, Part I. Water
And Sewage Works, 122(6):42,45-47.Furgason, R.R., R.O. Day. 1975b. Iron and Manganese Removal with Ozone, Part II. Water and
Sewage Works, 122(7) 61-63.Gabelich, C.F., C.L. Gerringer, and W. Knocke. 2005. Sequential Manganese desorption-
adsorption anthracite coal and silica sand filters. In Proceedings 2005 AWWA WaterQuality Technology Conference. Denver, Colo.: AWWA
Gehm, H.W., and J. I. Bregman. 1976. Handbook of Water Resources and Pollution Control. New York, N.Y.: Van Nostrand Reinhold Company.
Geney, R.S. 1986. Management Techniques for Surface Raw Water Reservoirs. In:Proceedings 1986 AWWA Water Quality Technology Conference, Portland, Oregon.Denver, CO: AWWA.
Geney, R.S. 1988. Reservoir Management for Water Quality Improvement. In: Proceedings
1988 AWWA Annual Conference, Orlando, FL. Denver, CO: AWWA.Geney, R.S. 1992. A Cost-Effective Approach to Water Treatment. In: Proceedings 1992
AWWA Water Quality Technology Conference, Toronto, Ontario. Denver, CO: AWWA.
Ghiorse, W.C. 1984. Biology of Iron- and Manganese-Depositing Bacteria. Ann. Rev. Microbiology, 38:515-550.
Gounot, A.M., Di Ruggiero, J. Haroux, C. 1988. Bacterial Manganese Transformations inGroundwaters. In: Current Perspectives in Environmental Biogeochemistry. Edited byG. Giovannozzi-Sermanni and P. Nannipieri. Rome, Italy: CNR-IPRA Publ.
Greger, J.L. 1999. Nutrition versus Toxicology of Manganese in Humans: Evaluation ofPotential Biomarkers. NeuroToxicology, 20(2-3):205-212.
Gregory, D., and K.H. Carlson. 2001. Ozonation of Dissolved Manganese in the Presence of Natural Organic Matter. Ozone: Science and Engineering, 23:149-159.
Gregory, D. and K. Carlson. 2003. Effect of soluble Mn concentration on oxidation kinetics Journal AWWA. 95(1): 98-108.
Griffin, A.E. 1960. Significance and removal of manganese in water supplies. Journal AWWA,52:13261334.
Gupta, S.K., R.C. Murphy, and S.V. Chandra. 1980. Neuromelanin in Manganese-ExposedPrimates. Toxicol. Letters, 6:17-20.
Hagopian, J.V. 1975. Manganese in Drinking Water in Rhode Island. Journal of the New
England Water Works Association, 89(2):101-104.Hammer, M.J. 1975. Water and Wastewater Technology, New York: John Wiley and Sons, Inc.
©2006 AwwaRF. All Rights Reserved.
7/21/2019 Occurrence of Manganese in Drinking Water and Manganese Control
http://slidepdf.com/reader/full/occurrence-of-manganese-in-drinking-water-and-manganese-control 193/463
167
Hao, O. J., A. P. Davis, and P.H. Chang. 1991. Kinetics of Manganese(II) Oxidation WithChlorine. Journal of Environmental Engineering. 117:3:359-374.
Hargette, A.C., and W.R. Knocke. 2001. Assessment of Fate of Manganese in Oxide-CoatedFiltration Systems. Journal of Environmental Engineering, 127(12):1132-1138.
Hatva, T., H. Seppänen, A. Vuorinen, and L. Carlson. 1985. Removal of Iron and Manganesefrom Groundwater by Reinfiltration and Slow Sand Filtration. Aqua Fenn., 15:211.
Health Canada. 1996. Guidelines for Canadian Drinking Water Quality. Sixth Edition. Ministerof Health, Ottawa.
Hickman, C., L. van der Tak, T.A., Bongiorni Ajello, P. Sacco, Sr., and L. Ashmore. 2001. LakeMonitoring for Evaluation of In-Lake Aeration Control Options of Iron, Manganese, andTaste and Odor Control. Proceedings 2001 AWWA Annual Conference.
Hietanen, E., J. Kilpio, and H. Savolainen. 1981. Neurochemical and BiotransformationalEnzyme Responses to Manganese Exposure in Rats. Arch. Environ. Contam. Toxicol.,10(3):339-345.
Hoehn, R.C., J.T. Novak, and W.E. Cumbie. 1987. Effects of Storage and Preoxidation onSludge and Water Quality. Jour. AWWA, 79(6):67.
Hoigne, J., and H. Bader. 1977. Ozonation of Water: Selectivity and Rate of Oxidation ofSolutes. In: Proceedings 3
rd International Ozone Association, Paris, France.
Holbrook, D.J., Jr., M.E. Washington, H.B. Leake, and P.E. Brubaker. 1975. Studies on theEvaluation of the Toxicity of Various Salts of Lead, Manganese, Platinum, andPalladium. Environ. Health Perspect. 10:95-101.
Huang, C.C., C.S. Lu, N.S. Chu, F. Hochberg, D. Lilienfeld, W. Olanow, and D.B. Calne. 1993.Progression After Chronic Manganese Exposure. Neurol., 43:1479-1483.
Huang, C.C., N.S. Chu, C.S. Lu, R.S. Chen, and D.B. Calne. 1998. Long-Term Progression inChronic Manganism: Ten Years of Follow-Up. Neurol., 50:698-700.
Hudnell, K., and D. Mergler. 1999. Manganese: Essential Element and Neurotoxin. In:Occupational Medicine Secrets. Edited by R. Bowler, K. Cone. Philadelphia: Hanley &Belfus, Inc.
Humphrey, S.B., and M.A. Eikleberry. 1962. Taste and Odor Control Using KMnO4. Water &
Sewage Works, 109:142.[IAC] Idaho Administrative Code. 2005. IDAPA 58.01.11 Rules of the Department of
Environmental Quality, IDAPA 58.01.11 “Ground Water Quality Rule”http://adm.idaho.gov/adminrules/rules/idapa58/0111.pdf
Ibrahim, E.A., E.A. Crossland, and K.L. Dixon. 1997. Optimizing Drinking Water Treatment forConflicting Objectives. In: Proceedings AWWA Water Quality Technology Conference,1997. Denver, Colo.: AWWA.
Iregren, A. 1990. Psychological Test Performance in Foundry Workers Exposed to Low Levelsof Manganese. Neurotoxicol. Teratol., 12:673-675.
Jenkins, S.R. 1974. The Effectiveness of Sand Filters for the Removal of Colloidal ManganeseOxides from Water Using Selected Cations as Filter Aids. National Technical
Information Service. No. OWRR B-011-WYO(1)Jung R., J.O. Sanders, and H.H. Lai. 1999. Improving Raw Water Quality Through Lake
Oxygenation at Camanche Reservoir. Presented at North American Lake ManagementSociety Annual Symposium, Reno, Nev. December 1, 1999.
Jung R., H.H. Lai, and A. Wilczak.2003. Hypolimnetic Oxygenation Operating Experience in aEutrophic Reservoir and its Effect on Water Treatment (Abstract). Poster at AWWAWater Quality Technical Conference, Philadelphia, Penn., November 2-6, 2003.
©2006 AwwaRF. All Rights Reserved.
7/21/2019 Occurrence of Manganese in Drinking Water and Manganese Control
http://slidepdf.com/reader/full/occurrence-of-manganese-in-drinking-water-and-manganese-control 194/463
168
Jung, R. 2004. Oxygenating Upper San Leandro Reservoir’s Hypolimnion: 2002-2004. East BayMunicipal Utility District internal presentation.
Kalavska, D. 1991. Determination of Mn(II) in tap water. International Journal of
Environmental Analytical Chemistry, 45:159-167.Kawamura, S. 1991. Integrated Design of Water Treatment Facilities. New York: John Wiley
and Sons, Inc.Kawamura, S. 2000. Integrated Design of Water Treatment Facilities. 2nd ed. New York: John
Wiley and Sons, Inc.Kim, A.J., P. Kohl, N. Spivey, C Schulz, and D. Franz. 2001. Practical Application of the Latest
Cryptosporidium Inactivation Research to the Design of Ozone Facilities. In 2001
Annual Conference Proceedings of the American Water Works Association. DenverColo.: AWWA.
Knocke, W.R., R.C. Hoehn, and R.L. Sinsabaugh. 1987. Using Alternative Oxidants to RemoveDissolved Manganese for Waters Laden with Organics. Jour. AWWA, 79(3):75-79.
Knocke, W.R., J.R. Hamon, and C.P. Thompson. 1988. Soluble Manganese Removal on Oxide-Coated Filter Media. Jour. AWWA, 80(12):65-70.
Knocke, W.R., S. Occiano, and R. Hungate. 1990. Removal of Soluble Manganese from Water
by Oxide-Coated Filter Media. Denver, CO: AWWA Research Foundation.
Knocke, W.R., J.E. Van Benschoten, M. Kearney, A. Soborski, and D.A. Reckhow. 1990. Alternative Oxidants for the Removal of Soluble Iron and Manganese. Denver, CO.:AWWA Research Foundation.
Kolthoff, I.M., and R. Belcher. 1957. Volumetric Analysis, New York: Interscience Publishers,Inc.
Kohl, P., A. Kim, and N. Charlton. 2002. Limitations of Ozone for Removal of Manganese toVery Low Levels, A Comparative Study. Proceedings 2002 AWWA Water Quality
Technology Conference.Komura, J. and M. Sakamoto. 1991. Short-Term Oral Administration of Several Manganese
Compounds in Mice: Physiological and Behavioral Alterations Caused by DifferentForms of Manganese. Bull. Environ. Contam. Toxicol., 46:921-928.
Kondakis, X.G., M. Makris, M. Leotsinidis, M. Prinou, and T. Papapetropoulos. 1989. Possiblehealth effects of high manganese concentration in drinking water. Arch. Environ. Health,44(3):175-8.
Kostial, K., D. Kello, S. Jugo, I. Rabar, and T. Maljkovic. 1978. Influence of Age on MetalMetabolism and Toxicity. Environmental Health Perspectives, 25:81-86.
Kothari, N. 1988. Groundwater, Iron and Manganese: An Unwelcome Trio. Water/Engineering
& Management , 135(2):25-26.Krom, M.D. 1978. On the Association of Iron and Manganese with Organic Matter in Anoxic
Marine Pore Waters. Geochimica et Cosmochimica Acta, 42:607.Kumar, A. 1985. Chemical speciation of manganese in fresh water, sea water and their mixtures.
Indian Journal of Chemistry, 24A:8-11.
Lai, J.C.K., T.K.C. Leung, and L. Lim. 1981. Brain Regional Distribution of Glutamic AcidDecarboxylase, Choline Acetyltransferase, and Acetylcholinesterase in the Rat: Effects ofChronic Manganese Chloride Administration after Two Years. J. Neurochem.,36(4):1443-1448.
Lai, J.C.K., T.K.C. Leung, J.F. Guest, A.N. Davison, and L. Lim. 1982. The Effects of ChronicManganese Chloride Treatment Expressed as Age-Dependent, Transient Changes in RatBrain Synaptosomal Uptake of Amines. Journal of Neurochemistry, 38(3):844-847.
©2006 AwwaRF. All Rights Reserved.
7/21/2019 Occurrence of Manganese in Drinking Water and Manganese Control
http://slidepdf.com/reader/full/occurrence-of-manganese-in-drinking-water-and-manganese-control 195/463
169
Larson, A.L. 1995. Biological Water Treatment Provides Economical Solution in Washington.Proceedings 1995 AWWA Annual Conference, Anaheim, California. Denver: AWWA.
Lauf, G.F. 1995. Modeling of Manganese Oxidation and Removal From Low Hardness Waters.Carus Chemical Company, LaSalle, IL, 61301.
Laxen, D.P.H., W. Davison, and C. Woof. 1984. Manganese chemistry in rivers and streams.Geochimica et Cosmochimica Acta, 48:2107-2111.
Lefebvre, E., and A. Deguin. 1997. Compromise between Bromate Ion Formation and PesticidesDegradation and/or Manganese Removal. Ozone: Science & Engineering. 19(1):39-53.
Legube, B., J.P. Croue, J. DeLaat, and M. Dore. 1989. Ozonation of an Extracted Aquatic FulvicAcid: Theoretical and Practical Aspects. Ozone: Science and Engineering, 11:69-92.
Leung, T.K.C., J.C.K. Lai, and L. Lim. 1981. The Regional Distribution of Monoamine OxidaseActivities Towards Different Substrates: Effects in Rat Brain of Chronic Administrationof Manganese Chloride and of Aging. Journal of Neurochemistry, 36(6):2037-2043.
Leung, T.K.C., J.C.K. Lai, M. Tricklebank, A.N. Davison, and L. Lim. 1982. ChronicManganese Treatment of Rats Alters Synaptosomal Transport of Dopamine and theBehavioral Response to Amphetamine Administration. Journal of Neurochemistry,39:1496-1499.
Long, B.W., R.A. Hulsey, and R.C. Hoehn. 1999. Complementary Uses of Chlorine Dioxide
and Ozone for Drinking Water Treatment. Ozone: Science and Engineering. 21:465-476.Lucchini, R., L. Selis, D. Folli, P. Apostoli, A. Mutti, O. Vanoni, L. Iregren, and L. Alessio.
1995. Neurobehavioral Effects of Manganese in Workers from a Ferroalloy Plant afterTemporary Cessation of Exposure. Scand. J. Work. Environ. Health, 21:143-149.
Lucchini, R., E. Bergamaschi, A. Smargiassi, D. Festa, and P. Aportoli. 1997. Motor Function,Olfactory Threshold and Hematological indices in Manganese Exposed FerroalloyWorkers. Environ. Res., 73:175-180.
Lucchini, R., P. Apostoli, C. Perrone, D. Placidi, P. Migliorati, D. Mergler, M.-P. Sassin, S.Palmi, and L. Alessio. 1999. Long Term Exposure to Low Levels of Manganese Oxidesand Neurofunctional Changes in Ferroalloy Workers. NeuroToxicology, 20(2-3):287-298.
Mann, M.A., D. Thomson, E. Jabari, and D. Rohe. 2002. Microfiltration and Ultrafiltration: Novel Pre-Treatments for Iron and Manganese Removal from a Reverse OsmosisFeedwater. Water Quality Technology Conference, Seattle, WA.
AWWA. Denver, CO.Marczenko, Z. 1986. Separation and Spectrophotometric Determination of Elements. Horwood,
Chichester.Marsden, C.D., and P.G. Jenner. 1987. The Significance of 1-methyl-4-phenyl-1,2,3,6-
tetrahydropyridine. In: Selective Neuronal Death. Ciba Foundation Symposium 126. Chichester: Wiley.
McGhee, T.J. 1991. Water Supply and Sewerage. New York: McGraw-Hill, Inc.McKnight, K.F., M. Carlson, P. Fortin, and C. Ziesmer. 1993. Comparison of Ozone Efficiency
for Manganese Oxidation Between Raw and Settled Water. Ozone: Science and
Engineering, 15(4):331-341.McMillan, D.E. 1999. A brief History of the Neurobehavioral Toxicity of Manganese: Some
Unanswered questions. NeuroToxicology, 20(2-3):499-508.Meco, G., V. Bonifati, N. Vanacor, and E. Fabrizio. 1994. Parkinsonism after Chronic
Exposure to the Fungicide Maneb. Scand. J. Work Environ. Health, 20:301-305.Mergler, D. 1999. Neurotoxic Effects of Low Level Exposure to Manganese in Human
Populations. Environmental Research, Sec. A. 80:99-102.
©2006 AwwaRF. All Rights Reserved.
7/21/2019 Occurrence of Manganese in Drinking Water and Manganese Control
http://slidepdf.com/reader/full/occurrence-of-manganese-in-drinking-water-and-manganese-control 196/463
170
Mergler, D., G. Huel, R. Bowler, A. Iregren, S. Belanger, M. Baldwin, R. Tardiff, A. Smargiassi,and L. Martin. 1994. Nervous System Dysfunction among Workers with Long-TermExposure to Manganese. Environ. Res., 64:151-180.
Merkle, P.B., W. Knocke, D. Gallagher, J. Junta-Rosso, and T. Solberg. 1996. CharacterizingFilter Media Mineral Coatings. Jour. AWWA. 88(12):62-73.
Merkle, P.B., W.R. Knocke, D.L. Gallagher, and J.C. Little. 1997. Dynamic Model for SolubleMn
2+ Removal by Oxide-Coated Filter Media. Journal of Environmental Engineering,
123(7):650-658.Moore, J.W. 1977. Iron and Manganese Removal by Direct Filtration. M.S. Thesis, Virginia
Polytechnic Institute and State University, Blacksburg.Morgan, J.J. 1967. Chemical equilibria and kinetic properties of manganese in natural waters. In
Principles and Application of Water Chemistry. Edited by S. Faust and J. Hunter. JohnWiley & Sons.
Morgan, J.J., and W. Stumm. 1964. Oxygenation of Aqueous Manganese(II). Jour. Coll. Sci.,19:347.
Mouchet, P. 1992. From Conventional to Biological Removal of Iron and Manganese in France. Jour. AWWA, 84(4):158-167.
Mulder, E.G., and W.L. van Veen. 1983. Investigations of the Sphaerotilus-Leptothrix Group.
Antonie van Leeuwehoek . 29:121.[NAC] Nevada Administrative Code. 2000. Water Quality Standards; 445A.455 Secondary
standards: General requirements; public noticehttp://www.leg.state.nv.us/nac/NAC-445A.html#NAC445ASec455
NAS. 1973. National Academy of Sciences-National Research Council. Division of MedicalSciences. Medical and Biologic Effects of Environmental Pollutants: Manganese.Washington, D.C.: National Academy Press.
NAS. 2004. National Academy of Sciences - Food and Nutrition Board – Institute of Medicine.Dietary Reference Intakes (DRIs): Recommended Intakes for Individuals, Vitaminshttp://www.iom.edu/Object.File/Master/21/372/0.pdf
Nealson, K.H. and C.R. Myers. 1992. Microbial reduction of manganese and iron: New
approaches to carbon cycling. Applied and Environmental Microbiology, 58: 439–443 Nelson, K., J. Golnick, T. Korn, and C. Angle. 1993. Manganese Encephalopathy: Utility of
Early Magnetic Resonance Imaging. British Journal of Internal Medicine, 50:510-513. Netzer, A., and A. Bowers. 1975. Removal of Trace Metals from Wastewater by Lime and
Ozonation. In: Proceedings First Intl. Symp. On Ozone for Water and Wastewater
Treatment . Edited by R.G. Rice and M.E. Browning. Norwalk, CT: Intl. Ozone Assoc.[NH DES] New Hampshire Department of Environmental Services. 2000. Environmental Fact
Sheet WD-WSEB-3-7: Removal of Iron and Manganese from Drinking Water -Technical Version.http://www.des.state.nh.us/factsheets/ws/inc/3-7.html
[NHMRC/AWRC]. 1980. Desirable Quality for Drinking Water in Australia. National Health
and Medical Research Council and the Australian Water Resources Council, AustralianGovernment Publishing Service (AGPS), Canberra.
[NHMRC/AWRC] Australian Government: National Health and Medical Research Council / Natural Resource Management Ministerial Council. 2004. National Water QualityManagement Strategy, Australian Drinking Water Guidelines 6.http://www.nhmrc.gov.au/publications/_files/awgfull.pdf
Nieminski, E., and D. Evans. 1995. Pilot Testing of Trace Metals Removal with Ozone atSnowbird Ski Resort. Ozone: Science and Engineering, 17:297-309.
©2006 AwwaRF. All Rights Reserved.
7/21/2019 Occurrence of Manganese in Drinking Water and Manganese Control
http://slidepdf.com/reader/full/occurrence-of-manganese-in-drinking-water-and-manganese-control 197/463
171
NIOSH. 1984a. Total manganese-method 7200. In: NIOSH manual of analytical methods. 3rded. Vol.1. Cincinnati, OH: National Institute for Occupational Safety and Health, DHHS(NIOSH) Publication No. 84-100.
NIOSH. 1984b. Total manganese-method 7300. In: NIOSH manual of analytical methods. 3rded. Vol. 1. Cincinnati, OH: National Institute for Occupational Safety and Health, DHHS(NIOSH) Publication No. 84-100.
NIOSH. 2002. NIOSH Pocket Guide to Chemical Hazards and Other Databases. NIOSHPublication No. 2002-140 (June 2002).
[NJ DEP] State of New Jersey Department of Environmental Protection, Bureau of SafeDrinking Water. 2004. Safe Drinking Water Act Regulations (N.J.A.C. 7:10) [36 N.J.R.5383]http://www.state.nj.us/dep/watersupply/sdwarule.pdf
[NMAC] New Mexico Administrative Code. 1990. State of New Mexico Standards for Intrastateand Interstate Streams. 20.6.4. Environmental Protection, Water Quality, Ground andSurface Water Protection. New Mexico Water Quality Commission.http://www.nmenv.state.nm.us/NMED_Regs/gwb/20_6_2_NMAC.pdf
Nowell, L.H., and J. Hoigne. 1987. Interaction of Iron (II) and other Transition Metals withAqueous Ozone. In: Proceedings from 8
th Ozone World Congress, International Ozone
Association, Norwalk, CT . E80-E95. NRC. 2001. National Research Council. Dietary Reference Intakes for Vitamin A, Vitamin K,
Arsenic, Boron, Chromium, Copper, Iodine, Iron, Manganese, Molybdenum, Nickel,
Silicon, Vanadium, and Zinc. Washington, D.C.: National Academy Press. NTP. 1993. Studies of Manganese (II) Sulfate Monohydrate in F344/N Rats and B6C3F Mice
(Feed Studies). Manganese(II) Sulfate Monohydrate. TR-428. Research Triangle Park, NC: National Toxicology Program.
[NYSDEC] New York State Department of Environmental Conservation. 1999. NYCRR Part703, Surface Water and Groundwater Quality Standards and Groundwater EffluentLimitations. §703.5 Water quality standards for taste-, color- and odor-producing, toxicand other deleterious substances. (Environmental Conservation Law, §§ 3-0301[2][m],
15-0313, 17-0301, 17-0809).http://www.dec.state.ny.us/website/regs/part703.html#top
O’Brien, W.J., E. Lee, S. Freeman, H. Shorney, B. Long, and D. Elder. 1996. ManganeseOxidation and Removal by Ozone and Polymer-Assisted Filtration. Proceedings 1996
AWWA Water Quality Technology Conference. Boston, MA. AWWA: Denver.O’Connor, J.T. 1971. Iron and Manganese. In: Water Quality and Treatment , A Handbook of
Public Water Supplies. 3rd Edition. New York: McGraw-Hill Book Co.Odell, L.H., and R. Cyr. 1998. Rethinking Iron and Manganese Removal. In: Proceedings
AWWA Water Quality Technology Conference, 1998. Denver, CO: AWWA.OSHA. 1998. Occupational Safety and Health Administration. Code of Federal Regulations 29
CFR 1910.1000. Table Z-1. Limits for air contaminants.
Paillard, H., B. Legube, M.M. Bourbigot, and E. Lefebvre. 1989. Iron and Manganese Removalwith Ozonation in the Presence of Humic Substances. Ozone Science and Engineering,11:93-114.
Percival, S.L., J.T. Walker, and P.R. Hunter. 2000. Biofilms and Drinking Water . Boca Raton,Fla.: CRC Press.
Pihl, R.O. and M. Parkes 1977. Hair element content in learning disabled children. Science,198:204-206.
©2006 AwwaRF. All Rights Reserved.
7/21/2019 Occurrence of Manganese in Drinking Water and Manganese Control
http://slidepdf.com/reader/full/occurrence-of-manganese-in-drinking-water-and-manganese-control 198/463
172
Pontius, F.W. 2004. Drinking water contaminant regulation—Where are we heading? Jour.
AWWA, 96(3):56-69 (Mar. 2004).Posselt, H.S., A.H. Reidies, and W.J. Weber. 1968. Coagulation of Colloidal Hydrous
Manganese Dioxide. Jour. AWWA, 60(1):48-68.Posselt, H.S., F.J. Anderson, and W.J. Weber. 1968. Cation Sorption on Colloidal Hydrous
Manganese Dioxide. Environmental Science and Technology, 2:1097.Post, J.E. 1999. Manganese oxide minerals: crystal structures and economic and environmental
significance. Proceedings Nat. Acad. Sci. USA 96:3447-3454Raveendran, R., B. Ashworth, B. Chatelier. 2001. Manganese Removal in Drinking Water
Systems. 64th
Annual Victorian Water Industry Engineers and Operators’ Conference.Bendigo, Vic. Australia, September 5-6, 2001.
Reckhow, D.A., W.R. Knocke, M.J.Kearney, and C.A. Parks. 1991. Oxidation of Iron andManganese by Ozone. Ozone Science and Engineering, 13(6):675.
Richards, R.P., and S.N. Foellmi. 1985. Utility Battles Iron and Manganese. Public Works,116(6):91-95.
Rittmann, B.E., and V.L. Snoeyink. 1984. Achieving Biologically Stable Drinking Water. Jour.
AWWA, 76(10):106-114.Robinson, L.R., E.D. Breland, and R.A. Dixon. 1967. Factors Affecting the Removal of Iron and
Manganese from Groundwater. Water Resources Research Institute. Mississippi StateUniversity, State College, Mississippi.
Rodier, J. 1955. Manganese Poisoning in Moroccan Miners. Brit. J. Ind. Med., 12:21-35.Roels, H.A., M.I. Ortega Eslava, E. Ceulemans, A. Robert, and D. Lison. 1999. Prospective
Study on the Reversibility of Neurobehavioral Effects in Workers Exposed to ManganeseDioxide. NeuroToxicology, 20(2-3)255-271.
Roscoe, J. 2002. Simple Solutions to Manganese Problems. 65th Annual Water Industry
Engineers and Operators’ Conference. Kardinia Heights Centre, Geelong. 4 and 5September 2002.
Sawyer, C.N., and P.L. McCarty. 1978. Chemistry for Environmental Engineering. New York, N.Y.: McGraw-Hill Book Company.
Schneider, C., P. Johns, and R.P. Huehmer. 2001. Microfiltration for Removal of Manganesefrom Surface Water. Proc. AWWA 2001 Annual Conference.
Schuler, P., H. Oyanguren, V. Maturana, A. Valensuela, E. Cruz, V. Plaza, E. Schmidt, and R.Haddad. 1957. Manganese Poisoning: Environmental and Medical Study at a ChileanMine. Int. Med. Surg. Pgs. 167-173.
Schulz, R.S., T. Crowley, C.H. Yu, K.P. Murphy. 1999. Biological Manganese Removal for a 26mgd Water Treatment Plant. Proceedings 1999 Water Quality Technology Conference.
Tampa, FL. AWWA: DenverSchweisfurth, R. 1972. Magaoxydierende Microorganismen in Trinkwasser-versorgugsanlagen.
GWF-Wasser/Abwasser. 113(12):562.Seby, F., M. Potin-Gautier, A. Chastetbon, and M. Astruc. 1995. Study of Ozone-Manganese
Reaction and the Interactions of Disulfonate Indigo Carmin/Oxidized Manganese Formsas a Function of pH. Ozone: Science and Engineering, 17:135-147.
Shigan, S. A., and B.R. Vitvitskaia. 1971. Experimental Proof of Permissible ResidualConcentrations of Potassium Permanganate in Drinking Water. Gig. Sanit ., 36(9):15-18.
Shorney, H.L, E. Lee, D. Smith, W.R. Knocke, and B.W. Long. 1998. Enhanced ManganeseRemoval in a Biologically Active Filter. Proceedings 1998 Water Quality Technology
Conference. San Diego, CA . AWWA: Denver.
©2006 AwwaRF. All Rights Reserved.
7/21/2019 Occurrence of Manganese in Drinking Water and Manganese Control
http://slidepdf.com/reader/full/occurrence-of-manganese-in-drinking-water-and-manganese-control 199/463
173
Shukla, G.S., S. Sigh, and S.V. Chandra. 1978. The Interaction Between Manganese andEthanol in Rats. Acta Pharmacol. Toxicol. (Copenh)., 43(5):354-362.
Sigel, A., and H. Sigel. 2000. Manganese and its Role in Biological Processes. In Metals Ions in
Biological Systems, vol. 37. New York: Marcel Dekker.Sly, L.I., and V. Arunpairojana. 1987. Isolation of manganese-oxidizing Pedomicrobium cultures
from water by micromanipulation. Journal Microbiol. Methods, 6:177-182.Sly, L.I., M.C. Hodgkinson, and V. Arunpairojana. 1988a. Effect of water velocity on the early
development of manganese depositing biofilm in a drinking-water distribution system.FEMS Microbiol. Ecol. 53:175-186.
Sly, L.I., V. Arunpairojana, and M.C. Hodgkinson. 1988b. Pedomicrobium manganicum fromdrinking water distribution systems with manganese-related “dirty water” problems.Systematic and Applied Microbiology, 11:75-84.
Sly, L.I., M.C. Hodgkinson, and V. Arunpairojana. 1989. The Importance of High AestheticQuality Potable Water in Tourist and Recreational Areas. Water Science and
Technology, 21(2):183-187.Sly, L.I., M.C. Hodgkinson, and V. Arunpairojana. 1990. Deposition of manganese in a drinking
water distribution system. Applied and Environmental Microbiology, 56:628-639.Smith, J.F.. 1993. Iron Removal using Biological Filtration. Master’s Thesis. Drexel University.
Philadelphia, Pa.Smyth, H.F., Jr., C.P. Carpenter, C.S. Weil, U.C. Pozzani, J.A. Striegel, and J.S. Nycum. 1969.
Range-finding Toxicity Data: List VII. Am. Ind. Hyg. Assoc. J., 30(5):470-476.Smyth, L.T., R.C. Ruhf, N.E. Whitman, and T. Dugan. 1973. Clinical Manganism and Exposure
to Manganese in the production and Processing of Ferromanganese Alloy. J. Occ. Med.,15:101-109.
Sokolova-Dubinina, G.A. 1979. Mechanism of the Oxidation of Divalent Iron and Manganese byIron Bacteria Growing at Neutral pH of the Medium. Microbiology, 47:471.
Sommerfeld, E.O. 1996. Manganese Removal: Why So Many Failures? Proceedings of the 48 th
Annual Conference of the Western Canada Water and Wastewater Association, Regina,Saskatchewan.
Sommerfeld, E.O. 1999. Iron and Manganese Removal Handbook. Denver, CO: AWWA.Spicher, R.G., and R.T. Skrinde. 1963. Potassium Permanganate Oxidation of Organic
Contaminants in Water Supplies. Jour. AWWA, 55:1174-1194.Staehelin, J., and J. Hoigne. 1983. Mechanism and Kinetics of Decomposition of Ozone in
Water in the Presence of Organic Solutes. Vom Wasser , 61:337.Stiles, J.F. 1978. Survey of the Iron and Manganese Problems in the USA. In Proceedings 1978
AWWA Annual Conference, Atlantic City, N.J . Denver Colo.: AWWA.Stoebner, R.A., and D.A. Rollag. 1981. Ozonation of a Municipal Groundwater Supply to
Reduce Iron, Manganese, and Trihalomethane Formation. In: Proceedings 1981 AWWA
Annual Conference, St. Louis, MO. Denver: AWWA.Stone, A.T. 1987. Microbial Metabolites and the Reductive Dissolution of Manganese Oxides:
Oxalate and Pyruvate. Geochimica et Cosmochimica Acta 51:919-925.Stumm, W., and G.F. Lee. 1961. Oxygenation of Ferrous Iron. Idus. Eng. Chem., 53:143.Stumm, W. 1995. The Inner-Sphere Surface Complex: A Key to Understanding Surface
Reactivity. In Aquatic Chemistry: Interfacial and Interspecies Processes (American
Chemical Society Advances in Chemistry Series No. 244). Edited by C. P. Huang, C. R.O’Melia, and J. J. Morgan. Washington, D.C.: American Chemical Society.
Tanaka, S. and J. Lieben. 1969. Manganese Poisoning and Exposure in Pennsylvania. Arch.
Environ. Health. 19:674-684.
©2006 AwwaRF. All Rights Reserved.
7/21/2019 Occurrence of Manganese in Drinking Water and Manganese Control
http://slidepdf.com/reader/full/occurrence-of-manganese-in-drinking-water-and-manganese-control 200/463
174
Thermo Electron Corporation. 2003. Orion Platinum Redox Electrode Instruction Manual,
Ag/AgCl Orion 96-78, 97-78, Revision D. Beverly, Mass.: Thermo Electron Corporation.Tinggi, U., C. Reilly, and C. Patterson. 1997. Determination of manganese and chromium in
food by atomic absorption spectrometry after wet digestion. Food Chem. 60:123-128.Trace Inorganic Substances Committee. 1987. Committee Report: Research Needs for the
Treatment of Iron and Manganese. Jour. AWWA, 79(9):119-122. Troester, J.W. 1998. Ground-Water Chemistry in the Valle De Yabucoa Alluvial Aquifer,
Southeastern Puerto Rico. American Water Resources Association Third InternationalSymposium on Tropical Hydrology, San Juan, Puerto Rico, July 12-16, 1998.
Turner, D.R., Whitfield, and A.G. Dickson. 1981. The equilibrium speciation of dissolvedcomponents in freshwater and seawater at 25°C and 1 atm pressure. Geochimica et
Cosmochimica Acta, 45:855-881.Tuschewitzki, G.J., and W. Dott. 1983. Rasterelektronenmikroskopische (REM) Untersuchung
von Manganablagerungen auf Filtermaterialen der Trinkwasseraufbereitung. A. Wasser-
Abwasser Forsch. 16(4):121.Twort, A.C. 1963. A Textbook of Water Supply. New York: American Elsevier Publishing
Company, Inc.Tyler, P.A., and K.C. Marshall. 1967. Hyphomicrobia—A Significant Factor in Manganese
Problems. Jour. AWWA, 59:1043-1048.USEPA. 1975. Scientific and Technical Assessment Report on Manganese. EPA 600/6-75-002.
National Environmental Research Center, Research Triangle Park, N.C.USEPA. 1977a. National Secondary Drinking Water Regulations. Proposed Regulations. Fed.
Reg., 42(62):17143-17147.USEPA. 1977b. Drinking Water and Health. Recommendations of the National Academy of
Sciences. Fed. Reg., 42(132):35764-35779.USEPA. 1979. National Secondary Drinking Water Regulations; Final Rule. Fed. Reg.,
44(140):42195-42202 (July 19, 1979).USEPA. 1982. Inductively coupled plasma-atomic emission spectrometric method for trace
element analysis of water and wastes—method 200.7. Cincinnati, OH: U.S.
Environmental Protection Agency, Office of Research and Development. USEPA. 1983a. Manganese: Atomic-absorption, direct aspiration—method 243.1. In: Methods
for chemical analysis of water and wastes. Cincinnati, OH: U.S. EnvironmentalProtection Agency, Office of Research and Development. EPA-600/4-79-020.
USEPA. 1983b. Manganese: Atomic absorption, furnace technique—method 243.2. In: Methodsfor chemical analysis of water and wastes. Cincinnati, OH: U.S. EnvironmentalProtection Agency, Office of Research and Development. EPA-600/4-79-020.
USEPA. 1986a. Acid digestion of sediments, sludges, and soils—method 3050. In: Test methodsfor evaluating solid waste. 3rd ed. SW-846. Washington, DC: U. S. EnvironmentalProtection Agency, Office of Solid Waste and Emergency Response.
USEPA. 1986b. Inductively coupled plasma atomic emission spectroscopy—method 6010. In:
Test methods for evaluating solid waste. 3rd ed. SW-846. Washington, DC: U.S.Environmental Protection Agency, Office of Solid Waste and Emergency Response.
USEPA. 1986c. Manganese (atomic absorption, direct aspiration)—method 7460. In: Testmethods for evaluating solid waste. 3rd ed. SW-846. Washington, DC: U.S.Environmental Protection Agency, Office of Solid Waste and Emergency Response.
USEPA. 1993. Drinking Water Criteria Document for Manganese. Final Draft. EnvironmentalCriteria and Assessment Office, Office of Health and Environmental Assessment, ECAO-CIN-D008. Cincinnati, OH.
©2006 AwwaRF. All Rights Reserved.
7/21/2019 Occurrence of Manganese in Drinking Water and Manganese Control
http://slidepdf.com/reader/full/occurrence-of-manganese-in-drinking-water-and-manganese-control 201/463
175
USEPA. 1994. Methods for the Determination of Metals in Environmental Samples –
Supplement 1. EPA/600/R-94-111, Cincinnati, Ohio. Environmental Monitoring Systems
Lab., Chemistry Research Div.
USEPA. 1996. Integrated Risk Information System; Manganese. Office of Research andDevelopment.
USEPA. 1998a. Announcement of the Drinking Water Contaminant Candidate List. Notice.
Fed. Reg., 63(40):10273-10287 (March 27, 1998).USEPA. 1998b. Title III list of lists: Consolidated list of chemicals subject to the Emergency
Planning and Community Right-to-know Act (EPCRA) and Section 112(r) of the Clean
Air Act, as Amended. EPA Report 550-B-98-017.USEPA. 1998c. Stage 1 Disinfectants and Disinfection Byproducts Rule. Final. Fed. Reg.,
63:241:69390-69476. (Dec. 16, 1998).
USEPA. 1999. Enhanced Coagulation and Enhanced Precipitative Softening Guidance Manual. EPA 815-R-99-012.
USEPA. 2000. Regulatory matrix of TRI chemicals in other federal programs. Washington,
D.C.: USEPA. Available on the Internet at: www.epa.gov/tri/chemicals.htm
USEPA. 2001a. Contaminant Candidate List Preliminary Regulatory Determination SupportDocument for Manganese. EPA 815-R-01-013. November.
USEPA. 2001b. Health effects support document for Manganese. External review draft. Officeof Water. EPA report 815-R-01-022.
USEPA. 2002. Announcement of Preliminary Regulatory Determinations for Priority
Contaminants on the Drinking Water Contaminant Candidate List. Fed. Reg.,
67(106):38222-38244 (June 3, 2002).USEPA. 2003. Announcement of Regulatory Determinations for Priority Contaminants on the
Drinking Water Contaminant Candidate List; Notice. Fed. Reg., 68(138):42898-42906
(July 18, 2003).USEPA. 2004. Drinking Water Health Advisory for Manganese. EPA report 822-R-04-003
http://www.epa.gov/safewater/ccl/pdfs/reg_determine1/support_cc1_magnese_dwreport.pdf
[USFDA] U.S. Food and Drug Administration. 2003. 21 CFR 165.110. Title 21--Food and
Drugs; Chapter I--Food and Drug Administration, Department of Health and HumanServices; Part 165—Beverages; Subpart B – Requirements for Specific Standardized
Beverages; (b)(4)(i)(A).
http://a257.g.akamaitech.net/7/257/2422/14mar20010800/edocket.access.gpo.gov/cfr_20
03/aprqtr/pdf/21cfr165.110.pdfUS Public Health Service. 1943. Public Health Service Drinking Water Standards. (Adoption of
Revisions to the 1925 Drinking Water Standards for interstate commerce). Public Health
Reports. 58(3):69-82. January 15, 1943.US Public Health Service. 1925. Report of Advisory Committee on Official Water Standards.
(Revisions to the 1914 Treasury Department Standard for drinking water on interstate
common carriers). Public Health Reports. 40(15):693-722. April 10, 1925.
USPHS. 1962. 1962 U.S. Public Health Service Standards. In: Drinking Water Regulation and Health. Edited by F.W. Pontius. New York: John Wiley and Sons, Inc. (2003).
Van der Tak, L. E. Snyder, and T. Martens. 1992. Partial Aeration of a Virginia Reservoir for
Iron, Manganese, and THM Control. In: Proceedings 1992 AWWA Water Quality
Technology Conference, Toronto, Ontario. Denver, CO: AWWA.
Vandenabeele, J., D. deBeer, R. Germonpre, and W. Verstraete. 1992. Manganese Oxidation by
Microbial Consortia from Sand Filters. Microbial Ecology, 24:91-108.
©2006 AwwaRF. All Rights Reserved.
7/21/2019 Occurrence of Manganese in Drinking Water and Manganese Control
http://slidepdf.com/reader/full/occurrence-of-manganese-in-drinking-water-and-manganese-control 202/463
176
Viraraghavan, T., E.L. Winchester, G.J. Brown, G.P. Wasson, and R.C. Landine. 1987.
Removing Manganese From Water at Fredericton, N.B., Canada. Jour. AWWA. 79(8):43-
48.
[VT DEC] State of Vermont: Agency of Natural Resources, Department of EnvironmentalConservation. 1997. Groundwater Protection Rule and Strategy. Rule Number: 97-P14;
Chapter 12, Table 2. Secondary Groundwater Quality Standards.
http://www.anr.state.vt.us/dec/watersup/gwrule97.htm[WAC-DNR] Wisconsin Register. 2004. Wisconsin Administrative Code, Department of Natural
Resources Chapter NR 140 Groundwater Quality.
http://www.legis.state.wi.us/rsb/code/nr/nr140.pdf[WADE-WAC] Washington State Department of Ecology. 1990. Chapter 173-200 WAC, Water
Quality Standards for Ground Waters of the State of Washington.
http://www.ecy.wa.gov/pubs/wac173200.pdfhttp://www.leg.wa.gov/wac/index.cfm?fuseaction=chapterdigest&chapter=173-200
Wasserman G.A., X. Liu, F. Parvez, H. Ahsan, D. Levy, P. Factor-Litvak, J. Kline, A. van
Green, V. Slakovick, N. Lolacono, Z. Cheng, Y Zheng, J. Graziano. 2006. Water
Manganese Exposure and Children’s Intellectual Function in Araihazar, Bangladesh. Environmental Health Prospectives 114(1): 124-129
Wake Forest University Baptist Medical Center. 2005. Does Manganese Inhaled from theShower Represent a Public Health Threat? Winston Salem, N.C. Wake Forest UniversitySchool of medicine and North Caroline Baptist Hospitals media release.
Weber, W.J., Jr. 1972. Physicochemical Processes for Water Quality Control. New York: John
Wiley & Sons, Inc.Welder, F.C. 1994. Biochemical and Nutritional Role of Manganese: An Overview. In:
Manganese in Health and Disease. Edited by D.J. Klimis-Tavantzis. Boca Raton, LA:
CRC Press.Weng, C.-N., D.L. Hoven, and B.J. Schwartz. 1986. Ozonation: An Economic Choice for Water
Treatment. Jour. AWWA, 78(11):83-89.Wennberg, A., A. Iregren, G. Struwe, G. Cizinsky, M.M. Hagman, and L. Johansson. 1991.
Scand. J. Work, Env. Health, 17:255-262.Weston, R.S. 1909. The Purification of Ground-Waters Containing Iron and Manganese.
Transactions of the American Society of Civil Engineers. Paper No. 1106.WHO 1993 Guidelines for Drinking-Water Quality – Second edition volume 1. Geneva, World
Health Organization.
WHO 2004a Guidelines for Drinking-Water Quality – Third edition volume 1. Geneva, WorldHealth Organization.
WHO. 2004b. Manganese in drinking-water. Background document for preparation of WHO
Guidelines for drinking-water quality. Geneva, World Health Organization.(WHO/SDE/WSH/03.04/104)
http://www.who.int/water_sanitation_health/dwq/chemicals/manganese.pdf
Wilczak, A., W.R. Knocke, R.E. Hubel, and E.M. Aieta. 1993. Manganese Control DuringOzonation of Water Containing Organic Compounds. Jour. AWWA,
Wong, J.M. 1984. Chlorination-Filtration for Iron and Manganese Removal. J. AWWA.
76(1):76-79.
Wormald, E.E., and J. Clark. 1994. Effectiveness of Existing Greensand Filtration System forIron and Manganese Removal. In: Proceedings 1994 AWWA Annual Conference—
Engineering and Operations, New York, NY. Denver, CO: AWWA.
©2006 AwwaRF. All Rights Reserved.

7/21/2019 Occurrence of Manganese in Drinking Water and Manganese Control
http://slidepdf.com/reader/full/occurrence-of-manganese-in-drinking-water-and-manganese-control 203/463
177
Yannoni, C.C., B.P. Kinsley, and T.R. Marston. 1999. Biological Filtration for Removal of
High Levels of Iron and Manganese. Jour. New England Water Works Association,
113(3):211-219.
Zaw, M., and B. Chiswell. 1995. Speciation of Iron and Manganese in Dam Water ParticlesUsing Electron Spectroscopy for Chemical Analyses. Talanta, 42:1:27-40.
Zienkiewicz, A.W. 1985. Removal of Iron and Manganese from Ground Water with the
Vyredox Method. Second International Conference on Ground Water Quality Research:
Proceedings. National Center for Ground Water Research, Houston, Texas. P 74-77.
©2006 AwwaRF. All Rights Reserved.

7/21/2019 Occurrence of Manganese in Drinking Water and Manganese Control
http://slidepdf.com/reader/full/occurrence-of-manganese-in-drinking-water-and-manganese-control 204/463
178
©2006 AwwaRF. All Rights Reserved.
7/21/2019 Occurrence of Manganese in Drinking Water and Manganese Control
http://slidepdf.com/reader/full/occurrence-of-manganese-in-drinking-water-and-manganese-control 205/463
179
ABBREVIATIONS
#/MG pounds (mass) per million gallons$M million US dollars$/mgd US dollars per million gallons per day
AA atomic adsorptionAAS atomic adsorption spectrometryAC advanced clarificationACGIH American Conference of Governmental Industrial HygienistsAg/Ag-Cl silver/silver chlorideAI adequate intakeAlk alkalinityAMD acid mine drainageamu atomic mass unitAO aesthetic objectiveAOC assimilable organic carbonAPDC ammonium l-pyrrolidine carbodithioateAPHA American Public Health Associationapp. apparent (color)aq. aqueousAS air strippingASTM American Society for Testing and MaterialsASV anodic stripping voltammetryatm atmosphereATSDR Agency for Toxic Substances and Disease Registryaux. auxiliaryAvg averageAWRC Australian Water Resources CouncilAWWA American Water Works AssociationAwwaRF Awwa Research Foundation
BAF biologically active filtrationBDOC biodegradable organic carbonBLS Bureau of Laboratory Services (Philadelphia Water Department)
°C degrees CelsiusCalif. CaliforniaCCR consumer confidence reportCERCLA Comprehensive Environmental Response, Compensation, and Liability Act
CFR Code of Federal RegulationsCDM Camp Dresser & McKeeCD-ROM compact disc – read only memoryCGS conventional gravity settlingCRC Cooperative Research Center – an Australian research entityCRU Central Receiving Unit (Philadelphia Water Department)CW clear well
©2006 AwwaRF. All Rights Reserved.
7/21/2019 Occurrence of Manganese in Drinking Water and Manganese Control
http://slidepdf.com/reader/full/occurrence-of-manganese-in-drinking-water-and-manganese-control 206/463
180
Da DaltonDAF dissolved air floatationDBP disinfection byproductsD/DBP disinfection/disinfection byproductDE diatomaceous earthDF direct filtrationDI deionizedDiss. DissolvedDNR Department of Natural ResourcesDO dissolved oxygenDOC dissolved organic carbonDPD N, N-diethyl-p-phenylenediamineDPP differential pulse polarographyDVD digital video discDWCCL Drinking Water Contaminant Candidate List
EC Economic Community – an early reference to the European UnionEH redox potential
EPA (United States) Environmental Protection AgencyEPCRA Emergency Planning and Community Right-to-Know ActEPR/ESR electron paramagnetic resonance / electron spin resonanceEQ pilot plant filter run end reason – equipment failure
FI filterability indexFSTRAC Federal-State Toxicology Risk Analysis Committee
GAC granular activated carbongfd gallons per foot per dayg/L grams per liter
gpcd gallons per capita daygpm gallons per minutegpm/sf gallons per minute per square footGW groundwaterGWUDI groundwater under the direct influence (of surface water)
HDPE high density polyethyleneHL pilot plant filter run end reason – headlossHOS hypolimnetic oxygenation systemHPC heterotrophic plate countHRT hydraulic residence time
IC ion chromatographicIAC Idaho Administrative CodeICP inductively coupled plasmaICP-AES inductively coupled plasma - atomic emission spectrometryICP-MS inductively coupled plasma - mass spectrometryIDAPA Idaho Administrative Procedure ActIDL instrument detection limit
©2006 AwwaRF. All Rights Reserved.
7/21/2019 Occurrence of Manganese in Drinking Water and Manganese Control
http://slidepdf.com/reader/full/occurrence-of-manganese-in-drinking-water-and-manganese-control 207/463
181
IDLHs immediately dangerous to life or health concentrationsIGE induced greensand effectin inchInt O3 intermediate ozonationIOCME induced oxide coated media effectIRIS Integrated Risk Information SystemISE ion selective electrode
K kilokDa kilodaltonkg kilogram
L/d liters per dayLD50 median lethal doseLG leucomalchite greenLIMS laboratory information management system
Mass. Massachusetts
MCE mixed cellulose esterMCL maximum contaminant levelMDL method detection limitmeq/L milliequivalents per literMF membrane filtrationMG malachite greenm2/g square meters per grammg/day milligrams per daymgd million gallons per daymg/kg milligrams per kilogrammg/kg-day milligrams per kilogram day
mg/kg/day milligrams per kilogram per daymg/L milligrams per litermg/L as CaCO3 milligrams per liter as calcium carbonatemg/L as P milligrams per liter as phosphorusmg/m
3 milligrams per cubic meter
MIBK methyl isobutyl ketonemL milliliterML/d megaliters per daymm millimeterMS mass spectrometerMUD Municipal Utility District
mV millivoltsMWCO molecular weight cutoffµg/g microgram per gramµg/kg microgram per kilogramµg/L microgram per literµg/m3 microgram per cubic meterµm micrometerµmho/cm micromho per centimeter
©2006 AwwaRF. All Rights Reserved.
7/21/2019 Occurrence of Manganese in Drinking Water and Manganese Control
http://slidepdf.com/reader/full/occurrence-of-manganese-in-drinking-water-and-manganese-control 208/463
182
n number of observations
N/A not applicable
NAC Nevada Administrative Code NAS National Academy of Sciences
ND non-detect
NEW North East Water NH New Hampshire
NHDES New Hampshire Department of Environmental Services
NHMRC National Health and Medical Research Council NIOSH National Institute of Occupational Safety and Health
NJ New Jersey
NJDEP New Jersey Department of Environmental Protection N.J.R. New Jersey Register
nm nanometers
NMAC New Mexico Administrative Code
NOM natural organic matter NPDES National Pollutant Discharge Elimination System
NPDWR National Primary Drinking Water Regulation NRC National Research Council NTU nephelometric turbidity units
NYSDEC New York State Department of Environmental Conservation
OCM oxide coated media
ORP oxidation-reduction potential
OSHA Occupational Safety and Health Administration
PAC project advisory groupPACl polyaluminum chloride
PAN 1-(2-pyridylazo)-2-naphtholPEL permissible exposure limit
PI principal investigatorPP polypropylene
PP pilot plant
p.p.m. part per millionPSA potentiometric stripping analysis
psi pounds per square inch
Pt-Co units platinum cobalt color unitsPWD Philadelphia Water Department
PWS public water system
QA quality assuranceQC quality control
R 2 proportion of variation
RfD reference dose
RL reporting limit
RO reverse osmosis
©2006 AwwaRF. All Rights Reserved.
7/21/2019 Occurrence of Manganese in Drinking Water and Manganese Control
http://slidepdf.com/reader/full/occurrence-of-manganese-in-drinking-water-and-manganese-control 209/463
183
s solidSDWA Safe Drinking Water ActSDWIS Safe Drinking Water Information SystemSGRWA South Gippsland Region Water AuthoritySM Standard MethodSMCL Secondary Maximum Contaminant Levelsp. speciesSW surface waterσ standard deviation of sample population
T(4-CP)P α,β,γ,δ-tetrakis(4-carboxyphenyl)porphineTAG technical advisory groupTB pilot plant filter run end reason – turbidity breakthroughTCR Total Coliform RuleTDS total dissolved solidsTHM trihalomethaneTMB 3,3',5,5'-tetramethylbenzidineT&O taste and odorTOC total organic carbonTM pilot plant filter run end reason – time constraintsTRI Toxic Release InventoryTSS total suspended solids
UF ultra filtrationUK United KingdomUL tolerable upper level intakeUS United States of AmericaUSA United States of AmericaUSEPA United States Environmental Protection Agency
USFDA United States Food and Drug AdministrationUSGS United States Geological SurveyUSPHS United States Public Health ServiceUV ultravioletUV254 ultraviolet absorbance at 254 nm
vs. versusVT DEC Vermont Department of Environmental Conservation
WAC Washington (State) Administrative CodeWAC Wisconsin Administrative Code Department of Natural Resources
WADE Washington State Department of EcologyWHO World Health OrganizationWQ water qualityWQN National Stream Water-Quality Monitoring NetworkWTP water treatment plantWQ water quality
©2006 AwwaRF. All Rights Reserved.

7/21/2019 Occurrence of Manganese in Drinking Water and Manganese Control
http://slidepdf.com/reader/full/occurrence-of-manganese-in-drinking-water-and-manganese-control 210/463
184
XPS X-ray photoelectron spectroscopyXRF X-ray fluorescence spectroscopy
©2006 AwwaRF. All Rights Reserved.
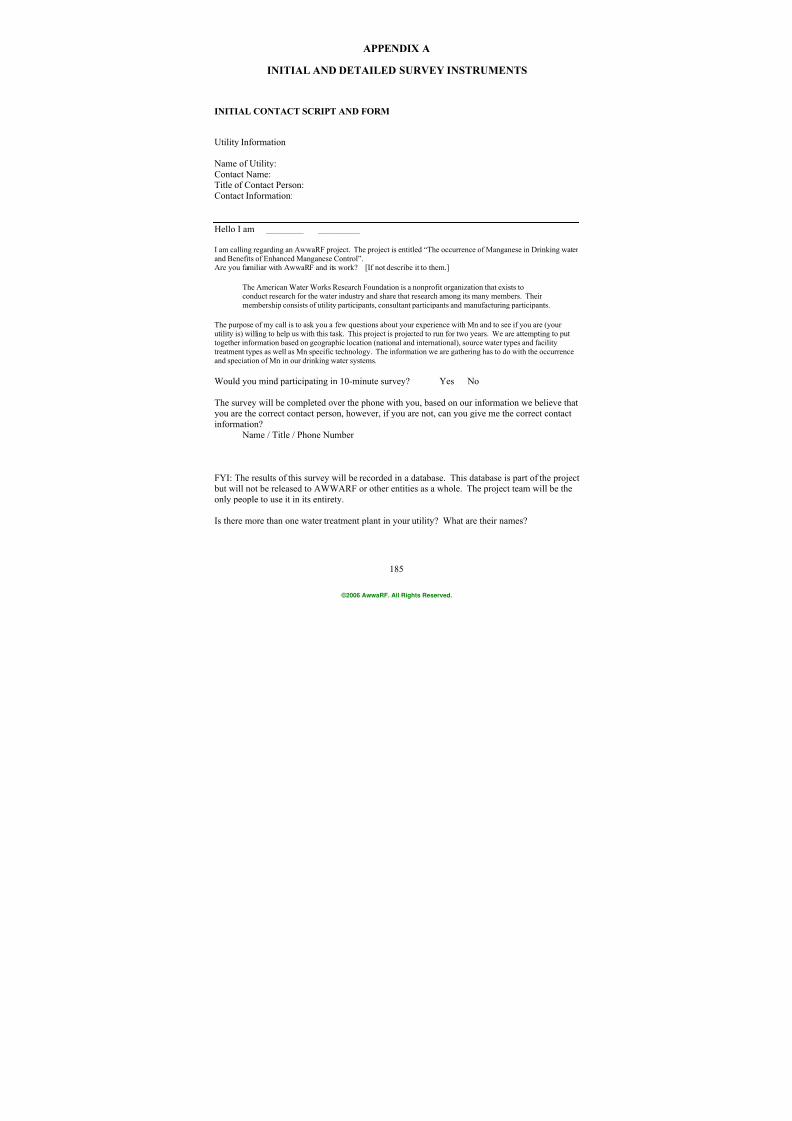
7/21/2019 Occurrence of Manganese in Drinking Water and Manganese Control
http://slidepdf.com/reader/full/occurrence-of-manganese-in-drinking-water-and-manganese-control 211/463
185
APPENDIX A
INITIAL AND DETAILED SURVEY INSTRUMENTS
INITIAL CONTACT SCRIPT AND FORM
Utility Information
Name of Utility:
Contact Name:Title of Contact Person:
Contact Information:
Hello I am ________ _________
I am calling regarding an AwwaRF project. The project is entitled “The occurrence of Manganese in Drinking water
and Benefits of Enhanced Manganese Control”.Are you familiar with AwwaRF and its work? [If not describe it to them.]
The American Water Works Research Foundation is a nonprofit organization that exists toconduct research for the water industry and share that research among its many members. Their
membership consists of utility participants, consultant participants and manufacturing participants.
The purpose of my call is to ask you a few questions about your experience with Mn and to see if you are (your
utility is) willing to help us with this task. This project is projected to run for two years. We are attempting to put
together information based on geographic location (national and international), source water types and facility
treatment types as well as Mn specific technology. The information we are gathering has to do with the occurrence
and speciation of Mn in our drinking water systems.
Would you mind participating in 10-minute survey? Yes No
The survey will be completed over the phone with you, based on our information we believe thatyou are the correct contact person, however, if you are not, can you give me the correct contact
information?
Name / Title / Phone Number
FYI: The results of this survey will be recorded in a database. This database is part of the project but will not be released to AWWARF or other entities as a whole. The project team will be the
only people to use it in its entirety.
Is there more than one water treatment plant in your utility? What are their names?
©2006 AwwaRF. All Rights Reserved.
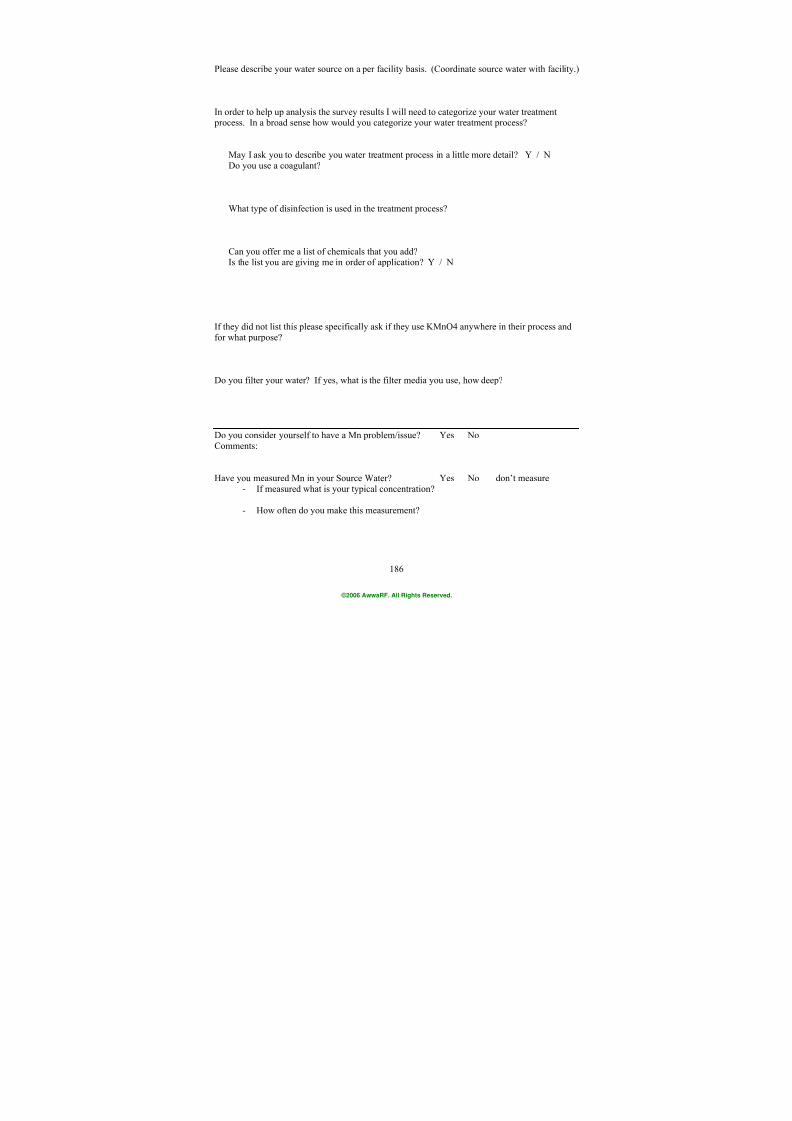
7/21/2019 Occurrence of Manganese in Drinking Water and Manganese Control
http://slidepdf.com/reader/full/occurrence-of-manganese-in-drinking-water-and-manganese-control 212/463
186
Please describe your water source on a per facility basis. (Coordinate source water with facility.)
In order to help up analysis the survey results I will need to categorize your water treatment process. In a broad sense how would you categorize your water treatment process?
May I ask you to describe you water treatment process in a little more detail? Y / N
Do you use a coagulant?
What type of disinfection is used in the treatment process?
Can you offer me a list of chemicals that you add?Is the list you are giving me in order of application? Y / N
If they did not list this please specifically ask if they use KMnO4 anywhere in their process and
for what purpose?
Do you filter your water? If yes, what is the filter media you use, how deep?
Do you consider yourself to have a Mn problem/issue? Yes No
Comments:
Have you measured Mn in your Source Water? Yes No don’t measure- If measured what is your typical concentration?
- How often do you make this measurement?
©2006 AwwaRF. All Rights Reserved.
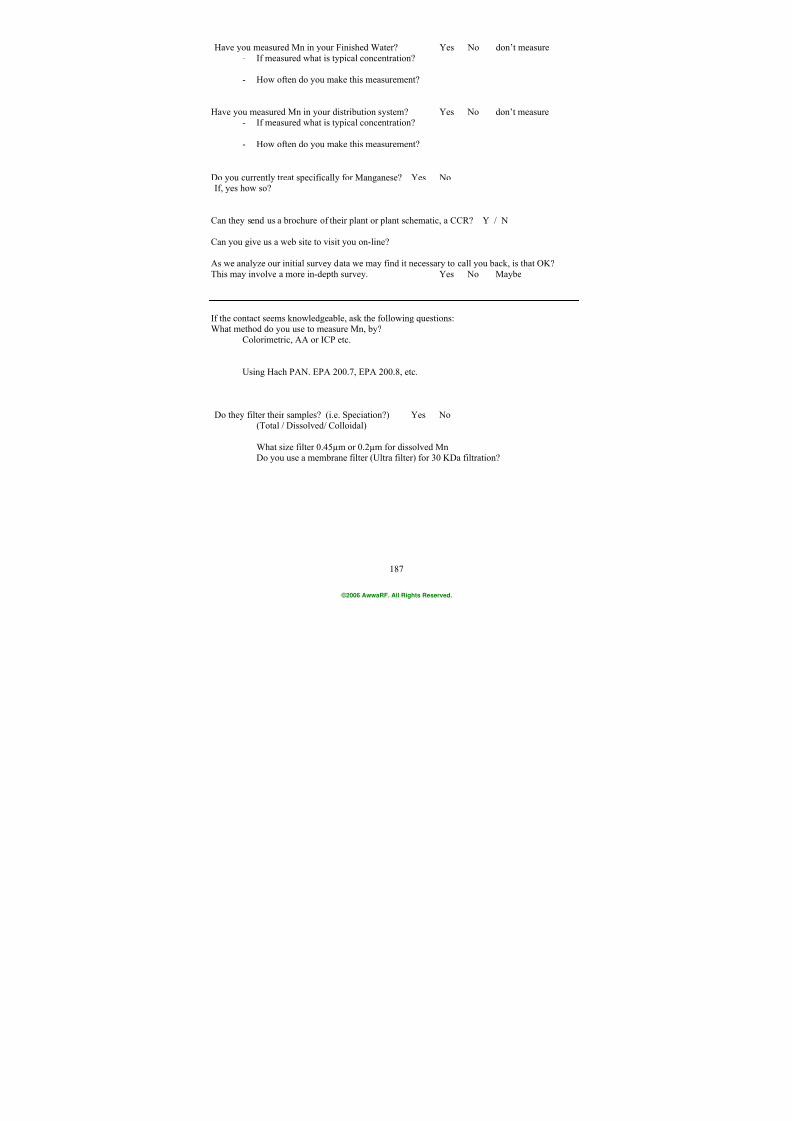
7/21/2019 Occurrence of Manganese in Drinking Water and Manganese Control
http://slidepdf.com/reader/full/occurrence-of-manganese-in-drinking-water-and-manganese-control 213/463
187
Have you measured Mn in your Finished Water? Yes No don’t measure
- If measured what is typical concentration?
- How often do you make this measurement?
Have you measured Mn in your distribution system? Yes No don’t measure- If measured what is typical concentration?
- How often do you make this measurement?
Do you currently treat specifically for Manganese? Yes NoIf, yes how so?
Can they send us a brochure of their plant or plant schematic, a CCR? Y / N
Can you give us a web site to visit you on-line?
As we analyze our initial survey data we may find it necessary to call you back, is that OK?
This may involve a more in-depth survey. Yes No Maybe
If the contact seems knowledgeable, ask the following questions:What method do you use to measure Mn, by?
Colorimetric, AA or ICP etc.
Using Hach PAN. EPA 200.7, EPA 200.8, etc.
Do they filter their samples? (i.e. Speciation?) Yes No(Total / Dissolved/ Colloidal)
What size filter 0.45µm or 0.2µm for dissolved MnDo you use a membrane filter (Ultra filter) for 30 KDa filtration?
©2006 AwwaRF. All Rights Reserved.
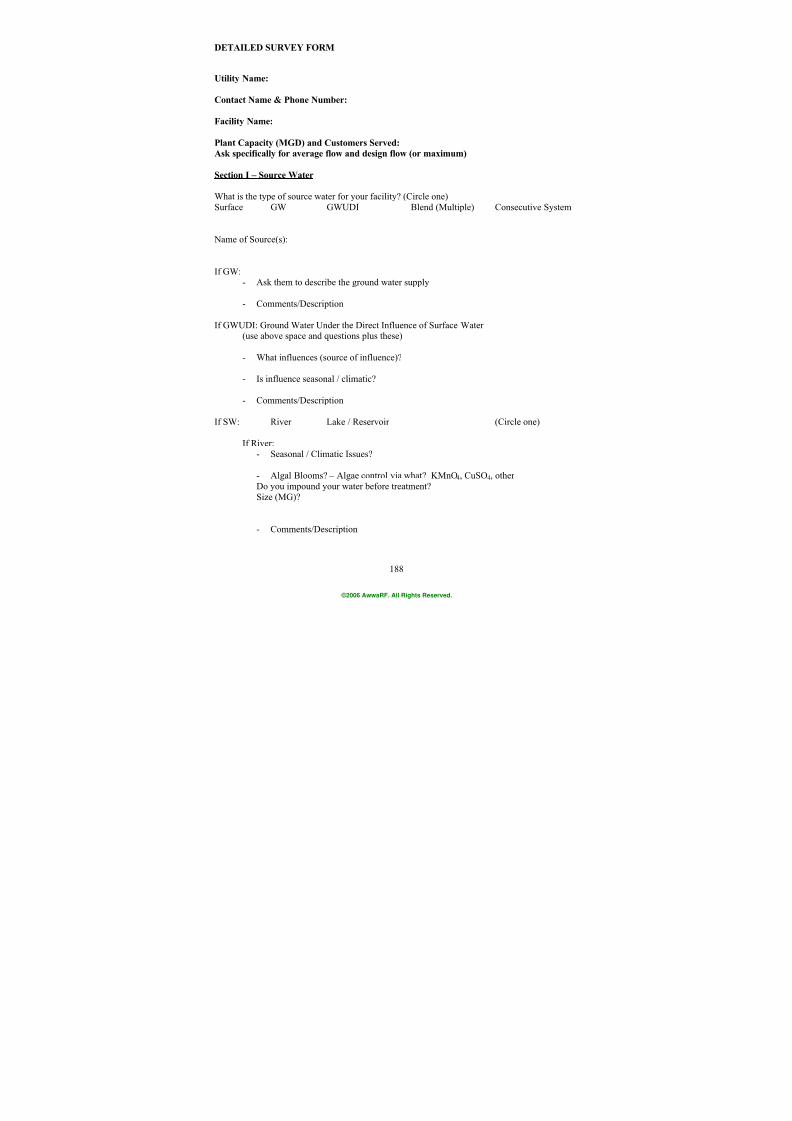
7/21/2019 Occurrence of Manganese in Drinking Water and Manganese Control
http://slidepdf.com/reader/full/occurrence-of-manganese-in-drinking-water-and-manganese-control 214/463
188
DETAILED SURVEY FORM
Utility Name:
Contact Name & Phone Number:
Facility Name:
Plant Capacity (MGD) and Customers Served:
Ask specifically for average flow and design flow (or maximum)
Section I – Source Water
What is the type of source water for your facility? (Circle one)
Surface GW GWUDI Blend (Multiple) Consecutive System
Name of Source(s):
If GW:- Ask them to describe the ground water supply
- Comments/Description
If GWUDI: Ground Water Under the Direct Influence of Surface Water(use above space and questions plus these)
- What influences (source of influence)?
- Is influence seasonal / climatic?
- Comments/Description
If SW: River Lake / Reservoir (Circle one)
If River:
- Seasonal / Climatic Issues?
- Algal Blooms? – Algae control via what? KMnO4, CuSO4, otherDo you impound your water before treatment?
Size (MG)?
- Comments/Description
©2006 AwwaRF. All Rights Reserved.
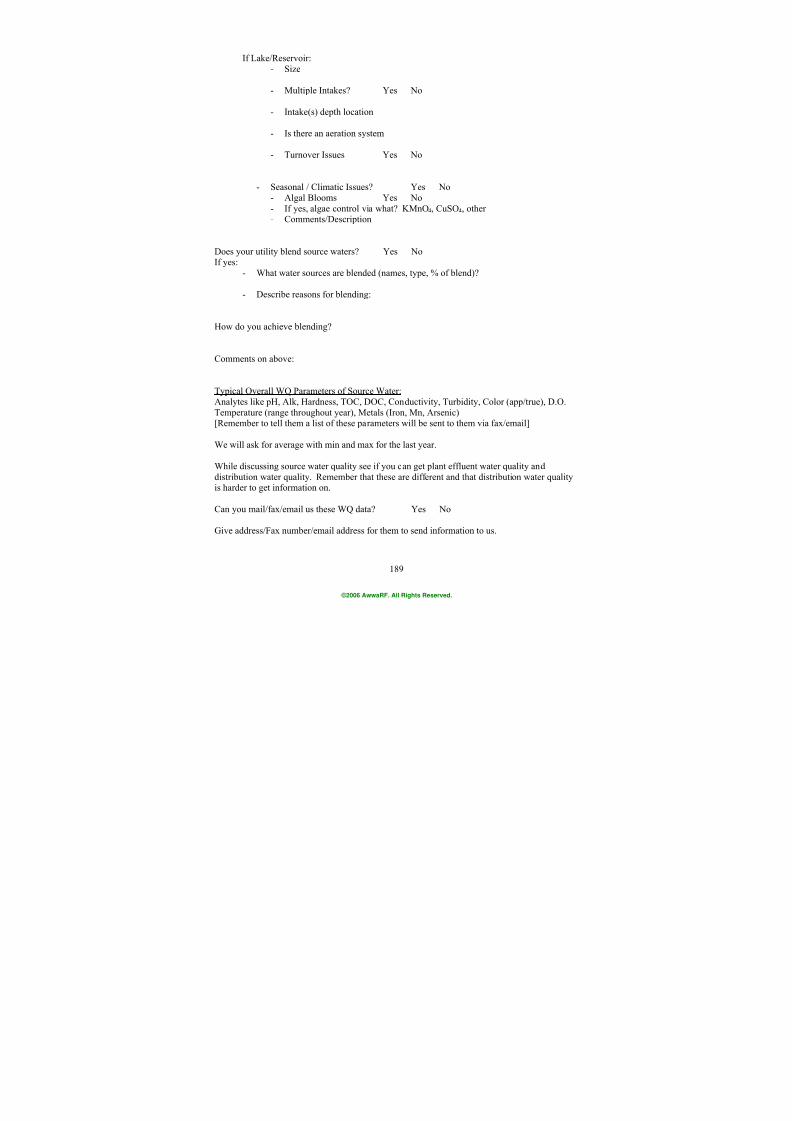
7/21/2019 Occurrence of Manganese in Drinking Water and Manganese Control
http://slidepdf.com/reader/full/occurrence-of-manganese-in-drinking-water-and-manganese-control 215/463
189
If Lake/Reservoir:
- Size
- Multiple Intakes? Yes No
- Intake(s) depth location
- Is there an aeration system
- Turnover Issues Yes No
- Seasonal / Climatic Issues? Yes No
- Algal Blooms Yes No
- If yes, algae control via what? KMnO4, CuSO4, other- Comments/Description
Does your utility blend source waters? Yes NoIf yes:
- What water sources are blended (names, type, % of blend)?
- Describe reasons for blending:
How do you achieve blending?
Comments on above:
Typical Overall WQ Parameters of Source Water:
Analytes like pH, Alk, Hardness, TOC, DOC, Conductivity, Turbidity, Color (app/true), D.O.
Temperature (range throughout year), Metals (Iron, Mn, Arsenic)[Remember to tell them a list of these parameters will be sent to them via fax/email]
We will ask for average with min and max for the last year.
While discussing source water quality see if you can get plant effluent water quality and
distribution water quality. Remember that these are different and that distribution water qualityis harder to get information on.
Can you mail/fax/email us these WQ data? Yes No
Give address/Fax number/email address for them to send information to us.
©2006 AwwaRF. All Rights Reserved.
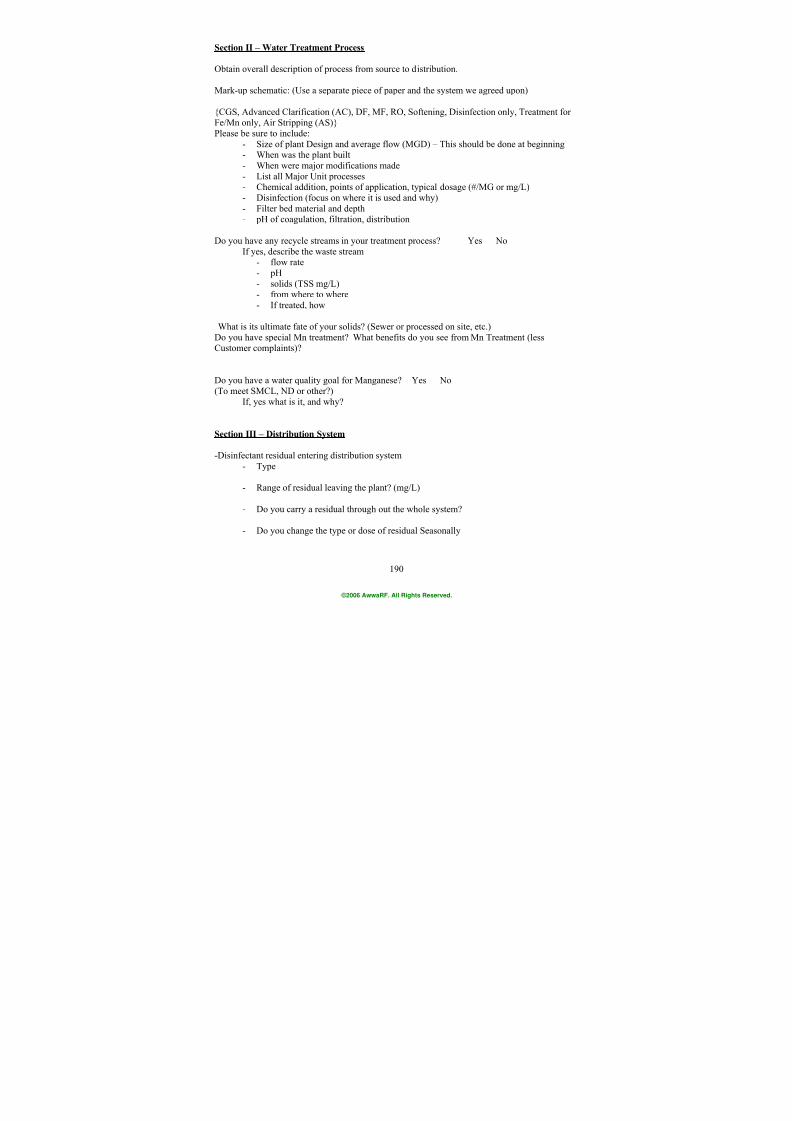
7/21/2019 Occurrence of Manganese in Drinking Water and Manganese Control
http://slidepdf.com/reader/full/occurrence-of-manganese-in-drinking-water-and-manganese-control 216/463
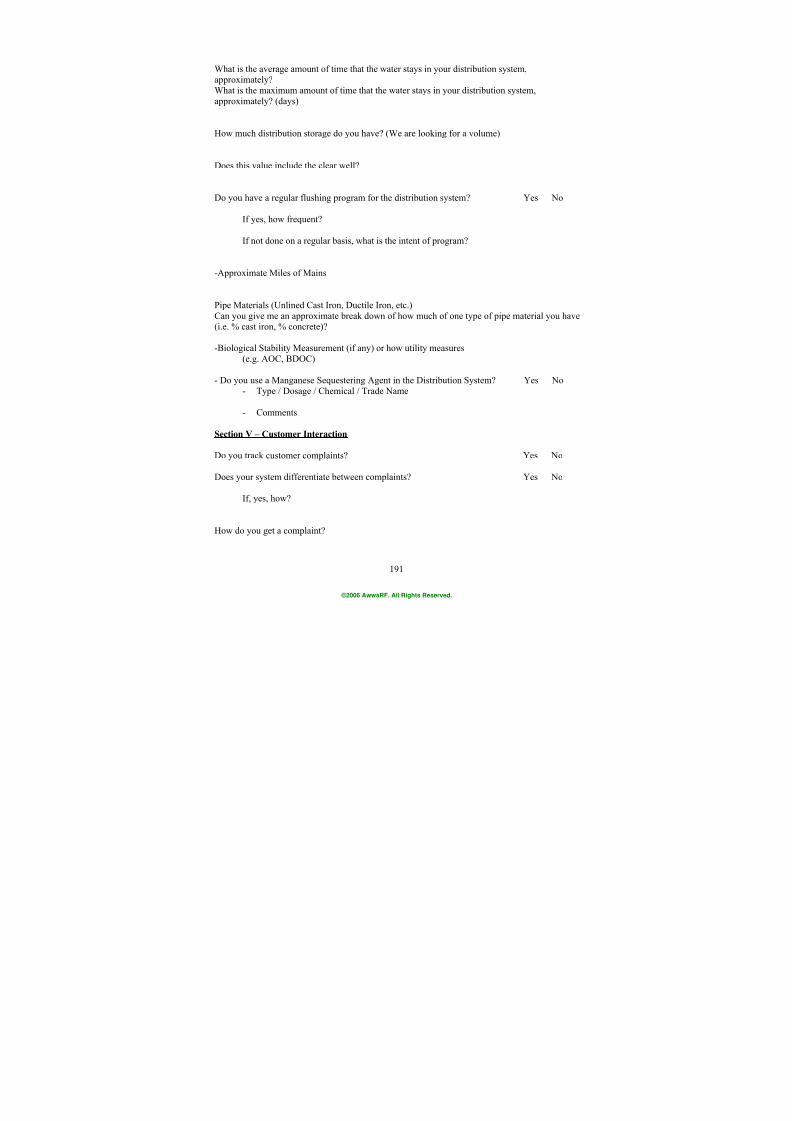
7/21/2019 Occurrence of Manganese in Drinking Water and Manganese Control
http://slidepdf.com/reader/full/occurrence-of-manganese-in-drinking-water-and-manganese-control 217/463
191
What is the average amount of time that the water stays in your distribution system,approximately?
What is the maximum amount of time that the water stays in your distribution system,
approximately? (days)
How much distribution storage do you have? (We are looking for a volume)
Does this value include the clear well?
Do you have a regular flushing program for the distribution system? Yes No
If yes, how frequent?
If not done on a regular basis, what is the intent of program?
-Approximate Miles of Mains
Pipe Materials (Unlined Cast Iron, Ductile Iron, etc.)
Can you give me an approximate break down of how much of one type of pipe material you have(i.e. % cast iron, % concrete)?
-Biological Stability Measurement (if any) or how utility measures
(e.g. AOC, BDOC)
- Do you use a Manganese Sequestering Agent in the Distribution System? Yes No
- Type / Dosage / Chemical / Trade Name
- Comments
Section V – Customer Interaction
Do you track customer complaints? Yes No
Does your system differentiate between complaints? Yes No
If, yes, how?
How do you get a complaint?
©2006 AwwaRF. All Rights Reserved.

7/21/2019 Occurrence of Manganese in Drinking Water and Manganese Control
http://slidepdf.com/reader/full/occurrence-of-manganese-in-drinking-water-and-manganese-control 218/463
192
What do you do with it?
Who responds to complaint?
How do you record complaints?
Water sampling follow up?
Can you see clusters of complaints within your distribution system? Yes No
If you see a cluster of complaints directly due to manganese;
Do you adjust treatment at your facility? Yes No
Is your procedure successful? Yes No
Comments:
Closure
Thanks for spending the time to answer this survey. If we have additional questions is it all rightto call you back for clarification of information? Yes No
Let me give you the address again for sending your Source Water and CCR information.
I will send you (OR) I have already sent you a list of parameters requested for both raw waterand finished water.
©2006 AwwaRF. All Rights Reserved.
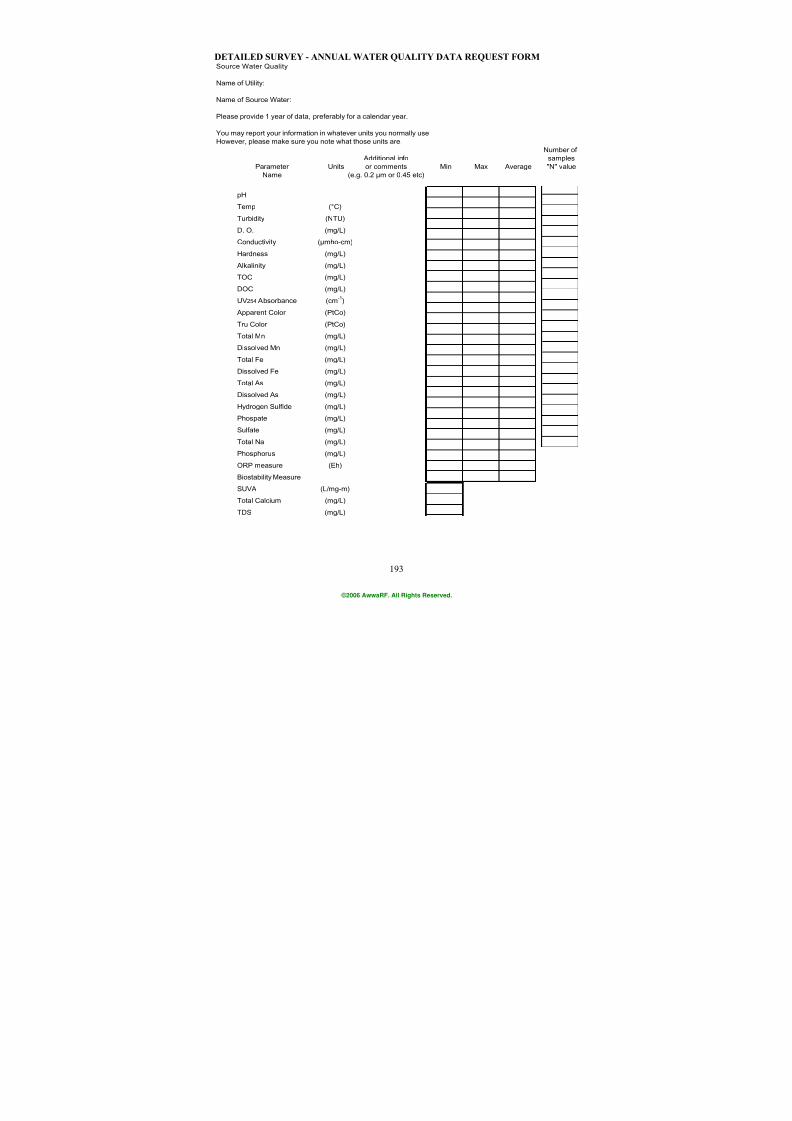
7/21/2019 Occurrence of Manganese in Drinking Water and Manganese Control
http://slidepdf.com/reader/full/occurrence-of-manganese-in-drinking-water-and-manganese-control 219/463
193
DETAILED SURVEY - ANNUAL WATER QUALITY DATA REQUEST FORMSource Water Quality
Name of Utility:
Name of Source Water:
Please provide 1 year of data, preferably for a calendar year.
You may report your information in whatever units you normally useHowever, please make sure you note what those units are.
Number of
Additional info samplesParameter Units or comments Min Max Average "N" value
Name (e.g. 0.2 µm or 0.45 etc)
pH
Temp (°C)
Turbidity (NTU)
D. O. (mg/L)
Conductivity (µmho-cm)
Hardness (mg/L)
Alkalinity (mg/L)
TOC (mg/L)
DOC (mg/L)
UV254 Absorbance (cm-1
)
Apparent Color (PtCo)
Tru Color (PtCo)
Total Mn (mg/L)
Dissolved Mn (mg/L)
Total Fe (mg/L)
Dissolved Fe (mg/L)
Total As (mg/L)
Dissolved As (mg/L)
Hydrogen Sulfide (mg/L)
Phospate (mg/L)
Sulfate (mg/L)
Total Na (mg/L)
Phosphorus (mg/L)
ORP measure (Eh)
Biostability Measure
SUVA (L/mg-m)
Total Calcium (mg/L)
TDS (mg/L)
©2006 AwwaRF. All Rights Reserved.

7/21/2019 Occurrence of Manganese in Drinking Water and Manganese Control
http://slidepdf.com/reader/full/occurrence-of-manganese-in-drinking-water-and-manganese-control 220/463
194
©2006 AwwaRF. All Rights Reserved.
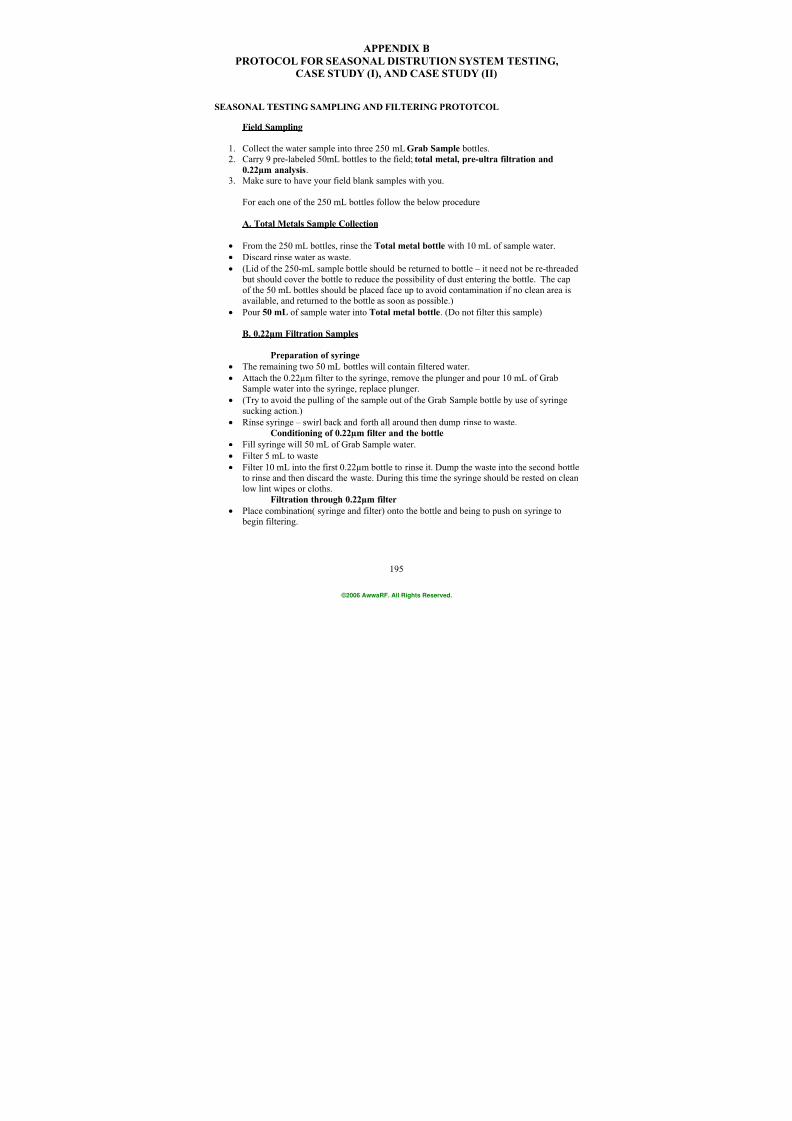
7/21/2019 Occurrence of Manganese in Drinking Water and Manganese Control
http://slidepdf.com/reader/full/occurrence-of-manganese-in-drinking-water-and-manganese-control 221/463
195
APPENDIX B
PROTOCOL FOR SEASONAL DISTRUTION SYSTEM TESTING,
CASE STUDY (I), AND CASE STUDY (II)
SEASONAL TESTING SAMPLING AND FILTERING PROTOTCOL
Field Sampling
1. Collect the water sample into three 250 mL Grab Sample bottles.2. Carry 9 pre-labeled 50mL bottles to the field; total metal, pre-ultra filtration and
0.22µm analysis.
3. Make sure to have your field blank samples with you.
For each one of the 250 mL bottles follow the below procedure
A. Total Metals Sample Collection
• From the 250 mL bottles, rinse the Total metal bottle with 10 mL of sample water.
• Discard rinse water as waste.
• (Lid of the 250-mL sample bottle should be returned to bottle – it need not be re-threaded but should cover the bottle to reduce the possibility of dust entering the bottle. The cap
of the 50 mL bottles should be placed face up to avoid contamination if no clean area isavailable, and returned to the bottle as soon as possible.)
• Pour 50 mL of sample water into Total metal bottle. (Do not filter this sample)
B. 0.22µm Filtration Samples
Preparation of syringe• The remaining two 50 mL bottles will contain filtered water.
• Attach the 0.22µm filter to the syringe, remove the plunger and pour 10 mL of GrabSample water into the syringe, replace plunger.
• (Try to avoid the pulling of the sample out of the Grab Sample bottle by use of syringe
sucking action.)
• Rinse syringe – swirl back and forth all around then dump rinse to waste.
Conditioning of 0.22µm filter and the bottle
• Fill syringe will 50 mL of Grab Sample water.
• Filter 5 mL to waste
• Filter 10 mL into the first 0.22µm bottle to rinse it. Dump the waste into the second bottle
to rinse and then discard the waste. During this time the syringe should be rested on cleanlow lint wipes or cloths.
Filtration through 0.22µm filter
• Place combination( syringe and filter) onto the bottle and being to push on syringe to begin filtering.
©2006 AwwaRF. All Rights Reserved.
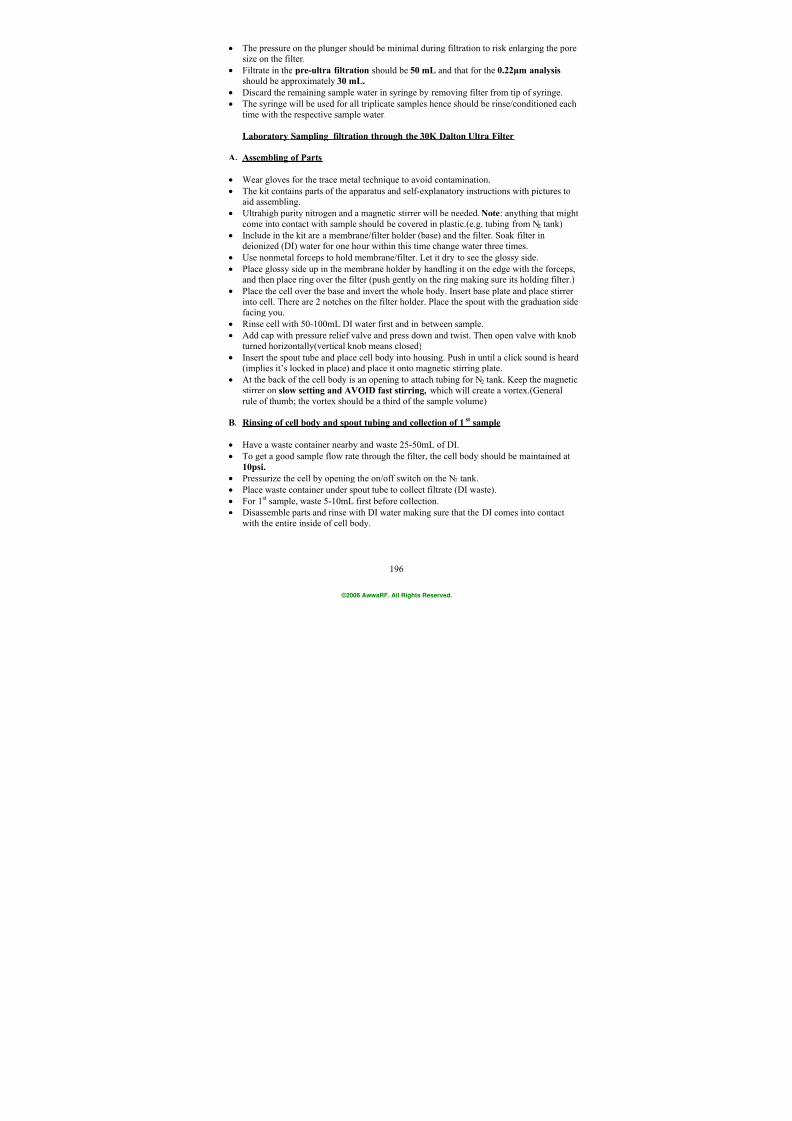
7/21/2019 Occurrence of Manganese in Drinking Water and Manganese Control
http://slidepdf.com/reader/full/occurrence-of-manganese-in-drinking-water-and-manganese-control 222/463
196
• The pressure on the plunger should be minimal during filtration to risk enlarging the poresize on the filter.
• Filtrate in the pre-ultra filtration should be 50 mL and that for the 0.22µm analysis should be approximately 30 mL.
• Discard the remaining sample water in syringe by removing filter from tip of syringe.
• The syringe will be used for all triplicate samples hence should be rinse/conditioned each
time with the respective sample water.
Laboratory Sampling filtration through the 30K Dalton Ultra Filter
A. Assembling of Parts
• Wear gloves for the trace metal technique to avoid contamination.
• The kit contains parts of the apparatus and self-explanatory instructions with pictures toaid assembling.
• Ultrahigh purity nitrogen and a magnetic stirrer will be needed. Note: anything that might
come into contact with sample should be covered in plastic.(e.g. tubing from N2 tank)
•
Include in the kit are a membrane/filter holder (base) and the filter. Soak filter indeionized (DI) water for one hour within this time change water three times.
• Use nonmetal forceps to hold membrane/filter. Let it dry to see the glossy side.
• Place glossy side up in the membrane holder by handling it on the edge with the forceps,and then place ring over the filter (push gently on the ring making sure its holding filter.)
• Place the cell over the base and invert the whole body. Insert base plate and place stirrerinto cell. There are 2 notches on the filter holder. Place the spout with the graduation sidefacing you.
• Rinse cell with 50-100mL DI water first and in between sample.
• Add cap with pressure relief valve and press down and twist. Then open valve with knobturned horizontally(vertical knob means closed)
• Insert the spout tube and place cell body into housing. Push in until a click sound is heard(implies it’s locked in place) and place it onto magnetic stirring plate.
• At the back of the cell body is an opening to attach tubing for N2 tank. Keep the magnetic
stirrer on slow setting and AVOID fast stirring, which will create a vortex.(General
rule of thumb; the vortex should be a third of the sample volume)
B. Rinsing of cell body and spout tubing and collection of 1st sample
• Have a waste container nearby and waste 25-50mL of DI.
• To get a good sample flow rate through the filter, the cell body should be maintained at
10psi.
• Pressurize the cell by opening the on/off switch on the N2 tank.
• Place waste container under spout tube to collect filtrate (DI waste).
• For 1st sample, waste 5-10mL first before collection.
• Disassemble parts and rinse with DI water making sure that the DI comes into contactwith the entire inside of cell body.
©2006 AwwaRF. All Rights Reserved.
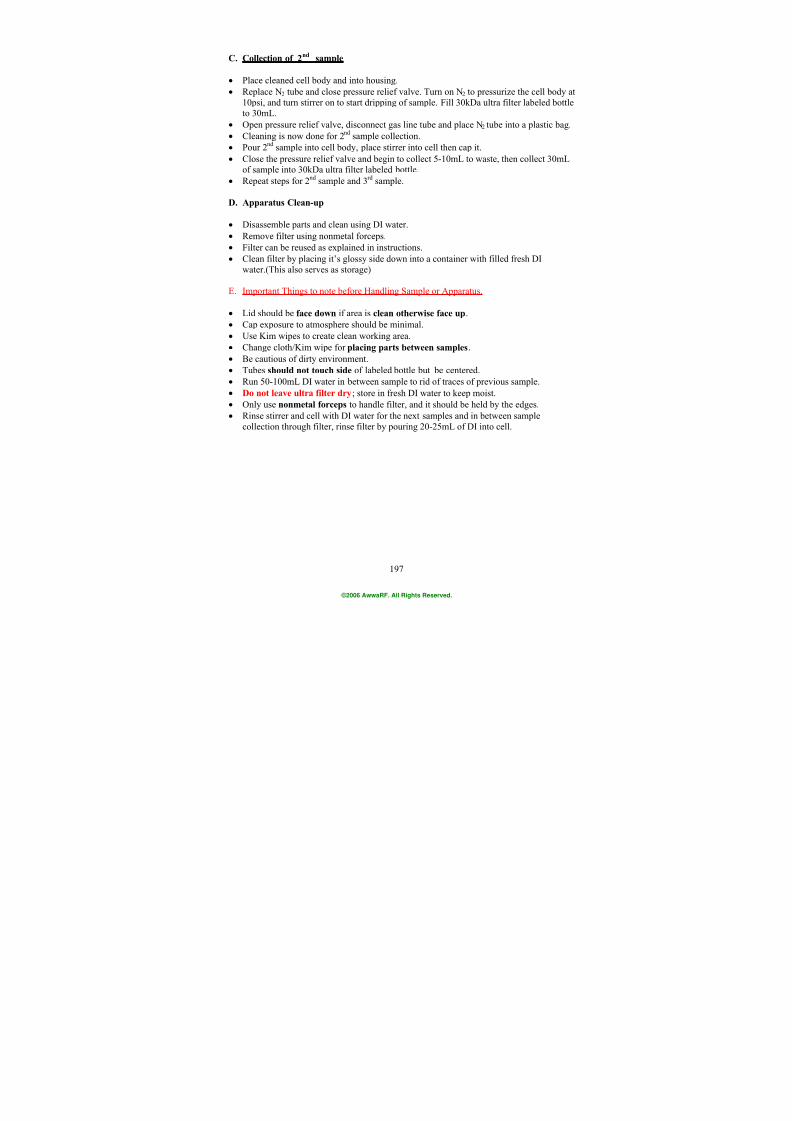
7/21/2019 Occurrence of Manganese in Drinking Water and Manganese Control
http://slidepdf.com/reader/full/occurrence-of-manganese-in-drinking-water-and-manganese-control 223/463
197
C. Collection of 2nd
sample
• Place cleaned cell body and into housing.
• Replace N2 tube and close pressure relief valve. Turn on N2 to pressurize the cell body at
10psi, and turn stirrer on to start dripping of sample. Fill 30kDa ultra filter labeled bottleto 30mL.
• Open pressure relief valve, disconnect gas line tube and place N2 tube into a plastic bag.
• Cleaning is now done for 2nd
sample collection.
• Pour 2nd
sample into cell body, place stirrer into cell then cap it.
• Close the pressure relief valve and begin to collect 5-10mL to waste, then collect 30mLof sample into 30kDa ultra filter labeled bottle.
• Repeat steps for 2nd
sample and 3rd
sample.
D. Apparatus Clean-up
• Disassemble parts and clean using DI water.
• Remove filter using nonmetal forceps.• Filter can be reused as explained in instructions.
• Clean filter by placing it’s glossy side down into a container with filled fresh DI
water.(This also serves as storage)
E. Important Things to note before Handling Sample or Apparatus.
• Lid should be face down if area is clean otherwise face up.
• Cap exposure to atmosphere should be minimal.
• Use Kim wipes to create clean working area.
• Change cloth/Kim wipe for placing parts between samples.
• Be cautious of dirty environment.• Tubes should not touch side of labeled bottle but be centered.
• Run 50-100mL DI water in between sample to rid of traces of previous sample.
• Do not leave ultra filter dry; store in fresh DI water to keep moist.
• Only use nonmetal forceps to handle filter, and it should be held by the edges.
• Rinse stirrer and cell with DI water for the next samples and in between sample
collection through filter, rinse filter by pouring 20-25mL of DI into cell.
©2006 AwwaRF. All Rights Reserved.
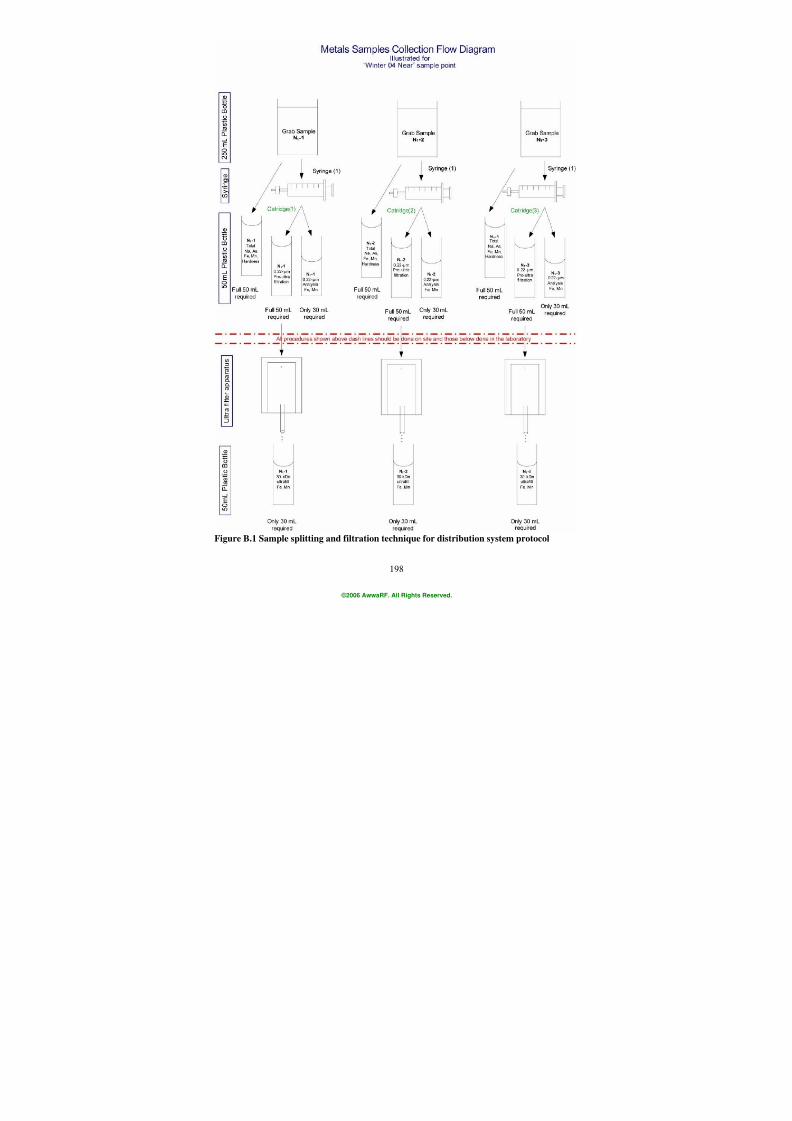
7/21/2019 Occurrence of Manganese in Drinking Water and Manganese Control
http://slidepdf.com/reader/full/occurrence-of-manganese-in-drinking-water-and-manganese-control 224/463
198
Figure B.1 Sample splitting and filtration technique for distribution system protocol
©2006 AwwaRF. All Rights Reserved.
7/21/2019 Occurrence of Manganese in Drinking Water and Manganese Control
http://slidepdf.com/reader/full/occurrence-of-manganese-in-drinking-water-and-manganese-control 225/463
199
CASE STUDY (I) PROTOCOL
PILOT TESTING FOR MANGANESE CONTROL
1.0 Introduction
To achieve very low manganese concentrations in the finished water, PWD relies uponcontact oxidation and adsorption on oxide coated filter media in the presence of pre-filter free
chlorine residual. Strategies to reduce disinfection by-product formation such as use of
alternative disinfectants, reduction of chlorine residuals, and delaying the point of chlorinationdownstream in the treatment process could impede the existing manganese removal mechanisms.
The investigations for Phase VII pilot testing are designed to characterize the effects of pH, pre-
filter chlorine, coagulant type, filter media, and seasonal raw water quality on the ability toremove and retain manganese.
Manganese control was a major element of Phase III (2000 to 2001), Phase IV (2001 to2002), and Phase VI (2003) piloting. The effects of pH, chlorine residual, intermediate
ozonation, biologically active filtration (BAF), and coagulant type on manganese control were
evaluated. Contact oxidation and adsorption in the presence of adequate free chlorine residual(about 0.5 mg/L over breakpoint) was found to be the most effect method of achieving the 0.015mg/L total manganese goal. Intermediate ozone and BAF were not found to be effective for
manganese control.
Phase VII piloting will include four major and two minor investigations which are
summarized as follows:
• Investigation 1 – The objective of this investigation will be to study the effect of pHon manganese control using ferric chloride (which contains substantial manganese
concentration) as the primary coagulant. Intermediate ozone will be used to oxidize
the manganese in order to minimize or eliminate the concentration of solublemanganese applied to the filters. A range of filtration pH values from 6.5 to 9.0 will
be tested. On each of Trains A and B, one dual media filter will be treated with pre-
filter chlorine, while one dual media filter and one GAC filter will receive no pre-
filter chlorine.
• Investigation 2 – The objective of this investigation will be to characterize themanganese retention of a previously chlorinated manganese oxide coated filter bed
upon cessation of pre-filter chlorine, over a range of filtration pH levels from 6.5 to8.5. This investigation will be performed with ferric chloride coagulation, following
the completion of Investigation 1.
• Investigation 3 – The objective of this investigation will be to study the effect of pHon manganese control using a primary coagulant containing negligible manganese,such as polyaluminum chloride (PACl). Therefore, in this investigation, the
manganese loading to the treatment process will consist of background levels existing
in the raw water. Investigation 3 will include the same experiments described for
Investigation 1 with the exception of the change to a non-manganese primarycoagulant.
©2006 AwwaRF. All Rights Reserved.
7/21/2019 Occurrence of Manganese in Drinking Water and Manganese Control
http://slidepdf.com/reader/full/occurrence-of-manganese-in-drinking-water-and-manganese-control 226/463
200
• Investigation 4 - The objective of this investigation will be to characterize themanganese retention of a previously chlorinated manganese oxide coated filter bed
upon cessation of pre-filter chlorine over a range of filtration pH levels from 6.5 to
8.5, using a non-manganese containing primary coagulant. This investigation will be performed using an alternative coagulant which achieves acceptable overall treatment
process performance. (Previous phases of testing indicate that the optimum
alternative coagulant will most likely be PACl), following the completion ofInvestigation 3.
• Investigation 5 – The pilot plants have recently (Phase VI) standardized on a 0.22 µmnominal pore size membrane filter, whereas the water industry at large still uses a
0.45 µm membrane for filtration of dissolved metals samples. The objective of thisinvestigation will be to determine the effect on iron and manganese of filtering
samples through 0.45 µm, 0.22 µm, and 30K Dalton membrane filters. The
evaluation will consist of an analysis of supplementary data collected during theexperiments conducted under Investigations 1 and 3.
• Investigation 6 – The objective of this QA investigation will be to determine whether
the ozone quenching agent, sodium metabisulfite, liberates manganese from oxidecoated filters. The findings will assist in interpretation of data in the event of an
accidental bisulfite overfeed.
2.0 Investigations
2.1 Pilot Plant Operation & Data Collection
Pilot Plant Design
The PWD has two pilot plants, each located full scale water treatment plants; these plantsdraw water from two different river sources, the Schuylkill River and the Delaware River . A
schematic of the Belmont WTP pilot plant (Schuylkill River source) is presented Figure B.2
The pilot plants draw water from the river source, without any pretreatment. About 20
gpm of river water enters a 600 gallon raw water basin that provides about 30 minutes of contacttime to model pre-treatment chemical addition.
The water is pumped and split into two parallel 8 gpm process trains. First the flowenters two small rapid mix basins, followed by two (Belmont pilot) or five (Baxter pilot)
flocculation basins, with a ‘tapered’ floc mixing scheme. The water then flows through a lamella
plate, upflow clarifier for settling; the full scale plants have gravity settling basins.
Depending the investigation protocol, the settled water from one of the two process trainsmay enter an 8 column, counter current, intermediate ozone contactor. Ozone is typically added
in the first column only, and then quenched if necessary in the last column.
The settled water, or post ozone contact water, is then filtered by gravity. Each train has
two dual media filters (21” anthracite and 9” sand) and one biologically active GAC filter.
©2006 AwwaRF. All Rights Reserved.
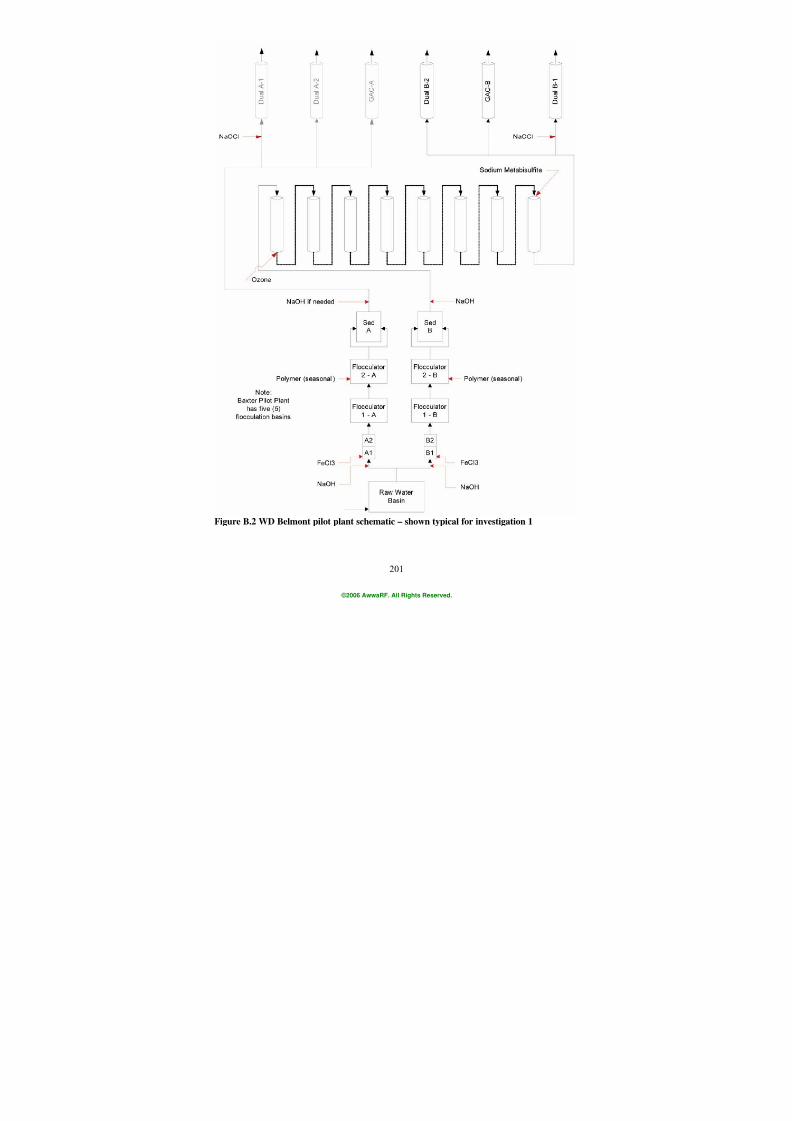
7/21/2019 Occurrence of Manganese in Drinking Water and Manganese Control
http://slidepdf.com/reader/full/occurrence-of-manganese-in-drinking-water-and-manganese-control 227/463
201
Figure B.2 WD Belmont pilot plant schematic – shown typical for investigation 1
©2006 AwwaRF. All Rights Reserved.
7/21/2019 Occurrence of Manganese in Drinking Water and Manganese Control
http://slidepdf.com/reader/full/occurrence-of-manganese-in-drinking-water-and-manganese-control 228/463
202
Online monitors measure: raw water turbidity and flow; flocculation pH; sedimentation
pH, turbidity, and particle counts; filter head loss, turbidity, and particle counts; intermediate
ozone residual in various locations throughout the columns, plus ozone feed gas and off gasconcentrations. All online data is recorded at two minute intervals in a PC based data logger.
Schedule
The schedule for Phase VII is from March 2004 to February 2005. Pilot Plantinformation relevant to AwwaRF 2863 will be forwarded to the PIs for inclusion in the final
report by November 2004. At least two of the investigations will be repeated twice to obtain
seasonal data. Investigations 1 and 3 are complex and labor-intensive and will require the piloting staff from both Baxter and Belmont to work together first at one plant then at the other
to complete the experiment. Investigations 2, 4, and 6 may be performed at each plant with its
own staff.
New Measurements
Oxidation-reduction potential was added to the sampling regimen during previous Phase
VI testing. Technical problems with the instrumentation prevented collection of useful dataduring Phase VI piloting. The piloting staff changed the ORP equipment to new (Orion) probesand are able to produce reliable data for Phase VII testing. Redox potential may prove to be a
valuable operational tool to determine the level at which manganese will oxidize or reduce and to
draw correlations to manganese breakthrough. Measurements will be taken at the applied waterafter ozonation or chlorination and at the filtered water. Redox potential measurements are
temperature dependent so all Eh measurements will be accompanied by a temperature. The Eh
will be taken along with pH, chlorine residual, and manganese measurements.The detailed standard operating procedure for the determination of redox potential is
provided in the next section of this appendix . The data are measured and recorded as:
Eh = ORP + Eref
where Eh is the reported redox potential, ORP is the half-cell potential in millivolts of the
sample measured with an inert (platinum) indicator electrode at the given temperature, and Eref is
the reference potential measured with a reference (Ag-AgCl) electrode at that same temperature.
Standard Operating Procedures
• Chemical doses will be established based on previous testing experience, full scale plant operations, and jar testing in accordance with the judgment of the pilot plant
staff.
• Both Train A and Train B will be in service with equal influent flow of 8 gpm to each
train. Both pilot plants will run at 8 gpm through flocculation and waste 2 gpm before sedimentation.
• Rapid mixing and flocculation will be set to optimized G-values as determined from previous investigations.
• The coagulation and filtration pH will be varied as described in Section 2.2.
©2006 AwwaRF. All Rights Reserved.
7/21/2019 Occurrence of Manganese in Drinking Water and Manganese Control
http://slidepdf.com/reader/full/occurrence-of-manganese-in-drinking-water-and-manganese-control 229/463
203
• For Investigations 1 and 3, intermediate ozone will be used with eight contactcolumns, providing a total HRT of 17 minutes at 6 gpm.
- Apply an ozone dose of 2 mg/L or more as needed to yield a measurable ozone
residual at the outlet of the final contact column in an attempt to oxidize all themanganese.
- Apply sodium hydroxide for pH adjustment, if necessary, at the influent to the 7th
column to achieve the targeted filtration pH.- Quench the ozone residual with sodium bisulfite, applied at the inlet to the 8th
column such that an ozone residual of > 0.0 but < 0.1 mg/L remains at the outlet
bottom tap of the 8th
column. This trace ozone residual will verify that there is no
carry over of reducing agent (bisulfite) into the filters.
• Train A will provide settled/ozonated water to dual media Filters A-1 and A-2 andGAC Filter A.
• Train B will provide settled/ozonated water to dual media Filters B-1 and B-2 and
GAC Filter 2.
• In each train, there will be a dedicated chlorinated dual media filter, a dedicated non-
chlorinated dual media filter, and a dedicated non-chlorinated biologically activeGAC filter. Pre-filter chlorine, when applicable for each investigation, will be dosed
to yield a 0.5 mg/L free residual at the filter effluent.
• Filters will be operated at 4 gpm/ft2. Filter runs will be conducted until 72 hours of
run time or as dictated by scheduling constraints, terminal headloss of 96 inches, orturbidity breakthrough of 0.1 NTU. A shorter filter run time may be used for
Investigation 6 once metals sampling at steady state has been completed.
• Upon changing coagulant from ferric to polyaluminum chloride and back again, there
will be a period of acclimation to allow the development of steady state conditions.
During this period, no data will be collected, but the pilot plants will be operated forapproximately one week, or as required for the filters to adjust to the change of
coagulant.
Startup and routine operations requirements will include the following procedures:• At the beginning and end of any shutdown, backwash the filters.
• Empty and flush the sedimentation basin hoppers weekly.
• Wipe lamella plates clean at least monthly, or more frequently if needed.
• During weekend shutdowns, continue raw water flow through the raw water basin to
the overflow. Run High Service water from pretreatment through the sedimentation basins to overflow. Leave the filters filled with water.
• During extended shutdowns lasting longer than a weekend, run high service waterfrom pretreatment through the filters. Maintain flow through the filters with plant
water.
2.2 Investigation Description
An investigation matrix for Phase VII Investigations 1 through 6 is provided in Table
B.1. This table summarizes the investigation description, variables, constants, evaluation
criteria, and number of runs. The sampling matrix for these investigations is provided in Table B.2. Bureau of Laboratory Services (BLS) sampling is summarized in Table B.3.
©2006 AwwaRF. All Rights Reserved.
7/21/2019 Occurrence of Manganese in Drinking Water and Manganese Control
http://slidepdf.com/reader/full/occurrence-of-manganese-in-drinking-water-and-manganese-control 230/463
204
Investigation 1 – Effect of pH on Manganese Control with Ferric Coagulation
Objective: The objective of this investigation will be to study the effect of pH on manganesecontrol using ferric chloride as the primary coagulant over a range of filtration pH
values from 6.5 to 9.0.
Description: Both Baxter and Belmont plant staffs will work at each plant in turn due to thecomplexity and labor intensiveness of the investigation. Due to the difficulty of
filtered manganese and redox potential measurement, only three filters will be
operated a time. Both Train A and Train B pretreatment will be started uptogether to facilitate a smooth transition from the Train A filters to the Train B
filters. Both trains will be coagulated at pH 6.5 using ferric chloride throughout
the investigation.
Intermediate ozone will be used at pH 6.5 with an applied dose of 2 mg/L and all
8 columns in service providing a total HRT of about 17 minutes at 6 gpm. Thedose is expected to yield a measurable ozone residual after the given contact time,
ensuring that all the manganese has been oxidized. If ozone residual is not
detected prior to quenching, increase the ozone dose until a residual is detected.At the effluent of the 6
th ozone column, add caustic soda for pH adjustment, as
described below. At the influent to the 8th
column, the ozone residual will be
quenched with sodium bisulfite such that an ozone residual of > 0.0 but < 0.1
mg/L remains at the effluent of the 8th
column. This trace ozone residual willverify that there is no carry over of reducing agent (bisulfite) into the filters which
could potentially cause a manganese breakthrough. The ozone system will first
be connected to receive the settled water from Train A and supply ozonated waterto the three Train A filters. Then, the ozone system will be switched over to
receive settled water from Train B and supply ozonated water to the three Train Bfilters.
The pH of the ozonated water will be adjusted using caustic soda added at theeffluent of the 6
th ozone contact column (influent to the 7
th column) to attain the
desired range of experimental values in a series of three sub-investigations. The
post-ozonation filtration pH will be monitored at the effluent of the 7th
column. In
Investigation 1A, Train A will remain at pH 6.5 post-ozonation while Train B will be adjusted to pH 7.0. In Investigation 1B, Train A will be adjusted to pH 7.5 and
Train B to pH 8.0. In Investigation 1C, Train A will be adjusted to pH 8.5 and
Train B to pH 9.0.
Note that it may be difficult to impossible to maintain ozone residual in the 7th
column at the highest pH tested due to rapid conversion of ozone to hydroxylradical. If this proves to be the case, monitor the residual upstream of the pH
adjustment point to ensure proper dosing. Under such conditions, it will not be
necessary to use the quenching agent.
©2006 AwwaRF. All Rights Reserved.
7/21/2019 Occurrence of Manganese in Drinking Water and Manganese Control
http://slidepdf.com/reader/full/occurrence-of-manganese-in-drinking-water-and-manganese-control 231/463
205
Train A Filter 1 will be treated with pre-filter chlorine at sufficient dose to
maintain a 0.5 mg/L free chlorine residual in the filter effluent. Train A Filter 2
and GAC1 will receive no chlorine. A Train A run will be conducted with the fullregimen of sampling with flow from Train A pretreatment to the ozone system to
the three filters. Upon completion of this run, the ozone will be piped to Train B.
Train B Filter B-1 will receive pre-chlorine at sufficient dose to maintain 0.5
mg/L free chlorine residual in the filter effluent. Train B Filter B-2 and GAC2will receive no chlorine. A Train B run will be conducted with the complete
sampling regimen. The procedure will be repeated for Investigations 1A, 1B, and
1C, testing the range of pH values.
Investigation 2 – Effect of pH on Oxide Coated Filter Media without Pre-Filter Chlorine (Ferric
Coagulation)
Objective: The objective of this investigation will be to characterize the manganese retention
of a previously chlorinated filter which has a developed manganese oxide coatingupon cessation of pre-filter chlorine over a range of filtration pH levels from 6.5
to 8.5. This investigation will be performed using coagulation with ferric chloride
following Investigation 1.
Description: Continue pretreatment established in the immediately preceding Investigation 1.
Discontinue intermediate ozone. The filters receiving pre-filter chlorine, Train A
Filter A-1 and Train B-1 will be operated for this investigation. A series of runswill be conducted with filtration pH varied from 6.5 to 8.5.
Establish steady state, normal operations with pre-filter chlorination yielding a 0.5mg/L free residual at the effluent. After 2 hours of run time, the chlorine will be
shut off, and the manganese concentration over the course of the filter runestablished by taking measurements at various time intervals, e.g., time zero, 30
minutes, and thereafter hourly increments. After one run, the filter will be backwashed and restarted without chlorine with measurement of the manganese profile. Based on the judgment of piloting staff, if unsteady conditions are still
evident, repeat runs will be conducted.
Investigation 3 – Effect of pH on Manganese Control with Alternative Coagulant
Objective: The objective of this investigation will be to study the effect of pH on manganese
control using a non-manganese containing primary coagulant, such as PACl. Themanganese loading to the treatment process will therefore consist of the
background levels present in the raw water.
Description: The experiments will be as described above for Investigation 1, with the
exception of the substitution of the alternative coagulant such as PACl instead of
ferric as the primary coagulant.
©2006 AwwaRF. All Rights Reserved.

7/21/2019 Occurrence of Manganese in Drinking Water and Manganese Control
http://slidepdf.com/reader/full/occurrence-of-manganese-in-drinking-water-and-manganese-control 232/463
206
Investigation 4 – Effect of pH on Oxide Coated Filter Media without Pre-Filter Chlorine
(Alternative Coagulant)
Objective: The objective of this investigation will be to characterize the manganese retention
of a previously chlorinated filter which has developed manganese oxide coating
upon cessation of pre-filter chlorine over a range of filtration pH levels from 6.5
to 8.5. This investigation will be performed with a non-manganese containingcoagulant, such as PACl, following Investigation 3.
Description: The experiments will be as described above for Investigation 2, with theexception of the substitution of alternative coagulant such as PACl instead of
ferric as the primary coagulant, as well as timing of the investigation to follow
Investigation 3.
Investigation 5 – Effect of Membrane Filter Nominal Pore Size on Metals Fractionation
Objective: The objective of this investigation will be to determine the effect on iron and
manganese of filtering samples through 0.45 µm, 0.22 µm, and 30K Dalton
membrane filters.
Description: The evaluation will consist of an analysis of supplementary data collected during
the experiments conducted under Investigations 1 and 3. At least once per
seasonal investigation, and more frequently if possible, collect a 0.45 µm metalssample, from the settled, ozonated, and filtered water. This collection should
coincide with the sampling for 0.22 µm and 30K Dalton samples. The effect of
membrane size on manganese and iron will be quantified.
Investigation 6 – Effect of Sodium Metabisulfite on Manganese Oxide Coated Filter Media
Objective: The objective of this QA investigation will be to determine whether the ozonequenching agent, sodium metabisulfite, liberates manganese from oxide coatedfilters.
Description: Establish pre-treatment, including intermediate ozone, as described for
Investigation 1, operating Train A and Filters 1 and 2. Coagulate and filter at pH6.5. Apply chlorine to the chlorinated Filter 1 yielding 0.5 mg/L free chlorine
residual in the filter effluent, and no chlorine to Filter 2. Beginning with the
typical baseline dose, increase the dose of sodium metabisulfite in 0.1 incrementsuntil there is a zero ozone residual at the effluent of column 8. Wait 2 hours for
each new dose, increasing each dose by 0.5 mg/L. Sample the filter effluent for
total and dissolved metals.
©2006 AwwaRF. All Rights Reserved.
7/21/2019 Occurrence of Manganese in Drinking Water and Manganese Control
http://slidepdf.com/reader/full/occurrence-of-manganese-in-drinking-water-and-manganese-control 233/463
207
3.0 Pilot Plant Reporting
Communication of results between pilot plant staff, WTP managers and engineers,
project managers, and the Technical Advisory Committee (TAC) is an important aspect of the
pilot program. Reports to be produced for Phase VII pilot study are described below.
3.1 Run Reports
A progress report summarizing the investigation will be due 4 to 5 weeks after completion of theinvestigation, depending upon receipt of analytical results from Bureau of Laboratory Services
(BLS). Weekly run reports are delivered to the PWD project manager for review and for
compilation in the Phase VII reference binder.
Components of the weekly run report include pilot plant as well as full scale plant
operating parameters including point of chemical application, chemical dose, flowrate througheach process unit, number of units in service, mixing intensity, HRTs, projected loading rates,
and filtration rates. Pilot plant water quality parameters will be summarized including raw,
settled and filtered water quality, profiles of on-line filter headloss, turbidity, and particle counts,water quality data from BLS, and a summary of filter run production data.
3.2 Semiannual Technical Memorandum Report
A technical memorandum report will be prepared for review by the TAC summarizing
the results of investigations on manganese control. The report will be based on the analysis
completed in the seasonal objective summary reports, augmented as needed by weekly reportinformation. After a review period, a conference call will be held with the Pilot Plant TAC, the
pilot plant team leaders, and project managers. Based upon the results of the conference call, thereport may be revised or conference call minutes appended.
3.3 AwwaRF Memorandum Report
A technical memorandum report will be prepared for review by the PIs summarizing the
results of investigations on manganese control. The report will be based on the Technical
Memorandum already written as described in section 3.2. This report will be completed in timefor inclusion in the AwwaRF 2863 report. As per the AwwaRF 2863 schedule that will be the
end of November 2004.
©2006 AwwaRF. All Rights Reserved.
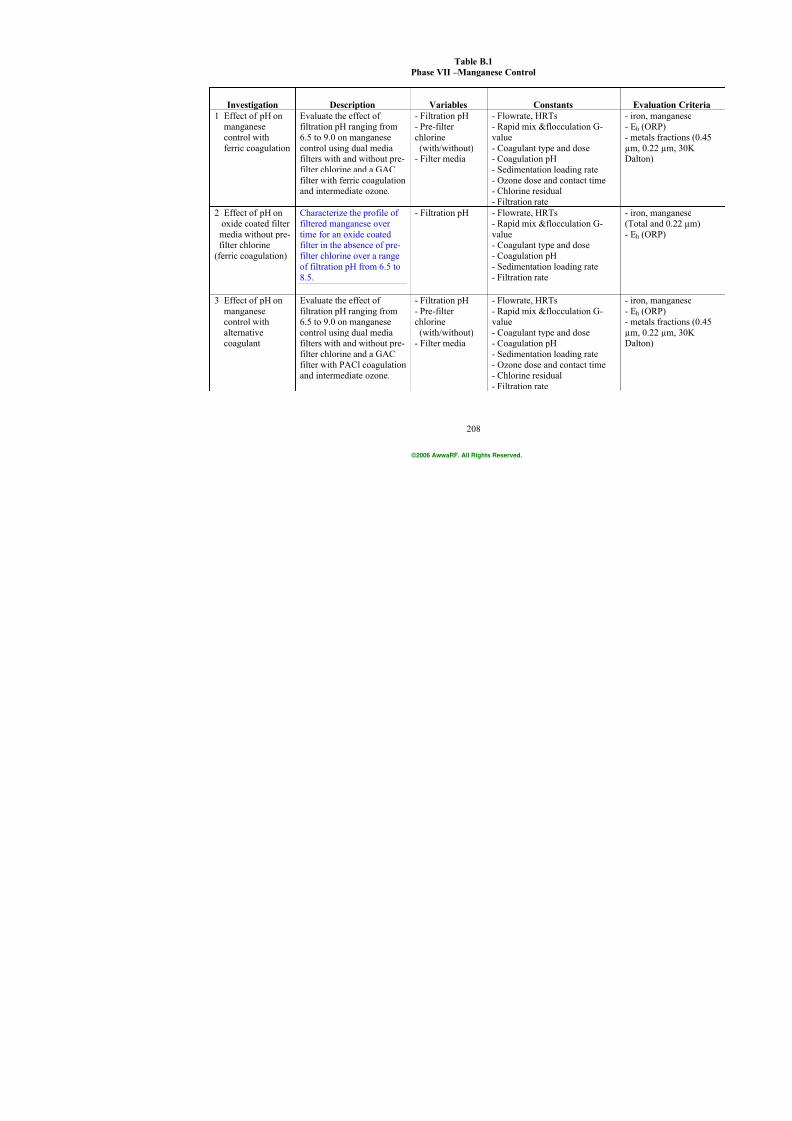
7/21/2019 Occurrence of Manganese in Drinking Water and Manganese Control
http://slidepdf.com/reader/full/occurrence-of-manganese-in-drinking-water-and-manganese-control 234/463
208
Table B.1
Phase VII –Manganese Control
Investigation Description Variables Constants
1 Effect of pH onmanganese
control with
ferric coagulation
Evaluate the effect offiltration pH ranging from
6.5 to 9.0 on manganese
control using dual mediafilters with and without pre-
filter chlorine and a GAC
filter with ferric coagulationand intermediate ozone.
- Filtration pH- Pre-filter
chlorine
(with/without)- Filter media
- Flowrate, HRTs- Rapid mix &flocculation G-
value
- Coagulant type and dose- Coagulation pH
- Sedimentation loading rate
- Ozone dose and contact time- Chlorine residual
- Filtration rate
2 Effect of pH on
oxide coated filter
media without pre-filter chlorine
(ferric coagulation)
Characterize the profile of
filtered manganese over
time for an oxide coatedfilter in the absence of pre-
filter chlorine over a range
of filtration pH from 6.5 to
8.5.
- Filtration pH - Flowrate, HRTs
- Rapid mix &flocculation G-
value- Coagulant type and dose
- Coagulation pH
- Sedimentation loading rate
- Filtration rate
3 Effect of pH on
manganesecontrol with
alternativecoagulant
Evaluate the effect of
filtration pH ranging from6.5 to 9.0 on manganese
control using dual mediafilters with and without pre-
filter chlorine and a GACfilter with PACl coagulationand intermediate ozone.
- Filtration pH
- Pre-filterchlorine
(with/without)- Filter media
- Flowrate, HRTs
- Rapid mix &flocculation G-value
- Coagulant type and dose- Coagulation pH
- Sedimentation loading rate- Ozone dose and contact time- Chlorine residual
- Filtration rate
©2006 AwwaRF. All Rights Reserved.
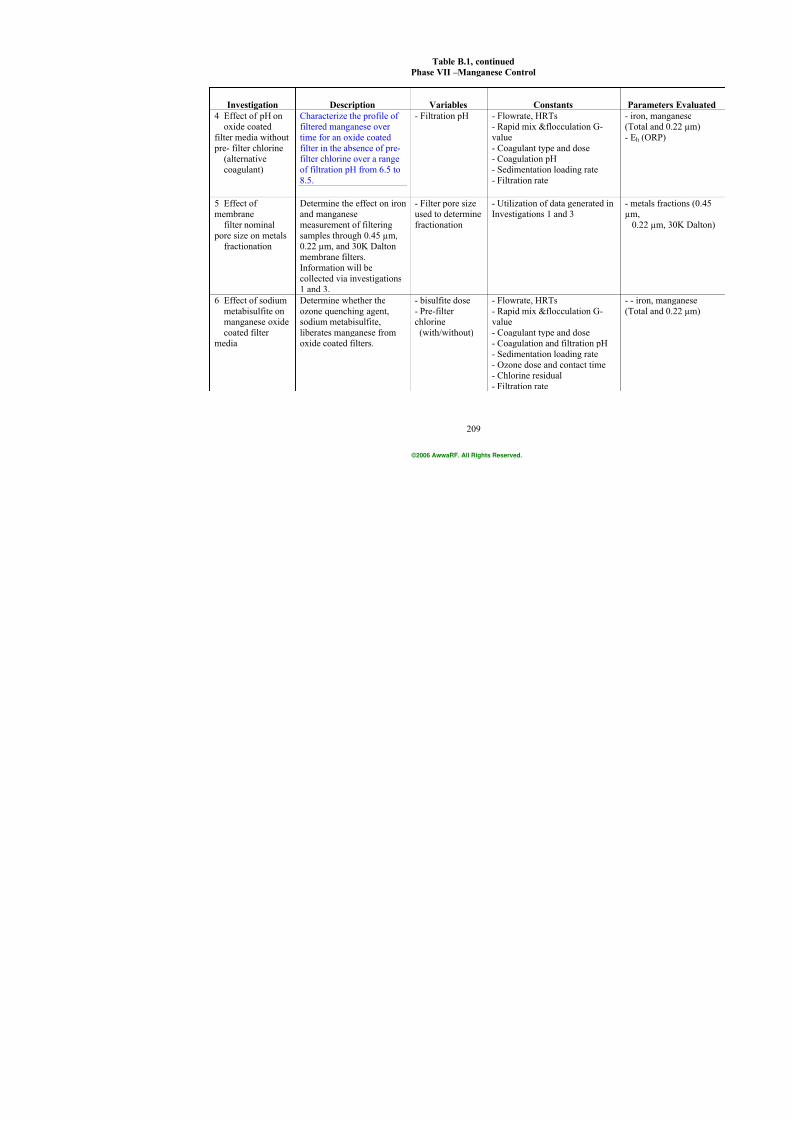
7/21/2019 Occurrence of Manganese in Drinking Water and Manganese Control
http://slidepdf.com/reader/full/occurrence-of-manganese-in-drinking-water-and-manganese-control 235/463
209
Table B.1, continued
Phase VII –Manganese Control
Investigation Description Variables Constants
4 Effect of pH onoxide coated
filter media without
pre- filter chlorine(alternative
coagulant)
Characterize the profile offiltered manganese over
time for an oxide coated
filter in the absence of pre-filter chlorine over a range
of filtration pH from 6.5 to
8.5.
- Filtration pH - Flowrate, HRTs- Rapid mix &flocculation G-
value
- Coagulant type and dose- Coagulation pH
- Sedimentation loading rate
- Filtration rate
5 Effect ofmembrane
filter nominal
pore size on metalsfractionation
Determine the effect on ironand manganese
measurement of filtering
samples through 0.45 µm,0.22 µm, and 30K Dalton
membrane filters.
Information will be
collected via investigations1 and 3.
- Filter pore sizeused to determine
fractionation
- Utilization of data generated Investigations 1 and 3
6 Effect of sodium
metabisulfite onmanganese oxide
coated filtermedia
Determine whether the
ozone quenching agent,sodium metabisulfite,
liberates manganese fromoxide coated filters.
- bisulfite dose
- Pre-filterchlorine
(with/without)
- Flowrate, HRTs
- Rapid mix &flocculation G-value
- Coagulant type and dose- Coagulation and filtration pH
- Sedimentation loading rate- Ozone dose and contact time- Chlorine residual
- Filtration rate
©2006 AwwaRF. All Rights Reserved.
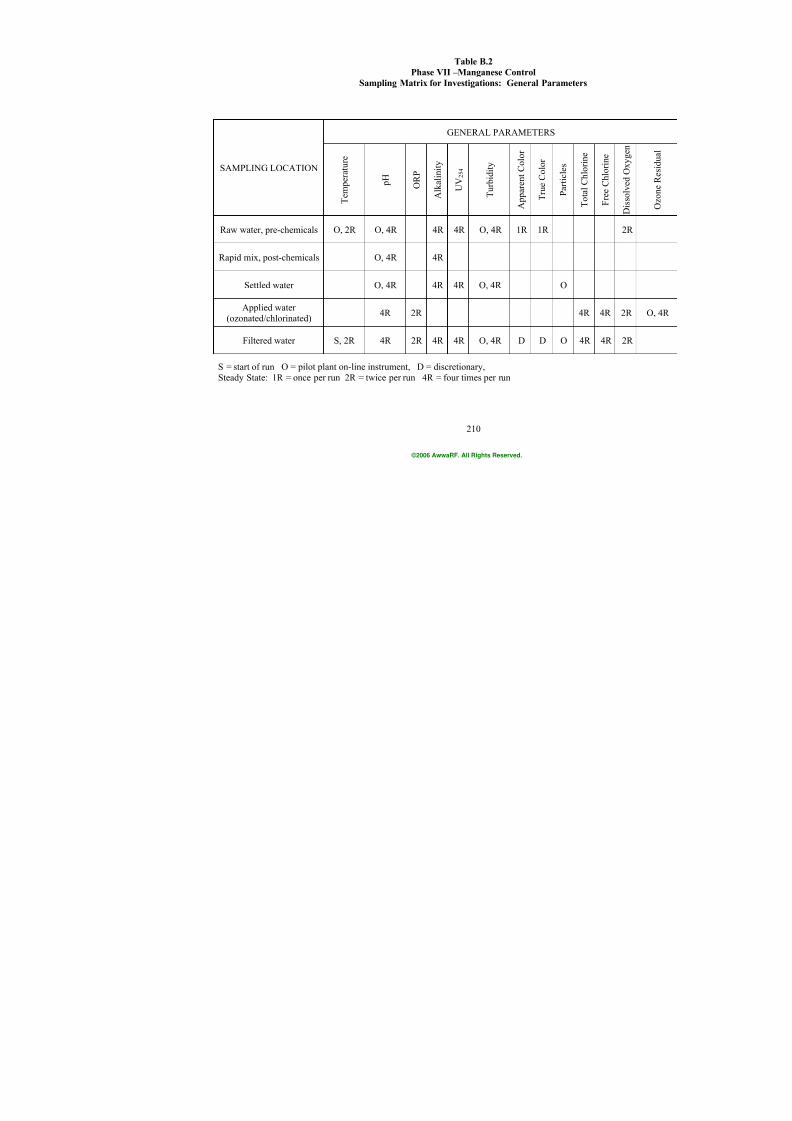
7/21/2019 Occurrence of Manganese in Drinking Water and Manganese Control
http://slidepdf.com/reader/full/occurrence-of-manganese-in-drinking-water-and-manganese-control 236/463
210
Table B.2
Phase VII –Manganese Control
Sampling Matrix for Investigations: General Parameters
GENERAL PARAMETERS
SAMPLING LOCATION
T e m p e r a t u r e
p H
O R P
A l k a l i n i t y
U V 2 5 4
T u r b i d i t y
A p p a r e n t C o l o r
T r u e C o l o r
P a r t i c l e s
T o t a l C h l o r i n e
F r e e C h l o r i n e
Raw water, pre-chemicals O, 2R O, 4R 4R 4R O, 4R 1R 1R
Rapid mix, post-chemicals O, 4R 4R
Settled water O, 4R 4R 4R O, 4R O
Applied water
(ozonated/chlorinated)4R 2R 4R 4R
Filtered water S, 2R 4R 2R 4R 4R O, 4R D D O 4R 4R
S = start of run O = pilot plant on-line instrument, D = discretionary,
Steady State: 1R = once per run 2R = twice per run 4R = four times per run
©2006 AwwaRF. All Rights Reserved.
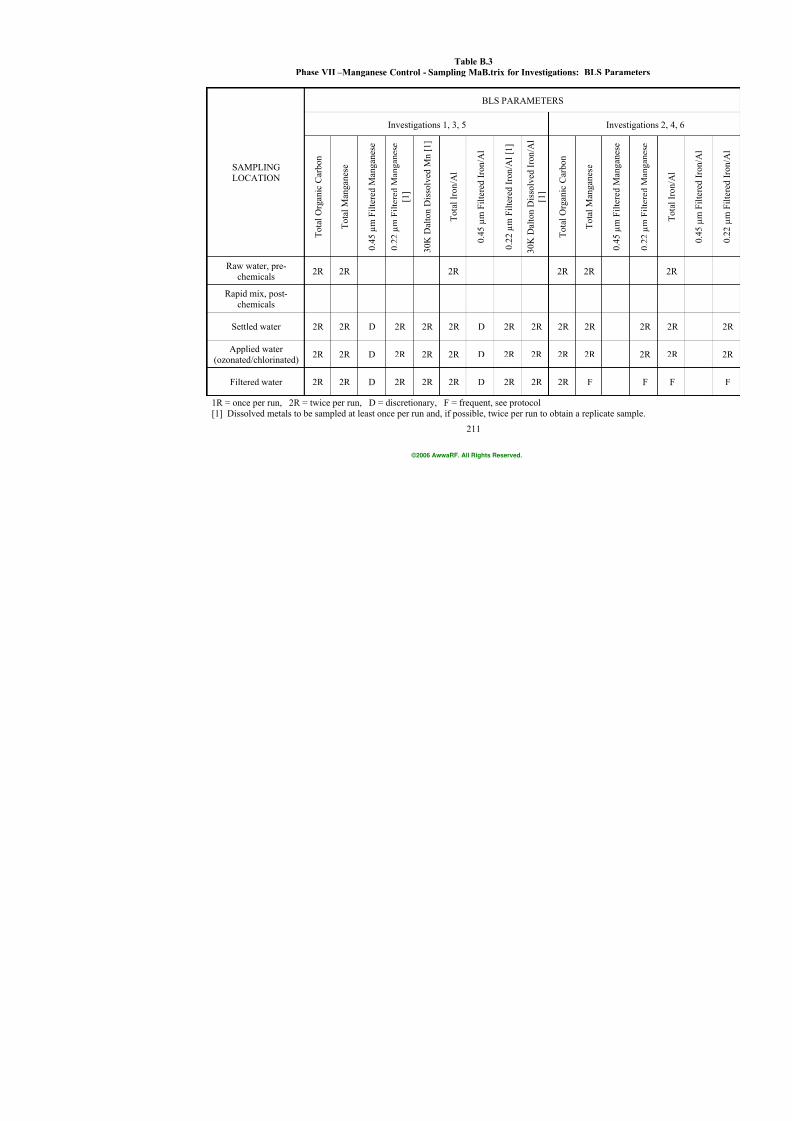
7/21/2019 Occurrence of Manganese in Drinking Water and Manganese Control
http://slidepdf.com/reader/full/occurrence-of-manganese-in-drinking-water-and-manganese-control 237/463
211
Table B.3
Phase VII –Manganese Control - Sampling MaB.trix for Investigations: BLS
BLS PARAMETERS
Investigations 1, 3, 5
SAMPLING
LOCATION
T
o t a l O r g a n i c C a r b o n
T o t a l M a n g a n e s e
0 . 4 5
µ m F i l t e r e d M a n g a n e s e
0 . 2 2
µ m F i l t e r e d M a n g a n e s e
[ 1 ]
3 0 K
D a l t o n D i s s o l v e d M n [ 1 ]
T o t a l I r o n / A l
0 . 4 5 µ m F i l t e r e d I r o n / A l
0 . 2 2
µ m F i l t e r e d I r o n / A l [ 1 ]
3 0 K D a l t o n D i s s o l v e d I r o n / A l
[ 1 ]
T
o t a l O r g a n i c C a r b o n
T o t a l M a n g a n e s e
Raw water, pre-
chemicals2R 2R 2R 2R 2R
Rapid mix, post-
chemicals
Settled water 2R 2R D 2R 2R 2R D 2R 2R 2R 2R
Applied water
(ozonated/chlorinated) 2R 2R D 2R 2R 2R D 2R 2R 2R 2R
Filtered water 2R 2R D 2R 2R 2R D 2R 2R 2R F
1R = once per run, 2R = twice per run, D = discretionary, F = frequent, see protocol
[1] Dissolved metals to be sampled at least once per run and, if possible, twice per run to obtain a replica
©2006 AwwaRF. All Rights Reserved.
7/21/2019 Occurrence of Manganese in Drinking Water and Manganese Control
http://slidepdf.com/reader/full/occurrence-of-manganese-in-drinking-water-and-manganese-control 238/463
212
OXIDATION REDUCTION POTENTIAL (ORP), STANDARD METHOD 2580
1.0 This SOP provides guidance for the determination of oxidation-reduction
potential in clean water.2.0 Detection limits
The lowest possible value for ORP is X millivolts.
3.0 Scope and Application3.1 The following discussion is given in Standard Methods for the Examination of
Water and Wastewater, 19th ed. “Oxidation and reduction reactions mediate the behavior of
many chemical constituents in drinking, process and wastewaters as well as most aquaticcompartments of the environment. The reactivities and mobilities of important elements in
biological systems (e.g. Fe, S, N and C) as well as those of a number of other metallic elements,
depend strongly on redox conditions. Reactions involving both electrons and protons are both
pH- and Eh-dependent; therefore, chemical reactions in aqueous media often can be characterized by pH and Eh together with the activity of dissolved chemical species. Like pH, Eh represents an
intensity factor. It does not characterize the capacity (i.e., poise) of the system for oxidation or
reduction…Eh values measured in the field correlate poorly with Eh values calculated from the
redox couples present. Nevertheless, measurement of redox potential, when properly performedand interpreted, is useful in developing a more complete understanding of water chemistry.”
3.2 This laboratory uses a combination platinum electrode and reference electrode.4.0 Summary of Method
5.0 Definitions
5.1 The following discussion is given in Standard Methods for the Examination of
Water and Wastewater, 19th ed. “Electrometric measurements are made by potentiometricdetermination of electron activity (or intensity) with an inert indicator electrode and a suitable
reference electrode. Ideally, the indicator electrode will serve as either an electron donor or
acceptor with respect to electroactive oxidized or reduced species in solution. At redoxequilibrium, the potential difference between the ideal indicator electrode and the reference
electrode equals the redox potential of the system. However, inert indicator electrodes that behave ideally in all aqueous systems, particularly in natural waters, do not exist. Electrodes
made of platinum are most commonly used for Eh measurements. They have limitations, as do
alternative materials such as gold and graphite.”6.0 Interferences
6.1 Contamination of the electrode sufrace, salt bridge or internal electrolyte in the
case of reference electrodes can lead to excessive drift and poor performance. Organic matter,sulfide and bromide may cause these problems. If problems persist after cleaning, discard the
electrode.
6.2 Redox potential is sensitive to pH if hydrogen or hydroxide ion are involved in
the redox half-cells. Cell potentials tend to increase as pH decreases, and vice-versa.
6.3 Sample handling and preservation will govern the sample’s resistance to changesin redox potential. Under clean water conditions, handle reduced samples very carefully to avoid
exposure to atmospheric oxygen. Samples cannot be stored or preserved; analyze at sampling.6.4 Obtain the Eh standard solution reading for the electrode pair at a temperature as
close as possible to that of the sample. Temperature determines the Eh reference potential for a
particular solution and electrode pair. It also may affect the reversibility of the redox reaction,the magnitude of the exchange current, and the stability of the apparent redox potential reading,
©2006 AwwaRF. All Rights Reserved.
7/21/2019 Occurrence of Manganese in Drinking Water and Manganese Control
http://slidepdf.com/reader/full/occurrence-of-manganese-in-drinking-water-and-manganese-control 239/463
213
particularly in poorly poised solutions. Hold temperature constant for all measurements and
report it with Eh results.
7.0 Safety7.1 Saftey glasses and gloves should be worn when handling chemicals and during
sample analysis.
7.2 ZoBell’s solution, the check standard reagent, contains cyanide. This chemical
should be handled carefully and contact with the chemical should be minimal.8.0 Equipment and Supplies
8.1 Inert metal electrode and reference electrode capable of measuring ORP. This
laboratory currently uses an Accumet Platinum/Ag-AgCl combination electrode, Fisher catalognumber 13-620-81 (Fisher Scientific, Pittsburgh, PA)
8.2 pH/ISE meter. This lab currently uses the Denver Instruments model 225 pH/ISE
meter with automatic temperature compensation (ATC).8.3 Beakers, preferably polyethylene or Teflon.
8.4 Magnetic stirrer and stirring bars.
8.5 Kimwipes. Kimwipes EX-L for blotting dry electrode bulb after use.8.6 KCl electrode filling solution. This electrode requires the use of 4M KCl.
8.7 Plastic squeeze bottle for rinsing electrode with deionized water.
9.0 Reagents and Standards9.1 ZoBell’s solution. This contains 1.4080 g potassium ferrocyanide, 1.0975 g
potassium ferricyanide and 7.4555 g potassium chloride per 1000 mL deionized water. This
solution will be prepared by the Bureau of Laboratory Services as needed.
9.2 Deionized water for rinsing electrodes.10.0 Sample Collection, Preservation, Shipment and Storage.
11.1. Sample containers and preservation
10.1.1.1 Samples should be collected in a glass BOD bottle with stopper. The bottle should be full with no air space.
10.1.1.2 Samples should be analyzed within ten minutes of collection.11.0 Quality Control
11.1 All quality control data should be maintained and available for easy reference orinspection.
11.2 Follow manufacturer’s instructions on preparation of the electrode.
11.3 Quality control checks will be performed with ZoBell’s solution. The potential of
this solution changes as a function of temperature, and can be calculated from Eh = [0.428 –
0.022 (T – 25)] * 1000, where T is the solution temperature in degrees Celsius. If the measured potential is more than +/- 10 mV from this value, perform electrode cleaning procedure and
repeat analysis.
12.0 Calibration and Standardization12.1 Calibration steps are specific to the pH meter currently in use in this laboratory
(Denver Instrument Model 225 pH/ISE meter). If the make or model of meter changes, consult
the meter’s instruction manual for detailed calibration instructions. For this make and model,there are no calibration procedures specific to ORP.
12.2 Standardization steps are specific to the pH meter currently in use in this
laboratory (Denver Instrument Model 225 pH/ISE meter). If the make or model of meter
changes, consult the meter’s instruction manual for detailed calibration instructions.12.2.1 Initial Setup
©2006 AwwaRF. All Rights Reserved.
7/21/2019 Occurrence of Manganese in Drinking Water and Manganese Control
http://slidepdf.com/reader/full/occurrence-of-manganese-in-drinking-water-and-manganese-control 240/463
214
12.2.1.1 Follow manufacturer’s instructions for initial setup of the Accumet
combination Platinum/Ag-AgCl electrode.
12.2.1.2 After the probe has been connected to the meter, turn the meter on.12.2.1.3 Press the “Standardize” button. Press “4” for mV options menu.
12.2.1.4 Press the “Standardize” button. Press “4” for mV options menu.
12.2.1.5 Press “1” for resolution- set to 1 mV.
12.2.1.6 Press “2” for stability criteria- set to medium12.2.1.7 Press “3” for signal averaging- set to medium
12.2.1.8 Press “6” to return to the standardization menu. Press “Mode” to return to
mV mode.12.2.1.9 The above steps only need to be repeated if the meter has been turned off.
12.2.2 Check standard
12.2.2.1 Remove black plastic end protector from the electrode.12.2.2.2 Very gently polish the platinum wire with Bon Ami and a q-tip.
12.2.2.3 Rinse electrode thoroughly with DI water.
12.2.2.4 Replace the black plastic end protector.12.2.2.5 Place the electrode in a beaker of ZoBell’s solution, and provide moderate
stirring.
12.2.2.6 After allowing the reading to stabilize, record the mV value and thetemperature.
12.2.2.7 The recorded value should be within +/- 10 mV of the calculated value for
ZoBell’s solution at the recorded temperature. This value can be calculated by Eh = [0.428 –
0.0022 (T – 25)] * 1000. A table of values for various temperatures will be provided for easyreference.
12.2.2.8 If the recorded value is not within the desired range, repeat analysis with a
fresh sample. If the value is still not within range, change electrode filling solution and repeatanalysis. If still not within range, perform electrode cleaning procedure. If still not within range,
discard the electrode and begin analysis with new electrode.12.2.2.9 After analysis, rinse electrode with DI water and place electrode in storage
solution.13.0 Procedure13.1 Once daily, analyze the check standard using the procedure found in section 13.
Ensure that the check standard is within range.
13.2 Remove the electrode from the storage solution. Rinse electrode thoroughly over
a waste beaker with DI water from a plastic squeeze bottle. Gently blot electrode with aKimwipe.
13.3 Immerse the electrode in the first sample, and provide moderate stirring.
13.4 Allow approximately 1 minute for the reading to stabilize. Once the reading hasstabilized, record the mV and temperature for the sample.
13.5 Rinse and repeat for the remaining samples.
13.6 After the last sample in a batch has been analyzed, rinse the electrode thoroughlywith DI water, blot and return the electrode to the storage solution.
14.0 Calculations
14.1 Report millivolt values to the nearest 1.0 mV, and temperature to the nearest °C.
15.0 Method Performance15.1 MDLs?
©2006 AwwaRF. All Rights Reserved.
7/21/2019 Occurrence of Manganese in Drinking Water and Manganese Control
http://slidepdf.com/reader/full/occurrence-of-manganese-in-drinking-water-and-manganese-control 241/463
215
15.2 If electrode response becomes sluggish, perform electrode cleaning procedure.
16.0 Data Assessment and Acceptance Criteria for QC Measures
16.1 All QQ measures shall be assessed and evaluated on an ongoing basis and QCacceptance criteria, which follow, shall be used to determine the acceptability of the data.
16.1.1 Quality control checks should be within +/- 10 mV of the expected value.
17.0 Corrective Actions for Unacceptable Data
17.1 Corrective actions for each QC check follow:17.1.1 Discard check standard and replace with fresh aliquot. Recalibrate. If still
outside of acceptable range, replace electrode filling solution. Recalibrate. If still outside range,
perform electrode cleaning procedure. Recalibrate. If still outside range, discard electrode and begin procedure with new electrode.
18.0 Contingencies for Handling Unacceptable Data
18.1 Samples may be reported only if the quality control measures are met. If the QCcheck is found to be unacceptable, no data associated with the failed criteria is to be reported.
19.0 Troubleshooting
19.1 Meter will not operate. Possible causes: Line/cord may not be firmly connectedto electrical outlet. Solution: Firmly connect cord to outlet.
19.2 Noisy or drifting readings. Possible causes: 1) electrode not plugged into proper
terminal 2) electrode plugs not seated properly 3) reference electrode solution is low, empty orcrystallized 4) cracked, broken or faulty electrode 5) solutions to be tested are at varioustemperatures 6) lack of insulator between beaker and stirrer 7) stirring: none, too fast or too slow.
Solutions: 1) plug electrode into designated terminal 2) firmly reseat electrode plug 3) maintain
electrode filling solution level as described in Accumet instructions and see section 20.3 4)replace electrode 5) not applicable here 6) place an insulator mat between beaker and stirrer 7)
stir at a constant, moderate rate.
19.3 Sluggish Response. If electrode performance becomes sluggish or you experienceexcessive drift, perform the electrode cleaning procedure as described below:
19.3.1 Carefully polish the metallic platinum wire with Bon Ami. Rinse with DI and blot dry.
19.3.2 Repeat the above procedure until performance improves.19.3.3 If the above procedure did not help, the following has been useful for restoring
electrode performance after long periods of use:
19.3.3.1 Mix 1 volume concentrated nitric acid with 3 volumes concentrated
hydrochloric acid. NOTE: This should be done under a fume hood.
19.3.3.2 Immerse the electrode in this solution for 1-2 minutes.19.3.3.3 Rinse thoroughly with DI water and blot dry.
19.3.3.4 If the electrode is broken or cracked, replace electrode.
19.3.4 Check standard out of range. Possible causes: 1) cracked or broken electrode 2)dirty electrode 3) lack of insulator between stirrer and beaker. Solutions: 1) replace electrode 2)
Discard check standard and replace with fresh aliquot. Recalibrate. If still outside of acceptable
range, replace electrode filling solution. Recalibrate. If still outside range, perform electrodecleaning procedure. Recalibrate. If still outside range, discard electrode and begin procedure
with new electrode. 3) place insulator mat between beaker and stirrer.
20.0 References
20.1 Standard Operating Procedures for Determination of Alkalinity by Tirtration to pH 4.5. Philadelphia Water Department Bureau of Laboratory Services, January 25, 2002.
©2006 AwwaRF. All Rights Reserved.
7/21/2019 Occurrence of Manganese in Drinking Water and Manganese Control
http://slidepdf.com/reader/full/occurrence-of-manganese-in-drinking-water-and-manganese-control 242/463
216
20.2 Standard Methods for the Examination of Water and Wastewater, 18th ed.
Oxidation-Reduction Potential (2580) Measurement in Clean Water
20.3 Denver Instruments Model 225 pH/ISE meter Operation Manual, 301127.1 Rev.D.
20.4 Accumet Instructions for Platinum Electrodes, models 13-620-82 or 13-620-115.
CASE STUDY (II) PROTOCOL
COMPARISON OF ANTHRACITE VS GAC FILTERS FOR MN
REMOVAL IN ONE TREATMENT PLANT
The Huntington Water Treatment Plant treats water for drinking-water compliance usingtraditional treatment techniques. Prior to the D/DBP Rule they coagulated at a high pH and
relied on GAC filter to reduce Taste and Odor compounds. They have changed their operational
practices to remove more TOC via coagulation and moved the initial point of chlorination further back into their water treatment process.
Water from the Ohio River is pumped into a holding reservoir where solids are allowedto settle. Following the initial settling of solids, sulfuric acid (to enhance removal of TOC incoagulation), ferric sulfate (coagulant) and a polymer coagulant aid are added at the mixing tank,
before the water splits into two settling basins. In each of the settling basins, there are four
flocculation chambers consisting of baffling, settling, and plate settlers. As the water leaves the
sedimentation basin, caustic is added to increase the pH to ∼ 7.0, followed by addition of a filter
aid and chlorine. The addition of chlorine (2 mg/L) prior to filtration aids in Mn oxidation andsubsequent removal via filtration. To remove taste and odor causing organics, the plant has
historically used GAC filters and had twelve of these on site. Recently, one of the GAC filterswas replaced with anthracite. Depending on other water quality parameters, occasionally some
Mn (which we think remains dissolved) passes through the filter even with the raising of pH and
addition of chlorine. The Mn that does pass through the filters manifests itself in increasedturbidity in the clearwell. There is no chlorine residual leaving the GAC filters. Since a chlorine
residual can be maintained across an anthracite filter, making it better filter for removal of Mn,
one of filter has been changed to anthracite.
By comparing the levels of Mn in the sedimentation effluent with the water in the filter
effluents of the anthracite filter and an adjacent GAC filter, we will compare directly the
performance of the two filter types on Mn removal ability. Because the only variable in the filtereffluent samples will be the filters themselves, this study will allow for a direct full-scale
comparison of Mn removal efficiency between the two filter types.
As a result of conducting the detailed survey and continued dialogue with SandraJohnson it was thought that the amount of alkalinity in the process water has something to do
with the efficacy of Mn removal. It seems that the more alkalinity that is in the water the betterremoval they achieve. This was supported by an observation that at very low source water
alkalinity, alkalinity so low that treatment cannot be conducted, they add lime pre rapid mix.
During these times, Mn removal is much.
©2006 AwwaRF. All Rights Reserved.

7/21/2019 Occurrence of Manganese in Drinking Water and Manganese Control
http://slidepdf.com/reader/full/occurrence-of-manganese-in-drinking-water-and-manganese-control 243/463
217
Three sampling events will occur during this study. Ideally, the sampling will capture a
wide range of source water alkalinity conditions, although limited time and resources will limitthe plant staff’s ability to wait, watch, and capture samples during instances of specific water
quality criteria.
The plant treatment process schematic is presented in Figure B.3.
©2006 AwwaRF. All Rights Reserved.
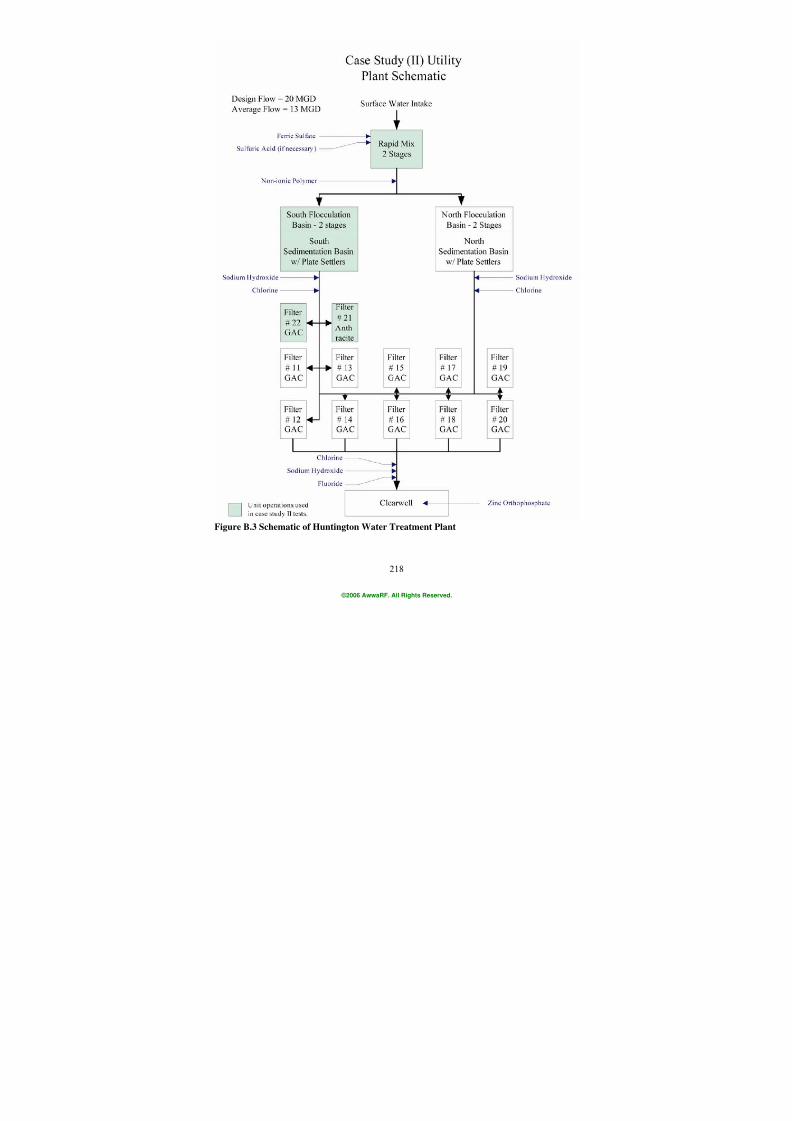
7/21/2019 Occurrence of Manganese in Drinking Water and Manganese Control
http://slidepdf.com/reader/full/occurrence-of-manganese-in-drinking-water-and-manganese-control 244/463
218
Figure B.3 Schematic of Huntington Water Treatment Plant
©2006 AwwaRF. All Rights Reserved.
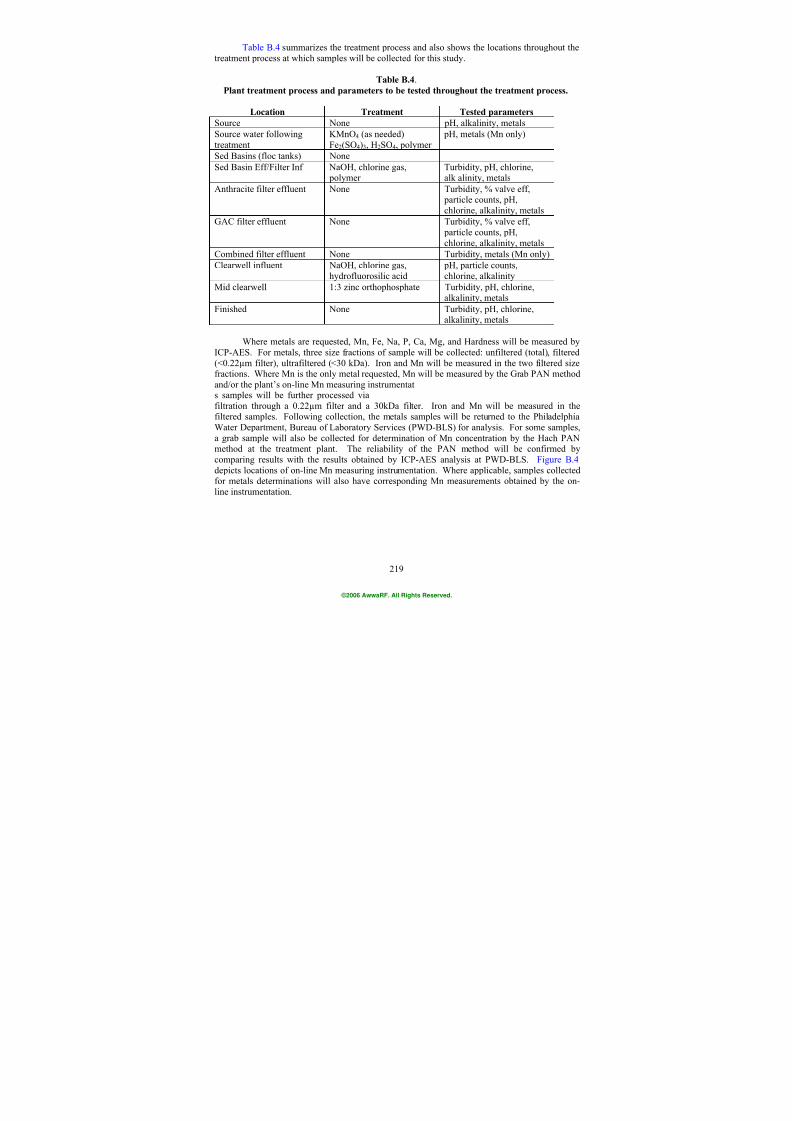
7/21/2019 Occurrence of Manganese in Drinking Water and Manganese Control
http://slidepdf.com/reader/full/occurrence-of-manganese-in-drinking-water-and-manganese-control 245/463
219
Table B.4 summarizes the treatment process and also shows the locations throughout the
treatment process at which samples will be collected for this study.
Table B.4.
Plant treatment process and parameters to be tested throughout the treatment process.
Location Treatment Tested parameters
Source None pH, alkalinity, metals
Source water following
treatment
KMnO4 (as needed)
Fe2(SO4)3, H2SO4, polymer
pH, metals (Mn only)
Sed Basins (floc tanks) None
Sed Basin Eff/Filter Inf NaOH, chlorine gas, polymer
Turbidity, pH, chlorine,alk alinity, metals
Anthracite filter effluent None Turbidity, % valve eff, particle counts, pH,
chlorine, alkalinity, metals
GAC filter effluent None Turbidity, % valve eff,
particle counts, pH,
chlorine, alkalinity, metals
Combined filter effluent None Turbidity, metals (Mn only)
Clearwell influent NaOH, chlorine gas,
hydrofluorosilic acid
pH, particle counts,
chlorine, alkalinity
Mid clearwell 1:3 zinc orthophosphate Turbidity, pH, chlorine,
alkalinity, metals
Finished None Turbidity, pH, chlorine,alkalinity, metals
Where metals are requested, Mn, Fe, Na, P, Ca, Mg, and Hardness will be measured by
ICP-AES. For metals, three size fractions of sample will be collected: unfiltered (total), filtered(<0.22µm filter), ultrafiltered (<30 kDa). Iron and Mn will be measured in the two filtered sizefractions. Where Mn is the only metal requested, Mn will be measured by the Grab PAN method
and/or the plant’s on-line Mn measuring instrumentat s samples will be further processed via
filtration through a 0.22µm filter and a 30kDa filter. Iron and Mn will be measured in thefiltered samples. Following collection, the metals samples will be returned to the Philadelphia
Water Department, Bureau of Laboratory Services (PWD-BLS) for analysis. For some samples,
a grab sample will also be collected for determination of Mn concentration by the Hach PANmethod at the treatment plant. The reliability of the PAN method will be confirmed by
comparing results with the results obtained by ICP-AES analysis at PWD-BLS. Figure B.4
depicts locations of on-line Mn measuring instrumentation. Where applicable, samples collectedfor metals determinations will also have corresponding Mn measurements obtained by the on-
line instrumentation.
©2006 AwwaRF. All Rights Reserved.
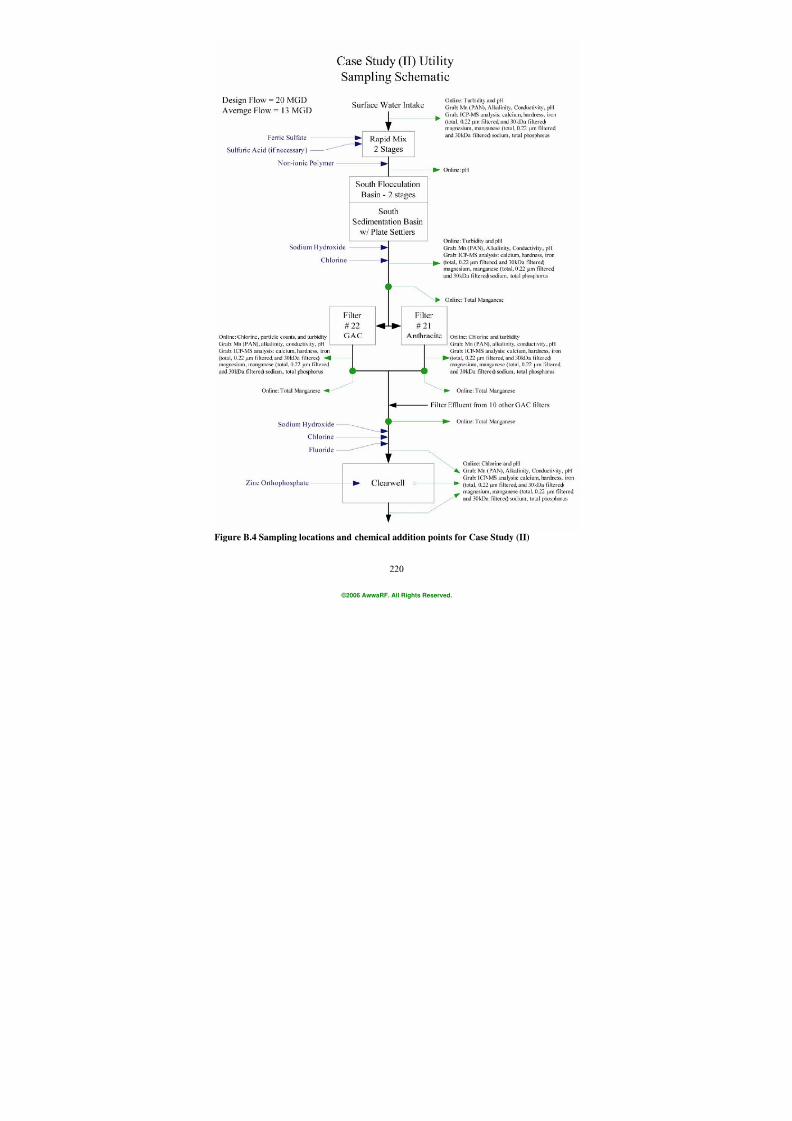
7/21/2019 Occurrence of Manganese in Drinking Water and Manganese Control
http://slidepdf.com/reader/full/occurrence-of-manganese-in-drinking-water-and-manganese-control 246/463
220
Figure B.4 Sampling locations and chemical addition points for Case Study (II)
©2006 AwwaRF. All Rights Reserved.
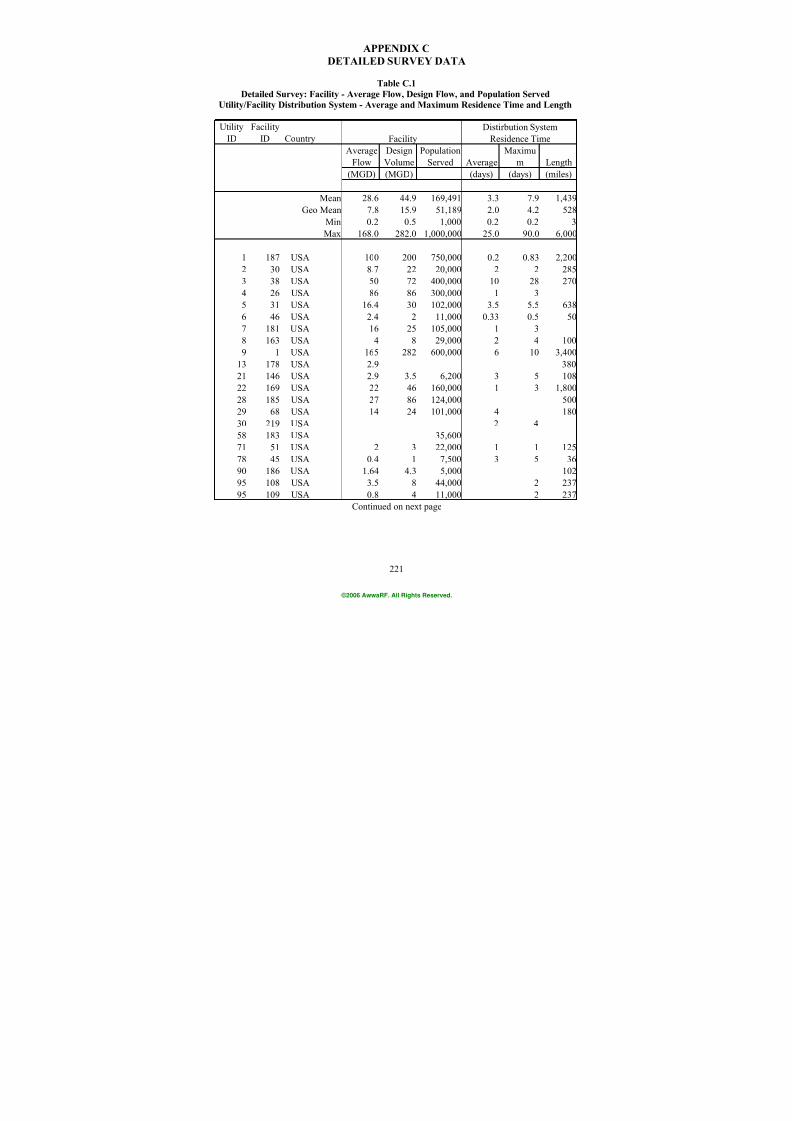
7/21/2019 Occurrence of Manganese in Drinking Water and Manganese Control
http://slidepdf.com/reader/full/occurrence-of-manganese-in-drinking-water-and-manganese-control 247/463
221
APPENDIX C
DETAILED SURVEY DATA
Table C.1
Detailed Survey: Facility - Average Flow, Design Flow, and Population Served
Utility/Facility Distribution System - Average and Maximum Residence Time and Length
Utility
ID
Facility
ID Country
Average
Flow
Design
Volume
Population
Served Average
Maximu
m Length
(MGD) (MGD) (days) (days) (miles)
Mean 28.6 44.9 169,491 3.3 7.9 1,439
Geo Mean 7.8 15.9 51,189 2.0 4.2 528
Min 0.2 0.5 1,000 0.2 0.2 3
Max 168.0 282.0 1,000,000 25.0 90.0 6,000
1 187 USA 100 200 750,000 0.2 0.83 2,200
2 30 USA 8.7 22 20,000 2 2 285
3 38 USA 50 72 400,000 10 28 270
4 26 USA 86 86 300,000 1 3
5 31 USA 16.4 30 102,000 3.5 5.5 638
6 46 USA 2.4 2 11,000 0.33 0.5 50
7 181 USA 16 25 105,000 1 3
8 163 USA 4 8 29,000 2 4 100
9 1 USA 165 282 600,000 6 10 3,40013 178 USA 2.9 380
21 146 USA 2.9 3.5 6,200 3 5 108
22 169 USA 22 46 160,000 1 3 1,800
28 185 USA 27 86 124,000 500
29 68 USA 14 24 101,000 4 180
30 219 USA 2 4
58 183 USA 35,600
71 51 USA 2 3 22,000 1 1 125
78 45 USA 0.4 1 7,500 3 5 36
90 186 USA 1.64 4.3 5,000 10295 108 USA 3.5 8 44,000 2 237
95 109 USA 0.8 4 11,000 2 237
Facility
Distirbution System
Residence Time
Continued on next page
©2006 AwwaRF. All Rights Reserved.
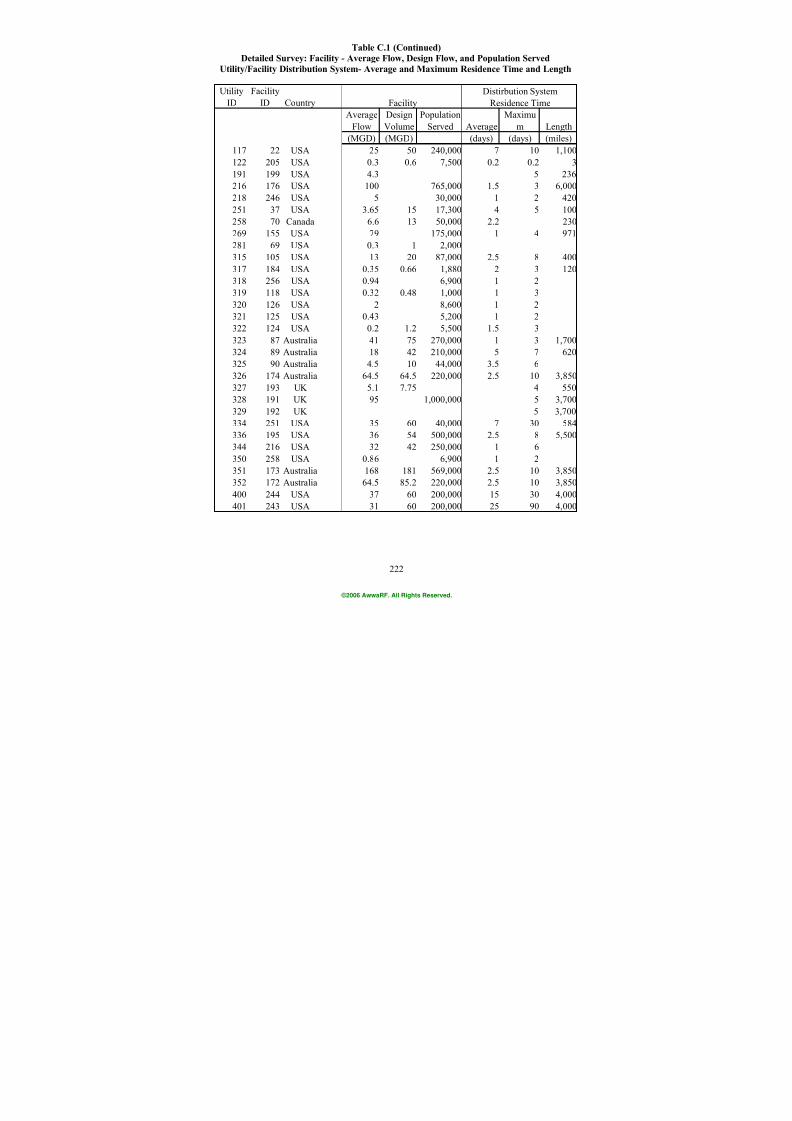
7/21/2019 Occurrence of Manganese in Drinking Water and Manganese Control
http://slidepdf.com/reader/full/occurrence-of-manganese-in-drinking-water-and-manganese-control 248/463
222
Table C.1 (Continued)
Detailed Survey: Facility - Average Flow, Design Flow, and Population Served
Utility/Facility Distribution System- Average and Maximum Residence Time and Length
Utility
ID
Facility
ID Country
AverageFlow
DesignVolume
PopulationServed Average
Maximum Length
(MGD) (MGD) (days) (days) (miles)
117 22 USA 25 50 240,000 7 10 1,100
122 205 USA 0.3 0.6 7,500 0.2 0.2 3
191 199 USA 4.3 5 236
216 176 USA 100 765,000 1.5 3 6,000
218 246 USA 5 30,000 1 2 420
251 37 USA 3.65 15 17,300 4 5 100
258 70 Canada 6.6 13 50,000 2.2 230
269 155 USA 79 175,000 1 4 971281 69 USA 0.3 1 2,000
315 105 USA 13 20 87,000 2.5 8 400
317 184 USA 0.35 0.66 1,880 2 3 120
318 256 USA 0.94 6,900 1 2
319 118 USA 0.32 0.48 1,000 1 3
320 126 USA 2 8,600 1 2
321 125 USA 0.43 5,200 1 2
322 124 USA 0.2 1.2 5,500 1.5 3
323 87 Australia 41 75 270,000 1 3 1,700
324 89 Australia 18 42 210,000 5 7 620325 90 Australia 4.5 10 44,000 3.5 6
326 174 Australia 64.5 64.5 220,000 2.5 10 3,850
327 193 UK 5.1 7.75 4 550
328 191 UK 95 1,000,000 5 3,700
329 192 UK 5 3,700
334 251 USA 35 60 40,000 7 30 584
336 195 USA 36 54 500,000 2.5 8 5,500
344 216 USA 32 42 250,000 1 6
350 258 USA 0.86 6,900 1 2
351 173 Australia 168 181 569,000 2.5 10 3,850352 172 Australia 64.5 85.2 220,000 2.5 10 3,850
400 244 USA 37 60 200,000 15 30 4,000
401 243 USA 31 60 200,000 25 90 4,000
Facility
Distirbution System
Residence Time
©2006 AwwaRF. All Rights Reserved.
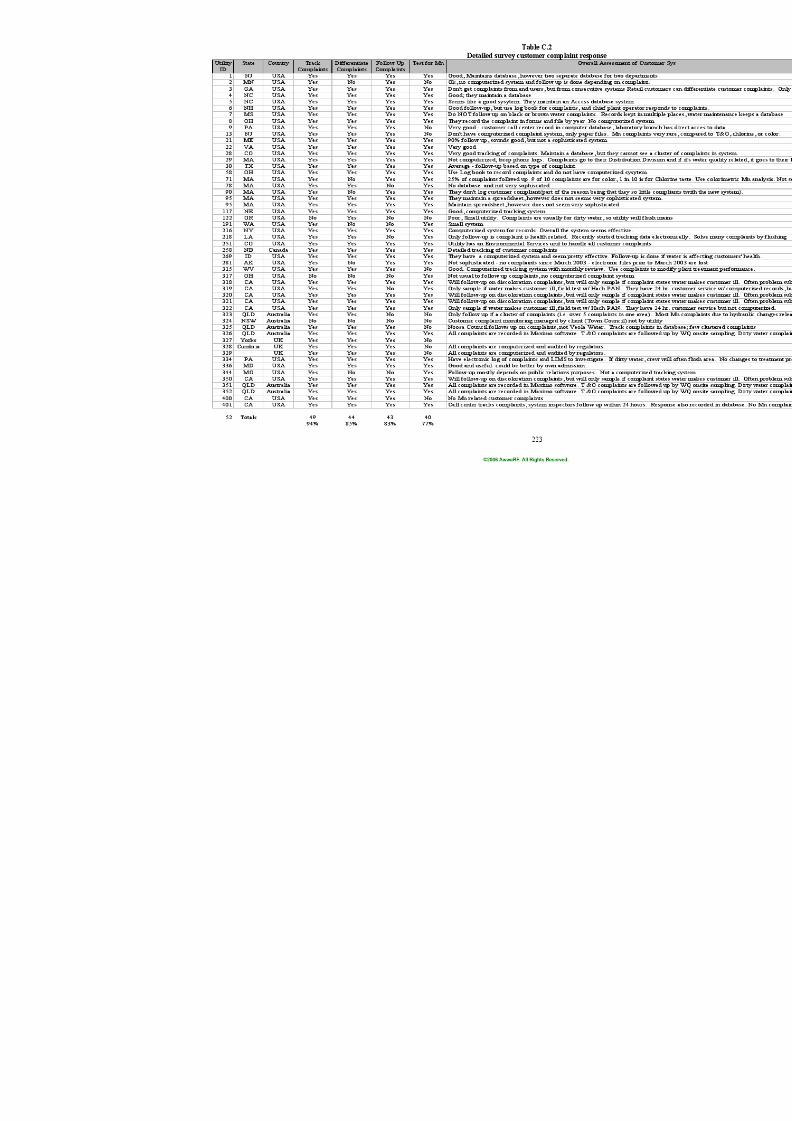
7/21/2019 Occurrence of Manganese in Drinking Water and Manganese Control
http://slidepdf.com/reader/full/occurrence-of-manganese-in-drinking-water-and-manganese-control 249/463
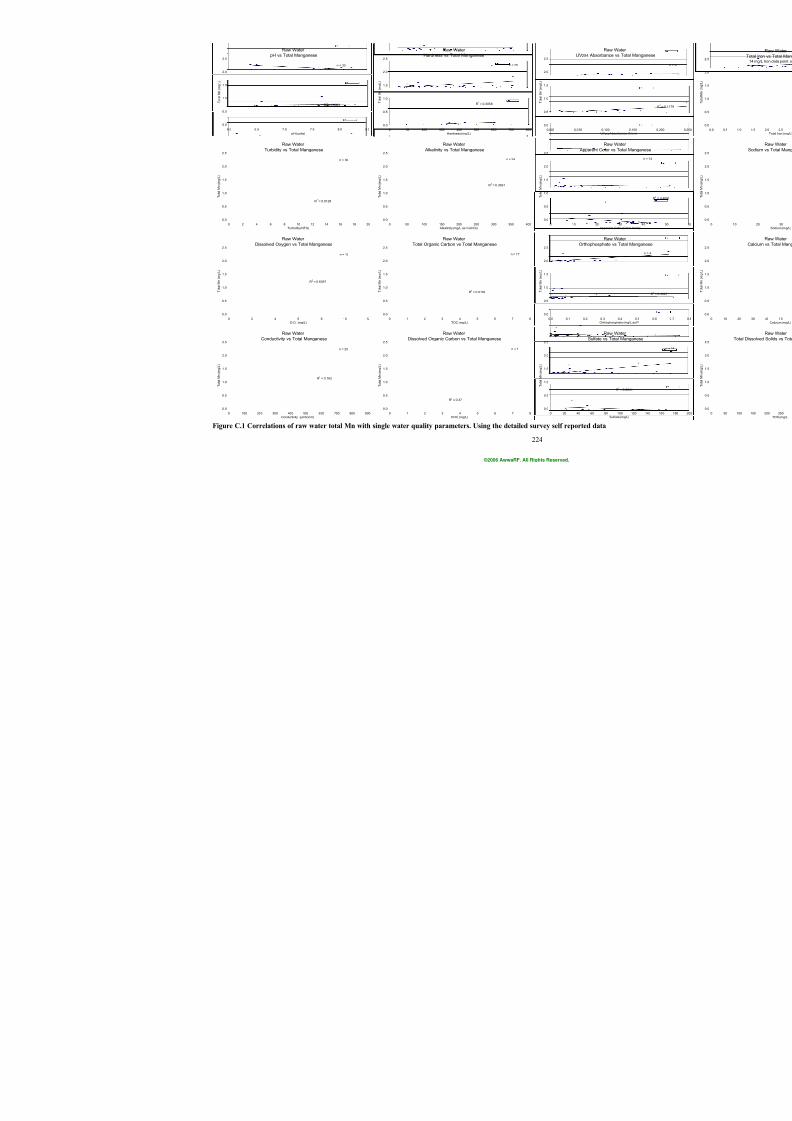
7/21/2019 Occurrence of Manganese in Drinking Water and Manganese Control
http://slidepdf.com/reader/full/occurrence-of-manganese-in-drinking-water-and-manganese-control 250/463
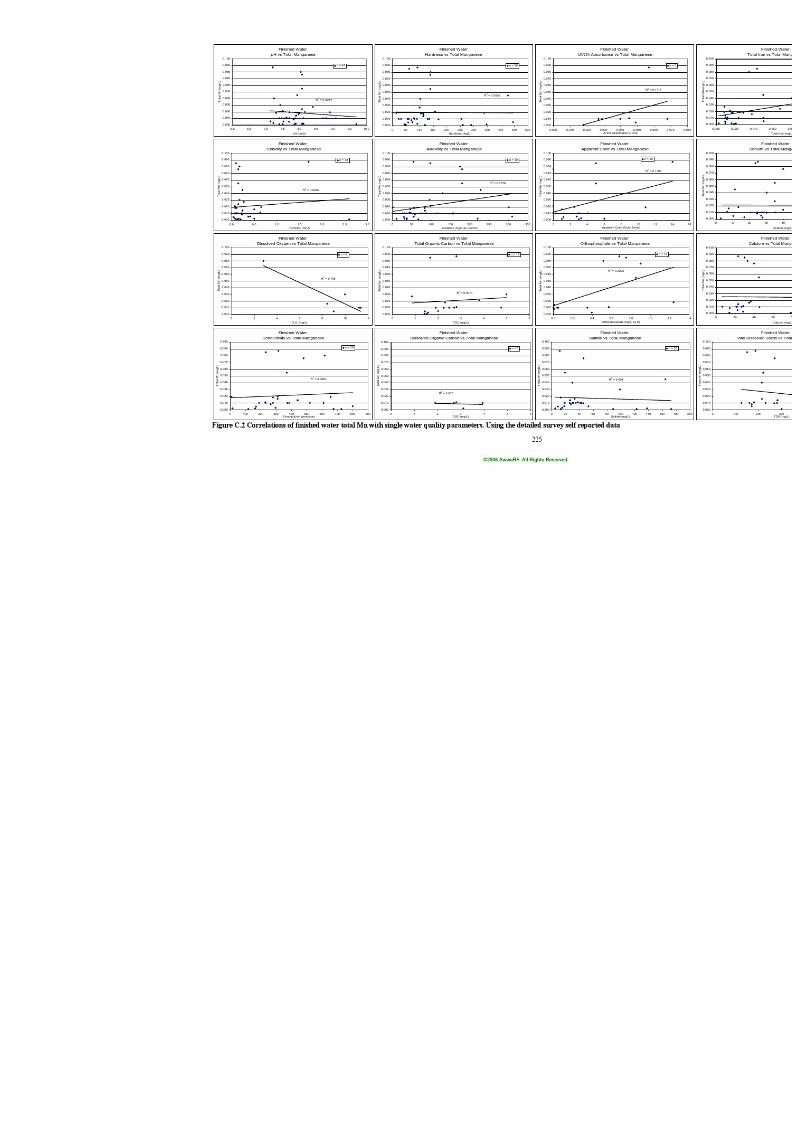
7/21/2019 Occurrence of Manganese in Drinking Water and Manganese Control
http://slidepdf.com/reader/full/occurrence-of-manganese-in-drinking-water-and-manganese-control 251/463
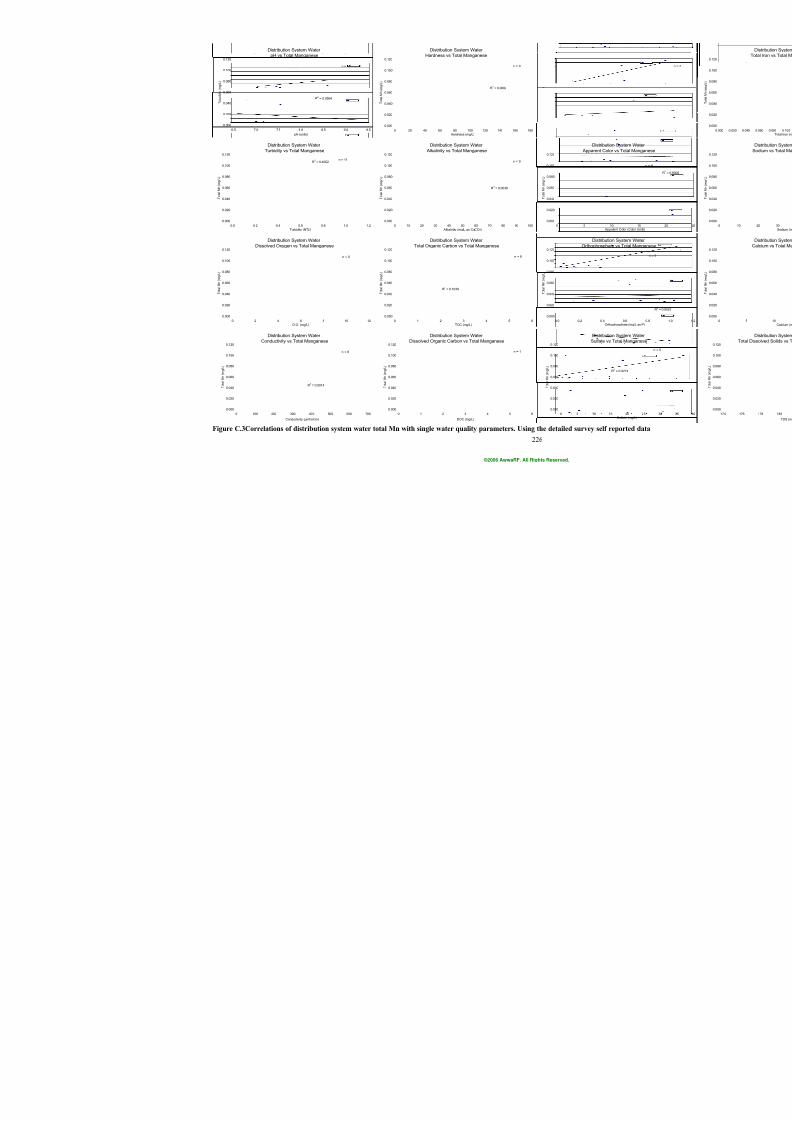
7/21/2019 Occurrence of Manganese in Drinking Water and Manganese Control
http://slidepdf.com/reader/full/occurrence-of-manganese-in-drinking-water-and-manganese-control 252/463
226
Distribution System Water pH vs Total Manganese
R2 = 0.0564
0.000
0.020
0.040
0.060
0.080
0.100
0.120
6.5 7.0 7.5 8.0 8.5 9.0 9.5
pH (units)
T o t a l M n ( m g / L )
n = 13
Distribution System Water Hardness vs Total Manganese
R2 = 0.0002
0.000
0.020
0.040
0.060
0.080
0.100
0.120
0 20 40 60 80 100 120 140 160 180Hardness (mg/L)
T o t a l M n ( m g / L )
n = 9
Distribution System Water
Turbidity vs Total Manganese
R2 = 0.4052
0.000
0.020
0.040
0.060
0.080
0.100
0.120
0.0 0.2 0.4 0.6 0.8 1.0 1.2
Turbidity (NTU)
T o t a l M n ( m g / L )
n = 11
Distribution System Water Dissolved Oxygen vs Total Manganese
0.000
0.020
0.040
0.060
0.080
0.100
0.120
0 2 4 6 8 10 12D.O. (mg/L)
T o t a l M n ( m g / L )
n = 0
Distribution System Water Conductivity vs Total Manganese
R2 = 0.0014
0.000
0.020
0.040
0.060
0.080
0.100
0.120
0 100 200 300 400 500 600 700
Conductivity (µmho/cm)
T o t a l M n ( m g / L )
n = 8
Distribution System Water
Alkalinity vs Total Manganese
R2 = 0.0039
0.000
0.020
0.040
0.060
0.080
0.100
0.120
0 10 20 30 40 50 60 70 80 90 100
Alkalinity (mg/L as CaCO3)
T o t a l M n ( m g / L )
n = 9
Distribution System Water Total Organic Carbon vs Total Manganese
R2 = 0.1039
0.000
0.020
0.040
0.060
0.080
0.100
0.120
0 1 2 3 4 5 6TOC (mg/L)
T o t a l M n ( m g / L )
n = 6
Distribution System Water Dissolved Organic Carbon vs Total Manganese
0.000
0.020
0.040
0.060
0.080
0.100
0.120
0 1 2 3 4 5 6
DOC (mg/L)
T o t a l M n ( m g / L )
n = 1
Distribu UV254 Absorb
0.000
0.020
0.040
0.060
0.080
0.100
0.120
0.000 0.010 0.020
T o t a l M n ( m g / L )
Distribu
Apparent Co
0.000
0.020
0.040
0.060
0.080
0.100
0.120
0 5 A
T o t a l M n ( m g / L )
Distribu Orthophosph
0.000
0.020
0.040
0.060
0.080
0.100
0.120
0.0 0.2 0.4O
T o t a l M n ( m g / L )
Distribu Sulfate
0.000
0.020
0.040
0.060
0.080
0.100
0.120
0 5 10
T o t a l M n ( m g / L )
Figure C.3Correlations of distribution system water total Mn with single water quality parameters. Using the detailed survey self
©2006 AwwaRF. All Rights Reserved.

7/21/2019 Occurrence of Manganese in Drinking Water and Manganese Control
http://slidepdf.com/reader/full/occurrence-of-manganese-in-drinking-water-and-manganese-control 253/463
227
APPENDIX D
DISTRIBUTION SYSTEM SEASONAL TESTING DATA
DISTIBUTION SYSTEM MANGANESE PLOTS
©2006 AwwaRF. All Rights Reserved.
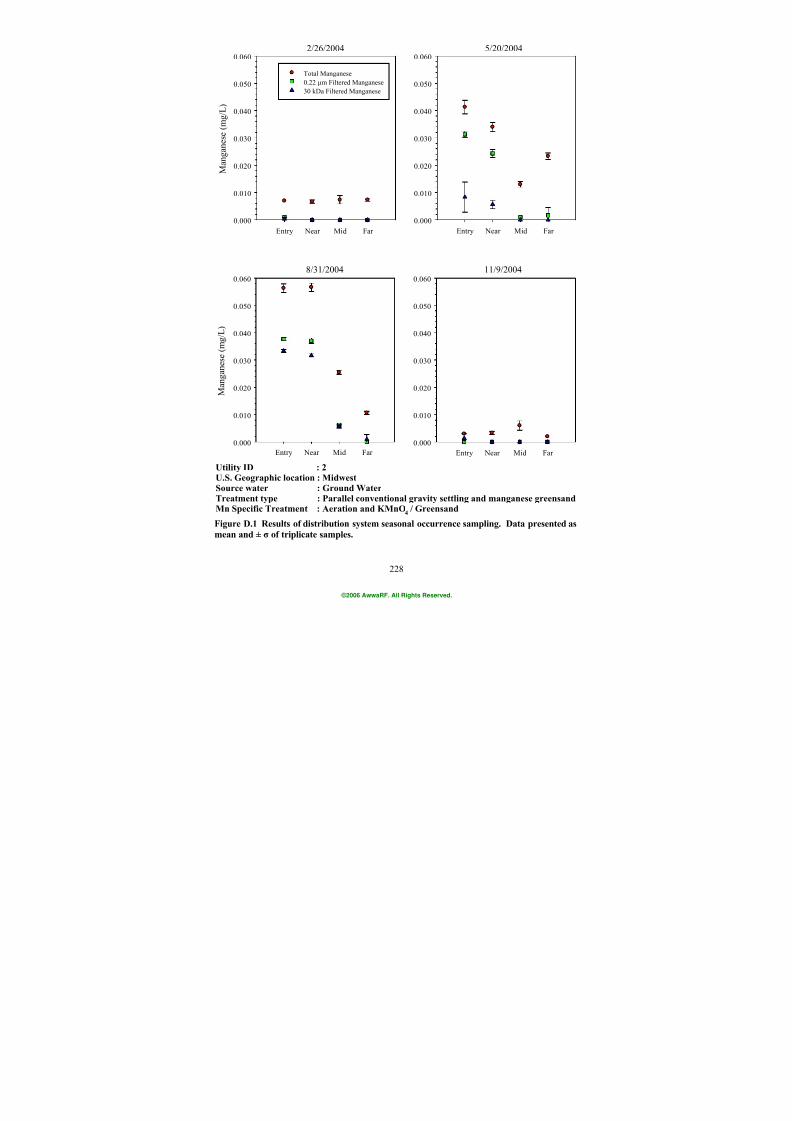
7/21/2019 Occurrence of Manganese in Drinking Water and Manganese Control
http://slidepdf.com/reader/full/occurrence-of-manganese-in-drinking-water-and-manganese-control 254/463
228
2/26/2004
Entry Near Mid Far
M a n g a n e s e ( m g
/ L )
0.000
0.010
0.020
0.030
0.040
0.050
0.0605/20/2004
Entry Near Mid Far
0.000
0.010
0.020
0.030
0.040
0.050
0.060
11/9/2004
Entry Near Mid Far
0.000
0.010
0.020
0.030
0.040
0.050
0.060
Total Manganese
0.22 µm Filtered Manganese
30 kDa Filtered Manganese
8/31/2004
Entry Near Mid Far
M a n g a n e s e
( m g / L )
0.000
0.010
0.020
0.030
0.040
0.050
0.060
Utility
ID : 2
U.S. Geographic location : MidwestSource water : Ground Water
Treatment type : Parallel conventional gravity settling and manganese greensandMn Specific Treatment : Aeration and KMnO
4 / Greensand
Figure D.1 Results of distribution system seasonal occurrence sampling. Data presented as
mean and ± σ of triplicate samples.
©2006 AwwaRF. All Rights Reserved.
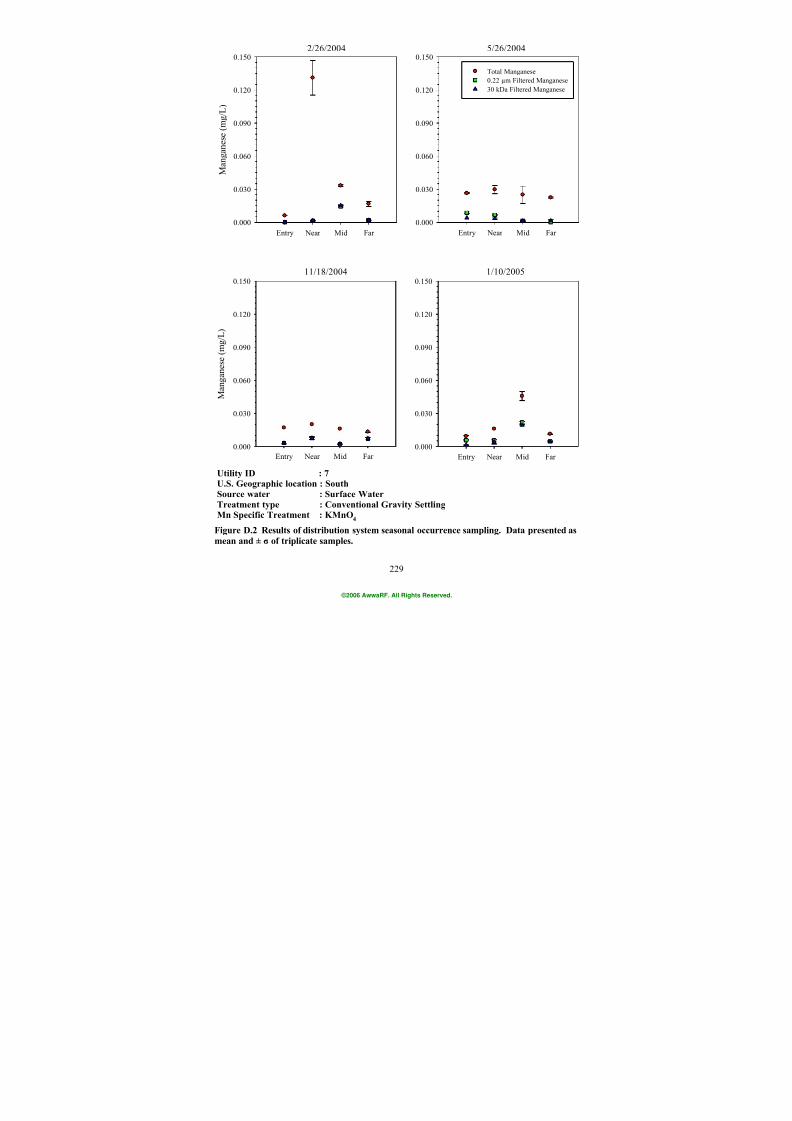
7/21/2019 Occurrence of Manganese in Drinking Water and Manganese Control
http://slidepdf.com/reader/full/occurrence-of-manganese-in-drinking-water-and-manganese-control 255/463
229
2/26/2004
Entry Near Mid Far
M a n g a n e s e ( m g
/ L )
0.000
0.030
0.060
0.090
0.120
0.1505/26/2004
Entry Near Mid Far
0.000
0.030
0.060
0.090
0.120
0.150
1/10/2005
Entry Near Mid Far
0.000
0.030
0.060
0.090
0.120
0.150
Total Manganese
0.22 µm Filtered Manganese
30 kDa Filtered Manganese
11/18/2004
Entry Near Mid Far
M a n g a n e s e ( m g / L )
0.000
0.030
0.060
0.090
0.120
0.150
Utility
ID : 7U.S. Geographic location : South
Source water : Surface Water
Treatment type : Conventional Gravity Settling
Mn Specific Treatment : KMnO4
Figure D.2 Results of distribution system seasonal occurrence sampling. Data presented as
mean and ± σ of triplicate samples.
©2006 AwwaRF. All Rights Reserved.
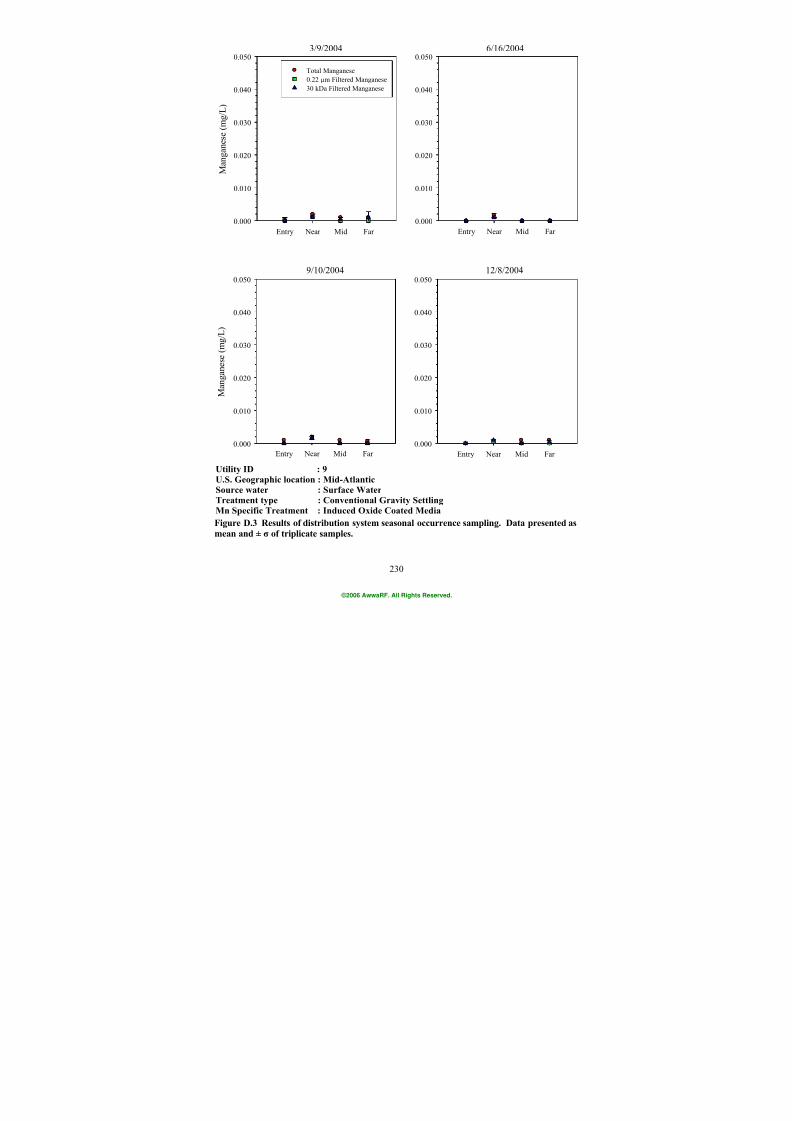
7/21/2019 Occurrence of Manganese in Drinking Water and Manganese Control
http://slidepdf.com/reader/full/occurrence-of-manganese-in-drinking-water-and-manganese-control 256/463
230
3/9/2004
Entry Near Mid Far
M a n g a n e s e ( m g
/ L )
0.000
0.010
0.020
0.030
0.040
0.0506/16/2004
Entry Near Mid Far
0.000
0.010
0.020
0.030
0.040
0.050
12/8/2004
Entry Near Mid Far
0.000
0.010
0.020
0.030
0.040
0.050
Total Manganese
0.22 µm Filtered Manganese
30 kDa Filtered Manganese
9/10/2004
Entry Near Mid Far
M a n g a n e s e
( m g / L )
0.000
0.010
0.020
0.030
0.040
0.050
Utility ID : 9
U.S. Geographic location : Mid-Atlantic
Source water : Surface Water
Treatment type : Conventional Gravity Settling
Mn Specific Treatment : Induced Oxide Coated Media
Figure D.3 Results of distribution system seasonal occurrence sampling. Data presented as
mean and ± σ of triplicate samples.
©2006 AwwaRF. All Rights Reserved.
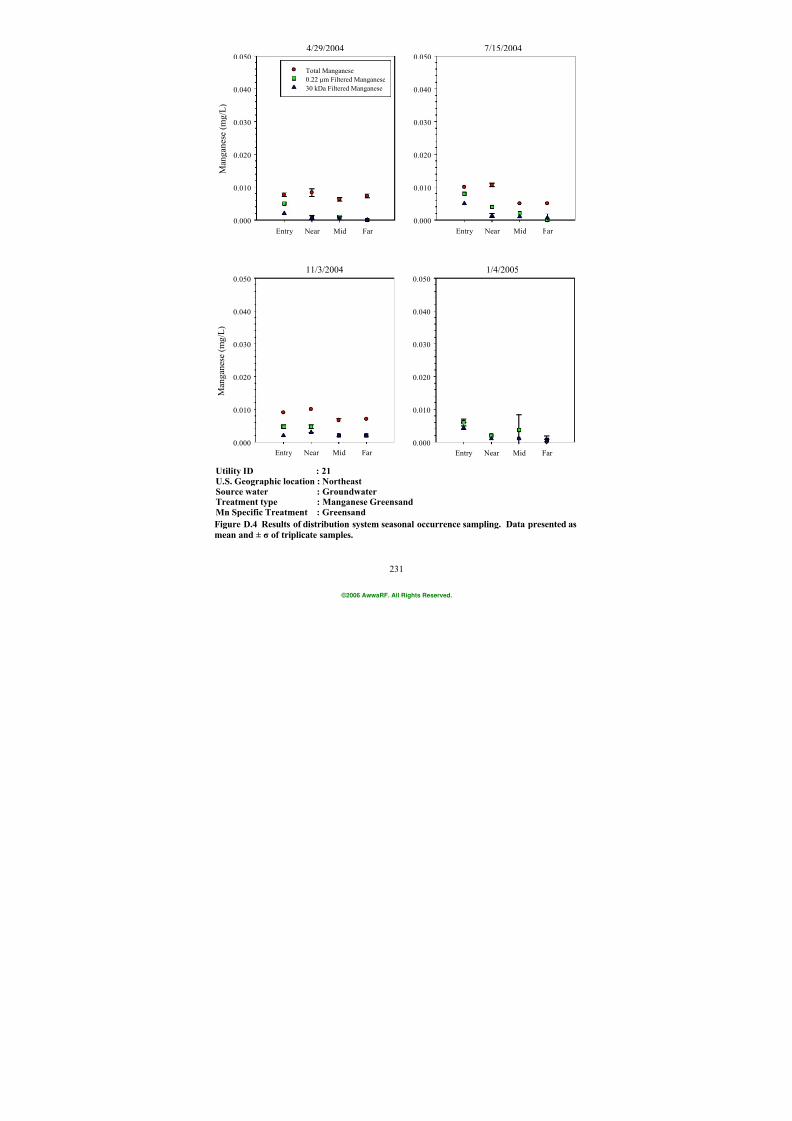
7/21/2019 Occurrence of Manganese in Drinking Water and Manganese Control
http://slidepdf.com/reader/full/occurrence-of-manganese-in-drinking-water-and-manganese-control 257/463
231
4/29/2004
Entry Near Mid Far
M a n g a n e s e ( m g
/ L )
0.000
0.010
0.020
0.030
0.040
0.0507/15/2004
Entry Near Mid Far
0.000
0.010
0.020
0.030
0.040
0.050
1/4/2005
Entry Near Mid Far
0.000
0.010
0.020
0.030
0.040
0.050
Total Manganese
0.22 µm Filtered Manganese
30 kDa Filtered Manganese
11/3/2004
Entry Near Mid Far
M a n g a n e s e
( m g / L )
0.000
0.010
0.020
0.030
0.040
0.050
Utility
ID : 21U.S. Geographic location : Northeast
Source water : GroundwaterTreatment type : Manganese Greensand
Mn Specific Treatment : Greensand
Figure D.4 Results of distribution system seasonal occurrence sampling. Data presented as
mean and ± σ of triplicate samples.
©2006 AwwaRF. All Rights Reserved.
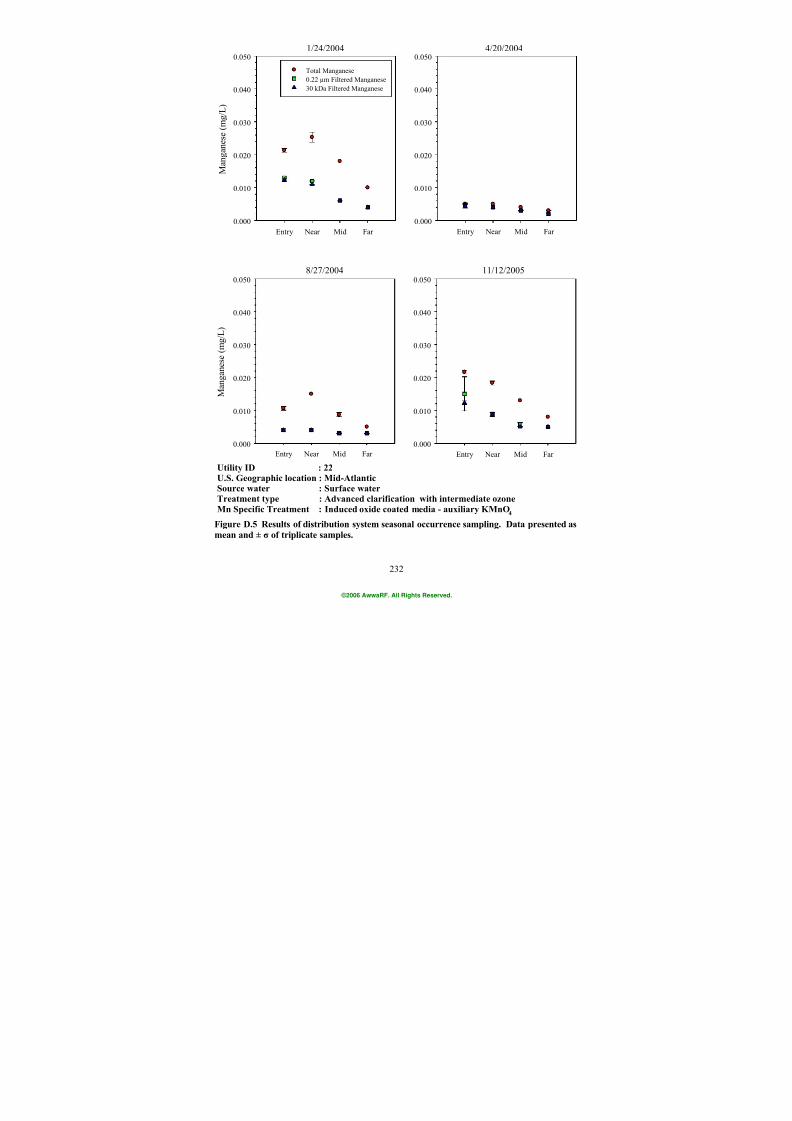
7/21/2019 Occurrence of Manganese in Drinking Water and Manganese Control
http://slidepdf.com/reader/full/occurrence-of-manganese-in-drinking-water-and-manganese-control 258/463
232
1/24/2004
Entry Near Mid Far
M a n g a n e s e ( m g
/ L )
0.000
0.010
0.020
0.030
0.040
0.0504/20/2004
Entry Near Mid Far
0.000
0.010
0.020
0.030
0.040
0.050
11/12/2005
Entry Near Mid Far
0.000
0.010
0.020
0.030
0.040
0.050
Total Manganese
0.22 µm Filtered Manganese
30 kDa Filtered Manganese
8/27/2004
Entry Near Mid Far
M a n g a n e s e
( m g / L )
0.000
0.010
0.020
0.030
0.040
0.050
Utility
ID : 22
U.S. Geographic location : Mid-AtlanticSource water : Surface water
Treatment type : Advanced clarification with intermediate ozone
Mn Specific Treatment : Induced oxide coated media - auxiliary KMnO4
Figure D.5 Results of distribution system seasonal occurrence sampling. Data presented as
mean and ± σ of triplicate samples.
©2006 AwwaRF. All Rights Reserved.
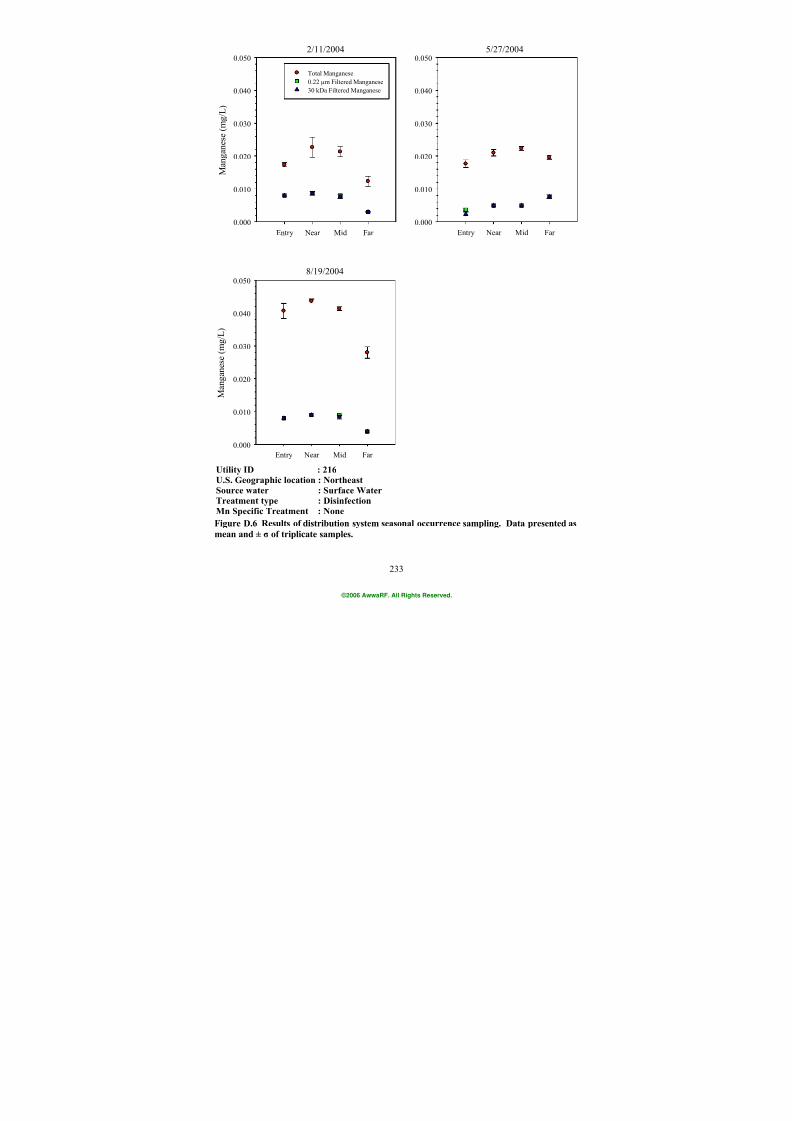
7/21/2019 Occurrence of Manganese in Drinking Water and Manganese Control
http://slidepdf.com/reader/full/occurrence-of-manganese-in-drinking-water-and-manganese-control 259/463
233
2/11/2004
Entry Near Mid Far
M a n g a n e s e ( m g
/ L )
0.000
0.010
0.020
0.030
0.040
0.050
Total Manganese
0.22 µm Filtered Manganese
30 kDa Filtered Manganese
5/27/2004
Entry Near Mid Far
0.000
0.010
0.020
0.030
0.040
0.050
8/19/2004
Entry Near Mid Far
M a n g a n e s e
( m g / L )
0.000
0.010
0.020
0.030
0.040
0.050
Utility
ID : 216
U.S. Geographic location : Northeast
Source water : Surface Water
Treatment type : Disinfection
Mn Specific Treatment : None
Figure D.6 Results of distribution system seasonal occurrence sampling. Data presented as
mean and ± σ of triplicate samples.
©2006 AwwaRF. All Rights Reserved.
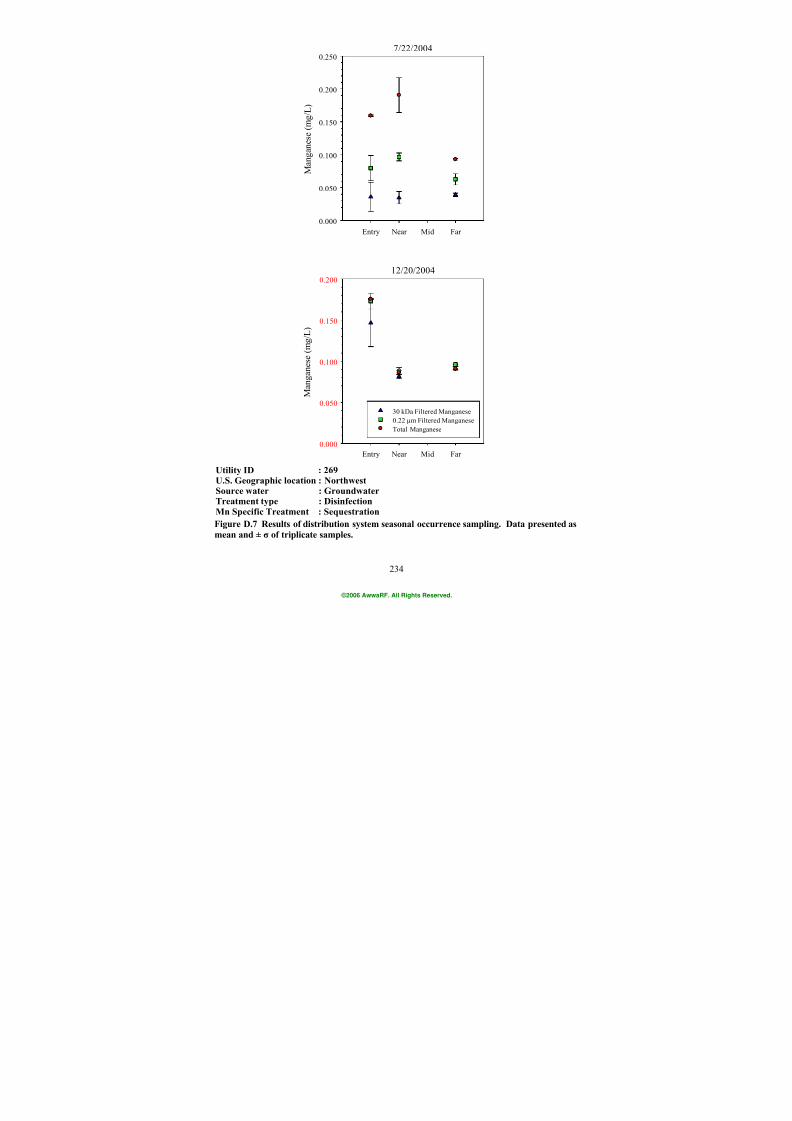
7/21/2019 Occurrence of Manganese in Drinking Water and Manganese Control
http://slidepdf.com/reader/full/occurrence-of-manganese-in-drinking-water-and-manganese-control 260/463
234
7/22/2004
Entry Near Mid Far
M a n g a n e s e ( m g
/ L )
0.000
0.050
0.100
0.150
0.200
0.250
12/20/2004
Entry Near Mid Far
M a n g a n e s e
( m g / L )
0.000
0.050
0.100
0.150
0.200
30 kDa Filtered Manganese
0.22 µm Filtered Manganese
Total Manganese
Utility ID : 269U.S. Geographic location : NorthwestSource water : GroundwaterTreatment type : Disinfection
Mn Specific Treatment : Sequestration Figure D.7 Results of distribution system seasonal occurrence sampling. Data presented as
mean and ± σ of triplicate samples.
©2006 AwwaRF. All Rights Reserved.
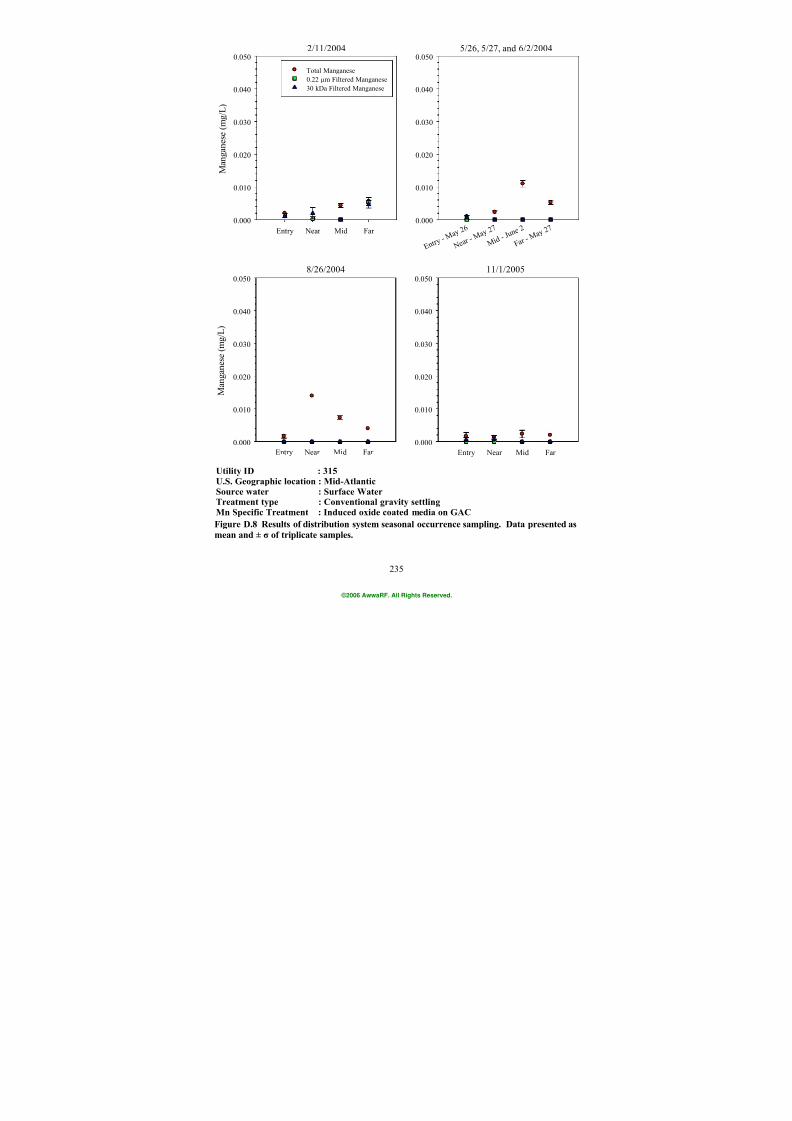
7/21/2019 Occurrence of Manganese in Drinking Water and Manganese Control
http://slidepdf.com/reader/full/occurrence-of-manganese-in-drinking-water-and-manganese-control 261/463
235
2/11/2004
Entry Near Mid Far
M a n g a n e s e ( m g
/ L )
0.000
0.010
0.020
0.030
0.040
0.0505/26, 5/27, and 6/2/2004
E n t r y - M a y 2 6
N e a r - M a y 2 7
M i d - J u n e 2
F a r - M a y 2 7
0.000
0.010
0.020
0.030
0.040
0.050
11/1/2005
Entry Near Mid Far
0.000
0.010
0.020
0.030
0.040
0.050
Total Manganese
0.22 µm Filtered Manganese
30 kDa Filtered Manganese
8/26/2004
Entry Near Mid Far
M a n g a n e s e
( m g / L )
0.000
0.010
0.020
0.030
0.040
0.050
Utility
ID : 315U.S. Geographic location : Mid-Atlantic
Source water : Surface WaterTreatment type : Conventional gravity settling
Mn Specific Treatment : Induced oxide coated media on GAC
Figure D.8 Results of distribution system seasonal occurrence sampling. Data presented as
mean and ± σ of triplicate samples.
©2006 AwwaRF. All Rights Reserved.
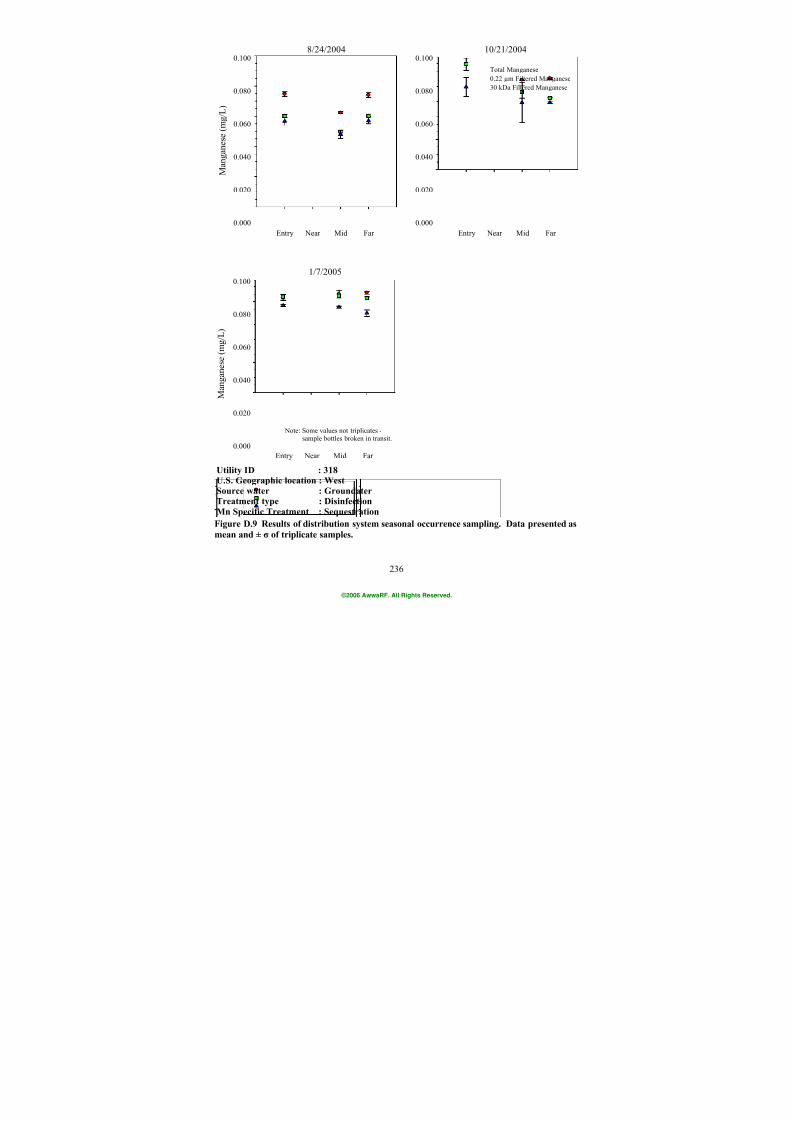
7/21/2019 Occurrence of Manganese in Drinking Water and Manganese Control
http://slidepdf.com/reader/full/occurrence-of-manganese-in-drinking-water-and-manganese-control 262/463
236
8/24/2004
Entry Near Mid Far
M a n g a n e s e ( m g / L )
0.000
0.020
0.040
0.060
0.080
0.100
Total Manganese
0.22 µm Filtered Manganese
30 kDa Filtered Manganese
10/21/2004
Entry Near Mid Far
0.000
0.020
0.040
0.060
0.080
0.100
Total Manganese
0.22 µm Filtered Manganese
30 kDa Filtered Manganese
1/7/2005
Entry Near Mid Far
M a n g a n e s e ( m g / L )
0.000
0.020
0.040
0.060
0.080
0.100
Utility ID : 318
U.S. Geographic location : West
Source water : Groundater
Treatment type : Disinfection
Mn Specific Treatment : Sequestration
Note: Some values not triplicates - sample bottles broken in transit.
Figure D.9 Results of distribution system seasonal occurrence sampling. Data presented as
mean and ± σ of triplicate samples.
©2006 AwwaRF. All Rights Reserved.
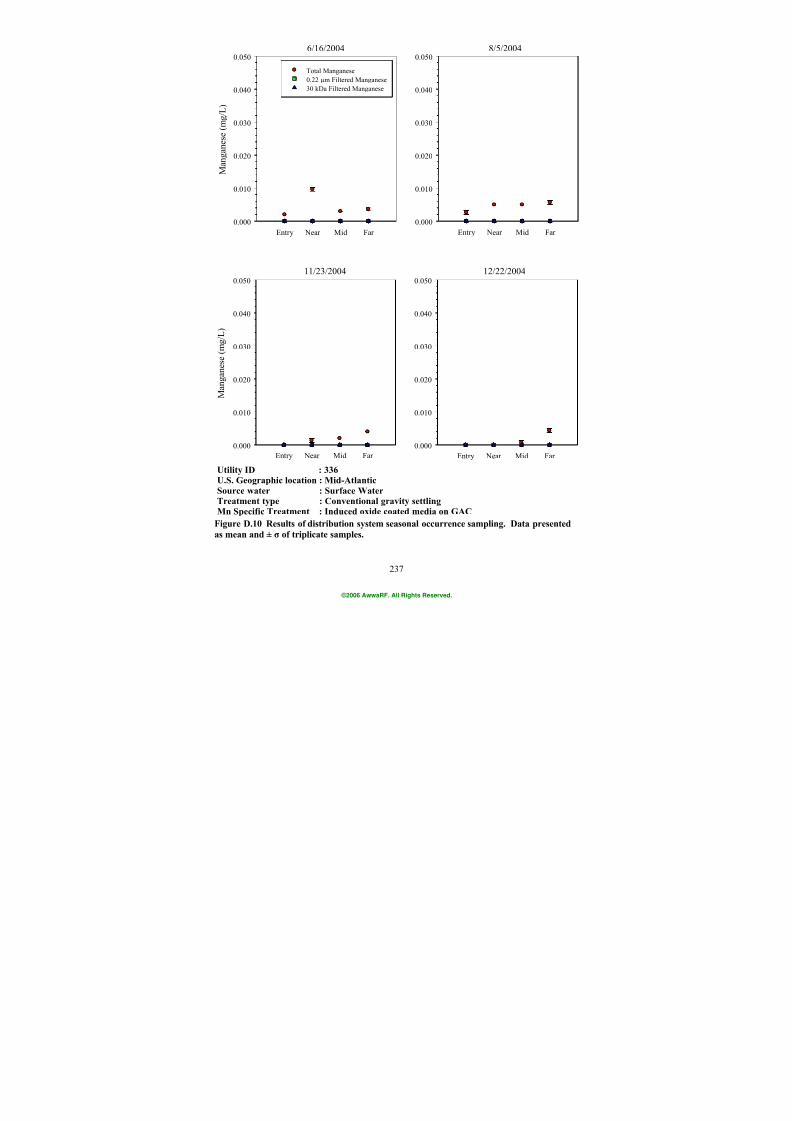
7/21/2019 Occurrence of Manganese in Drinking Water and Manganese Control
http://slidepdf.com/reader/full/occurrence-of-manganese-in-drinking-water-and-manganese-control 263/463

7/21/2019 Occurrence of Manganese in Drinking Water and Manganese Control
http://slidepdf.com/reader/full/occurrence-of-manganese-in-drinking-water-and-manganese-control 264/463
238
6/10/2004
Entry Near Mid Far
M a n g a n e s e ( m g / L )
0.000
0.010
0.020
0.030
0.040
0.050
Total Manganese
0.22 µm Filtered Manganese
30 kDa Filtered Manganese
12/29/2004
Entry Near Mid Far
M a n g a n e s e
( m g / L )
0.000
0.010
0.020
0.030
0.040
0.050
Utility
ID : 400
U.S. Geographic location : WestSource water : Surface waterTreatment type : Conventional gravity settling with intermediate ozoneMn Specific Treatment : KMnO
4 Figure D.11 Results of distribution system seasonal occurrence sampling. Data presented
as mean and ± σ of triplicate samples.
©2006 AwwaRF. All Rights Reserved.
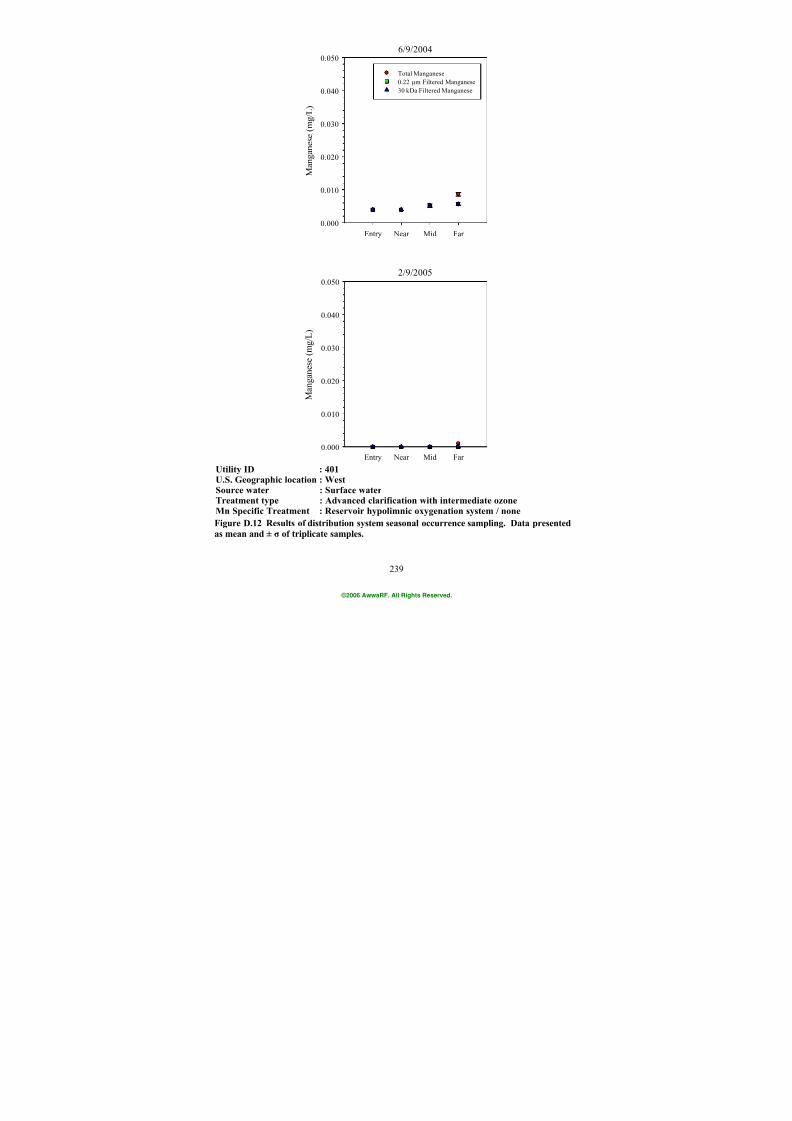
7/21/2019 Occurrence of Manganese in Drinking Water and Manganese Control
http://slidepdf.com/reader/full/occurrence-of-manganese-in-drinking-water-and-manganese-control 265/463
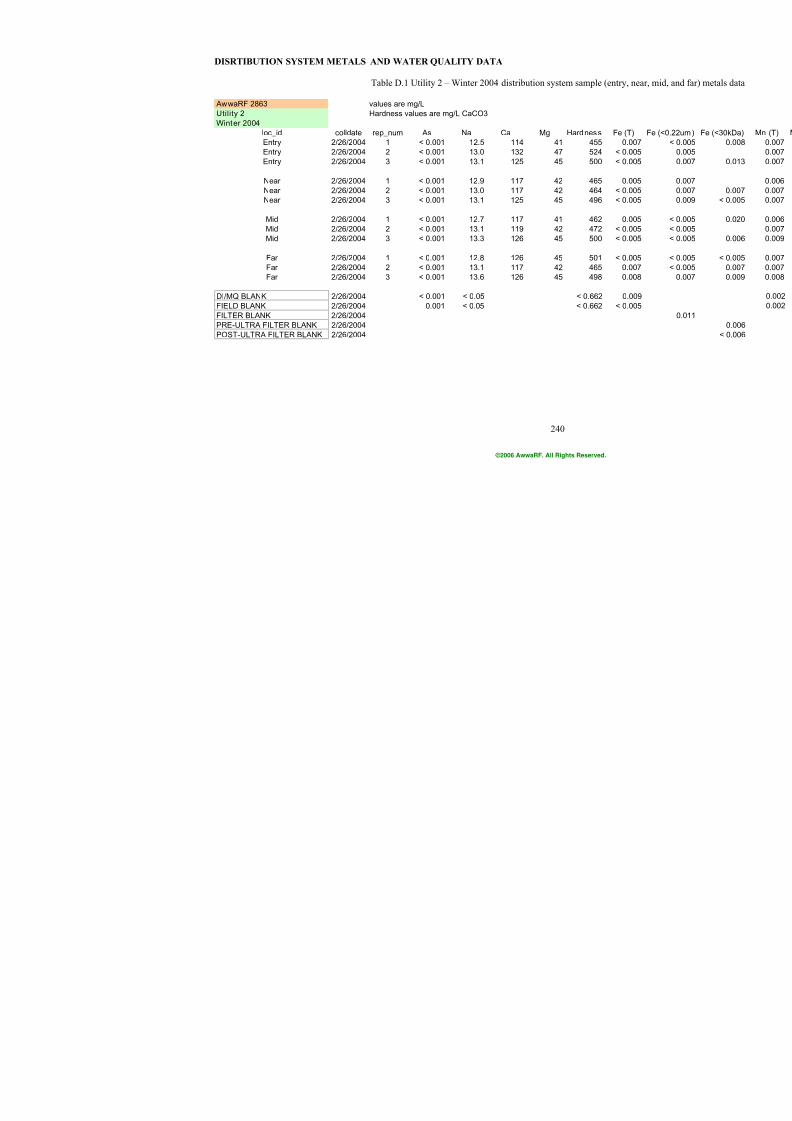
7/21/2019 Occurrence of Manganese in Drinking Water and Manganese Control
http://slidepdf.com/reader/full/occurrence-of-manganese-in-drinking-water-and-manganese-control 266/463
240
DISRTIBUTION SYSTEM METALS AND WATER QUALITY DATA
Table D.1 Utility 2 – Winter 2004 distribution system sample (
AwwaRF 2863 values are mg/LUtility 2 Hardness values are mg/L CaCO3Winter 2004
loc_id colldate rep_num As Na Ca Mg Hardness
Entry 2/26/2004 1 < 0.001 12.5 114 41 455Entry 2/26/2004 2 < 0.001 13.0 132 47 524Entry 2/26/2004 3 < 0.001 13.1 125 45 500
Near 2/26/2004 1 < 0.001 12.9 117 42 465Near 2/26/2004 2 < 0.001 13.0 117 42 464Near 2/26/2004 3 < 0.001 13.1 125 45 496
Mid 2/26/2004 1 < 0.001 12.7 117 41 462Mid 2/26/2004 2 < 0.001 13.1 119 42 472
Mid 2/26/2004 3 < 0.001 13.3 126 45 500
Far 2/26/2004 1 < 0.001 12.8 126 45 501Far 2/26/2004 2 < 0.001 13.1 117 42 465Far 2/26/2004 3 < 0.001 13.6 126 45 498
DI/MQ BLANK 2/26/2004 < 0.001 < 0.05 < 0.662FIELD BLANK 2/26/2004 0.001 < 0.05 < 0.662FILTER BLANK 2/26/2004PRE-ULTRA FILTER BLANK 2/26/2004POST-ULTRA FILTER BLANK 2/26/2004
©2006 AwwaRF. All Rights Reserved.

7/21/2019 Occurrence of Manganese in Drinking Water and Manganese Control
http://slidepdf.com/reader/full/occurrence-of-manganese-in-drinking-water-and-manganese-control 267/463
241
Table D.2 Utility 2 – Spring 2004 distribution system sample (
AwwaRF 2863 values are mg/LUtility 2 Hardness values are mg/L CaCO3Spring 2004
loc_id colldate rep_num As Na Ca Mg Hardness
Entry 5/20/2004 1 < 0.001 12.8 122 42 476Entry 5/20/2004 2 < 0.001 12.9 123 42 481Entry 5/20/2004 3 < 0.001 13.0 124 42 482
Near 5/20/2004 1 <0.001 13.0 122 42 480Near 5/20/2004 2 <0.001 12.9 122 42 477
Near 5/20/2004 3 <0.001 12.7 122 42 476
Mid 5/20/2004 1 <0.001 12.2 117 41 461Mid 5/20/2004 2 <0.001 12.4 120 41 471Mid 5/20/2004 3 <0.001 12.5 119 41 467
Far 5/20/2004 1 <0.001 11.9 116 40 456Far 5/20/2004 2 <0.001 12.0 117 41 461Far 5/20/2004 3 <0.001 12.7 126 44 495
DI/MQ BLANK 5/20/2004 < 0.001 < 0.05 < 1.66FIELD BLANK 5/20/2004 < 0.001 < 0.05 < 1.66FILTER BLANK 5/20/2004PRE-ULTRA FILTER BLANK 5/20/2004POST-ULTRA FILTER BLANK 5/20/2004
©2006 AwwaRF. All Rights Reserved.
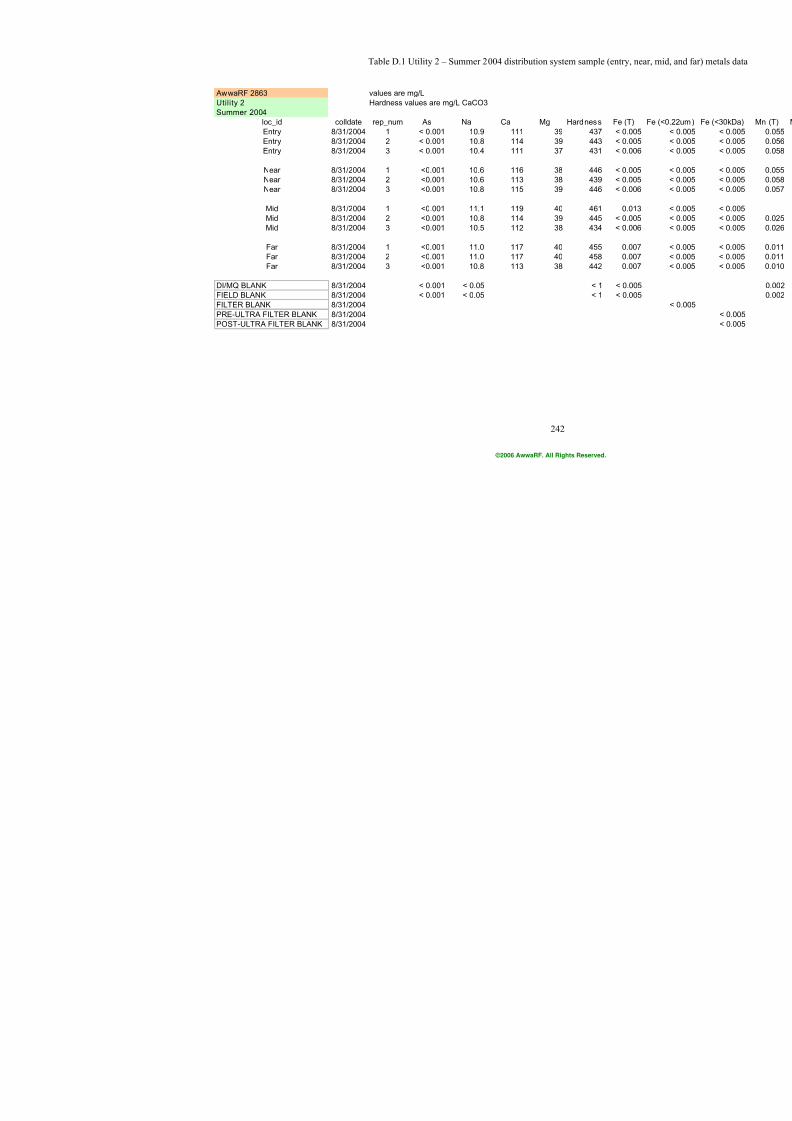
7/21/2019 Occurrence of Manganese in Drinking Water and Manganese Control
http://slidepdf.com/reader/full/occurrence-of-manganese-in-drinking-water-and-manganese-control 268/463
242
Table D.1 Utility 2 – Summer 2004 distribution system sample
AwwaRF 2863 values are mg/LUtility 2 Hardness values are mg/L CaCO3Summer 2004
loc_id colldate rep_num As Na Ca Mg Hardness
Entry 8/31/2004 1 < 0.001 10.9 111 39 437Entry 8/31/2004 2 < 0.001 10.8 114 39 443Entry 8/31/2004 3 < 0.001 10.4 111 37 431
Near 8/31/2004 1 <0.001 10.6 116 38 446Near 8/31/2004 2 <0.001 10.6 113 38 439Near 8/31/2004 3 <0.001 10.8 115 39 446
Mid 8/31/2004 1 <0.001 11.1 119 40 461Mid 8/31/2004 2 <0.001 10.8 114 39 445Mid 8/31/2004 3 <0.001 10.5 112 38 434
Far 8/31/2004 1 <0.001 11.0 117 40 455Far 8/31/2004 2 <0.001 11.0 117 40 458Far 8/31/2004 3 <0.001 10.8 113 38 442
DI/MQ BLANK 8/31/2004 < 0.001 < 0.05 < 1FIELD BLANK 8/31/2004 < 0.001 < 0.05 < 1FILTER BLANK 8/31/2004
PRE-ULTRA FILTER BLANK 8/31/2004POST-ULTRA FILTER BLANK 8/31/2004
©2006 AwwaRF. All Rights Reserved.
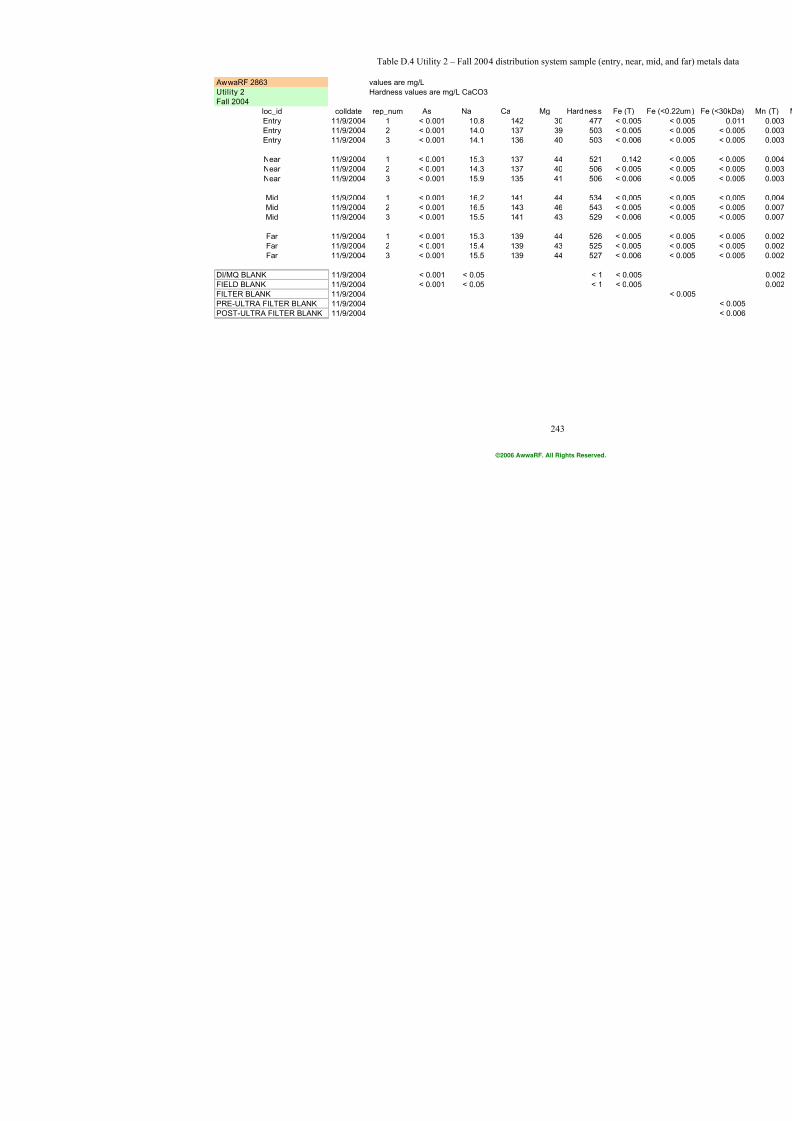
7/21/2019 Occurrence of Manganese in Drinking Water and Manganese Control
http://slidepdf.com/reader/full/occurrence-of-manganese-in-drinking-water-and-manganese-control 269/463
243
Table D.4 Utility 2 – Fall 2004 distribution system sample (en
AwwaRF 2863 values are mg/LUtility 2 Hardness values are mg/L CaCO3Fall 2004
loc_id colldate rep_num As Na Ca Mg Hardness
Entry 11/9/2004 1 < 0.001 10.8 142 30 477Entry 11/9/2004 2 < 0.001 14.0 137 39 503Entry 11/9/2004 3 < 0.001 14.1 136 40 503
Near 11/9/2004 1 < 0.001 15.3 137 44 521Near 11/9/2004 2 < 0.001 14.3 137 40 506
Near 11/9/2004 3 < 0.001 15.9 135 41 506
Mid 11/9/2004 1 < 0.001 16.2 141 44 534Mid 11/9/2004 2 < 0.001 16.5 143 46 543Mid 11/9/2004 3 < 0.001 15.5 141 43 529
Far 11/9/2004 1 < 0.001 15.3 139 44 526Far 11/9/2004 2 < 0.001 15.4 139 43 525Far 11/9/2004 3 < 0.001 15.5 139 44 527
DI/MQ BLANK 11/9/2004 < 0.001 < 0.05 < 1FIELD BLANK 11/9/2004 < 0.001 < 0.05 < 1FILTER BLANK 11/9/2004PRE-ULTRA FILTER BLANK 11/9/2004POST-ULTRA FILTER BLANK 11/9/2004
©2006 AwwaRF. All Rights Reserved.
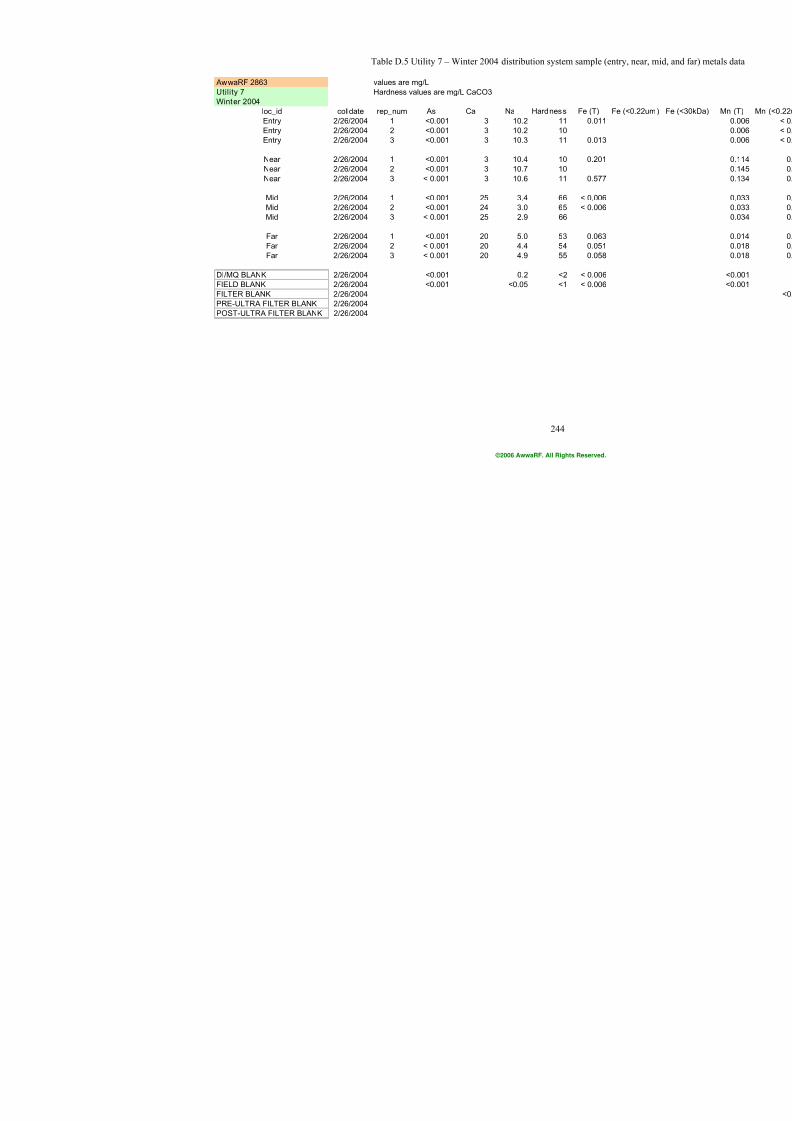
7/21/2019 Occurrence of Manganese in Drinking Water and Manganese Control
http://slidepdf.com/reader/full/occurrence-of-manganese-in-drinking-water-and-manganese-control 270/463
244
Table D.5 Utility 7 – Winter 2004 distribution system sample (
AwwaRF 2863 values are mg/L
Utility 7 Hardness values are mg/L CaCO3
Winter 2004
loc_id colldate rep_num As Ca Na Hardness Fe (T)
Entry 2/26/2004 1 <0.001 3 10.2 11 0.011
Entry 2/26/2004 2 <0.001 3 10.2 10
Entry 2/26/2004 3 <0.001 3 10.3 11 0.013
Near 2/26/2004 1 <0.001 3 10.4 10 0.201
Near 2/26/2004 2 <0.001 3 10.7 10
Near 2/26/2004 3 < 0.001 3 10.6 11 0.577
Mid 2/26/2004 1 <0.001 25 3.4 66 < 0.006
Mid 2/26/2004 2 <0.001 24 3.0 65 < 0.006
Mid 2/26/2004 3 < 0.001 25 2.9 66
Far 2/26/2004 1 <0.001 20 5.0 53 0.063Far 2/26/2004 2 < 0.001 20 4.4 54 0.051
Far 2/26/2004 3 < 0.001 20 4.9 55 0.058
DI/MQ BLANK 2/26/2004 <0.001 0.2 <2 < 0.006
FIELD BLANK 2/26/2004 <0.001 <0.05 <1 < 0.006
FILTER BLANK 2/26/2004
PRE-ULTRA FILTER BLANK 2/26/2004
POST-ULTRA FILTER BLANK 2/26/2004
©2006 AwwaRF. All Rights Reserved.
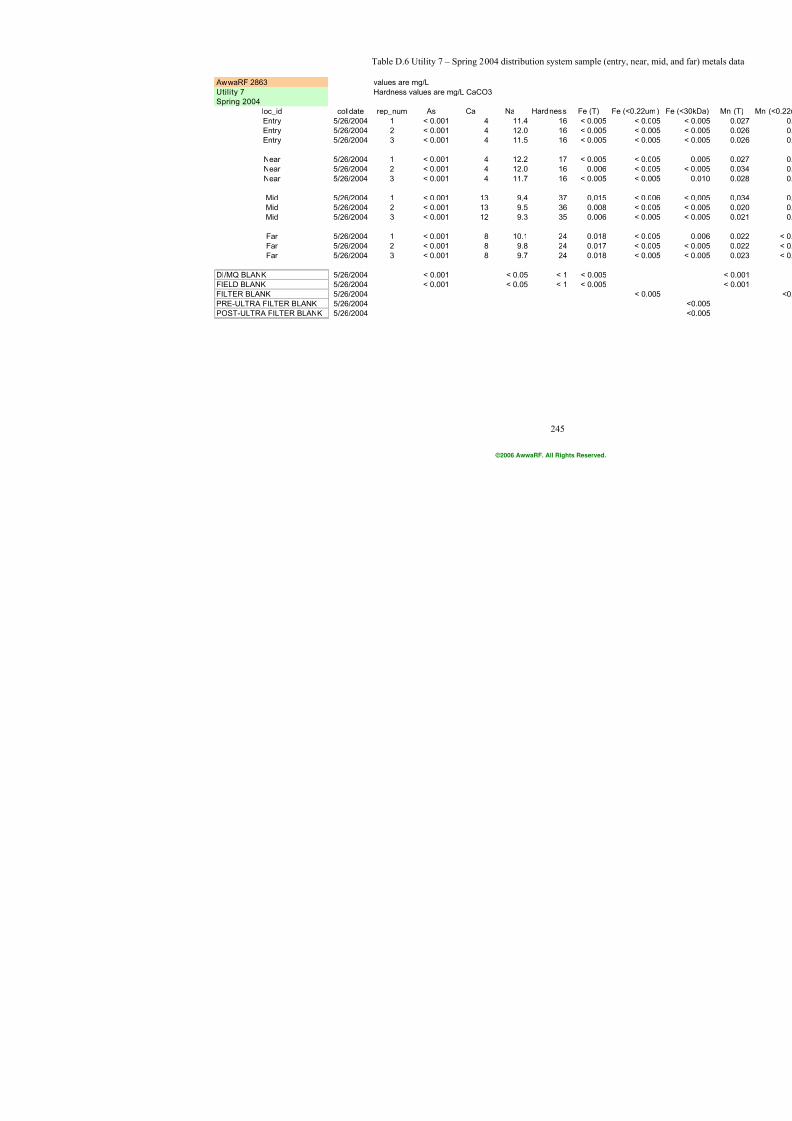
7/21/2019 Occurrence of Manganese in Drinking Water and Manganese Control
http://slidepdf.com/reader/full/occurrence-of-manganese-in-drinking-water-and-manganese-control 271/463
245
Table D.6 Utility 7 – Spring 2004 distribution system sample (
AwwaRF 2863 values are mg/L
Utility 7 Hardness values are mg/L CaCO3
Spring 2004
loc_id colldate rep_num As Ca Na Hardness Fe (T)
Entry 5/26/2004 1 < 0.001 4 11.4 16 < 0.005
Entry 5/26/2004 2 < 0.001 4 12.0 16 < 0.005
Entry 5/26/2004 3 < 0.001 4 11.5 16 < 0.005
Near 5/26/2004 1 < 0.001 4 12.2 17 < 0.005
Near 5/26/2004 2 < 0.001 4 12.0 16 0.006
Near 5/26/2004 3 < 0.001 4 11.7 16 < 0.005
Mid 5/26/2004 1 < 0.001 13 9.4 37 0.015
Mid 5/26/2004 2 < 0.001 13 9.5 36 0.008
Mid 5/26/2004 3 < 0.001 12 9.3 35 0.006
Far 5/26/2004 1 < 0.001 8 10.1 24 0.018Far 5/26/2004 2 < 0.001 8 9.8 24 0.017
Far 5/26/2004 3 < 0.001 8 9.7 24 0.018
DI/MQ BLANK 5/26/2004 < 0.001 < 0.05 < 1 < 0.005
FIELD BLANK 5/26/2004 < 0.001 < 0.05 < 1 < 0.005
FILTER BLANK 5/26/2004
PRE-ULTRA FILTER BLANK 5/26/2004
POST-ULTRA FILTER BLANK 5/26/2004
©2006 AwwaRF. All Rights Reserved.
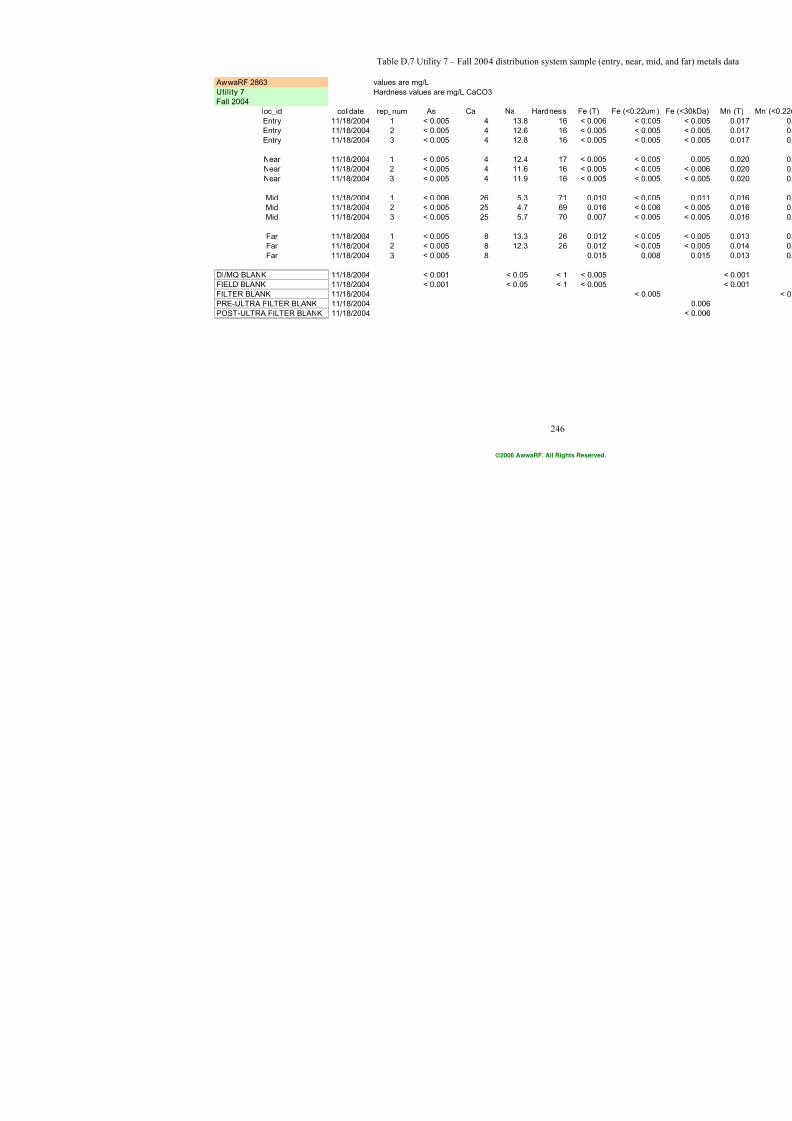
7/21/2019 Occurrence of Manganese in Drinking Water and Manganese Control
http://slidepdf.com/reader/full/occurrence-of-manganese-in-drinking-water-and-manganese-control 272/463
246
Table D.7 Utility 7 – Fall 2004 distribution system sample (en
AwwaRF 2863 values are mg/L
Utility 7 Hardness values are mg/L CaCO3
Fall 2004
loc_id colldate rep_num As Ca Na Hardness Fe (T)
Entry 11/18/2004 1 < 0.005 4 13.8 16 < 0.006
Entry 11/18/2004 2 < 0.005 4 12.6 16 < 0.005
Entry 11/18/2004 3 < 0.005 4 12.8 16 < 0.005
Near 11/18/2004 1 < 0.005 4 12.4 17 < 0.005
Near 11/18/2004 2 < 0.005 4 11.6 16 < 0.005
Near 11/18/2004 3 < 0.005 4 11.9 16 < 0.005
Mid 11/18/2004 1 < 0.006 26 5.3 71 0.010
Mid 11/18/2004 2 < 0.005 25 4.7 69 0.016
Mid 11/18/2004 3 < 0.005 25 5.7 70 0.007
Far 11/18/2004 1 < 0.005 8 13.3 26 0.012Far 11/18/2004 2 < 0.005 8 12.3 26 0.012
Far 11/18/2004 3 < 0.005 8 0.015
DI/MQ BLANK 11/18/2004 < 0.001 < 0.05 < 1 < 0.005
FIELD BLANK 11/18/2004 < 0.001 < 0.05 < 1 < 0.005
FILTER BLANK 11/18/2004
PRE-ULTRA FILTER BLANK 11/18/2004
POST-ULTRA FILTER BLANK 11/18/2004
©2006 AwwaRF. All Rights Reserved.
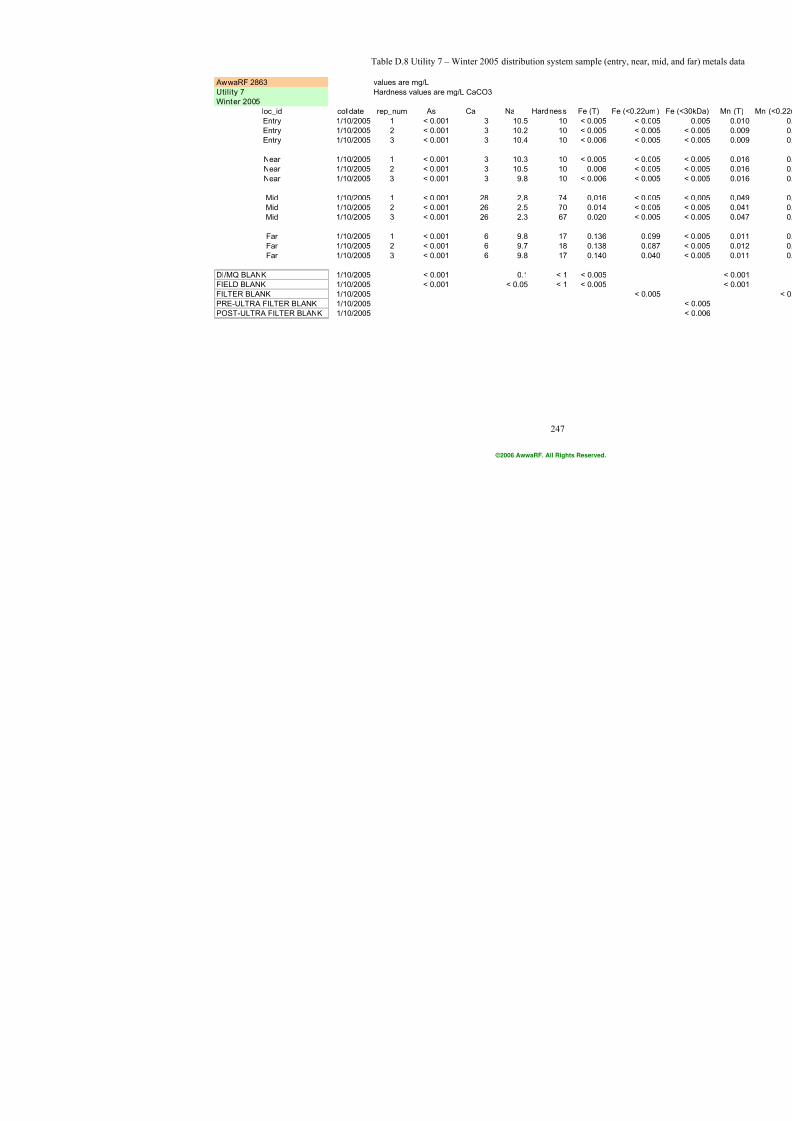
7/21/2019 Occurrence of Manganese in Drinking Water and Manganese Control
http://slidepdf.com/reader/full/occurrence-of-manganese-in-drinking-water-and-manganese-control 273/463
247
Table D.8 Utility 7 – Winter 2005 distribution system sample (
AwwaRF 2863 values are mg/L
Utility 7 Hardness values are mg/L CaCO3
Winter 2005
loc_id colldate rep_num As Ca Na Hardness Fe (T)
Entry 1/10/2005 1 < 0.001 3 10.5 10 < 0.005
Entry 1/10/2005 2 < 0.001 3 10.2 10 < 0.005
Entry 1/10/2005 3 < 0.001 3 10.4 10 < 0.006
Near 1/10/2005 1 < 0.001 3 10.3 10 < 0.005
Near 1/10/2005 2 < 0.001 3 10.5 10 0.006
Near 1/10/2005 3 < 0.001 3 9.8 10 < 0.006
Mid 1/10/2005 1 < 0.001 28 2.8 74 0.016
Mid 1/10/2005 2 < 0.001 26 2.5 70 0.014
Mid 1/10/2005 3 < 0.001 26 2.3 67 0.020
Far 1/10/2005 1 < 0.001 6 9.8 17 0.136Far 1/10/2005 2 < 0.001 6 9.7 18 0.138
Far 1/10/2005 3 < 0.001 6 9.8 17 0.140
DI/MQ BLANK 1/10/2005 < 0.001 0.1 < 1 < 0.005
FIELD BLANK 1/10/2005 < 0.001 < 0.05 < 1 < 0.005
FILTER BLANK 1/10/2005
PRE-ULTRA FILTER BLANK 1/10/2005
POST-ULTRA FILTER BLANK 1/10/2005
©2006 AwwaRF. All Rights Reserved.
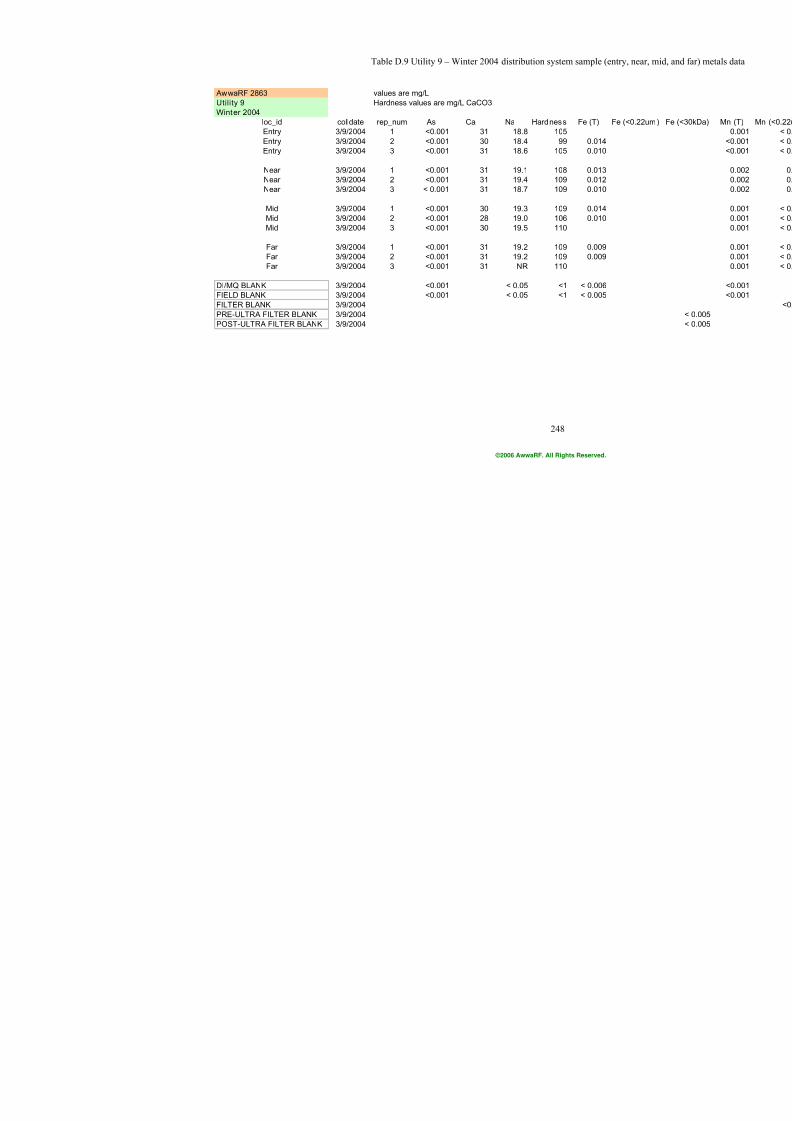
7/21/2019 Occurrence of Manganese in Drinking Water and Manganese Control
http://slidepdf.com/reader/full/occurrence-of-manganese-in-drinking-water-and-manganese-control 274/463
248
Table D.9 Utility 9 – Winter 2004 distribution system sample (
AwwaRF 2863 values are mg/L
Utility 9 Hardness values are mg/L CaCO3
Winter 2004
loc_id colldate rep_num As Ca Na Hardness Fe (T)
Entry 3/9/2004 1 <0.001 31 18.8 105
Entry 3/9/2004 2 <0.001 30 18.4 99 0.014
Entry 3/9/2004 3 <0.001 31 18.6 105 0.010
Near 3/9/2004 1 <0.001 31 19.1 108 0.013
Near 3/9/2004 2 <0.001 31 19.4 109 0.012
Near 3/9/2004 3 < 0.001 31 18.7 109 0.010
Mid 3/9/2004 1 <0.001 30 19.3 109 0.014
Mid 3/9/2004 2 <0.001 28 19.0 106 0.010
Mid 3/9/2004 3 <0.001 30 19.5 110
Far 3/9/2004 1 <0.001 31 19.2 109 0.009
Far 3/9/2004 2 <0.001 31 19.2 109 0.009
Far 3/9/2004 3 <0.001 31 NR 110
DI/MQ BLANK 3/9/2004 <0.001 < 0.05 <1 < 0.006
FIELD BLANK 3/9/2004 <0.001 < 0.05 <1 < 0.005
FILTER BLANK 3/9/2004
PRE-ULTRA FILTER BLANK 3/9/2004
POST-ULTRA FILTER BLANK 3/9/2004
©2006 AwwaRF. All Rights Reserved.
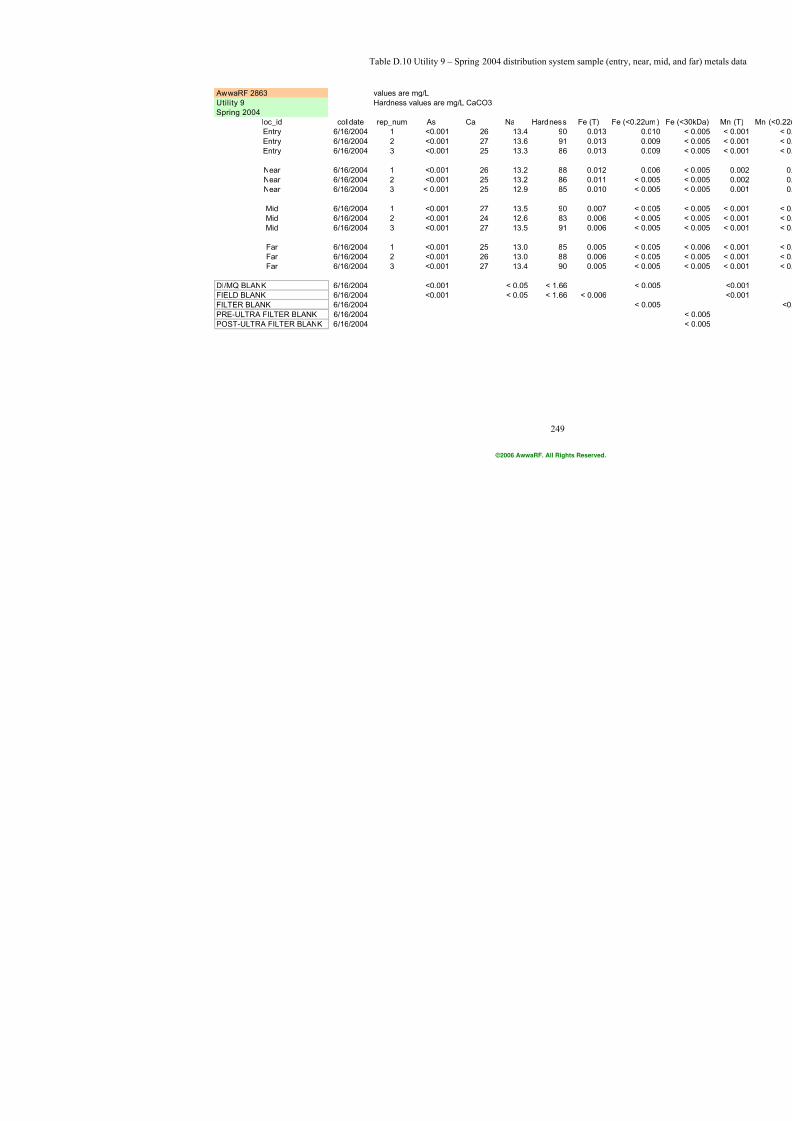
7/21/2019 Occurrence of Manganese in Drinking Water and Manganese Control
http://slidepdf.com/reader/full/occurrence-of-manganese-in-drinking-water-and-manganese-control 275/463
249
Table D.10 Utility 9 – Spring 2004 distribution system sample (
AwwaRF 2863 values are mg/L
Utility 9 Hardness values are mg/L CaCO3
Spring 2004
loc_id colldate rep_num As Ca Na Hardness Fe (T)
Entry 6/16/2004 1 <0.001 26 13.4 90 0.013
Entry 6/16/2004 2 <0.001 27 13.6 91 0.013
Entry 6/16/2004 3 <0.001 25 13.3 86 0.013
Near 6/16/2004 1 <0.001 26 13.2 88 0.012
Near 6/16/2004 2 <0.001 25 13.2 86 0.011
Near 6/16/2004 3 < 0.001 25 12.9 85 0.010
Mid 6/16/2004 1 <0.001 27 13.5 90 0.007
Mid 6/16/2004 2 <0.001 24 12.6 83 0.006
Mid 6/16/2004 3 <0.001 27 13.5 91 0.006
Far 6/16/2004 1 <0.001 25 13.0 85 0.005
Far 6/16/2004 2 <0.001 26 13.0 88 0.006
Far 6/16/2004 3 <0.001 27 13.4 90 0.005
DI/MQ BLANK 6/16/2004 <0.001 < 0.05 < 1.66
FIELD BLANK 6/16/2004 <0.001 < 0.05 < 1.66 < 0.006
FILTER BLANK 6/16/2004
PRE-ULTRA FILTER BLANK 6/16/2004
POST-ULTRA FILTER BLANK 6/16/2004
©2006 AwwaRF. All Rights Reserved.
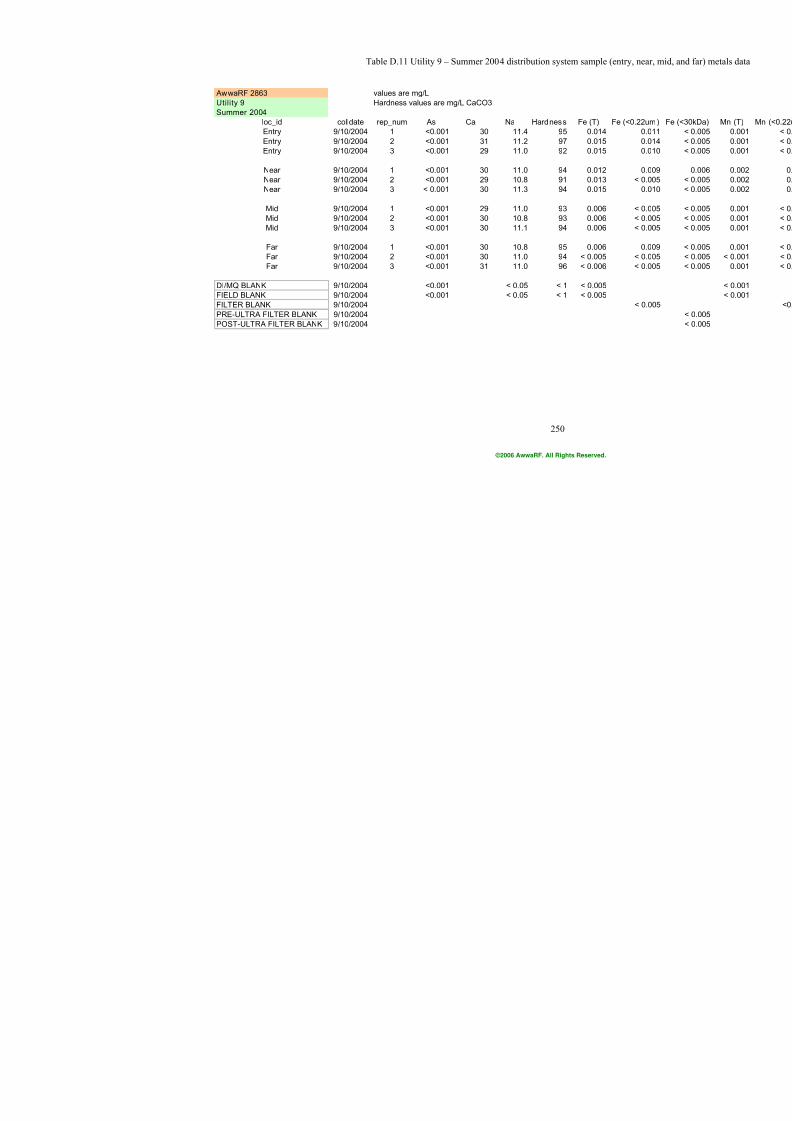
7/21/2019 Occurrence of Manganese in Drinking Water and Manganese Control
http://slidepdf.com/reader/full/occurrence-of-manganese-in-drinking-water-and-manganese-control 276/463
250
Table D.11 Utility 9 – Summer 2004 distribution system sample
AwwaRF 2863 values are mg/L
Utility 9 Hardness values are mg/L CaCO3
Summer 2004
loc_id colldate rep_num As Ca Na Hardness Fe (T)
Entry 9/10/2004 1 <0.001 30 11.4 95 0.014
Entry 9/10/2004 2 <0.001 31 11.2 97 0.015
Entry 9/10/2004 3 <0.001 29 11.0 92 0.015
Near 9/10/2004 1 <0.001 30 11.0 94 0.012
Near 9/10/2004 2 <0.001 29 10.8 91 0.013
Near 9/10/2004 3 < 0.001 30 11.3 94 0.015
Mid 9/10/2004 1 <0.001 29 11.0 93 0.006
Mid 9/10/2004 2 <0.001 30 10.8 93 0.006
Mid 9/10/2004 3 <0.001 30 11.1 94 0.006
Far 9/10/2004 1 <0.001 30 10.8 95 0.006
Far 9/10/2004 2 <0.001 30 11.0 94 < 0.005
Far 9/10/2004 3 <0.001 31 11.0 96 < 0.006
DI/MQ BLANK 9/10/2004 <0.001 < 0.05 < 1 < 0.005
FIELD BLANK 9/10/2004 <0.001 < 0.05 < 1 < 0.005
FILTER BLANK 9/10/2004
PRE-ULTRA FILTER BLANK 9/10/2004
POST-ULTRA FILTER BLANK 9/10/2004
©2006 AwwaRF. All Rights Reserved.
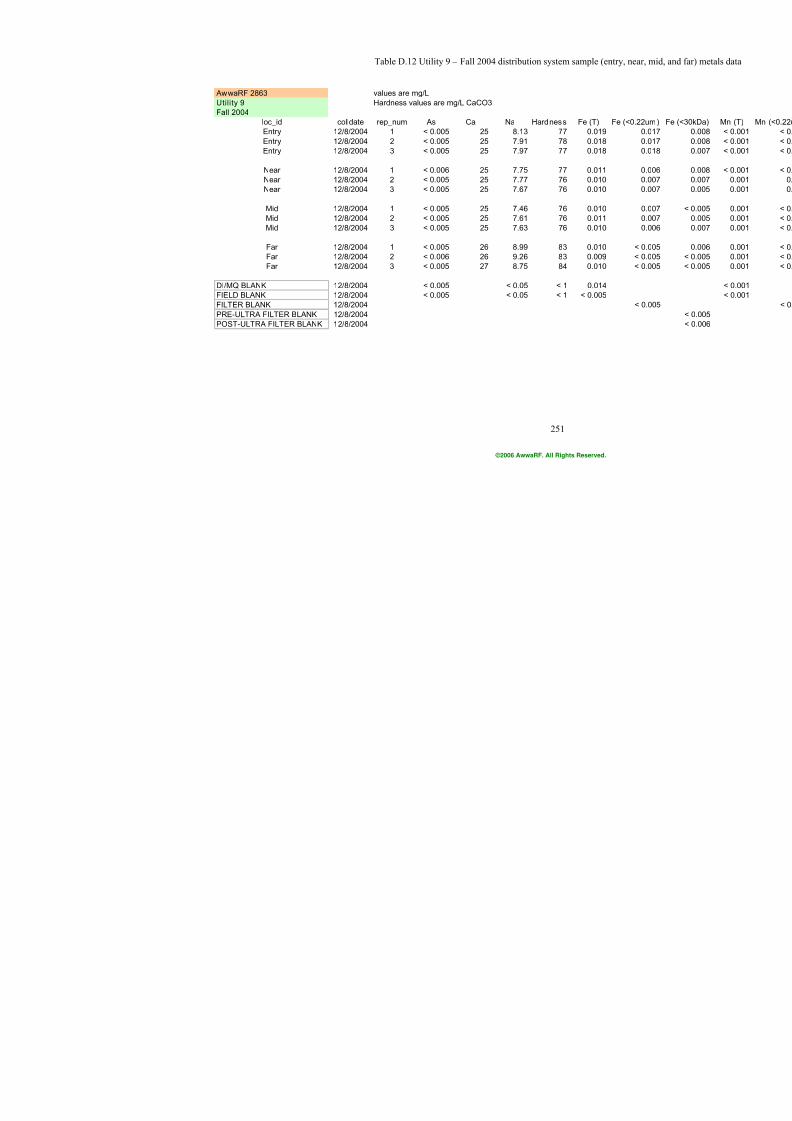
7/21/2019 Occurrence of Manganese in Drinking Water and Manganese Control
http://slidepdf.com/reader/full/occurrence-of-manganese-in-drinking-water-and-manganese-control 277/463
251
Table D.12 Utility 9 – Fall 2004 distribution system sample (e
AwwaRF 2863 values are mg/L
Utility 9 Hardness values are mg/L CaCO3
Fall 2004
loc_id colldate rep_num As Ca Na Hardness Fe (T)
Entry 12/8/2004 1 < 0.005 25 8.13 77 0.019
Entry 12/8/2004 2 < 0.005 25 7.91 78 0.018
Entry 12/8/2004 3 < 0.005 25 7.97 77 0.018
Near 12/8/2004 1 < 0.006 25 7.75 77 0.011
Near 12/8/2004 2 < 0.005 25 7.77 76 0.010
Near 12/8/2004 3 < 0.005 25 7.67 76 0.010
Mid 12/8/2004 1 < 0.005 25 7.46 76 0.010
Mid 12/8/2004 2 < 0.005 25 7.61 76 0.011
Mid 12/8/2004 3 < 0.005 25 7.63 76 0.010
Far 12/8/2004 1 < 0.005 26 8.99 83 0.010
Far 12/8/2004 2 < 0.006 26 9.26 83 0.009
Far 12/8/2004 3 < 0.005 27 8.75 84 0.010
DI/MQ BLANK 12/8/2004 < 0.005 < 0.05 < 1 0.014
FIELD BLANK 12/8/2004 < 0.005 < 0.05 < 1 < 0.005
FILTER BLANK 12/8/2004
PRE-ULTRA FILTER BLANK 12/8/2004
POST-ULTRA FILTER BLANK 12/8/2004
©2006 AwwaRF. All Rights Reserved.

7/21/2019 Occurrence of Manganese in Drinking Water and Manganese Control
http://slidepdf.com/reader/full/occurrence-of-manganese-in-drinking-water-and-manganese-control 278/463
252
Table D.13 Utility 21 – Spring 2004 distribution system sample
AwwaRF 2863 values are mg/L
Utility 21 Hardness values are mg/L CaCO3
Spring 2004
loc_id colldate rep_num As Ca Na Hardness Fe (T)
Entry 4/29/2004 1 0.003 18 16.8 53 0.006
Entry 4/29/2004 2 0.003 18 18.2 53 0.006
Entry 4/29/2004 3 0.003 19 17.6 54 0.006
Near 4/29/2004 1 0.003 15 17.4 44 < 0.005
Near 4/29/2004 2 0.003 19 17.1 55 0.005
Near 4/29/2004 3 0.003 19 17.8 54 < 0.006
Mid 4/29/2004 1 0.004 18 17.8 53 < 0.005
Mid 4/29/2004 2 0.004 20 17.4 57 < 0.005
Mid 4/29/2004 3 0.004 18 17.5 53 < 0.005
Far 4/29/2004 1 0.004 18 18.4 53 0.008
Far 4/29/2004 2 0.004 18 18.0 53 0.008
Far 4/29/2004 3 0.004 18 17.8 53 0.008
DI/MQ BLANK 4/29/2004 < 0.001 0.3 3 < 0.005
FIELD BLANK 4/29/2004 < 0.001 0.2 3 < 0.006
FILTER BLANK 4/29/2004
PRE-ULTRA FILTER BLANK 4/29/2004
POST-ULTRA FILTER BLANK 4/29/2004
©2006 AwwaRF. All Rights Reserved.
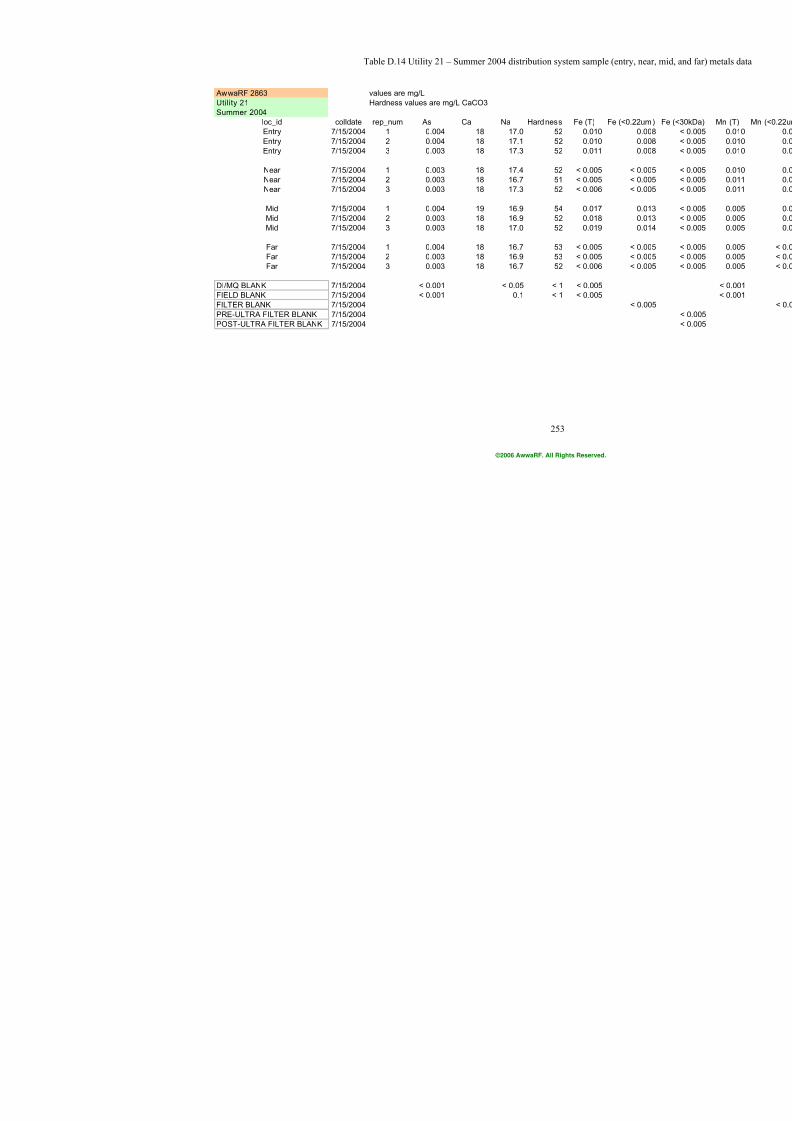
7/21/2019 Occurrence of Manganese in Drinking Water and Manganese Control
http://slidepdf.com/reader/full/occurrence-of-manganese-in-drinking-water-and-manganese-control 279/463
253
Table D.14 Utility 21 – Summer 2004 distribution system sample
AwwaRF 2863 values are mg/L
Utility 21 Hardness values are mg/L CaCO3
Summer 2004
loc_id colldate rep_num As Ca Na Hardness Fe (T)
Entry 7/15/2004 1 0.004 18 17.0 52 0.010
Entry 7/15/2004 2 0.004 18 17.1 52 0.010
Entry 7/15/2004 3 0.003 18 17.3 52 0.011
Near 7/15/2004 1 0.003 18 17.4 52 < 0.005
Near 7/15/2004 2 0.003 18 16.7 51 < 0.005
Near 7/15/2004 3 0.003 18 17.3 52 < 0.006
Mid 7/15/2004 1 0.004 19 16.9 54 0.017
Mid 7/15/2004 2 0.003 18 16.9 52 0.018
Mid 7/15/2004 3 0.003 18 17.0 52 0.019
Far 7/15/2004 1 0.004 18 16.7 53 < 0.005
Far 7/15/2004 2 0.003 18 16.9 53 < 0.005
Far 7/15/2004 3 0.003 18 16.7 52 < 0.006
DI/MQ BLANK 7/15/2004 < 0.001 < 0.05 < 1 < 0.005
FIELD BLANK 7/15/2004 < 0.001 0.1 < 1 < 0.005
FILTER BLANK 7/15/2004
PRE-ULTRA FILTER BLANK 7/15/2004
POST-ULTRA FILTER BLANK 7/15/2004
©2006 AwwaRF. All Rights Reserved.
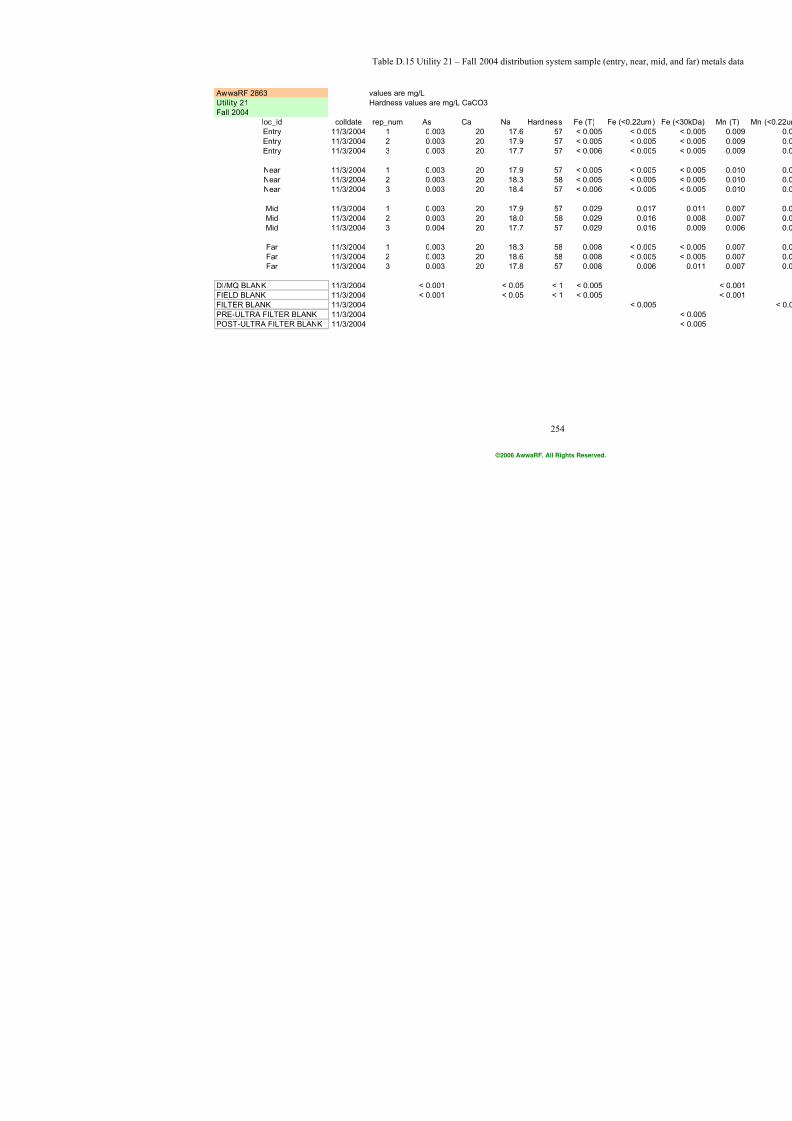
7/21/2019 Occurrence of Manganese in Drinking Water and Manganese Control
http://slidepdf.com/reader/full/occurrence-of-manganese-in-drinking-water-and-manganese-control 280/463
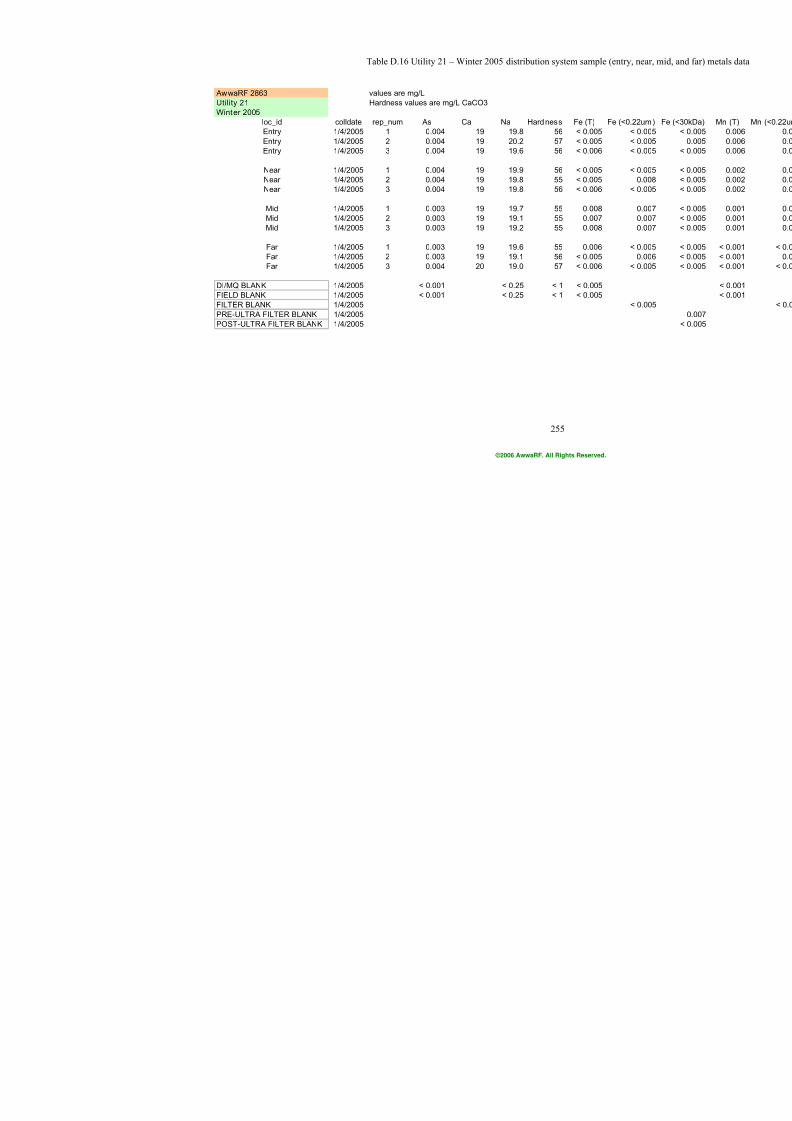
7/21/2019 Occurrence of Manganese in Drinking Water and Manganese Control
http://slidepdf.com/reader/full/occurrence-of-manganese-in-drinking-water-and-manganese-control 281/463
255
Table D.16 Utility 21 – Winter 2005 distribution system sample
AwwaRF 2863 values are mg/L
Utility 21 Hardness values are mg/L CaCO3
Winter 2005
loc_id colldate rep_num As Ca Na Hardness Fe (T)
Entry 1/4/2005 1 0.004 19 19.8 56 < 0.005
Entry 1/4/2005 2 0.004 19 20.2 57 < 0.005
Entry 1/4/2005 3 0.004 19 19.6 56 < 0.006
Near 1/4/2005 1 0.004 19 19.9 56 < 0.005
Near 1/4/2005 2 0.004 19 19.8 55 < 0.005
Near 1/4/2005 3 0.004 19 19.8 56 < 0.006
Mid 1/4/2005 1 0.003 19 19.7 55 0.008
Mid 1/4/2005 2 0.003 19 19.1 55 0.007
Mid 1/4/2005 3 0.003 19 19.2 55 0.008
Far 1/4/2005 1 0.003 19 19.6 55 0.006
Far 1/4/2005 2 0.003 19 19.1 56 < 0.005
Far 1/4/2005 3 0.004 20 19.0 57 < 0.006
DI/MQ BLANK 1/4/2005 < 0.001 < 0.25 < 1 < 0.005
FIELD BLANK 1/4/2005 < 0.001 < 0.25 < 1 < 0.005
FILTER BLANK 1/4/2005
PRE-ULTRA FILTER BLANK 1/4/2005
POST-ULTRA FILTER BLANK 1/4/2005
©2006 AwwaRF. All Rights Reserved.
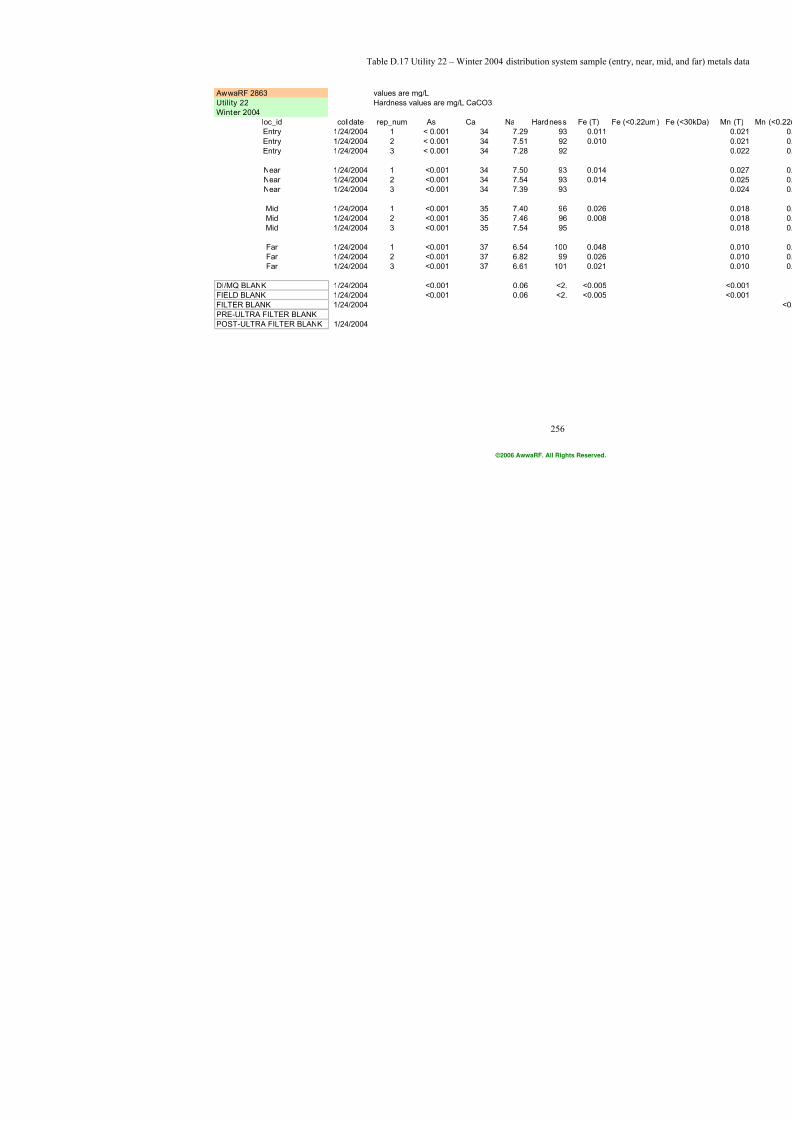
7/21/2019 Occurrence of Manganese in Drinking Water and Manganese Control
http://slidepdf.com/reader/full/occurrence-of-manganese-in-drinking-water-and-manganese-control 282/463
256
Table D.17 Utility 22 – Winter 2004 distribution system sample
AwwaRF 2863 values are mg/L
Utility 22 Hardness values are mg/L CaCO3
Winter 2004
loc_id colldate rep_num As Ca Na Hardness Fe (T)
Entry 1/24/2004 1 < 0.001 34 7.29 93 0.011
Entry 1/24/2004 2 < 0.001 34 7.51 92 0.010
Entry 1/24/2004 3 < 0.001 34 7.28 92
Near 1/24/2004 1 <0.001 34 7.50 93 0.014
Near 1/24/2004 2 <0.001 34 7.54 93 0.014
Near 1/24/2004 3 <0.001 34 7.39 93
Mid 1/24/2004 1 <0.001 35 7.40 96 0.026
Mid 1/24/2004 2 <0.001 35 7.46 96 0.008
Mid 1/24/2004 3 <0.001 35 7.54 95
Far 1/24/2004 1 <0.001 37 6.54 100 0.048
Far 1/24/2004 2 <0.001 37 6.82 99 0.026
Far 1/24/2004 3 <0.001 37 6.61 101 0.021
DI/MQ BLANK 1/24/2004 <0.001 0.06 <2. <0.005
FIELD BLANK 1/24/2004 <0.001 0.06 <2. <0.005
FILTER BLANK 1/24/2004
PRE-ULTRA FILTER BLANK
POST-ULTRA FILTER BLANK 1/24/2004
©2006 AwwaRF. All Rights Reserved.

7/21/2019 Occurrence of Manganese in Drinking Water and Manganese Control
http://slidepdf.com/reader/full/occurrence-of-manganese-in-drinking-water-and-manganese-control 283/463
257
Table D.18 Utility 22 – Spring 2004 distribution system sample
AwwaRF 2863 values are mg/L
Utility 22 Hardness values are mg/L CaCO3
Spring 2004
loc_id colldate rep_num As Ca Na Hardness Fe (T)
Entry 4/20/2004 1 < 0.001 29 9.37 79 0.007
Entry 4/20/2004 2 < 0.001 29 9.43 80 0.009
Entry 4/20/2004 3 < 0.001 29 9.51 81 0.010
Near 4/20/2004 1 <0.001 29 9.60 81 0.012
Near 4/20/2004 2 <0.001 29 9.58 80 0.010
Near 4/20/2004 3 <0.001 29 9.29 79 0.009
Mid 4/20/2004 1 <0.001 29 9.40 80 0.010
Mid 4/20/2004 2 <0.001 29 9.90 80 0.009
Mid 4/20/2004 3 <0.001 30 9.60 81 0.007
Far 4/20/2004 1 <0.001 34 9.69 91 0.014
Far 4/20/2004 2 <0.001 33 9.30 89 0.015
Far 4/20/2004 3 <0.001 33 9.42 90 0.015
DI/MQ BLANK 4/20/2004 <0.001 < 0.05 < 1 <0.005
FIELD BLANK 4/20/2004 <0.001 < 0.05 < 1 <0.005
FILTER BLANK 4/20/2004
PRE-ULTRA FILTER BLANK 4/20/2004
POST-ULTRA FILTER BLANK 4/20/2004
©2006 AwwaRF. All Rights Reserved.

7/21/2019 Occurrence of Manganese in Drinking Water and Manganese Control
http://slidepdf.com/reader/full/occurrence-of-manganese-in-drinking-water-and-manganese-control 284/463
258
Table D.19 Utility 22 – Summer 2004 distribution system sample
AwwaRF 2863 values are mg/L
Utility 22 Hardness values are mg/L CaCO3
Summer 2004
loc_id colldate rep_num As Ca Na Hardness Fe (T)
Entry 8/27/2004 1 < 0.001 32 3.92 85 0.011
Entry 8/27/2004 2 < 0.001 31 3.98 83 0.011
Entry 8/27/2004 3 < 0.001 32 3.89 84 0.011
Near 8/27/2004 1 < 0.001 32 3.79 86 0.009
Near 8/27/2004 2 < 0.001 32 3.62 85 0.009
Near 8/27/2004 3 < 0.001 32 3.52 85 0.009
Mid 8/27/2004 1 < 0.001 31 3.67 82 0.005
Mid 8/27/2004 2 < 0.001 31 3.52 82 0.006
Mid 8/27/2004 3 < 0.001 31 3.64 82 < 0.006
Far 8/27/2004 1 < 0.001 32 3.67 83 0.015
Far 8/27/2004 2 < 0.001 32 3.70 83 0.013
Far 8/27/2004 3 < 0.001 32 3.71 84 0.013
DI/MQ BLANK 8/27/2004 < 0.001 < 1 < 2 < 0.005
FIELD BLANK 8/27/2004 < 0.001 < 1 < 2 < 0.005
FILTER BLANK 8/27/2004
PRE-ULTRA FILTER BLANK 8/27/2004
POST-ULTRA FILTER BLANK 8/27/2004
©2006 AwwaRF. All Rights Reserved.
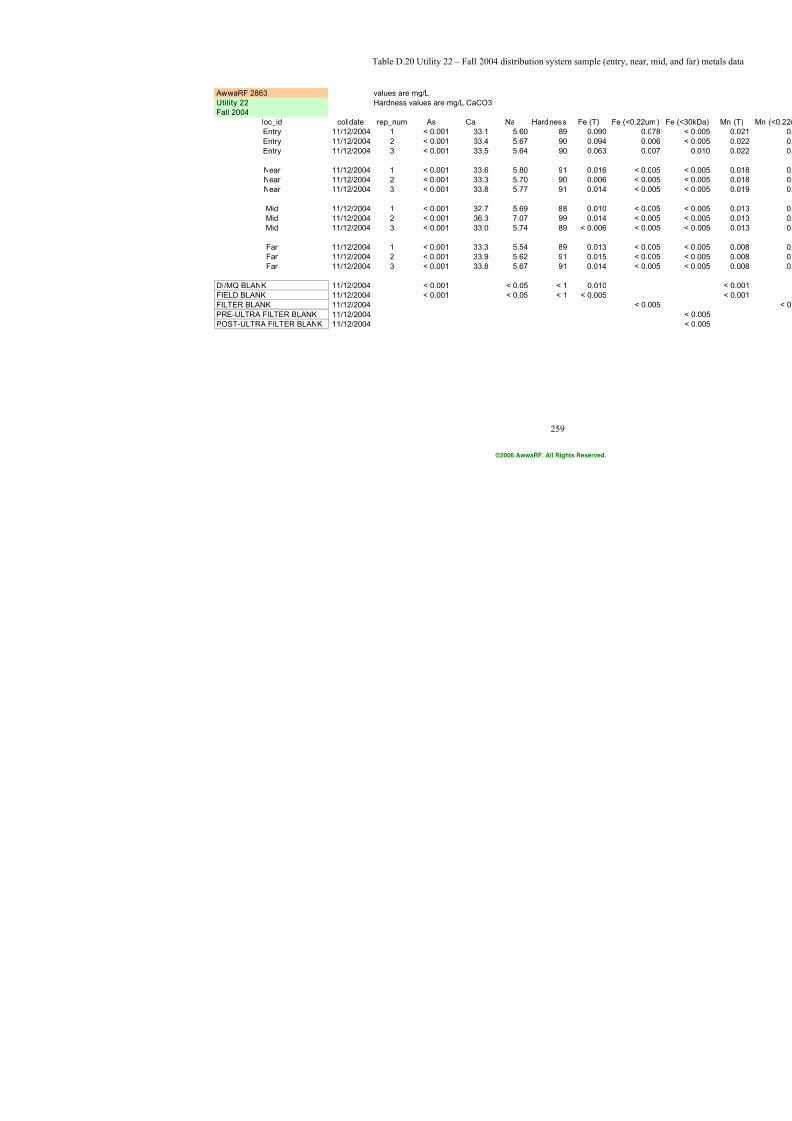
7/21/2019 Occurrence of Manganese in Drinking Water and Manganese Control
http://slidepdf.com/reader/full/occurrence-of-manganese-in-drinking-water-and-manganese-control 285/463
259
Table D.20 Utility 22 – Fall 2004 distribution system sample (e
AwwaRF 2863 values are mg/L
Utility 22 Hardness values are mg/L CaCO3
Fall 2004
loc_id colldate rep_num As Ca Na Hardness Fe (T)
Entry 11/12/2004 1 < 0.001 33.1 5.60 89 0.090
Entry 11/12/2004 2 < 0.001 33.4 5.67 90 0.094
Entry 11/12/2004 3 < 0.001 33.5 5.64 90 0.063
Near 11/12/2004 1 < 0.001 33.6 5.80 91 0.016
Near 11/12/2004 2 < 0.001 33.3 5.70 90 0.006
Near 11/12/2004 3 < 0.001 33.8 5.77 91 0.014
Mid 11/12/2004 1 < 0.001 32.7 5.69 88 0.010
Mid 11/12/2004 2 < 0.001 36.3 7.07 99 0.014
Mid 11/12/2004 3 < 0.001 33.0 5.74 89 < 0.006
Far 11/12/2004 1 < 0.001 33.3 5.54 89 0.013
Far 11/12/2004 2 < 0.001 33.9 5.62 91 0.015
Far 11/12/2004 3 < 0.001 33.8 5.67 91 0.014
DI/MQ BLANK 11/12/2004 < 0.001 < 0.05 < 1 0.010
FIELD BLANK 11/12/2004 < 0.001 < 0.05 < 1 < 0.005
FILTER BLANK 11/12/2004
PRE-ULTRA FILTER BLANK 11/12/2004
POST-ULTRA FILTER BLANK 11/12/2004
©2006 AwwaRF. All Rights Reserved.
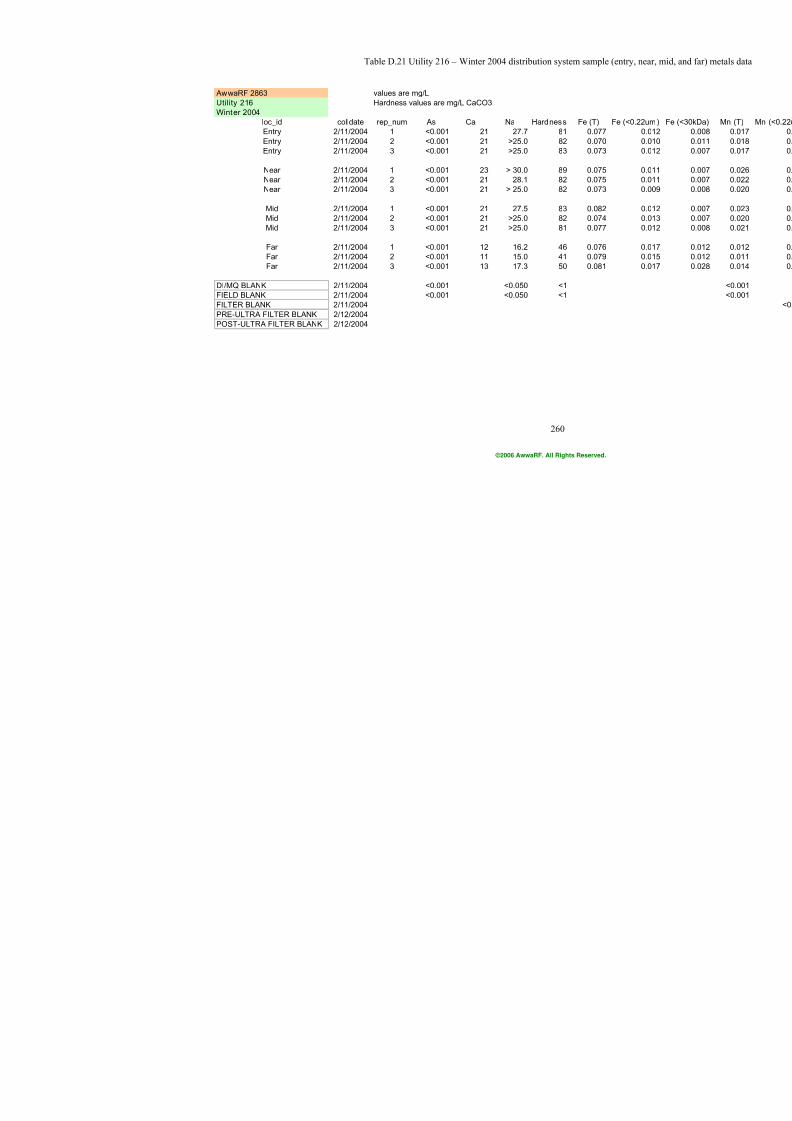
7/21/2019 Occurrence of Manganese in Drinking Water and Manganese Control
http://slidepdf.com/reader/full/occurrence-of-manganese-in-drinking-water-and-manganese-control 286/463
260
Table D.21 Utility 216 – Winter 2004 distribution system sample
AwwaRF 2863 values are mg/L
Utility 216 Hardness values are mg/L CaCO3
Winter 2004
loc_id colldate rep_num As Ca Na Hardness Fe (T)
Entry 2/11/2004 1 <0.001 21 27.7 81 0.077
Entry 2/11/2004 2 <0.001 21 >25.0 82 0.070
Entry 2/11/2004 3 <0.001 21 >25.0 83 0.073
Near 2/11/2004 1 <0.001 23 > 30.0 89 0.075
Near 2/11/2004 2 <0.001 21 28.1 82 0.075
Near 2/11/2004 3 <0.001 21 > 25.0 82 0.073
Mid 2/11/2004 1 <0.001 21 27.5 83 0.082
Mid 2/11/2004 2 <0.001 21 >25.0 82 0.074
Mid 2/11/2004 3 <0.001 21 >25.0 81 0.077
Far 2/11/2004 1 <0.001 12 16.2 46 0.076
Far 2/11/2004 2 <0.001 11 15.0 41 0.079
Far 2/11/2004 3 <0.001 13 17.3 50 0.081
DI/MQ BLANK 2/11/2004 <0.001 <0.050 <1
FIELD BLANK 2/11/2004 <0.001 <0.050 <1
FILTER BLANK 2/11/2004
PRE-ULTRA FILTER BLANK 2/12/2004
POST-ULTRA FILTER BLANK 2/12/2004
©2006 AwwaRF. All Rights Reserved.
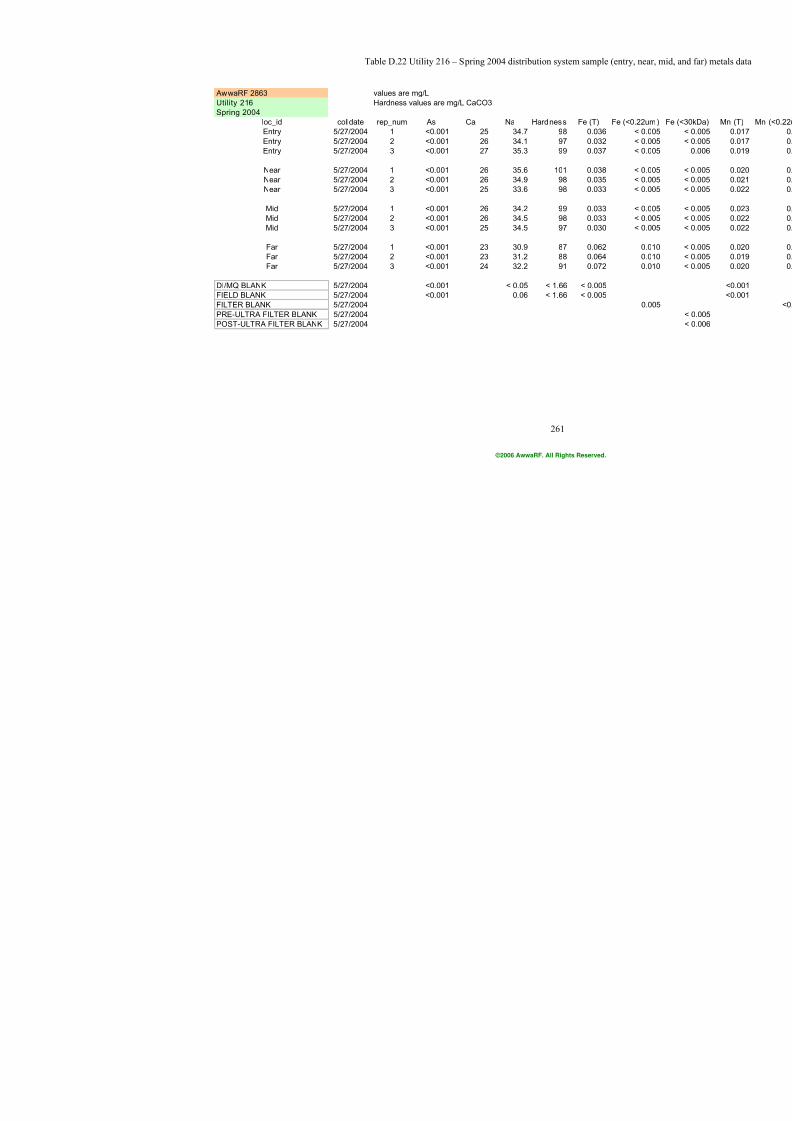
7/21/2019 Occurrence of Manganese in Drinking Water and Manganese Control
http://slidepdf.com/reader/full/occurrence-of-manganese-in-drinking-water-and-manganese-control 287/463
261
Table D.22 Utility 216 – Spring 2004 distribution system sample
AwwaRF 2863 values are mg/L
Utility 216 Hardness values are mg/L CaCO3
Spring 2004
loc_id colldate rep_num As Ca Na Hardness Fe (T)
Entry 5/27/2004 1 <0.001 25 34.7 98 0.036
Entry 5/27/2004 2 <0.001 26 34.1 97 0.032
Entry 5/27/2004 3 <0.001 27 35.3 99 0.037
Near 5/27/2004 1 <0.001 26 35.6 101 0.038
Near 5/27/2004 2 <0.001 26 34.9 98 0.035
Near 5/27/2004 3 <0.001 25 33.6 98 0.033
Mid 5/27/2004 1 <0.001 26 34.2 99 0.033
Mid 5/27/2004 2 <0.001 26 34.5 98 0.033
Mid 5/27/2004 3 <0.001 25 34.5 97 0.030
Far 5/27/2004 1 <0.001 23 30.9 87 0.062
Far 5/27/2004 2 <0.001 23 31.2 88 0.064
Far 5/27/2004 3 <0.001 24 32.2 91 0.072
DI/MQ BLANK 5/27/2004 <0.001 < 0.05 < 1.66 < 0.005
FIELD BLANK 5/27/2004 <0.001 0.06 < 1.66 < 0.005
FILTER BLANK 5/27/2004
PRE-ULTRA FILTER BLANK 5/27/2004
POST-ULTRA FILTER BLANK 5/27/2004
©2006 AwwaRF. All Rights Reserved.
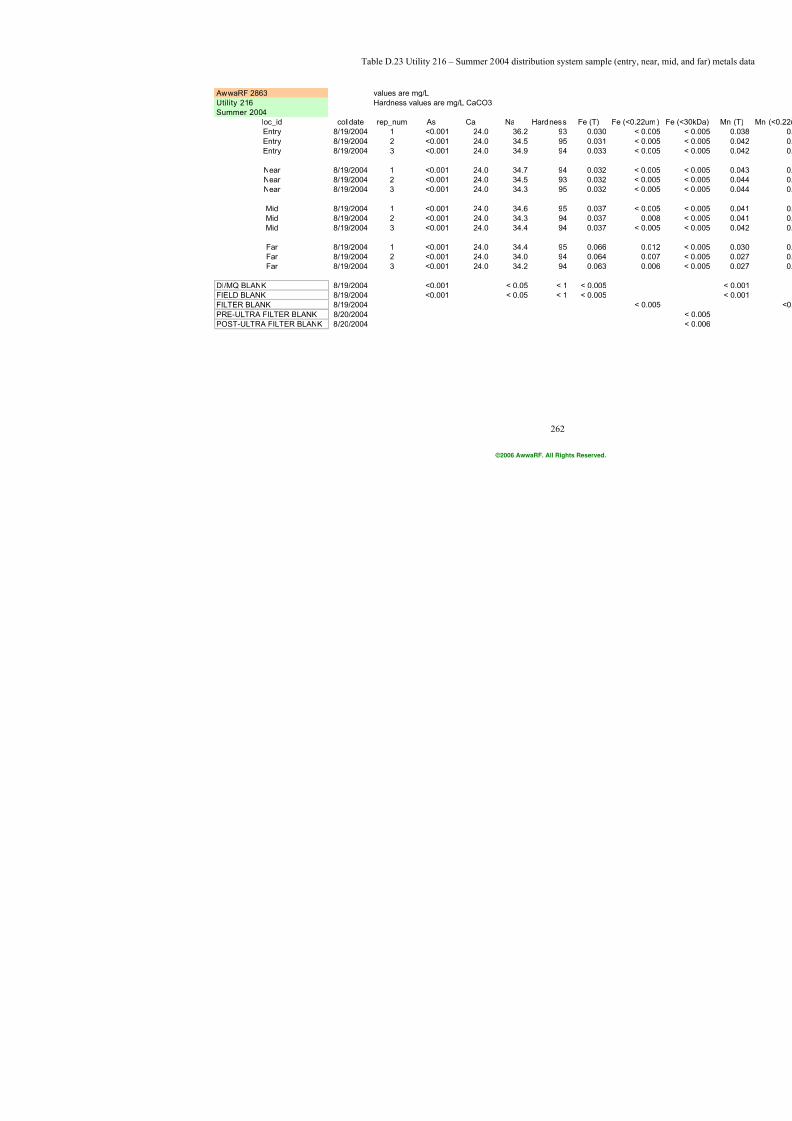
7/21/2019 Occurrence of Manganese in Drinking Water and Manganese Control
http://slidepdf.com/reader/full/occurrence-of-manganese-in-drinking-water-and-manganese-control 288/463
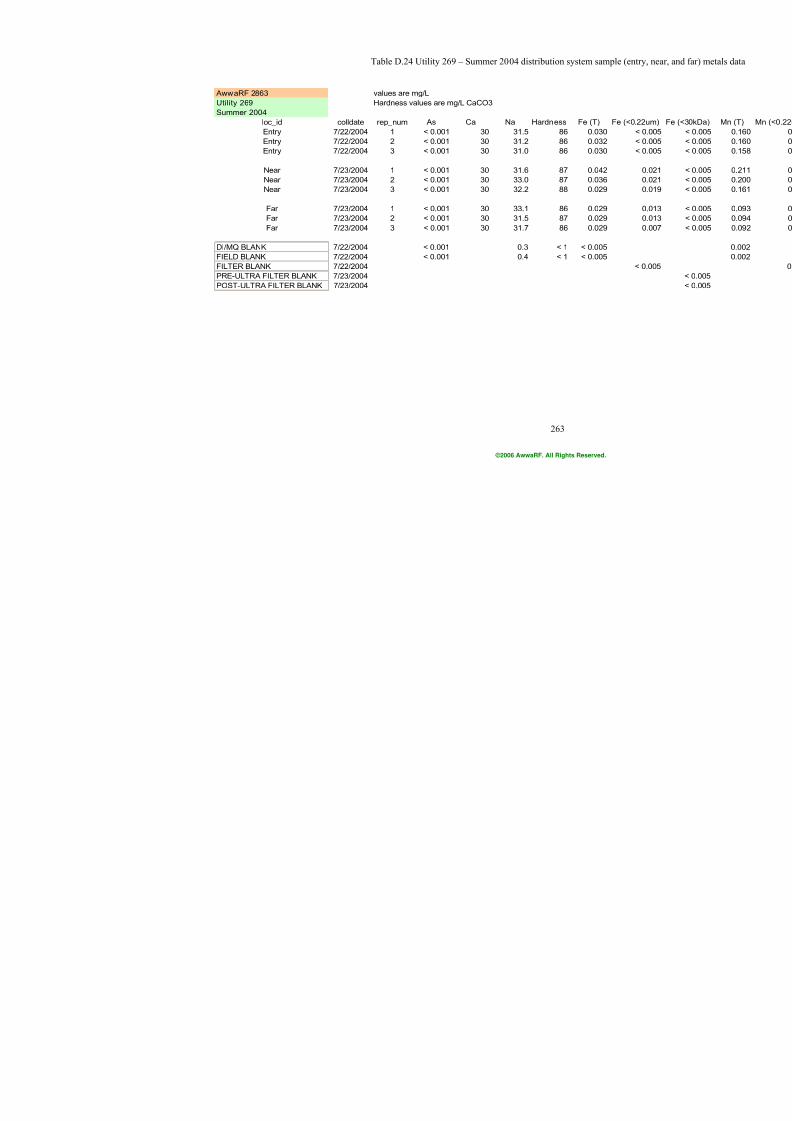
7/21/2019 Occurrence of Manganese in Drinking Water and Manganese Control
http://slidepdf.com/reader/full/occurrence-of-manganese-in-drinking-water-and-manganese-control 289/463
263
Table D.24 Utility 269 – Summer 2004 distribution system sam
AwwaRF 2863 values are mg/L
Utility 269 Hardness values are mg/L CaCO3
Summer 2004
loc_id colldate rep_num As Ca Na Hardness Fe (T)
Entry 7/22/2004 1 < 0.001 30 31.5 86 0.030
Entry 7/22/2004 2 < 0.001 30 31.2 86 0.032
Entry 7/22/2004 3 < 0.001 30 31.0 86 0.030
Near 7/23/2004 1 < 0.001 30 31.6 87 0.042
Near 7/23/2004 2 < 0.001 30 33.0 87 0.036
Near 7/23/2004 3 < 0.001 30 32.2 88 0.029
Far 7/23/2004 1 < 0.001 30 33.1 86 0.029
Far 7/23/2004 2 < 0.001 30 31.5 87 0.029
Far 7/23/2004 3 < 0.001 30 31.7 86 0.029
DI/MQ BLANK 7/22/2004 < 0.001 0.3 < 1 < 0.005
FIELD BLANK 7/22/2004 < 0.001 0.4 < 1 < 0.005
FILTER BLANK 7/22/2004
PRE-ULTRA FILTER BLANK 7/23/2004
POST-ULTRA FILTER BLANK 7/23/2004
©2006 AwwaRF. All Rights Reserved.
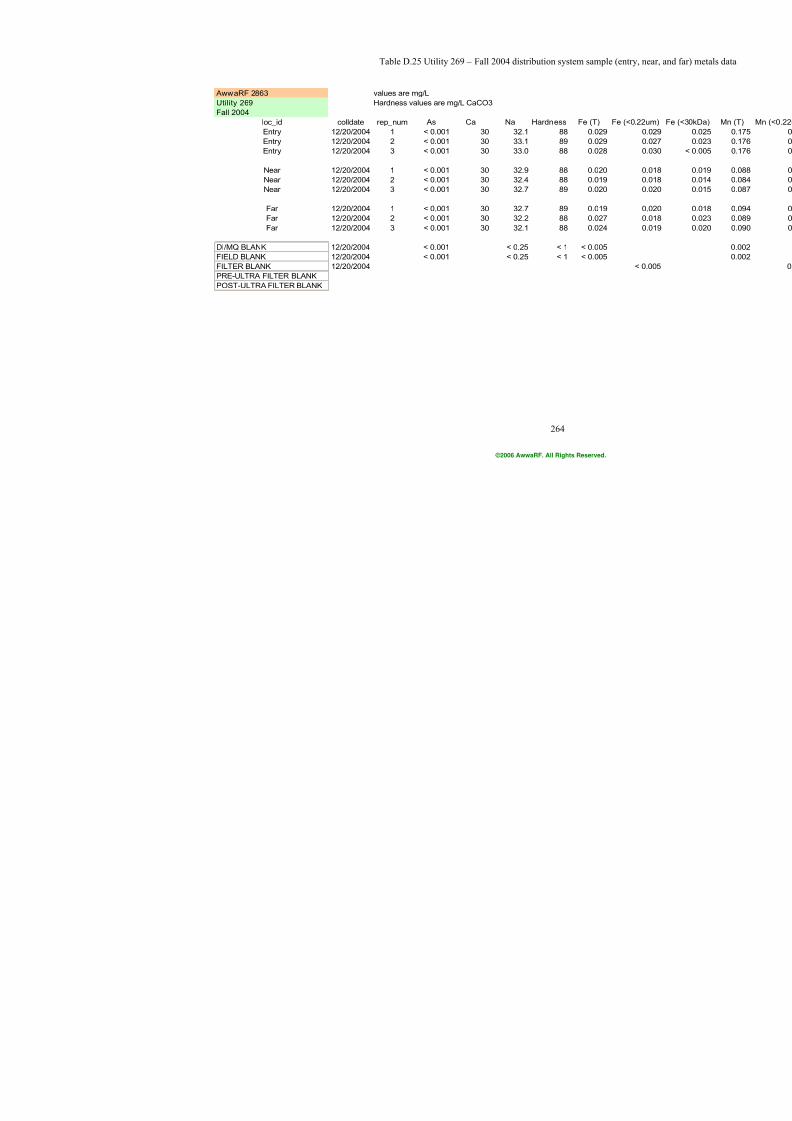
7/21/2019 Occurrence of Manganese in Drinking Water and Manganese Control
http://slidepdf.com/reader/full/occurrence-of-manganese-in-drinking-water-and-manganese-control 290/463
264
Table D.25 Utility 269 – Fall 2004 distribution system sampl
AwwaRF 2863 values are mg/L
Utility 269 Hardness values are mg/L CaCO3
Fall 2004
loc_id colldate rep_num As Ca Na Hardness Fe (T)
Entry 12/20/2004 1 < 0.001 30 32.1 88 0.029
Entry 12/20/2004 2 < 0.001 30 33.1 89 0.029
Entry 12/20/2004 3 < 0.001 30 33.0 88 0.028
Near 12/20/2004 1 < 0.001 30 32.9 88 0.020
Near 12/20/2004 2 < 0.001 30 32.4 88 0.019
Near 12/20/2004 3 < 0.001 30 32.7 89 0.020
Far 12/20/2004 1 < 0.001 30 32.7 89 0.019
Far 12/20/2004 2 < 0.001 30 32.2 88 0.027
Far 12/20/2004 3 < 0.001 30 32.1 88 0.024
DI/MQ BLANK 12/20/2004 < 0.001 < 0.25 < 1 < 0.005
FIELD BLANK 12/20/2004 < 0.001 < 0.25 < 1 < 0.005
FILTER BLANK 12/20/2004
PRE-ULTRA FILTER BLANK
POST-ULTRA FILTER BLANK
©2006 AwwaRF. All Rights Reserved.

7/21/2019 Occurrence of Manganese in Drinking Water and Manganese Control
http://slidepdf.com/reader/full/occurrence-of-manganese-in-drinking-water-and-manganese-control 291/463
265
Table D.26 Utility 315 – Winter 2004 distribution system sample
AwwaRF 2863 values are mg/L
Utility 315 Hardness values are mg/L CaCO3
Winter 2004
loc_id colldate rep_num As Ca Na Hardness Fe (T)
Entry 2/11/2004 1 <0.001 29 >25 107 0.021
Entry 2/11/2004 2 <0.001 31 >25 107 0.024
Entry 2/11/2004 3 <0.001 27 >25 110 0.027
Near 2/11/2004 1 <0.001 23 >25 110 0.014
Near 2/11/2004 2 <0.001 28 >25 118 0.015
Near 2/11/2004 3 <0.001 29 >25 121 0.046
Mid 2/11/2004 1 <0.001 26 >25 100 0.034
Mid 2/11/2004 2 <0.001 23 >25 100 0.036
Mid 2/11/2004 3 <0.001 28 >25 103 0.040
Far 2/11/2004 1 <0.001 31 >25 87 0.049
Far 2/11/2004 2 <0.001 27 >25 90 0.050
Far 2/11/2004 3 <0.001 25 >25 93 0.055
DI/MQ BLANK 2/11/2004 <0.001 < 0.05 <1 < 0.01
FIELD BLANK 2/11/2004 <0.001 < 0.05 <1 < 0.01
FILTER BLANK 2/11/2004
PRE-ULTRA FILTER BLANK 2/12/2004
POST-ULTRA FILTER BLANK 2/12/2004
©2006 AwwaRF. All Rights Reserved.
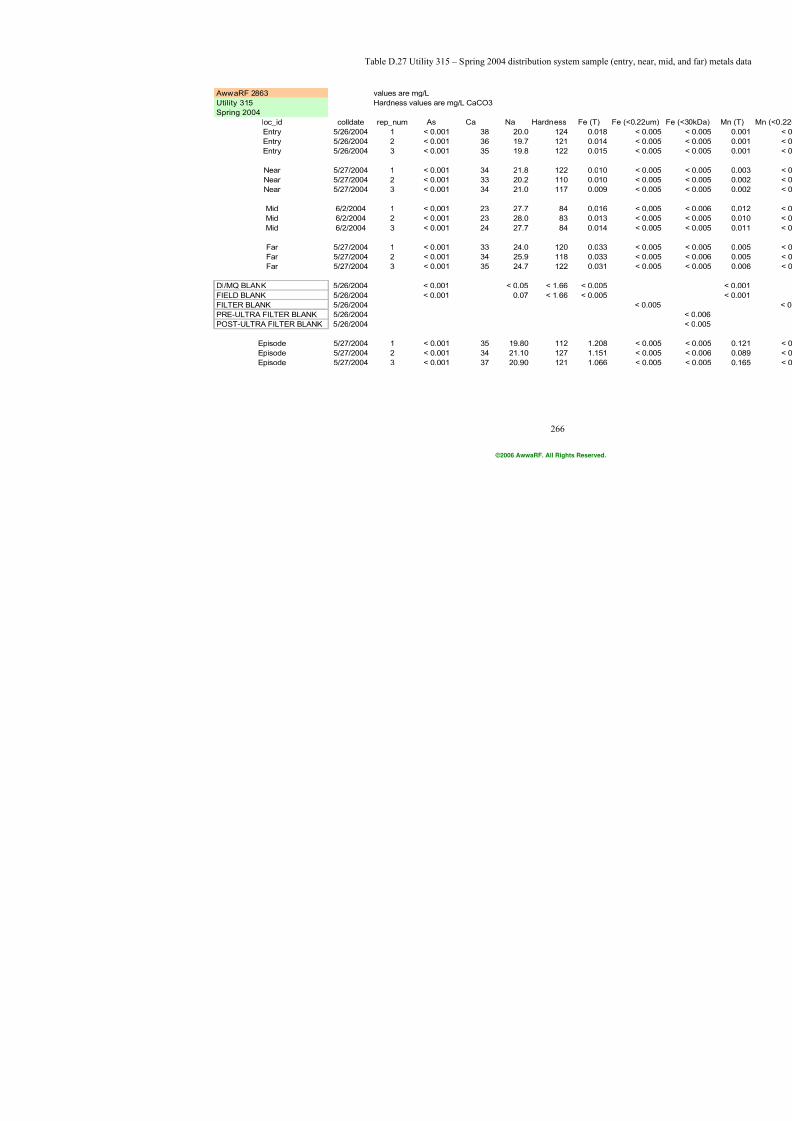
7/21/2019 Occurrence of Manganese in Drinking Water and Manganese Control
http://slidepdf.com/reader/full/occurrence-of-manganese-in-drinking-water-and-manganese-control 292/463
266
Table D.27 Utility 315 – Spring 2004 distribution system sample
AwwaRF 2863 values are mg/L
Utility 315 Hardness values are mg/L CaCO3
Spring 2004
loc_id colldate rep_num As Ca Na Hardness Fe (T)
Entry 5/26/2004 1 < 0.001 38 20.0 124 0.018
Entry 5/26/2004 2 < 0.001 36 19.7 121 0.014
Entry 5/26/2004 3 < 0.001 35 19.8 122 0.015
Near 5/27/2004 1 < 0.001 34 21.8 122 0.010
Near 5/27/2004 2 < 0.001 33 20.2 110 0.010
Near 5/27/2004 3 < 0.001 34 21.0 117 0.009
Mid 6/2/2004 1 < 0.001 23 27.7 84 0.016
Mid 6/2/2004 2 < 0.001 23 28.0 83 0.013
Mid 6/2/2004 3 < 0.001 24 27.7 84 0.014
Far 5/27/2004 1 < 0.001 33 24.0 120 0.033
Far 5/27/2004 2 < 0.001 34 25.9 118 0.033
Far 5/27/2004 3 < 0.001 35 24.7 122 0.031
DI/MQ BLANK 5/26/2004 < 0.001 < 0.05 < 1.66 < 0.005
FIELD BLANK 5/26/2004 < 0.001 0.07 < 1.66 < 0.005
FILTER BLANK 5/26/2004
PRE-ULTRA FILTER BLANK 5/26/2004
POST-ULTRA FILTER BLANK 5/26/2004
Episode 5/27/2004 1 < 0.001 35 19.80 112 1.208
Episode 5/27/2004 2 < 0.001 34 21.10 127 1.151Episode 5/27/2004 3 < 0.001 37 20.90 121 1.066
©2006 AwwaRF. All Rights Reserved.

7/21/2019 Occurrence of Manganese in Drinking Water and Manganese Control
http://slidepdf.com/reader/full/occurrence-of-manganese-in-drinking-water-and-manganese-control 293/463
267
Table D.28 Utility 315 – Summer 2004 distribution system sampl
AwwaRF 2863 values are mg/L
Utility 315 Hardness values are mg/L CaCO3
Summer 2004
loc_id colldate rep_num As Ca Na Hardness Fe (T)
Entry 8/26/2004 1 < 0.001 36 39.7 130 0.009
Entry 8/26/2004 2 < 0.001 37 41.1 135 < 0.005
Entry 8/26/2004 3 < 0.001 37 41.2 135 < 0.006
Near 8/26/2004 1 < 0.001 34 38.4 122 0.035
Near 8/26/2004 2 < 0.001 34 39.1 125 0.035
Near 8/26/2004 3 < 0.001 34 39.1 125 0.037
Mid 8/26/2004 1 < 0.001 32 39.7 117 0.018
Mid 8/26/2004 2 < 0.001 31 38.8 115 0.019
Mid 8/26/2004 3 < 0.001 32 38.8 117 0.020
Far 8/26/2004 1 < 0.001 33 38.6 119 0.118
Far 8/26/2004 2 < 0.001 33 38.5 117 0.127
Far 8/26/2004 3 < 0.001 34 39.6 121 0.141
DI/MQ BLANK 8/26/2004 < 0.001 < 0.05 < 1 0.232
FIELD BLANK 8/26/2004 < 0.001 < 0.05 < 1 0.018
FILTER BLANK 8/26/2004
PRE-ULTRA FILTER BLANK 8/26/2004
POST-ULTRA FILTER BLANK 8/26/2004
©2006 AwwaRF. All Rights Reserved.
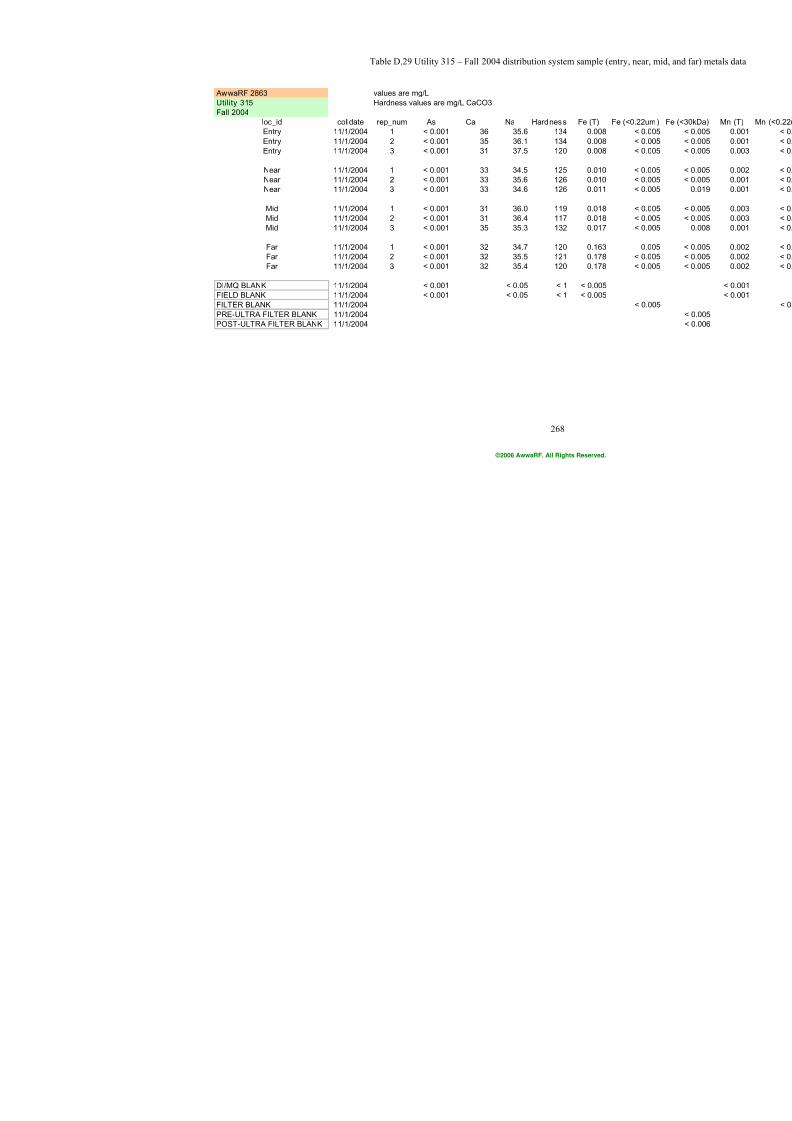
7/21/2019 Occurrence of Manganese in Drinking Water and Manganese Control
http://slidepdf.com/reader/full/occurrence-of-manganese-in-drinking-water-and-manganese-control 294/463
268
Table D.29 Utility 315 – Fall 2004 distribution system sample (
AwwaRF 2863 values are mg/L
Utility 315 Hardness values are mg/L CaCO3
Fall 2004
loc_id colldate rep_num As Ca Na Hardness Fe (T)
Entry 11/1/2004 1 < 0.001 36 35.6 134 0.008
Entry 11/1/2004 2 < 0.001 35 36.1 134 0.008
Entry 11/1/2004 3 < 0.001 31 37.5 120 0.008
Near 11/1/2004 1 < 0.001 33 34.5 125 0.010
Near 11/1/2004 2 < 0.001 33 35.6 126 0.010
Near 11/1/2004 3 < 0.001 33 34.6 126 0.011
Mid 11/1/2004 1 < 0.001 31 36.0 119 0.018
Mid 11/1/2004 2 < 0.001 31 36.4 117 0.018
Mid 11/1/2004 3 < 0.001 35 35.3 132 0.017
Far 11/1/2004 1 < 0.001 32 34.7 120 0.163
Far 11/1/2004 2 < 0.001 32 35.5 121 0.178
Far 11/1/2004 3 < 0.001 32 35.4 120 0.178
DI/MQ BLANK 11/1/2004 < 0.001 < 0.05 < 1 < 0.005
FIELD BLANK 11/1/2004 < 0.001 < 0.05 < 1 < 0.005
FILTER BLANK 11/1/2004
PRE-ULTRA FILTER BLANK 11/1/2004
POST-ULTRA FILTER BLANK 11/1/2004
©2006 AwwaRF. All Rights Reserved.
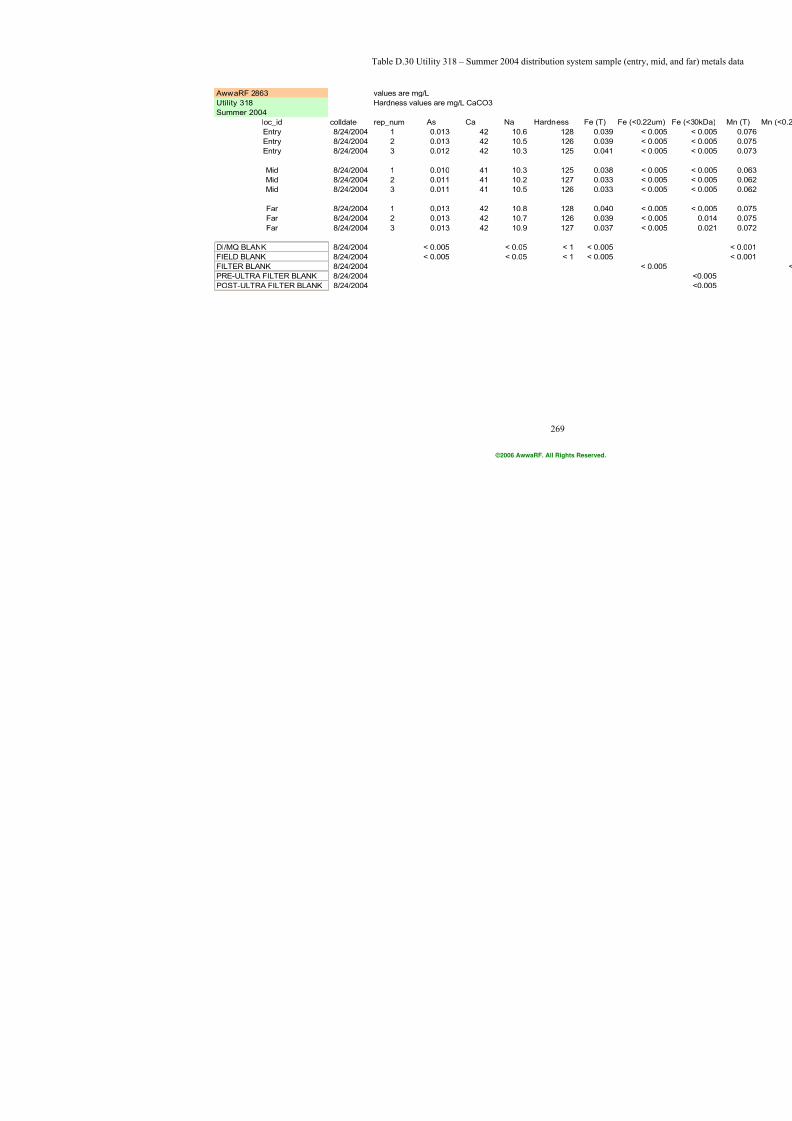
7/21/2019 Occurrence of Manganese in Drinking Water and Manganese Control
http://slidepdf.com/reader/full/occurrence-of-manganese-in-drinking-water-and-manganese-control 295/463
269
Table D.30 Utility 318 – Summer 2004 distribution system sam
AwwaRF 2863 values are mg/L
Utility 318 Hardness values are mg/L CaCO3
Summer 2004
loc_id colldate rep_num As Ca Na Hardness Fe (T)
Entry 8/24/2004 1 0.013 42 10.6 128 0.03
Entry 8/24/2004 2 0.013 42 10.5 126 0.03
Entry 8/24/2004 3 0.012 42 10.3 125 0.04
Mid 8/24/2004 1 0.010 41 10.3 125 0.03
Mid 8/24/2004 2 0.011 41 10.2 127 0.03
Mid 8/24/2004 3 0.011 41 10.5 126 0.03
Far 8/24/2004 1 0.013 42 10.8 128 0.04
Far 8/24/2004 2 0.013 42 10.7 126 0.03
Far 8/24/2004 3 0.013 42 10.9 127 0.03
DI/MQ BLANK 8/24/2004 < 0.005 < 0.05 < 1 < 0.00
FIELD BLANK 8/24/2004 < 0.005 < 0.05 < 1 < 0.00
FILTER BLANK 8/24/2004
PRE-ULTRA FILTER BLANK 8/24/2004
POST-ULTRA FILTER BLANK 8/24/2004
©2006 AwwaRF. All Rights Reserved.
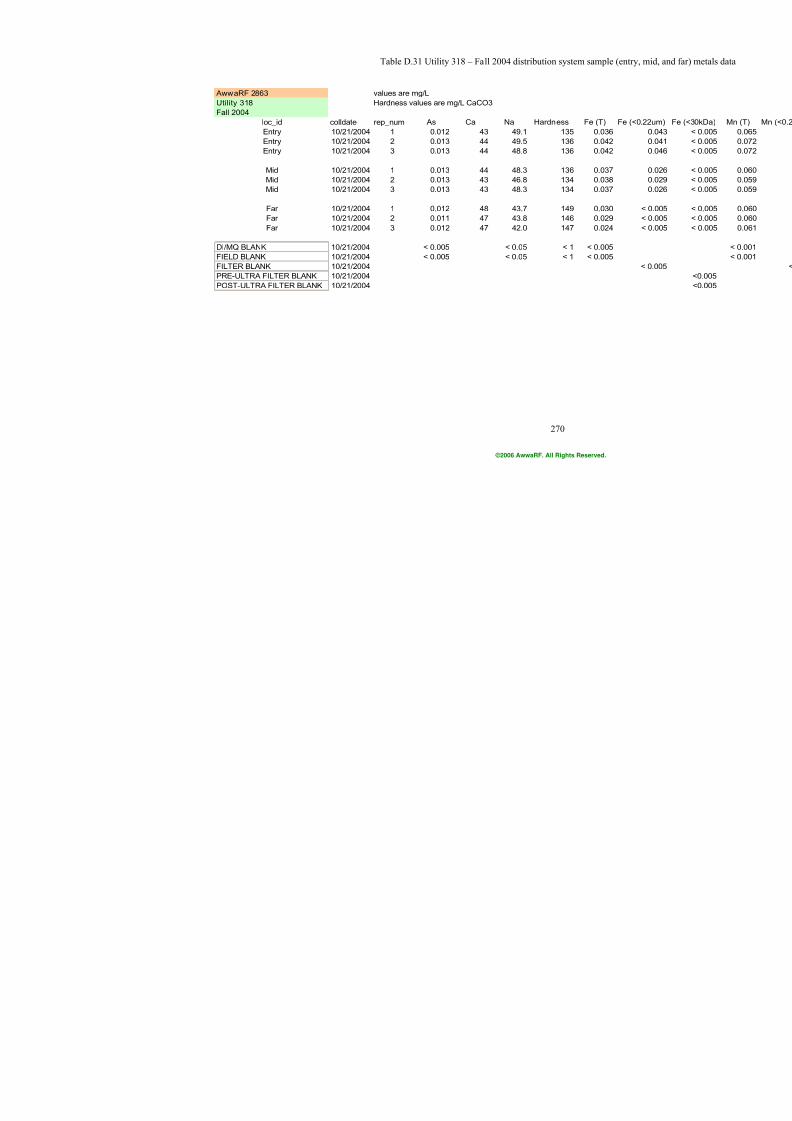
7/21/2019 Occurrence of Manganese in Drinking Water and Manganese Control
http://slidepdf.com/reader/full/occurrence-of-manganese-in-drinking-water-and-manganese-control 296/463
270
Table D.31 Utility 318 – Fall 2004 distribution system samp
AwwaRF 2863 values are mg/L
Utility 318 Hardness values are mg/L CaCO3
Fall 2004
loc_id colldate rep_num As Ca Na Hardness Fe (T)
Entry 10/21/2004 1 0.012 43 49.1 135 0.03
Entry 10/21/2004 2 0.013 44 49.5 136 0.04
Entry 10/21/2004 3 0.013 44 48.8 136 0.04
Mid 10/21/2004 1 0.013 44 48.3 136 0.03
Mid 10/21/2004 2 0.013 43 46.8 134 0.03
Mid 10/21/2004 3 0.013 43 48.3 134 0.03
Far 10/21/2004 1 0.012 48 43.7 149 0.03
Far 10/21/2004 2 0.011 47 43.8 146 0.02
Far 10/21/2004 3 0.012 47 42.0 147 0.02
DI/MQ BLANK 10/21/2004 < 0.005 < 0.05 < 1 < 0.00
FIELD BLANK 10/21/2004 < 0.005 < 0.05 < 1 < 0.00
FILTER BLANK 10/21/2004
PRE-ULTRA FILTER BLANK 10/21/2004
POST-ULTRA FILTER BLANK 10/21/2004
©2006 AwwaRF. All Rights Reserved.
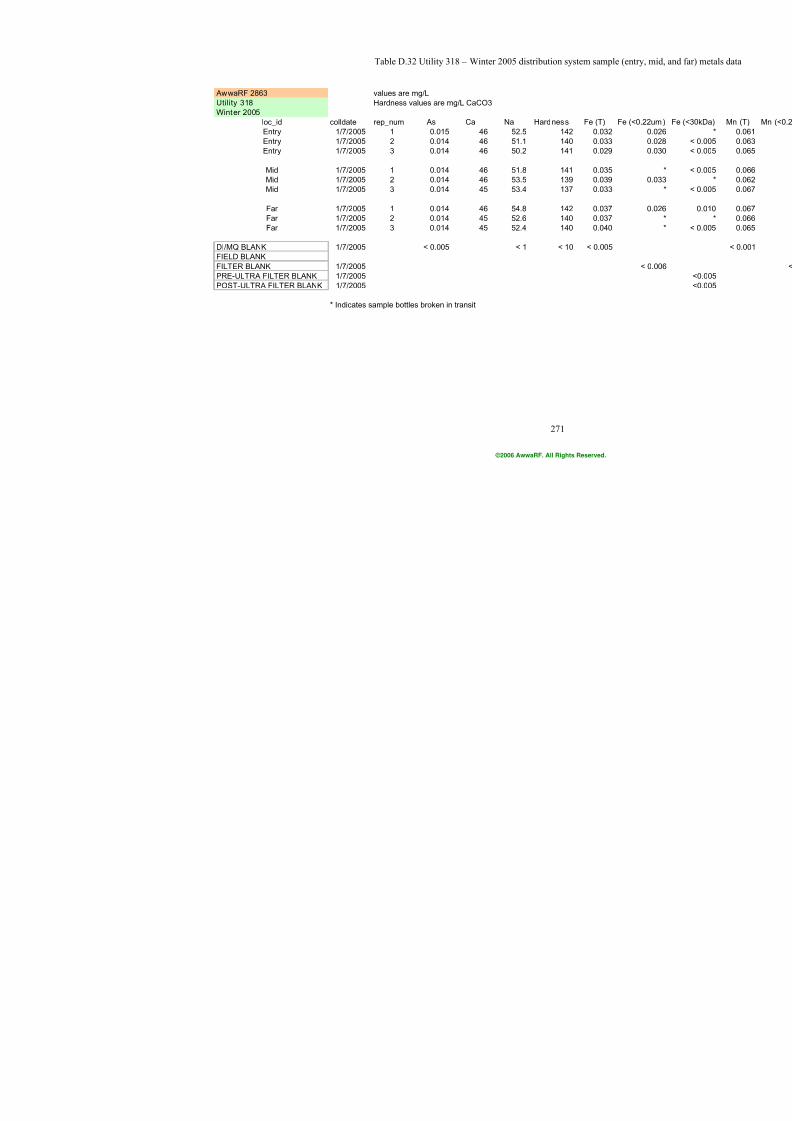
7/21/2019 Occurrence of Manganese in Drinking Water and Manganese Control
http://slidepdf.com/reader/full/occurrence-of-manganese-in-drinking-water-and-manganese-control 297/463
271
Table D.32 Utility 318 – Winter 2005 distribution system sam
AwwaRF 2863 values are mg/L
Utility 318 Hardness values are mg/L CaCO3
Winter 2005
loc_id colldate rep_num As Ca Na Hardness Fe (T)
Entry 1/7/2005 1 0.015 46 52.5 142 0.03
Entry 1/7/2005 2 0.014 46 51.1 140 0.03
Entry 1/7/2005 3 0.014 46 50.2 141 0.02
Mid 1/7/2005 1 0.014 46 51.8 141 0.03
Mid 1/7/2005 2 0.014 46 53.5 139 0.03
Mid 1/7/2005 3 0.014 45 53.4 137 0.03
Far 1/7/2005 1 0.014 46 54.8 142 0.03
Far 1/7/2005 2 0.014 45 52.6 140 0.03
Far 1/7/2005 3 0.014 45 52.4 140 0.04
DI/MQ BLANK 1/7/2005 < 0.005 < 1 < 10 < 0.00
FIELD BLANK
FILTER BLANK 1/7/2005
PRE-ULTRA FILTER BLANK 1/7/2005
POST-ULTRA FILTER BLANK 1/7/2005
* Indicates sample bottles broken in transit
©2006 AwwaRF. All Rights Reserved.
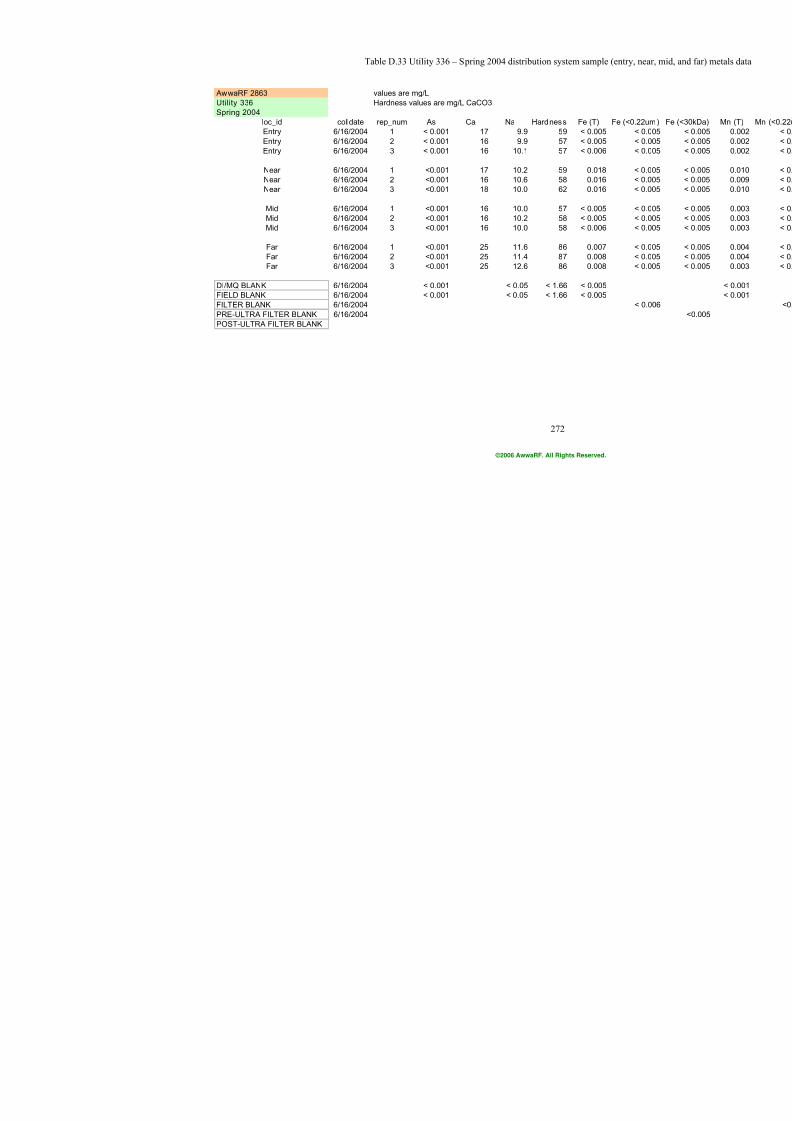
7/21/2019 Occurrence of Manganese in Drinking Water and Manganese Control
http://slidepdf.com/reader/full/occurrence-of-manganese-in-drinking-water-and-manganese-control 298/463
272
Table D.33 Utility 336 – Spring 2004 distribution system sample
AwwaRF 2863 values are mg/L
Utility 336 Hardness values are mg/L CaCO3
Spring 2004
loc_id colldate rep_num As Ca Na Hardness Fe (T)
Entry 6/16/2004 1 < 0.001 17 9.9 59 < 0.005
Entry 6/16/2004 2 < 0.001 16 9.9 57 < 0.005
Entry 6/16/2004 3 < 0.001 16 10.1 57 < 0.006
Near 6/16/2004 1 <0.001 17 10.2 59 0.018
Near 6/16/2004 2 <0.001 16 10.6 58 0.016
Near 6/16/2004 3 <0.001 18 10.0 62 0.016
Mid 6/16/2004 1 <0.001 16 10.0 57 < 0.005
Mid 6/16/2004 2 <0.001 16 10.2 58 < 0.005
Mid 6/16/2004 3 <0.001 16 10.0 58 < 0.006
Far 6/16/2004 1 <0.001 25 11.6 86 0.007
Far 6/16/2004 2 <0.001 25 11.4 87 0.008
Far 6/16/2004 3 <0.001 25 12.6 86 0.008
DI/MQ BLANK 6/16/2004 < 0.001 < 0.05 < 1.66 < 0.005
FIELD BLANK 6/16/2004 < 0.001 < 0.05 < 1.66 < 0.005
FILTER BLANK 6/16/2004
PRE-ULTRA FILTER BLANK 6/16/2004
POST-ULTRA FILTER BLANK
©2006 AwwaRF. All Rights Reserved.

7/21/2019 Occurrence of Manganese in Drinking Water and Manganese Control
http://slidepdf.com/reader/full/occurrence-of-manganese-in-drinking-water-and-manganese-control 299/463
273
Table D.34 Utility 336 – Summer 2004 distribution system sampl
AwwaRF 2863 values are mg/L
Utility 336 Hardness values are mg/L CaCO3
Summer 2004
loc_id colldate rep_num As Ca Na Hardness Fe (T)
Entry 8/5/2004 1 < 0.001 16 10.6 58 < 0.005
Entry 8/5/2004 2 < 0.001 17 10.5 59 < 0.005
Entry 8/5/2004 3 < 0.001 16 10.3 57 < 0.006
Near 8/5/2004 1 < 0.001 18 10.6 62 < 0.005
Near 8/5/2004 2 < 0.001 17 10.9 61 < 0.005
Near 8/5/2004 3 < 0.001 17 10.1 59 < 0.006
Mid 8/5/2004 1 < 0.001 17 10.3 59 < 0.005
Mid 8/5/2004 2 < 0.001 17 10.2 60 < 0.005
Mid 8/5/2004 3 < 0.001 17 10.5 61 < 0.006
Far 8/5/2004 1 < 0.001 20 10.8 69 0.008
Far 8/5/2004 2 < 0.001 20 10.7 70 0.007
Far 8/5/2004 3 < 0.001 21 10.9 71 0.008
DI/MQ BLANK 8/5/2004 < 0.001 < 0.05 < 1 < 0.005
FIELD BLANK 8/5/2004 < 0.001 < 0.05 < 1 < 0.005
FILTER BLANK 8/5/2004
PRE-ULTRA FILTER BLANK 8/5/2004
POST-ULTRA FILTER BLANK 8/5/2004
©2006 AwwaRF. All Rights Reserved.

7/21/2019 Occurrence of Manganese in Drinking Water and Manganese Control
http://slidepdf.com/reader/full/occurrence-of-manganese-in-drinking-water-and-manganese-control 300/463
274
Table D.35 Utility 336 – Fall 2004 distribution system sample (
AwwaRF 2863 values are mg/L
Utility 336 Hardness values are mg/L CaCO3
Fall 2004
loc_id colldate rep_num As Ca Na Hardness Fe (T)
Entry 11/23/2004 1 < 0.005 16 8.7 56 0.005
Entry 11/23/2004 2 < 0.005 16 8.4 56 < 0.005
Entry 11/23/2004 3 < 0.005 16 8.7 57 < 0.006
Near 11/23/2004 1 < 0.005 15 8.7 55 0.006
Near 11/23/2004 2 < 0.006 15 9.0 55 0.006
Near 11/23/2004 3 < 0.005 16 8.6 55 0.008
Mid 11/23/2004 1 < 0.005 15 9.0 54 < 0.005
Mid 11/23/2004 2 < 0.005 15 9.1 53 0.005
Mid 11/23/2004 3 < 0.005 15 9.1 54 < 0.006
Far 11/23/2004 1 < 0.005 24 10.6 81 0.017
Far 11/23/2004 2 < 0.005 24 10.7 80 0.017
Far 11/23/2004 3 < 0.005 24 10.3 81 0.015
DI/MQ BLANK 11/23/2004 < 0.001 < 0.05 < 1 < 0.005
FIELD BLANK 11/23/2004 < 0.001 < 0.05 < 1 < 0.005
FILTER BLANK 11/23/2004
PRE-ULTRA FILTER BLANK 11/23/2004
POST-ULTRA FILTER BLANK 11/23/2004
©2006 AwwaRF. All Rights Reserved.
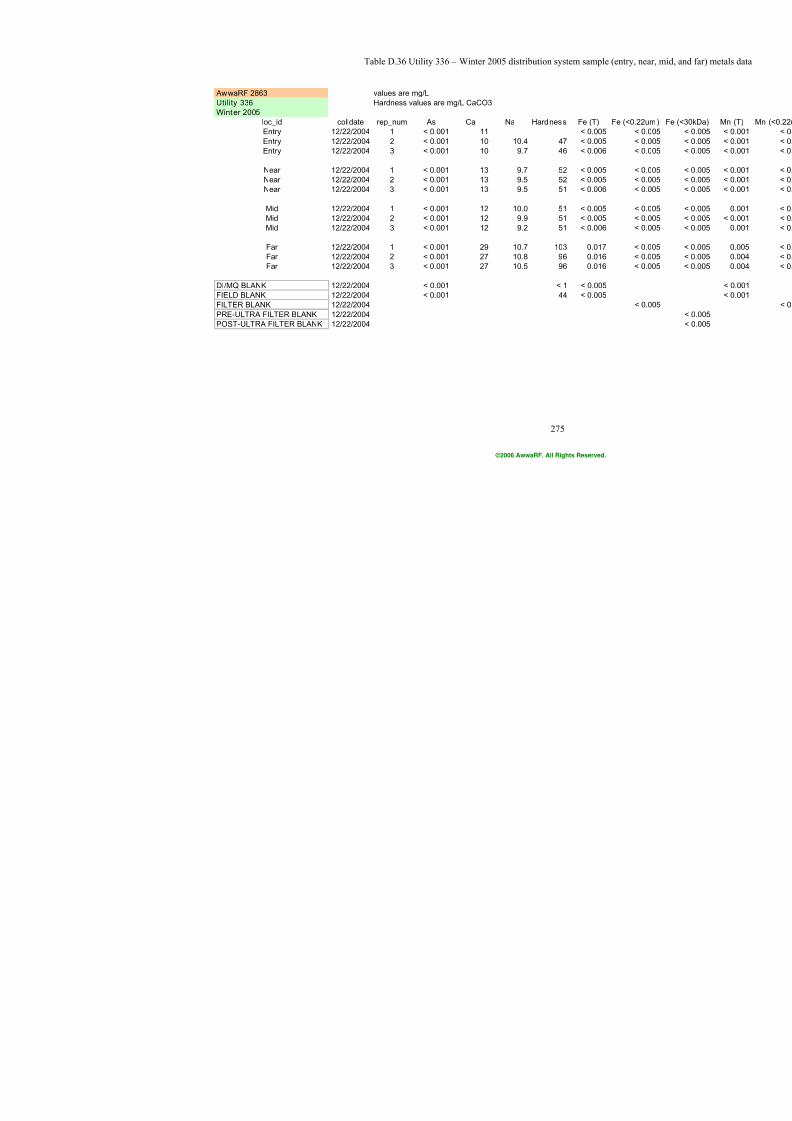
7/21/2019 Occurrence of Manganese in Drinking Water and Manganese Control
http://slidepdf.com/reader/full/occurrence-of-manganese-in-drinking-water-and-manganese-control 301/463
275
Table D.36 Utility 336 – Winter 2005 distribution system sample
AwwaRF 2863 values are mg/L
Utility 336 Hardness values are mg/L CaCO3
Winter 2005
loc_id colldate rep_num As Ca Na Hardness Fe (T)
Entry 12/22/2004 1 < 0.001 11 < 0.005
Entry 12/22/2004 2 < 0.001 10 10.4 47 < 0.005
Entry 12/22/2004 3 < 0.001 10 9.7 46 < 0.006
Near 12/22/2004 1 < 0.001 13 9.7 52 < 0.005
Near 12/22/2004 2 < 0.001 13 9.5 52 < 0.005
Near 12/22/2004 3 < 0.001 13 9.5 51 < 0.006
Mid 12/22/2004 1 < 0.001 12 10.0 51 < 0.005
Mid 12/22/2004 2 < 0.001 12 9.9 51 < 0.005
Mid 12/22/2004 3 < 0.001 12 9.2 51 < 0.006
Far 12/22/2004 1 < 0.001 29 10.7 103 0.017
Far 12/22/2004 2 < 0.001 27 10.8 96 0.016
Far 12/22/2004 3 < 0.001 27 10.5 96 0.016
DI/MQ BLANK 12/22/2004 < 0.001 < 1 < 0.005
FIELD BLANK 12/22/2004 < 0.001 44 < 0.005
FILTER BLANK 12/22/2004
PRE-ULTRA FILTER BLANK 12/22/2004
POST-ULTRA FILTER BLANK 12/22/2004
©2006 AwwaRF. All Rights Reserved.
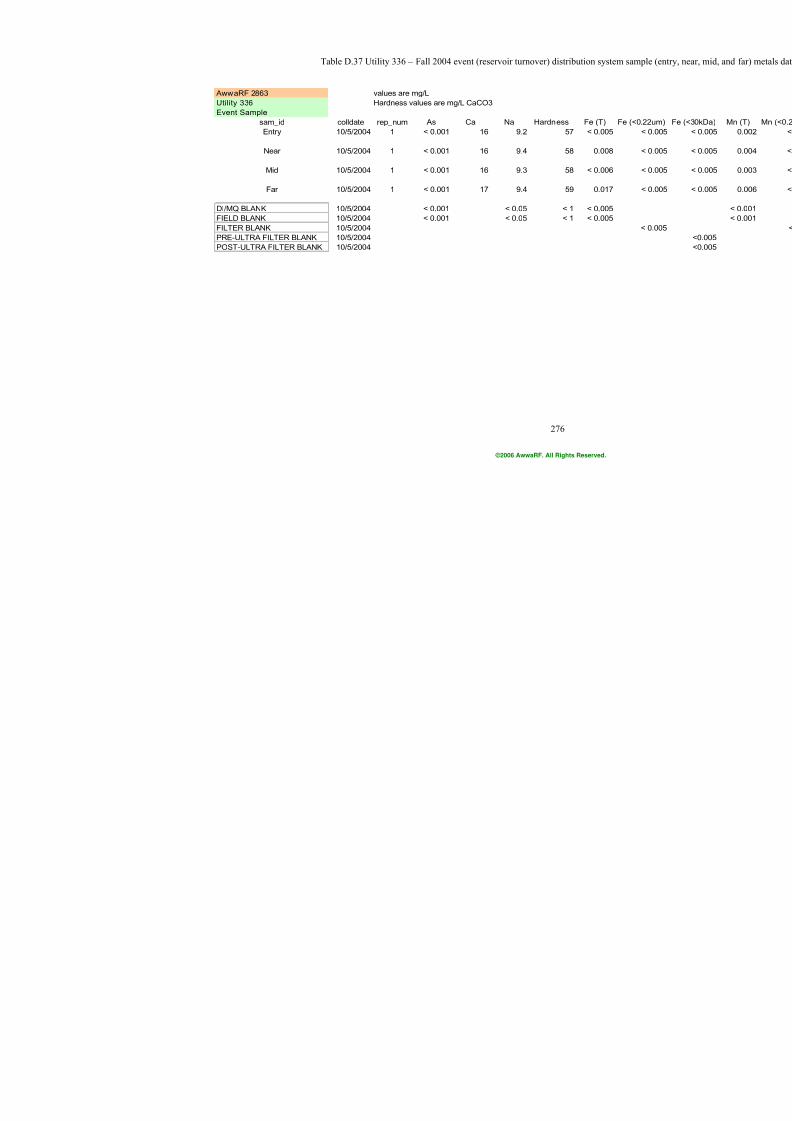
7/21/2019 Occurrence of Manganese in Drinking Water and Manganese Control
http://slidepdf.com/reader/full/occurrence-of-manganese-in-drinking-water-and-manganese-control 302/463
276
Table D.37 Utility 336 – Fall 2004 event (reservoir turnover) distribution sys
AwwaRF 2863 values are mg/L
Utility 336 Hardness values are mg/L CaCO3
Event Sample
sam_id colldate rep_num As Ca Na Hardness Fe (T)
Entry 10/5/2004 1 < 0.001 16 9.2 57 < 0.00
Near 10/5/2004 1 < 0.001 16 9.4 58 0.00
Mid 10/5/2004 1 < 0.001 16 9.3 58 < 0.00
Far 10/5/2004 1 < 0.001 17 9.4 59 0.01
DI/MQ BLANK 10/5/2004 < 0.001 < 0.05 < 1 < 0.00
FIELD BLANK 10/5/2004 < 0.001 < 0.05 < 1 < 0.00
FILTER BLANK 10/5/2004
PRE-ULTRA FILTER BLANK 10/5/2004POST-ULTRA FILTER BLANK 10/5/2004
©2006 AwwaRF. All Rights Reserved.
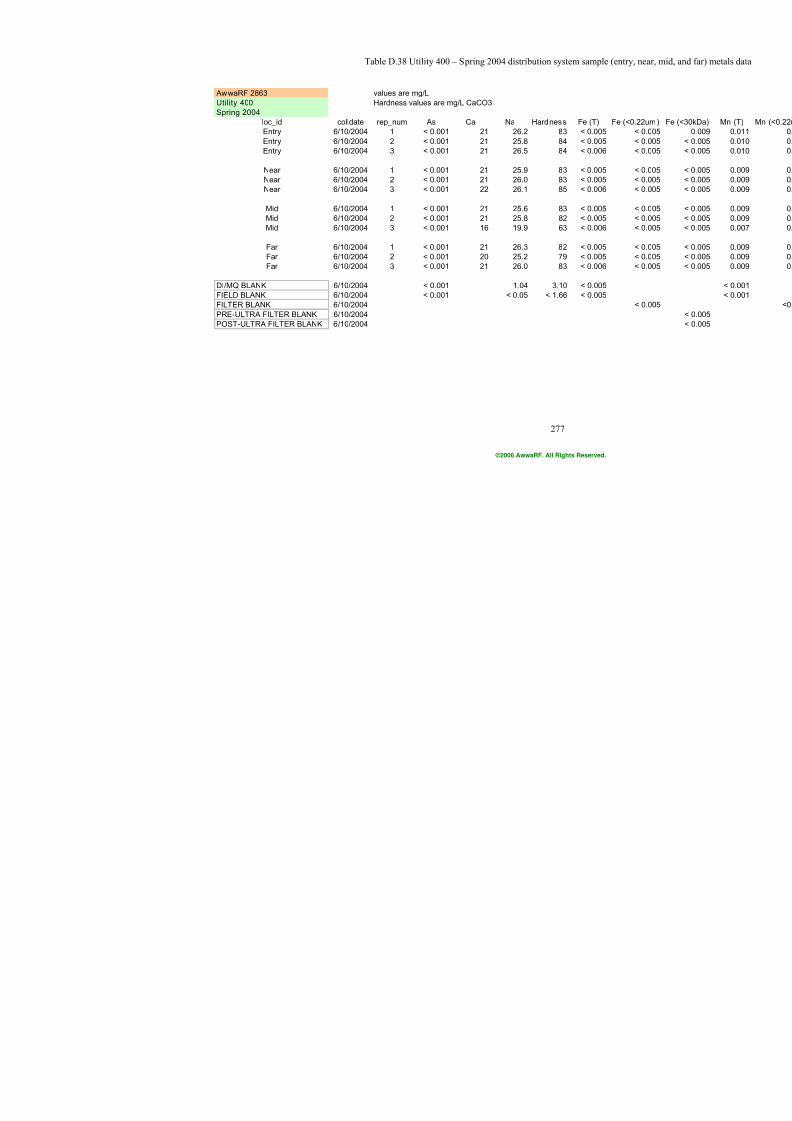
7/21/2019 Occurrence of Manganese in Drinking Water and Manganese Control
http://slidepdf.com/reader/full/occurrence-of-manganese-in-drinking-water-and-manganese-control 303/463
277
Table D.38 Utility 400 – Spring 2004 distribution system sample
AwwaRF 2863 values are mg/L
Utility 400 Hardness values are mg/L CaCO3
Spring 2004
loc_id colldate rep_num As Ca Na Hardness Fe (T)
Entry 6/10/2004 1 < 0.001 21 26.2 83 < 0.005
Entry 6/10/2004 2 < 0.001 21 25.8 84 < 0.005
Entry 6/10/2004 3 < 0.001 21 26.5 84 < 0.006
Near 6/10/2004 1 < 0.001 21 25.9 83 < 0.005
Near 6/10/2004 2 < 0.001 21 26.0 83 < 0.005
Near 6/10/2004 3 < 0.001 22 26.1 85 < 0.006
Mid 6/10/2004 1 < 0.001 21 25.6 83 < 0.005
Mid 6/10/2004 2 < 0.001 21 25.8 82 < 0.005
Mid 6/10/2004 3 < 0.001 16 19.9 63 < 0.006
Far 6/10/2004 1 < 0.001 21 26.3 82 < 0.005
Far 6/10/2004 2 < 0.001 20 25.2 79 < 0.005
Far 6/10/2004 3 < 0.001 21 26.0 83 < 0.006
DI/MQ BLANK 6/10/2004 < 0.001 1.04 3.10 < 0.005
FIELD BLANK 6/10/2004 < 0.001 < 0.05 < 1.66 < 0.005
FILTER BLANK 6/10/2004
PRE-ULTRA FILTER BLANK 6/10/2004
POST-ULTRA FILTER BLANK 6/10/2004
©2006 AwwaRF. All Rights Reserved.
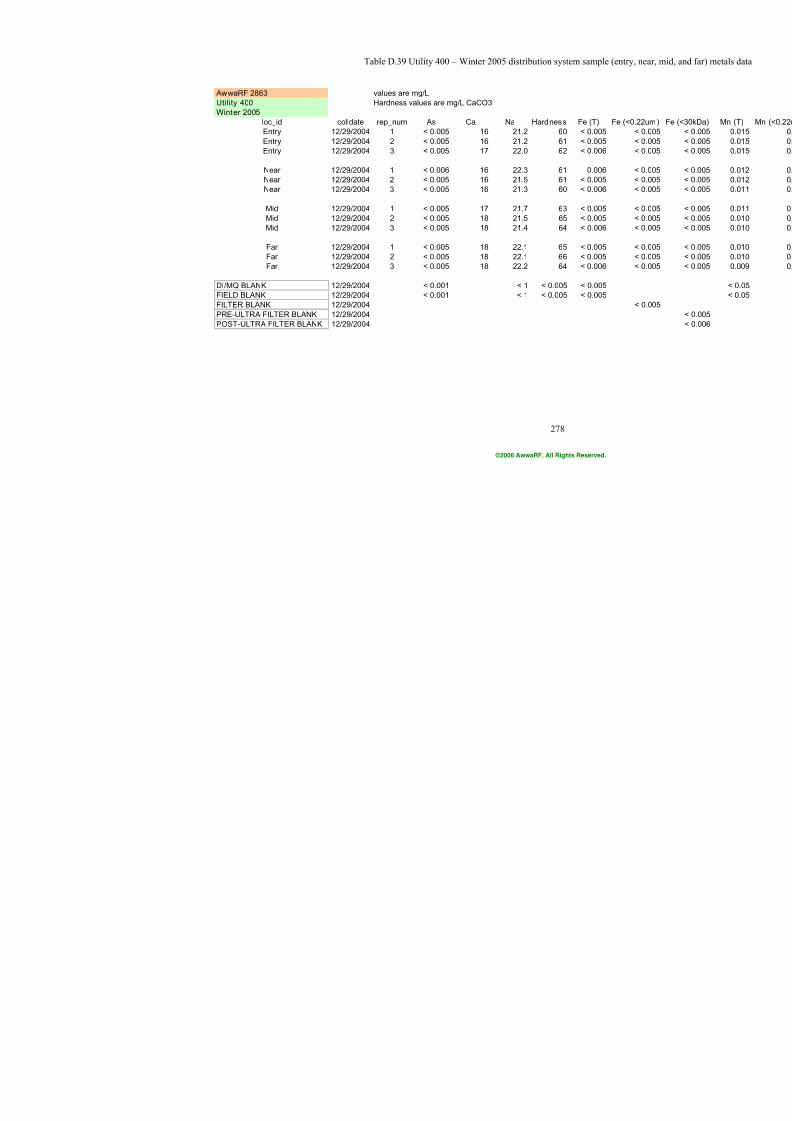
7/21/2019 Occurrence of Manganese in Drinking Water and Manganese Control
http://slidepdf.com/reader/full/occurrence-of-manganese-in-drinking-water-and-manganese-control 304/463
278
Table D.39 Utility 400 – Winter 2005 distribution system sample
AwwaRF 2863 values are mg/L
Utility 400 Hardness values are mg/L CaCO3
Winter 2005
loc_id colldate rep_num As Ca Na Hardness Fe (T)
Entry 12/29/2004 1 < 0.005 16 21.2 60 < 0.005
Entry 12/29/2004 2 < 0.005 16 21.2 61 < 0.005
Entry 12/29/2004 3 < 0.005 17 22.0 62 < 0.006
Near 12/29/2004 1 < 0.006 16 22.3 61 0.006
Near 12/29/2004 2 < 0.005 16 21.5 61 < 0.005
Near 12/29/2004 3 < 0.005 16 21.3 60 < 0.006
Mid 12/29/2004 1 < 0.005 17 21.7 63 < 0.005
Mid 12/29/2004 2 < 0.005 18 21.5 65 < 0.005
Mid 12/29/2004 3 < 0.005 18 21.4 64 < 0.006
Far 12/29/2004 1 < 0.005 18 22.1 65 < 0.005
Far 12/29/2004 2 < 0.005 18 22.1 66 < 0.005
Far 12/29/2004 3 < 0.005 18 22.2 64 < 0.006
DI/MQ BLANK 12/29/2004 < 0.001 < 1 < 0.005 < 0.005
FIELD BLANK 12/29/2004 < 0.001 < 1 < 0.005 < 0.005
FILTER BLANK 12/29/2004
PRE-ULTRA FILTER BLANK 12/29/2004
POST-ULTRA FILTER BLANK 12/29/2004
©2006 AwwaRF. All Rights Reserved.
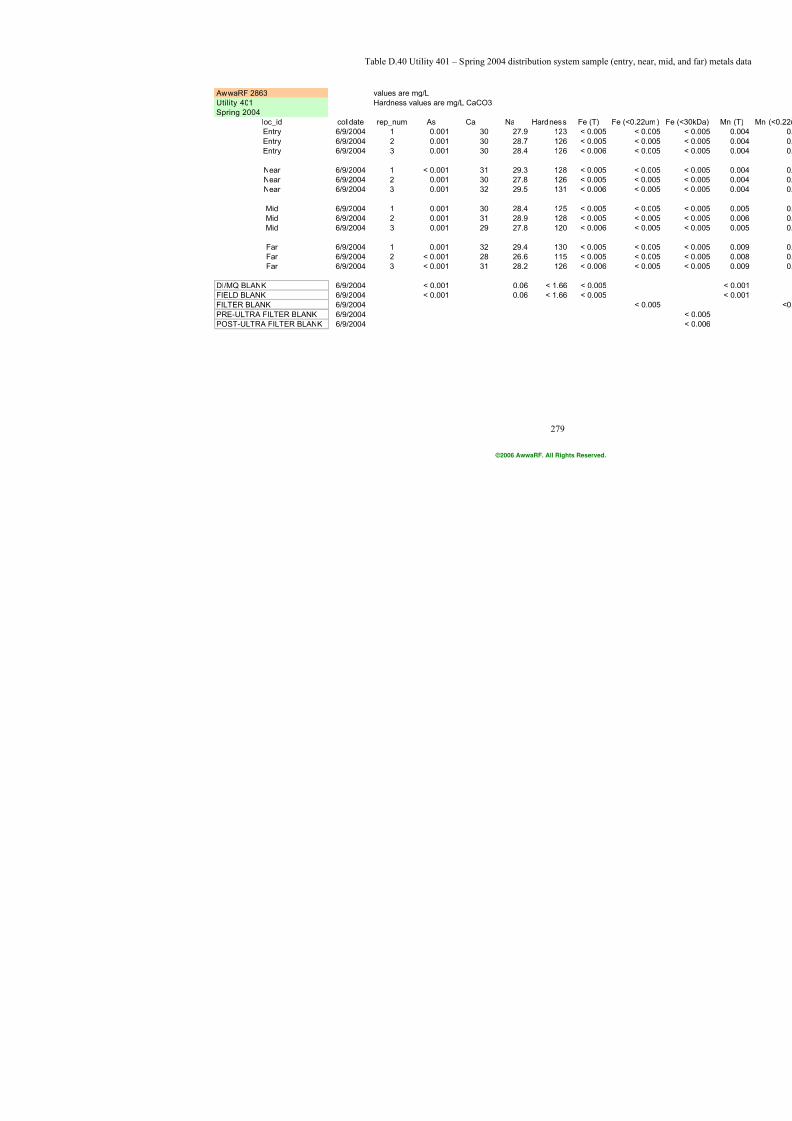
7/21/2019 Occurrence of Manganese in Drinking Water and Manganese Control
http://slidepdf.com/reader/full/occurrence-of-manganese-in-drinking-water-and-manganese-control 305/463
279
Table D.40 Utility 401 – Spring 2004 distribution system sample
AwwaRF 2863 values are mg/L
Utility 401 Hardness values are mg/L CaCO3
Spring 2004
loc_id colldate rep_num As Ca Na Hardness Fe (T)
Entry 6/9/2004 1 0.001 30 27.9 123 < 0.005
Entry 6/9/2004 2 0.001 30 28.7 126 < 0.005
Entry 6/9/2004 3 0.001 30 28.4 126 < 0.006
Near 6/9/2004 1 < 0.001 31 29.3 128 < 0.005
Near 6/9/2004 2 0.001 30 27.8 126 < 0.005
Near 6/9/2004 3 0.001 32 29.5 131 < 0.006
Mid 6/9/2004 1 0.001 30 28.4 125 < 0.005
Mid 6/9/2004 2 0.001 31 28.9 128 < 0.005
Mid 6/9/2004 3 0.001 29 27.8 120 < 0.006
Far 6/9/2004 1 0.001 32 29.4 130 < 0.005
Far 6/9/2004 2 < 0.001 28 26.6 115 < 0.005
Far 6/9/2004 3 < 0.001 31 28.2 126 < 0.006
DI/MQ BLANK 6/9/2004 < 0.001 0.06 < 1.66 < 0.005
FIELD BLANK 6/9/2004 < 0.001 0.06 < 1.66 < 0.005
FILTER BLANK 6/9/2004
PRE-ULTRA FILTER BLANK 6/9/2004
POST-ULTRA FILTER BLANK 6/9/2004
©2006 AwwaRF. All Rights Reserved.
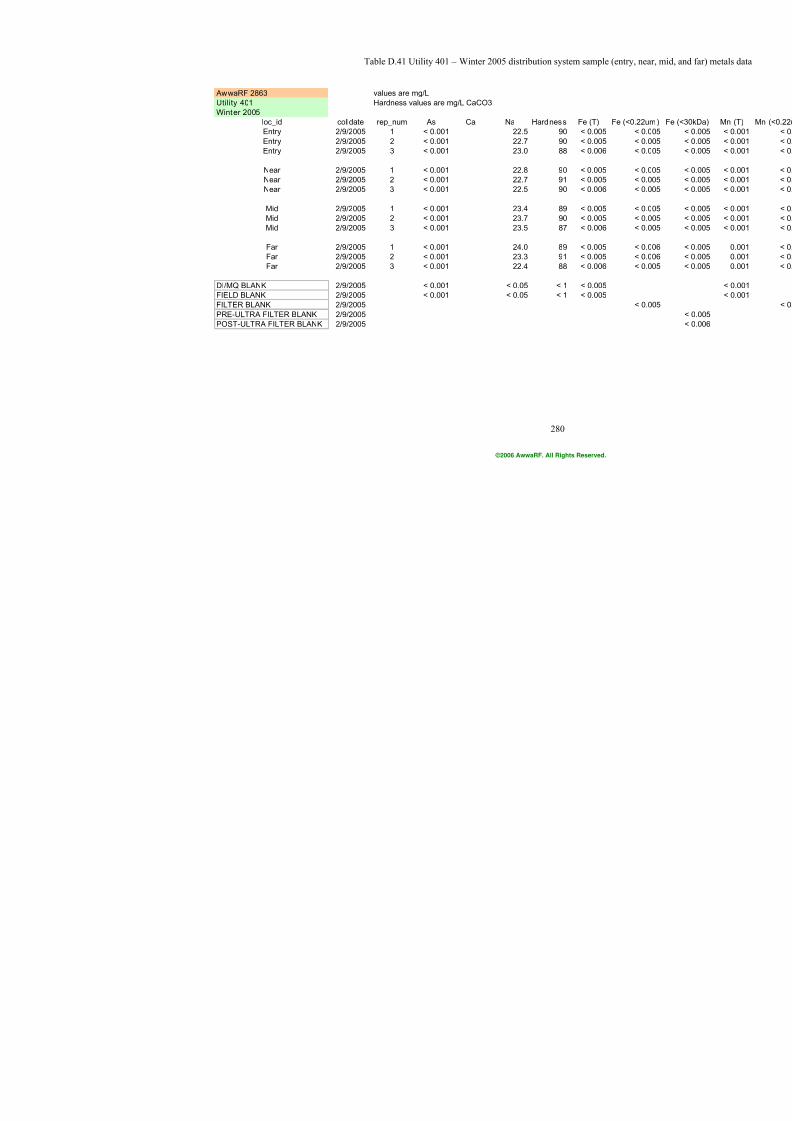
7/21/2019 Occurrence of Manganese in Drinking Water and Manganese Control
http://slidepdf.com/reader/full/occurrence-of-manganese-in-drinking-water-and-manganese-control 306/463
280
Table D.41 Utility 401 – Winter 2005 distribution system sample
AwwaRF 2863 values are mg/L
Utility 401 Hardness values are mg/L CaCO3
Winter 2005
loc_id colldate rep_num As Ca Na Hardness Fe (T)
Entry 2/9/2005 1 < 0.001 22.5 90 < 0.005
Entry 2/9/2005 2 < 0.001 22.7 90 < 0.005
Entry 2/9/2005 3 < 0.001 23.0 88 < 0.006
Near 2/9/2005 1 < 0.001 22.8 90 < 0.005
Near 2/9/2005 2 < 0.001 22.7 91 < 0.005
Near 2/9/2005 3 < 0.001 22.5 90 < 0.006
Mid 2/9/2005 1 < 0.001 23.4 89 < 0.005
Mid 2/9/2005 2 < 0.001 23.7 90 < 0.005
Mid 2/9/2005 3 < 0.001 23.5 87 < 0.006
Far 2/9/2005 1 < 0.001 24.0 89 < 0.005
Far 2/9/2005 2 < 0.001 23.3 91 < 0.005
Far 2/9/2005 3 < 0.001 22.4 88 < 0.006
DI/MQ BLANK 2/9/2005 < 0.001 < 0.05 < 1 < 0.005
FIELD BLANK 2/9/2005 < 0.001 < 0.05 < 1 < 0.005
FILTER BLANK 2/9/2005
PRE-ULTRA FILTER BLANK 2/9/2005
POST-ULTRA FILTER BLANK 2/9/2005
©2006 AwwaRF. All Rights Reserved.

7/21/2019 Occurrence of Manganese in Drinking Water and Manganese Control
http://slidepdf.com/reader/full/occurrence-of-manganese-in-drinking-water-and-manganese-control 307/463
281
Table D.42 Utility 2 – Winter 2004 distribution system sample (entry, near, mid, and far)
Ortho Poly Total Util ID Sample Date Time Util Alk F Cl2 T Cl2 pH phos phos phos Temp TOC UV254 Color- Color- Conduc
ID Sample ID phate phate phate Abs App True tivity mg/L mg/L mg/L mg/L mg/L mg/L °C mg/L 1/cm PtCo Color- µmhos/
CaCO3 units True cm
2 002-E1-1 2/26/2004 8:25 238.0 0.21 0.62 6.80 0.061 10.5 1.1 0.0165 < 5 940.0
2 002-E1-2 2/26/2004 8:25 238.0 0.21 0.62 6.80 0.061 10.5 1.1 0.0165 < 5 940.0
2 002-E1-3 2/26/2004 8:25 238.0 0.21 0.62 6.80 0.061 10.5 1.1 0.0165 < 5 940.0
2 002-M1-1 2/26/2004 9:15 242.0 0.30 0.42 6.80 0.23 6.5 1.1 0.017 < 5 930.0
2 002-M1-2 2/26/2004 9:15 242.0 0.30 0.42 6.80 0.23 6.5 1.1 0.017 < 5 930.0
2 002-M1-3 2/26/2004 9:15 242.0 0.30 0.42 6.80 0.23 6.5 1.1 0.017 < 5 930.0
2 002-N1-1 2/26/2004 9:55 240.0 0.30 0.42 6.50 0.074 6.0 1.1 0.0205 < 5 930.0
2 002-N1-2 2/26/2004 9:55 240.0 0.30 0.42 6.50 0.074 6.0 1.1 0.0205 < 5 930.0
2 002-N1-3 2/26/2004 9:55 240.0 0.30 0.42 6.50 0.074 6.0 1.1 0.0205 < 5 930.0
2 002-F1-1 2/26/2004 10:30 237.0 0.22 0.35 6.70 0.478 9.5 1.2 0.014 < 5 880.0
2 002-F1-2 2/26/2004 10:30 237.0 0.22 0.35 6.70 0.478 9.5 1.2 0.014 < 5 880.0
2 002-F1-3 2/26/2004 10:30 237.0 0.22 0.35 6.70 0.478 9.5 1.2 0.014 < 5 880.0
©2006 AwwaRF. All Rights Reserved.

7/21/2019 Occurrence of Manganese in Drinking Water and Manganese Control
http://slidepdf.com/reader/full/occurrence-of-manganese-in-drinking-water-and-manganese-control 308/463
282
Table D.43 Utility 2 – Spring 2004 distribution system sample (entry, near, mid, and far)
Ortho Poly Total Util ID Sample Date Time Util Alk F Cl2 T Cl2 pH phos phos phos Temp TOC UV254 Color- Color- Conduc
ID Sample ID phate phate phate Abs App True tivity mg/L mg/L mg/L mg/L mg/L mg/L °C mg/L 1/cm PtCo Color- µmhos/
CaCO3 units True cm
2 002-E2-1 5/20/2004 8:30 238.0 0.30 0.49 6.80 0.61 12.5 1.2 0.0215 5 < 5 930.0
2 002-E2-2 5/20/2004 8:30 238.0 0.30 0.49 6.80 0.61 12.5 1.2 0.0215 5 < 5 930.0
2 002-E2-3 5/20/2004 8:30 238.0 0.30 0.49 6.80 0.61 12.5 1.2 0.0215 5 < 5 930.0
2 002-M2-1 5/20/2004 9:15 231.0 0.21 0.25 6.80 0.659 14.0 <1.0 0.023 < 5 < 5 900.0
2 002-M2-2 5/20/2004 9:15 231.0 0.21 0.25 6.80 0.659 14.0 <1.0 0.023 < 5 < 5 900.0
2 002-M2-3 5/20/2004 9:15 231.0 0.21 0.25 6.80 0.659 14.0 <1.0 0.023 < 5 < 5 900.0
2 002-N2-1 5/20/2004 10:30 235.0 0.30 0.40 6.80 0.622 13.0 <1.0 0.029 < 5 < 5 940.0
2 002-N2-2 5/20/2004 10:30 235.0 0.30 0.40 6.80 0.622 13.0 <1.0 0.029 < 5 < 5 940.0
2 002-N2-3 5/20/2004 10:30 235.0 0.30 0.40 6.80 0.622 13.0 <1.0 0.029 < 5 < 5 940.0
2 002-F2-1 5/20/2004 11:05 234.0 0.26 0.30 7.00 0.668 13.5 <1.0 0.0205 < 5 < 5 880.0
2 002-F2-2 5/20/2004 11:05 234.0 0.26 0.30 7.00 0.668 13.5 <1.0 0.0205 < 5 < 5 880.0
2 002-F2-3 5/20/2004 11:05 234.0 0.26 0.30 7.00 0.668 13.5 <1.0 0.0205 < 5 < 5 880.0
©2006 AwwaRF. All Rights Reserved.

7/21/2019 Occurrence of Manganese in Drinking Water and Manganese Control
http://slidepdf.com/reader/full/occurrence-of-manganese-in-drinking-water-and-manganese-control 309/463
283
Table D.44 Utility 2 – Summer 2004 distribution system sample (entry, near, mid, and far)
Ortho Poly Total Util ID Sample Date Time Util Alk F Cl2 T Cl2 pH phos phos phos Temp TOC UV254 Color- Color- Conduc
ID Sample ID phate phate phate Abs App True tivity mg/L mg/L mg/L mg/L mg/L mg/L °C mg/L 1/cm PtCo Color- µmhos/
CaCO3 units True cm
2 002-E3-1 8/31/2004 7:50 223.0 0.42 0.62 6.00 0.307 13.3 1.2 0.009 < 5 < 5 760.0
2 002-E3-2 8/31/2004 7:50 223.0 0.42 0.62 6.00 0.307 13.3 1.2 0.009 < 5 < 5 760.0
2 002-E3-3 8/31/2004 7:50 223.0 0.42 0.62 6.00 0.307 13.3 1.2 0.009 < 5 < 5 760.0
2 002-M3-1 8/31/2004 8:25 223.0 0.24 0.37 6.60 0.497 17.6 1.5 0.013 < 5 < 5 750.0
2 002-M3-2 8/31/2004 8:25 223.0 0.24 0.37 6.60 0.497 17.6 1.5 0.013 < 5 < 5 750.0
2 002-M3-3 8/31/2004 8:25 223.0 0.24 0.37 6.60 0.497 17.6 1.5 0.013 < 5 < 5 750.0
2 002-N3-1 8/31/2004 9:00 225.0 0.33 0.46 6.30 0.328 14.7 1.2 0.012 < 5 < 5 810.0
2 002-N3-2 8/31/2004 9:00 225.0 0.33 0.46 6.30 0.328 14.7 1.2 0.012 < 5 < 5 810.0
2 002-N3-3 8/31/2004 9:00 225.0 0.33 0.46 6.30 0.328 14.7 1.2 0.012 < 5 < 5 810.0
2 002-F3-1 8/31/2004 9:30 225.0 0.01 0.04 6.50 0.724 18.5 1.4 < 0.009 < 5 < 5 740.0
2 002-F3-2 8/31/2004 9:30 225.0 0.01 0.04 6.50 0.724 18.5 1.4 < 0.009 < 5 < 5 740.0
2 002-F3-3 8/31/2004 9:30 225.0 0.01 0.04 6.50 0.724 18.5 1.4 < 0.009 < 5 < 5 740.0
©2006 AwwaRF. All Rights Reserved.
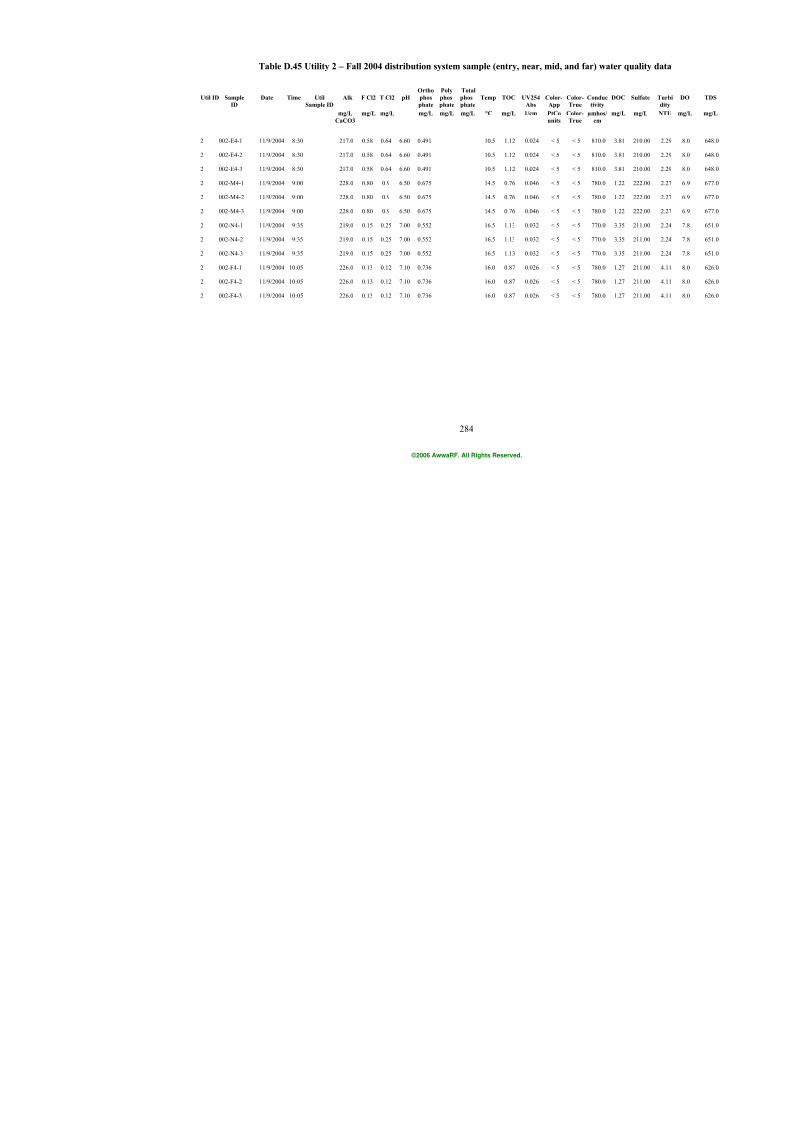
7/21/2019 Occurrence of Manganese in Drinking Water and Manganese Control
http://slidepdf.com/reader/full/occurrence-of-manganese-in-drinking-water-and-manganese-control 310/463
284
Table D.45 Utility 2 – Fall 2004 distribution system sample (entry, near, mid, and far) w
Ortho Poly Total Util ID Sample Date Time Util Alk F Cl2 T Cl2 pH phos phos phos Temp TOC UV254 Color- Color- Conduc
ID Sample ID phate phate phate Abs App True tivity mg/L mg/L mg/L mg/L mg/L mg/L °C mg/L 1/cm PtCo Color- µmhos/
CaCO3 units True cm
2 002-E4-1 11/9/2004 8:30 217.0 0.58 0.64 6.60 0.491 10.5 1.12 0.024 < 5 < 5 810.0
2 002-E4-2 11/9/2004 8:30 217.0 0.58 0.64 6.60 0.491 10.5 1.12 0.024 < 5 < 5 810.0
2 002-E4-3 11/9/2004 8:30 217.0 0.58 0.64 6.60 0.491 10.5 1.12 0.024 < 5 < 5 810.0
2 002-M4-1 11/9/2004 9:00 228.0 0.80 0.9 6.50 0.675 14.5 0.76 0.046 < 5 < 5 780.0
2 002-M4-2 11/9/2004 9:00 228.0 0.80 0.9 6.50 0.675 14.5 0.76 0.046 < 5 < 5 780.0
2 002-M4-3 11/9/2004 9:00 228.0 0.80 0.9 6.50 0.675 14.5 0.76 0.046 < 5 < 5 780.0
2 002-N4-1 11/9/2004 9:35 219.0 0.15 0.25 7.00 0.552 16.5 1.13 0.032 < 5 < 5 770.0
2 002-N4-2 11/9/2004 9:35 219.0 0.15 0.25 7.00 0.552 16.5 1.13 0.032 < 5 < 5 770.0
2 002-N4-3 11/9/2004 9:35 219.0 0.15 0.25 7.00 0.552 16.5 1.13 0.032 < 5 < 5 770.0
2 002-F4-1 11/9/2004 10:05 226.0 0.13 0.12 7.10 0.736 16.0 0.87 0.026 < 5 < 5 780.0
2 002-F4-2 11/9/2004 10:05 226.0 0.13 0.12 7.10 0.736 16.0 0.87 0.026 < 5 < 5 780.0
2 002-F4-3 11/9/2004 10:05 226.0 0.13 0.12 7.10 0.736 16.0 0.87 0.026 < 5 < 5 780.0
©2006 AwwaRF. All Rights Reserved.
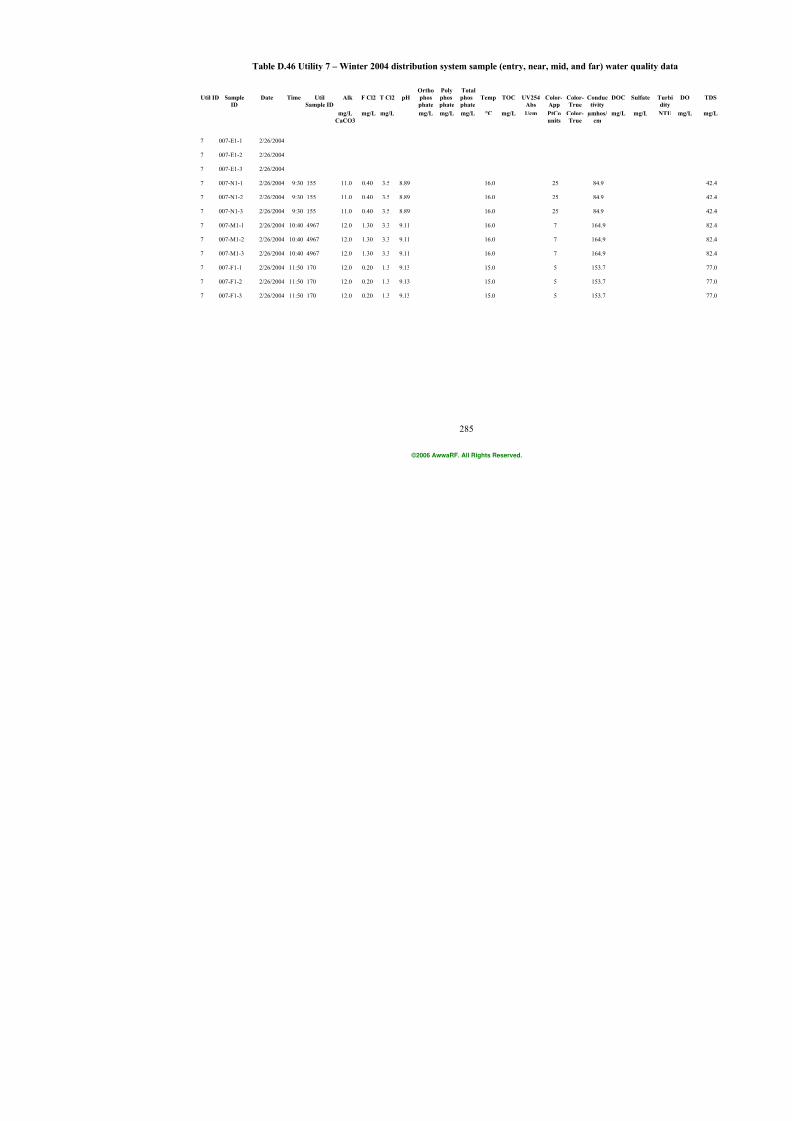
7/21/2019 Occurrence of Manganese in Drinking Water and Manganese Control
http://slidepdf.com/reader/full/occurrence-of-manganese-in-drinking-water-and-manganese-control 311/463
285
Table D.46 Utility 7 – Winter 2004 distribution system sample (entry, near, mid, and far)
Ortho Poly Total Util ID Sample Date Time Util Alk F Cl2 T Cl2 pH phos phos phos Temp TOC UV254 Color- Color- Conduc
ID Sample ID phate phate phate Abs App True tivity mg/L mg/L mg/L mg/L mg/L mg/L °C mg/L 1/cm PtCo Color- µmhos/
CaCO3 units True cm
7 007-E1-1 2/26/2004
7 007-E1-2 2/26/2004
7 007-E1-3 2/26/2004
7 007-N1-1 2/26/2004 9:30 155 11.0 0.40 3.5 8.89 16.0 25 84.9
7 007-N1-2 2/26/2004 9:30 155 11.0 0.40 3.5 8.89 16.0 25 84.9
7 007-N1-3 2/26/2004 9:30 155 11.0 0.40 3.5 8.89 16.0 25 84.9
7 007-M1-1 2/26/2004 10:40 4967 12.0 1.30 3.3 9.11 16.0 7 164.9
7 007-M1-2 2/26/2004 10:40 4967 12.0 1.30 3.3 9.11 16.0 7 164.9
7 007-M1-3 2/26/2004 10:40 4967 12.0 1.30 3.3 9.11 16.0 7 164.9
7 007-F1-1 2/26/2004 11:50 170 12.0 0.20 1.3 9.13 15.0 5 153.7
7 007-F1-2 2/26/2004 11:50 170 12.0 0.20 1.3 9.13 15.0 5 153.7
7 007-F1-3 2/26/2004 11:50 170 12.0 0.20 1.3 9.13 15.0 5 153.7
©2006 AwwaRF. All Rights Reserved.
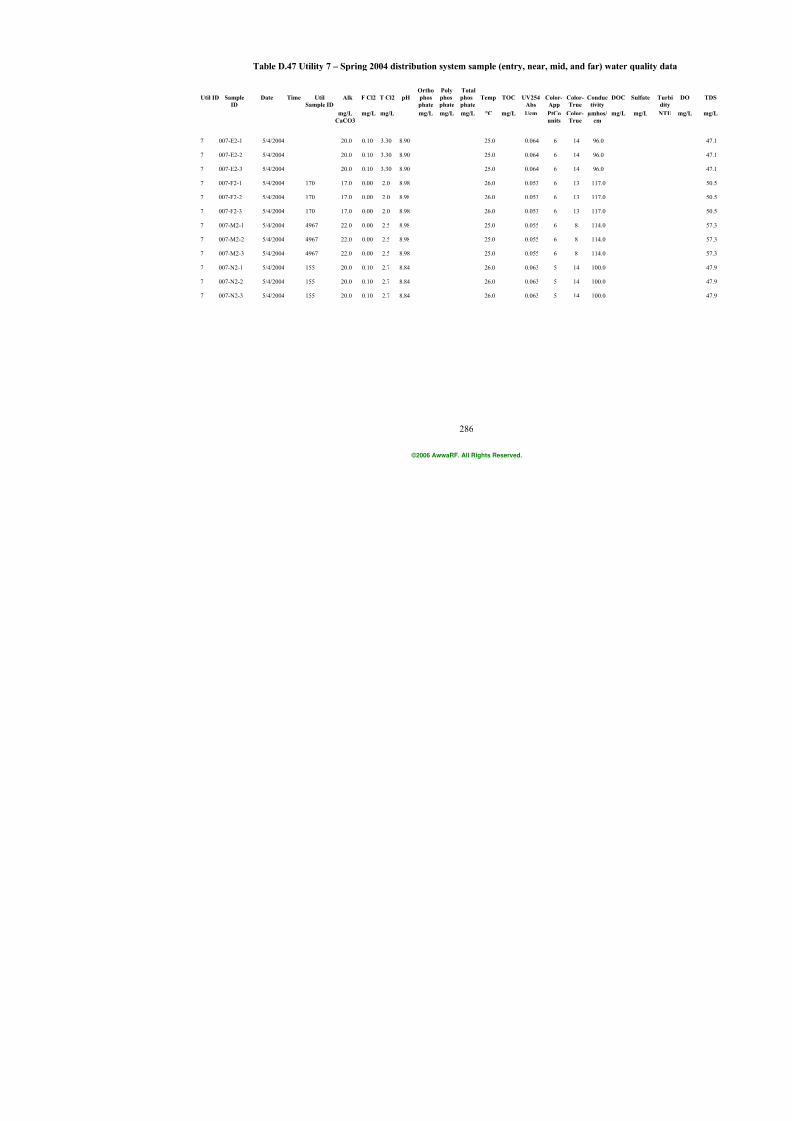
7/21/2019 Occurrence of Manganese in Drinking Water and Manganese Control
http://slidepdf.com/reader/full/occurrence-of-manganese-in-drinking-water-and-manganese-control 312/463
286
Table D.47 Utility 7 – Spring 2004 distribution system sample (entry, near, mid, and far)
Ortho Poly Total Util ID Sample Date Time Util Alk F Cl2 T Cl2 pH phos phos phos Temp TOC UV254 Color- Color- Conduc
ID Sample ID phate phate phate Abs App True tivity mg/L mg/L mg/L mg/L mg/L mg/L °C mg/L 1/cm PtCo Color- µmhos/
CaCO3 units True cm
7 007-E2-1 5/4/2004 20.0 0.10 3.30 8.90 25.0 0.064 6 14 96.0
7 007-E2-2 5/4/2004 20.0 0.10 3.30 8.90 25.0 0.064 6 14 96.0
7 007-E2-3 5/4/2004 20.0 0.10 3.30 8.90 25.0 0.064 6 14 96.0
7 007-F2-1 5/4/2004 170 17.0 0.00 2.0 8.98 26.0 0.053 6 13 117.0
7 007-F2-2 5/4/2004 170 17.0 0.00 2.0 8.98 26.0 0.053 6 13 117.0
7 007-F2-3 5/4/2004 170 17.0 0.00 2.0 8.98 26.0 0.053 6 13 117.0
7 007-M2-1 5/4/2004 4967 22.0 0.00 2.5 8.98 25.0 0.055 6 8 114.0
7 007-M2-2 5/4/2004 4967 22.0 0.00 2.5 8.98 25.0 0.055 6 8 114.0
7 007-M2-3 5/4/2004 4967 22.0 0.00 2.5 8.98 25.0 0.055 6 8 114.0
7 007-N2-1 5/4/2004 155 20.0 0.10 2.7 8.84 26.0 0.063 5 14 100.0
7 007-N2-2 5/4/2004 155 20.0 0.10 2.7 8.84 26.0 0.063 5 14 100.0
7 007-N2-3 5/4/2004 155 20.0 0.10 2.7 8.84 26.0 0.063 5 14 100.0
©2006 AwwaRF. All Rights Reserved.

7/21/2019 Occurrence of Manganese in Drinking Water and Manganese Control
http://slidepdf.com/reader/full/occurrence-of-manganese-in-drinking-water-and-manganese-control 313/463
287
Table D.48 Utility 7 – Fall 2004 distribution system sample (entry, near, mid, and far) w
Ortho Poly Total Util ID Sample Date Time Util Alk F Cl2 T Cl2 pH phos phos phos Temp TOC UV254 Color- Color- Conduc
ID Sample ID phate phate phate Abs App True tivity mg/L mg/L mg/L mg/L mg/L mg/L °C mg/L 1/cm PtCo Color- µmhos/
CaCO3 units True cm
7 007-N4-1 11/18/2004 10:35 155 20.0 0.00 3.2 8.22 20.6 2.3 0.073 4 100.0
7 007-N4-2 11/18/2004 10:35 155 20.0 0.00 3.2 8.22 20.6 2.3 0.073 4 100.0
7 007-N4-3 11/18/2004 10:35 155 20.0 0.00 3.2 8.22 20.6 2.3 0.073 4 100.0
7 007-F4-1 11/18/2004 13:02 170 18.0 0.00 0.0 7.49 21.4 1.6 0.057 3 120.0
7 007-F4-2 11/18/2004 13:02 170 18.0 0.00 0.0 7.49 21.4 1.6 0.057 3 120.0
7 007-F4-3 11/18/2004 13:02 170 18.0 0.00 0.0 7.49 21.4 1.6 0.057 3 120.0
7 007-M4-1 11/18/2004 14:05 4967 20.0 0.30 2.7 9.14 19.0 1.9 0.055 3 180.0
7 007-M4-2 11/18/2004 14:05 4967 20.0 0.30 2.7 9.14 19.0 1.9 0.055 3 180.0
7 007-M4-3 11/18/2004 14:05 4967 20.0 0.30 2.7 9.14 19.0 1.9 0.055 3 180.0
7 007-E4-1 11/18/2004 16:32 22.0 0.10 3.4 8.95 23.0 3.5 0.074 3 100.0
7 007-E4-2 11/18/2004 16:32 22.0 0.10 3.4 8.95 23.0 3.5 0.074 3 100.0
7 007-E4-3 11/18/2004 16:32 22.0 0.10 3.4 8.95 23.0 3.5 0.074 3 100.0
©2006 AwwaRF. All Rights Reserved.

7/21/2019 Occurrence of Manganese in Drinking Water and Manganese Control
http://slidepdf.com/reader/full/occurrence-of-manganese-in-drinking-water-and-manganese-control 314/463
288
Table D.49 Utility 7 – Winter 2005 distribution system sample (entry, near, mid, and far)
Ortho Poly Total Util ID Sample Date Time Util Alk F Cl2 T Cl2 pH phos phos phos Temp TOC UV254 Color- Color- Conduc
ID Sample ID phate phate phate Abs App True tivity mg/L mg/L mg/L mg/L mg/L mg/L °C mg/L 1/cm PtCo Color- µmhos/
CaCO3 units True cm
7 007-F5-1 1/10/2005 10:24 170 11.0 0.00 2.0 8.90 16.0 4.0 0.044 12 7 203.0
7 007-F5-2 1/10/2005 10:24 170 11.0 0.00 2.0 8.90 16.0 4.0 0.044 12 7 203.0
7 007-F5-3 1/10/2005 10:24 170 11.0 0.00 2.0 8.90 16.0 4.0 0.044 12 7 203.0
7 007-M5-1 1/10/2005 11:55 4967 13.0 0.50 3.5 8.85 13.0 4.3 0.043 8 3 127.0
7 007-M5-2 1/10/2005 11:55 4967 13.0 0.50 3.5 8.85 13.0 4.3 0.043 8 3 127.0
7 007-M5-3 1/10/2005 11:55 4967 13.0 0.50 3.5 8.85 13.0 4.3 0.043 8 3 127.0
7 007-N5-1 1/10/2005 13:17 155 13.0 1.50 3.5 8.93 14.0 3.2 0.049 11 7 90.0
7 007-N5-2 1/10/2005 13:17 155 13.0 1.50 3.5 8.93 14.0 3.2 0.049 11 7 90.0
7 007-N5-3 1/10/2005 13:17 155 13.0 1.50 3.5 8.93 14.0 3.2 0.049 11 7 90.0
7 007-E5-1 1/10/2005 14:30 14.0 1.50 3.13 9.03 13.3 4.0 0.057 7 5 80.0
7 007-E5-2 1/10/2005 14:30 14.0 1.50 3.13 9.03 13.3 4.0 0.057 7 5 80.0
7 007-E5-3 1/10/2005 14:30 14.0 1.50 3.13 9.03 13.3 4.0 0.057 7 5 80.0
©2006 AwwaRF. All Rights Reserved.
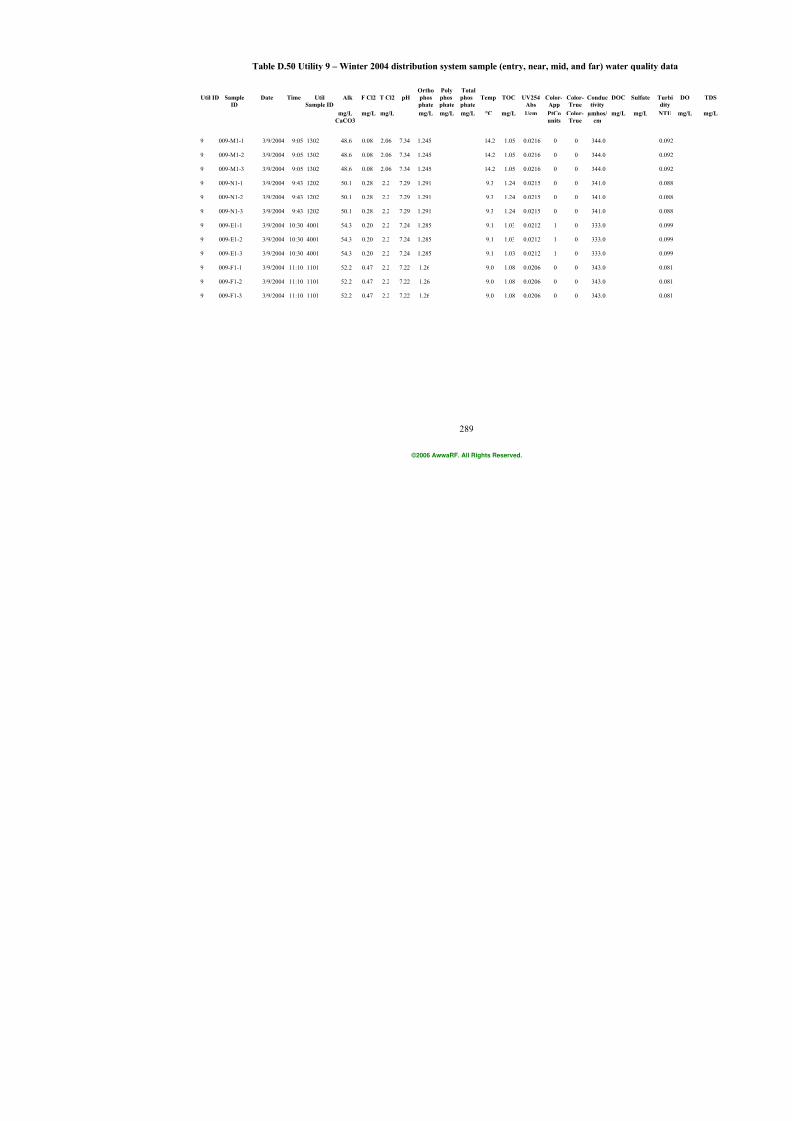
7/21/2019 Occurrence of Manganese in Drinking Water and Manganese Control
http://slidepdf.com/reader/full/occurrence-of-manganese-in-drinking-water-and-manganese-control 315/463
289
Table D.50 Utility 9 – Winter 2004 distribution system sample (entry, near, mid, and far)
Ortho Poly Total Util ID Sample Date Time Util Alk F Cl2 T Cl2 pH phos phos phos Temp TOC UV254 Color- Color- Conduc
ID Sample ID phate phate phate Abs App True tivity mg/L mg/L mg/L mg/L mg/L mg/L °C mg/L 1/cm PtCo Color- µmhos/
CaCO3 units True cm
9 009-M1-1 3/9/2004 9:05 1302 48.6 0.08 2.06 7.34 1.245 14.2 1.05 0.0216 0 0 344.0
9 009-M1-2 3/9/2004 9:05 1302 48.6 0.08 2.06 7.34 1.245 14.2 1.05 0.0216 0 0 344.0
9 009-M1-3 3/9/2004 9:05 1302 48.6 0.08 2.06 7.34 1.245 14.2 1.05 0.0216 0 0 344.0
9 009-N1-1 3/9/2004 9:43 1202 50.1 0.28 2.2 7.29 1.291 9.3 1.24 0.0215 0 0 341.0
9 009-N1-2 3/9/2004 9:43 1202 50.1 0.28 2.2 7.29 1.291 9.3 1.24 0.0215 0 0 341.0
9 009-N1-3 3/9/2004 9:43 1202 50.1 0.28 2.2 7.29 1.291 9.3 1.24 0.0215 0 0 341.0
9 009-E1-1 3/9/2004 10:30 4001 54.3 0.20 2.2 7.24 1.285 9.1 1.03 0.0212 1 0 333.0
9 009-E1-2 3/9/2004 10:30 4001 54.3 0.20 2.2 7.24 1.285 9.1 1.03 0.0212 1 0 333.0
9 009-E1-3 3/9/2004 10:30 4001 54.3 0.20 2.2 7.24 1.285 9.1 1.03 0.0212 1 0 333.0
9 009-F1-1 3/9/2004 11:10 1101 52.2 0.47 2.2 7.22 1.26 9.0 1.08 0.0206 0 0 343.0
9 009-F1-2 3/9/2004 11:10 1101 52.2 0.47 2.2 7.22 1.26 9.0 1.08 0.0206 0 0 343.0
9 009-F1-3 3/9/2004 11:10 1101 52.2 0.47 2.2 7.22 1.26 9.0 1.08 0.0206 0 0 343.0
©2006 AwwaRF. All Rights Reserved.

7/21/2019 Occurrence of Manganese in Drinking Water and Manganese Control
http://slidepdf.com/reader/full/occurrence-of-manganese-in-drinking-water-and-manganese-control 316/463
290
Table D.51 Utility 9 – Spring 2004 distribution system sample (entry, near, mid, and far)
Ortho Poly Total Util ID Sample Date Time Util Alk F Cl2 T Cl2 pH phos phos phos Temp TOC UV254 Color- Color- Conduc
ID Sample ID phate phate phate Abs App True tivity mg/L mg/L mg/L mg/L mg/L mg/L °C mg/L 1/cm PtCo Color- µmhos/
CaCO3 units True cm
9 009-M2-1 6/16/2004 8:45 1302 40.3 0.09 1.96 7.25 1.279 23.4 1.31 0.026 0 0 307.0
9 009-M2-2 6/16/2004 8:45 1302 40.3 0.09 1.96 7.25 1.279 23.4 1.31 0.026 0 0 307.0
9 009-M2-3 6/16/2004 8:45 1302 40.3 0.09 1.96 7.25 1.279 23.4 1.31 0.026 0 0 307.0
9 009-N2-1 6/16/2004 9:50 1202 40.6 0.05 1.97 7.25 1.279 21.0 1.13 0.0261 0 0 307.0
9 009-N2-2 6/16/2004 9:50 1202 40.6 0.05 1.97 7.25 1.279 21.0 1.13 0.0261 0 0 307.0
9 009-N2-3 6/16/2004 9:50 1202 40.6 0.05 1.97 7.25 1.279 21.0 1.13 0.0261 0 0 307.0
9 009-E2-1 6/16/2004 10:50 4001 40.2 0.05 2.05 7.27 1.275 23.6 1.88 0.0282 0 0 304.0
9 009-E2-2 6/16/2004 10:50 4001 40.2 0.05 2.05 7.27 1.275 23.6 1.88 0.0282 0 0 304.0
9 009-E2-3 6/16/2004 10:50 4001 40.2 0.05 2.05 7.27 1.275 23.6 1.88 0.0282 0 0 304.0
9 009-F2-1 6/16/2004 12:15 1101 41.3 0.05 1.99 7.27 1.266 22.4 1.51 0.0261 0 0 307.0
9 009-F2-2 6/16/2004 12:15 1101 41.3 0.05 1.99 7.27 1.266 22.4 1.51 0.0261 0 0 307.0
9 009-F2-3 6/16/2004 12:15 1101 41.3 0.05 1.99 7.27 1.266 22.4 1.51 0.0261 0 0 307.0
©2006 AwwaRF. All Rights Reserved.
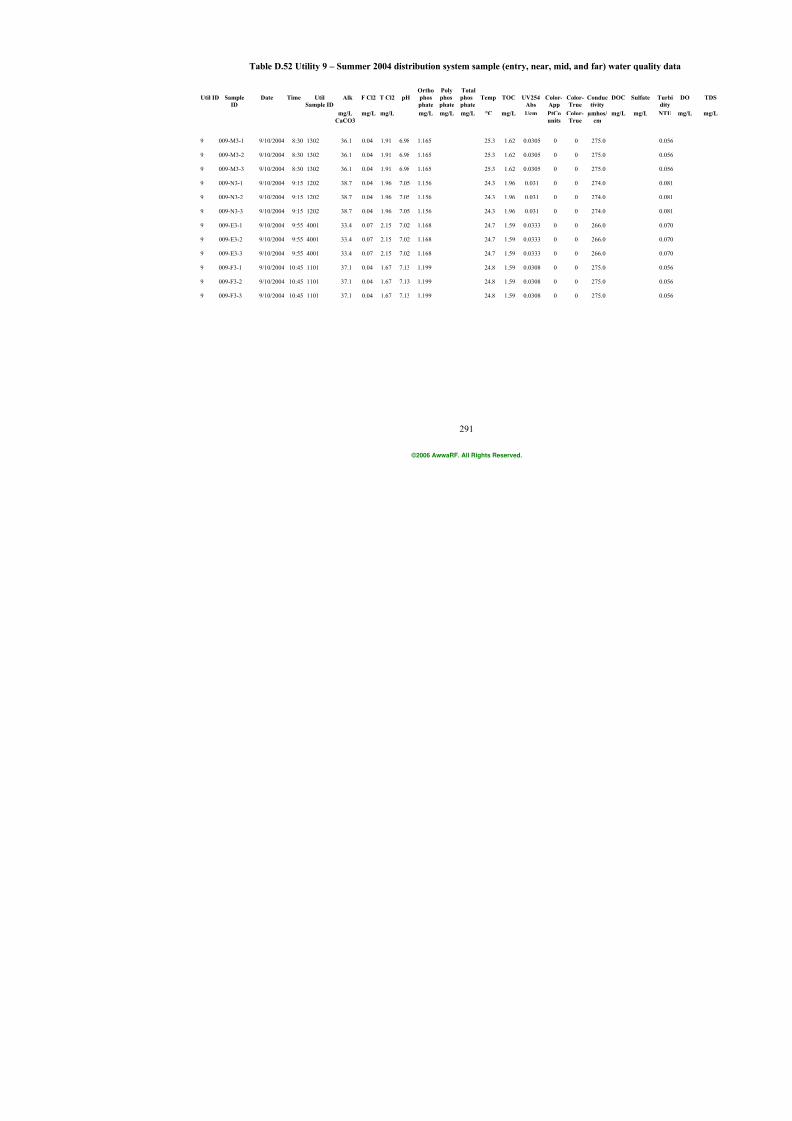
7/21/2019 Occurrence of Manganese in Drinking Water and Manganese Control
http://slidepdf.com/reader/full/occurrence-of-manganese-in-drinking-water-and-manganese-control 317/463
291
Table D.52 Utility 9 – Summer 2004 distribution system sample (entry, near, mid, and far)
Ortho Poly Total Util ID Sample Date Time Util Alk F Cl2 T Cl2 pH phos phos phos Temp TOC UV254 Color- Color- Conduc
ID Sample ID phate phate phate Abs App True tivity mg/L mg/L mg/L mg/L mg/L mg/L °C mg/L 1/cm PtCo Color- µmhos/
CaCO3 units True cm
9 009-M3-1 9/10/2004 8:30 1302 36.1 0.04 1.91 6.98 1.165 25.3 1.62 0.0305 0 0 275.0
9 009-M3-2 9/10/2004 8:30 1302 36.1 0.04 1.91 6.98 1.165 25.3 1.62 0.0305 0 0 275.0
9 009-M3-3 9/10/2004 8:30 1302 36.1 0.04 1.91 6.98 1.165 25.3 1.62 0.0305 0 0 275.0
9 009-N3-1 9/10/2004 9:15 1202 38.7 0.04 1.96 7.05 1.156 24.3 1.96 0.031 0 0 274.0
9 009-N3-2 9/10/2004 9:15 1202 38.7 0.04 1.96 7.05 1.156 24.3 1.96 0.031 0 0 274.0
9 009-N3-3 9/10/2004 9:15 1202 38.7 0.04 1.96 7.05 1.156 24.3 1.96 0.031 0 0 274.0
9 009-E3-1 9/10/2004 9:55 4001 33.4 0.07 2.15 7.02 1.168 24.7 1.59 0.0333 0 0 266.0
9 009-E3-2 9/10/2004 9:55 4001 33.4 0.07 2.15 7.02 1.168 24.7 1.59 0.0333 0 0 266.0
9 009-E3-3 9/10/2004 9:55 4001 33.4 0.07 2.15 7.02 1.168 24.7 1.59 0.0333 0 0 266.0
9 009-F3-1 9/10/2004 10:45 1101 37.1 0.04 1.67 7.13 1.199 24.8 1.59 0.0308 0 0 275.0
9 009-F3-2 9/10/2004 10:45 1101 37.1 0.04 1.67 7.13 1.199 24.8 1.59 0.0308 0 0 275.0
9 009-F3-3 9/10/2004 10:45 1101 37.1 0.04 1.67 7.13 1.199 24.8 1.59 0.0308 0 0 275.0
©2006 AwwaRF. All Rights Reserved.

7/21/2019 Occurrence of Manganese in Drinking Water and Manganese Control
http://slidepdf.com/reader/full/occurrence-of-manganese-in-drinking-water-and-manganese-control 318/463
292
Table D.53 Utility 9 – Fall 2004 distribution system sample (entry, near, mid, and far) w
Ortho Poly Total Util ID Sample Date Time Util Alk F Cl2 T Cl2 pH phos phos phos Temp TOC UV254 Color- Color- Conduc
ID Sample ID phate phate phate Abs App True tivity mg/L mg/L mg/L mg/L mg/L mg/L °C mg/L 1/cm PtCo Color- µmhos/
CaCO3 units True cm
9 009-M4-1 12/8/2004 8:45 1302 25.0 0.02 2.07 7.01 1.236 11.1 0.0259 0 0 234.0
9 009-M4-2 12/8/2004 8:45 1302 25.0 0.02 2.07 7.01 1.236 11.1 0.0259 0 0 234.0
9 009-M4-3 12/8/2004 8:45 1302 25.0 0.02 2.07 7.01 1.236 11.1 0.0259 0 0 234.0
9 009-N4-1 12/8/2004 9:50 1202 26.1 0.02 2.06 6.97 1.536 13.5 0.0259 0 0 232.0
9 009-N4-2 12/8/2004 9:50 1202 26.1 0.02 2.06 6.97 1.536 13.5 0.0259 0 0 232.0
9 009-N4-3 12/8/2004 9:50 1202 26.1 0.02 2.06 6.97 1.536 13.5 0.0259 0 0 232.0
9 009-E4-1 12/8/2004 10:35 4001 26.3 0.01 2.20 6.87 1.36 8.4 1.51 0.0262 0 0 241.0
9 009-E4-2 12/8/2004 10:35 4001 26.3 0.01 2.20 6.87 1.36 8.4 1.51 0.0262 0 0 241.0
9 009-E4-3 12/8/2004 10:35 4001 26.3 0.01 2.20 6.87 1.36 8.4 1.51 0.0262 0 0 241.0
9 009-F4-1 12/8/2004 11:50 1101 30.3 0.02 1.78 6.58 1.325 12.0 0.0256 0 0 260.0
9 009-F4-2 12/8/2004 11:50 1101 30.3 0.02 1.78 6.58 1.325 12.0 0.0256 0 0 260.0
9 009-F4-3 12/8/2004 11:50 1101 30.3 0.02 1.78 6.58 1.325 12.0 0.0256 0 0 260.0
©2006 AwwaRF. All Rights Reserved.
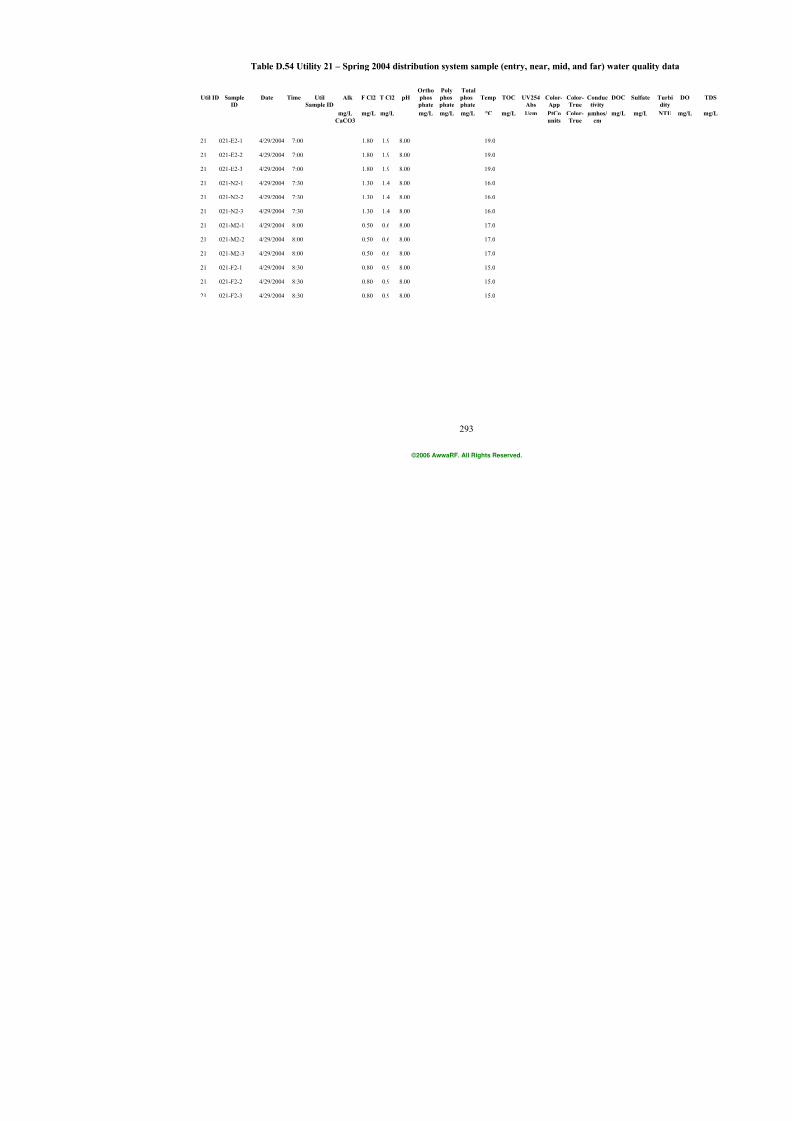
7/21/2019 Occurrence of Manganese in Drinking Water and Manganese Control
http://slidepdf.com/reader/full/occurrence-of-manganese-in-drinking-water-and-manganese-control 319/463
293
Table D.54 Utility 21 – Spring 2004 distribution system sample (entry, near, mid, and far)
Ortho Poly Total Util ID Sample Date Time Util Alk F Cl2 T Cl2 pH phos phos phos Temp TOC UV254 Color- Color- Conduc
ID Sample ID phate phate phate Abs App True tivity mg/L mg/L mg/L mg/L mg/L mg/L °C mg/L 1/cm PtCo Color- µmhos/
CaCO3 units True cm
21 021-E2-1 4/29/2004 7:00 1.80 1.9 8.00 19.0
21 021-E2-2 4/29/2004 7:00 1.80 1.9 8.00 19.0
21 021-E2-3 4/29/2004 7:00 1.80 1.9 8.00 19.0
21 021-N2-1 4/29/2004 7:30 1.30 1.4 8.00 16.0
21 021-N2-2 4/29/2004 7:30 1.30 1.4 8.00 16.0
21 021-N2-3 4/29/2004 7:30 1.30 1.4 8.00 16.0
21 021-M2-1 4/29/2004 8:00 0.50 0.6 8.00 17.0
21 021-M2-2 4/29/2004 8:00 0.50 0.6 8.00 17.0
21 021-M2-3 4/29/2004 8:00 0.50 0.6 8.00 17.0
21 021-F2-1 4/29/2004 8:30 0.80 0.9 8.00 15.0
21 021-F2-2 4/29/2004 8:30 0.80 0.9 8.00 15.0
21 021-F2-3 4/29/2004 8:30 0.80 0.9 8.00 15.0
©2006 AwwaRF. All Rights Reserved.
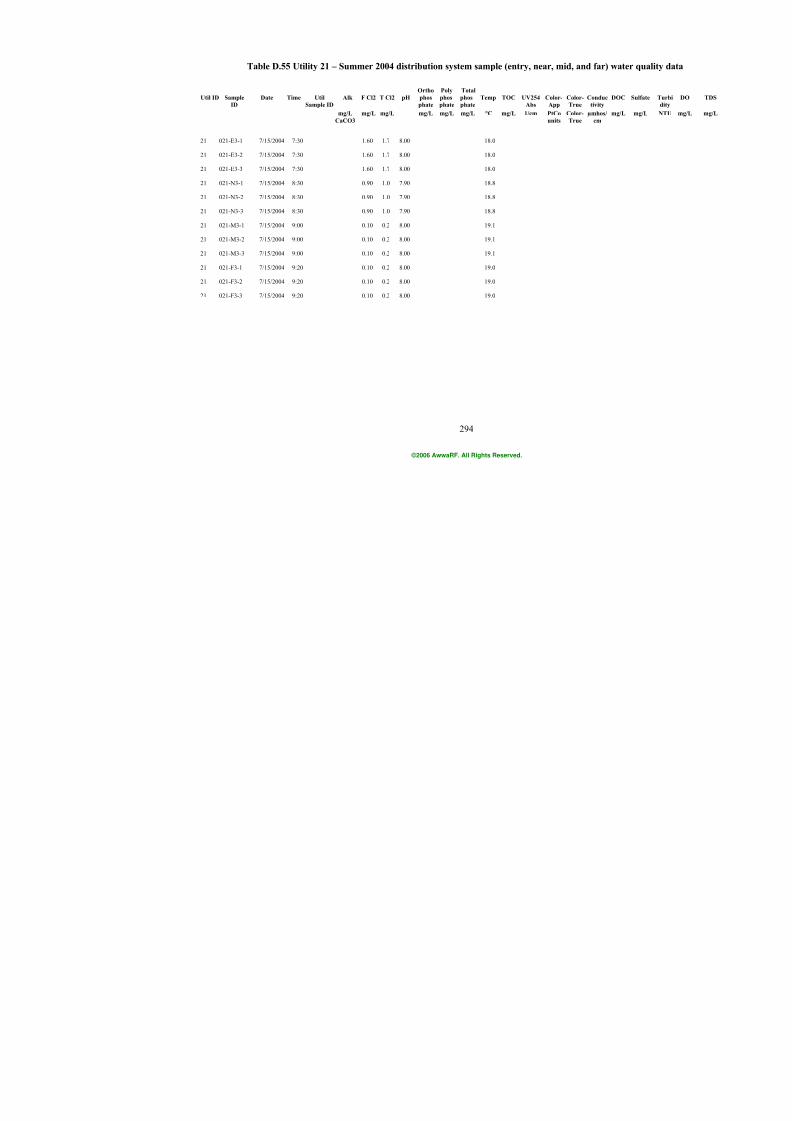
7/21/2019 Occurrence of Manganese in Drinking Water and Manganese Control
http://slidepdf.com/reader/full/occurrence-of-manganese-in-drinking-water-and-manganese-control 320/463
294
Table D.55 Utility 21 – Summer 2004 distribution system sample (entry, near, mid, and far
Ortho Poly Total Util ID Sample Date Time Util Alk F Cl2 T Cl2 pH phos phos phos Temp TOC UV254 Color- Color- Conduc
ID Sample ID phate phate phate Abs App True tivity mg/L mg/L mg/L mg/L mg/L mg/L °C mg/L 1/cm PtCo Color- µmhos/
CaCO3 units True cm
21 021-E3-1 7/15/2004 7:30 1.60 1.7 8.00 18.0
21 021-E3-2 7/15/2004 7:30 1.60 1.7 8.00 18.0
21 021-E3-3 7/15/2004 7:30 1.60 1.7 8.00 18.0
21 021-N3-1 7/15/2004 8:30 0.90 1.0 7.90 18.8
21 021-N3-2 7/15/2004 8:30 0.90 1.0 7.90 18.8
21 021-N3-3 7/15/2004 8:30 0.90 1.0 7.90 18.8
21 021-M3-1 7/15/2004 9:00 0.10 0.2 8.00 19.1
21 021-M3-2 7/15/2004 9:00 0.10 0.2 8.00 19.1
21 021-M3-3 7/15/2004 9:00 0.10 0.2 8.00 19.1
21 021-F3-1 7/15/2004 9:20 0.10 0.2 8.00 19.0
21 021-F3-2 7/15/2004 9:20 0.10 0.2 8.00 19.0
21 021-F3-3 7/15/2004 9:20 0.10 0.2 8.00 19.0
©2006 AwwaRF. All Rights Reserved.

7/21/2019 Occurrence of Manganese in Drinking Water and Manganese Control
http://slidepdf.com/reader/full/occurrence-of-manganese-in-drinking-water-and-manganese-control 321/463
295
Table D.56 Utility 21 – Fall 2004 distribution system sample (entry, near, mid, and far) w
Ortho Poly Total Util ID Sample Date Time Util Alk F Cl2 T Cl2 pH phos phos phos Temp TOC UV254 Color- Color- Conduc
ID Sample ID phate phate phate Abs App True tivity mg/L mg/L mg/L mg/L mg/L mg/L °C mg/L 1/cm PtCo Color- µmhos/
CaCO3 units True cm
21 021-N4-1 11/3/2004 8:15 1.00 1.2 7.90 12.0
21 021-N4-2 11/3/2004 8:15 1.00 1.2 7.90 12.0
21 021-N4-3 11/3/2004 8:15 1.00 1.2 7.90 12.0
21 021-M4-1 11/3/2004 8:50 0.10 0.2 7.80 13.0
21 021-M4-2 11/3/2004 8:50 0.10 0.2 7.80 13.0
21 021-M4-3 11/3/2004 8:50 0.10 0.2 7.80 13.0
21 021-F4-1 11/3/2004 9:20 0.10 0.2 7.70 12.0
21 021-F4-2 11/3/2004 9:20 0.10 0.2 7.70 12.0
21 021-F4-3 11/3/2004 9:20 0.10 0.2 7.70 12.0
21 021-E4-1 11/3/2004 10:00 1.60 1.7 7.70 12.0
21 021-E4-2 11/3/2004 10:00 1.60 1.7 7.70 12.0
21 021-E4-3 11/3/2004 10:00 1.60 1.7 7.70 12.0
©2006 AwwaRF. All Rights Reserved.
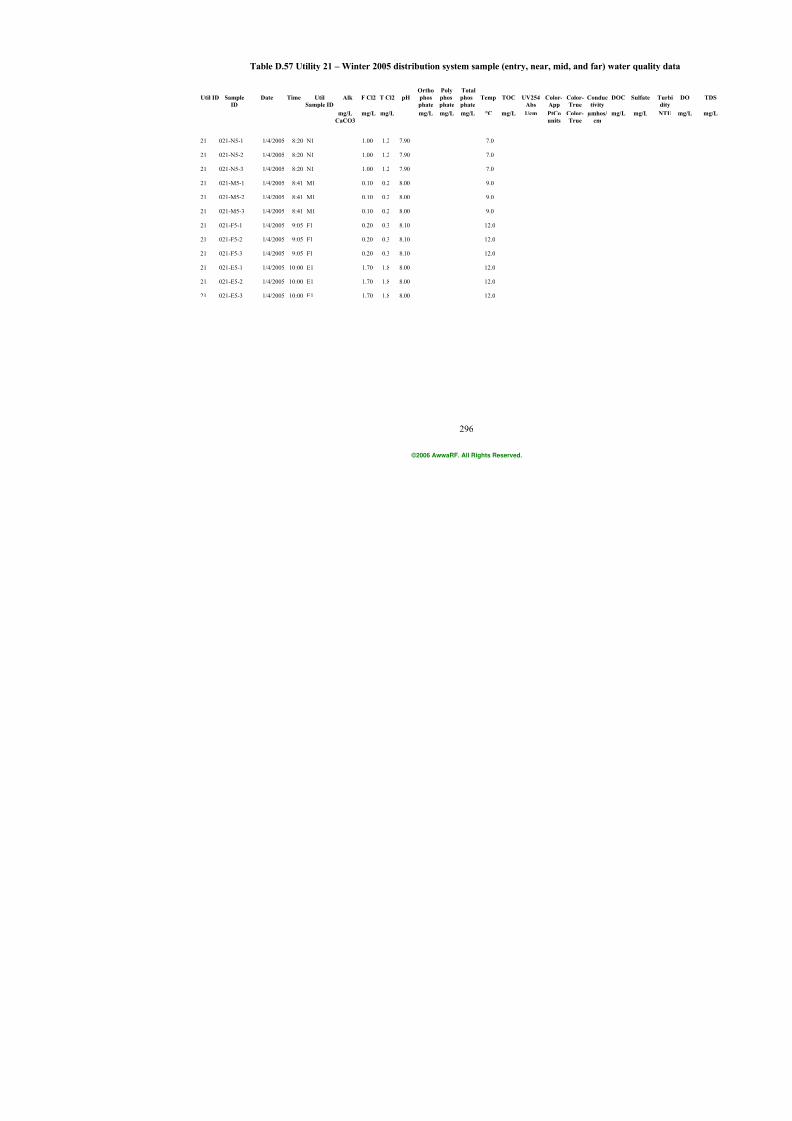
7/21/2019 Occurrence of Manganese in Drinking Water and Manganese Control
http://slidepdf.com/reader/full/occurrence-of-manganese-in-drinking-water-and-manganese-control 322/463
296
Table D.57 Utility 21 – Winter 2005 distribution system sample (entry, near, mid, and far)
Ortho Poly Total Util ID Sample Date Time Util Alk F Cl2 T Cl2 pH phos phos phos Temp TOC UV254 Color- Color- Conduc
ID Sample ID phate phate phate Abs App True tivity mg/L mg/L mg/L mg/L mg/L mg/L °C mg/L 1/cm PtCo Color- µmhos/
CaCO3 units True cm
21 021-N5-1 1/4/2005 8:20 N1 1.00 1.2 7.90 7.0
21 021-N5-2 1/4/2005 8:20 N1 1.00 1.2 7.90 7.0
21 021-N5-3 1/4/2005 8:20 N1 1.00 1.2 7.90 7.0
21 021-M5-1 1/4/2005 8:41 M1 0.10 0.2 8.00 9.0
21 021-M5-2 1/4/2005 8:41 M1 0.10 0.2 8.00 9.0
21 021-M5-3 1/4/2005 8:41 M1 0.10 0.2 8.00 9.0
21 021-F5-1 1/4/2005 9:05 F1 0.20 0.3 8.10 12.0
21 021-F5-2 1/4/2005 9:05 F1 0.20 0.3 8.10 12.0
21 021-F5-3 1/4/2005 9:05 F1 0.20 0.3 8.10 12.0
21 021-E5-1 1/4/2005 10:00 E1 1.70 1.8 8.00 12.0
21 021-E5-2 1/4/2005 10:00 E1 1.70 1.8 8.00 12.0
21 021-E5-3 1/4/2005 10:00 E1 1.70 1.8 8.00 12.0
©2006 AwwaRF. All Rights Reserved.
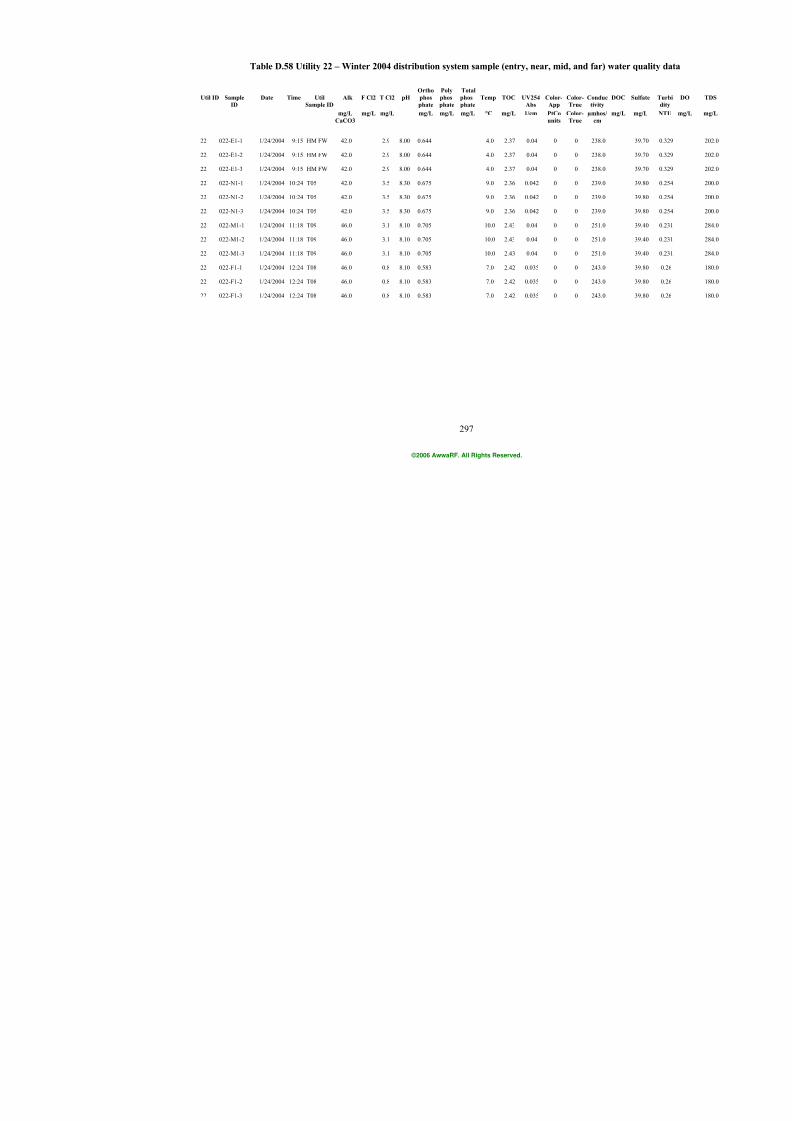
7/21/2019 Occurrence of Manganese in Drinking Water and Manganese Control
http://slidepdf.com/reader/full/occurrence-of-manganese-in-drinking-water-and-manganese-control 323/463
297
Table D.58 Utility 22 – Winter 2004 distribution system sample (entry, near, mid, and far)
Ortho Poly Total Util ID Sample Date Time Util Alk F Cl2 T Cl2 pH phos phos phos Temp TOC UV254 Color- Color- Conduc
ID Sample ID phate phate phate Abs App True tivity mg/L mg/L mg/L mg/L mg/L mg/L °C mg/L 1/cm PtCo Color- µmhos/
CaCO3 units True cm
22 022-E1-1 1/24/2004 9:15 HM FW 42.0 2.9 8.00 0.644 4.0 2.37 0.04 0 0 238.0
22 022-E1-2 1/24/2004 9:15 HM FW 42.0 2.9 8.00 0.644 4.0 2.37 0.04 0 0 238.0
22 022-E1-3 1/24/2004 9:15 HM FW 42.0 2.9 8.00 0.644 4.0 2.37 0.04 0 0 238.0
22 022-N1-1 1/24/2004 10:24 T05 42.0 3.5 8.30 0.675 9.0 2.36 0.042 0 0 239.0
22 022-N1-2 1/24/2004 10:24 T05 42.0 3.5 8.30 0.675 9.0 2.36 0.042 0 0 239.0
22 022-N1-3 1/24/2004 10:24 T05 42.0 3.5 8.30 0.675 9.0 2.36 0.042 0 0 239.0
22 022-M1-1 1/24/2004 11:18 T09 46.0 3.1 8.10 0.705 10.0 2.43 0.04 0 0 251.0
22 022-M1-2 1/24/2004 11:18 T09 46.0 3.1 8.10 0.705 10.0 2.43 0.04 0 0 251.0
22 022-M1-3 1/24/2004 11:18 T09 46.0 3.1 8.10 0.705 10.0 2.43 0.04 0 0 251.0
22 022-F1-1 1/24/2004 12:24 T08 46.0 0.8 8.10 0.583 7.0 2.42 0.035 0 0 243.0
22 022-F1-2 1/24/2004 12:24 T08 46.0 0.8 8.10 0.583 7.0 2.42 0.035 0 0 243.0
22 022-F1-3 1/24/2004 12:24 T08 46.0 0.8 8.10 0.583 7.0 2.42 0.035 0 0 243.0
©2006 AwwaRF. All Rights Reserved.

7/21/2019 Occurrence of Manganese in Drinking Water and Manganese Control
http://slidepdf.com/reader/full/occurrence-of-manganese-in-drinking-water-and-manganese-control 324/463
298
Table D.59 Utility 22 – Spring 2004 distribution system sample (entry, near, mid, and far)
Ortho Poly Total Util ID Sample Date Time Util Alk F Cl2 T Cl2 pH phos phos phos Temp TOC UV254 Color- Color- Conduc
ID Sample ID phate phate phate Abs App True tivity mg/L mg/L mg/L mg/L mg/L mg/L °C mg/L 1/cm PtCo Color- µmhos/
CaCO3 units True cm
22 022-E2-1 4/20/2004 8:20 HM FW 38.0 2.8 7.80 0.46 20.0 2.57 0.038 0 0 226.0
22 022-E2-2 4/20/2004 8:20 HM FW 38.0 2.8 7.80 0.46 20.0 2.57 0.038 0 0 226.0
22 022-E2-3 4/20/2004 8:20 HM FW 38.0 2.8 7.80 0.46 20.0 2.57 0.038 0 0 226.0
22 022-N2-1 4/20/2004 9:56 T05 34.0 2.8 7.50 0.491 22.5 2.34 0.039 0 0 227.0
22 022-N2-2 4/20/2004 9:56 T05 34.0 2.8 7.50 0.491 22.5 2.34 0.039 0 0 227.0
22 022-N2-3 4/20/2004 9:56 T05 34.0 2.8 7.50 0.491 22.5 2.34 0.039 0 0 227.0
22 022-M2-1 4/20/2004 10:55 T09 40.0 2.4 7.80 0.491 19.5 2.39 0.037 0 0 230.0
22 022-M2-2 4/20/2004 10:55 T09 40.0 2.4 7.80 0.491 19.5 2.39 0.037 0 0 230.0
22 022-M2-3 4/20/2004 10:55 T09 40.0 2.4 7.80 0.491 19.5 2.39 0.037 0 0 230.0
22 022-F2-1 4/20/2004 11:51 T08 44.0 0 8.30 0.552 16.5 2.00 0.029 0 0 243.0
22 022-F2-2 4/20/2004 11:51 T08 44.0 0 8.30 0.552 16.5 2.00 0.029 0 0 243.0
22 022-F2-3 4/20/2004 11:51 T08 44.0 0 8.30 0.552 16.5 2.00 0.029 0 0 243.0
©2006 AwwaRF. All Rights Reserved.

7/21/2019 Occurrence of Manganese in Drinking Water and Manganese Control
http://slidepdf.com/reader/full/occurrence-of-manganese-in-drinking-water-and-manganese-control 325/463
299
Table D.60 Utility 22 – Summer 2004 distribution system sample (entry, near, mid, and far
Ortho Poly Total Util ID Sample Date Time Util Alk F Cl2 T Cl2 pH phos phos phos Temp TOC UV254 Color- Color- Conduc
ID Sample ID phate phate phate Abs App True tivity mg/L mg/L mg/L mg/L mg/L mg/L °C mg/L 1/cm PtCo Color- µmhos/
CaCO3 units True cm
22 022-N3-1 8/27/2004 9:50 T05 40.0 4.2 7.60 0.552 28.0 3.35 0.063 0 0 225.0
22 022-N3-2 8/27/2004 9:50 T05 40.0 4.2 7.60 0.552 28.0 3.35 0.063 0 0 225.0
22 022-N3-3 8/27/2004 9:50 T05 40.0 4.2 7.60 0.552 28.0 3.35 0.063 0 0 225.0
22 022-M3-1 8/27/2004 10:35 T09 44.0 3.1 7.70 0.613 26.0 3.44 0.055 0 0 218.0
22 022-M3-2 8/27/2004 10:35 T09 44.0 3.1 7.70 0.613 26.0 3.44 0.055 0 0 218.0
22 022-M3-3 8/27/2004 10:35 T09 44.0 3.1 7.70 0.613 26.0 3.44 0.055 0 0 218.0
22 022-E3-1 8/27/2004 11:02 HM FW 44.0 4.2 7.50 0.521 26.5 3.29 0.061 0 0 220.0
22 022-E3-2 8/27/2004 11:02 HM FW 44.0 4.2 7.50 0.521 26.5 3.29 0.061 0 0 220.0
22 022-E3-3 8/27/2004 11:02 HM FW 44.0 4.2 7.50 0.521 26.5 3.29 0.061 0 0 220.0
22 022-F3-1 8/27/2004 11:24 T08 42.0 2.5 8.10 0.583 27.0 3.39 0.050 0 0 223.0
22 022-F3-2 8/27/2004 11:24 T08 42.0 2.5 8.10 0.583 27.0 3.39 0.050 0 0 223.0
22 022-F3-3 8/27/2004 11:24 T08 42.0 2.5 8.10 0.583 27.0 3.39 0.050 0 0 223.0
©2006 AwwaRF. All Rights Reserved.
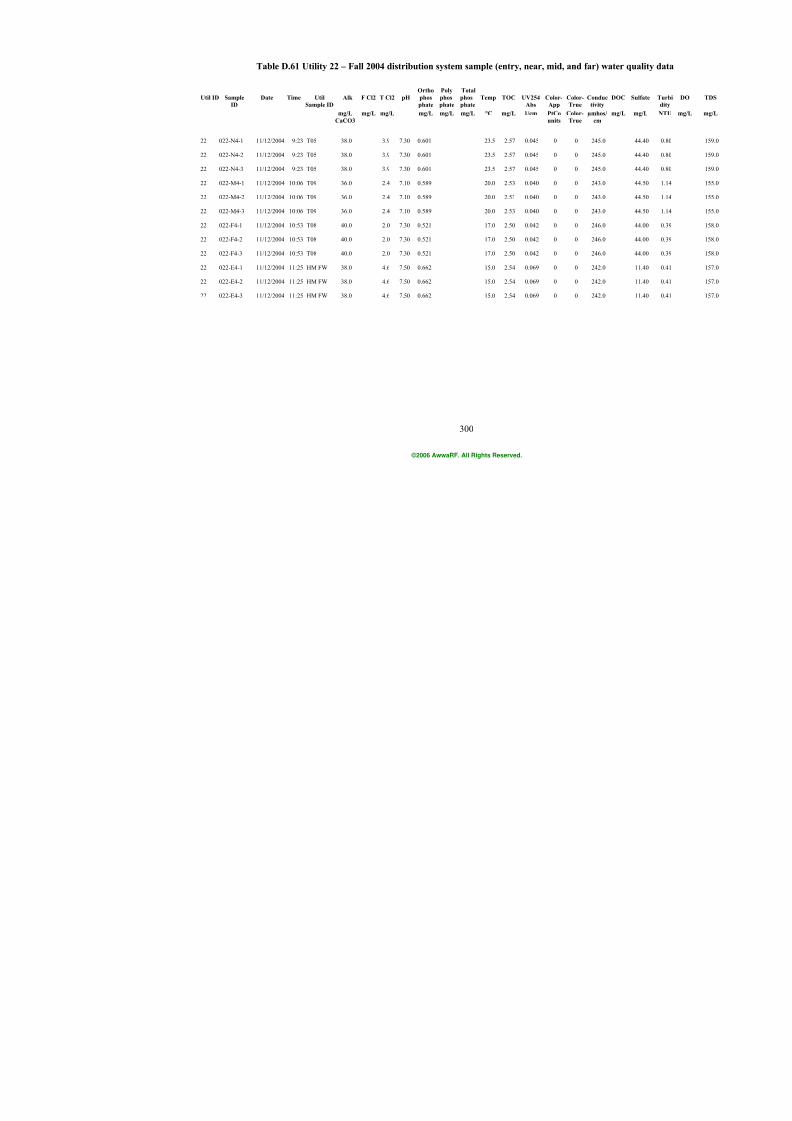
7/21/2019 Occurrence of Manganese in Drinking Water and Manganese Control
http://slidepdf.com/reader/full/occurrence-of-manganese-in-drinking-water-and-manganese-control 326/463
300
Table D.61 Utility 22 – Fall 2004 distribution system sample (entry, near, mid, and far) w
Ortho Poly Total Util ID Sample Date Time Util Alk F Cl2 T Cl2 pH phos phos phos Temp TOC UV254 Color- Color- Conduc
ID Sample ID phate phate phate Abs App True tivity mg/L mg/L mg/L mg/L mg/L mg/L °C mg/L 1/cm PtCo Color- µmhos/
CaCO3 units True cm
22 022-N4-1 11/12/2004 9:23 T05 38.0 3.9 7.30 0.601 23.5 2.57 0.045 0 0 245.0
22 022-N4-2 11/12/2004 9:23 T05 38.0 3.9 7.30 0.601 23.5 2.57 0.045 0 0 245.0
22 022-N4-3 11/12/2004 9:23 T05 38.0 3.9 7.30 0.601 23.5 2.57 0.045 0 0 245.0
22 022-M4-1 11/12/2004 10:06 T09 36.0 2.4 7.10 0.589 20.0 2.53 0.040 0 0 243.0
22 022-M4-2 11/12/2004 10:06 T09 36.0 2.4 7.10 0.589 20.0 2.53 0.040 0 0 243.0
22 022-M4-3 11/12/2004 10:06 T09 36.0 2.4 7.10 0.589 20.0 2.53 0.040 0 0 243.0
22 022-F4-1 11/12/2004 10:53 T08 40.0 2.0 7.30 0.521 17.0 2.50 0.042 0 0 246.0
22 022-F4-2 11/12/2004 10:53 T08 40.0 2.0 7.30 0.521 17.0 2.50 0.042 0 0 246.0
22 022-F4-3 11/12/2004 10:53 T08 40.0 2.0 7.30 0.521 17.0 2.50 0.042 0 0 246.0
22 022-E4-1 11/12/2004 11:25 HM FW 38.0 4.6 7.50 0.662 15.0 2.54 0.069 0 0 242.0
22 022-E4-2 11/12/2004 11:25 HM FW 38.0 4.6 7.50 0.662 15.0 2.54 0.069 0 0 242.0
22 022-E4-3 11/12/2004 11:25 HM FW 38.0 4.6 7.50 0.662 15.0 2.54 0.069 0 0 242.0
©2006 AwwaRF. All Rights Reserved.
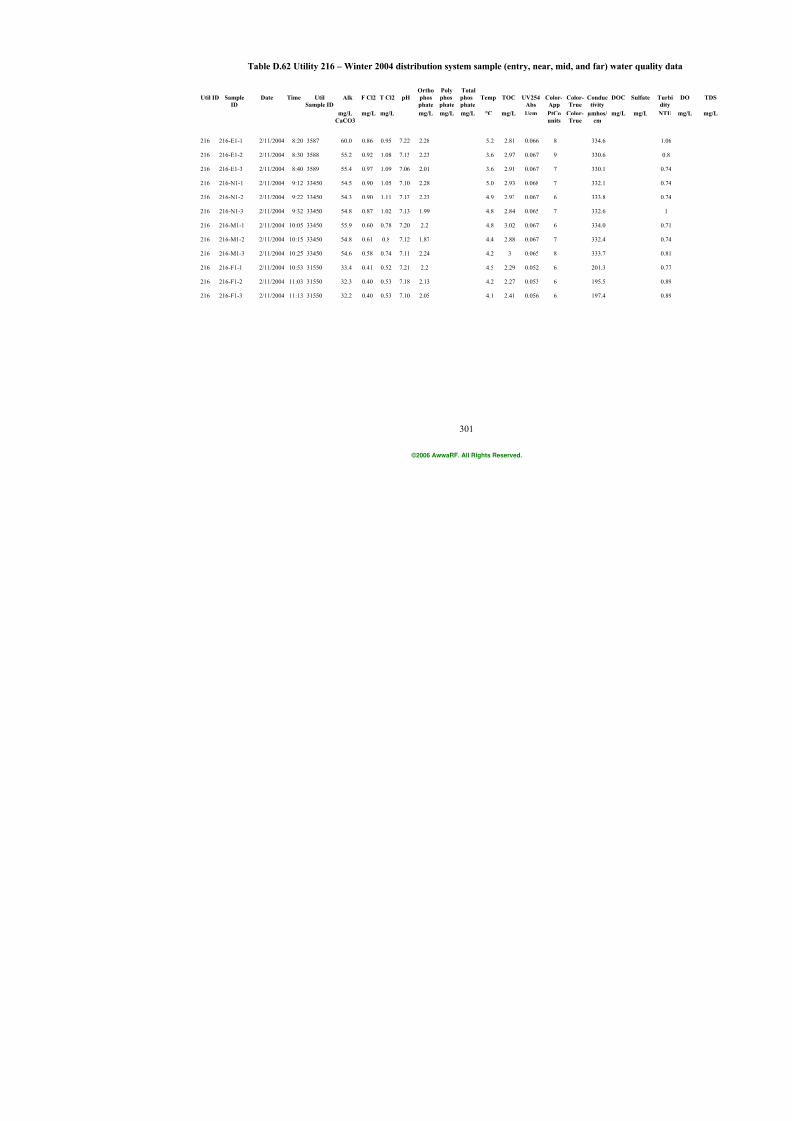
7/21/2019 Occurrence of Manganese in Drinking Water and Manganese Control
http://slidepdf.com/reader/full/occurrence-of-manganese-in-drinking-water-and-manganese-control 327/463
301
Table D.62 Utility 216 – Winter 2004 distribution system sample (entry, near, mid, and far
Ortho Poly Total Util ID Sample Date Time Util Alk F Cl2 T Cl2 pH phos phos phos Temp TOC UV254 Color- Color- Conduc
ID Sample ID phate phate phate Abs App True tivity mg/L mg/L mg/L mg/L mg/L mg/L °C mg/L 1/cm PtCo Color- µmhos/
CaCO3 units True cm
216 216-E1-1 2/11/2004 8:20 3587 60.0 0.86 0.95 7.22 2.28 5.2 2.81 0.066 8 334.6
216 216-E1-2 2/11/2004 8:30 3588 55.2 0.92 1.08 7.13 2.23 3.6 2.97 0.067 9 330.6
216 216-E1-3 2/11/2004 8:40 3589 55.4 0.97 1.09 7.06 2.01 3.6 2.91 0.067 7 330.1
216 216-N1-1 2/11/2004 9:12 33450 54.5 0.90 1.05 7.10 2.28 5.0 2.93 0.068 7 332.1
216 216-N1-2 2/11/2004 9:22 33450 54.3 0.90 1.11 7.13 2.23 4.9 2.93 0.067 6 333.8
216 216-N1-3 2/11/2004 9:32 33450 54.8 0.87 1.02 7.13 1.99 4.8 2.84 0.065 7 332.6
216 216-M1-1 2/11/2004 10:05 33450 55.9 0.60 0.78 7.20 2.2 4.8 3.02 0.067 6 334.0
216 216-M1-2 2/11/2004 10:15 33450 54.8 0.61 0.8 7.12 1.87 4.4 2.88 0.067 7 332.4
216 216-M1-3 2/11/2004 10:25 33450 54.6 0.58 0.74 7.11 2.24 4.2 3 0.065 8 333.7
216 216-F1-1 2/11/2004 10:53 31550 33.4 0.41 0.52 7.21 2.2 4.5 2.29 0.052 6 201.3
216 216-F1-2 2/11/2004 11:03 31550 32.3 0.40 0.53 7.18 2.13 4.2 2.27 0.053 6 195.5
216 216-F1-3 2/11/2004 11:13 31550 32.2 0.40 0.53 7.10 2.05 4.1 2.41 0.056 6 197.4
©2006 AwwaRF. All Rights Reserved.

7/21/2019 Occurrence of Manganese in Drinking Water and Manganese Control
http://slidepdf.com/reader/full/occurrence-of-manganese-in-drinking-water-and-manganese-control 328/463
302
Table D.63 Utility 216 – Spring 2004 distribution system sample (entry, near, mid, and far)
Ortho Poly Total Util ID Sample Date Time Util Alk F Cl2 T Cl2 pH phos phos phos Temp TOC UV254 Color- Color- Conduc
ID Sample ID phate phate phate Abs App True tivity mg/L mg/L mg/L mg/L mg/L mg/L °C mg/L 1/cm PtCo Color- µmhos/
CaCO3 units True cm
216 216-E2-1 5/27/2004 9:06 BX 33 55.9 0.88 1.06 7.19 2.06 13.7 3.19 0.054 7 380.0
216 216-E2-2 5/27/2004 9:15 BX 33 55.2 0.90 1.06 7.18 2.05 13.1 2.81 0.053 7 384.0
216 216-E2-3 5/27/2004 9:23 BX 33 55.5 0.81 0.93 7.18 2.19 13.3 2.48 0.052 6 398.0
216 216-N2-1 5/27/2004 9:58 38400 54.9 0.62 0.7 7.22 2.43 13.0 2.66 0.055 6 383.0
216 216-N2-2 5/27/2004 10:06 38400 55.0 0.60 0.76 7.25 1.95 12.5 2.8 0.054 7 384.0
216 216-N2-3 5/27/2004 10:13 38400 54.7 0.58 0.79 7.25 2.06 12.5 2.55 0.055 6 389.0
216 216-M2-1 5/27/2004 11:05 33450 54.8 0.42 0.46 7.29 1.98 13.9 2.52 0.054 8 378.0
216 216-M2-2 5/27/2004 11:13 33450 55.1 0.31 0.43 7.29 2.12 13.7 2.5 0.054 7 383.0
216 216-M2-3 5/27/2004 11:21 33450 55.0 0.30 0.5 7.27 1.95 13.7 2.72 0.055 7 384.0
216 216-F2-1 5/27/2004 12:25 31550 49.0 0.07 0.13 7.27 1.92 17.2 2.43 0.05 6 339.0
216 216-F2-2 5/27/2004 12:33 31550 48.9 0.01 0.16 7.26 1.8 16.7 2.62 0.051 6 344.0
216 216-F2-3 5/27/2004 12:40 31550 51.5 0.01 0.16 7.24 1.87 16.8 2.45 0.053 7 351.0
©2006 AwwaRF. All Rights Reserved.
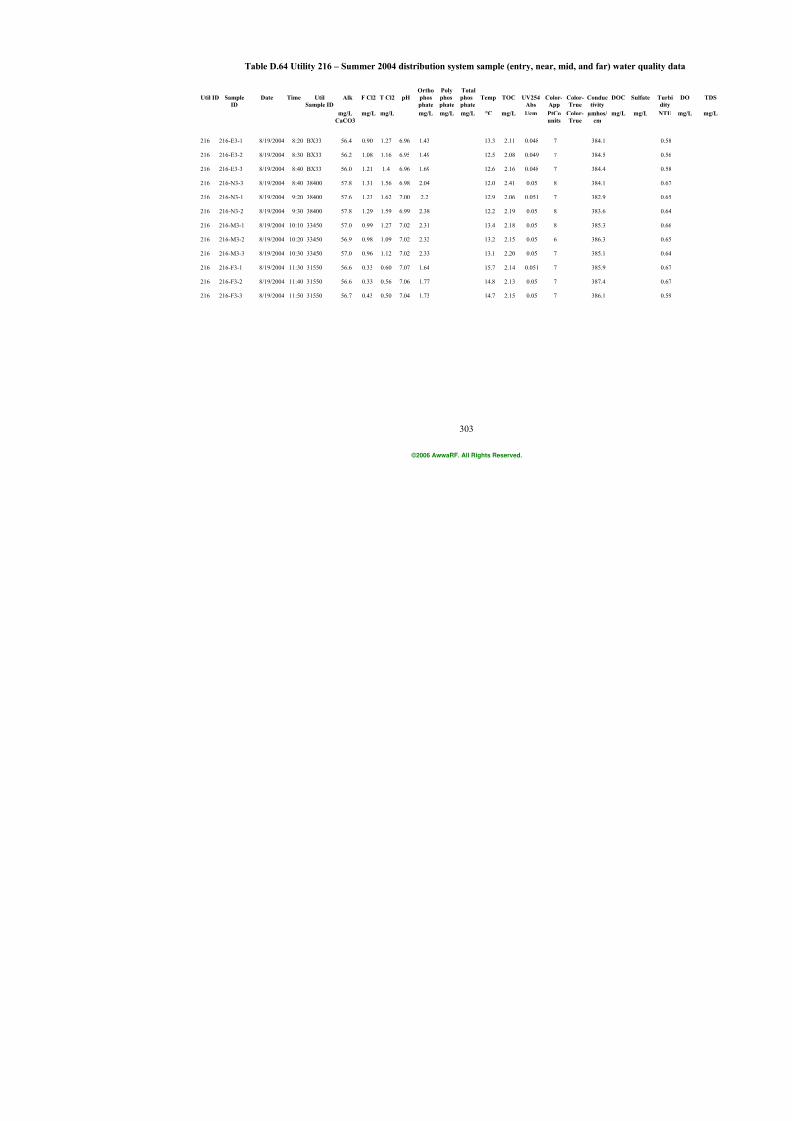
7/21/2019 Occurrence of Manganese in Drinking Water and Manganese Control
http://slidepdf.com/reader/full/occurrence-of-manganese-in-drinking-water-and-manganese-control 329/463
303
Table D.64 Utility 216 – Summer 2004 distribution system sample (entry, near, mid, and far
Ortho Poly Total Util ID Sample Date Time Util Alk F Cl2 T Cl2 pH phos phos phos Temp TOC UV254 Color- Color- Conduc
ID Sample ID phate phate phate Abs App True tivity mg/L mg/L mg/L mg/L mg/L mg/L °C mg/L 1/cm PtCo Color- µmhos/
CaCO3 units True cm
216 216-E3-1 8/19/2004 8:20 BX33 56.4 0.90 1.27 6.96 1.43 13.3 2.11 0.048 7 384.1
216 216-E3-2 8/19/2004 8:30 BX33 56.2 1.08 1.16 6.95 1.49 12.5 2.08 0.049 7 384.5
216 216-E3-3 8/19/2004 8:40 BX33 56.0 1.21 1.4 6.96 1.69 12.6 2.16 0.048 7 384.4
216 216-N3-3 8/19/2004 8:40 38400 57.8 1.31 1.56 6.98 2.04 12.0 2.41 0.05 8 384.1
216 216-N3-1 8/19/2004 9:20 38400 57.6 1.23 1.62 7.00 2.2 12.9 2.06 0.051 7 382.9
216 216-N3-2 8/19/2004 9:30 38400 57.8 1.29 1.59 6.99 2.38 12.2 2.19 0.05 8 383.6
216 216-M3-1 8/19/2004 10:10 33450 57.0 0.99 1.27 7.02 2.31 13.4 2.18 0.05 8 385.3
216 216-M3-2 8/19/2004 10:20 33450 56.9 0.98 1.09 7.02 2.32 13.2 2.15 0.05 6 386.3
216 216-M3-3 8/19/2004 10:30 33450 57.0 0.96 1.12 7.02 2.33 13.1 2.20 0.05 7 385.1
216 216-F3-1 8/19/2004 11:30 31550 56.6 0.33 0.60 7.07 1.64 15.7 2.14 0.051 7 385.9
216 216-F3-2 8/19/2004 11:40 31550 56.6 0.33 0.56 7.06 1.77 14.8 2.13 0.05 7 387.4
216 216-F3-3 8/19/2004 11:50 31550 56.7 0.43 0.50 7.04 1.73 14.7 2.15 0.05 7 386.1
©2006 AwwaRF. All Rights Reserved.
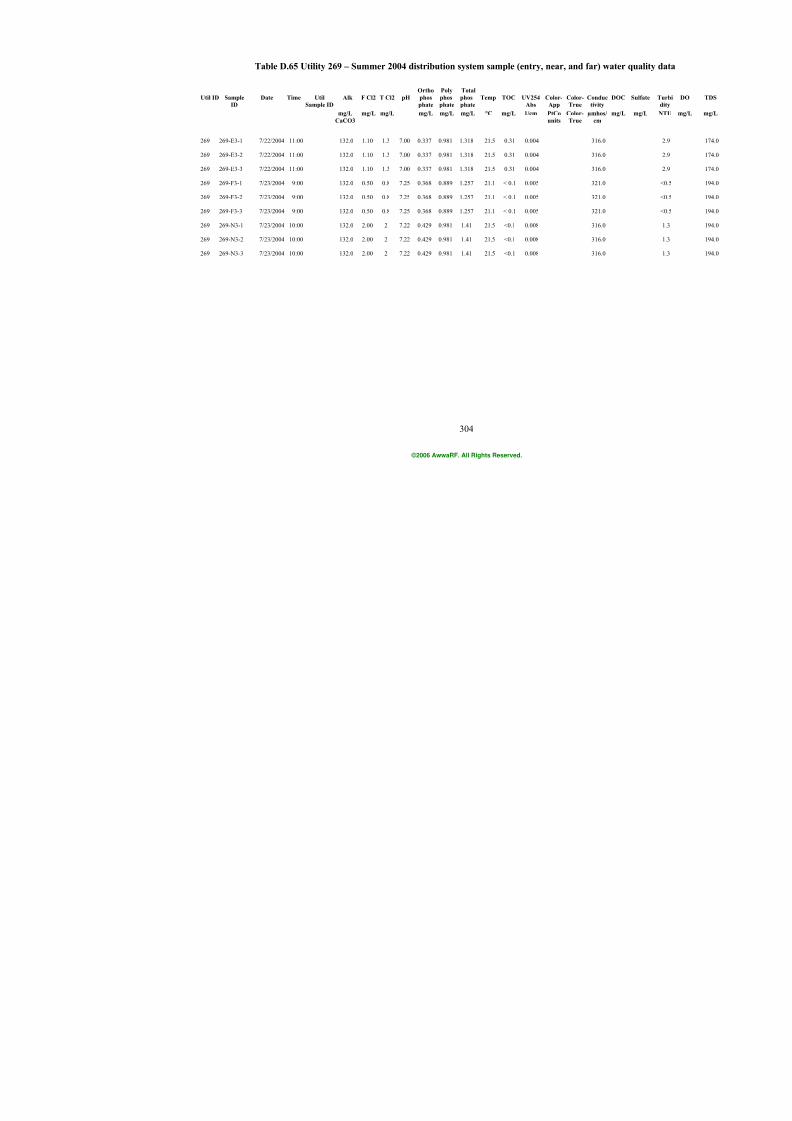
7/21/2019 Occurrence of Manganese in Drinking Water and Manganese Control
http://slidepdf.com/reader/full/occurrence-of-manganese-in-drinking-water-and-manganese-control 330/463
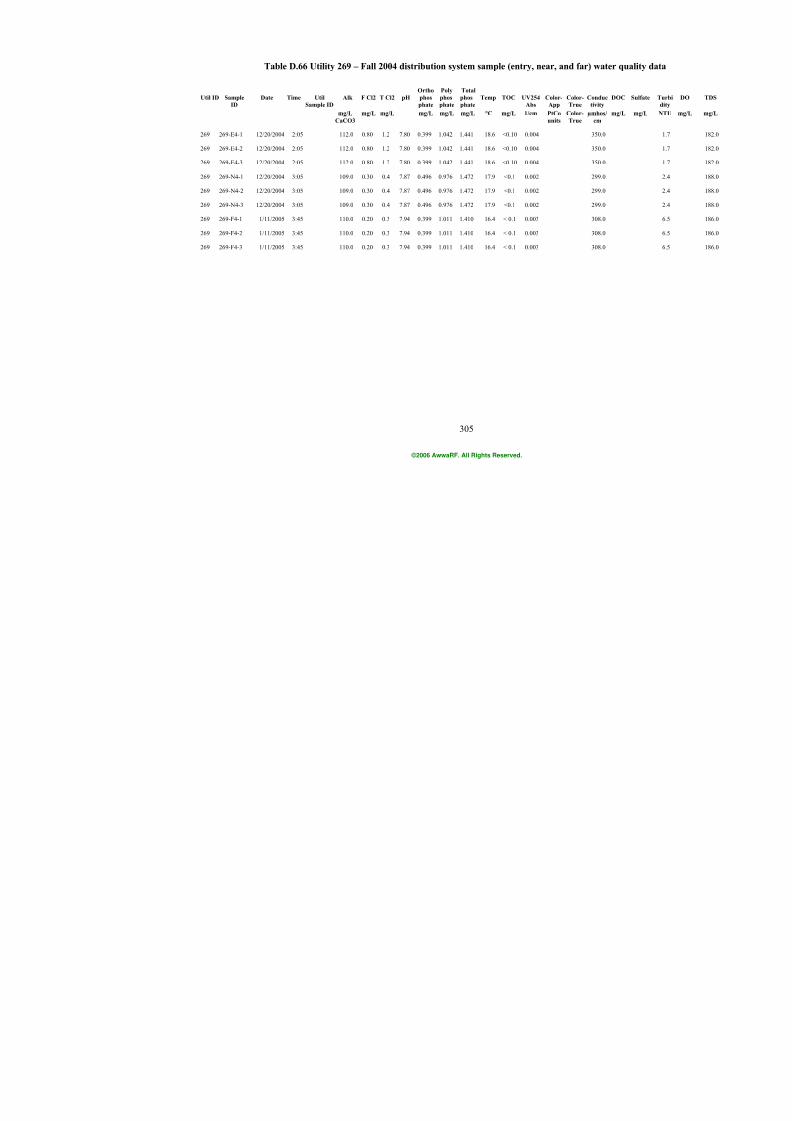
7/21/2019 Occurrence of Manganese in Drinking Water and Manganese Control
http://slidepdf.com/reader/full/occurrence-of-manganese-in-drinking-water-and-manganese-control 331/463
305
Table D.66 Utility 269 – Fall 2004 distribution system sample (entry, near, and far) wa
Ortho Poly Total Util ID Sample Date Time Util Alk F Cl2 T Cl2 pH phos phos phos Temp TOC UV254 Color- Color- Conduc
ID Sample ID phate phate phate Abs App True tivity mg/L mg/L mg/L mg/L mg/L mg/L °C mg/L 1/cm PtCo Color- µmhos/
CaCO3 units True cm
269 269-E4-1 12/20/2004 2:05 112.0 0.80 1.2 7.80 0.399 1.042 1.441 18.6 <0.10 0.004 350.0
269 269-E4-2 12/20/2004 2:05 112.0 0.80 1.2 7.80 0.399 1.042 1.441 18.6 <0.10 0.004 350.0
269 269-E4-3 12/20/2004 2:05 112.0 0.80 1.2 7.80 0.399 1.042 1.441 18.6 <0.10 0.004 350.0
269 269-N4-1 12/20/2004 3:05 109.0 0.30 0.4 7.87 0.496 0.976 1.472 17.9 <0.1 0.002 299.0
269 269-N4-2 12/20/2004 3:05 109.0 0.30 0.4 7.87 0.496 0.976 1.472 17.9 <0.1 0.002 299.0
269 269-N4-3 12/20/2004 3:05 109.0 0.30 0.4 7.87 0.496 0.976 1.472 17.9 <0.1 0.002 299.0
269 269-F4-1 1/11/2005 3:45 110.0 0.20 0.3 7.94 0.399 1.011 1.410 16.4 < 0.1 0.003 308.0
269
269-F4-2
1/11/2005
3:45
110.0
0.20
0.3
7.94
0.399
1.011
1.410
16.4
< 0.1
0.003
308.0
269 269-F4-3 1/11/2005 3:45 110.0 0.20 0.3 7.94 0.399 1.011 1.410 16.4 < 0.1 0.003 308.0
©2006 AwwaRF. All Rights Reserved.

7/21/2019 Occurrence of Manganese in Drinking Water and Manganese Control
http://slidepdf.com/reader/full/occurrence-of-manganese-in-drinking-water-and-manganese-control 332/463
306
Table D.67 Utility 315 – Winter 2004 distribution system sample (entry, near, mid, and far
Ortho Poly Total Util ID Sample Date Time Util Alk F Cl2 T Cl2 pH phos phos phos Temp TOC UV254 Color- Color- Conduc
ID Sample ID phate phate phate Abs App True tivity mg/L mg/L mg/L mg/L mg/L mg/L °C mg/L 1/cm PtCo Color- µmhos/
CaCO3 units True cm
315 315-E1-1 2/24/2004 14:15 2.45 2.55 7.31 5.0
315 315-E1-2 2/24/2004 14:15 2.45 2.55 7.31 5.0
315 315-E1-3 2/24/2004 14:15 2.45 2.55 7.31 5.0
315 315-N1-1 2/25/2004 11:15 1.50 2.2 7.40 5.0
315 315-N1-2 2/25/2004 11:15 1.50 2.2 7.40 5.0
315 315-N1-3 2/25/2004 11:15 1.50 2.2 7.40 5.0
315 315-M1-1 2/26/2004 9:20 2.30 2.5 7.20 5.0
315
315-M1-2
2/26/2004
9:20
2.30
2.5
7.20
5.0
315 315-M1-3 2/26/2004 9:20 2.30 2.5 7.20 5.0
315 315-F1-1 2/27/2004 10:20 1.90 2 7.30 5.0
315 315-F1-2 2/27/2004 10:20 1.90 2 7.30 5.0
315 315-F1-3 2/27/2004 10:20 1.90 2 7.30 5.0
©2006 AwwaRF. All Rights Reserved.
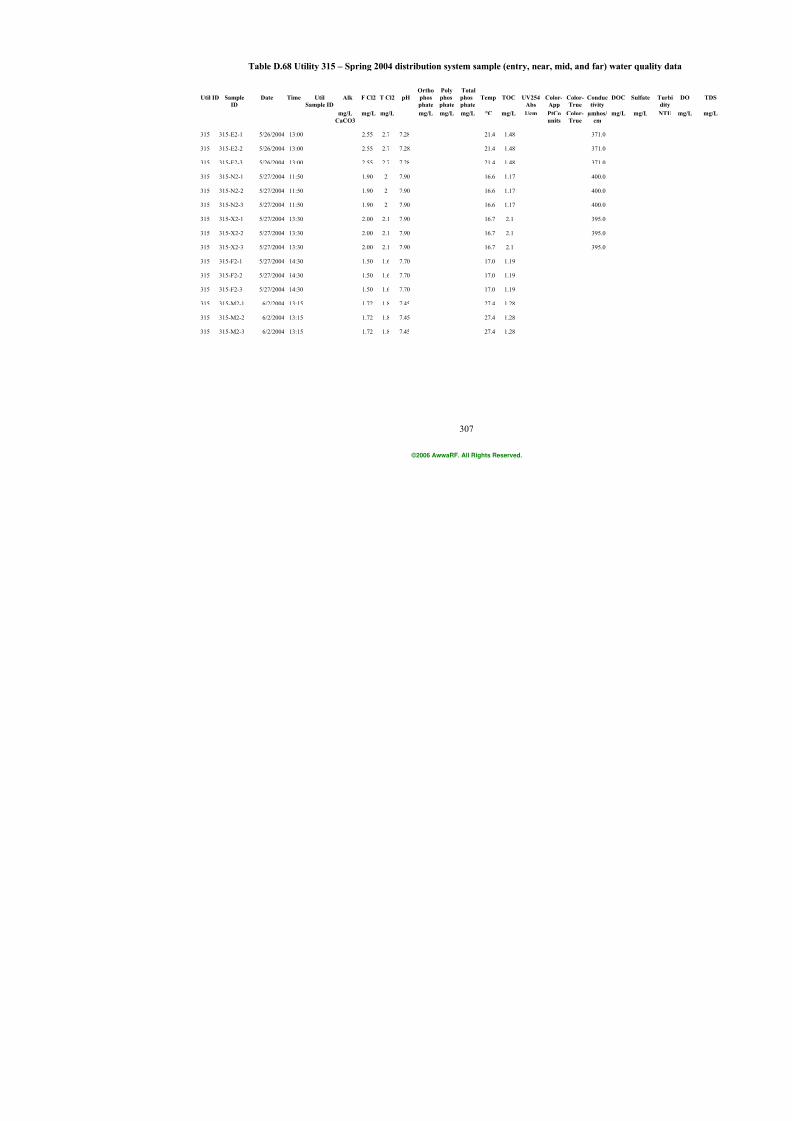
7/21/2019 Occurrence of Manganese in Drinking Water and Manganese Control
http://slidepdf.com/reader/full/occurrence-of-manganese-in-drinking-water-and-manganese-control 333/463
307
Table D.68 Utility 315 – Spring 2004 distribution system sample (entry, near, mid, and far)
Ortho Poly Total Util ID Sample Date Time Util Alk F Cl2 T Cl2 pH phos phos phos Temp TOC UV254 Color- Color- Conduc
ID Sample ID phate phate phate Abs App True tivity mg/L mg/L mg/L mg/L mg/L mg/L °C mg/L 1/cm PtCo Color- µmhos/
CaCO3 units True cm
315 315-E2-1 5/26/2004 13:00 2.55 2.7 7.28 21.4 1.48 371.0
315 315-E2-2 5/26/2004 13:00 2.55 2.7 7.28 21.4 1.48 371.0
315 315-E2-3 5/26/2004 13:00 2.55 2.7 7.28 21.4 1.48 371.0
315 315-N2-1 5/27/2004 11:50 1.90 2 7.90 16.6 1.17 400.0
315 315-N2-2 5/27/2004 11:50 1.90 2 7.90 16.6 1.17 400.0
315 315-N2-3 5/27/2004 11:50 1.90 2 7.90 16.6 1.17 400.0
315 315-X2-1 5/27/2004 13:30 2.00 2.1 7.90 16.7 2.1 395.0
315
315-X2-2
5/27/2004
13:30
2.00
2.1
7.90
16.7
2.1
395.0
315 315-X2-3 5/27/2004 13:30 2.00 2.1 7.90 16.7 2.1 395.0
315 315-F2-1 5/27/2004 14:30 1.50 1.6 7.70 17.0 1.19
315 315-F2-2 5/27/2004 14:30 1.50 1.6 7.70 17.0 1.19
315 315-F2-3 5/27/2004 14:30 1.50 1.6 7.70 17.0 1.19
315 315-M2-1 6/2/2004 13:15 1.72 1.8 7.45 27.4 1.28
315 315-M2-2 6/2/2004 13:15 1.72 1.8 7.45 27.4 1.28
315 315-M2-3 6/2/2004 13:15 1.72 1.8 7.45 27.4 1.28
©2006 AwwaRF. All Rights Reserved.
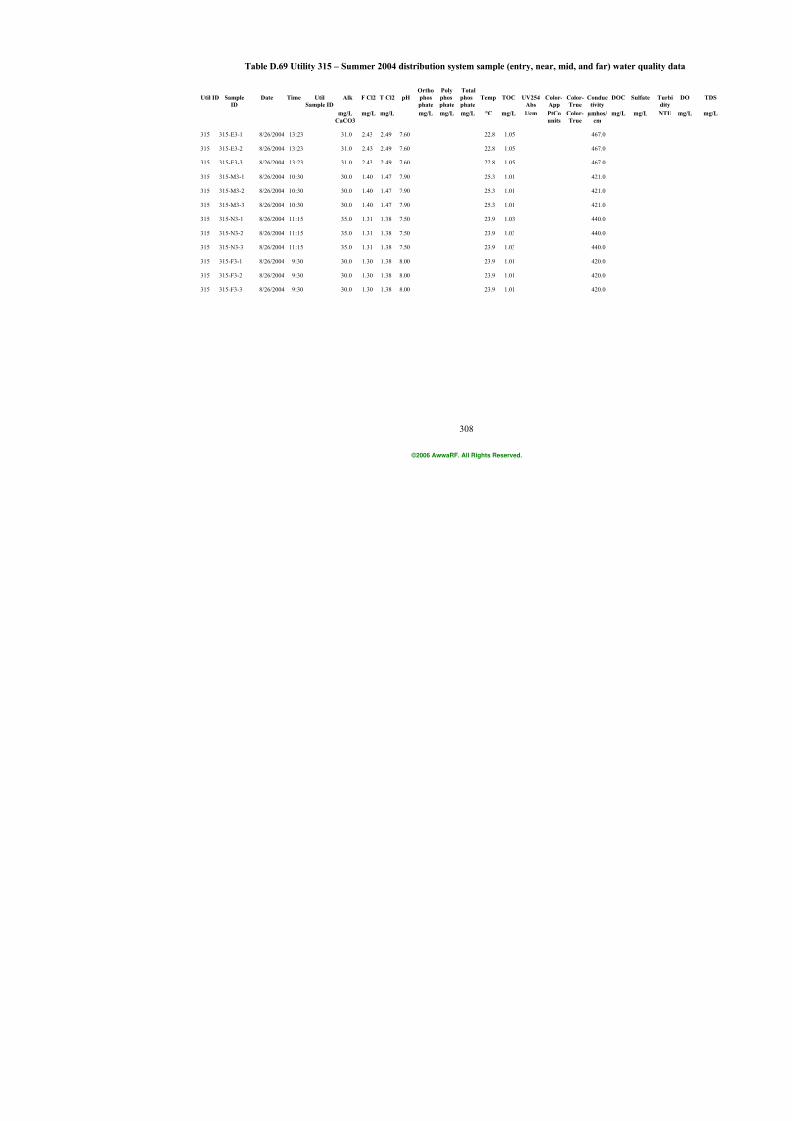
7/21/2019 Occurrence of Manganese in Drinking Water and Manganese Control
http://slidepdf.com/reader/full/occurrence-of-manganese-in-drinking-water-and-manganese-control 334/463
308
Table D.69 Utility 315 – Summer 2004 distribution system sample (entry, near, mid, and far
Ortho Poly Total Util ID Sample Date Time Util Alk F Cl2 T Cl2 pH phos phos phos Temp TOC UV254 Color- Color- Conduc
ID Sample ID phate phate phate Abs App True tivity mg/L mg/L mg/L mg/L mg/L mg/L °C mg/L 1/cm PtCo Color- µmhos/
CaCO3 units True cm
315 315-E3-1 8/26/2004 13:23 31.0 2.43 2.49 7.60 22.8 1.05 467.0
315 315-E3-2 8/26/2004 13:23 31.0 2.43 2.49 7.60 22.8 1.05 467.0
315 315-E3-3 8/26/2004 13:23 31.0 2.43 2.49 7.60 22.8 1.05 467.0
315 315-M3-1 8/26/2004 10:30 30.0 1.40 1.47 7.90 25.3 1.01 421.0
315 315-M3-2 8/26/2004 10:30 30.0 1.40 1.47 7.90 25.3 1.01 421.0
315 315-M3-3 8/26/2004 10:30 30.0 1.40 1.47 7.90 25.3 1.01 421.0
315 315-N3-1 8/26/2004 11:15 35.0 1.31 1.38 7.50 23.9 1.03 440.0
315
315-N3-2
8/26/2004
11:15
35.0
1.31
1.38
7.50
23.9
1.03
440.0
315 315-N3-3 8/26/2004 11:15 35.0 1.31 1.38 7.50 23.9 1.03 440.0
315 315-F3-1 8/26/2004 9:30 30.0 1.30 1.38 8.00 23.9 1.01 420.0
315 315-F3-2 8/26/2004 9:30 30.0 1.30 1.38 8.00 23.9 1.01 420.0
315 315-F3-3 8/26/2004 9:30 30.0 1.30 1.38 8.00 23.9 1.01 420.0
©2006 AwwaRF. All Rights Reserved.
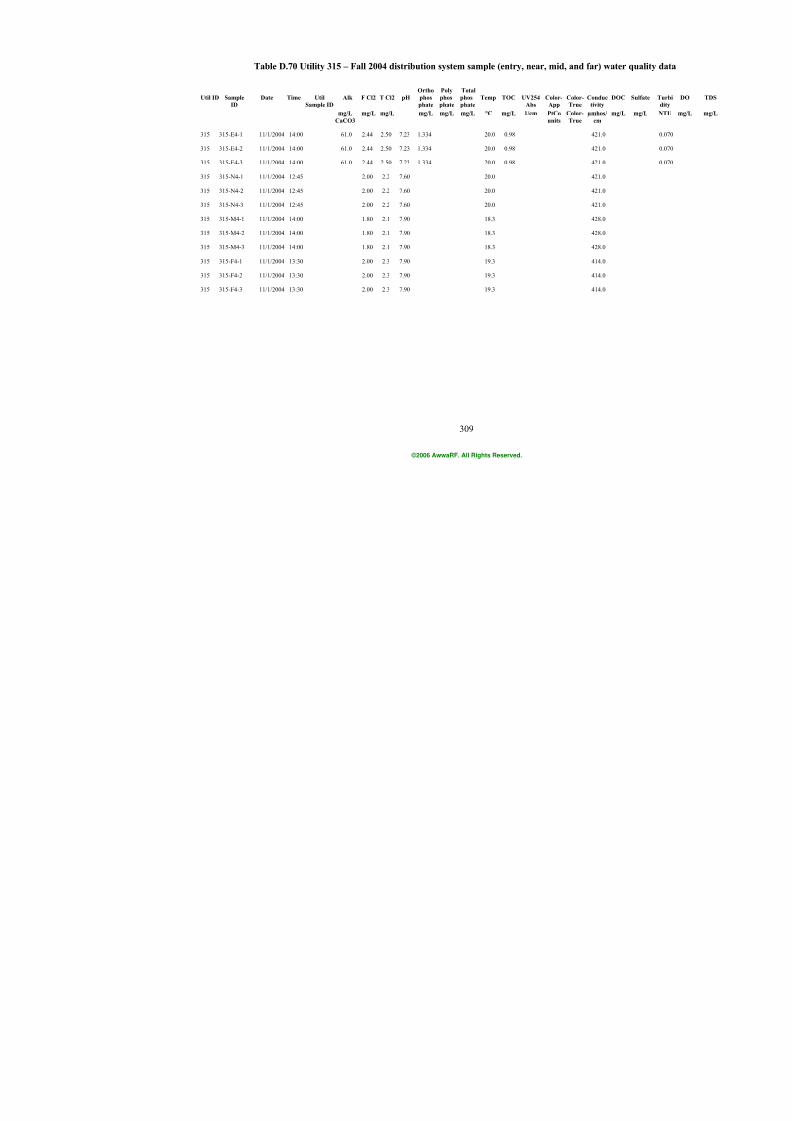
7/21/2019 Occurrence of Manganese in Drinking Water and Manganese Control
http://slidepdf.com/reader/full/occurrence-of-manganese-in-drinking-water-and-manganese-control 335/463
309
Table D.70 Utility 315 – Fall 2004 distribution system sample (entry, near, mid, and far) w
Ortho Poly Total Util ID Sample Date Time Util Alk F Cl2 T Cl2 pH phos phos phos Temp TOC UV254 Color- Color- Conduc
ID Sample ID phate phate phate Abs App True tivity mg/L mg/L mg/L mg/L mg/L mg/L °C mg/L 1/cm PtCo Color- µmhos/
CaCO3 units True cm
315 315-E4-1 11/1/2004 14:00 61.0 2.44 2.50 7.23 1.334 20.0 0.98 421.0
315 315-E4-2 11/1/2004 14:00 61.0 2.44 2.50 7.23 1.334 20.0 0.98 421.0
315 315-E4-3 11/1/2004 14:00 61.0 2.44 2.50 7.23 1.334 20.0 0.98 421.0
315 315-N4-1 11/1/2004 12:45 2.00 2.2 7.60 20.0 421.0
315 315-N4-2 11/1/2004 12:45 2.00 2.2 7.60 20.0 421.0
315 315-N4-3 11/1/2004 12:45 2.00 2.2 7.60 20.0 421.0
315 315-M4-1 11/1/2004 14:00 1.80 2.1 7.90 18.3 428.0
315
315-M4-2
11/1/2004
14:00
1.80
2.1
7.90
18.3
428.0
315 315-M4-3 11/1/2004 14:00 1.80 2.1 7.90 18.3 428.0
315 315-F4-1 11/1/2004 13:30 2.00 2.3 7.90 19.3 414.0
315 315-F4-2 11/1/2004 13:30 2.00 2.3 7.90 19.3 414.0
315 315-F4-3 11/1/2004 13:30 2.00 2.3 7.90 19.3 414.0
©2006 AwwaRF. All Rights Reserved.
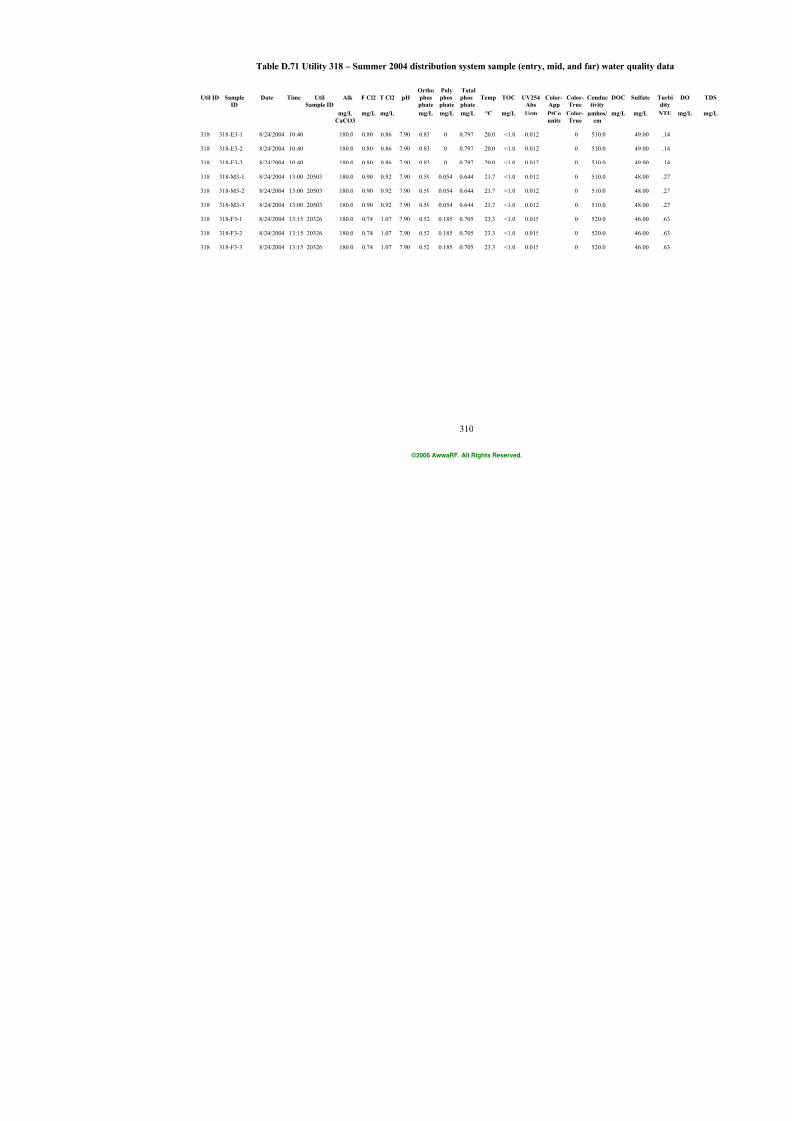
7/21/2019 Occurrence of Manganese in Drinking Water and Manganese Control
http://slidepdf.com/reader/full/occurrence-of-manganese-in-drinking-water-and-manganese-control 336/463
310
Table D.71 Utility 318 – Summer 2004 distribution system sample (entry, mid, and far) w
Ortho Poly Total Util ID Sample Date Time Util Alk F Cl2 T Cl2 pH phos phos phos Temp TOC UV254 Color- Color- Conduc
ID Sample ID phate phate phate Abs App True tivity mg/L mg/L mg/L mg/L mg/L mg/L °C mg/L 1/cm PtCo Color- µmhos/
CaCO3 units True cm
318 318-E3-1 8/24/2004 10:40 180.0 0.80 0.86 7.90 0.83 0 0.797 20.0 <1.0 0.012 0 510.0
318 318-E3-2 8/24/2004 10:40 180.0 0.80 0.86 7.90 0.83 0 0.797 20.0 <1.0 0.012 0 510.0
318 318-E3-3 8/24/2004 10:40 180.0 0.80 0.86 7.90 0.83 0 0.797 20.0 <1.0 0.012 0 510.0
318 318-M3-1 8/24/2004 13:00 20503 180.0 0.90 0.92 7.90 0.59 0.054 0.644 21.7 <1.0 0.012 0 510.0
318 318-M3-2 8/24/2004 13:00 20503 180.0 0.90 0.92 7.90 0.59 0.054 0.644 21.7 <1.0 0.012 0 510.0
318 318-M3-3 8/24/2004 13:00 20503 180.0 0.90 0.92 7.90 0.59 0.054 0.644 21.7 <1.0 0.012 0 510.0
318 318-F3-1 8/24/2004 13:15 20326 180.0 0.74 1.07 7.90 0.52 0.185 0.705 23.3 <1.0 0.015 0 520.0
318
318-F3-2
8/24/2004
13:15
20326
180.0
0.74
1.07
7.90
0.52
0.185
0.705
23.3
<1.0
0.015
0
520.0
318 318-F3-3 8/24/2004 13:15 20326 180.0 0.74 1.07 7.90 0.52 0.185 0.705 23.3 <1.0 0.015 0 520.0
©2006 AwwaRF. All Rights Reserved.
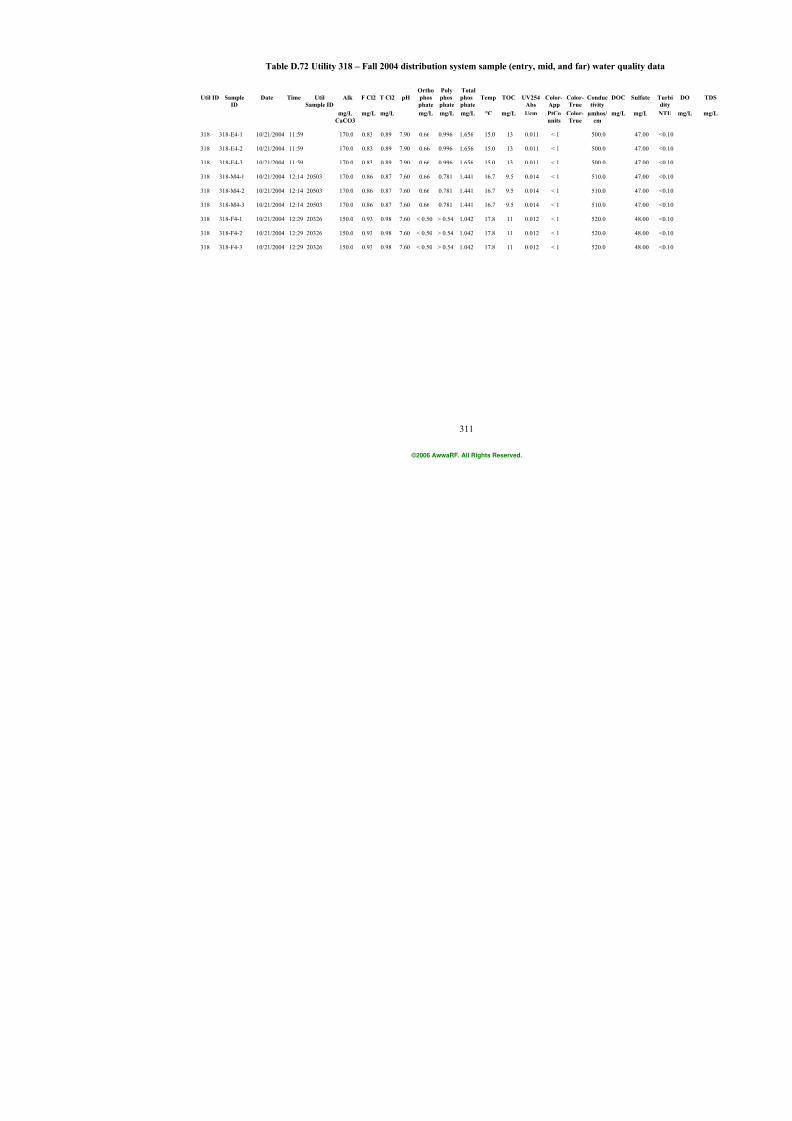
7/21/2019 Occurrence of Manganese in Drinking Water and Manganese Control
http://slidepdf.com/reader/full/occurrence-of-manganese-in-drinking-water-and-manganese-control 337/463
311
Table D.72 Utility 318 – Fall 2004 distribution system sample (entry, mid, and far) wat
Ortho Poly Total Util ID Sample Date Time Util Alk F Cl2 T Cl2 pH phos phos phos Temp TOC UV254 Color- Color- Conduc
ID Sample ID phate phate phate Abs App True tivity mg/L mg/L mg/L mg/L mg/L mg/L °C mg/L 1/cm PtCo Color- µmhos/
CaCO3 units True cm
318 318-E4-1 10/21/2004 11:59 170.0 0.83 0.89 7.90 0.66 0.996 1.656 15.0 13 0.011 < 1 500.0
318 318-E4-2 10/21/2004 11:59 170.0 0.83 0.89 7.90 0.66 0.996 1.656 15.0 13 0.011 < 1 500.0
318 318-E4-3 10/21/2004 11:59 170.0 0.83 0.89 7.90 0.66 0.996 1.656 15.0 13 0.011 < 1 500.0
318 318-M4-1 10/21/2004 12:14 20503 170.0 0.86 0.87 7.60 0.66 0.781 1.441 16.7 9.5 0.014 < 1 510.0
318 318-M4-2 10/21/2004 12:14 20503 170.0 0.86 0.87 7.60 0.66 0.781 1.441 16.7 9.5 0.014 < 1 510.0
318 318-M4-3 10/21/2004 12:14 20503 170.0 0.86 0.87 7.60 0.66 0.781 1.441 16.7 9.5 0.014 < 1 510.0
318 318-F4-1 10/21/2004 12:29 20326 150.0 0.93 0.98 7.60 < 0.50 > 0.54 1.042 17.8 11 0.012 < 1 520.0
318
318-F4-2
10/21/2004
12:29
20326
150.0
0.93
0.98
7.60
< 0.50
> 0.54
1.042
17.8
11
0.012
< 1
520.0
318 318-F4-3 10/21/2004 12:29 20326 150.0 0.93 0.98 7.60 < 0.50 > 0.54 1.042 17.8 11 0.012 < 1 520.0
©2006 AwwaRF. All Rights Reserved.
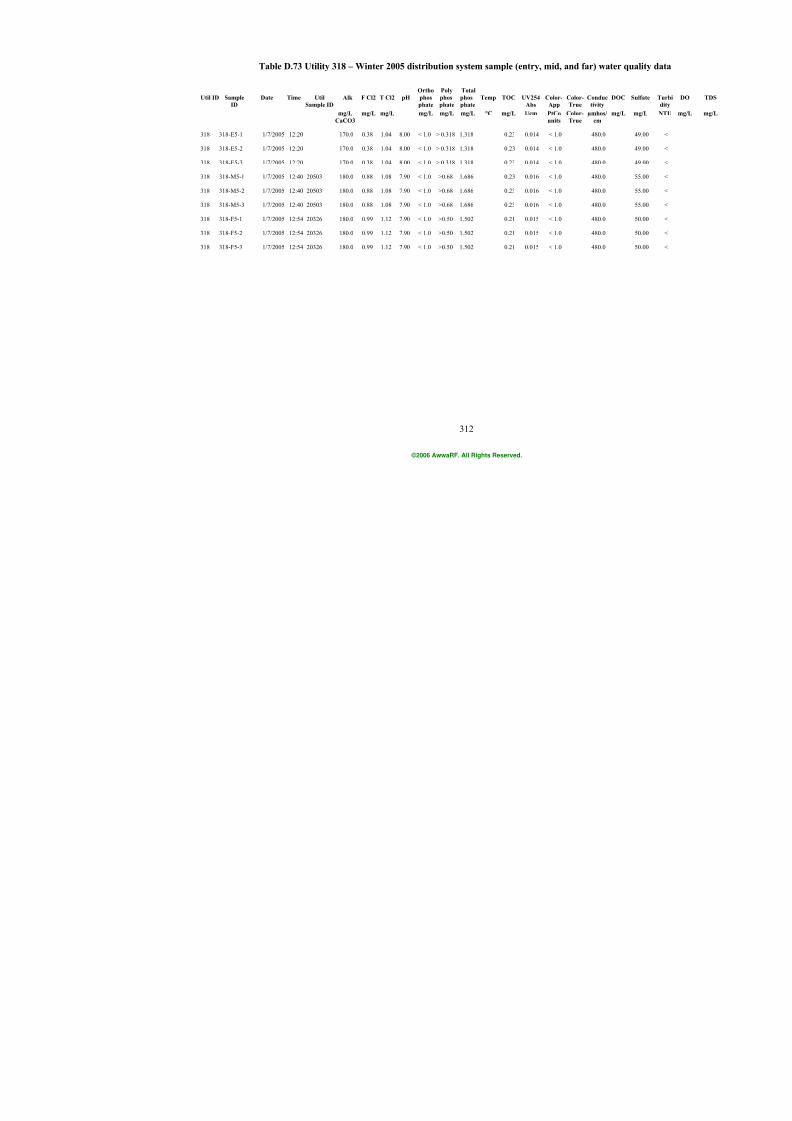
7/21/2019 Occurrence of Manganese in Drinking Water and Manganese Control
http://slidepdf.com/reader/full/occurrence-of-manganese-in-drinking-water-and-manganese-control 338/463
312
Table D.73 Utility 318 – Winter 2005 distribution system sample (entry, mid, and far) w
Ortho Poly Total Util ID Sample Date Time Util Alk F Cl2 T Cl2 pH phos phos phos Temp TOC UV254 Color- Color- Conduc
ID Sample ID phate phate phate Abs App True tivity mg/L mg/L mg/L mg/L mg/L mg/L °C mg/L 1/cm PtCo Color- µmhos/
CaCO3 units True cm
318 318-E5-1 1/7/2005 12:20 170.0 0.38 1.04 8.00 < 1.0 > 0.318 1.318 0.23 0.014 < 1.0 480.0
318 318-E5-2 1/7/2005 12:20 170.0 0.38 1.04 8.00 < 1.0 > 0.318 1.318 0.23 0.014 < 1.0 480.0
318 318-E5-3 1/7/2005 12:20 170.0 0.38 1.04 8.00 < 1.0 > 0.318 1.318 0.23 0.014 < 1.0 480.0
318 318-M5-1 1/7/2005 12:40 20503 180.0 0.88 1.08 7.90 < 1.0 >0.68 1.686 0.23 0.016 < 1.0 480.0
318 318-M5-2 1/7/2005 12:40 20503 180.0 0.88 1.08 7.90 < 1.0 >0.68 1.686 0.23 0.016 < 1.0 480.0
318 318-M5-3 1/7/2005 12:40 20503 180.0 0.88 1.08 7.90 < 1.0 >0.68 1.686 0.23 0.016 < 1.0 480.0
318 318-F5-1 1/7/2005 12:54 20326 180.0 0.99 1.12 7.90 < 1.0 >0.50 1.502 0.21 0.015 < 1.0 480.0
318
318-F5-2
1/7/2005
12:54
20326
180.0
0.99
1.12
7.90
< 1.0
>0.50
1.502
0.21
0.015
< 1.0
480.0
318 318-F5-3 1/7/2005 12:54 20326 180.0 0.99 1.12 7.90 < 1.0 >0.50 1.502 0.21 0.015 < 1.0 480.0
©2006 AwwaRF. All Rights Reserved.
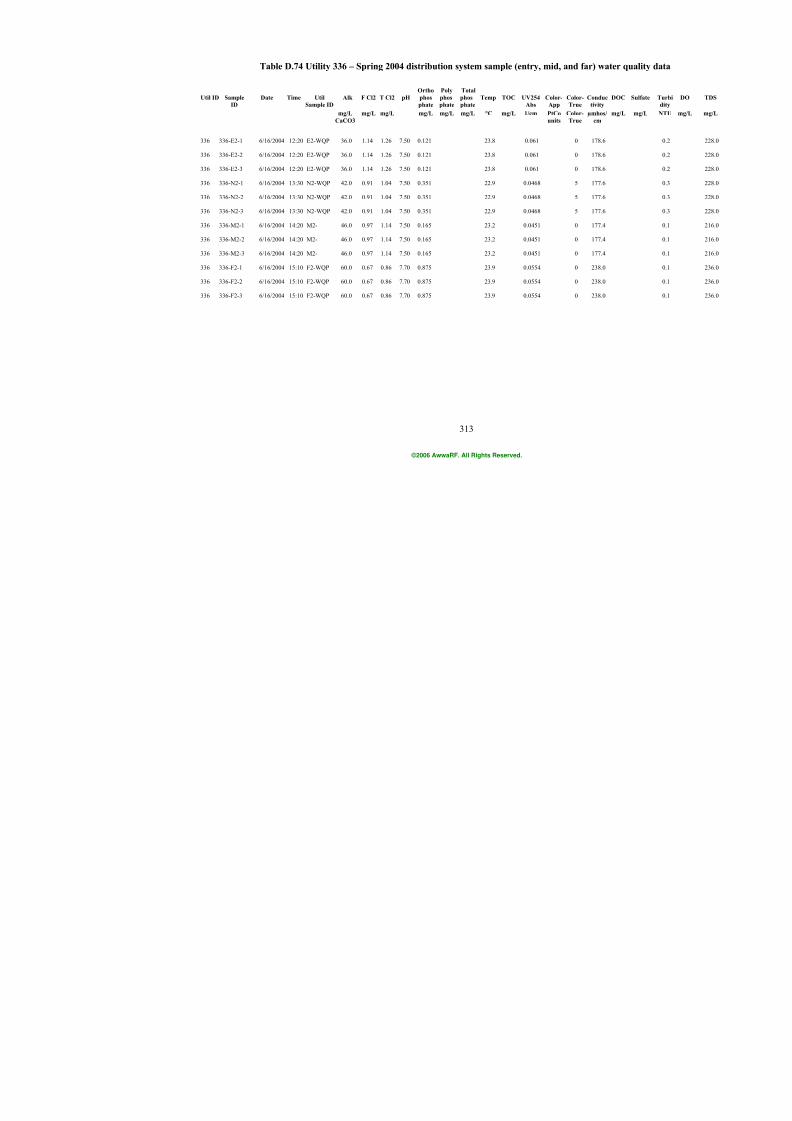
7/21/2019 Occurrence of Manganese in Drinking Water and Manganese Control
http://slidepdf.com/reader/full/occurrence-of-manganese-in-drinking-water-and-manganese-control 339/463
313
Table D.74 Utility 336 – Spring 2004 distribution system sample (entry, mid, and far) w
Ortho Poly Total Util ID Sample Date Time Util Alk F Cl2 T Cl2 pH phos phos phos Temp TOC UV254 Color- Color- Conduc
ID Sample ID phate phate phate Abs App True tivity mg/L mg/L mg/L mg/L mg/L mg/L °C mg/L 1/cm PtCo Color- µmhos/
CaCO3 units True cm
336 336-E2-1 6/16/2004 12:20 E2-WQP 36.0 1.14 1.26 7.50 0.121 23.8 0.061 0 178.6
336 336-E2-2 6/16/2004 12:20 E2-WQP 36.0 1.14 1.26 7.50 0.121 23.8 0.061 0 178.6
336 336-E2-3 6/16/2004 12:20 E2-WQP 36.0 1.14 1.26 7.50 0.121 23.8 0.061 0 178.6
336 336-N2-1 6/16/2004 13:30 N2-WQP 42.0 0.91 1.04 7.50 0.351 22.9 0.0468 5 177.6
336 336-N2-2 6/16/2004 13:30 N2-WQP 42.0 0.91 1.04 7.50 0.351 22.9 0.0468 5 177.6
336 336-N2-3 6/16/2004 13:30 N2-WQP 42.0 0.91 1.04 7.50 0.351 22.9 0.0468 5 177.6
336 336-M2-1 6/16/2004 14:20 M2- 46.0 0.97 1.14 7.50 0.165 23.2 0.0451 0 177.4
336 336-M2-2 6/16/2004 14:20 M2- 46.0 0.97 1.14 7.50 0.165 23.2 0.0451 0 177.4
336 336-M2-3 6/16/2004 14:20 M2- 46.0 0.97 1.14 7.50 0.165 23.2 0.0451 0 177.4
336 336-F2-1 6/16/2004 15:10 F2-WQP 60.0 0.67 0.86 7.70 0.875 23.9 0.0554 0 238.0
336 336-F2-2 6/16/2004 15:10 F2-WQP 60.0 0.67 0.86 7.70 0.875 23.9 0.0554 0 238.0
336 336-F2-3 6/16/2004 15:10 F2-WQP 60.0 0.67 0.86 7.70 0.875 23.9 0.0554 0 238.0
©2006 AwwaRF. All Rights Reserved.
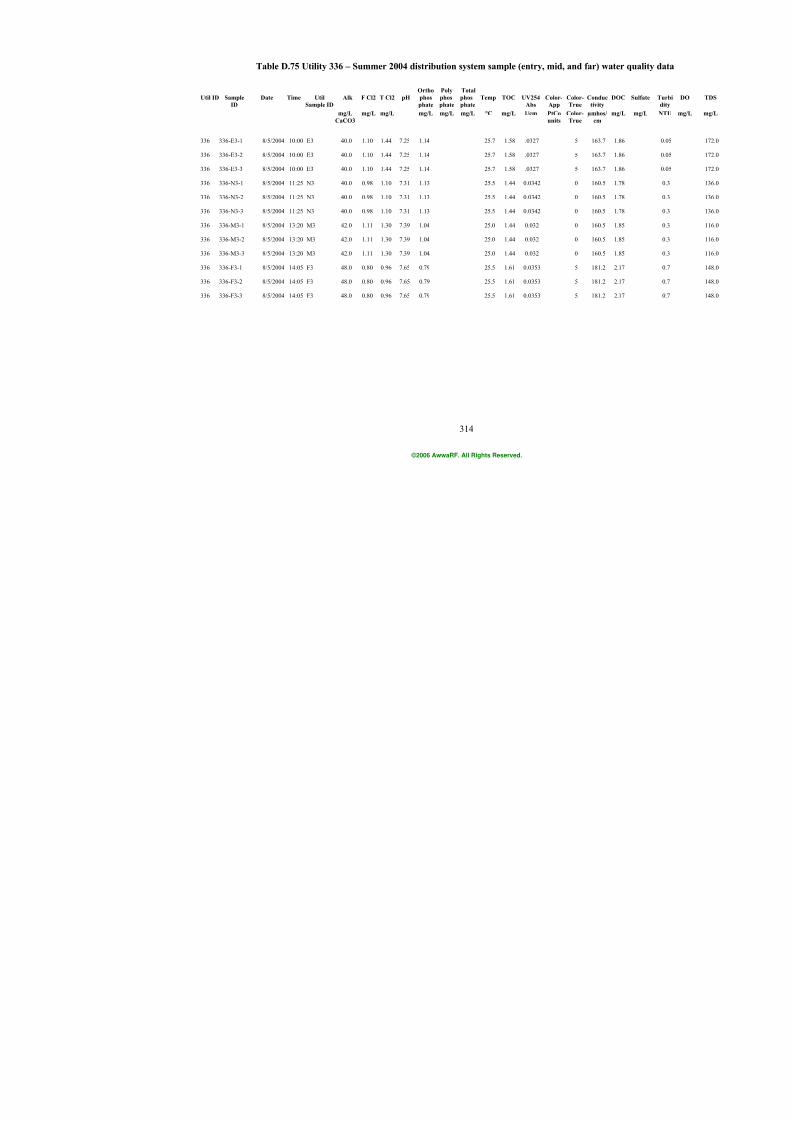
7/21/2019 Occurrence of Manganese in Drinking Water and Manganese Control
http://slidepdf.com/reader/full/occurrence-of-manganese-in-drinking-water-and-manganese-control 340/463
314
Table D.75 Utility 336 – Summer 2004 distribution system sample (entry, mid, and far) w
Ortho Poly Total
Util ID Sample Date Time Util Alk F Cl2 T Cl2 pH phos phos phos Temp TOC UV254 Color- Color- Conduc
ID Sample ID phate phate phate Abs App True tivity mg/L mg/L mg/L mg/L mg/L mg/L °C mg/L 1/cm PtCo Color- µmhos/
CaCO3 units True cm
336 336-E3-1 8/5/2004 10:00 E3 40.0 1.10 1.44 7.25 1.14 25.7 1.58 .0327 5 163.7
336 336-E3-2 8/5/2004 10:00 E3 40.0 1.10 1.44 7.25 1.14 25.7 1.58 .0327 5 163.7
336 336-E3-3 8/5/2004 10:00 E3 40.0 1.10 1.44 7.25 1.14 25.7 1.58 .0327 5 163.7
336 336-N3-1 8/5/2004 11:25 N3 40.0 0.98 1.10 7.31 1.13 25.5 1.44 0.0342 0 160.5
336 336-N3-2 8/5/2004 11:25 N3 40.0 0.98 1.10 7.31 1.13 25.5 1.44 0.0342 0 160.5
336 336-N3-3 8/5/2004 11:25 N3 40.0 0.98 1.10 7.31 1.13 25.5 1.44 0.0342 0 160.5
336 336-M3-1 8/5/2004 13:20 M3 42.0 1.11 1.30 7.39 1.04 25.0 1.44 0.032 0 160.5
336 336-M3-2 8/5/2004 13:20 M3 42.0 1.11 1.30 7.39 1.04 25.0 1.44 0.032 0 160.5
336 336-M3-3 8/5/2004 13:20 M3 42.0 1.11 1.30 7.39 1.04 25.0 1.44 0.032 0 160.5
336 336-F3-1 8/5/2004 14:05 F3 48.0 0.80 0.96 7.65 0.79 25.5 1.61 0.0353 5 181.2
336 336-F3-2 8/5/2004 14:05 F3 48.0 0.80 0.96 7.65 0.79 25.5 1.61 0.0353 5 181.2
336 336-F3-3 8/5/2004 14:05 F3 48.0 0.80 0.96 7.65 0.79 25.5 1.61 0.0353 5 181.2
©2006 AwwaRF. All Rights Reserved.
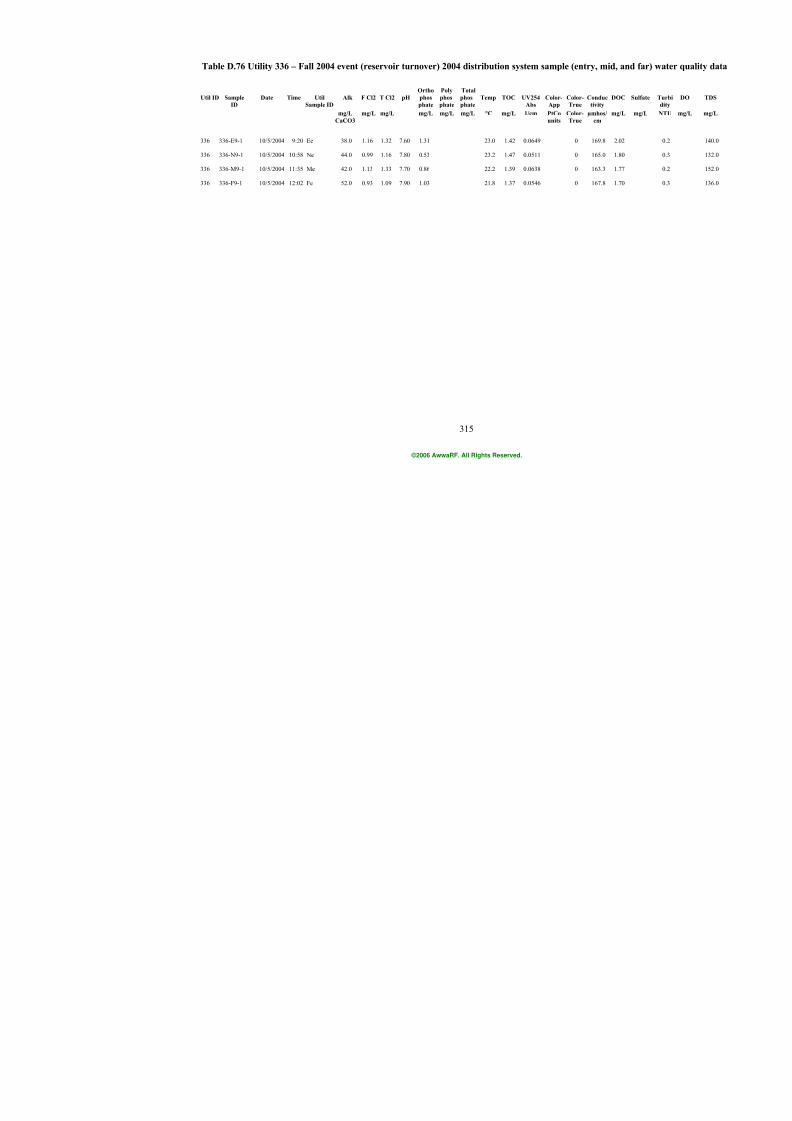
7/21/2019 Occurrence of Manganese in Drinking Water and Manganese Control
http://slidepdf.com/reader/full/occurrence-of-manganese-in-drinking-water-and-manganese-control 341/463
315
Table D.76 Utility 336 – Fall 2004 event (reservoir turnover) 2004 distribution system sample (entry, m
Ortho Poly Total
Util ID Sample Date Time Util Alk F Cl2 T Cl2 pH phos phos phos Temp TOC UV254 Color- Color- Conduc
ID Sample ID phate phate phate Abs App True tivity mg/L mg/L mg/L mg/L mg/L mg/L °C mg/L 1/cm PtCo Color- µmhos/
CaCO3 units True cm
336 336-E9-1 10/5/2004 9:20 Ee 38.0 1.16 1.32 7.60 1.31 23.0 1.42 0.0649 0 169.8
336 336-N9-1 10/5/2004 10:58 Ne 44.0 0.99 1.16 7.80 0.53 23.2 1.47 0.0511 0 165.0
336 336-M9-1 10/5/2004 11:35 Me 42.0 1.13 1.33 7.70 0.86 22.2 1.39 0.0638 0 163.3
336 336-F9-1 10/5/2004 12:02 Fe 52.0 0.93 1.09 7.90 1.03 21.8 1.37 0.0546 0 167.8
©2006 AwwaRF. All Rights Reserved.

7/21/2019 Occurrence of Manganese in Drinking Water and Manganese Control
http://slidepdf.com/reader/full/occurrence-of-manganese-in-drinking-water-and-manganese-control 342/463
316
Table D.77 Utility 336 – Fall 2004 distribution system sample (entry, mid, and far) wat
Ortho Poly Total
Util ID Sample Date Time Util Alk F Cl2 T Cl2 pH phos phos phos Temp TOC UV254 Color- Color- Conduc
ID Sample ID phate phate phate Abs App True tivity
mg/L mg/L mg/L mg/L mg/L mg/L °C mg/L 1/cm PtCo Color- µmhos/CaCO3 units True cm
336 336-E4-1 11/23/2004 9:35 E4 48.0 1.50 1.65 7.57 0.135 15.5 1.61 0.058 0 163.7
336 336-E4-2 11/23/2004 9:35 E4 48.0 1.50 1.65 7.57 0.135 15.5 1.61 0.058 0 163.7
336 336-E4-3 11/23/2004 9:35 E4 48.0 1.50 1.65 7.57 0.135 15.5 1.61 0.058 0 163.7
336 336-N4-1 11/23/2004 10:53 N4 52.0 0.83 1.06 7.82 0.046 15.5 1.65 0.0511 0 159.6
336 336-N4-2 11/23/2004 10:53 N4 52.0 0.83 1.06 7.82 0.046 15.5 1.65 0.0511 0 159.6
336 336-N4-3 11/23/2004 10:53 N4 52.0 0.83 1.06 7.82 0.046 15.5 1.65 0.0511 0 159.6
336 336-M4-1 11/23/2004 11:40 M4 48.0 1.11 1.83 7.73 0.028 13.8 1.65 0.0516 0 157.2
336 336-M4-2 11/23/2004 11:40 M4 48.0 1.11 1.83 7.73 0.028 13.8 1.65 0.0516 0 157.2 336 336-M4-3 11/23/2004 11:40 M4 48.0 1.11 1.83 7.73 0.028 13.8 1.65 0.0516 0 157.2
336 336-F4-1 11/23/2004 12:20 F4 70.0 1.21 1.43 7.93 0.136 16.2 1.66 0.0489 0 208.0
336 336-F4-2 11/23/2004 12:20 F4 70.0 1.21 1.43 7.93 0.136 16.2 1.66 0.0489 0 208.0
336 336-F4-3 11/23/2004 12:20 F4 70.0 1.21 1.43 7.93 0.136 16.2 1.66 0.0489 0 208.0
©2006 AwwaRF. All Rights Reserved.
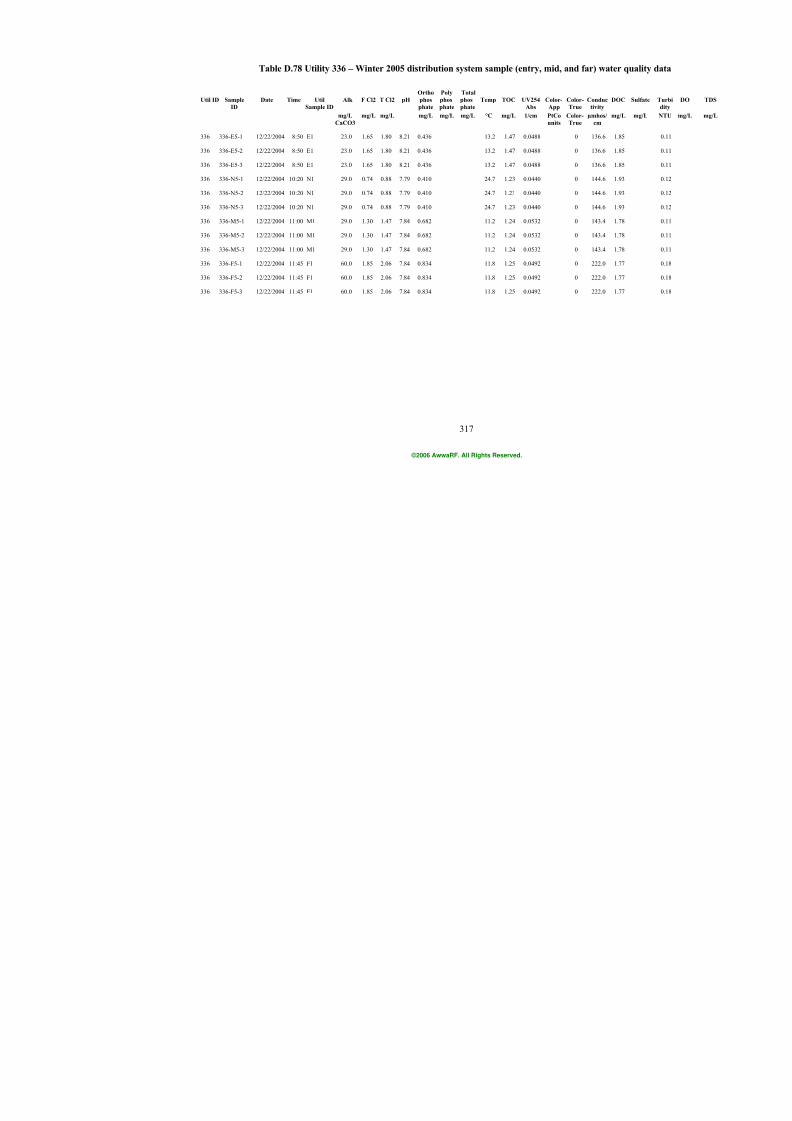
7/21/2019 Occurrence of Manganese in Drinking Water and Manganese Control
http://slidepdf.com/reader/full/occurrence-of-manganese-in-drinking-water-and-manganese-control 343/463
317
Table D.78 Utility 336 – Winter 2005 distribution system sample (entry, mid, and far) w
Ortho Poly Total
Util ID Sample Date Time Util Alk F Cl2 T Cl2 pH phos phos phos Temp TOC UV254 Color- Color- Conduc
ID Sample ID phate phate phate Abs App True tivity
mg/L mg/L mg/L mg/L mg/L mg/L °C mg/L 1/cm PtCo Color- µmhos/CaCO3 units True cm
336 336-E5-1 12/22/2004 8:50 E1 23.0 1.65 1.80 8.21 0.436 13.2 1.47 0.0488 0 136.6
336 336-E5-2 12/22/2004 8:50 E1 23.0 1.65 1.80 8.21 0.436 13.2 1.47 0.0488 0 136.6
336 336-E5-3 12/22/2004 8:50 E1 23.0 1.65 1.80 8.21 0.436 13.2 1.47 0.0488 0 136.6
336 336-N5-1 12/22/2004 10:20 N1 29.0 0.74 0.88 7.79 0.410 24.7 1.23 0.0440 0 144.6
336 336-N5-2 12/22/2004 10:20 N1 29.0 0.74 0.88 7.79 0.410 24.7 1.23 0.0440 0 144.6
336 336-N5-3 12/22/2004 10:20 N1 29.0 0.74 0.88 7.79 0.410 24.7 1.23 0.0440 0 144.6
336 336-M5-1 12/22/2004 11:00 M1 29.0 1.30 1.47 7.84 0.682 11.2 1.24 0.0532 0 143.4
336 336-M5-2 12/22/2004 11:00 M1 29.0 1.30 1.47 7.84 0.682 11.2 1.24 0.0532 0 143.4 336 336-M5-3 12/22/2004 11:00 M1 29.0 1.30 1.47 7.84 0.682 11.2 1.24 0.0532 0 143.4
336 336-F5-1 12/22/2004 11:45 F1 60.0 1.85 2.06 7.84 0.834 11.8 1.25 0.0492 0 222.0
336 336-F5-2 12/22/2004 11:45 F1 60.0 1.85 2.06 7.84 0.834 11.8 1.25 0.0492 0 222.0
336 336-F5-3 12/22/2004 11:45 F1 60.0 1.85 2.06 7.84 0.834 11.8 1.25 0.0492 0 222.0
©2006 AwwaRF. All Rights Reserved.
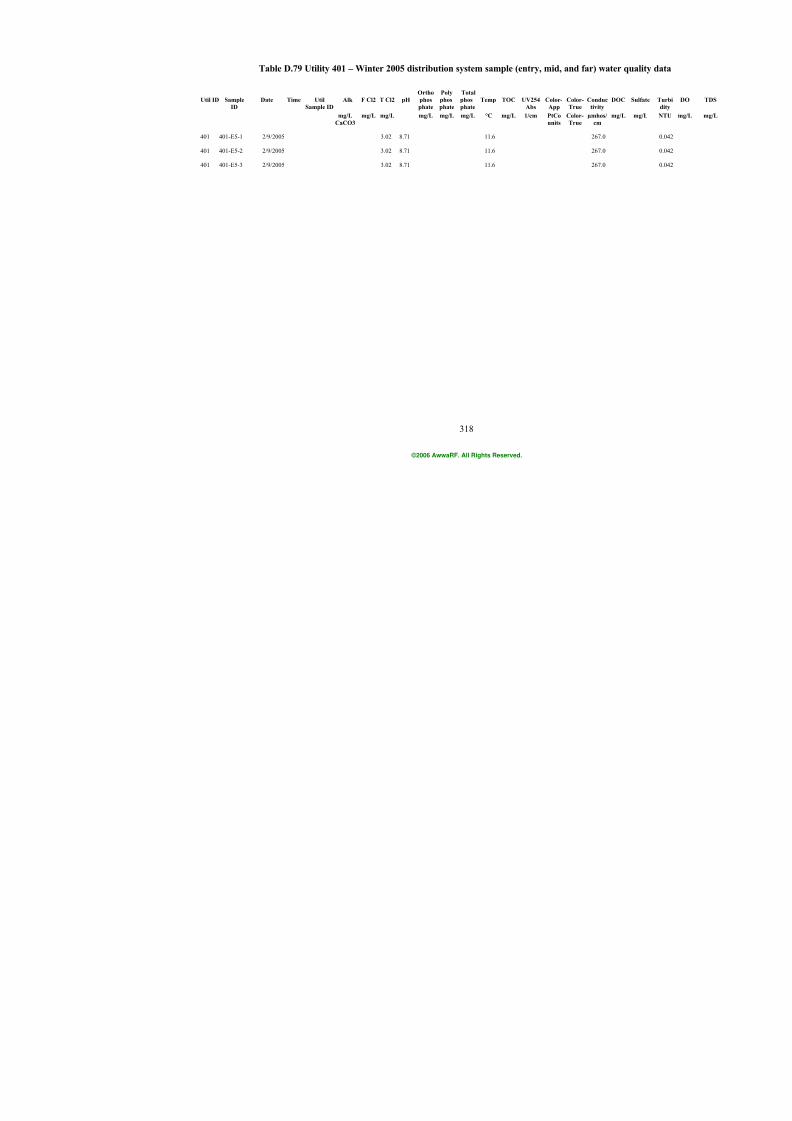
7/21/2019 Occurrence of Manganese in Drinking Water and Manganese Control
http://slidepdf.com/reader/full/occurrence-of-manganese-in-drinking-water-and-manganese-control 344/463
318
Table D.79 Utility 401 – Winter 2005 distribution system sample (entry, mid, and far) w
Ortho Poly Total
Util ID Sample Date Time Util Alk F Cl2 T Cl2 pH phos phos phos Temp TOC UV254 Color- Color- Conduc
ID Sample ID phate phate phate Abs App True tivity
mg/L mg/L mg/L mg/L mg/L mg/L °C mg/L 1/cm PtCo Color- µmhos/CaCO3 units True cm
401 401-E5-1 2/9/2005 3.02 8.71 11.6 267.0
401 401-E5-2 2/9/2005 3.02 8.71 11.6 267.0
401 401-E5-3 2/9/2005 3.02 8.71 11.6 267.0
©2006 AwwaRF. All Rights Reserved.
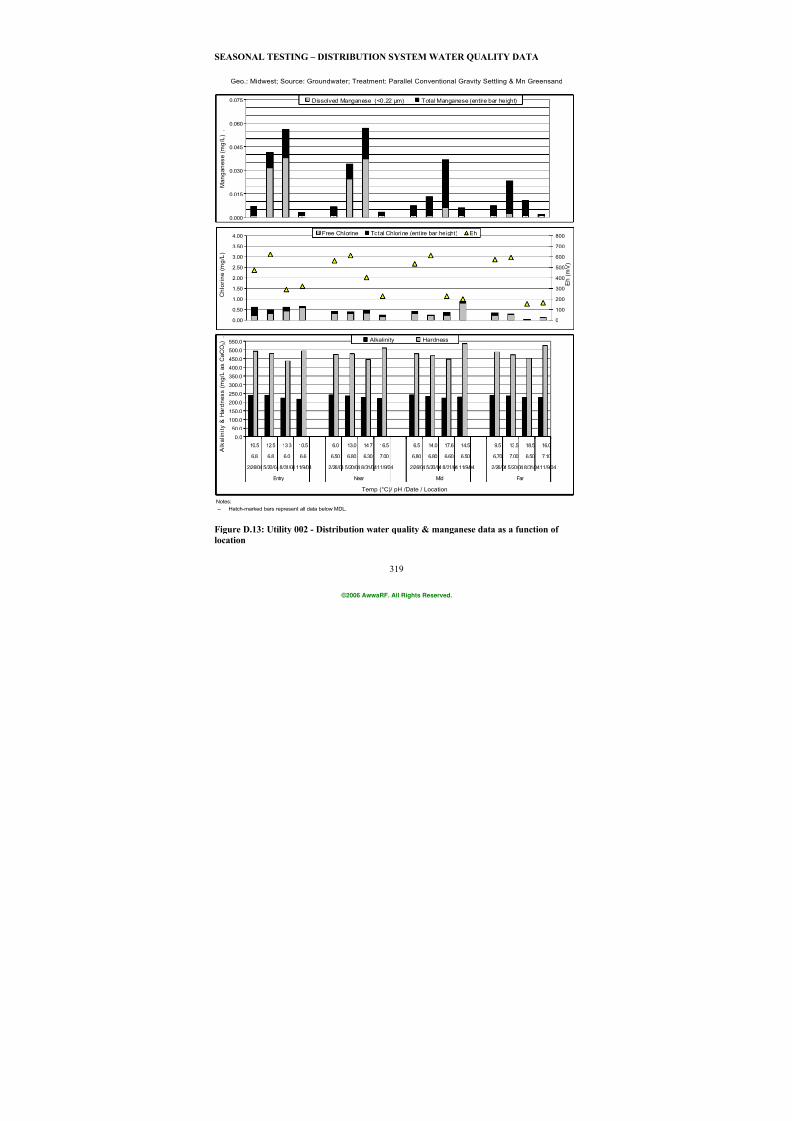
7/21/2019 Occurrence of Manganese in Drinking Water and Manganese Control
http://slidepdf.com/reader/full/occurrence-of-manganese-in-drinking-water-and-manganese-control 345/463
319
Geo.: Midwest; Source: Groundwater; Treatment: Parallel Conventional Gravity Settling & Mn Greensand
Notes:
-- Hatch-marked bars represent all data below MDL.
0.000
0.015
0.030
0.045
0.060
0.075
M a n g a n e s e ( m g / L ) .
Dissolved Manganese (<0.22 µm) Total Manganese (entire bar height)
0.0
50.0
100.0
150.0
200.0
250.0
300.0
350.0
400.0
450.0
500.0
550.0
10.5 12.5 13.3 10.5 6.0 13.0 14.7 16.5 6.5 14.0 17.6 14.5 9.5 13.5 18.5 16.0
6.8 6.8 6.0 6.6 6.50 6.80 6.30 7.00 6.80 6.80 6.60 6.50 6.70 7.00 6.50 7.10
2/26/04 5/20/048/31/04 11/9/04 2/26/04 5/20/04 8/31/0411/9/04 2/26/04 5/20/048/31/04 11/9/04 2/26/04 5/20/048/31/0411/9/04
Entry Near Mid Far
Temp (°C)/ pH /Date / Location
A l k a l i n i t y &
H a r d n e s s ( m g / L a s C a
C O 3 ) .
Alkalinity Hardness
0.00
0.50
1.00
1.50
2.00
2.50
3.00
3.50
4.00
C h l o r i n e ( m g / L )
0
100
200
300
400
500
600
700
800
E h ( m V )
Free Chlorine Total Chlorine (entire bar height) Eh
SEASONAL TESTING – DISTRIBUTION SYSTEM WATER QUALITY DATA
Figure D.13: Utility 002 - Distribution water quality & manganese data as a function of
location
©2006 AwwaRF. All Rights Reserved.
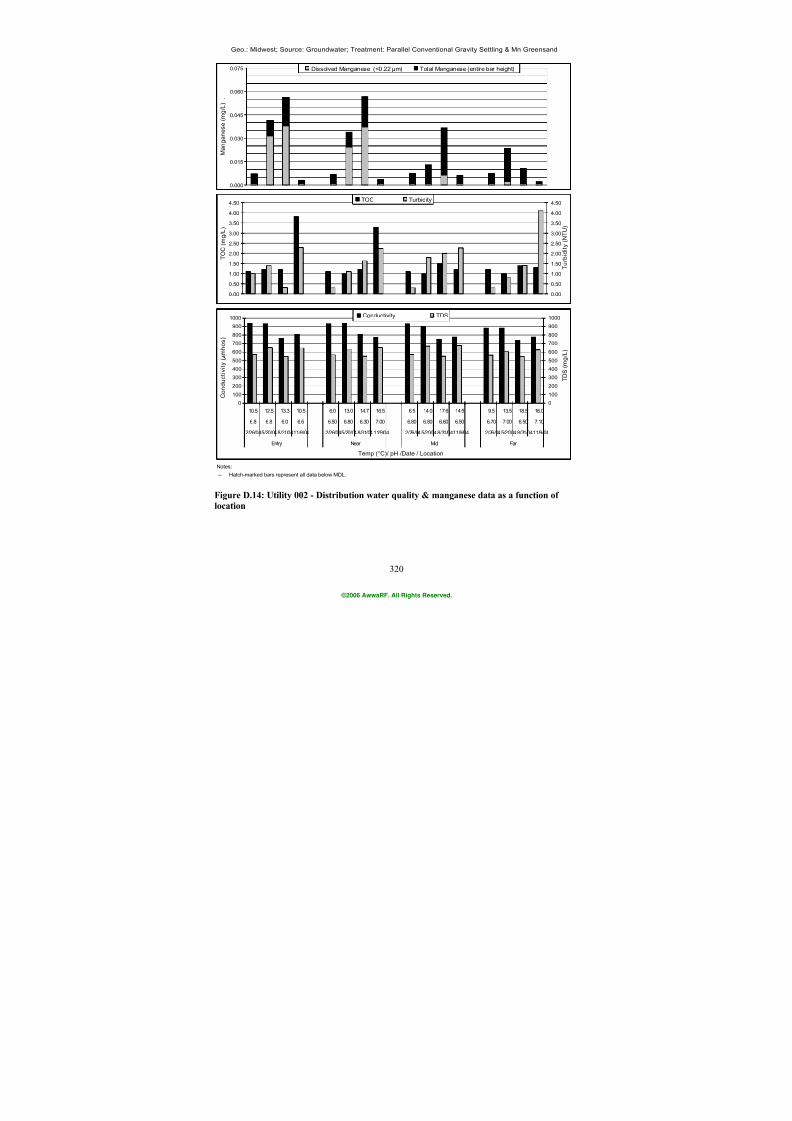
7/21/2019 Occurrence of Manganese in Drinking Water and Manganese Control
http://slidepdf.com/reader/full/occurrence-of-manganese-in-drinking-water-and-manganese-control 346/463
320
Figure D.14: Utility 002 - Distribution water quality & manganese data as a function of
location
Geo.: Midwest; Source: Groundwater; Treatment: Parallel Conventional Gravity Settling & Mn Greensand
Notes:
-- Hatch-marked bars represent all data below MDL.
0.00
0.50
1.00
1.50
2.00
2.50
3.00
3.50
4.00
4.50
T O C
( m g
/ L )
0.00
0.50
1.00
1.50
2.00
2.50
3.00
3.50
4.00
4.50
T u r b i d i t y ( N
T U )
TOC Turbidity
0
100
200
300
400
500
600
700
800
900
1000
10.5 12.5 13.3 10.5 6.0 13.0 14.7 16.5 6.5 14.0 17.6 14.5 9.5 13.5 18.5 16.0
6.8 6.8 6.0 6.6 6.50 6.80 6.30 7.00 6.80 6.80 6.60 6.50 6.70 7.00 6.50 7.10
2/26/045/20/048/31/0411/9/04 2/26/045/20/048/31/0411/9/04 2/26/045/20/048/31/0411/9/04 2/26/045/20/048/31/0411/9/04
Entry Near Mid Far
Temp (°C)/ pH /Date / Location
C o n d u c t i v i t y ( m h o s )
0
100
200
300
400
500
600
700
800
900
1000
T D S ( m g / L )
Conductivity TDS
0.000
0.015
0.030
0.045
0.060
0.075
M a n g a n e s e ( m
g / L ) .
Dissolved Manganese (<0.22 µm) Total Manganese (entire bar height)
©2006 AwwaRF. All Rights Reserved.
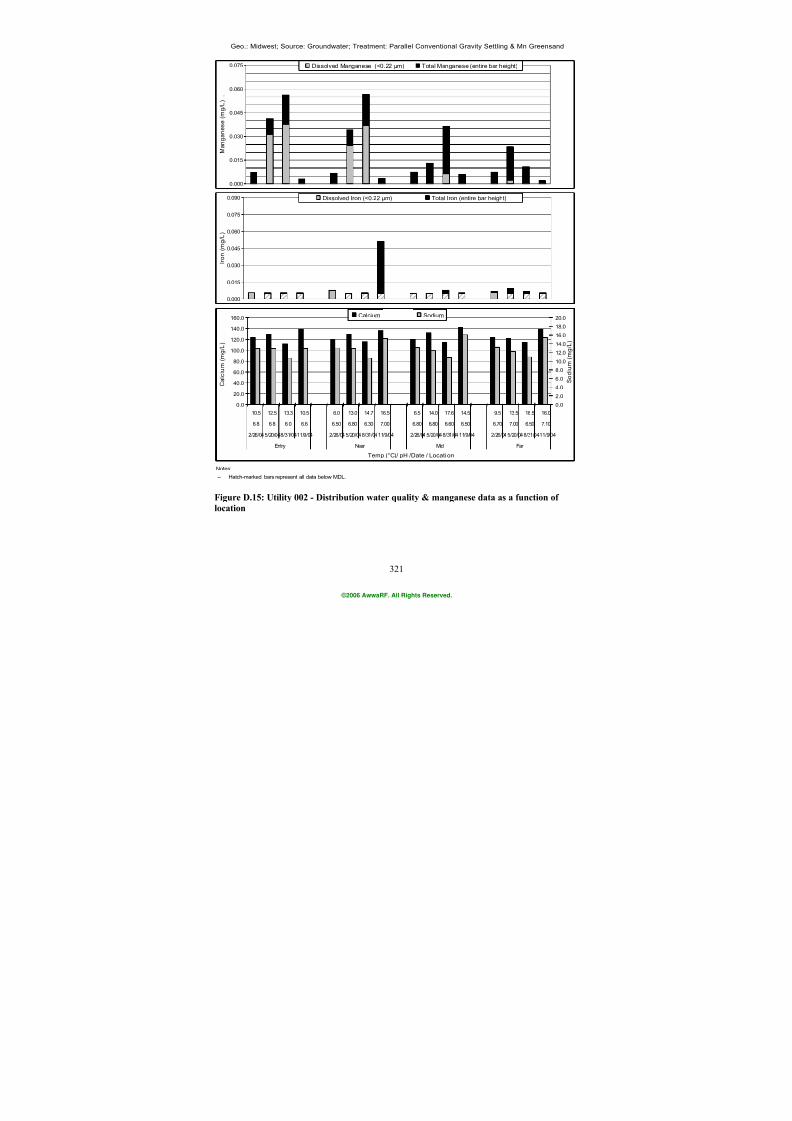
7/21/2019 Occurrence of Manganese in Drinking Water and Manganese Control
http://slidepdf.com/reader/full/occurrence-of-manganese-in-drinking-water-and-manganese-control 347/463
321
Geo.: Midwest; Source: Groundwater; Treatment: Parallel Conventional Gravity Settling & Mn Greensand
Notes:
-- Hatch-marked bars represent all data below MDL.
0.0
20.0
40.0
60.0
80.0
100.0
120.0
140.0
160.0
10.5 12.5 13.3 10.5 6.0 13.0 14.7 16.5 6.5 14.0 17.6 14.5 9.5 13.5 18.5 16.0
6.8 6.8 6.0 6.6 6.50 6.80 6.30 7.00 6.80 6.80 6.60 6.50 6.70 7.00 6.50 7.10
2/26/045/20/048/31/0411/9/04 2/26/045/20/048/31/0411/9/04 2/26/045/20/048/31/0411/9/04 2/26/045/20/048/31/0411/9/04
Entry Near Mid Far
Temp (°C)/ pH /Date / Locati on
C a l c i u m ( m
g / L )
0.0
2.0
4.0
6.0
8.0
10.0
12.0
14.0
16.0
18.0
20.0
S o d i u m ( m
g / L )
Calcium Sodium
0.000
0.015
0.030
0.045
0.060
0.075
0.090
I r o n ( m g / L
)
Dissolved Iron (<0.22 µm) Total Iron (entire bar height)
0.000
0.015
0.030
0.045
0.060
0.075
M a n g a n e s e ( m g / L ) .
Dissolved Manganese (<0.22 µm) Total Manganese (entire bar height)
Figure D.15: Utility 002 - Distribution water quality & manganese data as a function of
location
©2006 AwwaRF. All Rights Reserved.
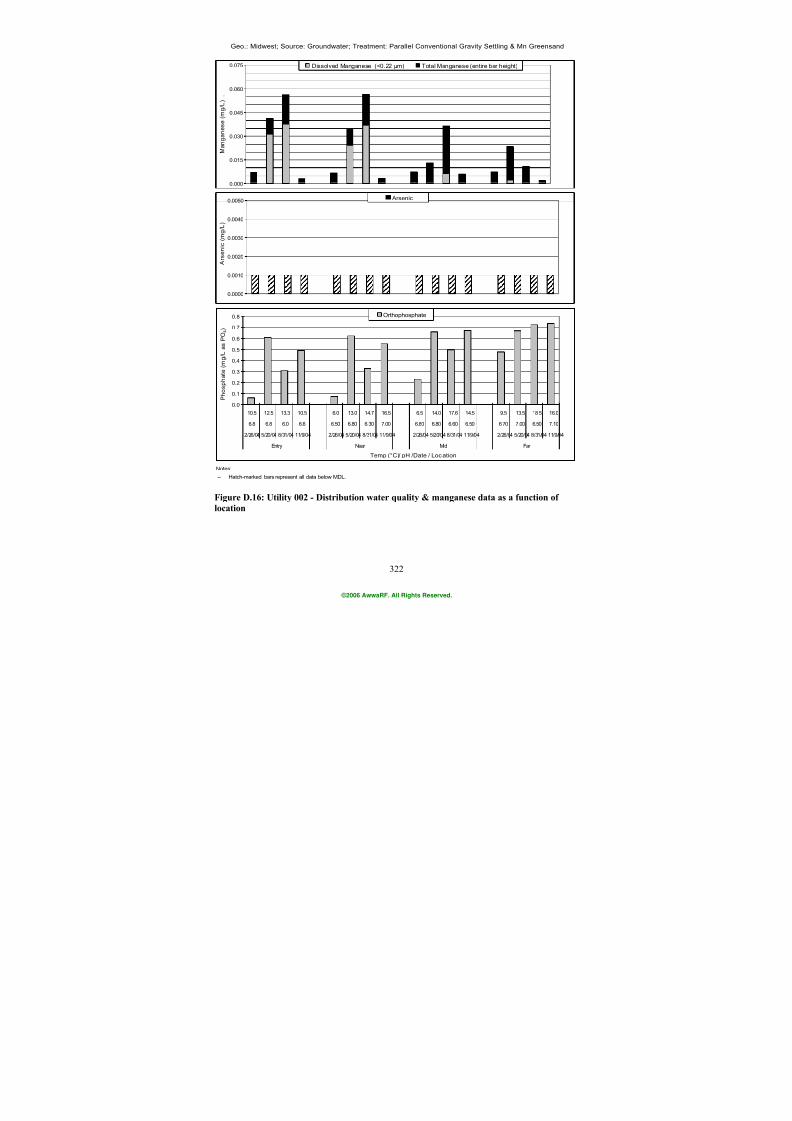
7/21/2019 Occurrence of Manganese in Drinking Water and Manganese Control
http://slidepdf.com/reader/full/occurrence-of-manganese-in-drinking-water-and-manganese-control 348/463
322
Geo.: Midwest; Source: Groundwater; Treatment: Parallel Conventional Gravity Settling & Mn Greensand
Notes:
-- Hatch-marked bars represent all data below MDL.
0.0
0.1
0.2
0.3
0.4
0.5
0.6
0.7
0.8
10.5 12.5 13.3 10.5 6.0 13.0 14.7 16.5 6.5 14.0 17.6 14.5 9.5 13.5 18.5 16.0
6.8 6.8 6.0 6.6 6.50 6.80 6.30 7.00 6.80 6.80 6.60 6.50 6.70 7.00 6.50 7.10
2/26/04 5/20/04 8/31/04 11/9/04 2/26/04 5/20/04 8/31/04 11/9/04 2/26/04 5/20/04 8/31/04 11/9/04 2/26/04 5/20/04 8/31/04 11/9/04
Entry Near Mid Far
Temp (°C)/ pH /Date / Location
P h o s p h a t e ( m g /
L a s P O 4 )
Orthophosphate
0.0000
0.0010
0.0020
0.0030
0.0040
0.0050
A r s e n i c ( m
g / L )
Arsenic
0.000
0.015
0.030
0.045
0.060
0.075
M a n g a n e s e ( m g / L ) .
Dissolved Manganese (<0.22 µm) Total Manganese (entire bar height)
Figure D.16: Utility 002 - Distribution water quality & manganese data as a function of
location
©2006 AwwaRF. All Rights Reserved.
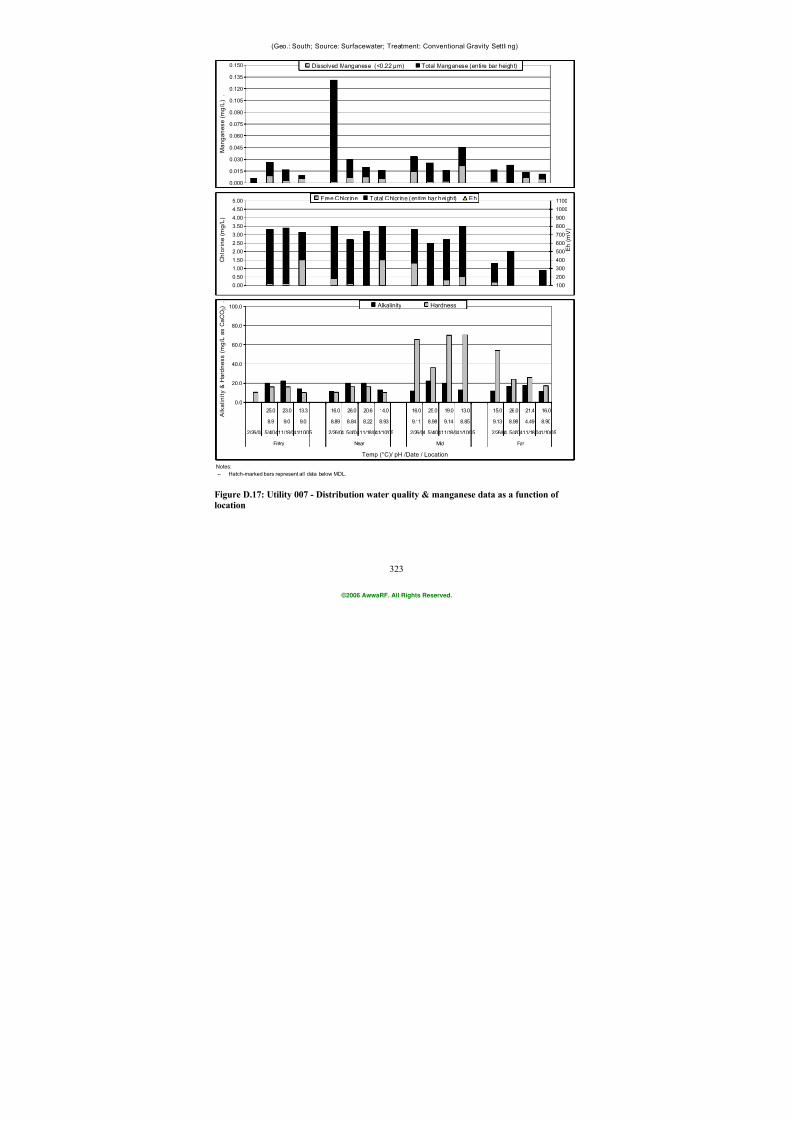
7/21/2019 Occurrence of Manganese in Drinking Water and Manganese Control
http://slidepdf.com/reader/full/occurrence-of-manganese-in-drinking-water-and-manganese-control 349/463
323
(Geo.: South; Source: Surfacewater; Treatment: Conventional Gravity Settli ng)
Notes:
-- Hatch-marked bars represent all data below MDL.
0.000
0.015
0.030
0.045
0.060
0.075
0.090
0.105
0.120
0.135
0.150
M a n g a n e s e ( m g / L ) .
Dissolved Manganese (<0.22 µm) Total Manganese (entire bar height)
0.0
20.0
40.0
60.0
80.0
100.0
25.0 23.0 13.3 16.0 26.0 20.6 14.0 16.0 25.0 19.0 13.0 15.0 26.0 21.4 16.0
8.9 9.0 9.0 8.89 8.84 8.22 8.93 9.11 8.98 9.14 8.85 9.13 8.98 4.49 8.90
2/26/04 5/4/0411/18/041/10/05 2/26/04 5/4/0411/18/041/10/05 2/26/04 5/4/0411/18/041/10/05 2/26/04 5/4/0411/18/041/10/05
Entry Near Mid Far
Temp (°C)/ pH /Date / Location
A l k a l i n i t y &
H a r d n e s s
( m g / L a s C a C O 3 ) .
Alkalinity Hardness
0.00
0.50
1.00
1.50
2.00
2.503.00
3.50
4.00
4.50
5.00
C h l o r i n e
( m g / L )
100
200
300
400
500
600700
800
900
1000
1100
E h ( m
V )
Free Chlorine Total Chlorine (entire bar height) Eh
Figure D.17: Utility 007 - Distribution water quality & manganese data as a function of
location
©2006 AwwaRF. All Rights Reserved.
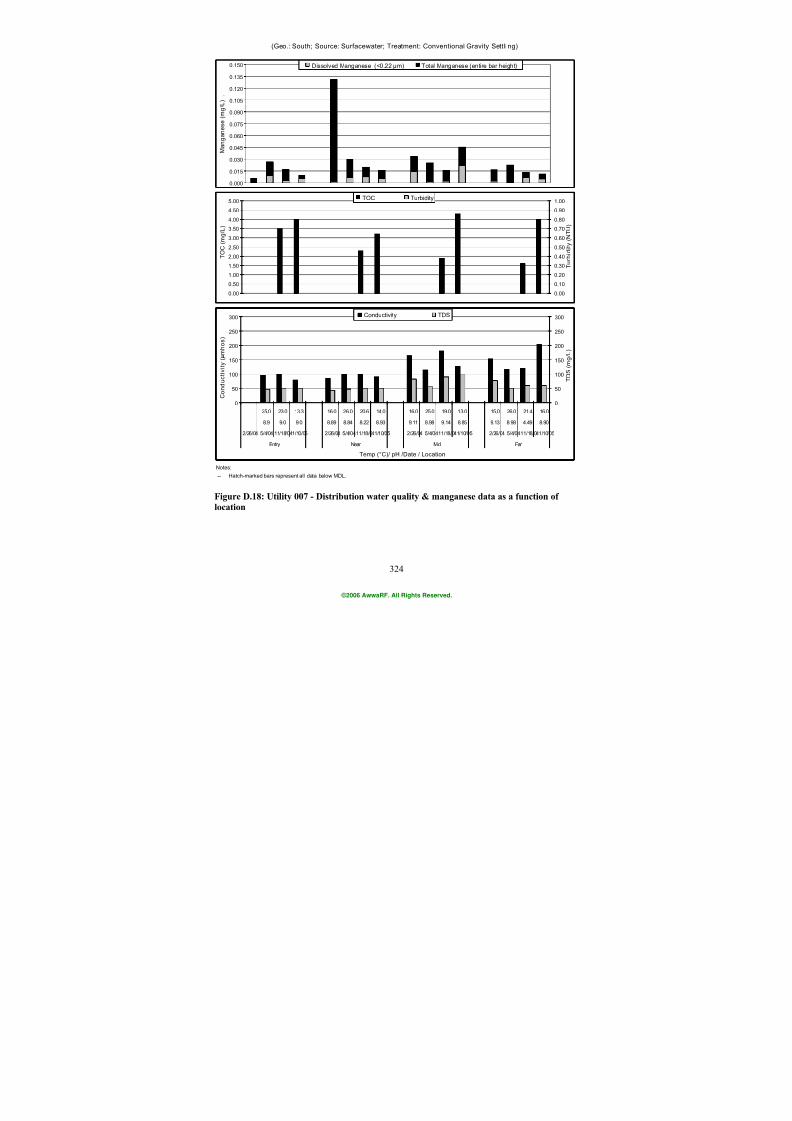
7/21/2019 Occurrence of Manganese in Drinking Water and Manganese Control
http://slidepdf.com/reader/full/occurrence-of-manganese-in-drinking-water-and-manganese-control 350/463
324
(Geo.: South; Source: Surfacewater; Treatment: Conventional Gravity Settli ng)
Notes:
-- Hatch-marked bars represent all data below MDL.
0.00
0.50
1.00
1.50
2.00
2.50
3.00
3.50
4.00
4.50
5.00
T O C
( m g / L )
0.00
0.10
0.20
0.30
0.40
0.50
0.60
0.70
0.80
0.90
1.00
T u r b i d i t y ( N
T U )
TOC Turbidity
0
50
100
150
200
250
300
25.0 23.0 13.3 16.0 26.0 20.6 14.0 16.0 25.0 19.0 13.0 15.0 26.0 21.4 16.0
8.9 9.0 9.0 8.89 8.84 8.22 8.93 9.11 8.98 9.14 8.85 9.13 8.98 4.49 8.90
2/26/04 5/4/04 11/18/041/10/05 2/26/04 5/4/0411/18/041/10/05 2/26/04 5/4/0411/18/041/10/05 2/26/04 5/4/0411/18/041/10/05
Entry Near Mid Far
Temp (°C)/ pH /Date / Location
C o n d u c t i v i t y ( m h o s )
0
50
100
150
200
250
300
T D S ( m g /
L )
Conductivity TDS
0.000
0.015
0.030
0.045
0.060
0.075
0.090
0.105
0.120
0.135
0.150
M a n g a n e s e ( m g / L ) .
Dissolved Manganese (<0.22 µm) Total Manganese (entire bar height)
Figure D.18: Utility 007 - Distribution water quality & manganese data as a function of
location
©2006 AwwaRF. All Rights Reserved.
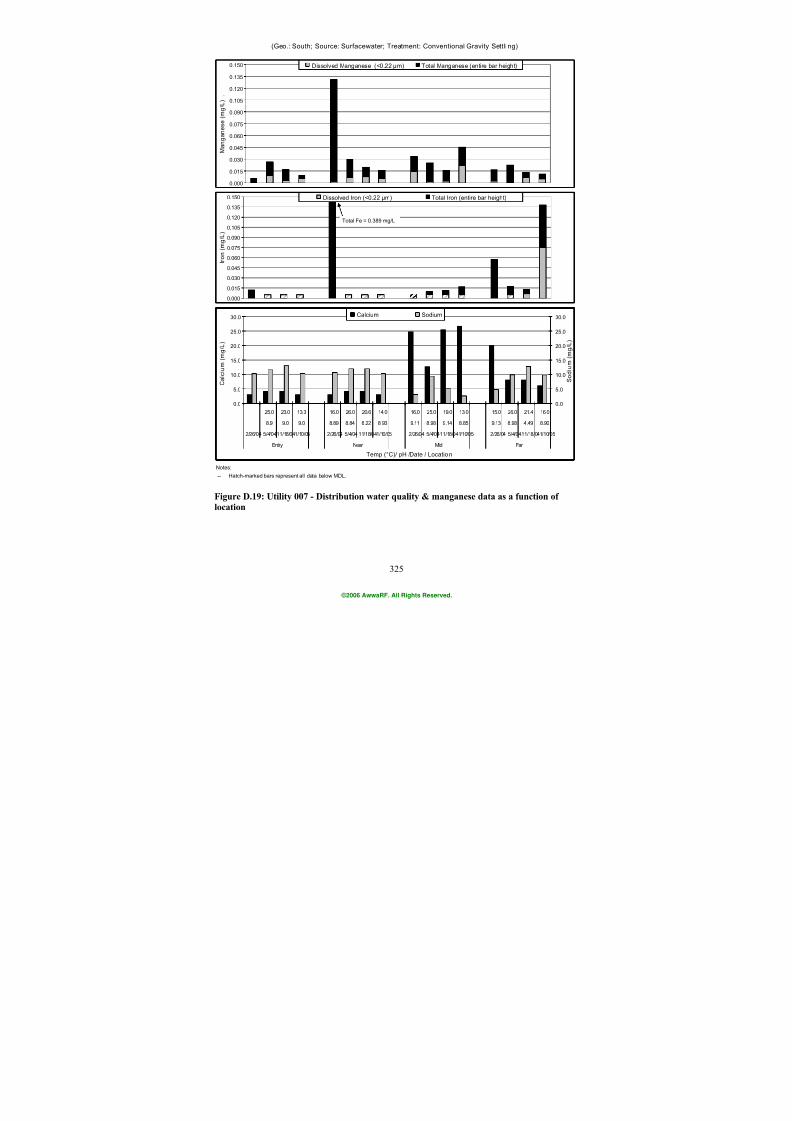
7/21/2019 Occurrence of Manganese in Drinking Water and Manganese Control
http://slidepdf.com/reader/full/occurrence-of-manganese-in-drinking-water-and-manganese-control 351/463
325
(Geo.: South; Source: Surfacewater; Treatment: Conventional Gravity Settli ng)
Notes:
-- Hatch-marked bars represent all data below MDL.
0.0
5.0
10.0
15.0
20.0
25.0
30.0
25.0 23.0 13.3 16.0 26.0 20.6 14.0 16.0 25.0 19.0 13.0 15.0 26.0 21.4 16.0
8.9 9.0 9.0 8.89 8.84 8.22 8.93 9.11 8.98 9.14 8.85 9.13 8.98 4.49 8.90
2/26/04 5/4/0411/18/041/10/05 2/26/04 5/4/04 11/18/041/10/05 2/26/04 5/4/0411/18/041/10/05 2/26/04 5/4/0411/18/041/10/05
Entry Near Mid Far
Temp (°C)/ pH /Date / Locatio n
C a l c i u m ( m
g / L )
0.0
5.0
10.0
15.0
20.0
25.0
30.0
S o d i u m ( m
g / L )
Calcium Sodium
0.000
0.015
0.030
0.045
0.060
0.075
0.090
0.105
0.120
0.135
0.150
I r o n ( m g / L
)
Dissolved Iron (<0.22 µm) Total Iron (entire bar height)
Total Fe = 0.389 mg/L
0.000
0.015
0.030
0.045
0.060
0.075
0.090
0.105
0.120
0.135
0.150
M a n g a n e s e ( m g / L ) .
Dissolved Manganese (<0.22 µm) Total Manganese (entire bar height)
Figure D.19: Utility 007 - Distribution water quality & manganese data as a function of
location
©2006 AwwaRF. All Rights Reserved.
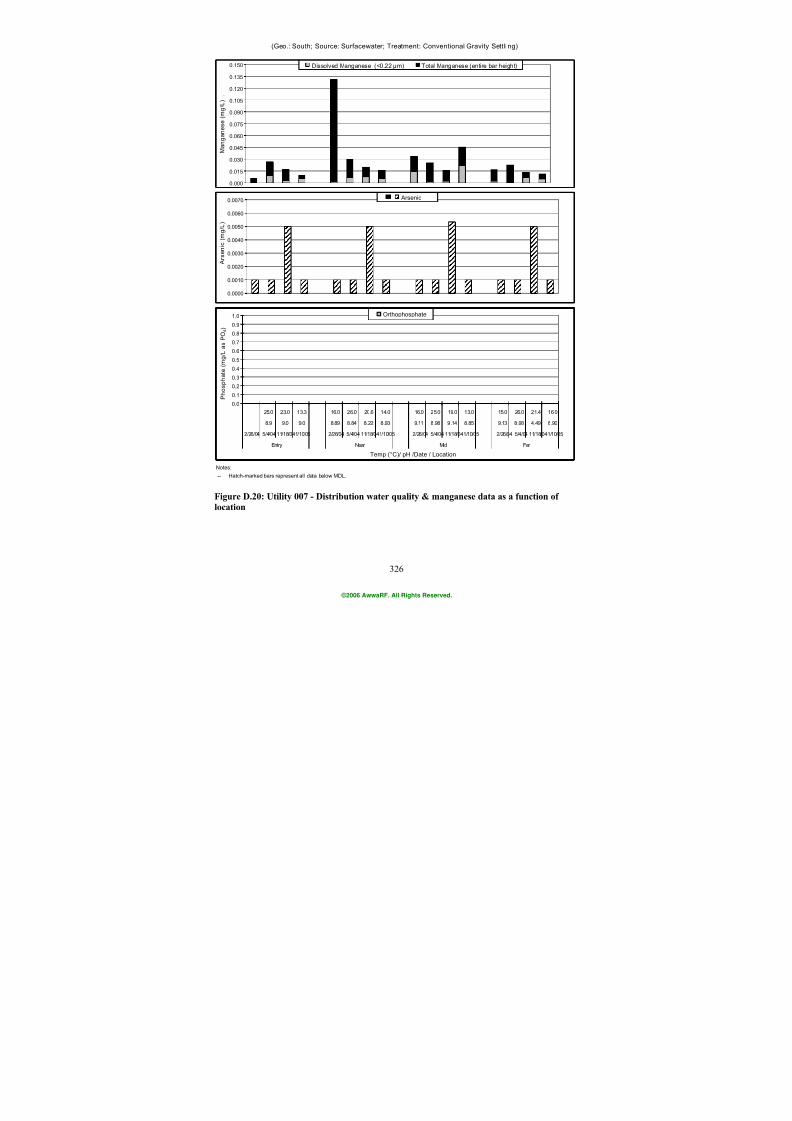
7/21/2019 Occurrence of Manganese in Drinking Water and Manganese Control
http://slidepdf.com/reader/full/occurrence-of-manganese-in-drinking-water-and-manganese-control 352/463
326
(Geo.: South; Source: Surfacewater; Treatment: Conventional Gravity Settli ng)
Notes:
-- Hatch-marked bars represent all data below MDL.
0.0
0.1
0.2
0.3
0.4
0.5
0.6
0.7
0.8
0.9
1.0
25.0 23.0 13.3 16.0 26.0 20.6 14.0 16.0 25.0 19.0 13.0 15.0 26.0 21.4 16.0
8.9 9.0 9.0 8.89 8.84 8.22 8.93 9.11 8.98 9.14 8.85 9.13 8.98 4.49 8.90
2/26/04 5/4/04 11/18/041/10/05 2/26/04 5/4/04 11/18/041/10/05 2/26/04 5/4/04 11/18/041/10/05 2/26/04 5/4/04 11/18/041/10/05
Entry Near Mid Far
Temp (°C)/ pH /Date / Location
P h o s p h a t e ( m g / L a s P O 4 )
Orthophosphate
0.0000
0.0010
0.0020
0.0030
0.0040
0.0050
0.0060
0.0070
A r s e n i c ( m
g / L )
Arsenic
0.000
0.015
0.030
0.045
0.060
0.075
0.090
0.105
0.120
0.135
0.150
M a n g a n e s e ( m g / L ) .
Dissolved Manganese (<0.22 µm) Total Manganese (entire bar height)
Figure D.20: Utility 007 - Distribution water quality & manganese data as a function of
location
©2006 AwwaRF. All Rights Reserved.
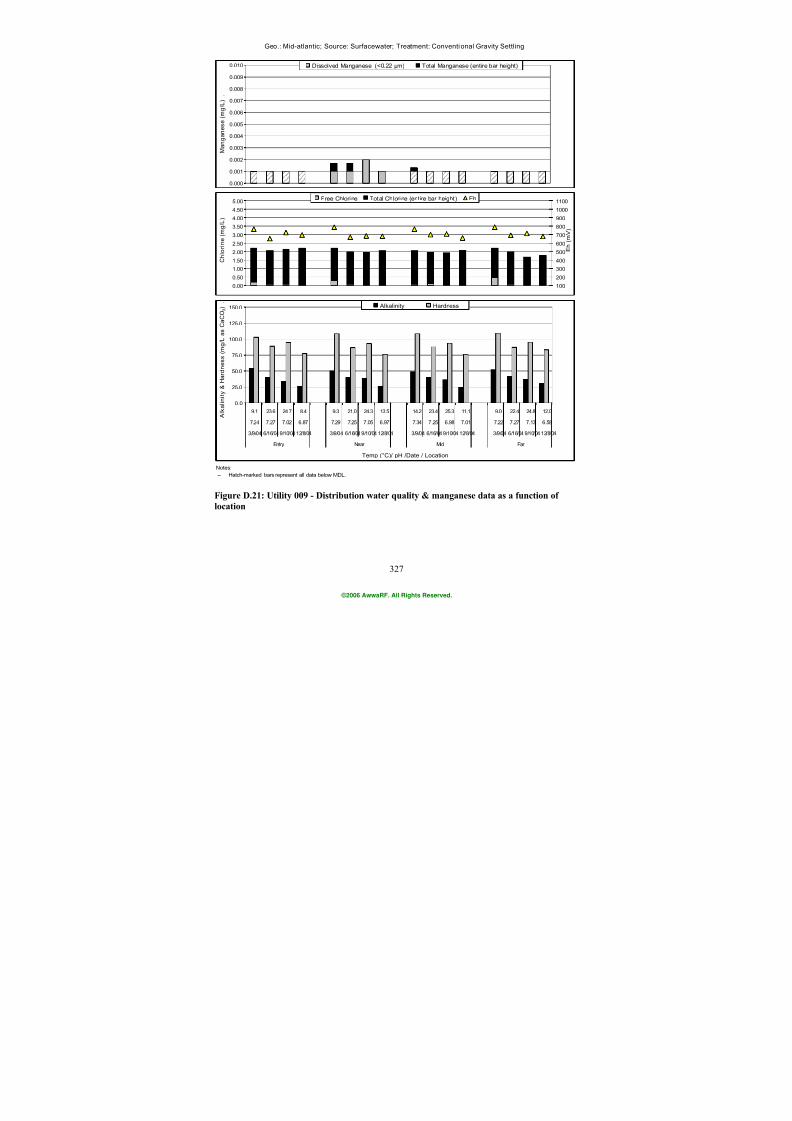
7/21/2019 Occurrence of Manganese in Drinking Water and Manganese Control
http://slidepdf.com/reader/full/occurrence-of-manganese-in-drinking-water-and-manganese-control 353/463
327
Geo.: Mid-atlantic; Source: Surfacewater; Treatment: Conventional Gravity Settling
Notes:
-- Hatch-marked bars represent all data below MDL.
0.000
0.001
0.002
0.003
0.004
0.005
0.006
0.007
0.008
0.009
0.010
M a n g a n e s e ( m g / L ) .
Dissolved Manganese (<0.22 µm) Total Manganese (entire bar height)
0.0
25.0
50.0
75.0
100.0
125.0
150.0
9.1 23.6 24.7 8.4 9.3 21.0 24.3 13.5 14.2 23.4 25.3 11.1 9.0 22.4 24.8 12.0
7.24 7.27 7.02 6.87 7.29 7.25 7.05 6.97 7.34 7.25 6.98 7.01 7.22 7.27 7.13 6.58
3/9/04 6/16/049/10/0412/8/04 3/9/04 6/16/049/10/04 12/8/04 3/9/04 6/16/049/10/04 12/8/04 3/9/04 6/16/04 9/10/04 12/8/04
Entry Near Mid Far
Temp (°C)/ pH /Date / Location
A l k a l i n i t y &
H a r d n e s s
( m g / L a s C a C O 3 ) .
Alkalinity Hardness
0.00
0.50
1.00
1.50
2.00
2.503.00
3.50
4.00
4.50
5.00
C h l o r i n e
( m g / L )
100
200
300
400
500
600700
800
900
1000
1100
E h ( m
V )
Free Chlorine Total Chlorine (entire bar height) Eh
Figure D.21: Utility 009 - Distribution water quality & manganese data as a function of
location
©2006 AwwaRF. All Rights Reserved.
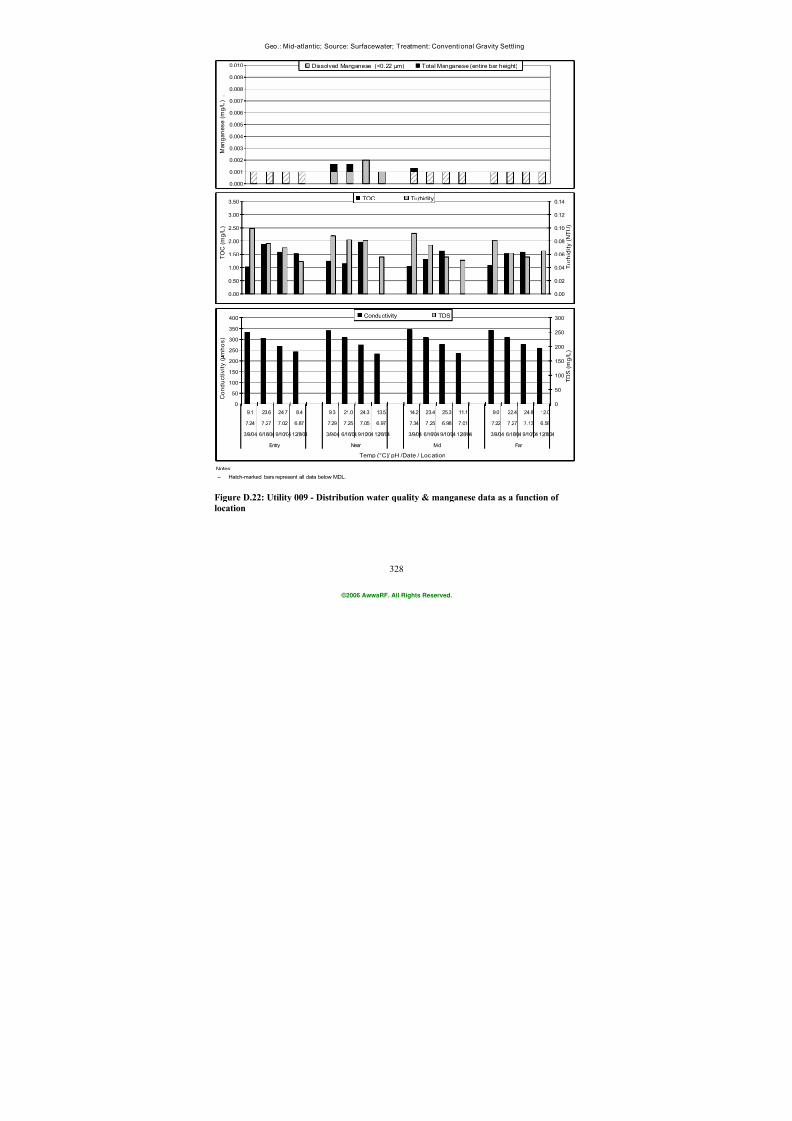
7/21/2019 Occurrence of Manganese in Drinking Water and Manganese Control
http://slidepdf.com/reader/full/occurrence-of-manganese-in-drinking-water-and-manganese-control 354/463
328
Geo.: Mid-atlantic; Source: Surfacewater; Treatment: Conventional Gravity Settling
Notes:
-- Hatch-marked bars represent all data below MDL.
0.00
0.50
1.00
1.50
2.00
2.50
3.00
3.50
T O C
( m g / L )
0.00
0.02
0.04
0.06
0.08
0.10
0.12
0.14
T u r b i d i t y ( N
T U )
TOC Turbidity
0
50
100
150
200
250
300
350
400
9.1 23.6 24.7 8.4 9.3 21.0 24.3 13.5 14.2 23.4 25.3 11.1 9.0 22.4 24.8 12.0
7.24 7.27 7.02 6.87 7.29 7.25 7.05 6.97 7.34 7.25 6.98 7.01 7.22 7.27 7.13 6.58
3/9/04 6/16/04 9/10/04 12/8/04 3/9/04 6/16/04 9/10/04 12/8/04 3/9/04 6/16/04 9/10/04 12/8/04 3/9/04 6/16/04 9/10/04 12/8/04
Entry Near Mid Far
Temp (°C)/ pH /Date / Location
C o n d u c t i v i t y ( m h o s )
0
50
100
150
200
250
300
T D S ( m g / L )
Conductivity TDS
0.000
0.001
0.002
0.003
0.004
0.005
0.006
0.007
0.008
0.009
0.010
M a n g a n e s e ( m g / L ) .
Dissolved Manganese (<0.22 µm) Total Manganese (entire bar height)
Figure D.22: Utility 009 - Distribution water quality & manganese data as a function of
location
©2006 AwwaRF. All Rights Reserved.
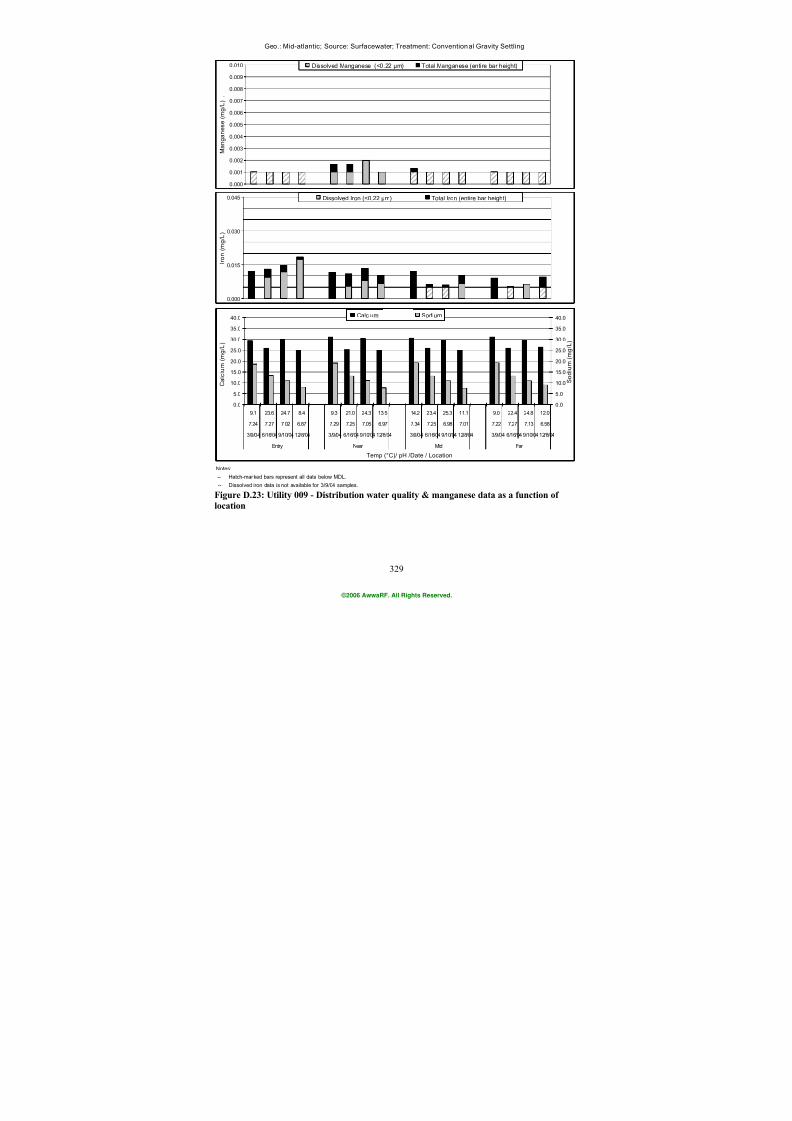
7/21/2019 Occurrence of Manganese in Drinking Water and Manganese Control
http://slidepdf.com/reader/full/occurrence-of-manganese-in-drinking-water-and-manganese-control 355/463
329
Geo.: Mid-atlantic; Source: Surfacewater; Treatment: Conventional Gravity Settling
Notes:
-- Hatch-marked bars represent all data below MDL.
-- Dissolved iron data is not available for 3/9/04 samples.
0.0
5.0
10.0
15.0
20.0
25.0
30.0
35.0
40.0
9.1 23.6 24.7 8.4 9.3 21.0 24.3 13.5 14.2 23.4 25.3 11.1 9.0 22.4 24.8 12.0
7.24 7.27 7.02 6.87 7.29 7.25 7.05 6.97 7.34 7.25 6.98 7.01 7.22 7.27 7.13 6.58
3/9/04 6/16/04 9/10/04 12/8/04 3/9/04 6/16/04 9/10/04 12/8/04 3/9/04 6/16/04 9/10/04 12/8/04 3/9/04 6/16/04 9/10/04 12/8/04
Entry Near Mid Far
Temp (°C)/ pH /Date / Location
C a l c i u m ( m
g / L )
0.0
5.0
10.0
15.0
20.0
25.0
30.0
35.0
40.0
S o d i u m ( m
g / L )
Calcium Sodium
0.000
0.015
0.030
0.045
I r o n ( m g / L
)
Dissolved Iron (<0.22 µm) Total Iron (entire bar height)
0.000
0.001
0.002
0.003
0.004
0.005
0.006
0.007
0.008
0.009
0.010
M a n g a n e s e (
m g / L ) .
Dissolved Manganese (<0.22 µm) Total Manganese (entire bar height)
Figure D.23: Utility 009 - Distribution water quality & manganese data as a function of
location
©2006 AwwaRF. All Rights Reserved.
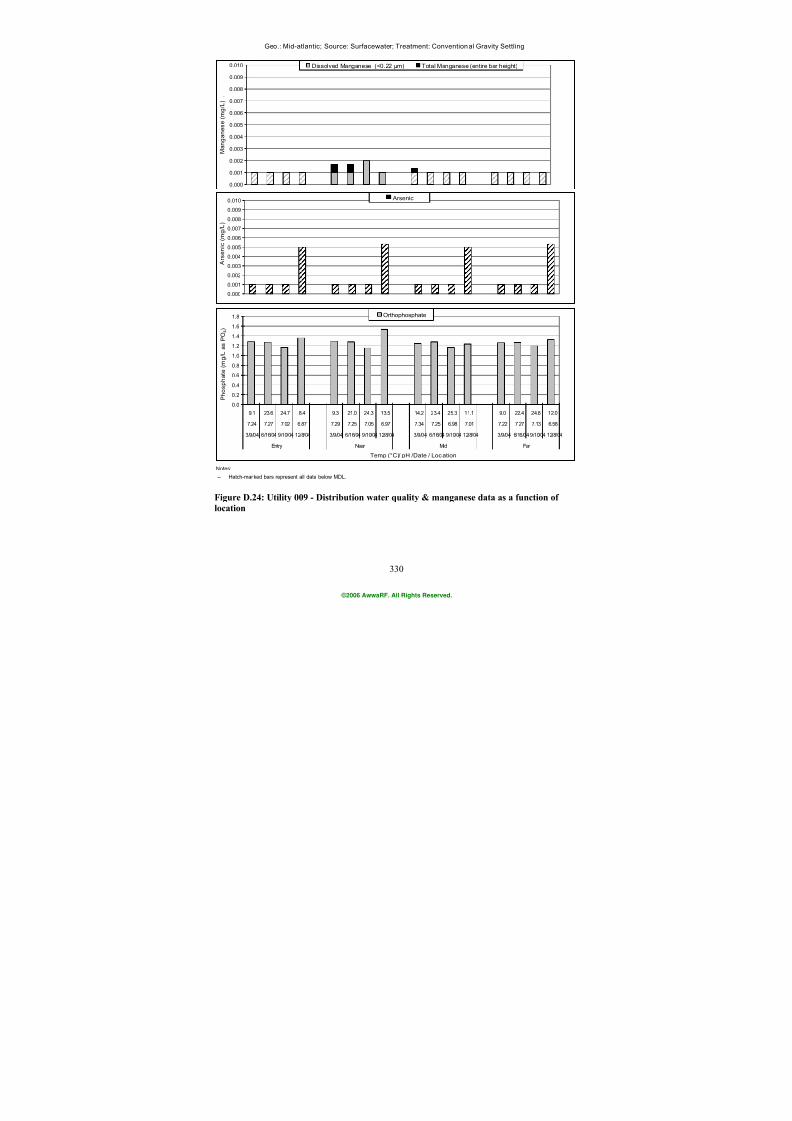
7/21/2019 Occurrence of Manganese in Drinking Water and Manganese Control
http://slidepdf.com/reader/full/occurrence-of-manganese-in-drinking-water-and-manganese-control 356/463
330
Geo.: Mid-atlantic; Source: Surfacewater; Treatment: Conventional Gravity Settling
Notes:
-- Hatch-marked bars represent all data below MDL.
0.0
0.2
0.4
0.6
0.8
1.0
1.2
1.4
1.6
1.8
9.1 23.6 24.7 8.4 9.3 21.0 24.3 13.5 14.2 23.4 25.3 11.1 9.0 22.4 24.8 12.0
7.24 7.27 7.02 6.87 7.29 7.25 7.05 6.97 7.34 7.25 6.98 7.01 7.22 7.27 7.13 6.58
3/9/04 6/16/04 9/10/04 12/8/04 3/9/04 6/16/04 9/10/04 12/8/04 3/9/04 6/16/04 9/10/04 12/8/04 3/9/04 6/16/04 9/10/04 12/8/04
Entry Near Mid Far
Temp (°C)/ pH /Date / Location
P h o s p h a t e ( m g /
L a s P O 4 )
Orthophosphate
0.000
0.001
0.002
0.003
0.004
0.005
0.006
0.007
0.008
0.009
0.010
A r s e n i c ( m
g / L )
Arsenic
0.000
0.001
0.002
0.003
0.004
0.005
0.006
0.007
0.008
0.009
0.010
M a n g a n e s e (
m g / L ) .
Dissolved Manganese (<0.22 µm) Total Manganese (entire bar height)
Figure D.24: Utility 009 - Distribution water quality & manganese data as a function of
location
©2006 AwwaRF. All Rights Reserved.
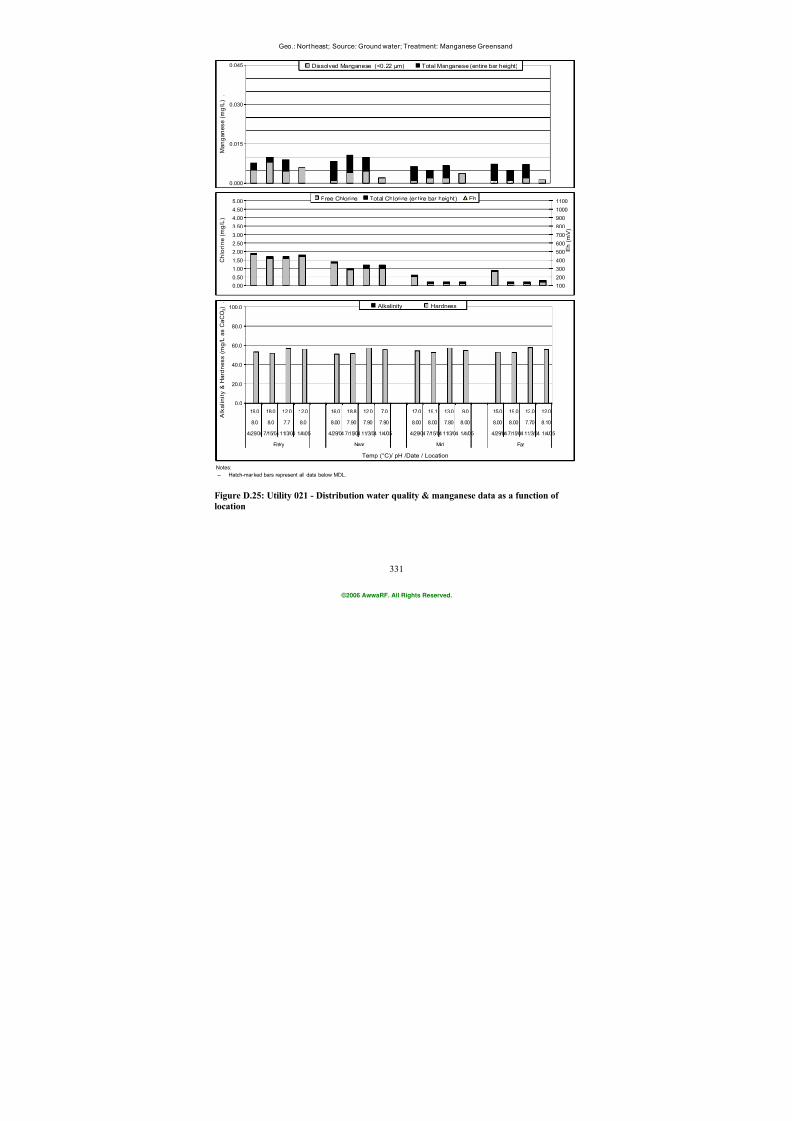
7/21/2019 Occurrence of Manganese in Drinking Water and Manganese Control
http://slidepdf.com/reader/full/occurrence-of-manganese-in-drinking-water-and-manganese-control 357/463
331
Geo.: Northeast; Source: Groundwater; Treatment: Manganese Greensand
Notes:
-- Hatch-marked bars represent all data below MDL.
0.000
0.015
0.030
0.045
M a n g a n e s e ( m g / L ) .
Dissolved Manganese (<0.22 µm) Total Manganese (entire bar height)
0.0
20.0
40.0
60.0
80.0
100.0
19.0 18.0 12.0 12.0 16.0 18.8 12.0 7.0 17.0 19.1 13.0 9.0 15.0 19.0 12.0 12.0
8.0 8.0 7.7 8.0 8.00 7.90 7.90 7.90 8.00 8.00 7.80 8.00 8.00 8.00 7.70 8.10
4/29/04 7/15/04 11/3/04 1/4/05 4/29/04 7/15/04 11/3/04 1/4/05 4/29/04 7/15/04 11/3/04 1/4/05 4/29/04 7/15/04 11/3/04 1/4/05
Entry Near Mid Far
Temp (°C)/ pH /Date / Location
A l k a l i n i t y &
H a r d n e s s
( m g / L a s C a C O 3 ) .
Alkalinity Hardness
0.00
0.50
1.00
1.50
2.00
2.503.00
3.50
4.00
4.50
5.00
C h l o r i n e
( m g / L )
100
200
300
400
500
600700
800
900
1000
1100
E h ( m
V )
Free Chlorine Total Chlorine (entire bar height) Eh
Figure D.25: Utility 021 - Distribution water quality & manganese data as a function of
location
©2006 AwwaRF. All Rights Reserved.
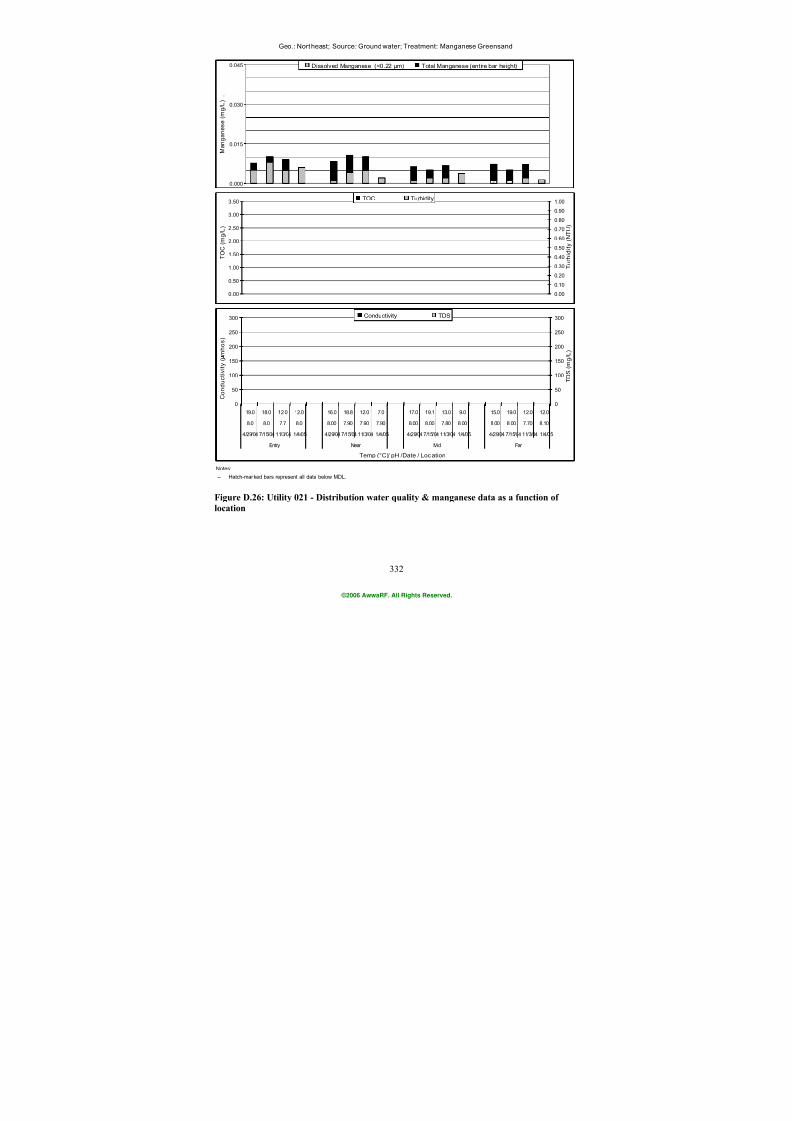
7/21/2019 Occurrence of Manganese in Drinking Water and Manganese Control
http://slidepdf.com/reader/full/occurrence-of-manganese-in-drinking-water-and-manganese-control 358/463
332
Geo.: Northeast; Source: Groundwater; Treatment: Manganese Greensand
Notes:
-- Hatch-marked bars represent all data below MDL.
0.00
0.50
1.00
1.50
2.00
2.50
3.00
3.50
T O C
( m g / L )
0.00
0.10
0.20
0.30
0.40
0.50
0.60
0.70
0.80
0.90
1.00
T u r b i d i t y ( N
T U )
TOC Turbidity
0
50
100
150
200
250
300
19.0 18.0 12.0 12.0 16.0 18.8 12.0 7.0 17.0 19.1 13.0 9.0 15.0 19.0 12.0 12.0
8.0 8.0 7.7 8.0 8.00 7.90 7.90 7.90 8.00 8.00 7.80 8.00 8.00 8.00 7.70 8.10
4/29/04 7/15/04 11/3/04 1/4/05 4/29/04 7/15/04 11/3/04 1/4/05 4/29/04 7/15/04 11/3/04 1/4/05 4/29/04 7/15/04 11/3/04 1/4/05
Entry Near Mid Far
Temp (°C)/ pH /Date / Location
C o n d u c t i v i t y ( m h o s )
0
50
100
150
200
250
300
T D S ( m g / L )
Conductivity TDS
0.000
0.015
0.030
0.045
M a n g a n e s e ( m g / L ) .
Dissolved Manganese (<0.22 µm) Total Manganese (entire bar height)
Figure D.26: Utility 021 - Distribution water quality & manganese data as a function of
location
©2006 AwwaRF. All Rights Reserved.
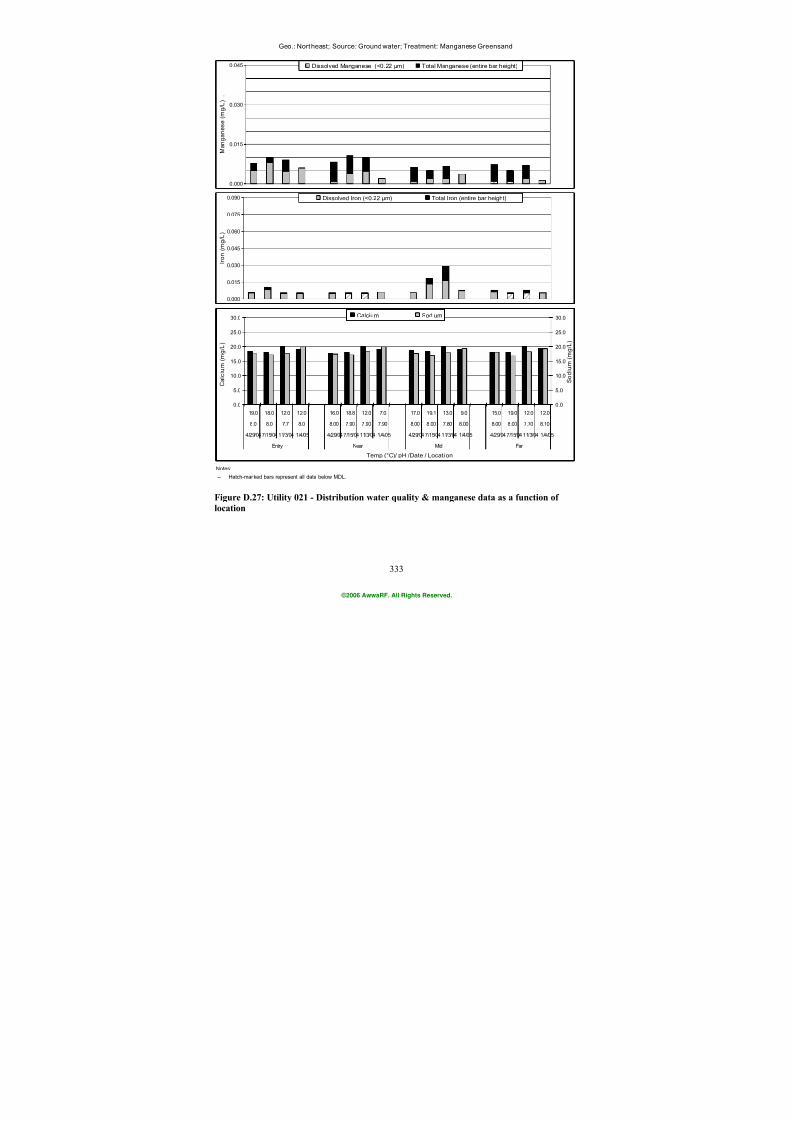
7/21/2019 Occurrence of Manganese in Drinking Water and Manganese Control
http://slidepdf.com/reader/full/occurrence-of-manganese-in-drinking-water-and-manganese-control 359/463
333
Geo.: Northeast; Source: Groundwater; Treatment: Manganese Greensand
Notes:
-- Hatch-marked bars represent all data below MDL.
0.0
5.0
10.0
15.0
20.0
25.0
30.0
19.0 18.0 12.0 12.0 16.0 18.8 12.0 7.0 17.0 19.1 13.0 9.0 15.0 19.0 12.0 12.0
8.0 8.0 7.7 8.0 8.00 7.90 7.90 7.90 8.00 8.00 7.80 8.00 8.00 8.00 7.70 8.10
4/29/04 7/15/04 11/3/04 1/4/05 4/29/04 7/15/04 11/3/04 1/4/05 4/29/04 7/15/04 11/3/04 1/4/05 4/29/04 7/15/04 11/3/04 1/4/05
Entry Near Mid Far
Temp (°C)/ pH /Date / Locati on
C a l c i u m ( m
g / L )
0.0
5.0
10.0
15.0
20.0
25.0
30.0
S o d i u m ( m
g / L )
Calcium Sodium
0.000
0.015
0.030
0.045
0.060
0.075
0.090
I r o n ( m g / L
)
Dissolved Iron (<0.22 µm) Total Iron (entire bar height)
0.000
0.015
0.030
0.045
M a n g a n e s e ( m g / L ) .
Dissolved Manganese (<0.22 µm) Total Manganese (entire bar height)
Figure D.27: Utility 021 - Distribution water quality & manganese data as a function of
location
©2006 AwwaRF. All Rights Reserved.
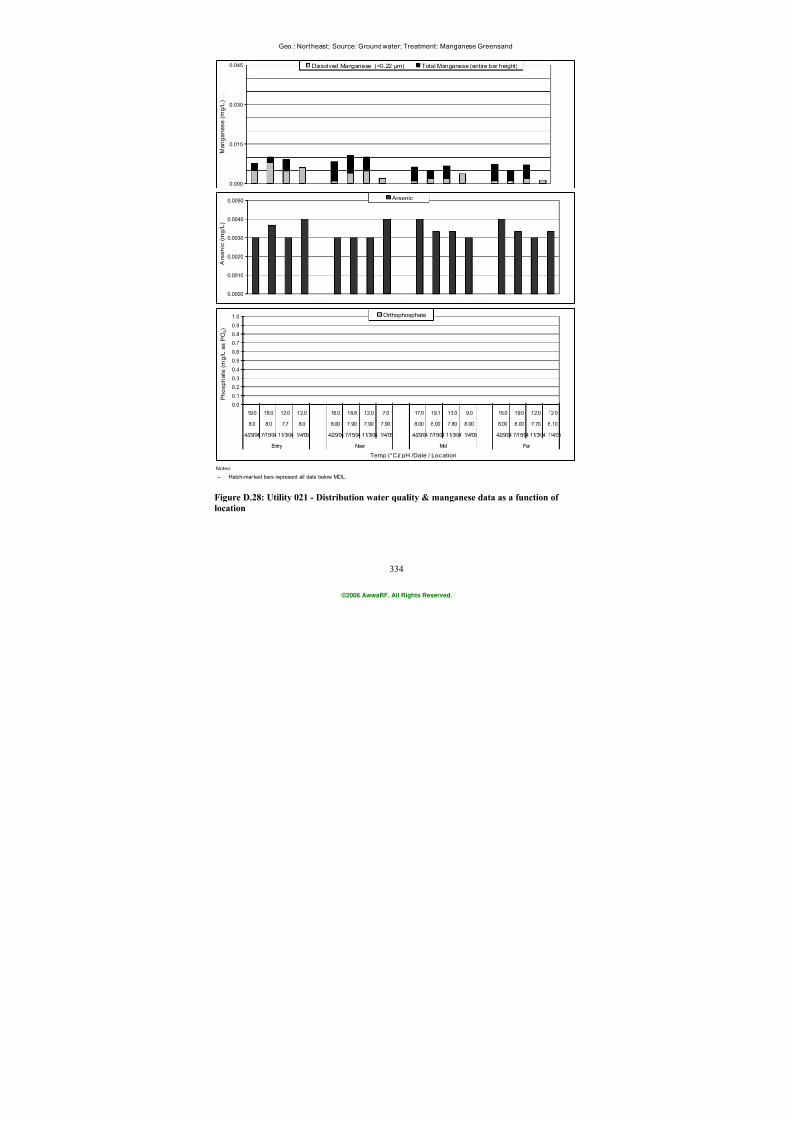
7/21/2019 Occurrence of Manganese in Drinking Water and Manganese Control
http://slidepdf.com/reader/full/occurrence-of-manganese-in-drinking-water-and-manganese-control 360/463
334
Geo.: Northeast; Source: Groundwater; Treatment: Manganese Greensand
Notes:
-- Hatch-marked bars represent all data below MDL.
0.0
0.1
0.2
0.3
0.4
0.5
0.6
0.7
0.8
0.9
1.0
19.0 18.0 12.0 12.0 16.0 18.8 12.0 7.0 17.0 19.1 13.0 9.0 15.0 19.0 12.0 12.0
8.0 8.0 7.7 8.0 8.00 7.90 7.90 7.90 8.00 8.00 7.80 8.00 8.00 8.00 7.70 8.10
4/29/04 7/15/04 11/3/04 1/4/05 4/29/04 7/15/04 11/3/04 1/4/05 4/29/04 7/15/04 11/3/04 1/4/05 4/29/04 7/15/04 11/3/04 1/4/05
Entry Near Mid Far
Temp (°C)/ pH /Date / Location
P h o s p h a t e ( m g /
L a s P O 4 )
Orthophosphate
0.0000
0.0010
0.0020
0.0030
0.0040
0.0050
A r s e n i c ( m
g / L )
Arsenic
0.000
0.015
0.030
0.045
M a n g a n e s e ( m g / L ) .
Dissolved Manganese (<0.22 µm) Total Manganese (entire bar height)
Figure D.28: Utility 021 - Distribution water quality & manganese data as a function of
location
©2006 AwwaRF. All Rights Reserved.
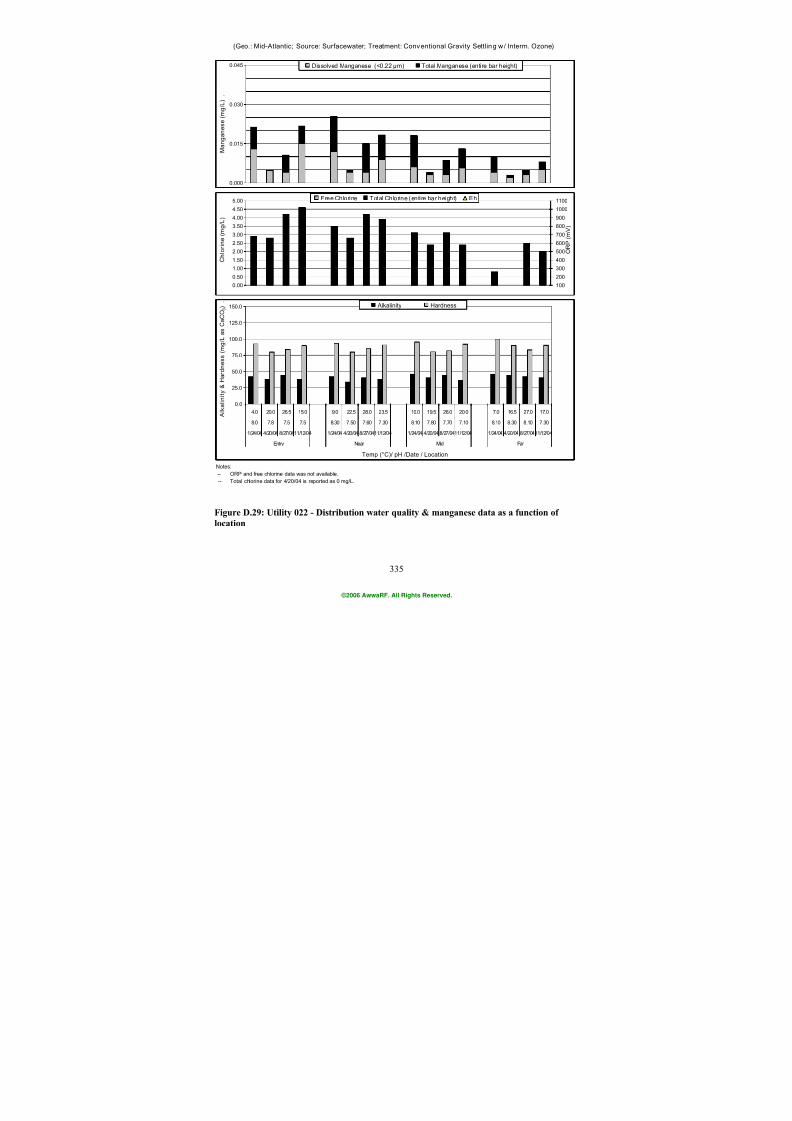
7/21/2019 Occurrence of Manganese in Drinking Water and Manganese Control
http://slidepdf.com/reader/full/occurrence-of-manganese-in-drinking-water-and-manganese-control 361/463
335
(Geo.: Mid-Atlantic; Source: Surfacewater; Treatment: Conventional Gravity Settling w/ Interm. Ozone)
Notes:
-- ORP and free chlorine data was not available. -- Total chlorine data for 4/20/04 is reported as 0 mg/L.
0.000
0.015
0.030
0.045
M a n g a n e s e ( m g / L ) .
Dissolved Manganese (<0.22 µm) Total Manganese (entire bar height)
0.0
25.0
50.0
75.0
100.0
125.0
150.0
4.0 20.0 26.5 15.0 9.0 22.5 28.0 23.5 10.0 19.5 26.0 20.0 7.0 16.5 27.0 17.0
8.0 7.8 7.5 7.5 8.30 7.50 7.60 7.30 8.10 7.80 7.70 7.10 8.10 8.30 8.10 7.30
1/24/04 4/20/04 8/27/0411/12/04 1/24/04 4/20/04 8/27/0411/12/04 1/24/04 4/20/04 8/27/0411/12/04 1/24/04 4/20/04 8/27/0411/12/04
Entry Near Mid Far
Temp (°C)/ pH /Date / Location
A l k a l i n i t y &
H a r d n e s s
( m g / L a s C a C O 3 ) .
Alkalinity Hardness
0.00
0.50
1.00
1.50
2.00
2.503.00
3.50
4.00
4.50
5.00
C h l o r i n e
( m g / L )
100
200
300
400
500
600700
800
900
1000
1100
O R P ( m V )
Free Chlorine Total Chlorine (entire bar height) Eh
Figure D.29: Utility 022 - Distribution water quality & manganese data as a function of
location
©2006 AwwaRF. All Rights Reserved.
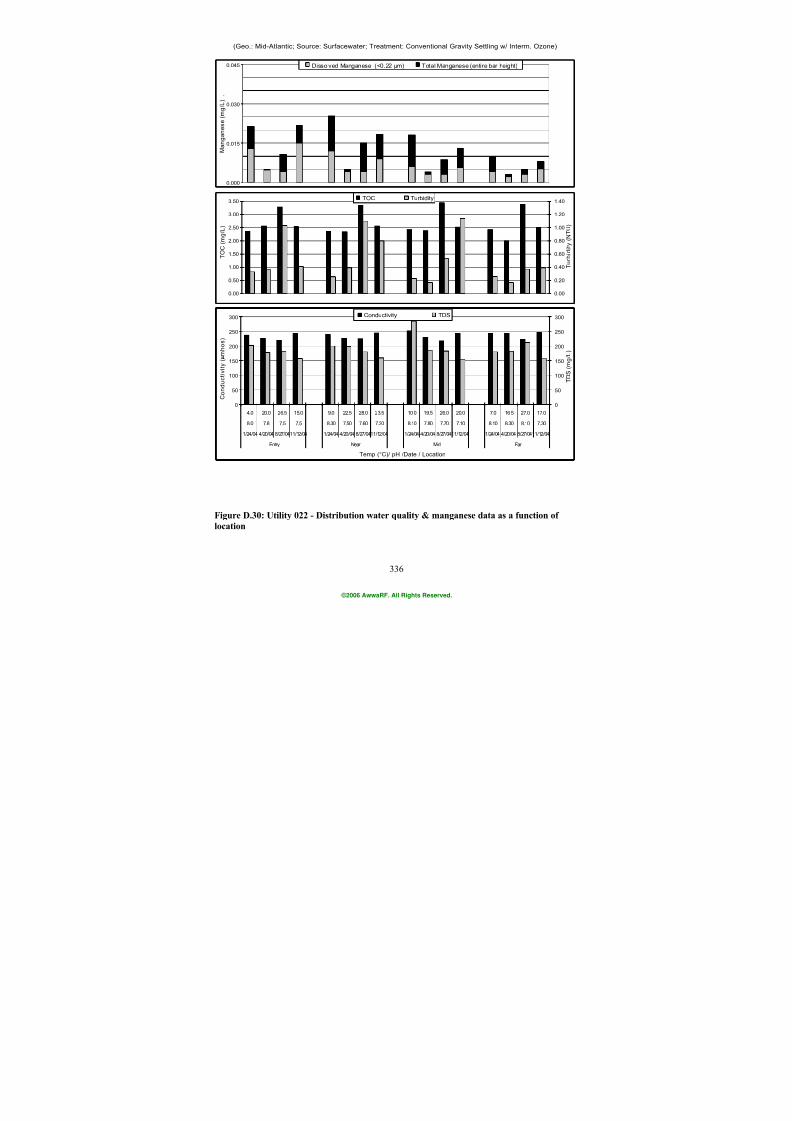
7/21/2019 Occurrence of Manganese in Drinking Water and Manganese Control
http://slidepdf.com/reader/full/occurrence-of-manganese-in-drinking-water-and-manganese-control 362/463
336
(Geo.: Mid-Atlantic; Source: Surfacewater; Treatment: Conventional Gravity Settling w/ Interm. Ozone)
0.00
0.50
1.00
1.50
2.00
2.50
3.00
3.50
T O C
( m g / L )
0.00
0.20
0.40
0.60
0.80
1.00
1.20
1.40
T u r b i d i t y ( N
T U )
TOC Turbidity
0
50
100
150
200
250
300
4.0 20.0 26.5 15.0 9.0 22.5 28.0 23.5 10.0 19.5 26.0 20.0 7.0 16.5 27.0 17.0
8.0 7.8 7.5 7.5 8.30 7.50 7.60 7.30 8.10 7.80 7.70 7.10 8.10 8.30 8.10 7.30
1/24/04 4/20/04 8/27/0411/12/04 1/24/04 4/20/04 8/27/0411/12/04 1/24/04 4/20/04 8/27/0411/12/04 1/24/04 4/20/04 8/27/0411/12/04
Entry Near Mid Far
Temp (°C)/ pH /Date / Location
C o n d u c t i v i t y ( m h o s )
0
50
100
150
200
250
300
T D S ( m g / L )
Conductivity TDS
0.000
0.015
0.030
0.045
M a n g a n e s e ( m g / L ) .
Dissolved Manganese (<0.22 µm) Total Manganese (entire bar height)
Figure D.30: Utility 022 - Distribution water quality & manganese data as a function of
location
©2006 AwwaRF. All Rights Reserved.
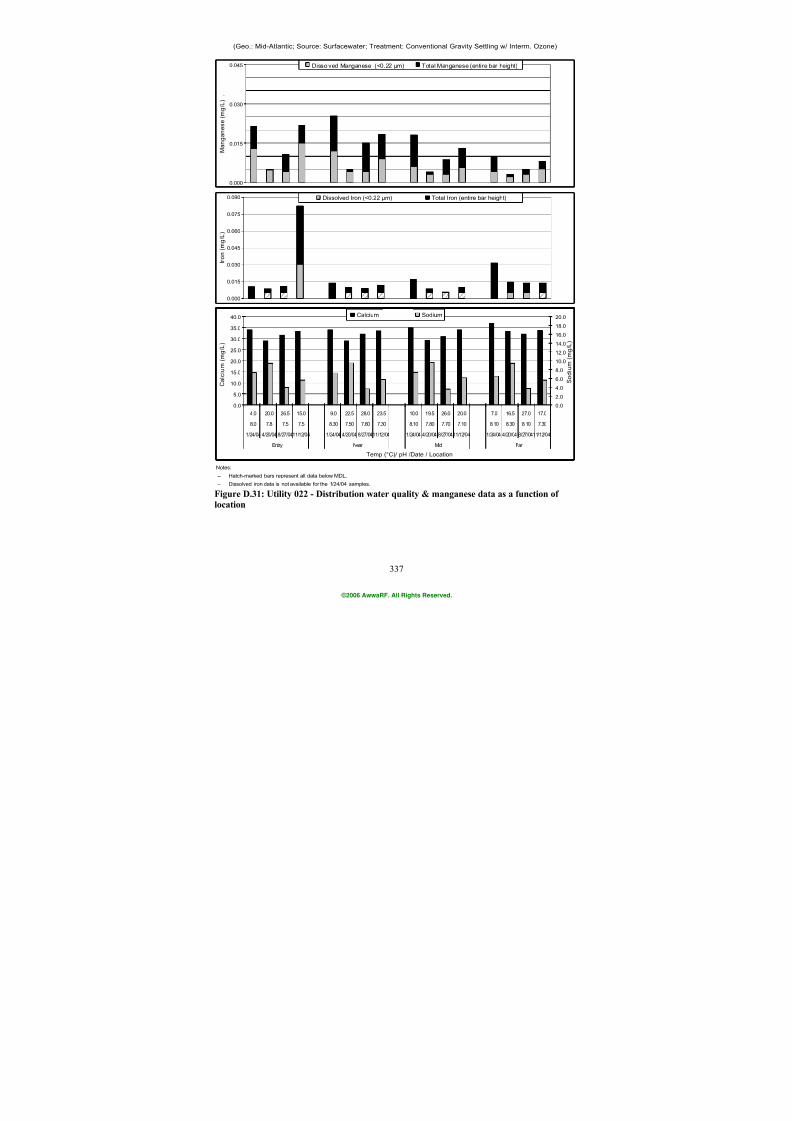
7/21/2019 Occurrence of Manganese in Drinking Water and Manganese Control
http://slidepdf.com/reader/full/occurrence-of-manganese-in-drinking-water-and-manganese-control 363/463
337
(Geo.: Mid-Atlantic; Source: Surfacewater; Treatment: Conventional Gravity Settling w/ Interm. Ozone)
Notes:
-- Hatch-marked bars represent all data below MDL. -- Dissolved iron data is not available for the 1/24/04 samples.
0.0
5.0
10.0
15.0
20.0
25.0
30.0
35.0
40.0
4.0 20.0 26.5 15.0 9.0 22.5 28.0 23.5 10.0 19.5 26.0 20.0 7.0 16.5 27.0 17.0
8.0 7.8 7.5 7.5 8.30 7.50 7.60 7.30 8.10 7.80 7.70 7.10 8.10 8.30 8.10 7.30
1/24/04 4/20/04 8/27/0411/12/04 1/24/04 4/20/04 8/27/0411/12/04 1/24/04 4/20/04 8/27/0411/12/04 1/24/04 4/20/04 8/27/0411/12/04
Entry Near Mid Far
Temp (°C)/ pH /Date / Location
C a l c i u m ( m
g / L )
0.0
2.0
4.0
6.0
8.0
10.0
12.0
14.0
16.0
18.0
20.0
S o d i u m ( m
g / L )
Calcium Sodium
0.000
0.015
0.030
0.045
0.060
0.075
0.090
I r o n ( m g / L
)
Dissolved Iron (<0.22 µm) Total Iron (entire bar height)
0.000
0.015
0.030
0.045
M a n g a n e s e ( m g / L ) .
Dissolved Manganese (<0.22 µm) Total Manganese (entire bar height)
Figure D.31: Utility 022 - Distribution water quality & manganese data as a function of
location
©2006 AwwaRF. All Rights Reserved.
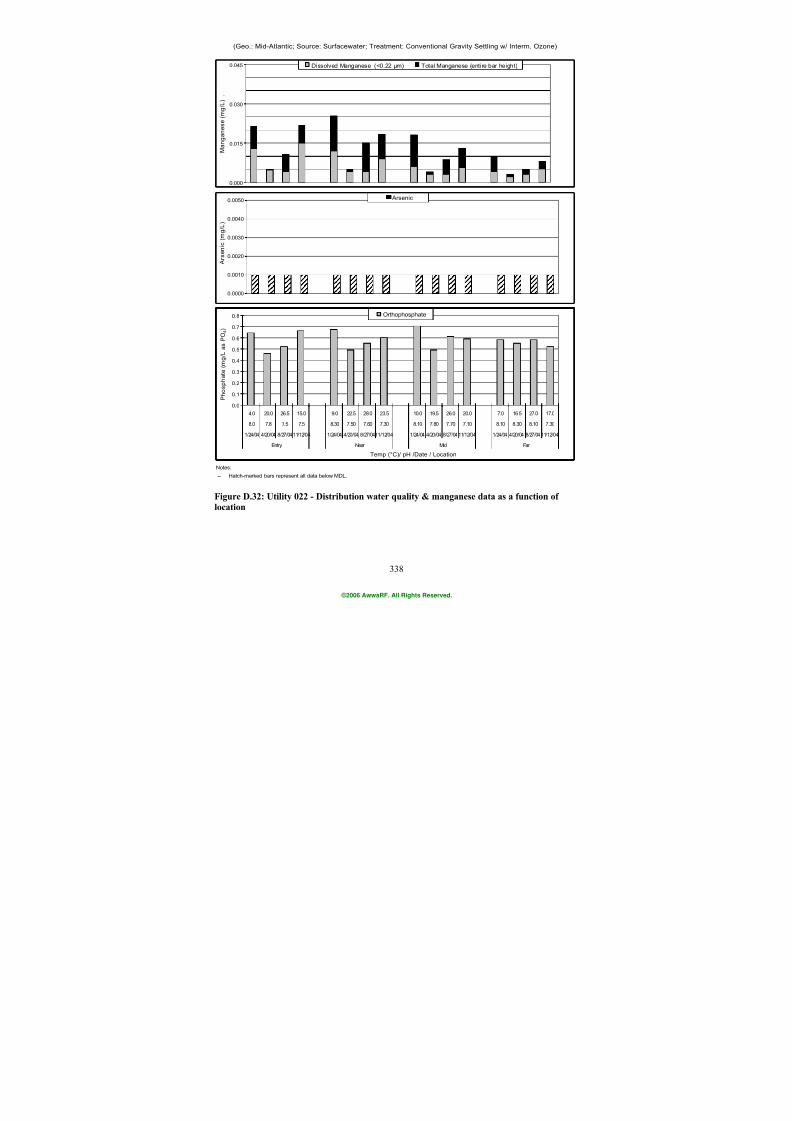
7/21/2019 Occurrence of Manganese in Drinking Water and Manganese Control
http://slidepdf.com/reader/full/occurrence-of-manganese-in-drinking-water-and-manganese-control 364/463
338
(Geo.: Mid-Atlantic; Source: Surfacewater; Treatment: Conventional Gravity Settling w/ Interm. Ozone)
Notes:
-- Hatch-marked bars represent all data below MDL.
0.0
0.1
0.2
0.3
0.4
0.5
0.6
0.7
0.8
4.0 20.0 26.5 15.0 9.0 22.5 28.0 23.5 10.0 19.5 26.0 20.0 7.0 16.5 27.0 17.0
8.0 7.8 7.5 7.5 8.30 7.50 7.60 7.30 8.10 7.80 7.70 7.10 8.10 8.30 8.10 7.30
1/24/04 4/20/04 8/27/0411/12/04 1/24/04 4/20/04 8/27/0411/12/04 1/24/04 4/20/04 8/27/0411/12/04 1/24/04 4/20/04 8/27/0411/12/04
Entry Near Mid Far
Temp (°C)/ pH /Date / Location
P h o s p h a t e ( m g /
L a s P O 4 )
Orthophosphate
0.0000
0.0010
0.0020
0.0030
0.0040
0.0050
A r s e n i c ( m
g / L )
Arsenic
0.000
0.015
0.030
0.045
M a n g a n e s e ( m g / L ) .
Dissolved Manganese (<0.22 µm) Total Manganese (entire bar height)
Figure D.32: Utility 022 - Distribution water quality & manganese data as a function of
location
©2006 AwwaRF. All Rights Reserved.
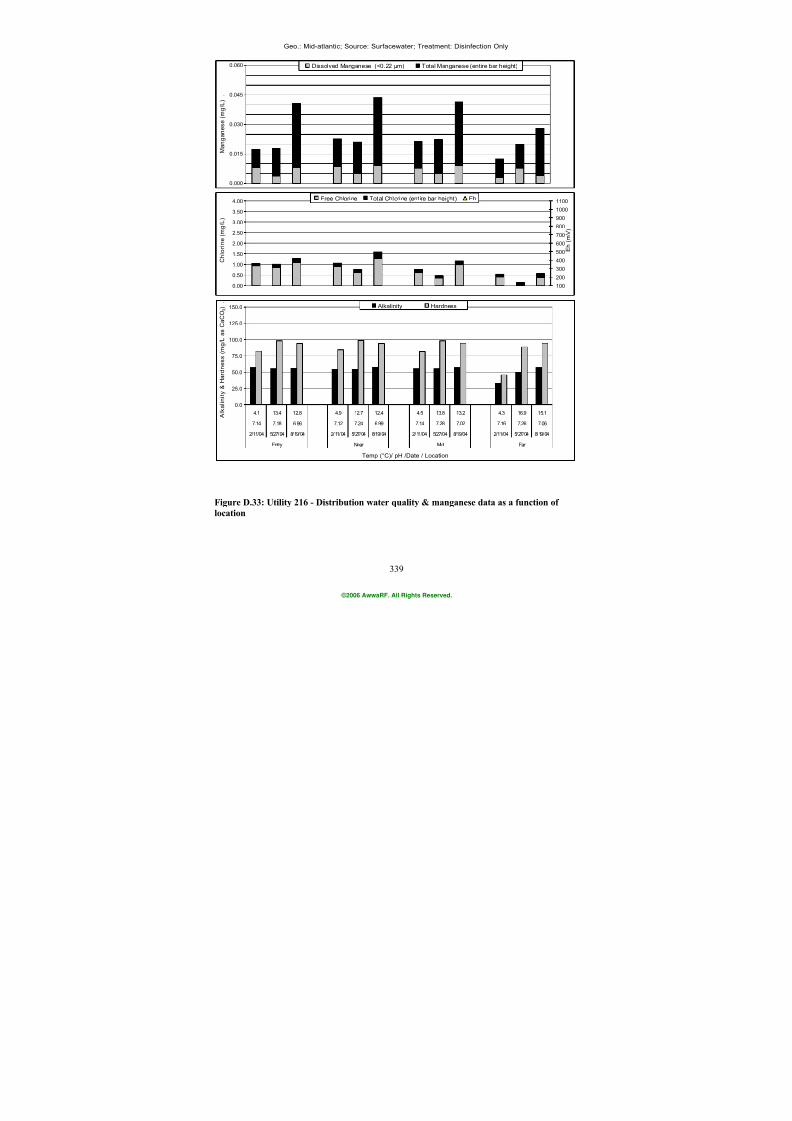
7/21/2019 Occurrence of Manganese in Drinking Water and Manganese Control
http://slidepdf.com/reader/full/occurrence-of-manganese-in-drinking-water-and-manganese-control 365/463
339
Geo.: Mid-atlantic; Source: Surfacewater; Treatment: Disinfection Only
0.000
0.015
0.030
0.045
0.060
M a n g a n e s e ( m g / L ) .
Dissolved Manganese (<0.22 µm) Total Manganese (entire bar height)
0.0
25.0
50.0
75.0
100.0
125.0
150.0
4.1 13.4 12.8 4.9 12.7 12.4 4.5 13.8 13.2 4.3 16.9 15.1
7.14 7.18 6.96 7.12 7.24 6.99 7.14 7.28 7.02 7.16 7.26 7.06
2/11/04 5/27/04 8/19/04 2/11/04 5/27/04 8/19/04 2/11/04 5/27/04 8/19/04 2/11/04 5/27/04 8/19/04
Entry Near Mid Far
Temp (°C)/ pH /Date / Location
A l k a l i n i t y &
H a r d n e s s
( m g / L a s C a C O 3 ) .
Alkalinity Hardness
0.00
0.50
1.00
1.50
2.00
2.50
3.00
3.50
4.00
C h l o r i n e
( m g / L )
100
200
300
400
500
600700
800
900
1000
1100
E h ( m
V )
Free Chlorine Total Chlorine (entire bar height) Eh
Figure D.33: Utility 216 - Distribution water quality & manganese data as a function of
location
©2006 AwwaRF. All Rights Reserved.
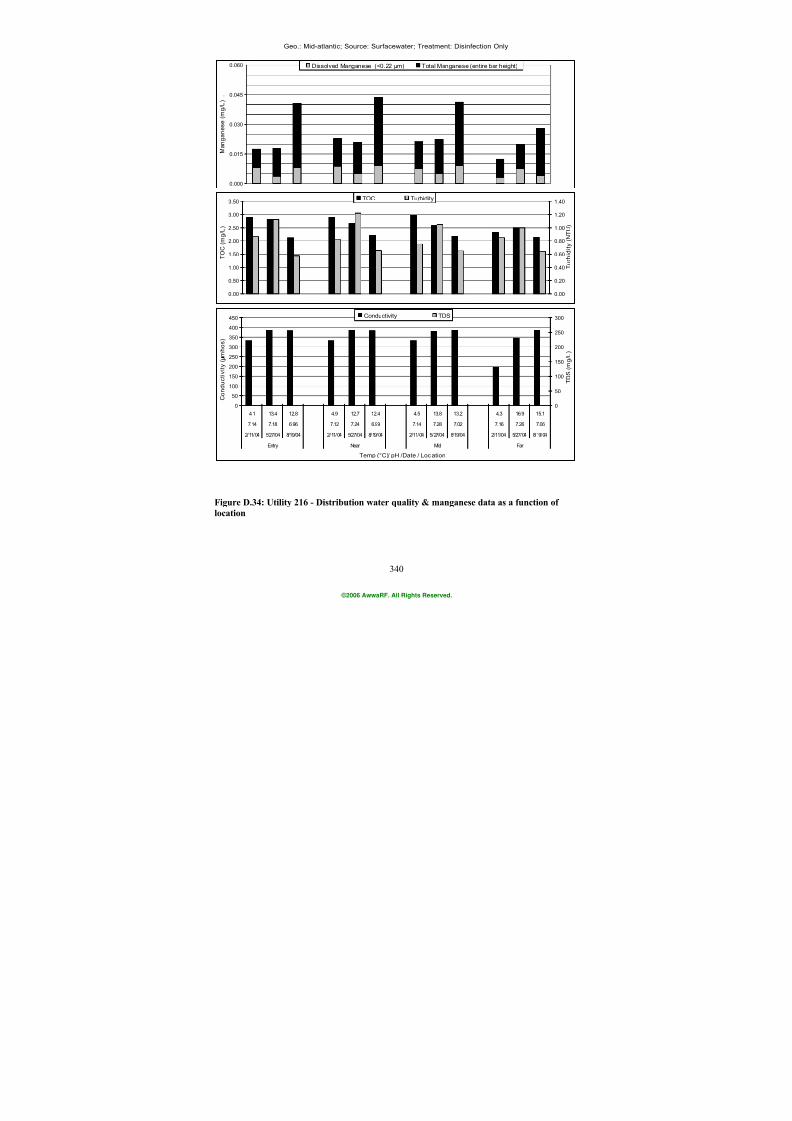
7/21/2019 Occurrence of Manganese in Drinking Water and Manganese Control
http://slidepdf.com/reader/full/occurrence-of-manganese-in-drinking-water-and-manganese-control 366/463
340
Geo.: Mid-atlantic; Source: Surfacewater; Treatment: Disinfection Only
0.00
0.50
1.00
1.50
2.00
2.50
3.00
3.50
T O C
( m g / L )
0.00
0.20
0.40
0.60
0.80
1.00
1.20
1.40
T u r b i d i t y ( N
T U )
TOC Turbidity
0
50
100
150
200
250
300
350
400
450
4.1 13.4 12.8 4.9 12.7 12.4 4.5 13.8 13.2 4.3 16.9 15.1
7.14 7.18 6.96 7.12 7.24 6.99 7.14 7.28 7.02 7.16 7.26 7.06
2/11/04 5/27/04 8/19/04 2/11/04 5/27/04 8/19/04 2/11/04 5/27/04 8/19/04 2/11/04 5/27/04 8/19/04
Entry Near Mid Far
Temp (°C)/ pH /Date / Location
C o n d u c t i v i t y ( m
h o s )
0
50
100
150
200
250
300
T D S ( m g / L
)
Conductivity TDS
0.000
0.015
0.030
0.045
0.060
M a n g a n e s e ( m g / L ) .
Dissolved Manganese (<0.22 µm) Total Manganese (entire bar height)
Figure D.34: Utility 216 - Distribution water quality & manganese data as a function of
location
©2006 AwwaRF. All Rights Reserved.
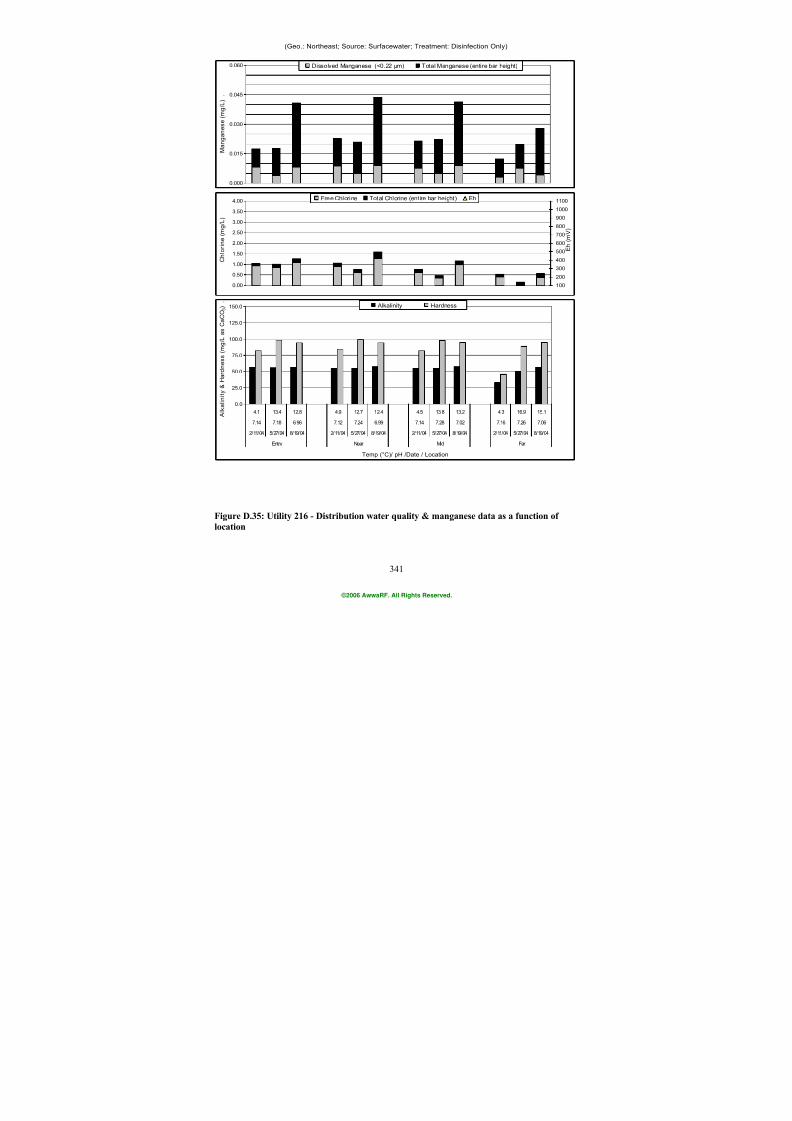
7/21/2019 Occurrence of Manganese in Drinking Water and Manganese Control
http://slidepdf.com/reader/full/occurrence-of-manganese-in-drinking-water-and-manganese-control 367/463
341
(Geo.: Northeast; Source: Surfacewater; Treatment: Disinfection Only)
0.000
0.015
0.030
0.045
0.060
M a n g a n e s e ( m g / L ) .
Dissolved Manganese (<0.22 µm) Total Manganese (entire bar height)
0.0
25.0
50.0
75.0
100.0
125.0
150.0
4.1 13.4 12.8 4.9 12.7 12.4 4.5 13.8 13.2 4.3 16.9 15.1
7.14 7.18 6.96 7.12 7.24 6.99 7.14 7.28 7.02 7.16 7.26 7.06
2/11/04 5/27/04 8/19/04 2/11/04 5/27/04 8/19/04 2/11/04 5/27/04 8/19/04 2/11/04 5/27/04 8/19/04
Entry Near Mid Far
Temp (°C)/ pH /Date / Location
A l k a l i n i t y &
H a r d n e s s
( m g / L a s C a C O 3 ) .
Alkalinity Hardness
0.00
0.50
1.00
1.50
2.00
2.50
3.00
3.50
4.00
C h l o r i n e
( m g / L )
100
200
300
400
500
600
700
800
900
1000
1100
E h ( m
V )
Free Chlorine Total Chlorine (entire bar height) Eh
Figure D.35: Utility 216 - Distribution water quality & manganese data as a function of
location
©2006 AwwaRF. All Rights Reserved.
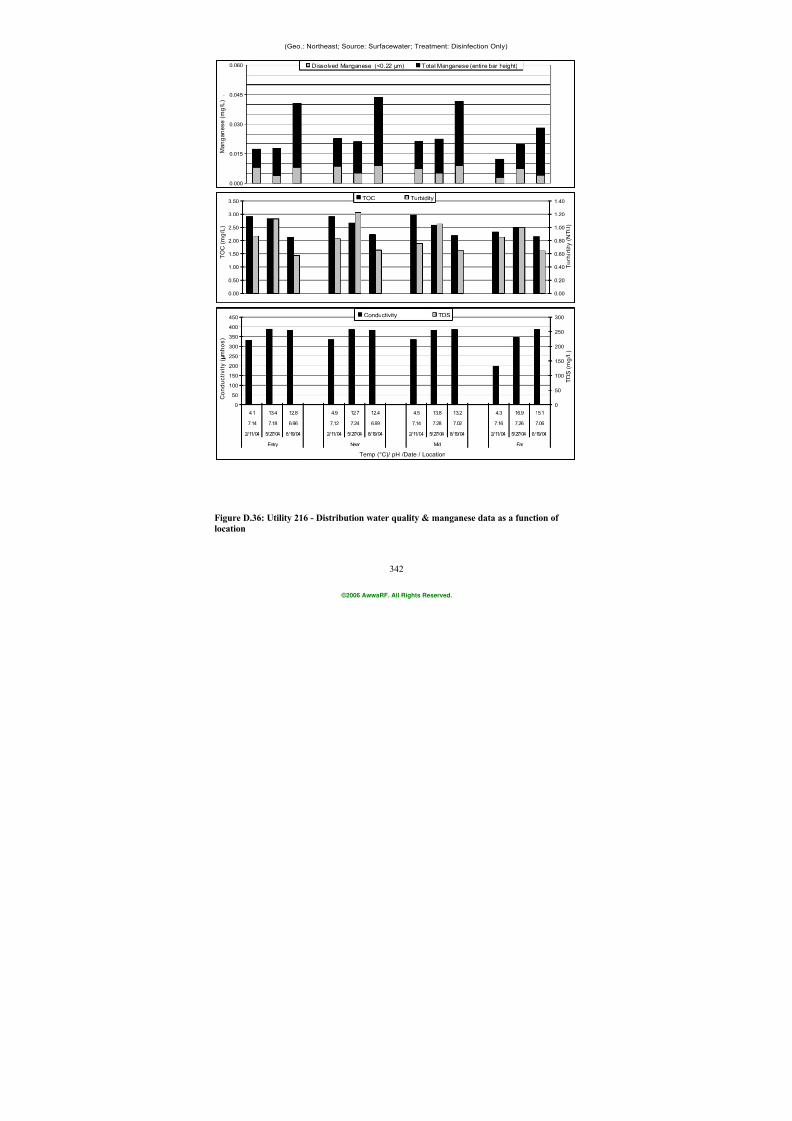
7/21/2019 Occurrence of Manganese in Drinking Water and Manganese Control
http://slidepdf.com/reader/full/occurrence-of-manganese-in-drinking-water-and-manganese-control 368/463
342
(Geo.: Northeast; Source: Surfacewater; Treatment: Disinfection Only)
0.00
0.50
1.00
1.50
2.00
2.50
3.00
3.50
T O C
( m g / L )
0.00
0.20
0.40
0.60
0.80
1.00
1.20
1.40
T u r b i d i t y ( N
T U )
TOC Turbidity
0
50
100
150
200
250
300
350
400
450
4.1 13.4 12.8 4.9 12.7 12.4 4.5 13.8 13.2 4.3 16.9 15.1
7.14 7.18 6.96 7.12 7.24 6.99 7.14 7.28 7.02 7.16 7.26 7.06
2/11/04 5/27/04 8/19/04 2/11/04 5/27/04 8/19/04 2/11/04 5/27/04 8/19/04 2/11/04 5/27/04 8/19/04
Entry Near Mid Far
Temp (°C)/ pH /Date / Location
C o n d u c t i v i t y ( m h o s )
0
50
100
150
200
250
300
T D S ( m g / L )
Conductivity TDS
0.000
0.015
0.030
0.045
0.060
M a n g a n e s e ( m g / L ) .
Dissolved Manganese (<0.22 µm) Total Manganese (entire bar height)
Figure D.36: Utility 216 - Distribution water quality & manganese data as a function of
location
©2006 AwwaRF. All Rights Reserved.
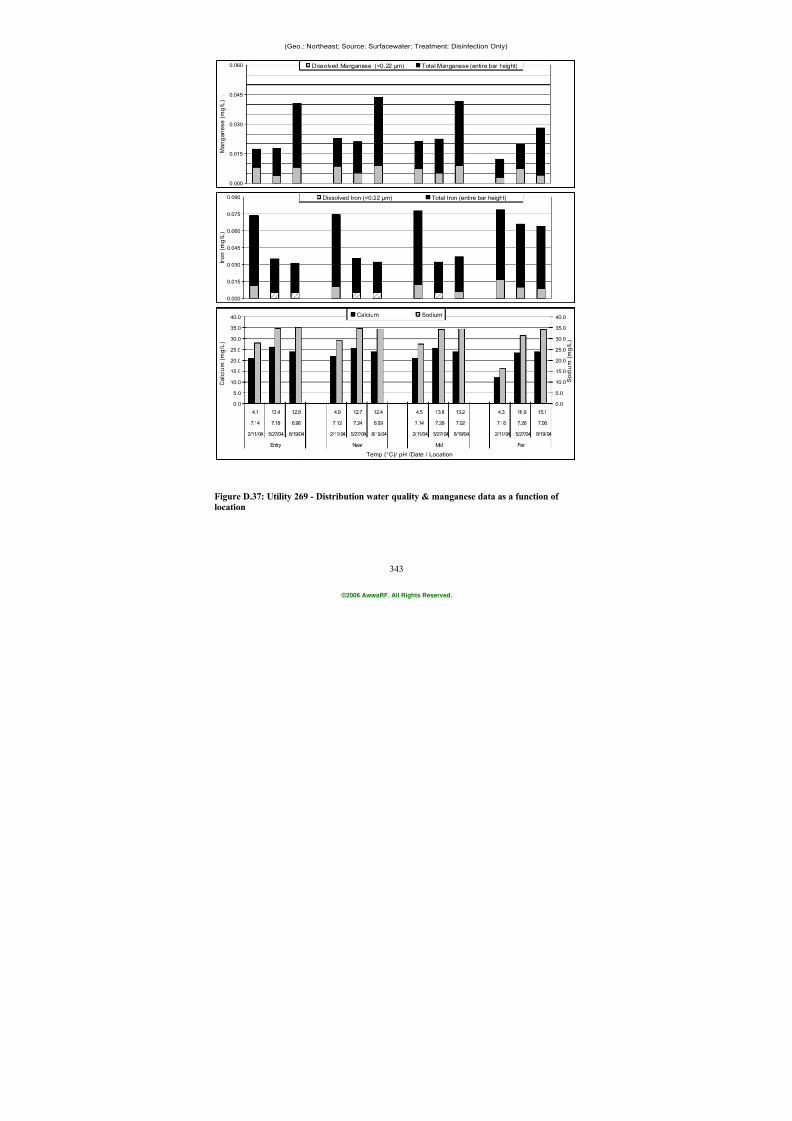
7/21/2019 Occurrence of Manganese in Drinking Water and Manganese Control
http://slidepdf.com/reader/full/occurrence-of-manganese-in-drinking-water-and-manganese-control 369/463
343
(Geo.: Northeast; Source: Surfacewater; Treatment: Disinfection Only)
0.0
5.0
10.0
15.0
20.0
25.0
30.0
35.0
40.0
4.1 13.4 12.8 4.9 12.7 12.4 4.5 13.8 13.2 4.3 16.9 15.1
7.14 7.18 6.96 7.12 7.24 6.99 7.14 7.28 7.02 7.16 7.26 7.06
2/11/04 5/27/04 8/19/04 2/11/04 5/27/04 8/19/04 2/11/04 5/27/04 8/19/04 2/11/04 5/27/04 8/19/04
Entry Near Mid Far
Temp (°C)/ pH /Date / Location
C a l c i u m ( m
g / L )
0.0
5.0
10.0
15.0
20.0
25.0
30.0
35.0
40.0
S o d i u m ( m
g / L )
Calcium Sodium
0.000
0.015
0.030
0.045
0.060
0.075
0.090
I r o n ( m g / L
)
Dissolved Iron (<0.22 µm) Total Iron (entire bar height)
0.000
0.015
0.030
0.045
0.060
M a n g a n e s e ( m g / L ) .
Dissolved Manganese (<0.22 µm) Total Manganese (entire bar height)
Figure D.37: Utility 269 - Distribution water quality & manganese data as a function of
location
©2006 AwwaRF. All Rights Reserved.
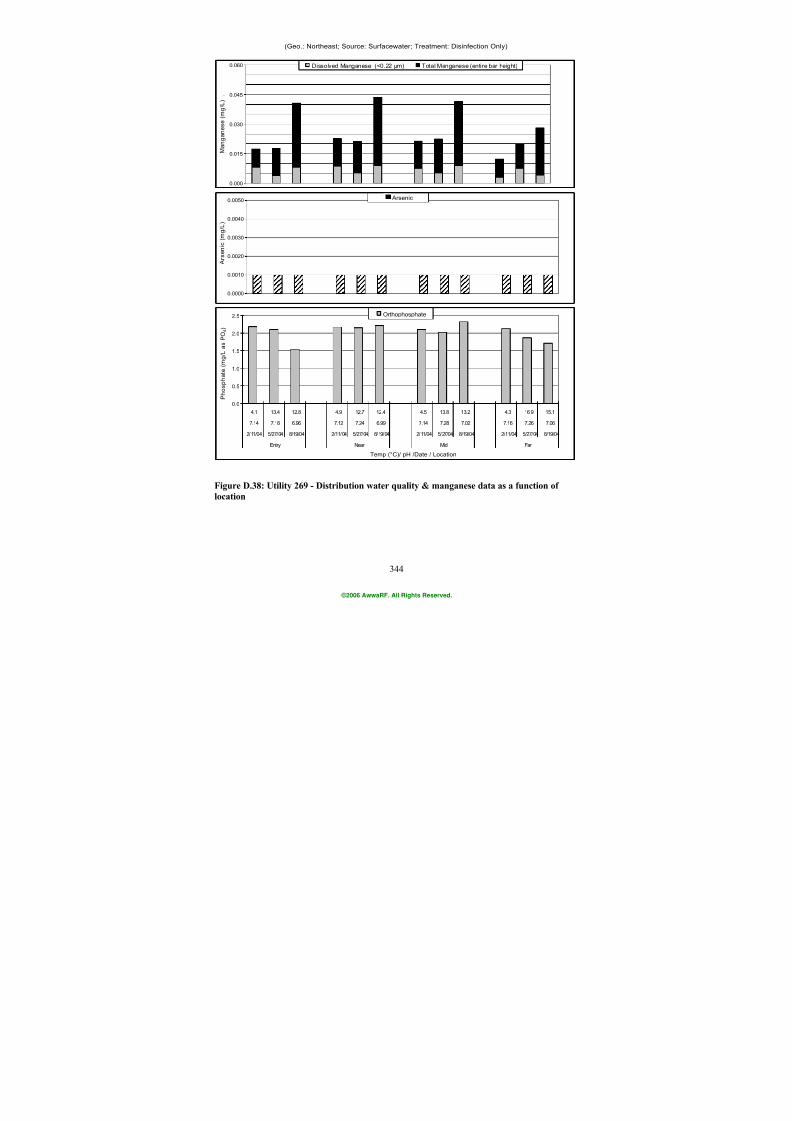
7/21/2019 Occurrence of Manganese in Drinking Water and Manganese Control
http://slidepdf.com/reader/full/occurrence-of-manganese-in-drinking-water-and-manganese-control 370/463
344
(Geo.: Northeast; Source: Surfacewater; Treatment: Disinfection Only)
0.0
0.5
1.0
1.5
2.0
2.5
4.1 13.4 12.8 4.9 12.7 12.4 4.5 13.8 13.2 4.3 16.9 15.1
7.14 7.18 6.96 7.12 7.24 6.99 7.14 7.28 7.02 7.16 7.26 7.06
2/11/04 5/27/04 8/19/04 2/11/04 5/27/04 8/19/04 2/11/04 5/27/04 8/19/04 2/11/04 5/27/04 8/19/04
Entry Near Mid Far
Temp (°C)/ pH /Date / Location
P h o s p h a t e ( m g / L a s P O 4 )
Orthophosphate
0.0000
0.0010
0.0020
0.0030
0.0040
0.0050
A r s e n i c ( m
g / L )
Arsenic
0.000
0.015
0.030
0.045
0.060
M a n g a n e s e ( m g / L ) .
Dissolved Manganese (<0.22 µm) Total Manganese (entire bar height)
Figure D.38: Utility 269 - Distribution water quality & manganese data as a function of
location
©2006 AwwaRF. All Rights Reserved.
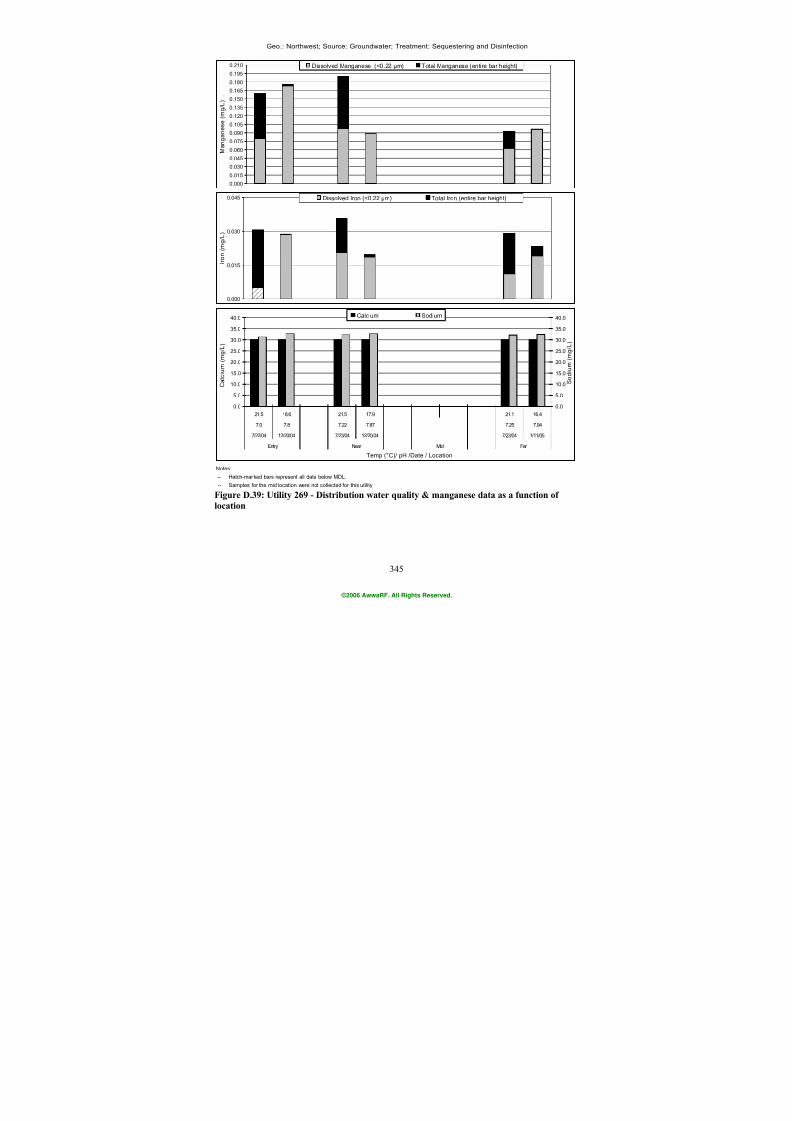
7/21/2019 Occurrence of Manganese in Drinking Water and Manganese Control
http://slidepdf.com/reader/full/occurrence-of-manganese-in-drinking-water-and-manganese-control 371/463
345
Geo.: Northwest; Source: Groundwater; Treatment: Sequestering and Disinfection
Notes:
-- Hatch-marked bars represent all data below MDL.
-- Samples for the mid location were not collected for this utility.
0.0
5.0
10.0
15.0
20.0
25.0
30.0
35.0
40.0
21.5 18.6 21.5 17.9 21.1 16.4
7.0 7.8 7.22 7.87 7.25 7.94
7/22/04 12/20/04 7/23/04 12/20/04 7/23/04 1/11/05
Entry Near Mid Far
Temp (°C)/ pH /Date / Location
C a l c i u m ( m
g / L )
0.0
5.0
10.0
15.0
20.0
25.0
30.0
35.0
40.0
S o d i u m ( m
g / L )
Calcium Sodium
0.000
0.015
0.030
0.045
I r o n ( m g / L
)
Dissolved Iron (<0.22 µm) Total Iron (entire bar height)
0.000
0.015
0.030
0.045
0.060
0.075
0.090
0.1050.120
0.135
0.150
0.165
0.180
0.195
0.210
M a n g a n e s e ( m g / L ) .
Dissolved Manganese (<0.22 µm) Total Manganese (entire bar height)
Figure D.39: Utility 269 - Distribution water quality & manganese data as a function of
location
©2006 AwwaRF. All Rights Reserved.
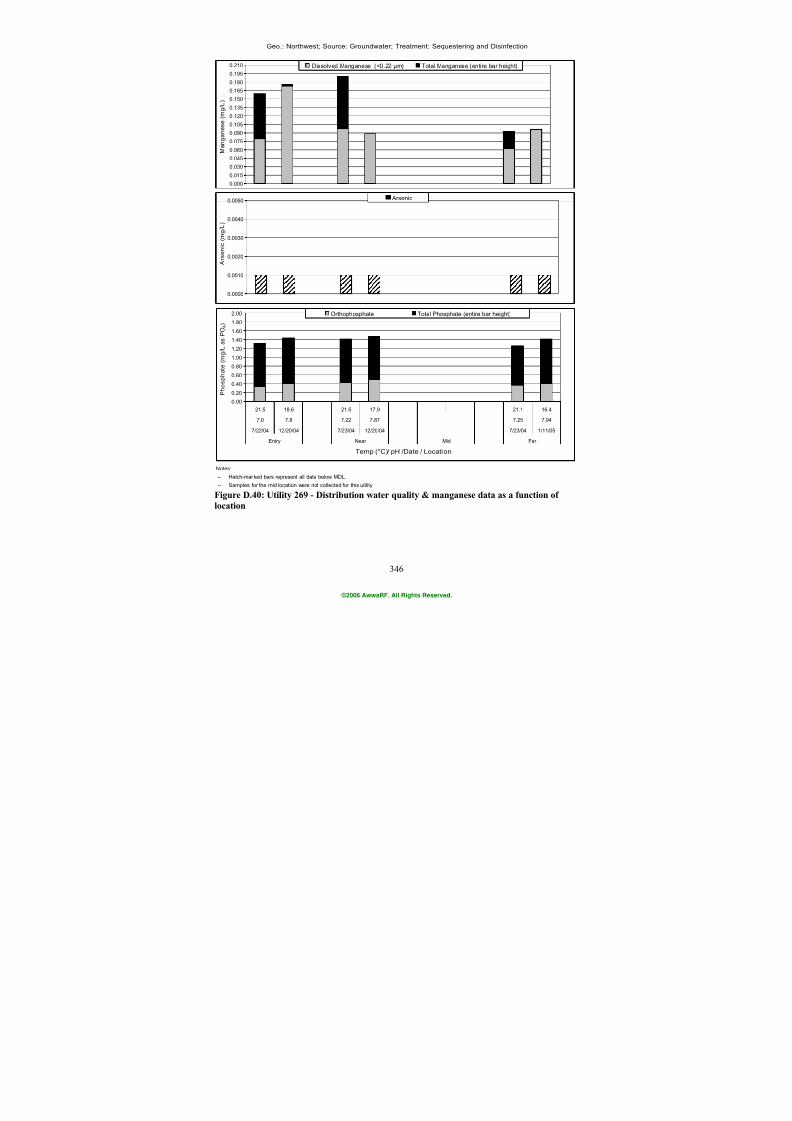
7/21/2019 Occurrence of Manganese in Drinking Water and Manganese Control
http://slidepdf.com/reader/full/occurrence-of-manganese-in-drinking-water-and-manganese-control 372/463
346
Geo.: Northwest; Source: Groundwater; Treatment: Sequestering and Disinfection
Notes:
-- Hatch-marked bars represent all data below MDL.
-- Samples for the mid location were not collected for this utility.
0.0000
0.0010
0.0020
0.0030
0.0040
0.0050
A r s e n i c ( m
g / L )
Arsenic
0.000
0.015
0.030
0.045
0.060
0.075
0.090
0.1050.120
0.135
0.150
0.165
0.180
0.195
0.210
M a n g a n e s e ( m g / L ) .
Dissolved Manganese (<0.22 µm) Total Manganese (entire bar height)
0.00
0.20
0.40
0.60
0.80
1.00
1.20
1.40
1.60
1.80
2.00
21.5 18.6 21.5 17.9 21.1 16.4
7.0 7.8 7.22 7.87 7.25 7.94
7/22/04 12/20/04 7/23/04 12/20/04 7/23/04 1/11/05
Entry Near Mid Far
Temp (°C)/ pH /Date / Location
P h o s p h a t e ( m g / L a s P O 4 )
Orthophosphate Total Phosphate (entire bar height)
Figure D.40: Utility 269 - Distribution water quality & manganese data as a function of
location
©2006 AwwaRF. All Rights Reserved.
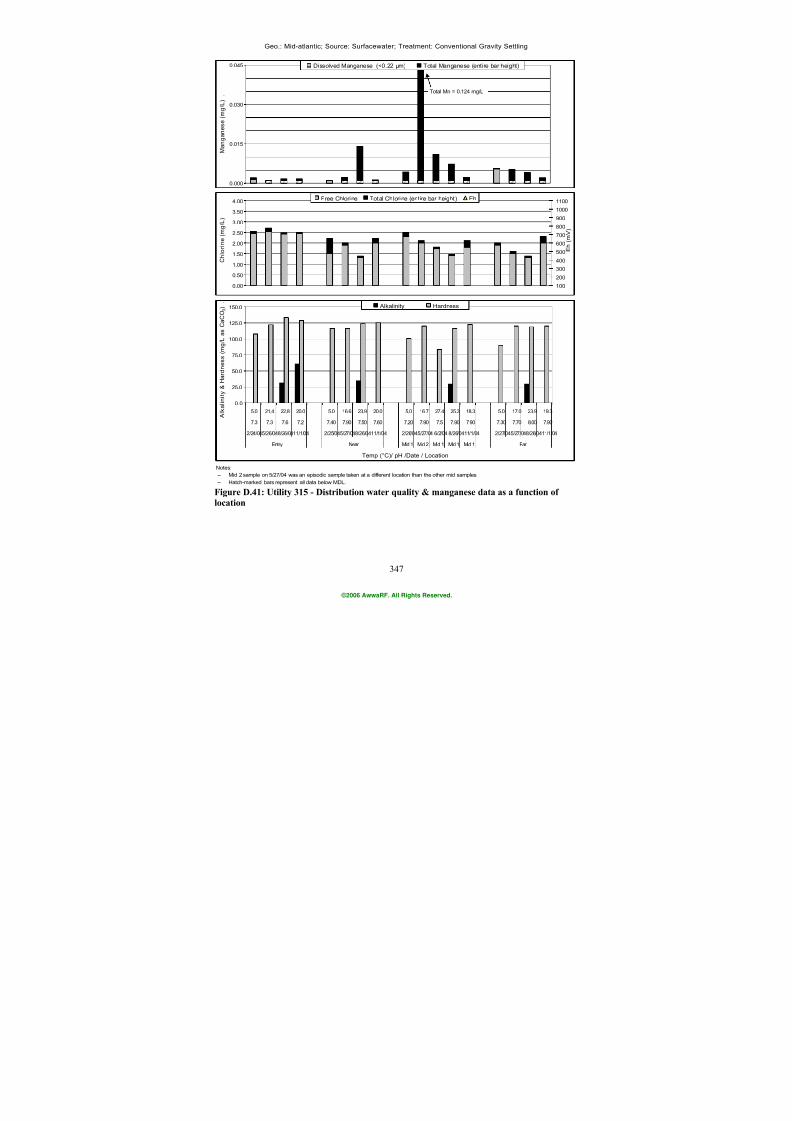
7/21/2019 Occurrence of Manganese in Drinking Water and Manganese Control
http://slidepdf.com/reader/full/occurrence-of-manganese-in-drinking-water-and-manganese-control 373/463
347
Geo.: Mid-atlantic; Source: Surfacewater; Treatment: Conventional Gravity Settling
Notes:
-- Mid 2 sample on 5/27/04 was an episodic sample taken at a different location than the other mid samples. -- Hatch-marked bars represent all data below MDL.
0.000
0.015
0.030
0.045
M a n g a n e s e ( m g / L ) .
Dissolved Manganese (<0.22 µm) Total Manganese (entire bar height)
0.0
25.0
50.0
75.0
100.0
125.0
150.0
5.0 21.4 22.8 20.0 5.0 16.6 23.9 20.0 5.0 16.7 27.4 25.3 18.3 5.0 17.0 23.9 19.3
7.3 7.3 7.6 7.2 7.40 7.90 7.50 7.60 7.20 7.90 7.5 7.90 7.90 7.30 7.70 8.00 7.90
2/24/045/26/048/26/0411/1/04 2/25/045/27/048/26/0411/1/04 2/26/045/27/04 6/2/04 8/26/0411/1/04 2/27/045/27/048/26/0411/1/04
Entry Near Mid 1 Mid 2 Mid 1 Mid 1 Mid 1 Far
Temp (°C)/ pH /Date / Location
A l k a l i n i t y &
H a r d n e s s
( m g / L a s C a C O 3 ) .
Alkalinity Hardness
0.00
0.50
1.00
1.50
2.00
2.50
3.00
3.50
4.00
C h l o r i n e
( m g / L )
100
200
300
400
500
600700
800
900
1000
1100
E h ( m
V )
Free Chlorine Total Chlorine (entire bar height) Eh
Total Mn = 0.124 mg/L
Figure D.41: Utility 315 - Distribution water quality & manganese data as a function of
location
©2006 AwwaRF. All Rights Reserved.
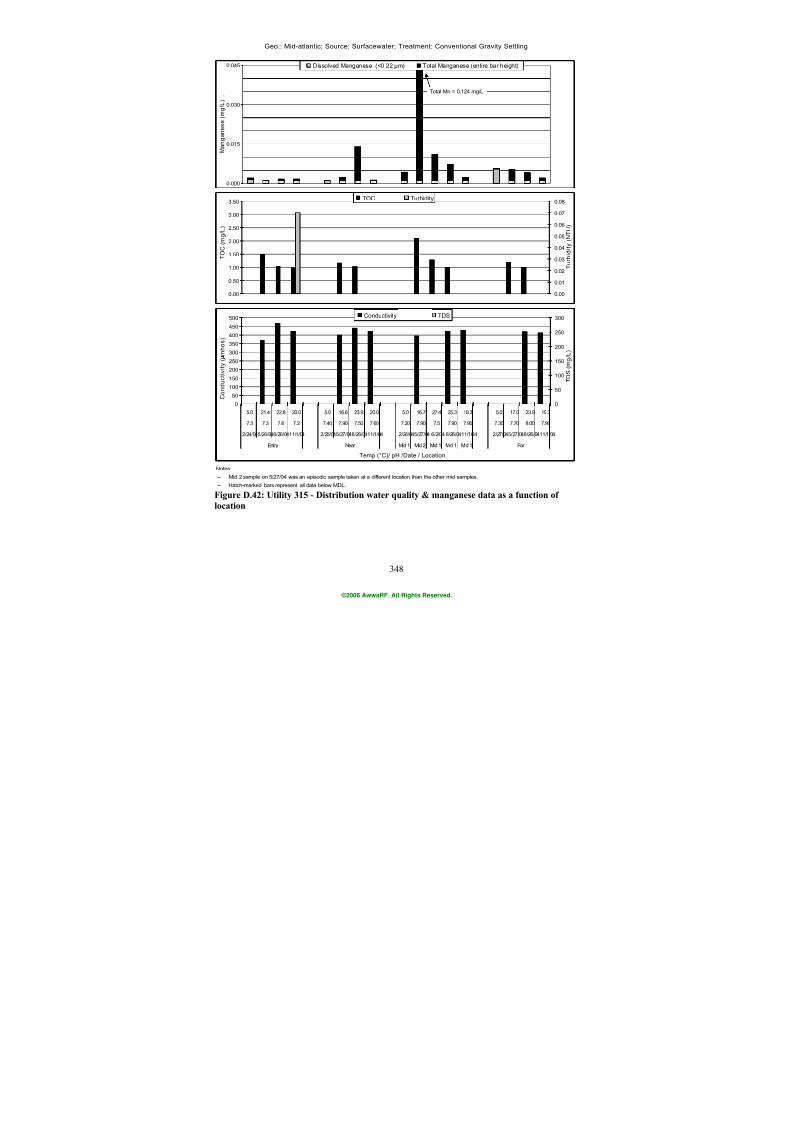
7/21/2019 Occurrence of Manganese in Drinking Water and Manganese Control
http://slidepdf.com/reader/full/occurrence-of-manganese-in-drinking-water-and-manganese-control 374/463
348
Geo.: Mid-atlantic; Source: Surfacewater; Treatment: Conventional Gravity Settling
Notes:
-- Mid 2 sample on 5/27/04 was an episodic sample taken at a different location than the other mid samples.
-- Hatch-marked bars represent all data below MDL.
0.00
0.50
1.00
1.50
2.00
2.50
3.00
3.50
T O C
( m g / L )
0.00
0.01
0.02
0.03
0.04
0.05
0.06
0.07
0.08
T u r b i d i t y ( N
T U )
TOC Turbidity
0
50
100
150
200
250
300
350
400
450
500
5.0 21.4 22.8 20.0 5.0 16.6 23.9 20.0 5.0 16.7 27.4 25.3 18.3 5.0 17.0 23.9 19.3
7.3 7.3 7.6 7.2 7.40 7.90 7.50 7.60 7.20 7.90 7.5 7.90 7.90 7.30 7.70 8.00 7.90
2/24/045/26/048/26/0411/1/04 2/25/045/27/048/26/0411/1/04 2/26/045/27/04 6/2/04 8/26/0411/1/04 2/27/045/27/048/26/0411/1/04
Entry Near Mid 1 Mid 2 Mid 1 Mid 1 Mid 1 Far
Temp (°C)/ pH /Date / Location
C o n d u c t i v i t y ( m h o s )
0
50
100
150
200
250
300
T D S ( m g / L )
Conductivity TDS
0.000
0.015
0.030
0.045
M a n g a n e s e ( m g / L ) .
Dissolved Manganese (<0.22 µm) Total Manganese (entire bar height)
Total Mn = 0.124 mg/L
Figure D.42: Utility 315 - Distribution water quality & manganese data as a function of
location
©2006 AwwaRF. All Rights Reserved.
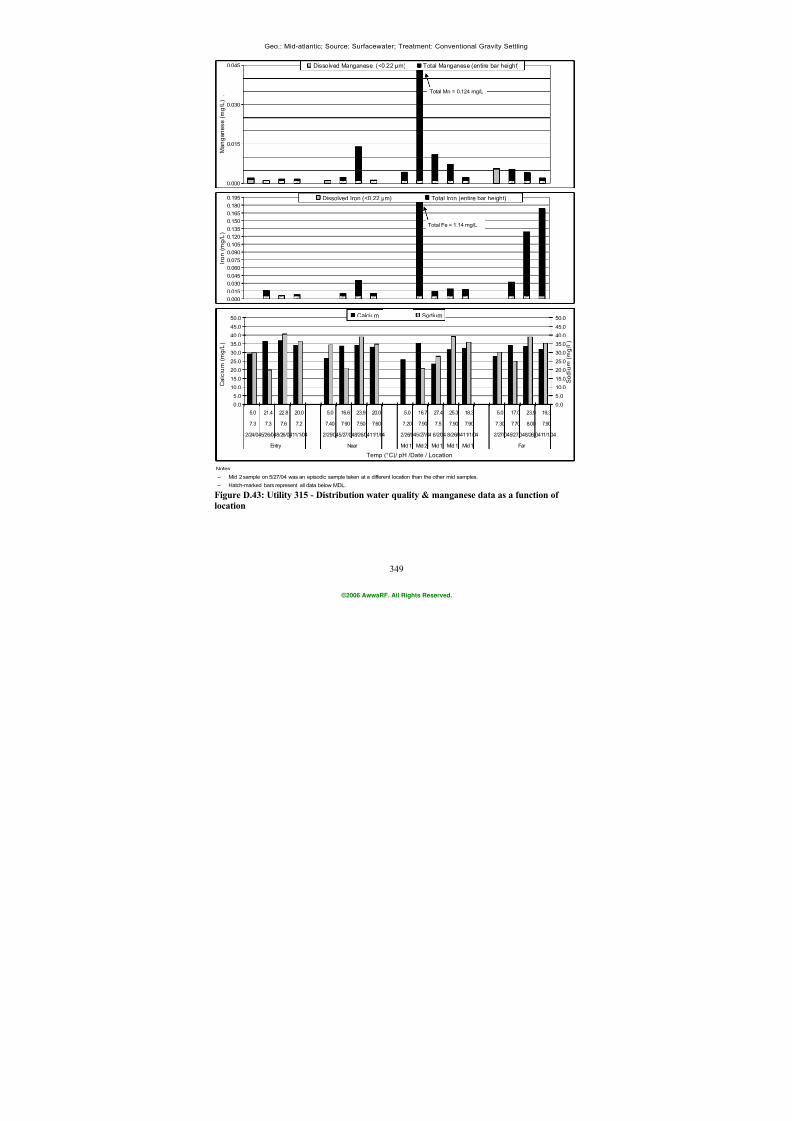
7/21/2019 Occurrence of Manganese in Drinking Water and Manganese Control
http://slidepdf.com/reader/full/occurrence-of-manganese-in-drinking-water-and-manganese-control 375/463
349
Geo.: Mid-atlantic; Source: Surfacewater; Treatment: Conventional Gravity Settling
Notes:
-- Mid 2 sample on 5/27/04 was an episodic sample taken at a different location than the other mid samples.
-- Hatch-marked bars represent all data below MDL.
0.0
5.0
10.0
15.0
20.0
25.0
30.0
35.0
40.0
45.0
50.0
5.0 21.4 22.8 20.0 5.0 16.6 23.9 20.0 5.0 16.7 27.4 25.3 18.3 5.0 17.0 23.9 19.3
7.3 7.3 7.6 7.2 7.40 7.90 7.50 7.60 7.20 7.90 7.5 7.90 7.90 7.30 7.70 8.00 7.90
2/24/045/26/048/26/0411/1/04 2/25/045/27/048/26/0411/1/04 2/26/045/27/04 6/2/04 8/26/0411/1/04 2/27/045/27/048/26/0411/1/04
Entry Near Mid 1 Mid 2 Mid 1 Mid 1 Mid 1 Far
Temp (°C)/ pH /Date / Location
C a l c i u m ( m
g / L )
0.0
5.0
10.0
15.0
20.0
25.0
30.0
35.0
40.0
45.0
50.0
S o d i u m ( m
g / L )
Calcium Sodium
0.000
0.015
0.030
0.045
0.060
0.075
0.090
0.1050.120
0.135
0.150
0.165
0.180
0.195
I r o n ( m g / L
)
Dissolved Iron (<0.22 µm) Total Iron (entire bar height)
Total Fe = 1.14 mg/L
0.000
0.015
0.030
0.045
M a n g a n e s e ( m g / L ) .
Dissolved Manganese (<0.22 µm) Total Manganese (entire bar height)
Total Mn = 0.124 mg/L
Figure D.43: Utility 315 - Distribution water quality & manganese data as a function of
location
©2006 AwwaRF. All Rights Reserved.
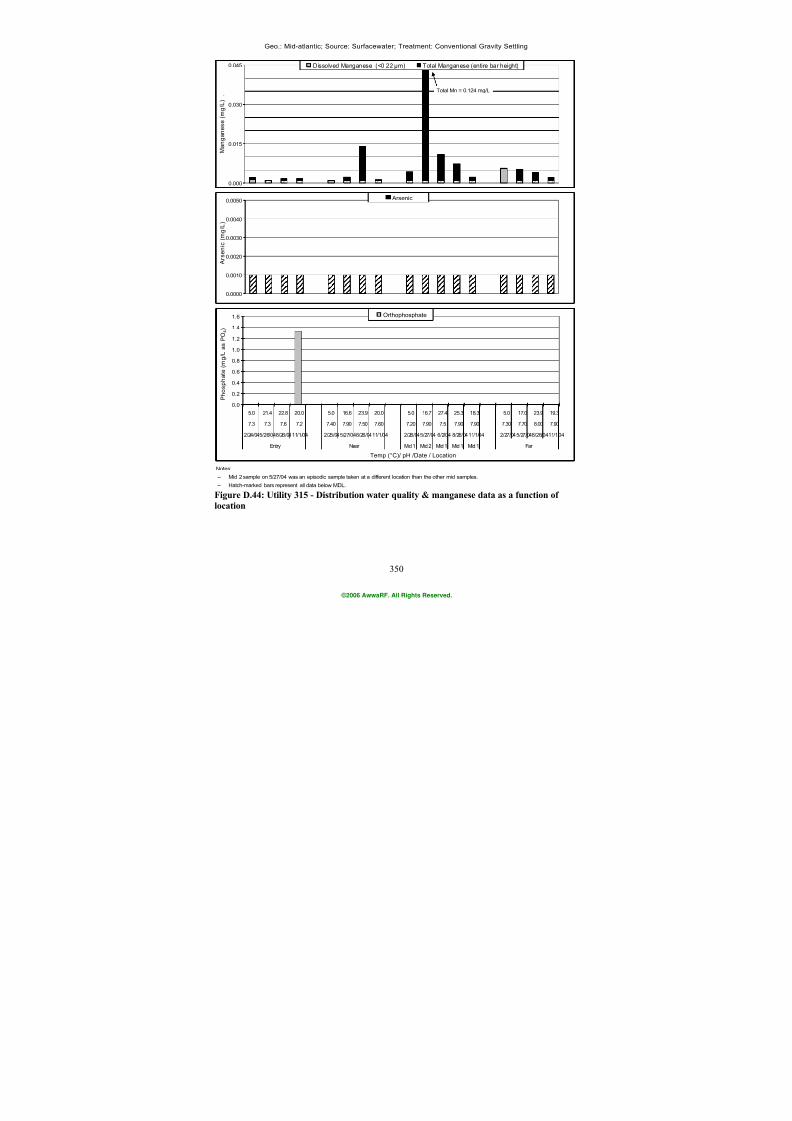
7/21/2019 Occurrence of Manganese in Drinking Water and Manganese Control
http://slidepdf.com/reader/full/occurrence-of-manganese-in-drinking-water-and-manganese-control 376/463
350
Geo.: Mid-atlantic; Source: Surfacewater; Treatment: Conventional Gravity Settling
Notes:
-- Mid 2 sample on 5/27/04 was an episodic sample taken at a different location than the other mid samples.
-- Hatch-marked bars represent all data below MDL.
0.0
0.2
0.4
0.6
0.8
1.0
1.2
1.4
1.6
5.0 21.4 22.8 20.0 5.0 16.6 23.9 20.0 5.0 16.7 27.4 25.3 18.3 5.0 17.0 23.9 19.3
7.3 7.3 7.6 7.2 7.40 7.90 7.50 7.60 7.20 7.90 7.5 7.90 7.90 7.30 7.70 8.00 7.90
2/24/045/26/048/26/0411/1/04 2/25/045/27/048/26/0411/1/04 2/26/045/27/04 6/2/04 8/26/0411/1/04 2/27/045/27/048/26/0411/1/04
Entry Near Mid 1 Mid 2 Mid 1 Mid 1 Mid 1 Far
Temp (°C)/ pH /Date / Location
P h o s p h a t e ( m g /
L a s P O 4 )
Orthophosphate
0.0000
0.0010
0.0020
0.0030
0.0040
0.0050
A r s e n i c ( m
g / L )
Arsenic
0.000
0.015
0.030
0.045
M a n g a n e s e ( m g / L ) .
Dissolved Manganese (<0.22 µm) Total Manganese (entire bar height)
Total Mn = 0.124 mg/L
Figure D.44: Utility 315 - Distribution water quality & manganese data as a function of
location
©2006 AwwaRF. All Rights Reserved.
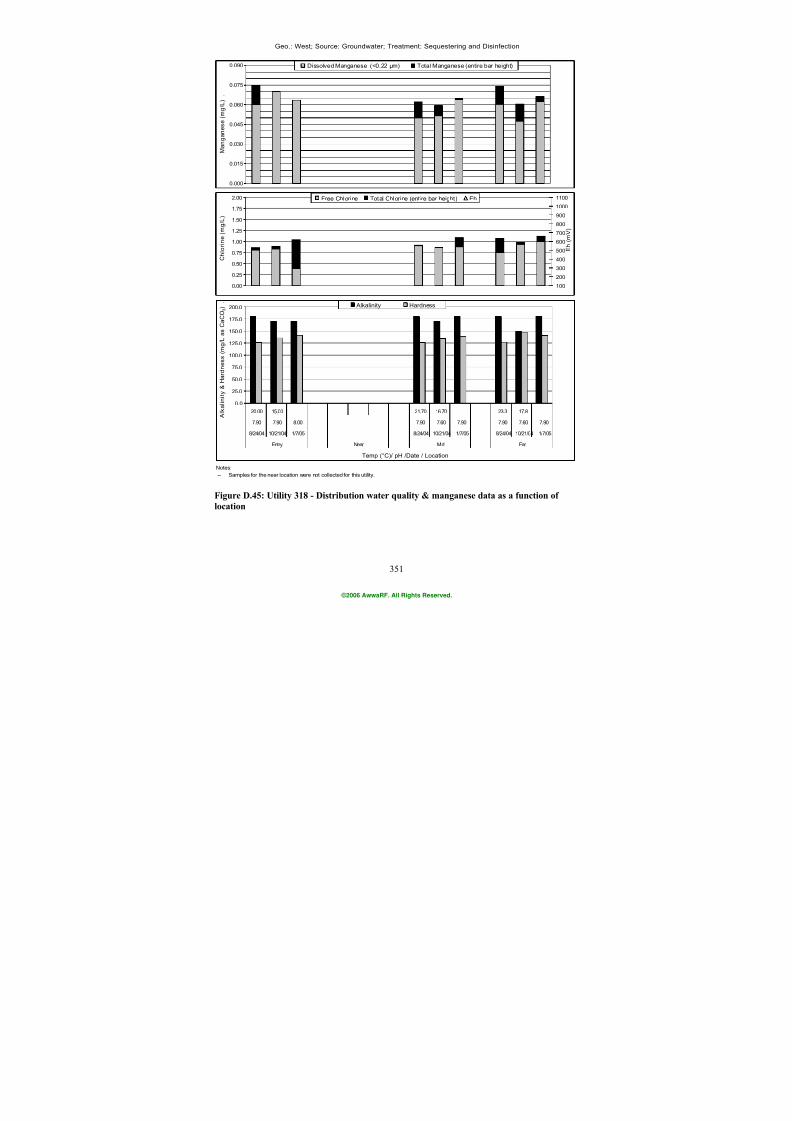
7/21/2019 Occurrence of Manganese in Drinking Water and Manganese Control
http://slidepdf.com/reader/full/occurrence-of-manganese-in-drinking-water-and-manganese-control 377/463
351
Geo.: West; Source: Groundwater; Treatment: Sequestering and Disinfection
Notes:
-- Samples for the near location were not collected for this utility.
0.000
0.015
0.030
0.045
0.060
0.075
0.090
M a n g a n e s e ( m g / L ) .
Dissolved Manganese (<0.22 µm) Total Manganese (entire bar height)
0.0
25.0
50.0
75.0
100.0
125.0
150.0
175.0
200.0
20.00 15.00 21.70 16.70 23.3 17.8
7.90 7.90 8.00 7.90 7.60 7.90 7.90 7.60 7.90
8/24/04 10/21/04 1/7/05 8/24/04 10/21/04 1/7/05 8/24/04 10/21/04 1/7/05
Entry Near Mid Far
Temp (°C)/ pH /Date / Location
A l k a l i n i t y &
H a r d n e s s
( m g / L a s C a C O 3 ) .
Alkalinity Hardness
0.00
0.25
0.50
0.75
1.00
1.25
1.50
1.75
2.00
C h l o r i n e
( m g / L )
100
200
300
400
500
600
700
800
900
1000
1100
E h ( m
V )
Free Chlorine Total Chlorine (entire bar height) Eh
Figure D.45: Utility 318 - Distribution water quality & manganese data as a function of
location
©2006 AwwaRF. All Rights Reserved.
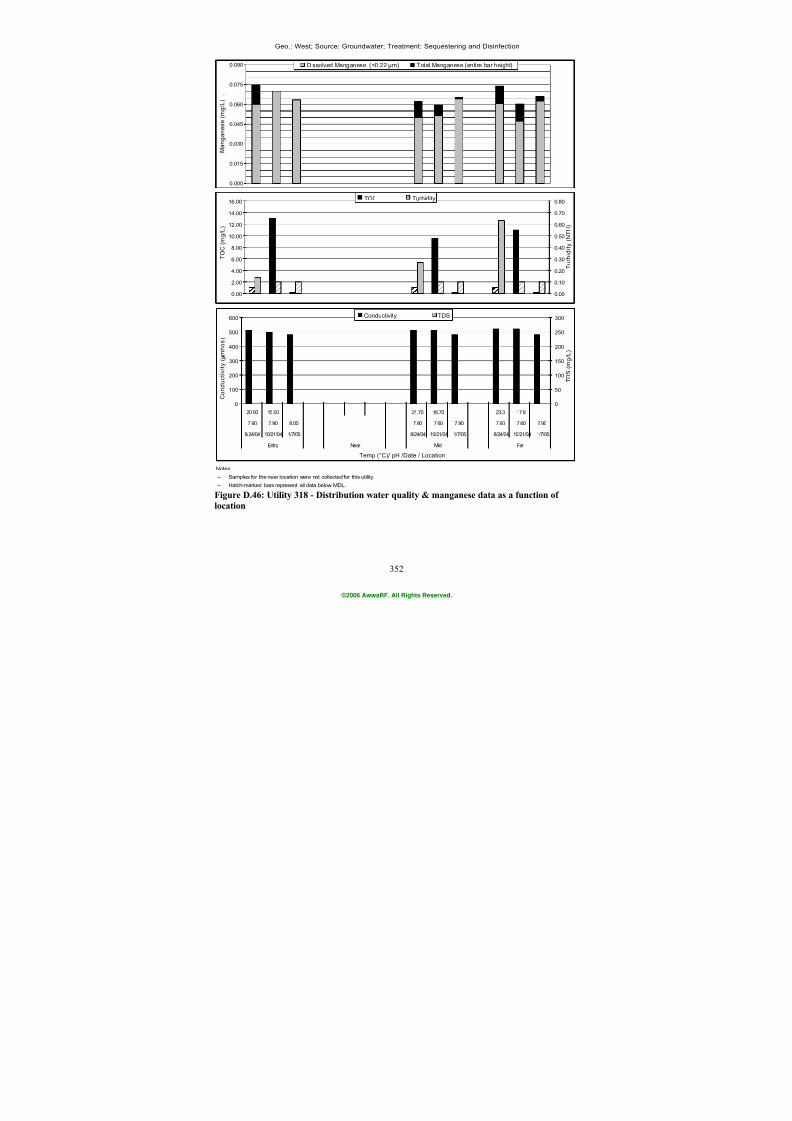
7/21/2019 Occurrence of Manganese in Drinking Water and Manganese Control
http://slidepdf.com/reader/full/occurrence-of-manganese-in-drinking-water-and-manganese-control 378/463
352
Geo.: West; Source: Groundwater; Treatment: Sequestering and Disinfection
Notes:
-- Samples for the near location were not collected for this utility.
-- Hatch-marked bars represent all data below MDL.
0.00
2.00
4.00
6.00
8.00
10.00
12.00
14.00
16.00
T O C
( m g / L )
0.00
0.10
0.20
0.30
0.40
0.50
0.60
0.70
0.80
T u r b i d i t y ( N
T U )
TOC Turbidity
0
100
200
300
400
500
600
20.00 15.00 21.70 16.70 23.3 17.8
7.90 7.90 8.00 7.90 7.60 7.90 7.90 7.60 7.90
8/24/04 10/21/04 1/7/05 8/24/04 10/21/04 1/7/05 8/24/04 10/21/04 1/7/05
Entry Near Mid Far
Temp (°C)/ pH /Date / Location
C o n d u c t i v i t y ( m h o s )
0
50
100
150
200
250
300
T D S ( m g / L )
Conductivity TDS
0.000
0.015
0.030
0.045
0.060
0.075
0.090
M a n g a n e s e ( m g / L ) .
Dissolved Manganese (<0.22 µm) Total Manganese (entire bar height)
Figure D.46: Utility 318 - Distribution water quality & manganese data as a function of
location
©2006 AwwaRF. All Rights Reserved.
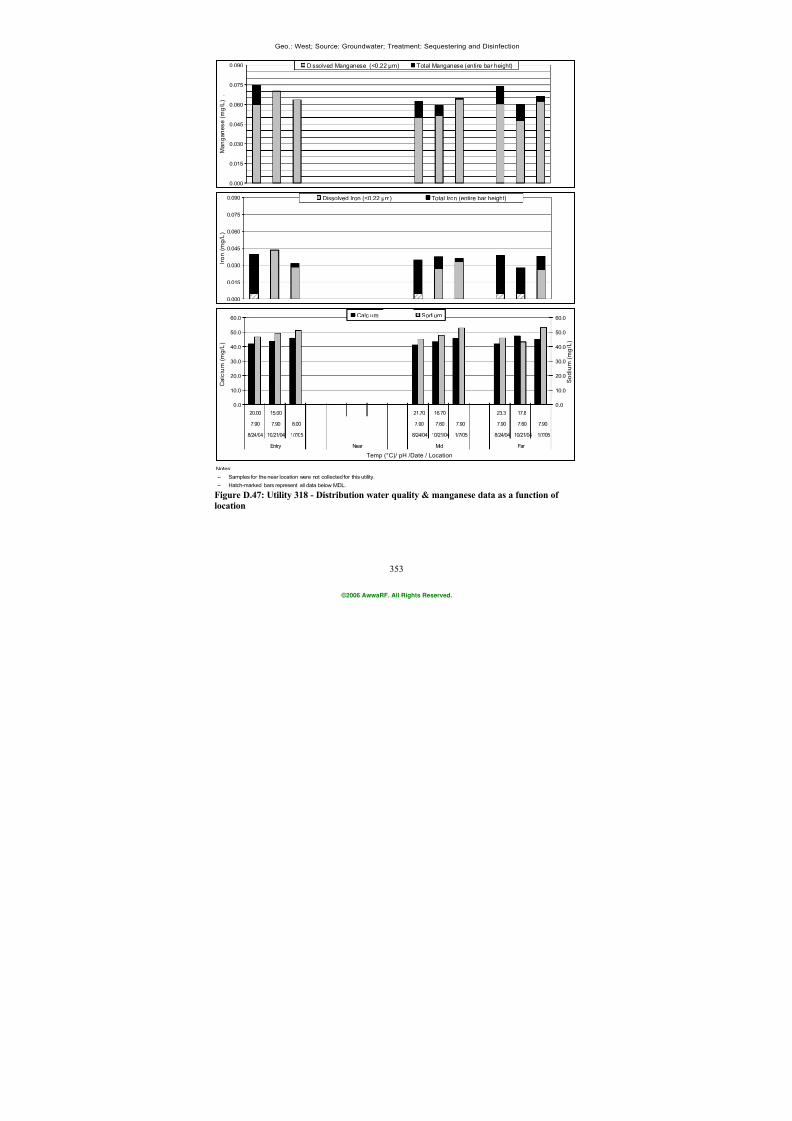
7/21/2019 Occurrence of Manganese in Drinking Water and Manganese Control
http://slidepdf.com/reader/full/occurrence-of-manganese-in-drinking-water-and-manganese-control 379/463
353
Geo.: West; Source: Groundwater; Treatment: Sequestering and Disinfection
Notes:
-- Samples for the near location were not collected for this utility.
-- Hatch-marked bars represent all data below MDL.
0.0
10.0
20.0
30.0
40.0
50.0
60.0
20.00 15.00 21.70 16.70 23.3 17.8
7.90 7.90 8.00 7.90 7.60 7.90 7.90 7.60 7.90
8/24/04 10/21/04 1/7/05 8/24/04 10/21/04 1/7/05 8/24/04 10/21/04 1/7/05
Entry Near Mid Far
Temp (°C)/ pH /Date / Location
C a l c i u m ( m
g / L )
0.0
10.0
20.0
30.0
40.0
50.0
60.0
S o d i u m ( m
g / L )
Calcium Sodium
0.000
0.015
0.030
0.045
0.060
0.075
0.090
I r o n ( m g / L
)
Dissolved Iron (<0.22 µm) Total Iron (entire bar height)
0.000
0.015
0.030
0.045
0.060
0.075
0.090
M a n g a n e s e ( m g / L ) .
Dissolved Manganese (<0.22 µm) Total Manganese (entire bar height)
Figure D.47: Utility 318 - Distribution water quality & manganese data as a function of
location
©2006 AwwaRF. All Rights Reserved.
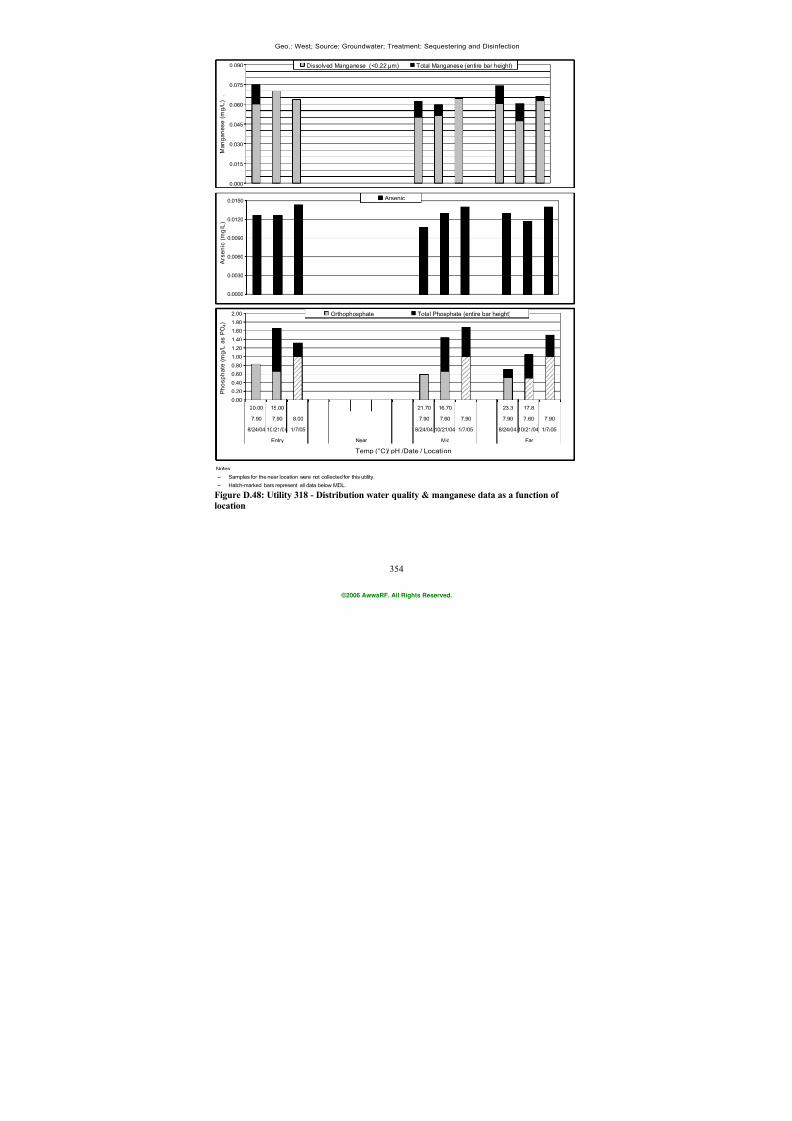
7/21/2019 Occurrence of Manganese in Drinking Water and Manganese Control
http://slidepdf.com/reader/full/occurrence-of-manganese-in-drinking-water-and-manganese-control 380/463
354
Geo.: West; Source: Groundwater; Treatment: Sequestering and Disinfection
Notes:
-- Samples for the near location were not collected for this utility.
-- Hatch-marked bars represent all data below MDL.
0.0000
0.0030
0.0060
0.0090
0.0120
0.0150
A r s e n i c ( m
g / L )
Arsenic
0.000
0.015
0.030
0.045
0.060
0.075
0.090
M a n g a n e s e ( m g / L ) .
Dissolved Manganese (<0.22 µm) Total Manganese (entire bar height)
0.00
0.20
0.40
0.60
0.80
1.00
1.20
1.40
1.60
1.80
2.00
20.00 15.00 21.70 16.70 23.3 17.8
7.90 7.90 8.00 7.90 7.60 7.90 7.90 7.60 7.90
8/24/04 10/21/04 1/7/05 8/24/04 10/21/04 1/7/05 8/24/04 10/21/04 1/7/05
Entry Near Mid Far
Temp (°C)/ pH /Date / Location
P h o s p h a t e ( m
g / L a s P O 4 )
Orthophosphate Total Phosphate (entire bar height)
Figure D.48: Utility 318 - Distribution water quality & manganese data as a function of
location
©2006 AwwaRF. All Rights Reserved.
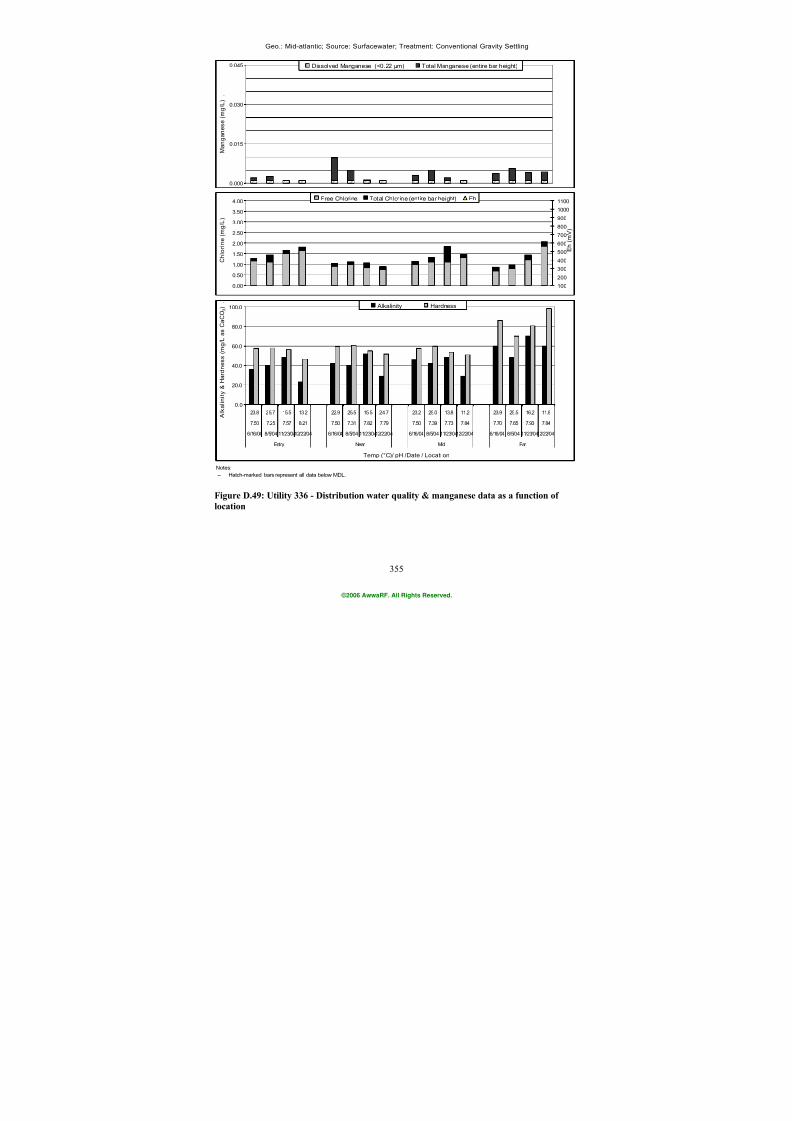
7/21/2019 Occurrence of Manganese in Drinking Water and Manganese Control
http://slidepdf.com/reader/full/occurrence-of-manganese-in-drinking-water-and-manganese-control 381/463
355
Geo.: Mid-atlantic; Source: Surfacewater; Treatment: Conventional Gravity Settling
Notes:
-- Hatch-marked bars represent all data below MDL.
0.000
0.015
0.030
0.045
M a n g a n e s e ( m g / L ) .
Dissolved Manganese (<0.22 µm) Total Manganese (entire bar height)
0.0
20.0
40.0
60.0
80.0
100.0
23.8 25.7 15.5 13.2 22.9 25.5 15.5 24.7 23.2 25.0 13.8 11.2 23.9 25.5 16.2 11.8
7.50 7.25 7.57 8.21 7.50 7.31 7.82 7.79 7.50 7.39 7.73 7.84 7.70 7.65 7.93 7.84
6/16/04 8/5/04 11/23/0412/22/04 6/16/04 8/5/04 11/23/0412/22/04 6/16/04 8/5/04 11/23/0412/22/04 6/16/04 8/5/04 11/23/0412/22/04
Entry Near Mid Far
Temp (°C)/ pH /Date / Locati on
A l k a l i n i t y &
H a r d n e s s
( m g / L a s C a C O 3 ) .
Alkalinity Hardness
0.00
0.50
1.00
1.50
2.00
2.50
3.00
3.50
4.00
C h l o r i n e
( m g / L )
100
200
300
400
500
600700
800
900
1000
1100
E h ( m
V )
Free Chlorine Total Chlorine (entire bar height) Eh
Figure D.49: Utility 336 - Distribution water quality & manganese data as a function of
location
©2006 AwwaRF. All Rights Reserved.
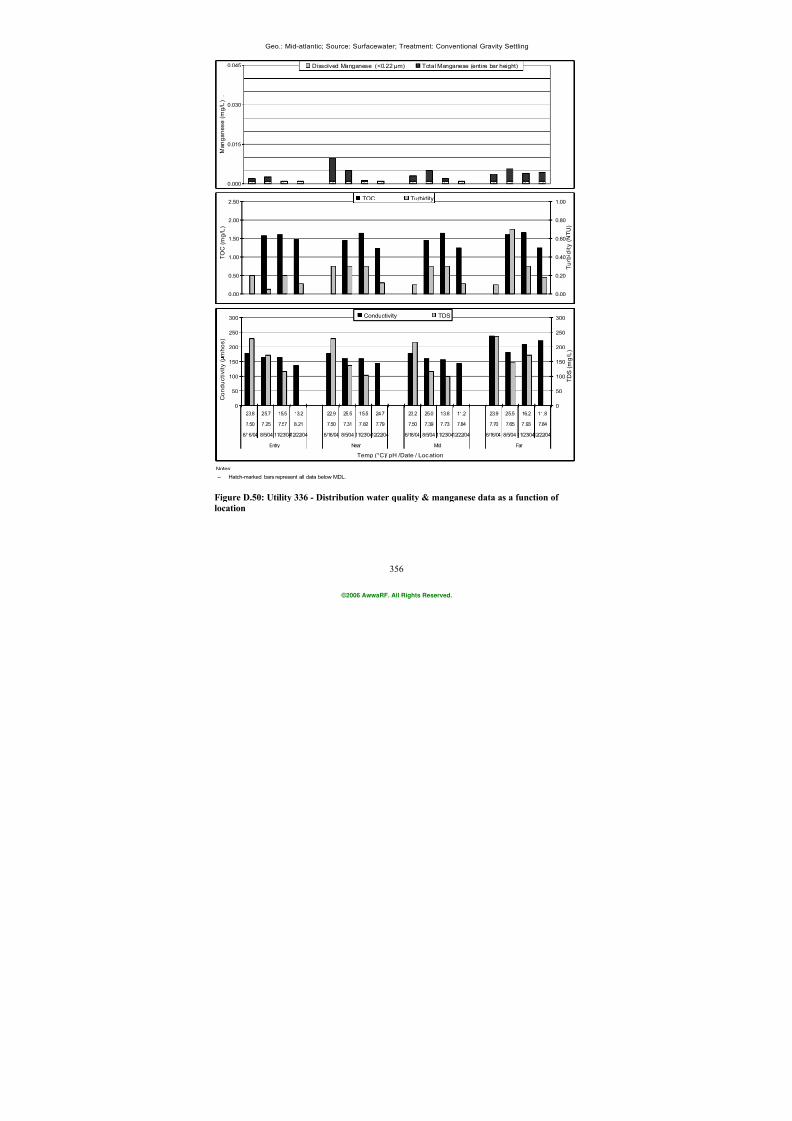
7/21/2019 Occurrence of Manganese in Drinking Water and Manganese Control
http://slidepdf.com/reader/full/occurrence-of-manganese-in-drinking-water-and-manganese-control 382/463
356
Geo.: Mid-atlantic; Source: Surfacewater; Treatment: Conventional Gravity Settling
Notes:
-- Hatch-marked bars represent all data below MDL.
0.00
0.50
1.00
1.50
2.00
2.50
T O C
( m g / L )
0.00
0.20
0.40
0.60
0.80
1.00
T u r b i d i t y ( N
T U )
TOC Turbidity
0
50
100
150
200
250
300
23.8 25.7 15.5 13.2 22.9 25.5 15.5 24.7 23.2 25.0 13.8 11.2 23.9 25.5 16.2 11.8
7.50 7.25 7.57 8.21 7.50 7.31 7.82 7.79 7.50 7.39 7.73 7.84 7.70 7.65 7.93 7.84
6/16/04 8/5/04 11/23/0412/22/04 6/16/04 8/5/04 11/23/0412/22/04 6/16/04 8/5/04 11/23/0412/22/04 6/16/04 8/5/04 11/23/0412/22/04
Entry Near Mid Far
Temp (°C)/ pH /Date / Location
C o n d u c t i v i t y ( m
h o s )
0
50
100
150
200
250
300
T D S ( m g / L )
Conductivity TDS
0.000
0.015
0.030
0.045
M a n g a n e s e ( m g / L ) .
Dissolved Manganese (<0.22 µm) Total Manganese (entire bar height)
Figure D.50: Utility 336 - Distribution water quality & manganese data as a function of
location
©2006 AwwaRF. All Rights Reserved.
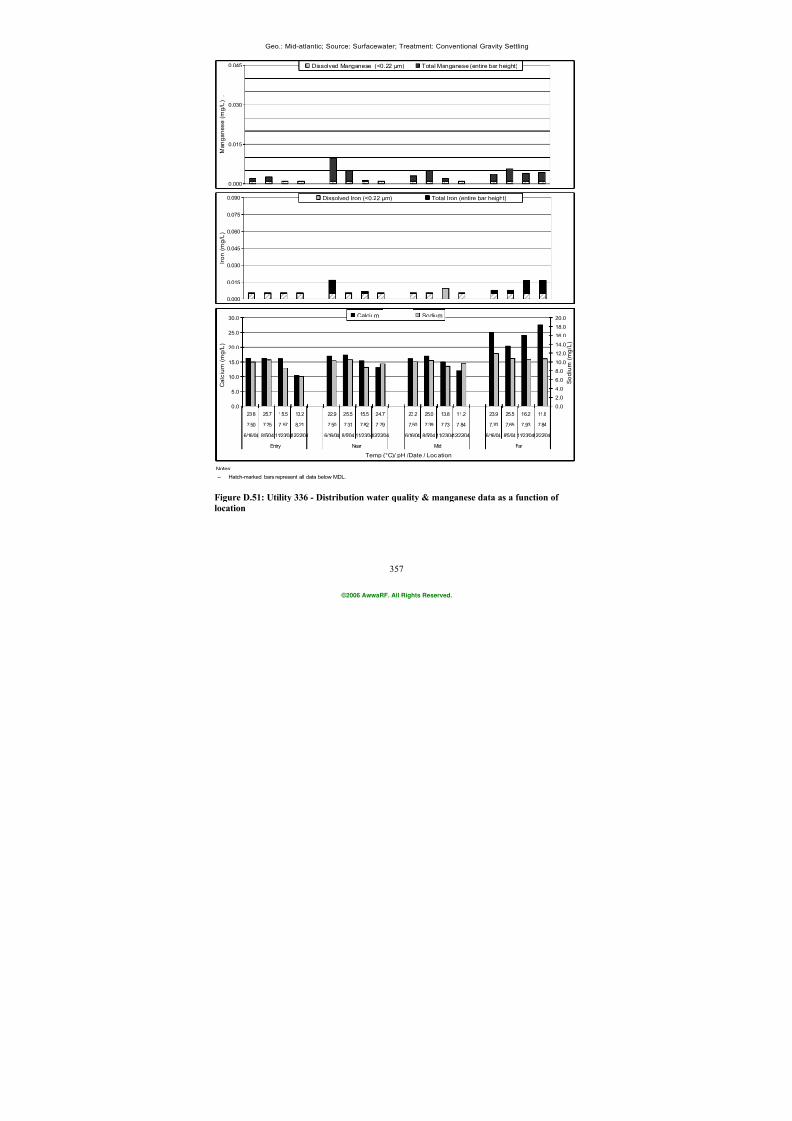
7/21/2019 Occurrence of Manganese in Drinking Water and Manganese Control
http://slidepdf.com/reader/full/occurrence-of-manganese-in-drinking-water-and-manganese-control 383/463
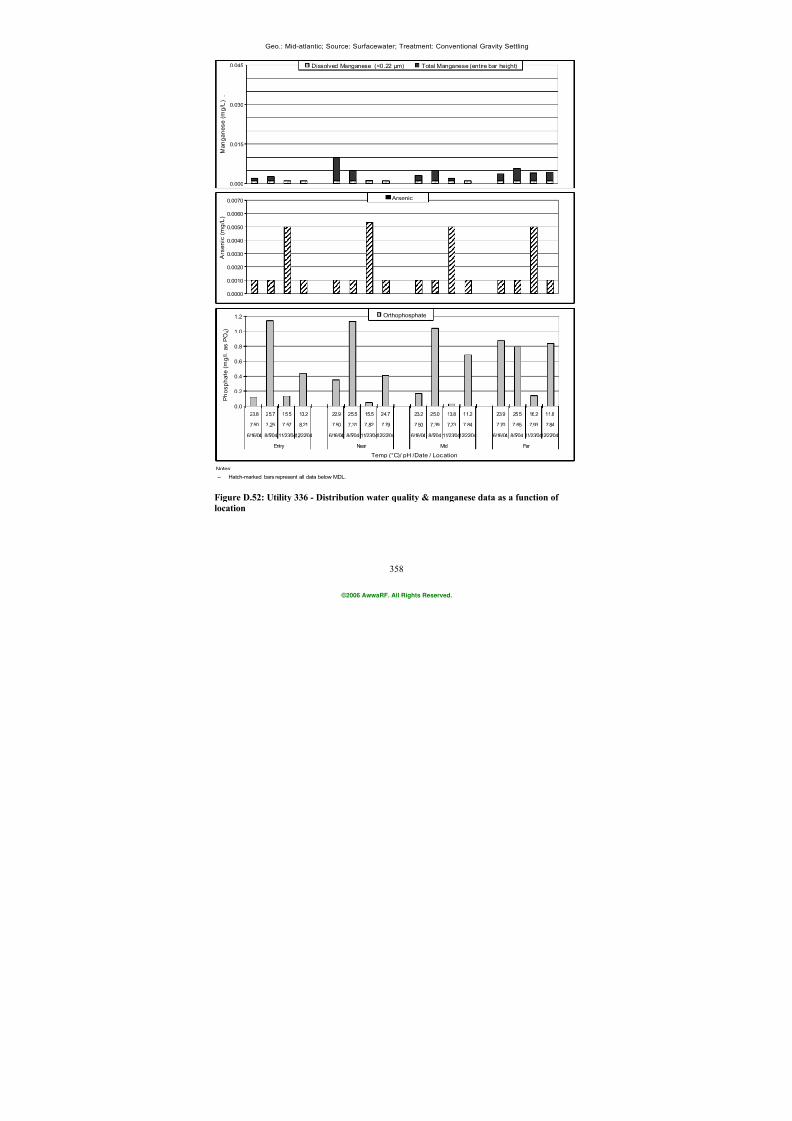
7/21/2019 Occurrence of Manganese in Drinking Water and Manganese Control
http://slidepdf.com/reader/full/occurrence-of-manganese-in-drinking-water-and-manganese-control 384/463
358
Geo.: Mid-atlantic; Source: Surfacewater; Treatment: Conventional Gravity Settling
Notes:
-- Hatch-marked bars represent all data below MDL.
0.0
0.2
0.4
0.6
0.8
1.0
1.2
23.8 25.7 15.5 13.2 22.9 25.5 15.5 24.7 23.2 25.0 13.8 11.2 23.9 25.5 16.2 11.8
7.50 7.25 7.57 8.21 7.50 7.31 7.82 7.79 7.50 7.39 7.73 7.84 7.70 7.65 7.93 7.84
6/16/04 8/5/04 11/23/0412/22/04 6/16/04 8/5/04 11/23/0412/22/04 6/16/04 8/5/04 11/23/0412/22/04 6/16/04 8/5/04 11/23/0412/22/04
Entry Near Mid Far
Temp (°C)/ pH /Date / Location
P h o s p h a t e ( m g / L a s P O 4 )
Orthophosphate
0.0000
0.0010
0.0020
0.0030
0.0040
0.0050
0.0060
0.0070
A r s e n i c
( m g / L )
Arsenic
0.000
0.015
0.030
0.045
M a n g a n e s e ( m g / L ) .
Dissolved Manganese (<0.22 µm) Total Manganese (entire bar height)
Figure D.52: Utility 336 - Distribution water quality & manganese data as a function of
location
©2006 AwwaRF. All Rights Reserved.
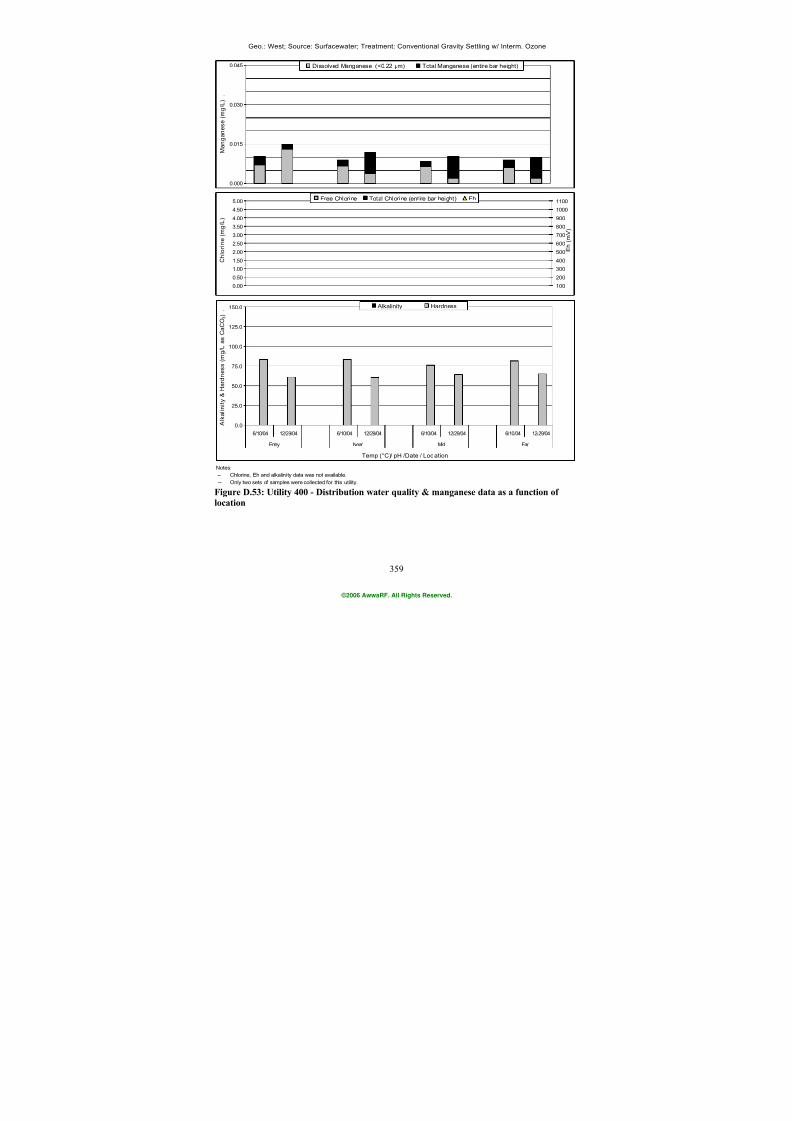
7/21/2019 Occurrence of Manganese in Drinking Water and Manganese Control
http://slidepdf.com/reader/full/occurrence-of-manganese-in-drinking-water-and-manganese-control 385/463
359
Geo.: West; Source: Surfacewater; Treatment: Conventional Gravity Settling w/ Interm. Ozone
Notes:
-- Chlorine, Eh and alkalini ty data was not available. -- Only two sets of samples were collected for this utility.
0.000
0.015
0.030
0.045
M a n g a n e s e ( m g / L ) .
Dissolved Manganese (<0.22 µm) Total Manganese (entire bar height)
0.0
25.0
50.0
75.0
100.0
125.0
150.0
6/10/04 12/29/04 6/10/04 12/29/04 6/10/04 12/29/04 6/10/04 12/29/04
Entry Near Mid Far
Temp (°C)/ pH /Date / Location
A l k a l i n i t y &
H a r d n e s s ( m
g / L a s C a C O 3 ) .
Alkalinity Hardness
0.00
0.50
1.00
1.50
2.00
2.503.00
3.50
4.00
4.50
5.00
C h l o r i n e
( m g / L )
100
200
300
400
500
600700
800
900
1000
1100
E h ( m
V )
Free Chlorine Total Chlorine (entire bar height) Eh
Figure D.53: Utility 400 - Distribution water quality & manganese data as a function of
location
©2006 AwwaRF. All Rights Reserved.
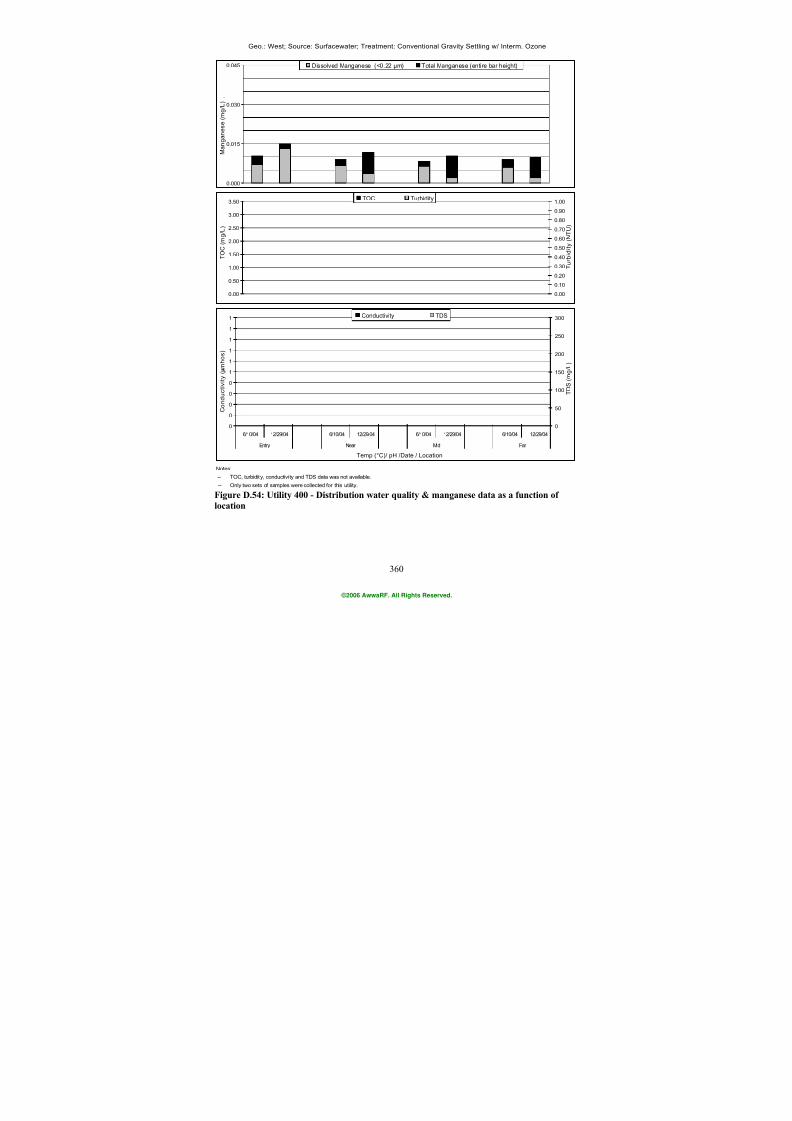
7/21/2019 Occurrence of Manganese in Drinking Water and Manganese Control
http://slidepdf.com/reader/full/occurrence-of-manganese-in-drinking-water-and-manganese-control 386/463
360
Geo.: West; Source: Surfacewater; Treatment: Conventional Gravity Settling w/ Interm. Ozone
Notes:
-- TOC, turbidity, conductivity and TDS data was not available.
-- Only two sets of samples were collected for this utility.
0.00
0.50
1.00
1.50
2.00
2.50
3.00
3.50
T O C
( m g / L )
0.00
0.10
0.20
0.30
0.40
0.50
0.60
0.70
0.80
0.90
1.00
T u r b i d i t y ( N
T U )
TOC Turbidity
0
0
0
0
0
1
1
1
1
1
1
6/10/04 12/29/04 6/10/04 12/29/04 6/10/04 12/29/04 6/10/04 12/29/04
Entry Near Mid Far
Temp (°C)/ pH /Date / Location
C o n d u c t i v i t y ( m h o s )
0
50
100
150
200
250
300
T D S ( m g / L )
Conductivity TDS
0.000
0.015
0.030
0.045
M a n g a n e s e ( m g / L ) .
Dissolved Manganese (<0.22 µm) Total Manganese (entire bar height)
Figure D.54: Utility 400 - Distribution water quality & manganese data as a function of
location
©2006 AwwaRF. All Rights Reserved.
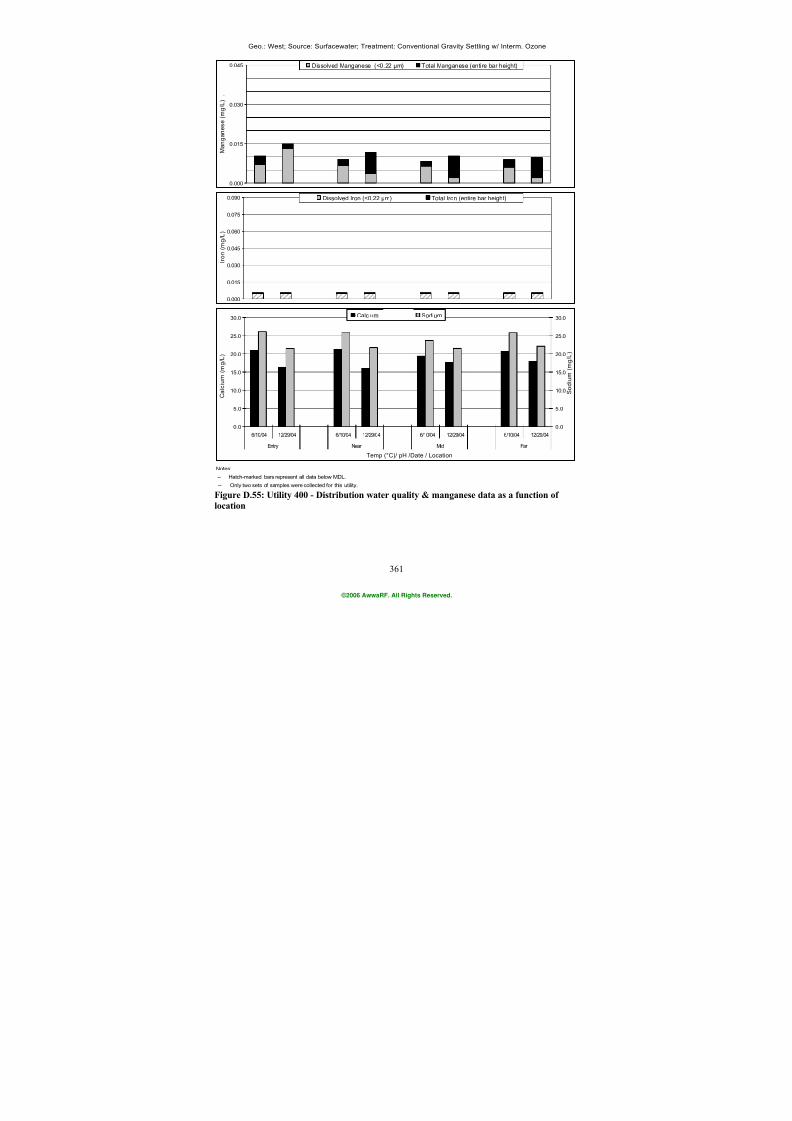
7/21/2019 Occurrence of Manganese in Drinking Water and Manganese Control
http://slidepdf.com/reader/full/occurrence-of-manganese-in-drinking-water-and-manganese-control 387/463
361
Geo.: West; Source: Surfacewater; Treatment: Conventional Gravity Settling w/ Interm. Ozone
Notes:
-- Hatch-marked bars represent all data below MDL.
-- Only two sets of samples were collected for this utility.
0.0
5.0
10.0
15.0
20.0
25.0
30.0
6/10/04 12/29/04 6/10/04 12/29/04 6/10/04 12/29/04 6/10/04 12/29/04
Entry Near Mid Far
Temp (°C)/ pH /Date / Location
C a l c i u m ( m
g / L )
0.0
5.0
10.0
15.0
20.0
25.0
30.0
S o d i u m ( m
g / L
)
Calcium Sodium
0.000
0.015
0.030
0.045
0.060
0.075
0.090
I r o n ( m g / L )
Dissolved Iron (<0.22 µm) Total Iron (entire bar height)
0.000
0.015
0.030
0.045
M a n g a n e s e ( m g / L ) .
Dissolved Manganese (<0.22 µm) Total Manganese (entire bar height)
Figure D.55: Utility 400 - Distribution water quality & manganese data as a function of
location
©2006 AwwaRF. All Rights Reserved.
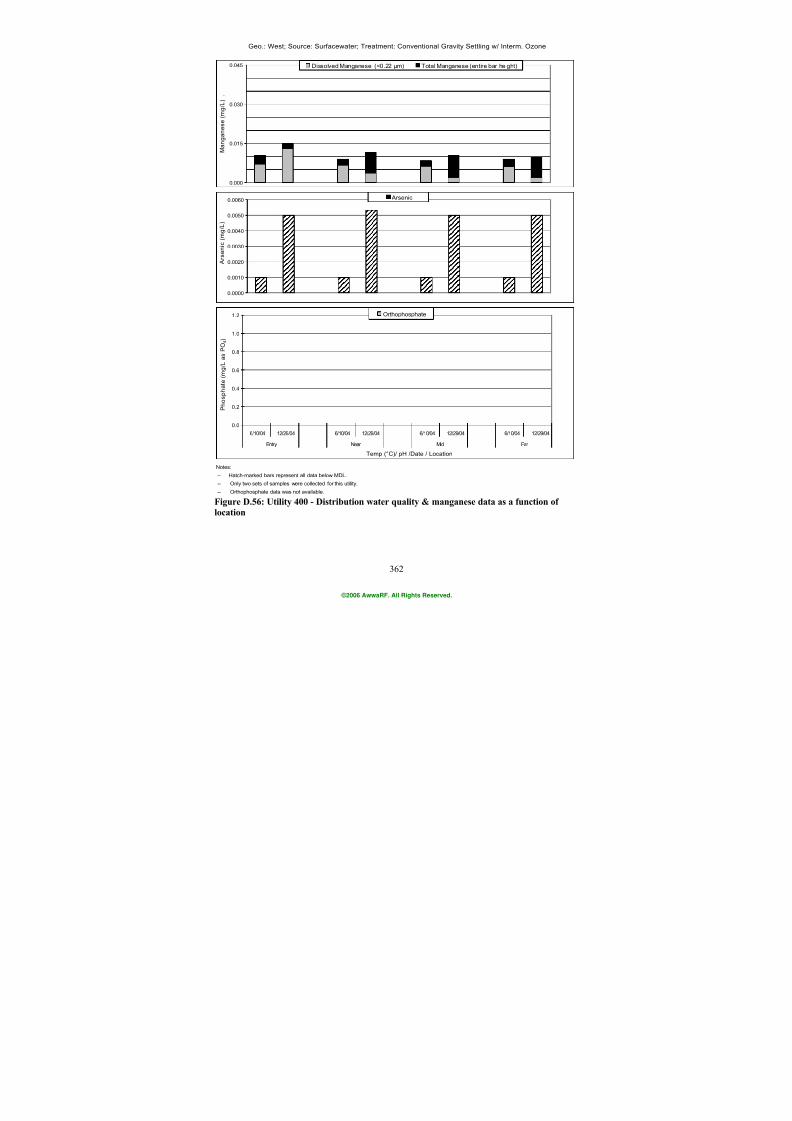
7/21/2019 Occurrence of Manganese in Drinking Water and Manganese Control
http://slidepdf.com/reader/full/occurrence-of-manganese-in-drinking-water-and-manganese-control 388/463
362
Geo.: West; Source: Surfacewater; Treatment: Conventional Gravity Settling w/ Interm. Ozone
Notes:
-- Hatch-marked bars represent all data below MDL. -- Only two sets of samples were collected for this utility.
-- Orthophosphate data was not available.
0.0
0.2
0.4
0.6
0.8
1.0
1.2
6/10/04 12/29/04 6/10/04 12/29/04 6/10/04 12/29/04 6/10/04 12/29/04
Entry Near Mid Far
Temp (°C)/ pH /Date / Location
P h o s p h a t e ( m g / L a s
P O 4 )
Orthophosphate
0.0000
0.0010
0.0020
0.0030
0.0040
0.0050
0.0060
A r s e n i c ( m
g / L )
Arsenic
0.000
0.015
0.030
0.045
M a n g a n e s e ( m g / L ) .
Dissolved Manganese (<0.22 µm) Total Manganese (entire bar height)
Figure D.56: Utility 400 - Distribution water quality & manganese data as a function of
location
©2006 AwwaRF. All Rights Reserved.
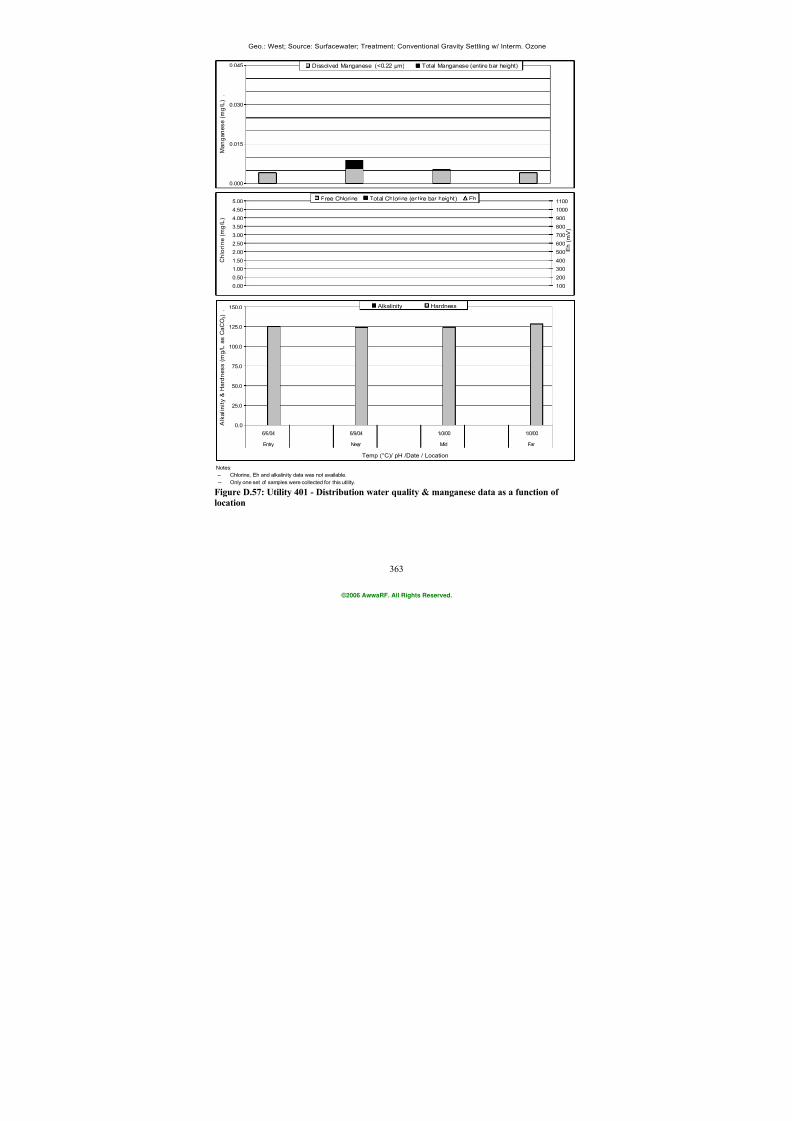
7/21/2019 Occurrence of Manganese in Drinking Water and Manganese Control
http://slidepdf.com/reader/full/occurrence-of-manganese-in-drinking-water-and-manganese-control 389/463
363
Geo.: West; Source: Surfacewater; Treatment: Conventional Gravity Settling w/ Interm. Ozone
Notes:
-- Chlorine, Eh and alkalini ty data was not available. -- Only one set of samples were collected for this utility.
0.000
0.015
0.030
0.045
M a n g a n e s e ( m g / L ) .
Dissolved Manganese (<0.22 µm) Total Manganese (entire bar height)
0.0
25.0
50.0
75.0
100.0
125.0
150.0
6/9/04 6/9/04 1/0/00 1/0/00
Entry Near Mid Far
Temp (°C)/ pH /Date / Location
A l k a l i n i t y &
H a r d n e s s ( m
g / L a s C a C O 3 ) .
Alkalinity Hardness
0.00
0.50
1.00
1.50
2.00
2.503.00
3.50
4.00
4.50
5.00
C h l o r i n e
( m g / L )
100
200
300
400
500
600700
800
900
1000
1100
E h ( m
V )
Free Chlorine Total Chlorine (entire bar height) Eh
Figure D.57: Utility 401 - Distribution water quality & manganese data as a function of
location
©2006 AwwaRF. All Rights Reserved.
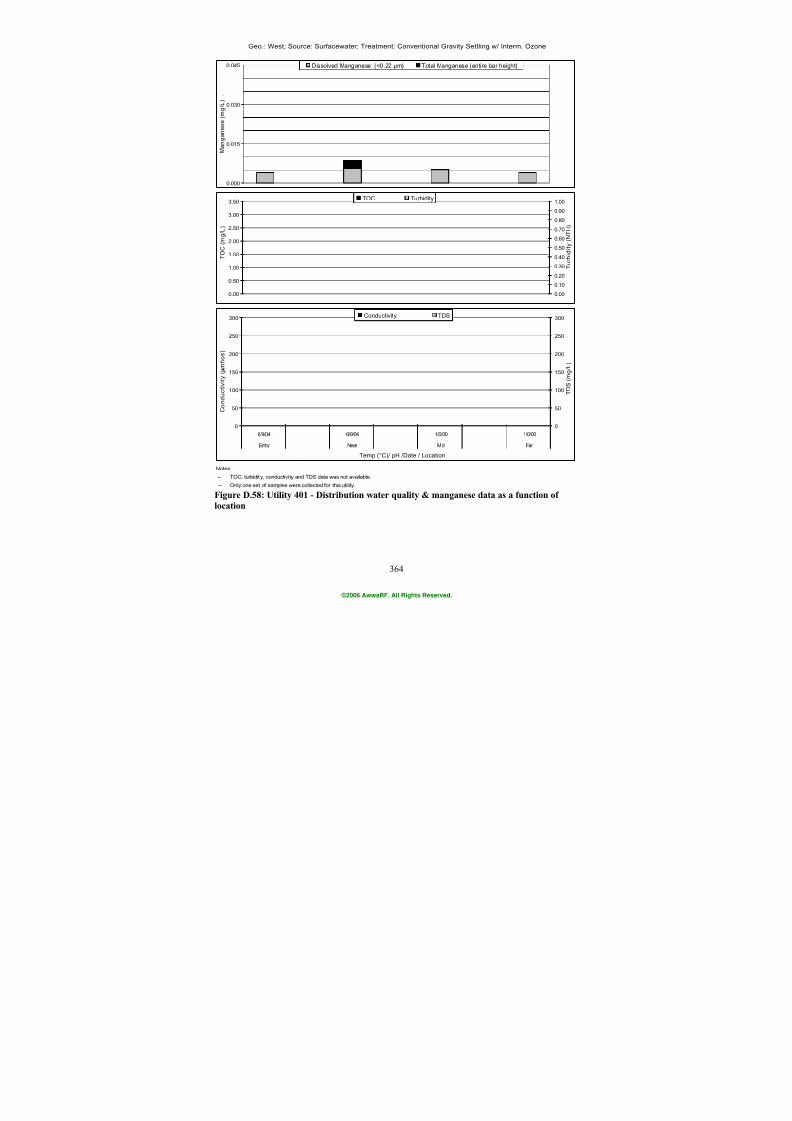
7/21/2019 Occurrence of Manganese in Drinking Water and Manganese Control
http://slidepdf.com/reader/full/occurrence-of-manganese-in-drinking-water-and-manganese-control 390/463
364
Geo.: West; Source: Surfacewater; Treatment: Conventional Gravity Settling w/ Interm. Ozone
Notes:
-- TOC, turbidity, conductivity and TDS data was not available.
-- Only one set of samples were collected for this utility.
0.00
0.50
1.00
1.50
2.00
2.50
3.00
3.50
T O C
( m g / L )
0.00
0.10
0.20
0.30
0.40
0.50
0.60
0.70
0.80
0.90
1.00
T u r b i d i t y ( N
T U )
TOC Turbidity
0
50
100
150
200
250
300
6/9/04 6/9/04 1/0/00 1/0/00
Entry Near Mid Far
Temp (°C)/ pH /Date / Location
C o n d u c t i v i t y ( m h o s )
0
50
100
150
200
250
300
T D S ( m g / L )
Conductivity TDS
0.000
0.015
0.030
0.045
M a n g a n e s e ( m g / L ) .
Dissolved Manganese (<0.22 µm) Total Manganese (entire bar height)
Figure D.58: Utility 401 - Distribution water quality & manganese data as a function of
location
©2006 AwwaRF. All Rights Reserved.
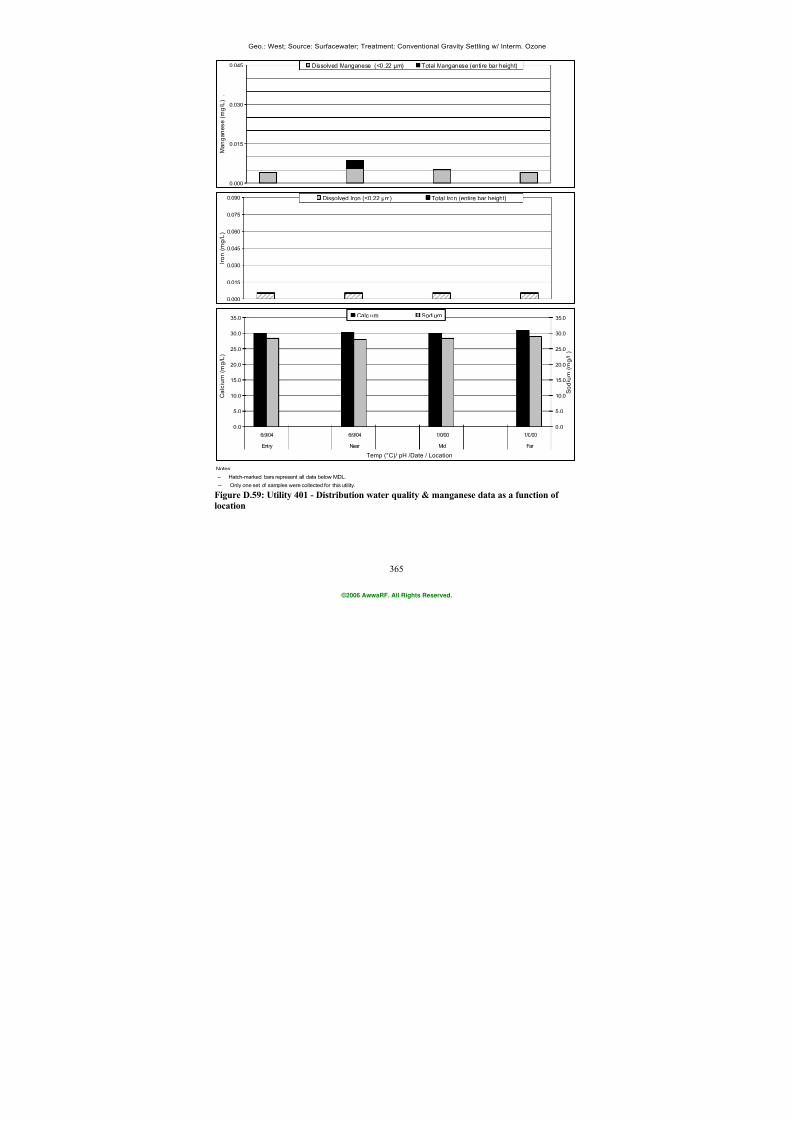
7/21/2019 Occurrence of Manganese in Drinking Water and Manganese Control
http://slidepdf.com/reader/full/occurrence-of-manganese-in-drinking-water-and-manganese-control 391/463
365
Geo.: West; Source: Surfacewater; Treatment: Conventional Gravity Settling w/ Interm. Ozone
Notes:
-- Hatch-marked bars represent all data below MDL.
-- Only one set of samples were collected for this utility.
0.0
5.0
10.0
15.0
20.0
25.0
30.0
35.0
6/9/04 6/9/04 1/0/00 1/0/00
Entry Near Mid Far
Temp (°C)/ pH /Date / Location
C a l c i u m ( m
g / L )
0.0
5.0
10.0
15.0
20.0
25.0
30.0
35.0
S o d i u m ( m
g / L
)
Calcium Sodium
0.000
0.015
0.030
0.045
0.060
0.075
0.090
I r o n ( m g / L
)
Dissolved Iron (<0.22 µm) Total Iron (entire bar height)
0.000
0.015
0.030
0.045
M a n g a n e s e ( m g / L ) .
Dissolved Manganese (<0.22 µm) Total Manganese (entire bar height)
Figure D.59: Utility 401 - Distribution water quality & manganese data as a function of
location
©2006 AwwaRF. All Rights Reserved.
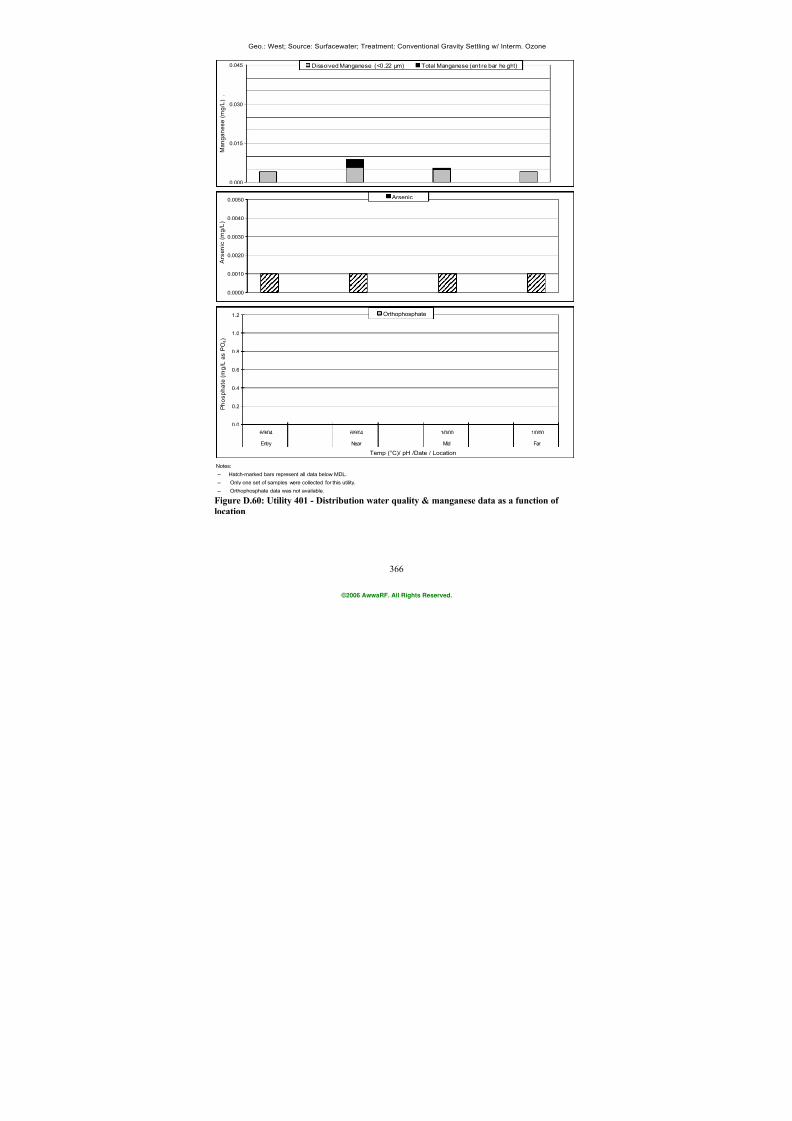
7/21/2019 Occurrence of Manganese in Drinking Water and Manganese Control
http://slidepdf.com/reader/full/occurrence-of-manganese-in-drinking-water-and-manganese-control 392/463
366
Geo.: West; Source: Surfacewater; Treatment: Conventional Gravity Settling w/ Interm. Ozone
Notes:
-- Hatch-marked bars represent all data below MDL. -- Only one set of samples were collected for this utility.
-- Orthophosphate data was not available.
0.0
0.2
0.4
0.6
0.8
1.0
1.2
6/9/04 6/9/04 1/0/00 1/0/00
Entry Near Mid Far
Temp (°C)/ pH /Date / Location
P h o s p h a t e ( m g / L a s P O 4 )
Orthophosphate
0.0000
0.0010
0.0020
0.0030
0.0040
0.0050
A r s e n i c ( m
g / L )
Arsenic
0.000
0.015
0.030
0.045
M a n g a n e s e ( m g / L ) .
Dissolved Manganese (<0.22 µm) Total Manganese (entire bar height)
Figure D.60: Utility 401 - Distribution water quality & manganese data as a function of
location
©2006 AwwaRF. All Rights Reserved.
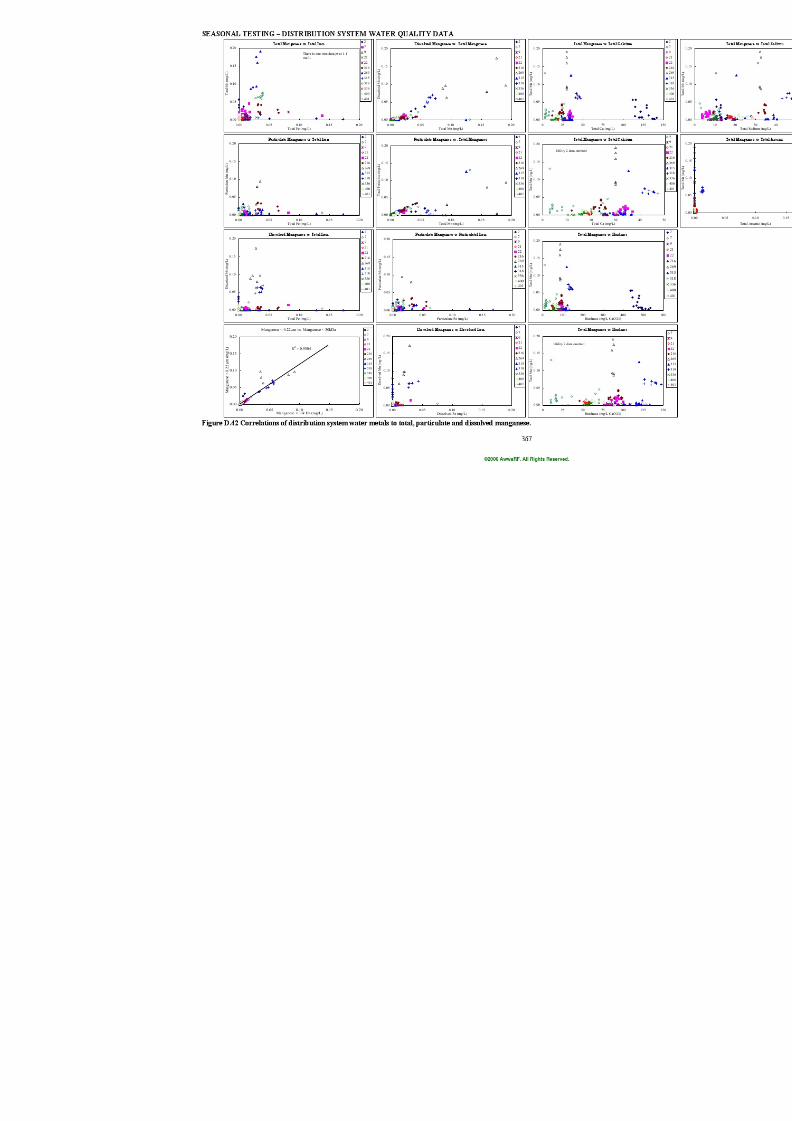
7/21/2019 Occurrence of Manganese in Drinking Water and Manganese Control
http://slidepdf.com/reader/full/occurrence-of-manganese-in-drinking-water-and-manganese-control 393/463
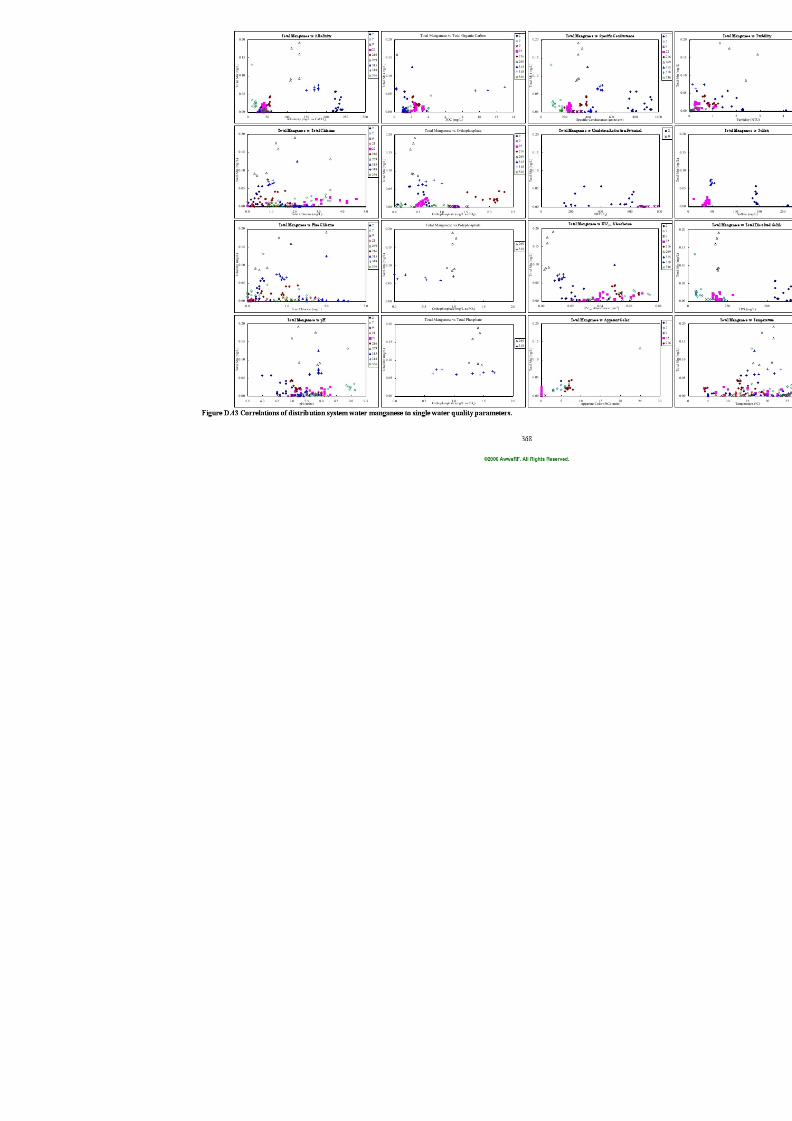
7/21/2019 Occurrence of Manganese in Drinking Water and Manganese Control
http://slidepdf.com/reader/full/occurrence-of-manganese-in-drinking-water-and-manganese-control 394/463
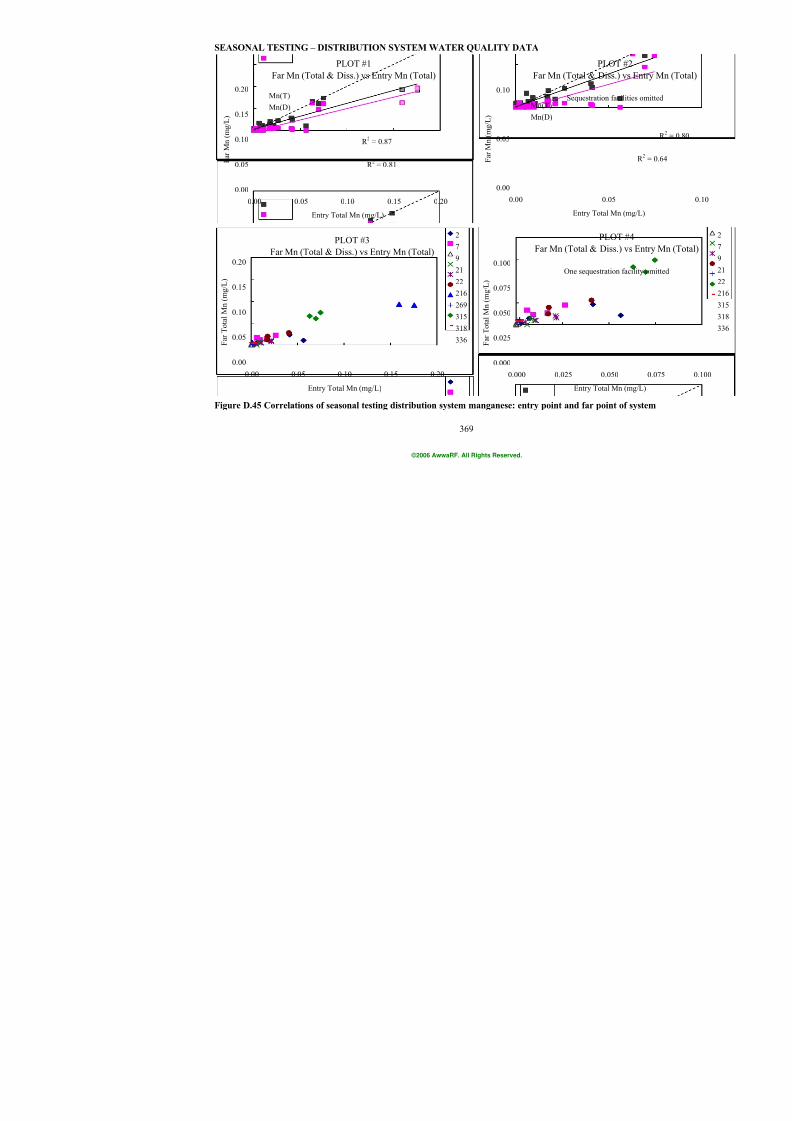
7/21/2019 Occurrence of Manganese in Drinking Water and Manganese Control
http://slidepdf.com/reader/full/occurrence-of-manganese-in-drinking-water-and-manganese-control 395/463
369
SEASONAL TESTING – DISTRIBUTION SYSTEM WATER QUALITY DATA
PLOT #1
Far Mn (Total & Diss.) vs Entry Mn (Total)
R 2 = 0.87
R 2 = 0.81
0.00
0.05
0.10
0.15
0.20
0.00 0.05 0.10 0.15 0.20
Entry Total Mn (mg/L)
F a r M n ( m g / L )
Mn(T)
Mn(D)
PL
Far Mn (Total & Di
Sequestration
0.00
0.05
0.10
0.00 0
Entry Tota
F a r M n ( m g / L )
Mn(T)
Mn(D)
PLOT #3
Far Mn (Total & Diss.) vs Entry Mn (Total)
0.00
0.05
0.10
0.15
0.20
0.00 0.05 0.10 0.15 0.20
Entry Total Mn (mg/L)
F a r T o t a l M n ( m g / L )
27
9
21
22
216
269
315
318
336
PLFar Mn (Total & D
One sequestra
0.000
0.025
0.050
0.075
0.100
0.000 0.025 0.
Entry Tota
F a r T o t a l M n ( m g / L )
Figure D.45 Correlations of seasonal testing distribution system manganese: entry point and far po
©2006 AwwaRF. All Rights Reserved.
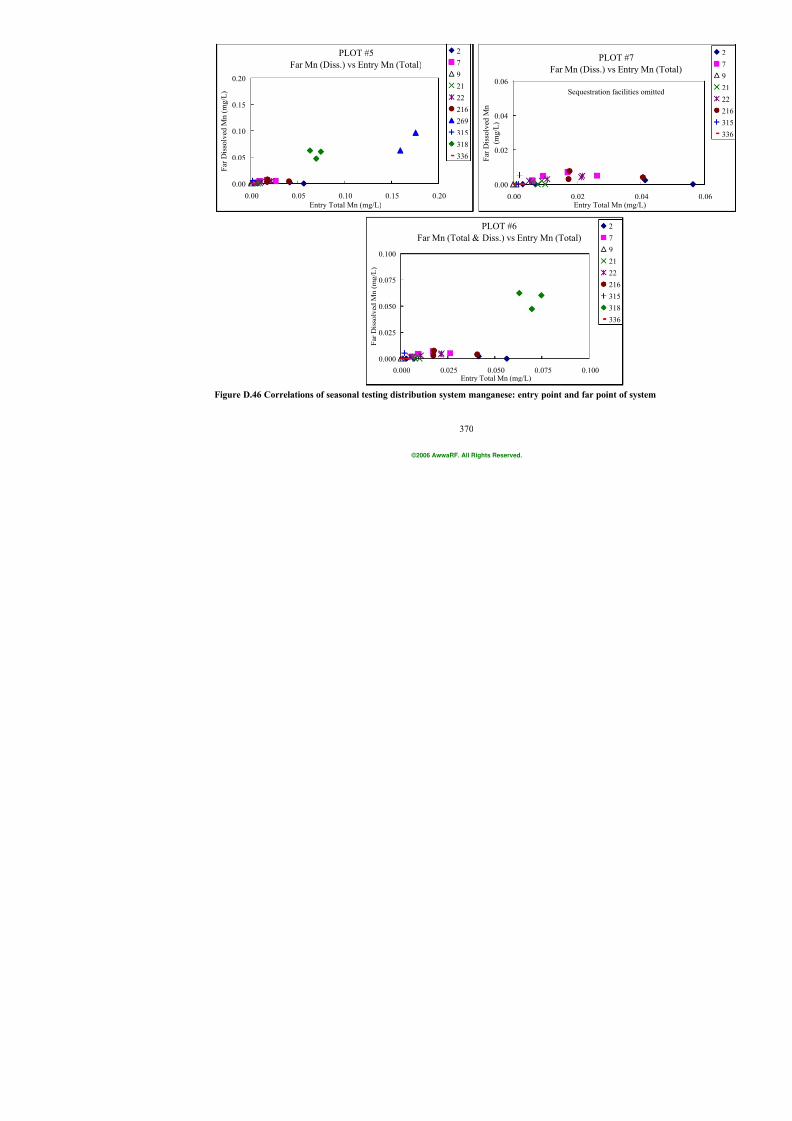
7/21/2019 Occurrence of Manganese in Drinking Water and Manganese Control
http://slidepdf.com/reader/full/occurrence-of-manganese-in-drinking-water-and-manganese-control 396/463
370
PLOT #5
Far Mn (Diss.) vs Entry Mn (Total)
0.00
0.05
0.10
0.15
0.20
0.00 0.05 0.10 0.15 0.20
Entry Total Mn (mg/L)
F a r D i s s o l v e d M n
( m g / L )
2
7
9
21
22
216
269
315
318
336
PLOT #6
Far Mn (Total & Diss.) vs Entry Mn (Total)
0.000
0.025
0.050
0.075
0.100
0.000 0.025 0.050 0.075 0.100Entry Total Mn (mg/L)
F a r D i s s o l v e d M n ( m g / L )
PL
Far Mn (Diss.)
Sequestratio
0.00
0.02
0.04
0.06
0.00 0.02Entry Tota
F a r D i s s o l v e d
M n
( m g / L )
Figure D.46 Correlations of seasonal testing distribution system manganese: entry point and far po
©2006 AwwaRF. All Rights Reserved.
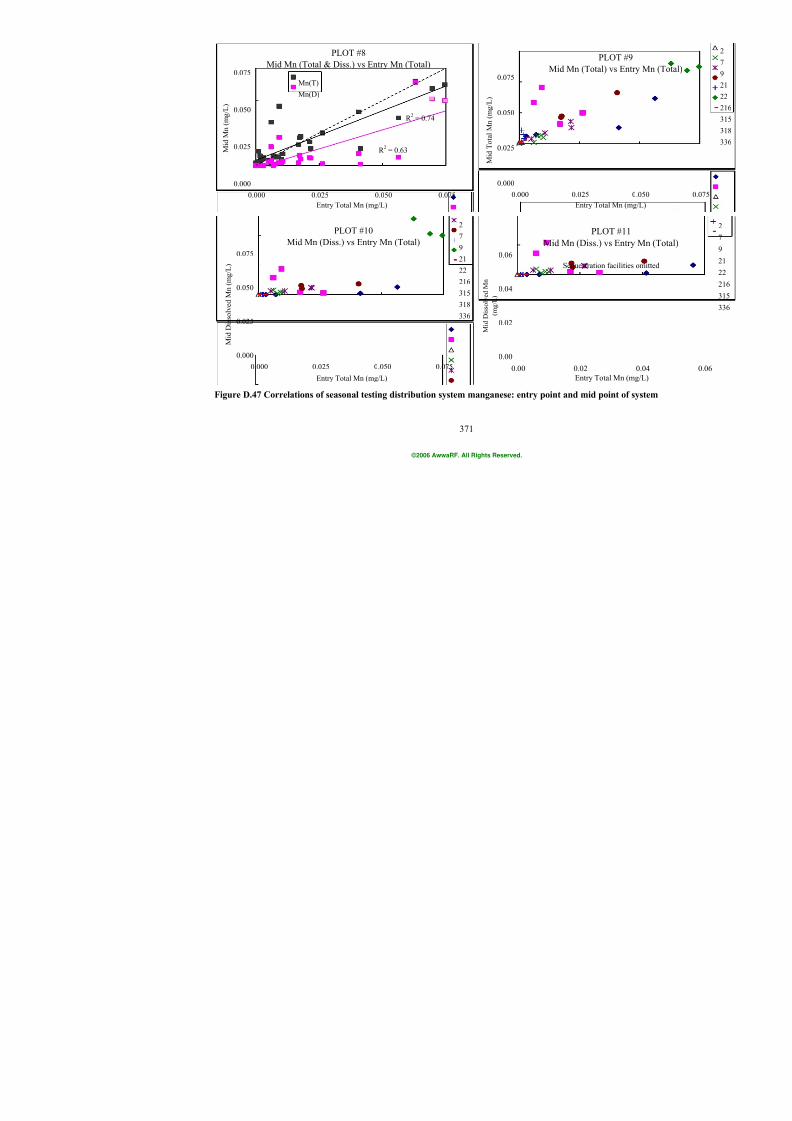
7/21/2019 Occurrence of Manganese in Drinking Water and Manganese Control
http://slidepdf.com/reader/full/occurrence-of-manganese-in-drinking-water-and-manganese-control 397/463
371
PLOT #8
Mid Mn (Total & Diss.) vs Entry Mn (Total)
R 2
= 0.74
R 2 = 0.63
0.000
0.025
0.050
0.075
0.000 0.025 0.050 0.075
Entry Total Mn (mg/L)
M i d M n ( m g / L )
Mn(T)
Mn(D)
PL
Mid Mn (Total)
0.000
0.025
0.050
0.075
0.000 0.025
Entry Tota
M i d T o t a l M n (
m g / L )
PLOT #10
Mid Mn (Diss.) vs Entry Mn (Total)
0.000
0.025
0.050
0.075
0.000 0.025 0.050 0.075
Entry Total Mn (mg/L)
M i d D i s s o l v e d M n ( m g / L )
2
79
21
22
216
315
318
336
PLO
Mid Mn (Diss.) v
Sequestration
0.00
0.02
0.04
0.06
0.00 0.02
Entry Tot
M i d D i s s o l v e d M n
( m g / L )
Figure D.47 Correlations of seasonal testing distribution system manganese: entry point and mid po
©2006 AwwaRF. All Rights Reserved.
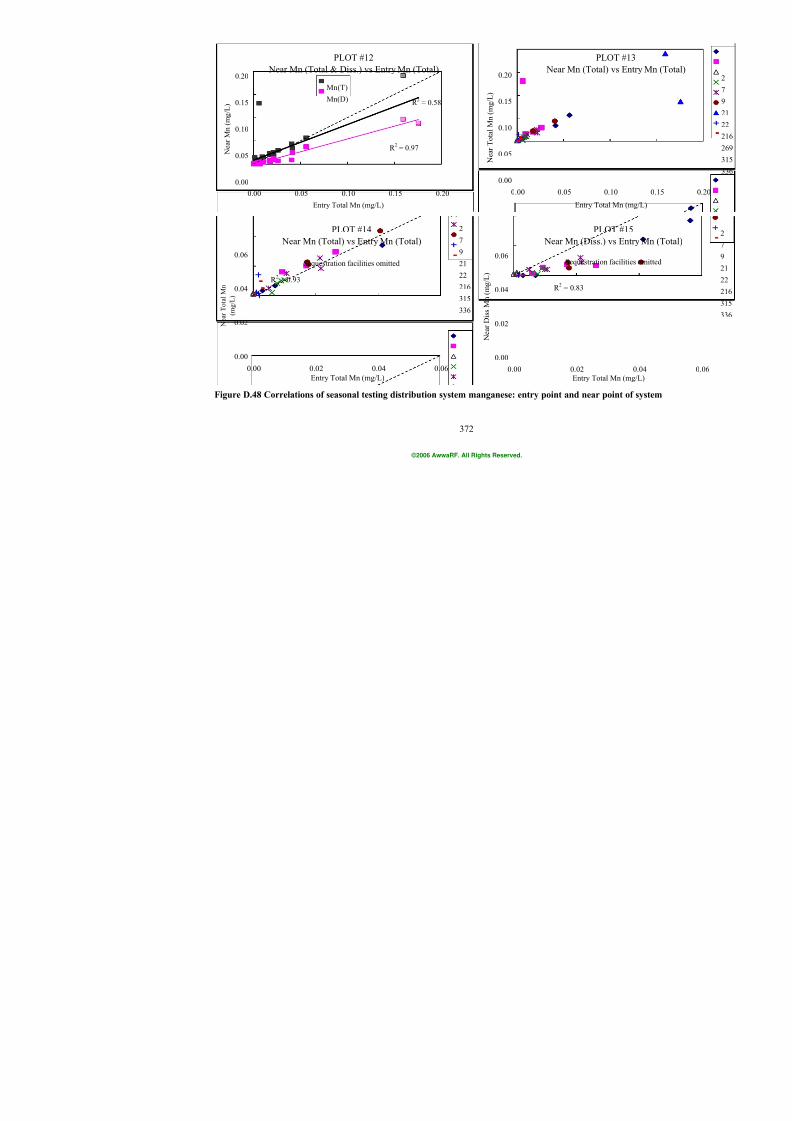
7/21/2019 Occurrence of Manganese in Drinking Water and Manganese Control
http://slidepdf.com/reader/full/occurrence-of-manganese-in-drinking-water-and-manganese-control 398/463
372
PLOT #12
Near Mn (Total & Diss.) vs Entry Mn (Total)
R 2 = 0.58
R 2 = 0.97
0.00
0.05
0.10
0.15
0.20
0.00 0.05 0.10 0.15 0.20
Entry Total Mn (mg/L)
N e a r M n ( m g / L )
Mn(T)
Mn(D)
PL
Near Mn (Total)
0.00
0.05
0.10
0.15
0.20
0.00 0.05 0
Entry Tota
N e a r T o t a l M n
( m g / L )
PLOT #14
Near Mn (Total) vs Entry Mn (Total)
Sequestration facilities omitted
0.00
0.02
0.04
0.06
0.00 0.02 0.04 0.06
Entry Total Mn (mg/L)
N e a r T o t a l M n
( m g / L )
2
7
9
21
22
216
315
336
R 2 = 0.93
PLO
Near Mn (Diss.)
Sequestration
0.00
0.02
0.04
0.06
0.00 0.02
Entry Tota
N e a r D i s s M n ( m g / L )
R 2 = 0.83
Figure D.48 Correlations of seasonal testing distribution system manganese: entry point and near p
©2006 AwwaRF. All Rights Reserved.
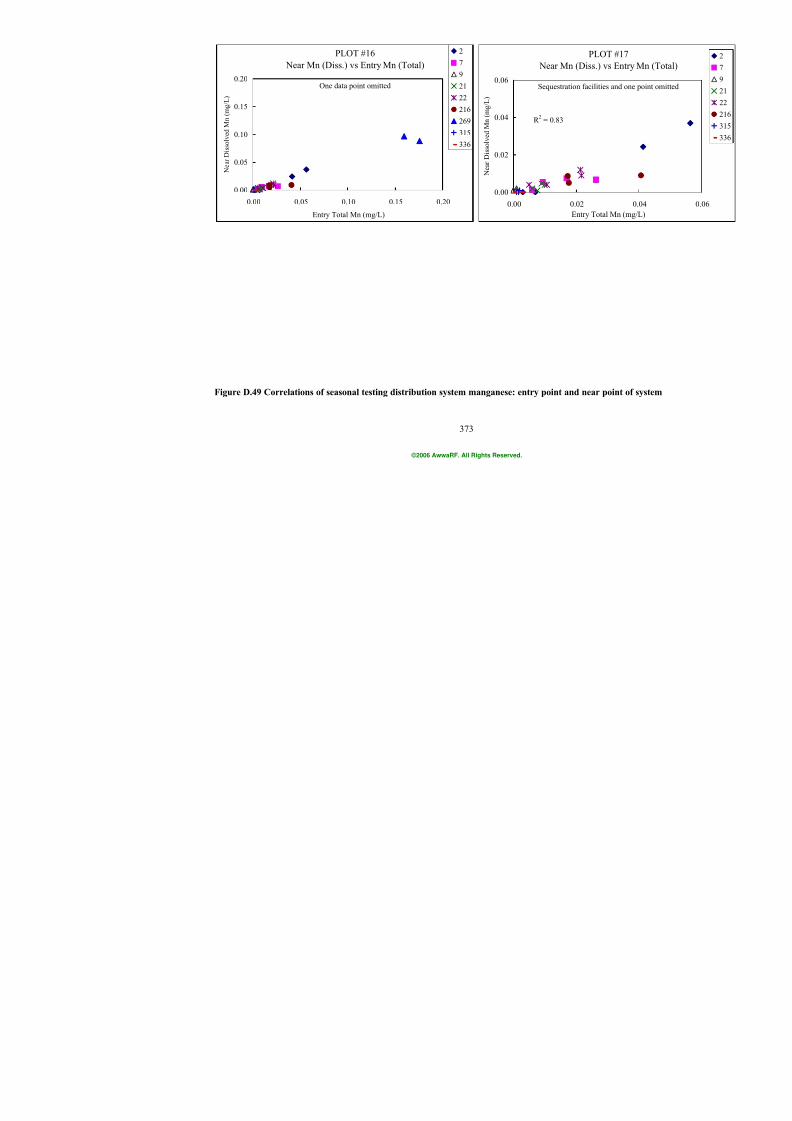
7/21/2019 Occurrence of Manganese in Drinking Water and Manganese Control
http://slidepdf.com/reader/full/occurrence-of-manganese-in-drinking-water-and-manganese-control 399/463
373
PLOT #16
Near Mn (Diss.) vs Entry Mn (Total)
One data point omitted
0.00
0.05
0.10
0.15
0.20
0.00 0.05 0.10 0.15 0.20
Entry Total Mn (mg/L)
N e a r D i s s o l v e d M n
( m g / L )
2
7
9
21
22
216
269
315
336
PLO
Near Mn (Diss.) v
Sequestration facilitie
0.00
0.02
0.04
0.06
0.00 0.02
Entry Tota
N e a r D i s s o l v e d M n ( m g / L )
R 2 = 0.83
Figure D.49 Correlations of seasonal testing distribution system manganese: entry point and near p
©2006 AwwaRF. All Rights Reserved.
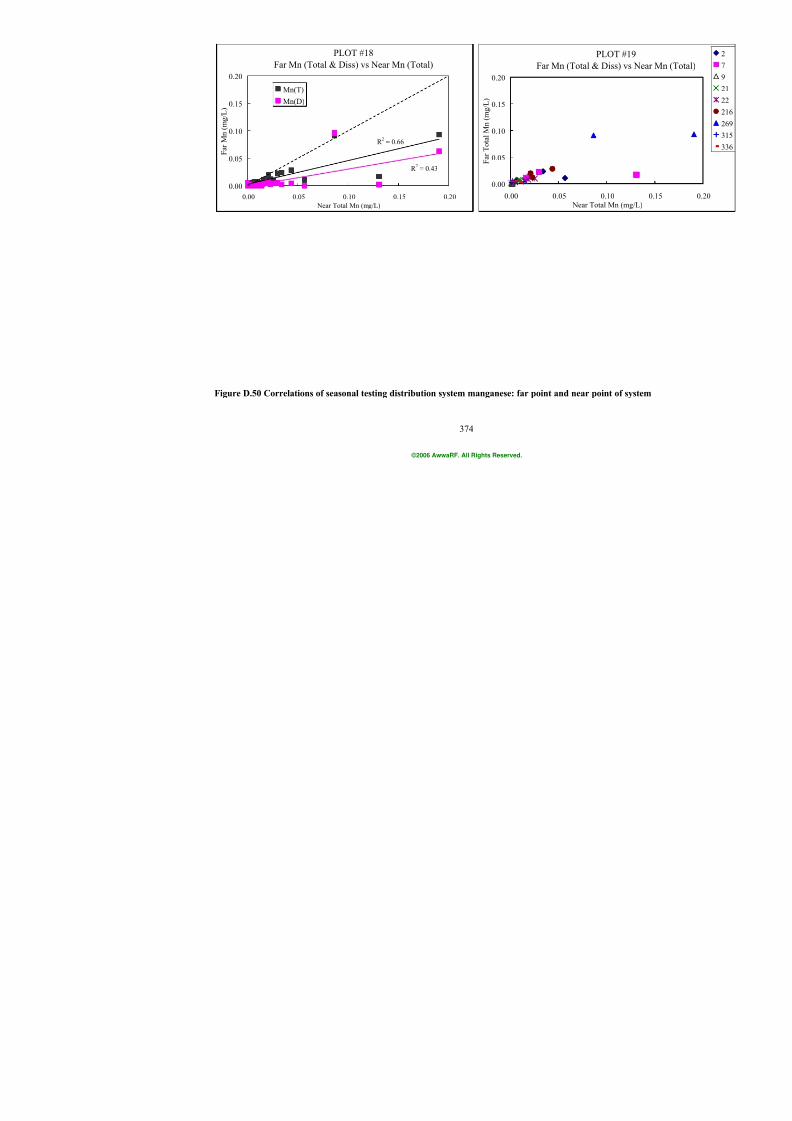
7/21/2019 Occurrence of Manganese in Drinking Water and Manganese Control
http://slidepdf.com/reader/full/occurrence-of-manganese-in-drinking-water-and-manganese-control 400/463
374
PLOT #18
Far Mn (Total & Diss) vs Near Mn (Total)
R 2 = 0.66
R 2 = 0.43
0.00
0.05
0.10
0.15
0.20
0.00 0.05 0.10 0.15 0.20
Near Total Mn (mg/L)
F a r M n ( m g / L )
Mn(T)
Mn(D)
PL
Far Mn (Total & D
0.00
0.05
0.10
0.15
0.20
0.00 0.05 0.
Near Total
F a r T o t a l M n ( m g / L )
Figure D.50 Correlations of seasonal testing distribution system manganese: far point and near poi
©2006 AwwaRF. All Rights Reserved.
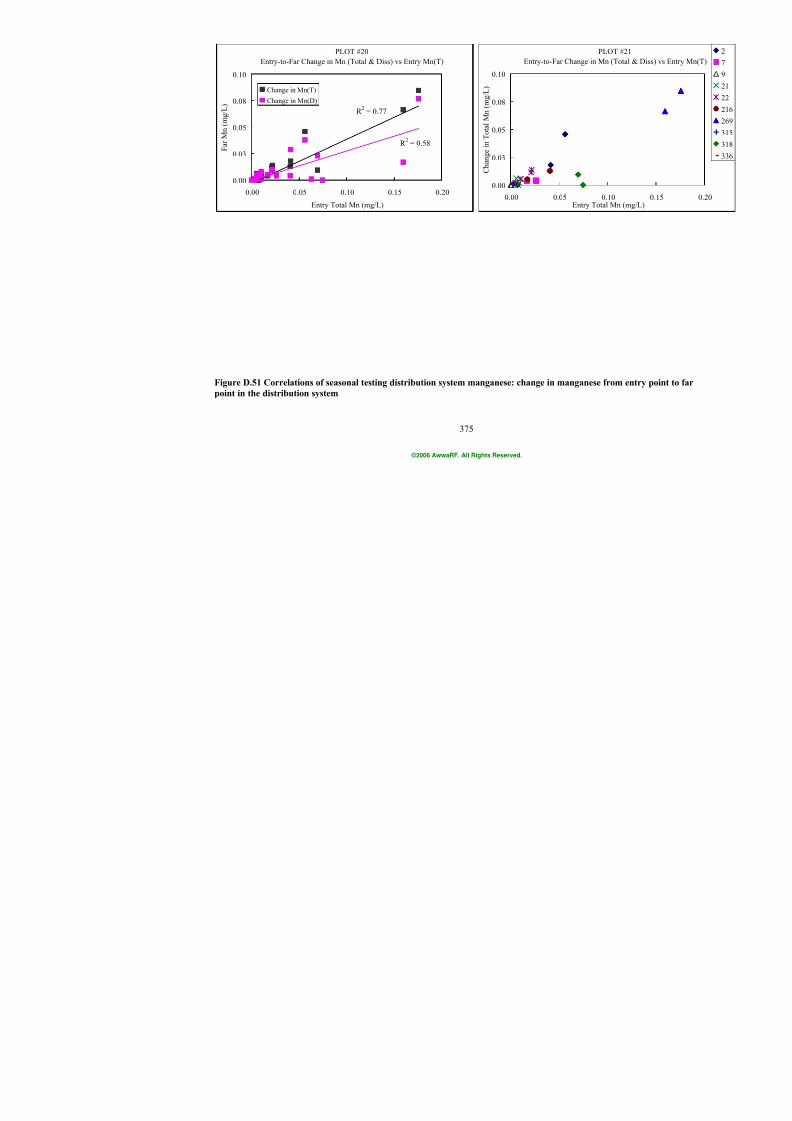
7/21/2019 Occurrence of Manganese in Drinking Water and Manganese Control
http://slidepdf.com/reader/full/occurrence-of-manganese-in-drinking-water-and-manganese-control 401/463
375
PLOT #20
Entry-to-Far Change in Mn (Total & Diss) vs Entry Mn(T)
R 2 = 0.77
R 2 = 0.58
0.00
0.03
0.05
0.08
0.10
0.00 0.05 0.10 0.15 0.20
Entry Total Mn (mg/L)
F a r M n ( m g / L )
Change in Mn(T)
Change in Mn(D)
PL
Entry-to-Far Change in Mn
0.00
0.03
0.05
0.08
0.10
0.00 0.05 0Entry Tota
C h a n g e i n T o t a l M
n ( m g / L )
Figure D.51 Correlations of seasonal testing distribution system manganese: change in manganese f
point in the distribution system
©2006 AwwaRF. All Rights Reserved.
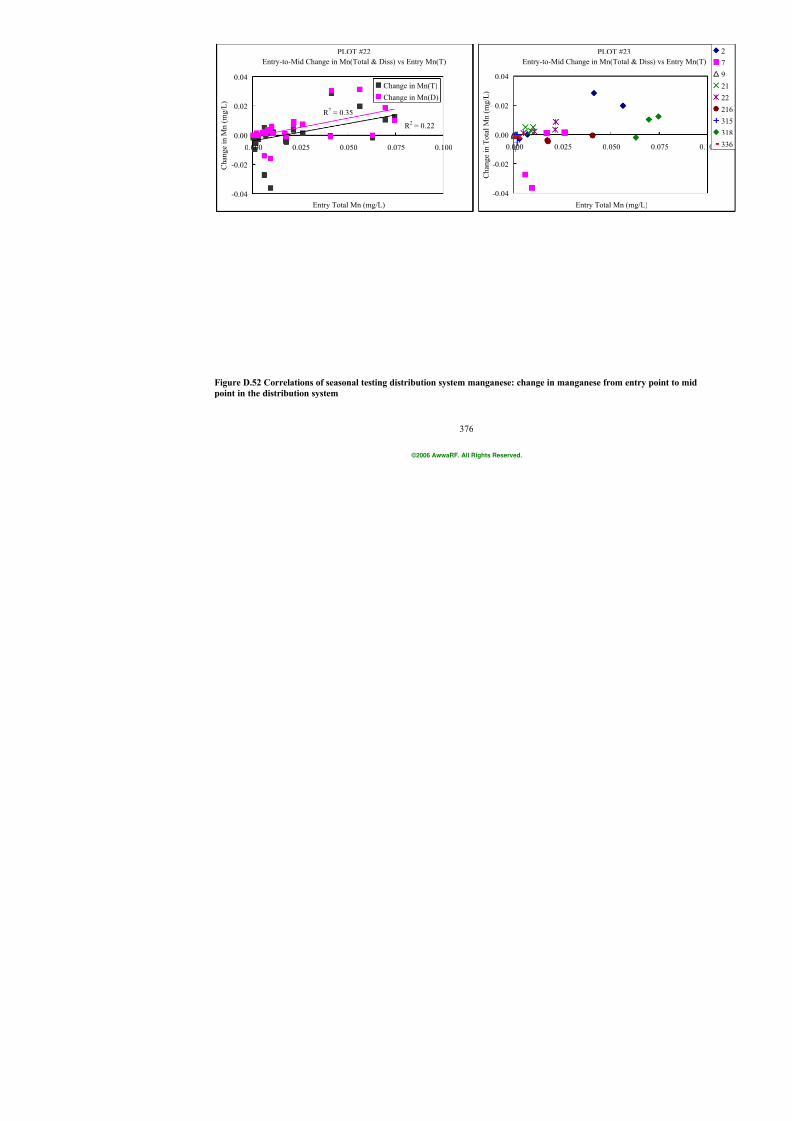
7/21/2019 Occurrence of Manganese in Drinking Water and Manganese Control
http://slidepdf.com/reader/full/occurrence-of-manganese-in-drinking-water-and-manganese-control 402/463
376
PLOT #22
Entry-to-Mid Change in Mn(Total & Diss) vs Entry Mn(T)
R 2 = 0.35
R 2 = 0.22
-0.04
-0.02
0.00
0.02
0.04
0.000 0.025 0.050 0.075 0.100
Entry Total Mn (mg/L)
C h a n g e i n M n ( m
g / L )
Change in Mn(T)
Change in Mn(D)
PL
Entry-to-Mid Change in M
-0.04
-0.02
0.00
0.02
0.04
0.000 0.025 0
Entry Tot
C h a n g e i n T o t a l M n
( m g / L )
Figure D.52 Correlations of seasonal testing distribution system manganese: change in manganese f
point in the distribution system
©2006 AwwaRF. All Rights Reserved.
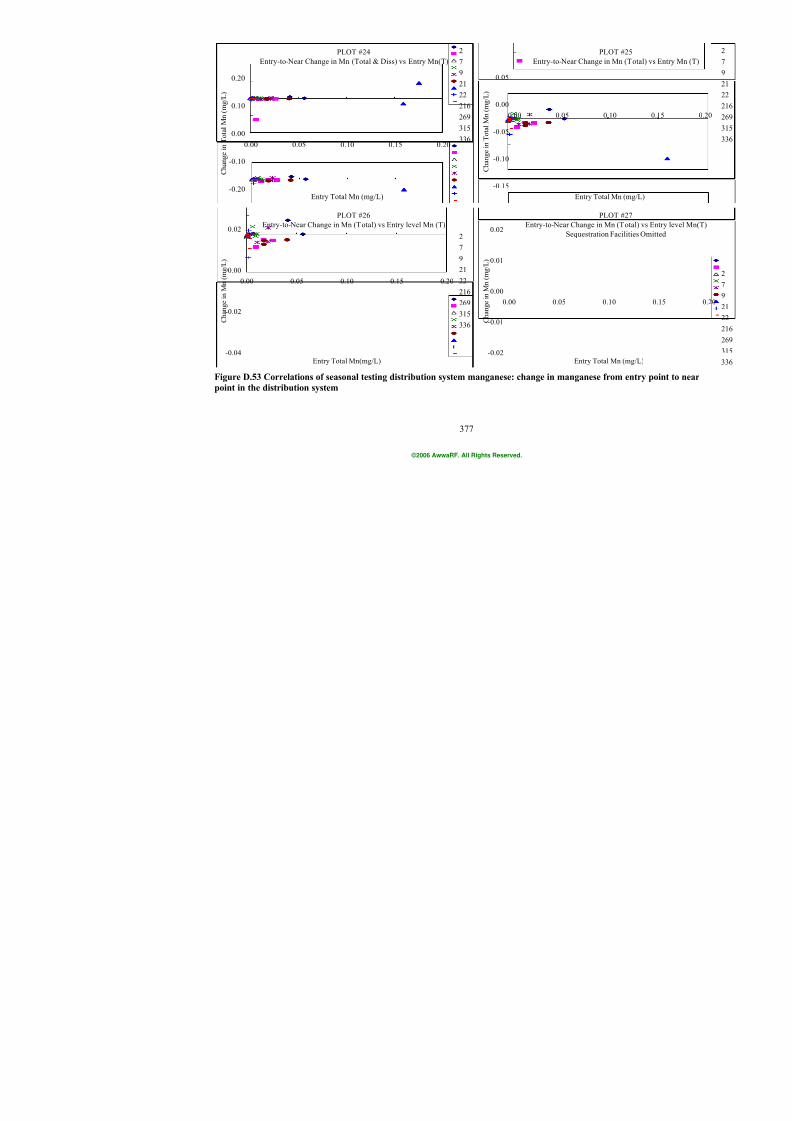
7/21/2019 Occurrence of Manganese in Drinking Water and Manganese Control
http://slidepdf.com/reader/full/occurrence-of-manganese-in-drinking-water-and-manganese-control 403/463
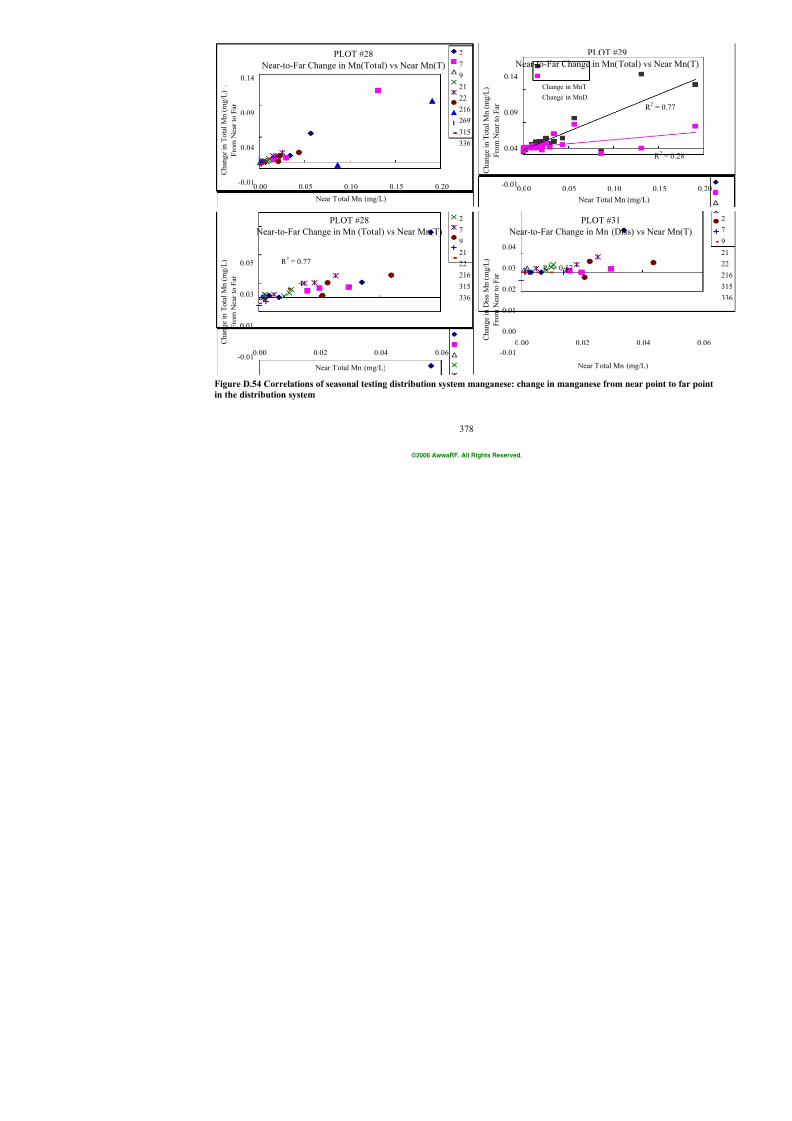
7/21/2019 Occurrence of Manganese in Drinking Water and Manganese Control
http://slidepdf.com/reader/full/occurrence-of-manganese-in-drinking-water-and-manganese-control 404/463
378
PLOT #28
Near-to-Far Change in Mn(Total) vs Near Mn(T)
-0.01
0.04
0.09
0.14
0.00 0.05 0.10 0.15 0.20
Near Total Mn (mg/L)
C h a n g e i n T o t a l M n ( m g / L ) .
F r o m N e a r t o
F a r
2
7
9
21
22
216
269
315
336
PLOT
Near-to-Far Change in M
-0.01
0.04
0.09
0.14
0.00 0.05
Near Tot
C h a n g e i n T o t a l M
n ( m g / L )
F r o m N e a r t o
F a r
Change in MnT
Change in MnD
PLOT #28
Near-to-Far Change in Mn (Total) vs Near Mn(T)
-0.01
0.01
0.03
0.05
0.00 0.02 0.04 0.06 Near Total Mn (mg/L)
C h a n g e i n T o t a l M n ( m g / L )
F r o m N e a r t o F a r
2
7
9
21
22
216
315
336
R 2 = 0.77
PLOT
Near-to-Far Change in Mn
-0.01
0.00
0.01
0.02
0.03
0.04
0.00 0.02
Near Tot
C h a n g e i n D i s s M n ( m g / L )
F r o m N e a r t o F a r
R 2 = 0.57
Figure D.54 Correlations of seasonal testing distribution system manganese: change in manganese f
in the distribution system
©2006 AwwaRF. All Rights Reserved.
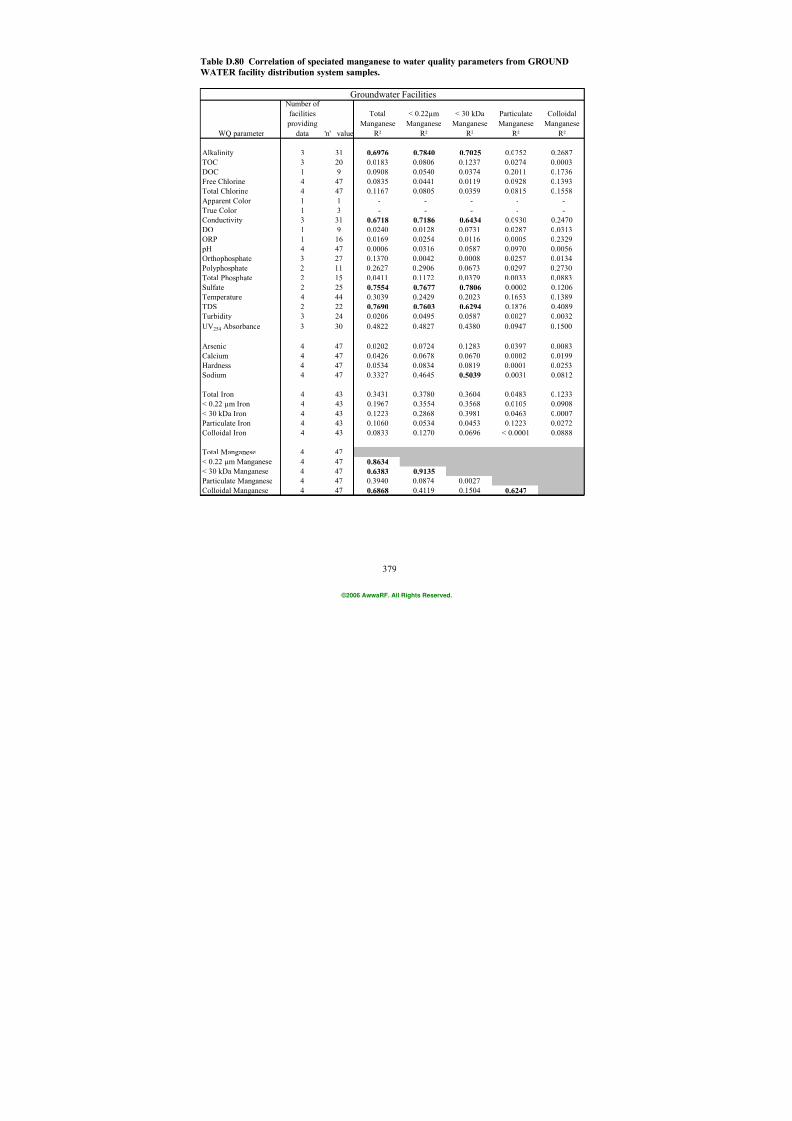
7/21/2019 Occurrence of Manganese in Drinking Water and Manganese Control
http://slidepdf.com/reader/full/occurrence-of-manganese-in-drinking-water-and-manganese-control 405/463
379
Table D.80 Correlation of speciated manganese to water quality parameters from GROUND
WATER facility distribution system samples.
WQ parameter
Number of
facilities
providing
data 'n' value
Total
Manganese
R²
< 0.22µm
Manganese
R²
< 30 kDa
Manganese
R²
Particulate
Manganese
R²
Colloidal
Manganese
R²
Alkalinity 3 31 0.6976 0.7840 0.7025 0.0752 0.2687
TOC 3 20 0.0183 0.0806 0.1237 0.0274 0.0003
DOC 1 9 0.0908 0.0540 0.0374 0.2011 0.1736
Free Chlorine 4 47 0.0835 0.0441 0.0119 0.0928 0.1393
Total Chlorine 4 47 0.1167 0.0805 0.0359 0.0815 0.1558
Apparent Color 1 1 - - - - -
True Color 1 3 - - - - -
Conductivity 3 31 0.6718 0.7186 0.6434 0.0930 0.2470
DO 1 9 0.0240 0.0128 0.0731 0.0287 0.0313
ORP 1 16 0.0169 0.0254 0.0116 0.0005 0.2329 pH 4 47 0.0006 0.0316 0.0587 0.0970 0.0056
Orthophosphate 3 27 0.1370 0.0042 0.0008 0.0257 0.0134
Polyphosphate 2 11 0.2627 0.2906 0.0673 0.0297 0.2730
Total Phosphate 2 15 0.0411 0.1172 0.0379 0.0033 0.0883
Sulfate 2 25 0.7554 0.7677 0.7806 0.0002 0.1206
Temperature 4 44 0.3039 0.2429 0.2023 0.1653 0.1389
TDS 2 22 0.7690 0.7603 0.6294 0.1876 0.4089
Turbidity 3 24 0.0206 0.0495 0.0587 0.0027 0.0032
UV254 Absorbance 3 30 0.4822 0.4827 0.4380 0.0947 0.1500
Arsenic 4 47 0.0202 0.0724 0.1283 0.0397 0.0083
Calcium 4 47 0.0426 0.0678 0.0670 0.0002 0.0199Hardness 4 47 0.0534 0.0834 0.0819 0.0001 0.0253
Sodium 4 47 0.3327 0.4645 0.5039 0.0031 0.0812
Total Iron 4 43 0.3431 0.3780 0.3604 0.0483 0.1233
< 0.22 µm Iron 4 43 0.1967 0.3554 0.3568 0.0105 0.0908
< 30 kDa Iron 4 43 0.1223 0.2868 0.3981 0.0463 0.0007
Particulate Iron 4 43 0.1060 0.0534 0.0453 0.1223 0.0272
Colloidal Iron 4 43 0.0833 0.1270 0.0696 < 0.0001 0.0888
Total Manganese 4 47
< 0.22 µm Manganese 4 47 0.8634
< 30 kDa Manganese 4 470.6383 0.9135Particulate Manganese 4 47 0.3940 0.0874 0.0027
Colloidal Manganese 4 47 0.6868 0.4119 0.1504 0.6247
Groundwater Facilities
©2006 AwwaRF. All Rights Reserved.
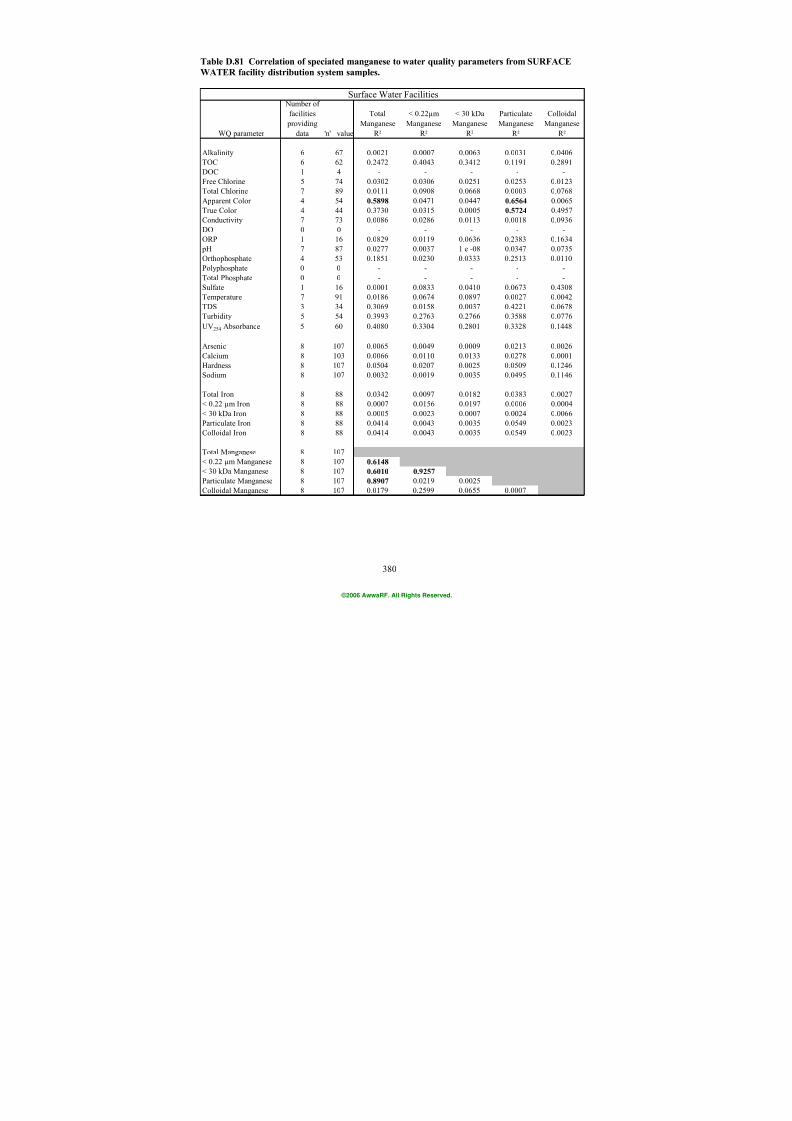
7/21/2019 Occurrence of Manganese in Drinking Water and Manganese Control
http://slidepdf.com/reader/full/occurrence-of-manganese-in-drinking-water-and-manganese-control 406/463
380
Table D.81 Correlation of speciated manganese to water quality parameters from SURFACE
WATER facility distribution system samples.
WQ parameter
Number of
facilities
providing
data 'n' value
Total
Manganese
R²
< 0.22µm
Manganese
R²
< 30 kDa
Manganese
R²
Particulate
Manganese
R²
Colloidal
Manganese
R²
Alkalinity 6 67 0.0021 0.0007 0.0063 0.0031 0.0406
TOC 6 62 0.2472 0.4043 0.3412 0.1191 0.2891
DOC 1 4 - - - - -
Free Chlorine 5 74 0.0302 0.0306 0.0251 0.0253 0.0123
Total Chlorine 7 89 0.0111 0.0908 0.0668 0.0003 0.0768
Apparent Color 4 54 0.5898 0.0471 0.0447 0.6564 0.0065
True Color 4 44 0.3730 0.0315 0.0005 0.5724 0.4957
Conductivity 7 73 0.0086 0.0286 0.0113 0.0018 0.0936
DO 0 0 - - - - -
ORP 1 16 0.0829 0.0119 0.0636 0.2383 0.1634 pH 7 87 0.0277 0.0037 1 e -08 0.0347 0.0735
Orthophosphate 4 53 0.1851 0.0230 0.0333 0.2513 0.0110
Polyphosphate 0 0 - - - - -
Total Phosphate 0 0 - - - - -
Sulfate 1 16 0.0001 0.0833 0.0410 0.0673 0.4308
Temperature 7 91 0.0186 0.0674 0.0897 0.0027 0.0042
TDS 3 34 0.3069 0.0158 0.0037 0.4221 0.0678
Turbidity 5 54 0.3993 0.2763 0.2766 0.3588 0.0776
UV254 Absorbance 5 60 0.4080 0.3304 0.2801 0.3328 0.1448
Arsenic 8 107 0.0065 0.0049 0.0009 0.0213 0.0026
Calcium 8 103 0.0066 0.0110 0.0133 0.0278 0.0001Hardness 8 107 0.0504 0.0207 0.0025 0.0509 0.1246
Sodium 8 107 0.0032 0.0019 0.0035 0.0495 0.1146
Total Iron 8 88 0.0342 0.0097 0.0182 0.0383 0.0027
< 0.22 µm Iron 8 88 0.0007 0.0156 0.0197 0.0006 0.0004
< 30 kDa Iron 8 88 0.0005 0.0023 0.0007 0.0024 0.0066
Particulate Iron 8 88 0.0414 0.0043 0.0035 0.0549 0.0023
Colloidal Iron 8 88 0.0414 0.0043 0.0035 0.0549 0.0023
Total Manganese 8 107
< 0.22 µm Manganese 8 107 0.6148
< 30 kDa Manganese 8 1070.6010 0.9257Particulate Manganese 8 107 0.8907 0.0219 0.0025
Colloidal Manganese 8 107 0.0179 0.2599 0.0655 0.0007
Surface Water Facilities
©2006 AwwaRF. All Rights Reserved.
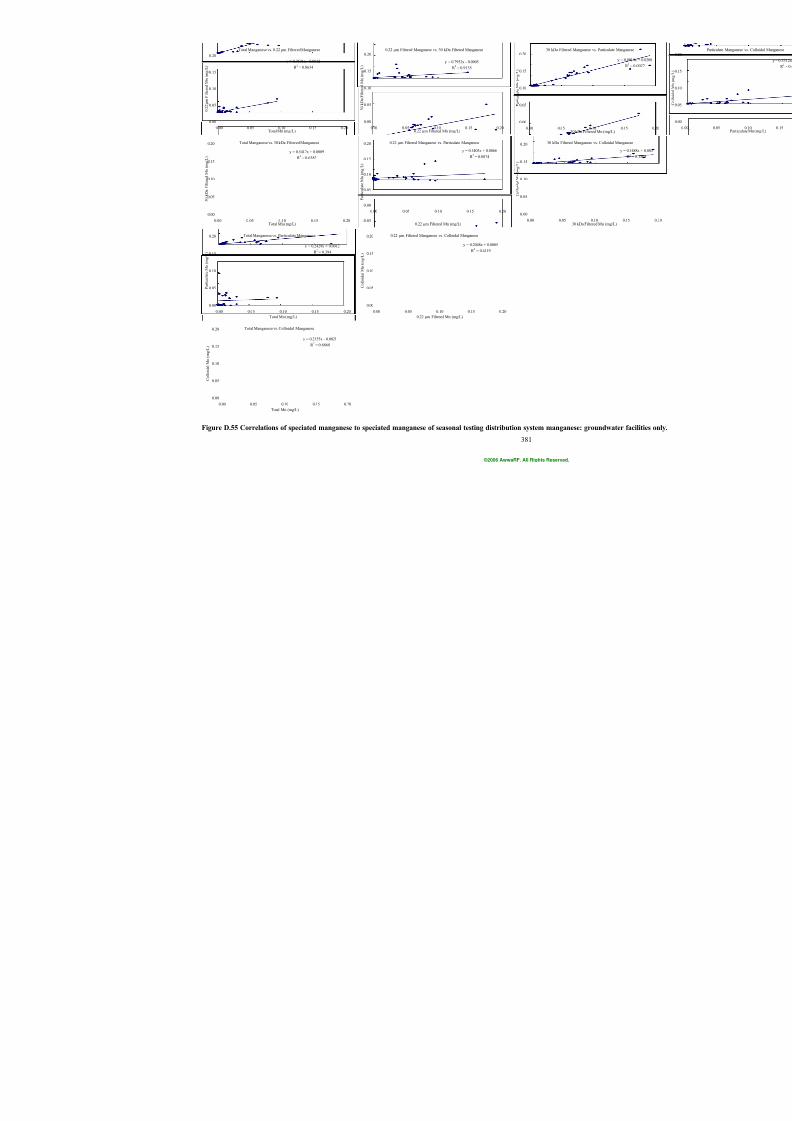
7/21/2019 Occurrence of Manganese in Drinking Water and Manganese Control
http://slidepdf.com/reader/full/occurrence-of-manganese-in-drinking-water-and-manganese-control 407/463
381
Total Manganese vs. 0.22 µm Filtered Manganese
y = 0.7571x - 0.0012
R 2 = 0.8634
0.00
0.05
0.10
0.15
0.20
0.00 0.05 0.10 0.15 0.20Total Mn (mg/L)
0 . 2
2 µ m F i l t e r e d M n ( m g / L )
Total Manganese vs. 30 kDa Filtered Manganese
y = 0.5417x + 0.0009
R 2 = 0.6383
0.00
0.05
0.10
0.15
0.20
0.00 0.05 0.10 0.15 0.20Total Mn (mg/L)
3 0 k D a F i l t e r e d M n ( m g / L )
Total Manganese vs. Particulate Manganese
y = 0.2429x + 0.0012
R 2 = 0.394
0.00
0.05
0.10
0.15
0.20
0.00 0.05 0.10 0.15 0.20
Total Mn (mg/L)
P a r t i c u l a t e M n ( m g / L )
Total Manganese vs. Colloidal Manganese
y = 0.2155x - 0.0021
R 2 = 0.6868
0.00
0.05
0.10
0.15
0.20
0.00 0.05 0.10 0.15 0.20
Total Mn (mg/L)
C o l l o i d a l M n ( m g / L )
0.22 µm Filtered Manganese vs. 30 kDa Filtered Manganese
y = 0.7952x - 0.0005
R 2 = 0.9135
0.00
0.05
0.10
0.15
0.20
0.00 0.05 0.10 0.15 0.200.22 µm Filtered Mn (mg/L)
3 0 k D a F i l t e r e d M n ( m g / L )
0.22 µm Filtered Manganese vs. Particulate Manganese
y = 0.1403x + 0.0066
R 2 = 0.0874
-0.05
0.00
0.05
0.10
0.15
0.20
0.00 0.05 0.10 0.15 0.20
0.22 µm Filtered Mn (mg/L)
P a r t i c u l a t e M n ( m g / L )
0.22 µm Filtered Manganese vs. Colloidal Manganese
y = 0.2048x + 0.0005
R 2 = 0.4119
0.00
0.05
0.10
0.15
0.20
0.00 0.05 0.10 0.15 0.20
0.22 µm Filtered Mn (mg/L)
C o l l o i d a l M n ( m g / L )
30 kDa Filtered Manganese vs. Parti
0.00
0.05
0.10
0.15
0.20
0.00 0.05 0.1030 kDa Filtered Mn (m
P a r t i c u l a t e M n ( m g / L )
30 kDa Filtered Manganese vs. Coll
0.00
0.05
0.10
0.15
0.20
0.00 0.05 0.1030 kDa Filtered Mn (
C o l l o i d a l M n ( m g / L )
Figure D.55 Correlations of speciated manganese to speciated manganese of seasonal testing distribution system manganese: ground
©2006 AwwaRF. All Rights Reserved.
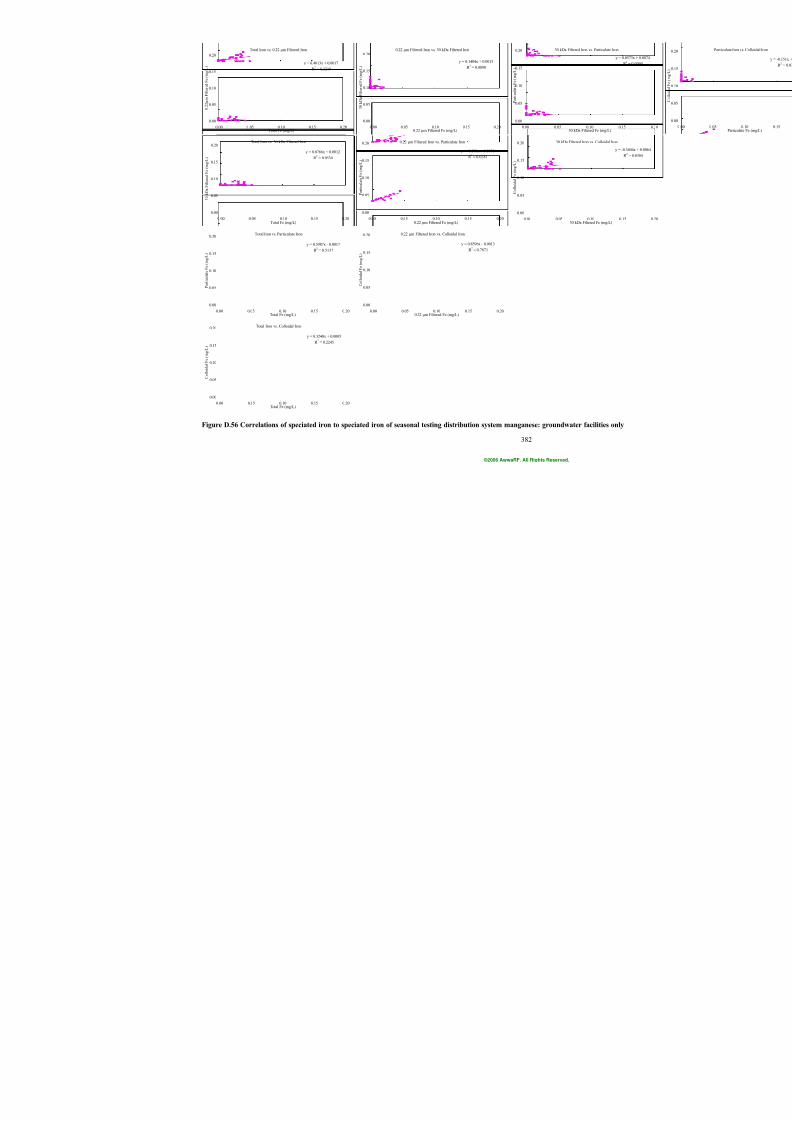
7/21/2019 Occurrence of Manganese in Drinking Water and Manganese Control
http://slidepdf.com/reader/full/occurrence-of-manganese-in-drinking-water-and-manganese-control 408/463
382
Total Iron vs. 0.22 µm Filtered Iron
y = 0.4013x + 0.0017
R 2 = 0.3219
0.00
0.05
0.10
0.15
0.20
0.00 0.05 0.10 0.15 0.20Total Fe (mg/L)
0 . 2
2 µ m F i l t e r e d F e ( m g / L )
Total Iron vs. 30 kDa Filtered Iron
y = 0.0766x + 0.0012
R 2 = 0.0534
0.00
0.05
0.10
0.15
0.20
0.00 0.05 0.10 0.15 0.20Total Fe (mg/L)
3 0 k D a F i l t e r e d F e ( m g / L )
Total Iron vs. Particulate Iron
y = 0.5987x - 0.0017
R 2 = 0.5137
0.00
0.05
0.10
0.15
0.20
0.00 0.05 0.10 0.15 0.20Total Fe (mg/L)
P a r t i c u l a t e F e ( m g / L )
Total Iron vs. Colloidal Iron
y = 0.3248x + 0.0005
R 2 = 0.2245
0.00
0.05
0.10
0.15
0.20
0.00 0.05 0.10 0.15 0.20Total Fe (mg/L)
C o l l o i d a l F e ( m g / L )
0.22 µm Filtered Iron vs. 30 kDa Filtered Iron
y = 0.1404x + 0.0013
R 2 = 0.0898
0.00
0.05
0.10
0.15
0.20
0.00 0.05 0.10 0.15 0.200.22 µm Filtered Fe (mg/L)
3 0 k D a F i l t e r e d F e ( m g / L )
0.22 µm Filtered Iron vs. Particulate Iron
y = -0.198x + 0.0091
R 2 = 0.0281
0.00
0.05
0.10
0.15
0.20
0.00 0.05 0.10 0.15 0.200.22 µm Filtered Fe (mg/L)
P a r t i c u l a t e F e ( m g / L )
0.22 µm Filtered Iron vs. Colloidal Iron
y = 0.8596x - 0.0013
R 2 = 0.7871
0.00
0.05
0.10
0.15
0.20
0.00 0.05 0.10 0.15 0.200.22 µm Filtered Fe (mg/L)
C o l l o i d a l F e ( m g / L )
30 kDa Filtered Iron vs. Particu
0.00
0.05
0.10
0.15
0.20
0.00 0.05 0.1030 kDa Filtered Fe (mg
P a r t i c u l a t e F e ( m g / L )
30 kDa Filtered Iron vs. Colloid
0.00
0.05
0.10
0.15
0.20
0.00 0.05 0.1030 kDa Filtered Fe (m
C o l l o i d a l F e ( m g / L )
Figure D.56 Correlations of speciated iron to speciated iron of seasonal testing distribution system manganese: groundwater facilitie
©2006 AwwaRF. All Rights Reserved.
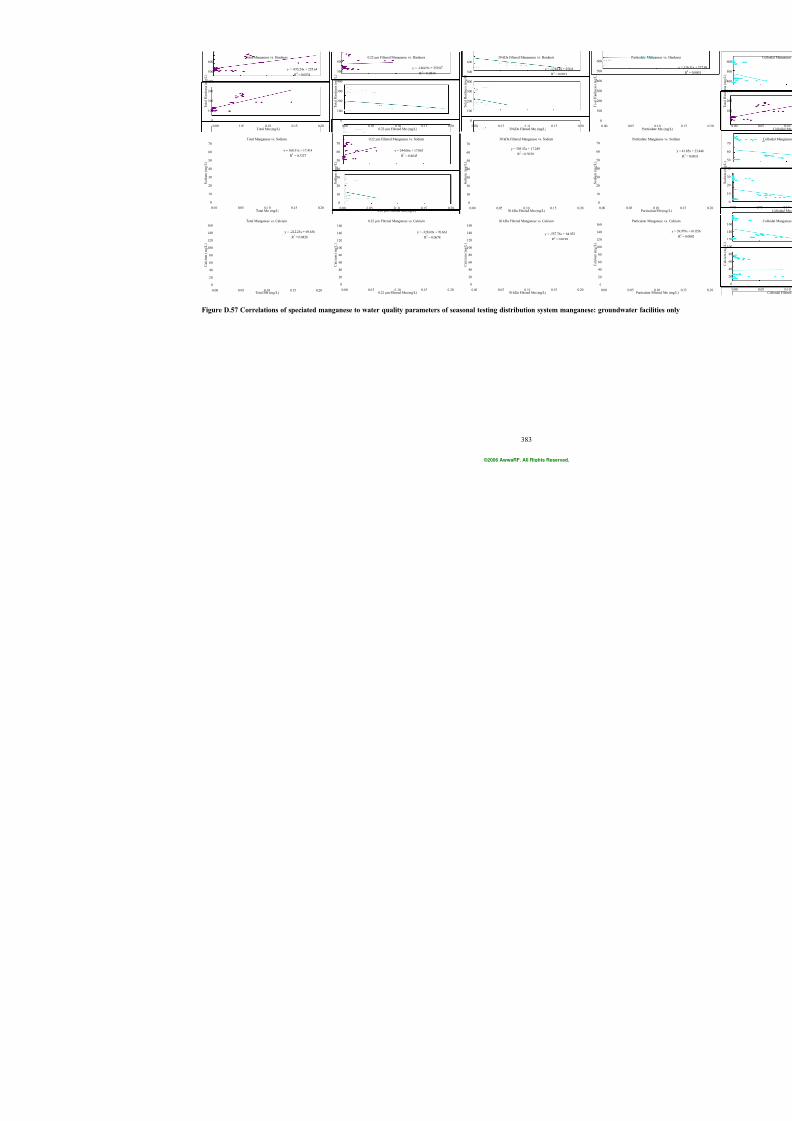
7/21/2019 Occurrence of Manganese in Drinking Water and Manganese Control
http://slidepdf.com/reader/full/occurrence-of-manganese-in-drinking-water-and-manganese-control 409/463
383
Total Manganese vs. Hardness
y = -955.24x + 255.64
R 2 = 0.0534
0
100
200
300
400
500
600
0.00 0.05 0.10 0.15 0.20Total Mn (mg/L)
T o t a l H a r d n e s s ( m g / L )
0.22 µm Filtered Manganese vs. Hardness
y = -1464.9x + 259.87
R 2 = 0.0834
0
100
200
300
400
500
600
0.00 0.05 0.10 0.15 0.200.22 µm Filtered Mn (mg/L)
T o t a l H a r d n e s s ( m g / L )
30 kDa Filtered Manganese vs. Hardness
y = -1744.4x + 256.8
R 2 = 0.0819
0
100
200
300
400
500
600
0.00 0.05 0.10 0.15 0.2030 kDa Filtered Mn (mg/L)
T o t a l H a r d n e s s ( m g / L )
0
100
200
300
400
500
600
0.0
T o t a l H a r d n e s s ( m g / L )
Total Manganese vs. Sodium
y = 168.31x + 17.414
R 2 = 0.3327
0
10
20
30
40
50
60
70
0.00 0.05 0.10 0.15 0.20Total Mn (mg/L)
S o d i u m ( m g / L )
0.22 µm Filtered Manganese vs. Sodium
y = 244.06x + 17.063
R 2 = 0.4645
0
10
20
30
40
50
60
70
0.00 0.05 0.10 0.15 0.200.22 µm Filtered Mn (mg/L)
S o d i u m ( m g / L )
30 kDa Filtered Manganese vs. Sodium
y = 305.52x + 17.249
R 2 = 0.5039
0
10
20
30
40
50
60
70
0.00 0.05 0.10 0.15 0.2030 kDa Filtered Mn (mg/L)
S o d i u m ( m g / L )
0
10
20
30
40
50
60
70
0.00
S o d i u m ( m g / L )
Total Manganese vs. Calcium
y = -212.25x + 69.636
R 2
= 0.0426
0
20
40
60
80
100
120
140
160
0.00 0.05 0.10 0.15 0.20Total Mn (mg/L)
C a l c i u m ( m g / L )
0.22 µm Filtered Manganese vs. Calcium
y = -328.69x + 70.663
R 2
= 0.0678
0
20
40
60
80
100
120
140
160
0.00 0.05 0.10 0.15 0.200.22 µm Filtered Mn (mg/L)
C a l c i u m ( m g / L )
30 kDa Filtered Manganese vs. Calcium
y = -557.76x + 64.952
R 2 = 0.0199
0
20
40
60
80
100
120
140
160
0.00 0.05 0.10 0.15 0.2030 kDa Filtered Mn (mg/L)
C a l c i u m ( m g / L )
0
20
40
60
80
100
120
140
160
0.00
C a l c i u m ( m g / L )
Figure D.57 Correlations of speciated manganese to water quality parameters of seasonal testing distribution system manganese: gr
©2006 AwwaRF. All Rights Reserved.
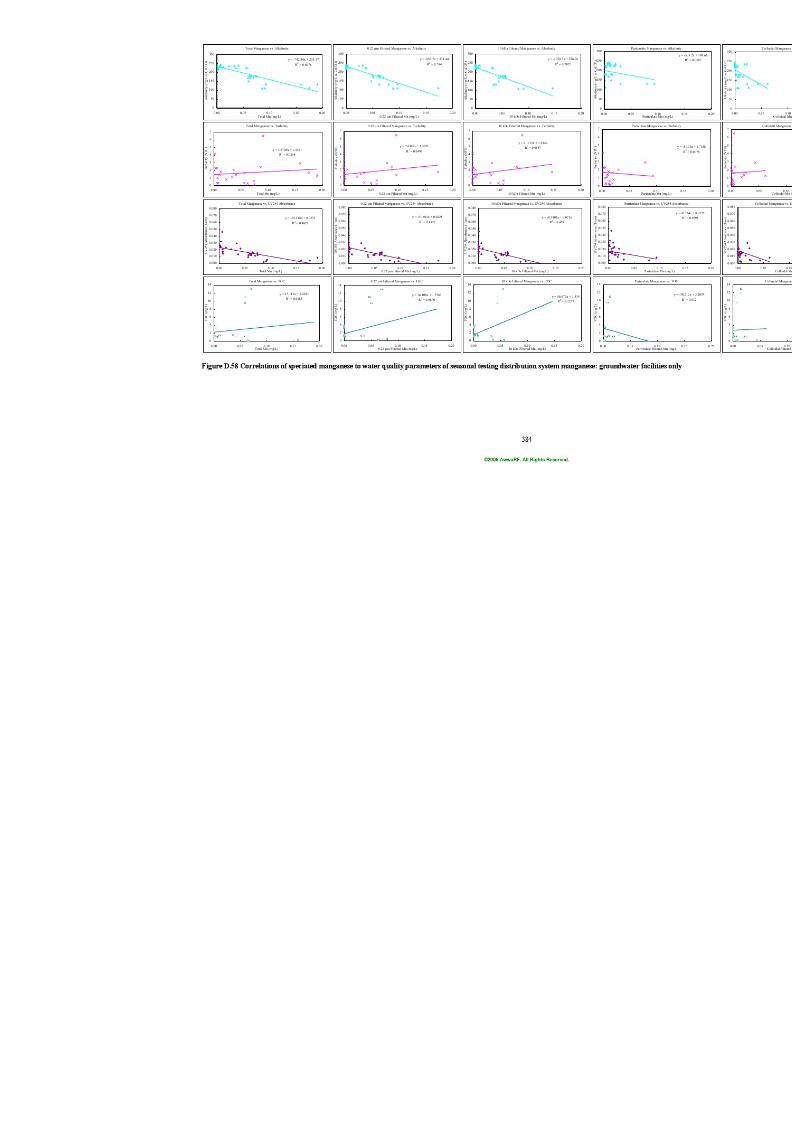
7/21/2019 Occurrence of Manganese in Drinking Water and Manganese Control
http://slidepdf.com/reader/full/occurrence-of-manganese-in-drinking-water-and-manganese-control 410/463
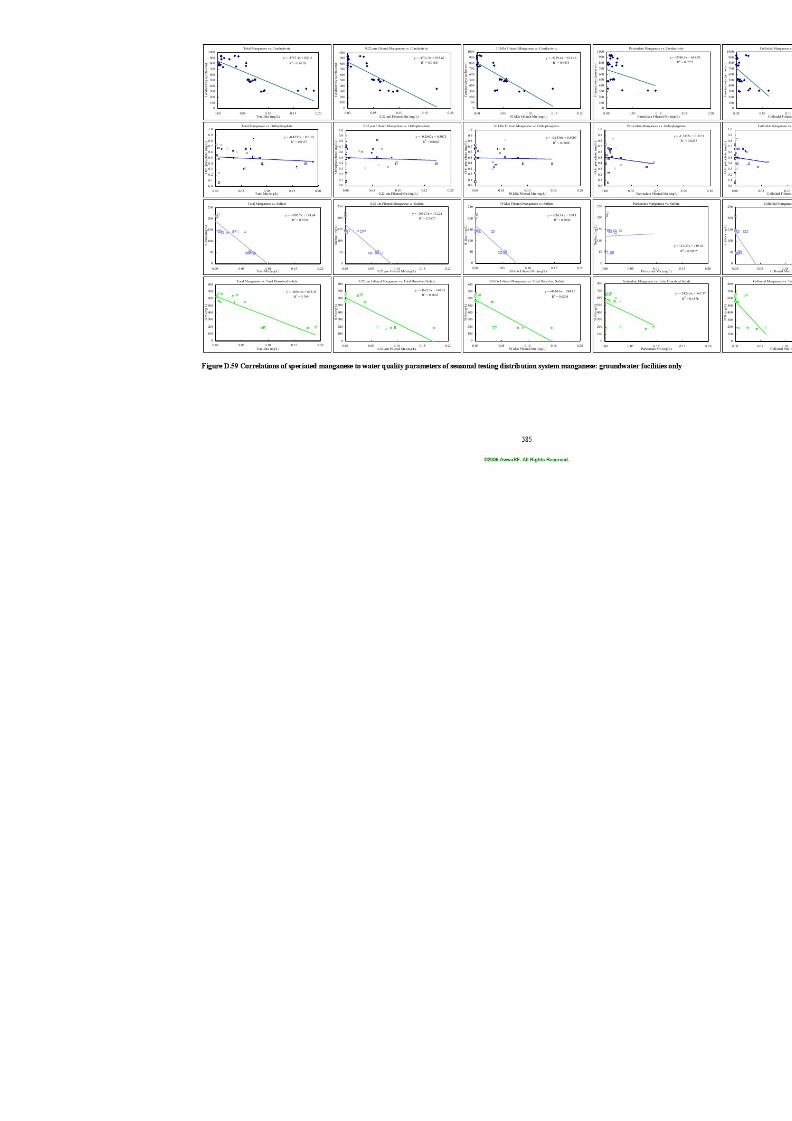
7/21/2019 Occurrence of Manganese in Drinking Water and Manganese Control
http://slidepdf.com/reader/full/occurrence-of-manganese-in-drinking-water-and-manganese-control 411/463
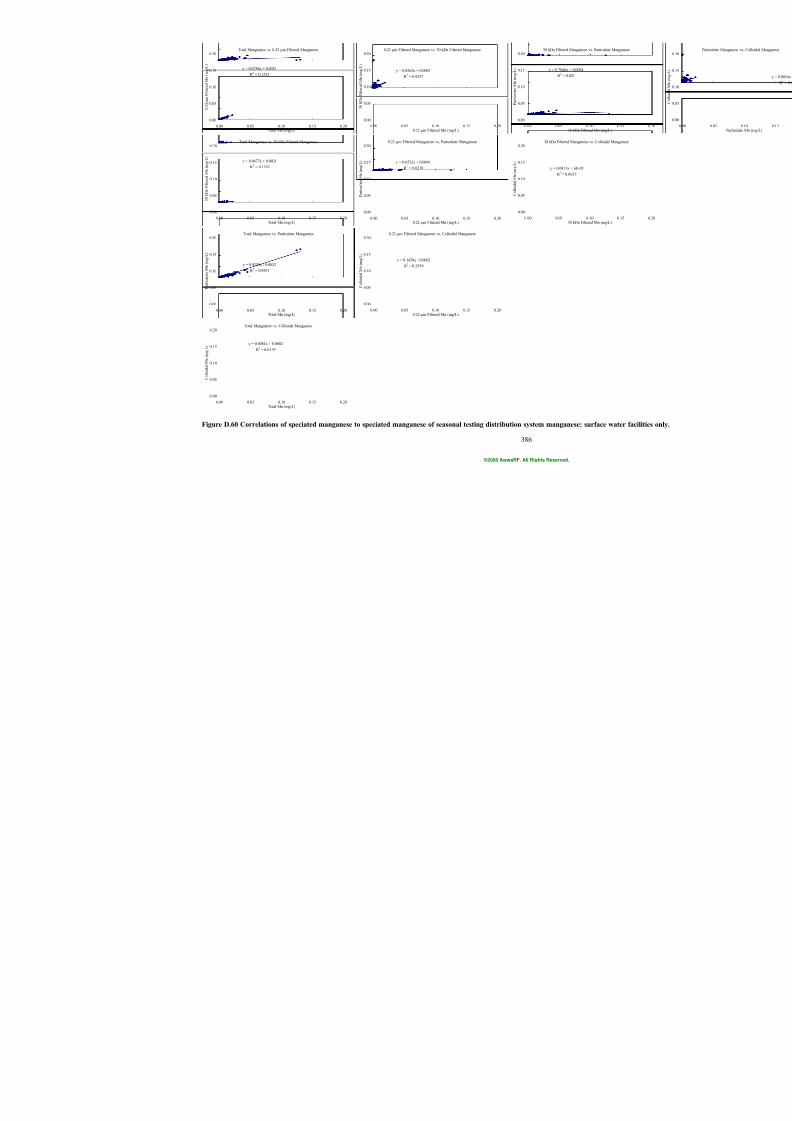
7/21/2019 Occurrence of Manganese in Drinking Water and Manganese Control
http://slidepdf.com/reader/full/occurrence-of-manganese-in-drinking-water-and-manganese-control 412/463
386
Total Manganese vs. 0.22 µm Filtered Manganese
y = 0.0758x + 0.0023
R 2 = 0.1253
0.00
0.05
0.10
0.15
0.20
0.00 0.05 0.10 0.15 0.20Total Mn (mg/L)
0 . 2
2 µ m F i l t e r e d M n ( m g / L )
Total Manganese vs. 30 kDa Filtered Manganese
y = 0.0677x + 0.0021
R 2 = 0.1263
0.00
0.05
0.10
0.15
0.20
0.00 0.05 0.10 0.15 0.20Total Mn (mg/L)
3 0 k D a F i l t e r e d M n ( m g / L )
Total Manganese vs. Particulate Manganese
y = 0.9239x - 0.0023
R 2 = 0.9551
0.00
0.05
0.10
0.15
0.20
0.00 0.05 0.10 0.15 0.20Total Mn (mg/L)
P a r t i c u l a t e M n ( m g / L )
Total Manganese vs. Colloidal Manganese
y = 0.0081x + 0.0002
R 2 = 0.0179
0.00
0.05
0.10
0.15
0.20
0.00 0.05 0.10 0.15 0.20Total Mn (mg/L)
C o l l o i d a l M n ( m g / L )
0.22 µm Filtered Manganese vs. 30 kDa Filtered Manganese
y = 0.8562x + 0.0002
R 2 = 0.9257
0.00
0.05
0.10
0.15
0.20
0.00 0.05 0.10 0.15 0.200.22 µm Filtered Mn (mg/L)
3 0 k D a F i l t e r e d M n ( m g / L )
0.22 µm Filtered Manganese vs. Particulate Manganese
y = 0.6532x + 0.0066
R 2 = 0.0219
0.00
0.05
0.10
0.15
0.20
0.00 0.05 0.10 0.15 0.200.22 µm Filtered Mn (mg/L)
P a r t i c u l a t e M n ( m g / L )
0.22 µm Filtered Manganese vs. Colloidal Manganese
y = 0.1438x - 0.0002
R 2 = 0.2599
0.00
0.05
0.10
0.15
0.20
0.00 0.05 0.10 0.15 0.200.22 µm Filtered Mn (mg/L)
C o l l o i d a l M n ( m g / L )
30 kDa Filtered Manganese vs. Particu
y = 0.7846x + 0.0064
R 2 = 0.025
0.00
0.05
0.10
0.15
0.20
0.00 0.05 0.1030 kDa Filtered Mn (mg
P a r t i c u l a t e M n ( m g / L )
30 kDa Filtered Manganese vs. Colloid
y = 0.0811x + 6E-05
R 2 = 0.0655
0.00
0.05
0.10
0.15
0.20
0.00 0.05 0.1030 kDa Filtered Mn (mg
C o l l o i d a l M n ( m g / L )
Figure D.60 Correlations of speciated manganese to speciated manganese of seasonal testing distribution system manganese: surface
©2006 AwwaRF. All Rights Reserved.
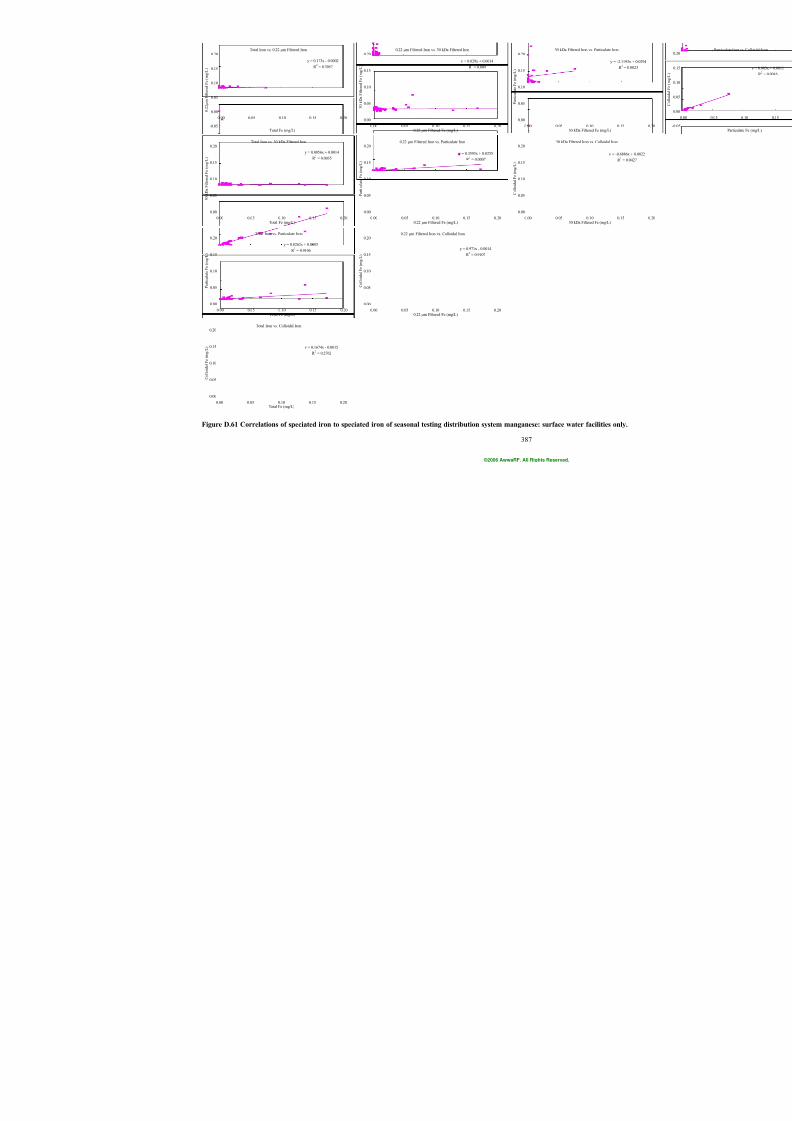
7/21/2019 Occurrence of Manganese in Drinking Water and Manganese Control
http://slidepdf.com/reader/full/occurrence-of-manganese-in-drinking-water-and-manganese-control 413/463
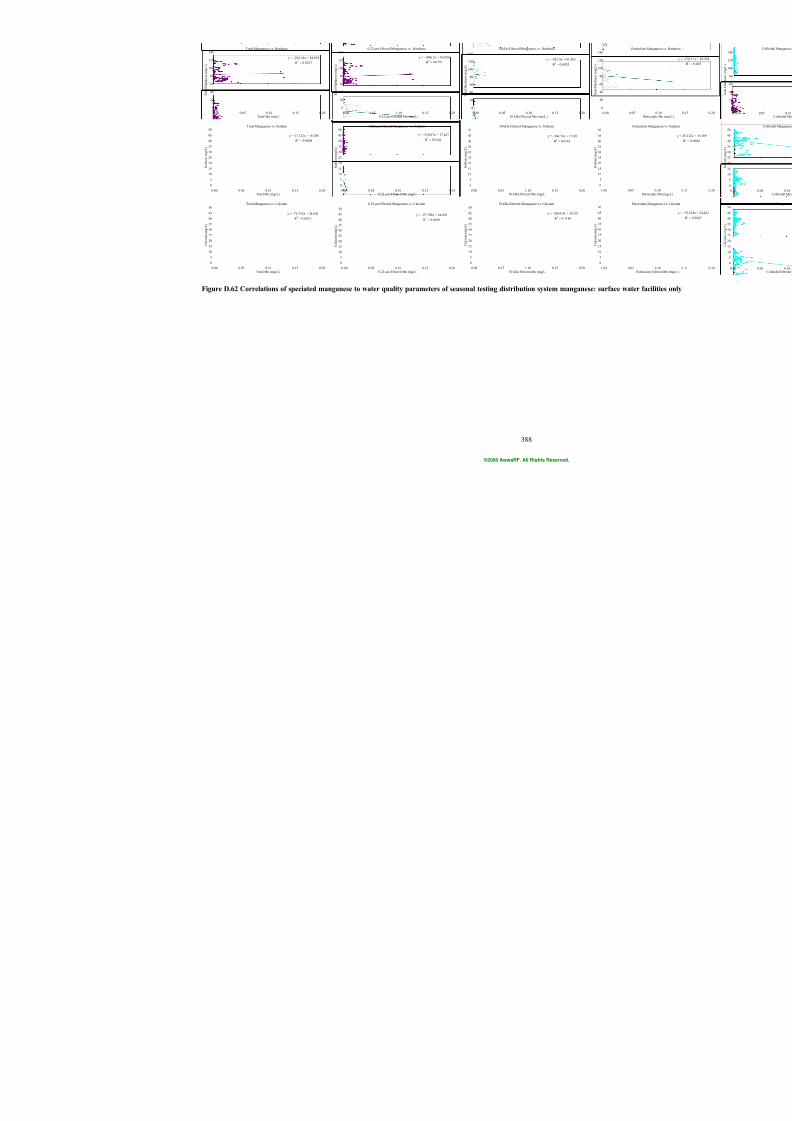
7/21/2019 Occurrence of Manganese in Drinking Water and Manganese Control
http://slidepdf.com/reader/full/occurrence-of-manganese-in-drinking-water-and-manganese-control 414/463
388
Total Manganese vs. Hardness
y = -292.14x + 84.055
R 2 = 0.0327
0
20
40
60
80
100
120
140
0.00 0.05 0.10 0.15 0.20Total Mn (mg/L)
T o t a l H a r d n e s s ( m g / L )
0.22 µm Filtered Manganese vs. Hardness
y = -1086.5x + 84.059
R 2 = 0.0207
0
20
40
60
80
100
120
140
0.00 0.05 0.10 0.15 0.200.22 µm Filtered Mn (mg/L)
T o t a l H a r d n e s s ( m g / L )
30 kDa Filtered Manganese vs. Hardness
y = -422.9x + 81.803
R 2 = 0.0025
0
20
40
60
80
100
120
140
0.00 0.05 0.10 0.15 0.2030 kDa Filtered Mn (mg/L)
T o t a l H a r d n e s s ( m g / L )
0
20
40
60
80
100
120
140
0.0
T o t a l H a r d n e s s ( m g / L )
Total Manganese vs. Sodium
y = 11.122x + 16.286
R 2 = 0.0004
0
5
10
15
20
25
30
35
40
45
50
0.00 0.05 0.10 0.15 0.20Total Mn (mg/L)
S o d i u m ( m g / L )
0.22 µm Filtered Manganese vs. Sodium
y = -310.07x + 17.427
R 2 = 0.0146
0
5
10
15
20
25
30
35
40
45
50
0.00 0.05 0.10 0.15 0.200.22 µm Filtered Mn (mg/L)
S o d i u m ( m g / L )
30 kDa Filtered Manganese vs. Sodium
y = -364.74x + 17.49
R 2 = 0.0161
0
5
10
15
20
25
30
35
40
45
50
0.00 0.05 0.10 0.15 0.2030 kDa Filtered Mn (mg/L)
S o d i u m ( m g / L )
0
5
10
15
20
25
30
35
40
45
50
0.00
S o d i u m ( m g / L )
Total Manganese vs. Calcium
y = -75.755x + 24.641
R 2 = 0.0251
0
5
10
15
20
25
30
35
40
45
50
0.00 0.05 0.10 0.15 0.20Total Mn (mg/L)
C a l c i u m ( m g / L )
0.22 µm Filtered Manganese vs. Calcium
y = -97.702x + 24.029
R 2 = 0.0019
0
5
10
15
2025
30
35
40
45
50
0.00 0.05 0.10 0.15 0.200.22 µm Filtered Mn (mg/L)
C a l c i u m
( m g / L )
30 kDa Filtered Manganese vs. Calcium
y = -2664.9x + 24.524
R 2 = 0.1146
0
5
10
15
20
25
30
35
40
45
50
0.00 0.05 0.10 0.15 0.2030 kDa Filtered Mn (mg/L)
C a l c i u m ( m g / L )
0
5
10
15
20
25
30
35
40
45
50
0.00
C a l c i u m ( m g / L )
Figure D.62 Correlations of speciated manganese to water quality parameters of seasonal testing distribution system manganese: su
©2006 AwwaRF. All Rights Reserved.
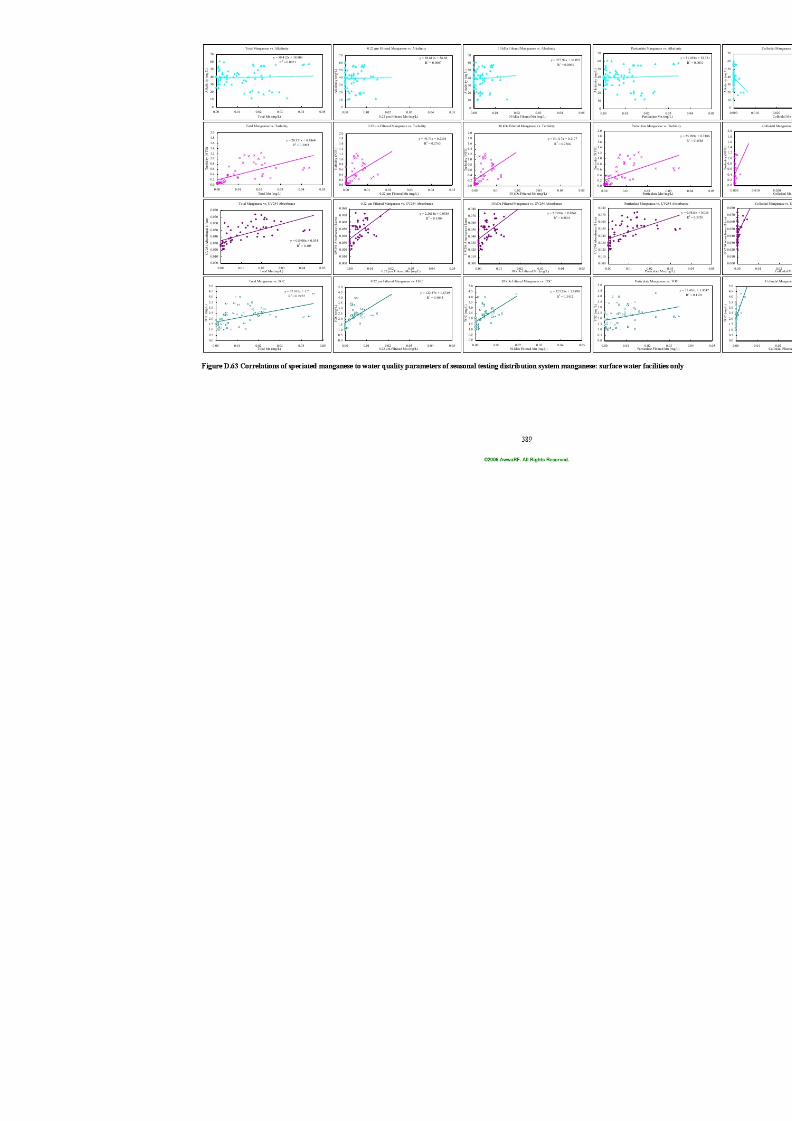
7/21/2019 Occurrence of Manganese in Drinking Water and Manganese Control
http://slidepdf.com/reader/full/occurrence-of-manganese-in-drinking-water-and-manganese-control 415/463
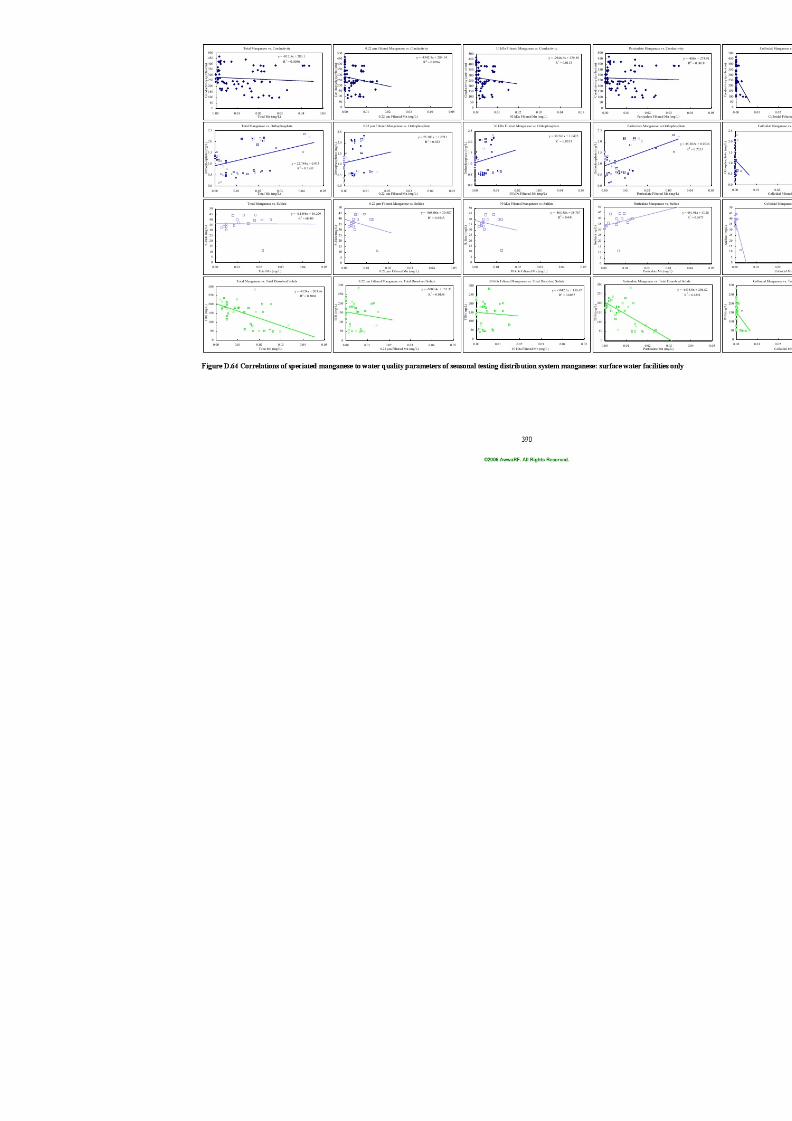
7/21/2019 Occurrence of Manganese in Drinking Water and Manganese Control
http://slidepdf.com/reader/full/occurrence-of-manganese-in-drinking-water-and-manganese-control 416/463

7/21/2019 Occurrence of Manganese in Drinking Water and Manganese Control
http://slidepdf.com/reader/full/occurrence-of-manganese-in-drinking-water-and-manganese-control 417/463
391
APPENDIX E
CASE STUDY (I) DATA
FILTER EFFLUENT MANGANESE AS A FUNCTION OF TEMPERATURE
FREE CHLORINE ≥ 0.40 mg/L AND FREE CHLORINE < 0.40 mg/L
©2006 AwwaRF. All Rights Reserved.
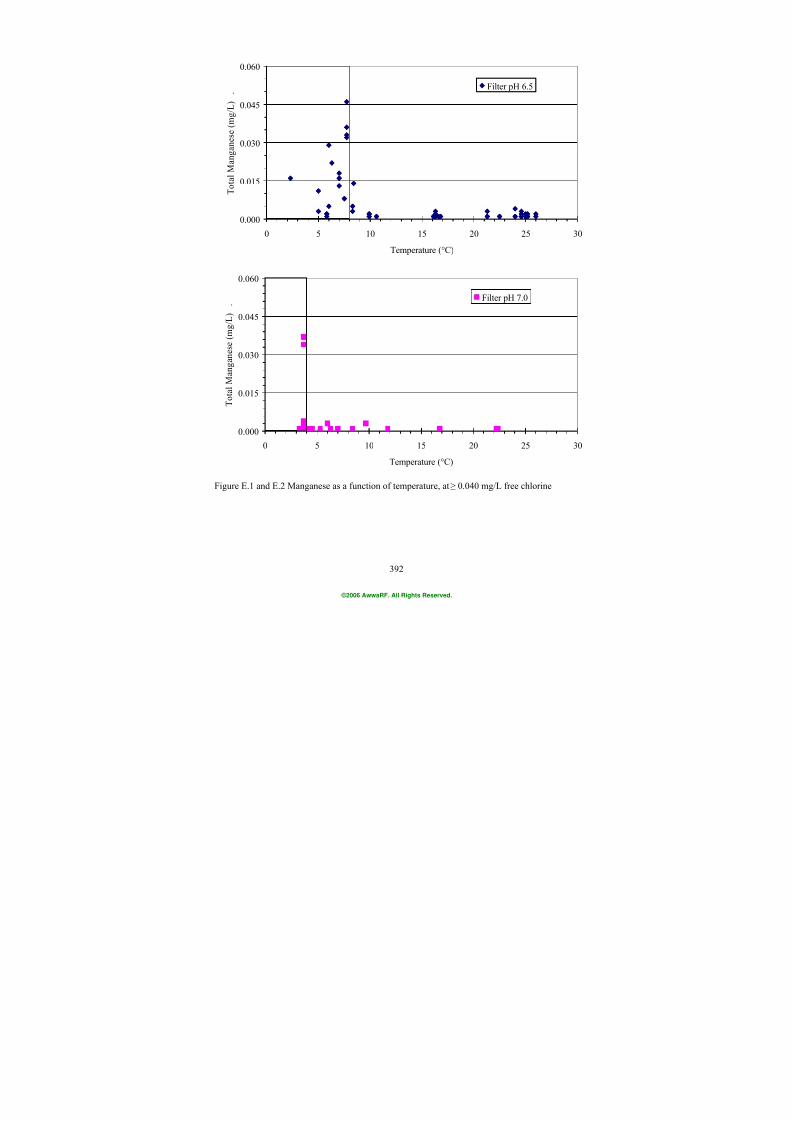
7/21/2019 Occurrence of Manganese in Drinking Water and Manganese Control
http://slidepdf.com/reader/full/occurrence-of-manganese-in-drinking-water-and-manganese-control 418/463
392
0.000
0.015
0.030
0.045
0.060
0 5 10 15 20 25 30Temperature (°C)
T o t a l M a n g a n e s e ( m g / L )
.Filter pH 6.5
0.000
0.015
0.030
0.045
0.060
0 5 10 15 20 25 30
Temperature (°C)
T o t a l M a n g a n
e s e ( m g / L )
.Filter pH 7.0
Figure E.1 and E.2 Manganese as a function of temperature, at ≥ 0.040 mg/L free chlorine
©2006 AwwaRF. All Rights Reserved.
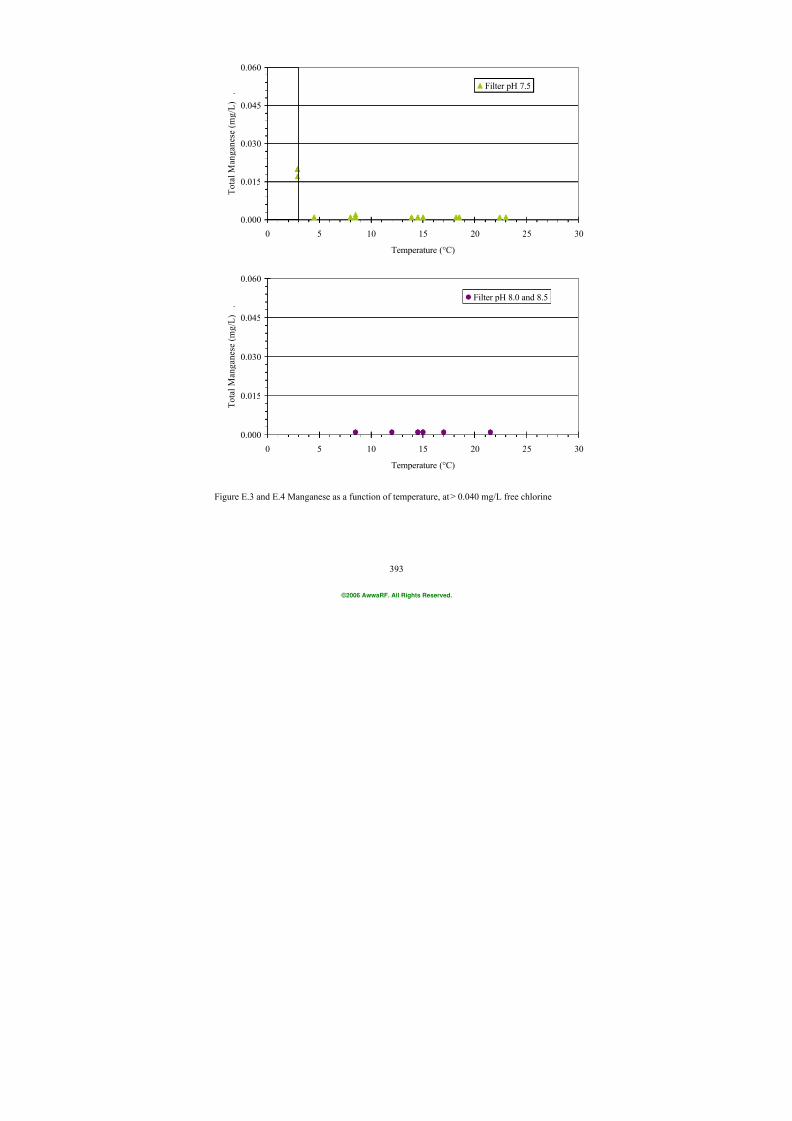
7/21/2019 Occurrence of Manganese in Drinking Water and Manganese Control
http://slidepdf.com/reader/full/occurrence-of-manganese-in-drinking-water-and-manganese-control 419/463
393
0.000
0.015
0.030
0.045
0.060
0 5 10 15 20 25 30Temperature (°C)
T o t a l M a n g a n e s e ( m g / L )
.Filter pH 7.5
0.000
0.015
0.030
0.045
0.060
0 5 10 15 20 25 30
Temperature (°C)
T o t a l M a n g a n e s e ( m g / L )
.Filter pH 8.0 and 8.5
Figure E.3 and E.4 Manganese as a function of temperature, at ≥ 0.040 mg/L free chlorine
©2006 AwwaRF. All Rights Reserved.
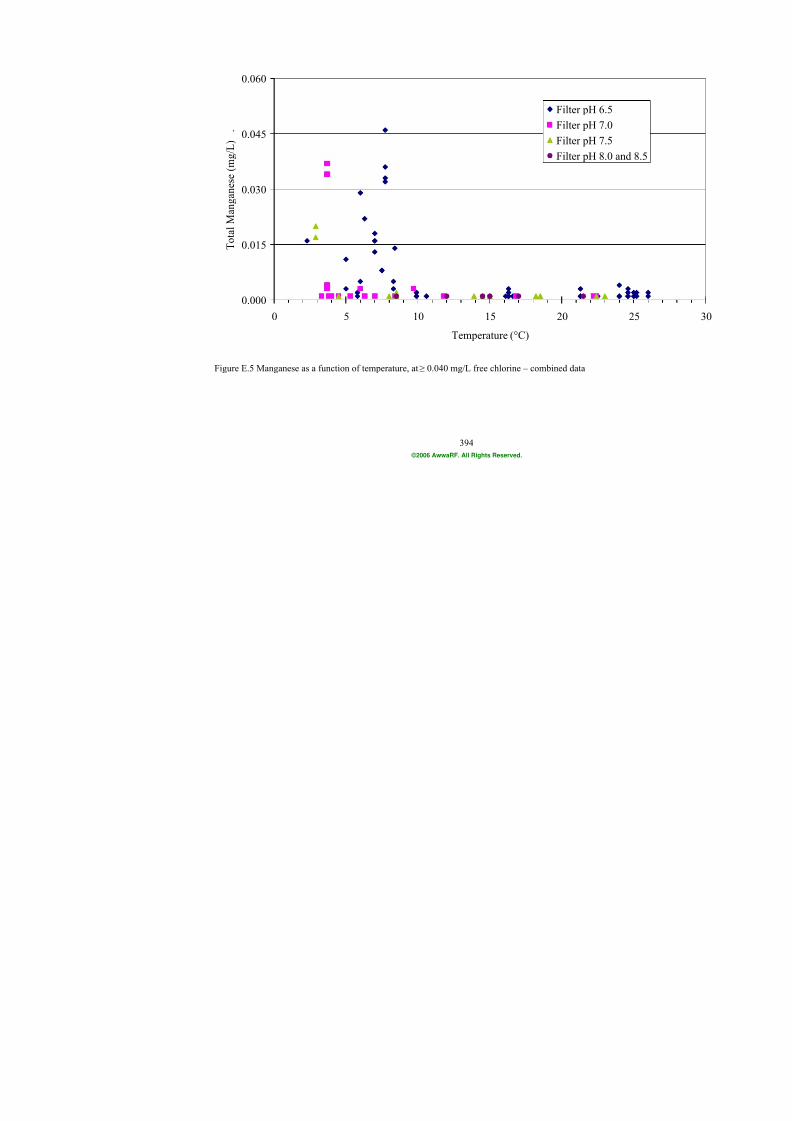
7/21/2019 Occurrence of Manganese in Drinking Water and Manganese Control
http://slidepdf.com/reader/full/occurrence-of-manganese-in-drinking-water-and-manganese-control 420/463
394
0.000
0.015
0.030
0.045
0.060
0 5 10 15 20
Temperature (°C)
T o t a l M a n g a n e s e ( m g / L )
.
Filter pH 6.
Filter pH 7.
Filter pH 7.
Filter pH 8.
Figure E.5 Manganese as a function of temperature, at ≥ 0.040 mg/L free chlorine – combined data
©2006 AwwaRF. All Rights Reserved.
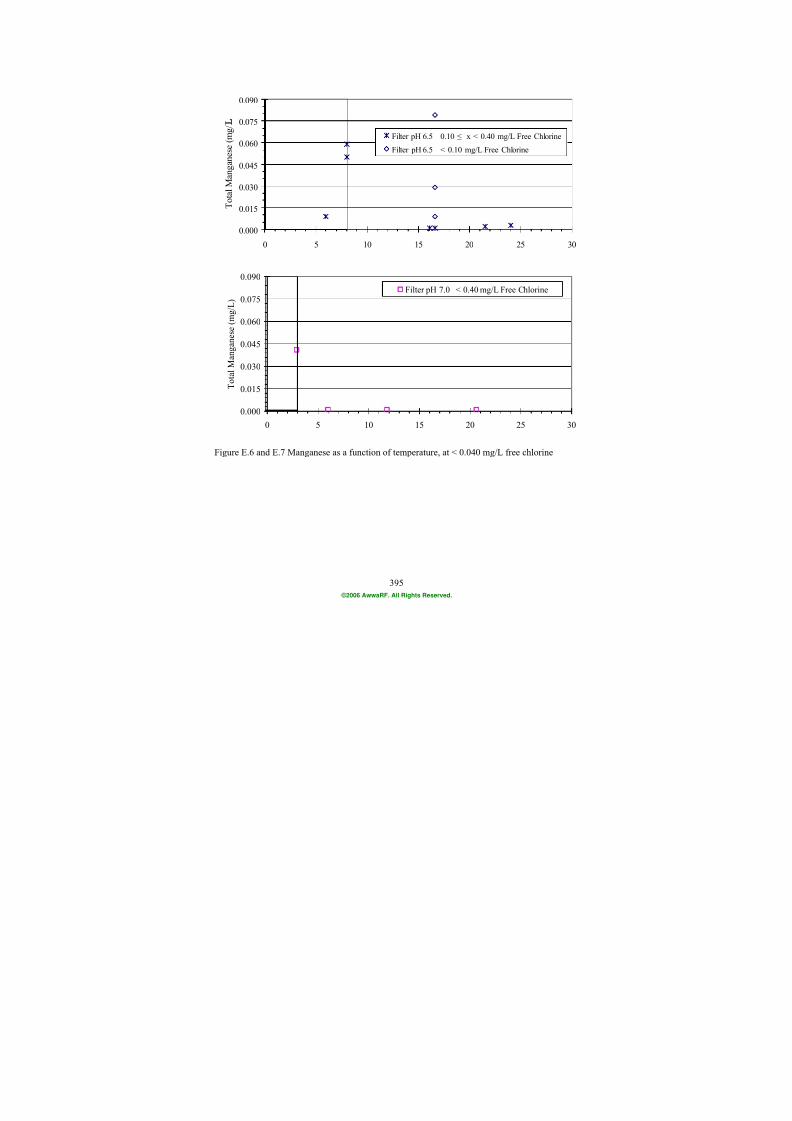
7/21/2019 Occurrence of Manganese in Drinking Water and Manganese Control
http://slidepdf.com/reader/full/occurrence-of-manganese-in-drinking-water-and-manganese-control 421/463
395
0.000
0.015
0.030
0.045
0.060
0.075
0.090
0 5 10 15 20 25 30
T o t a l M a n g a n e s e ( m g /
Filter pH 6.5 0.10 ≤ x < 0.40 mg/L Free Chlorine
Filter pH 6.5 < 0.10 mg/L Free Chlorine
0.000
0.015
0.030
0.045
0.060
0.075
0.090
0 5 10 15 20 25 30
T o t a l M a n g a n e s e ( m g / L )
Filter pH 7.0 < 0.40 mg/L Free Chlorine
Figure E.6 and E.7 Manganese as a function of temperature, at < 0.040 mg/L free chlorine
©2006 AwwaRF. All Rights Reserved.
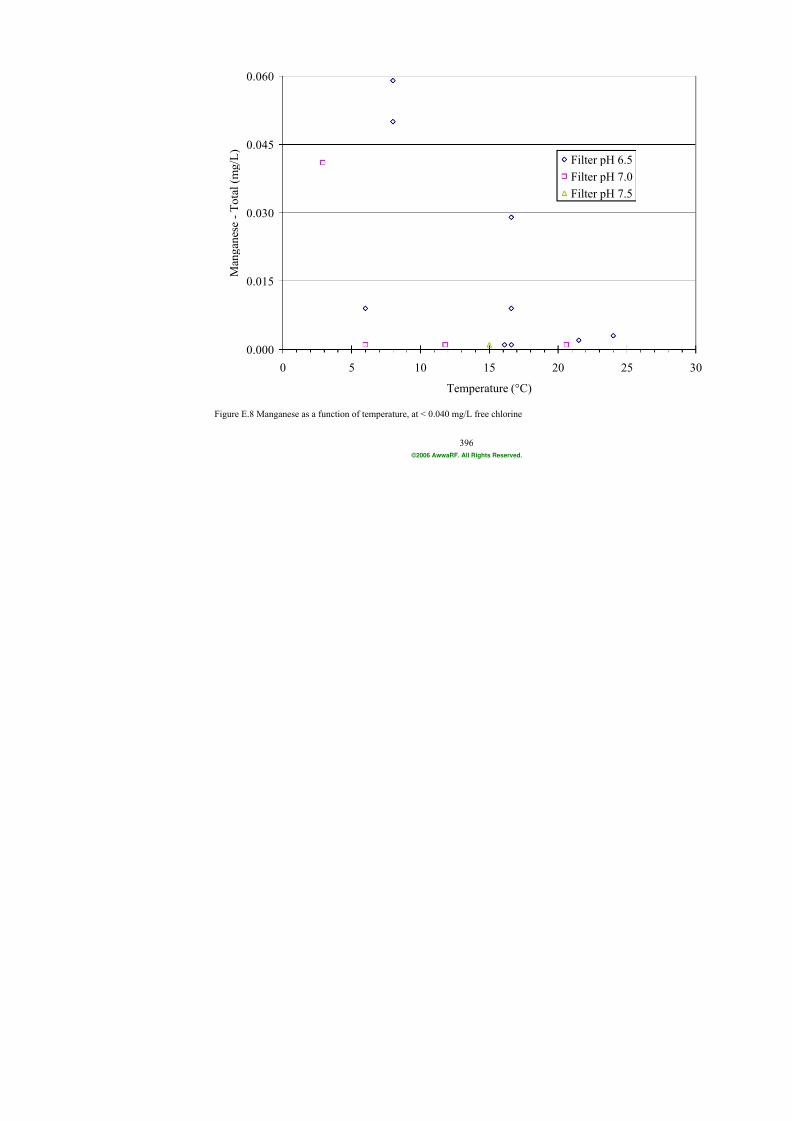
7/21/2019 Occurrence of Manganese in Drinking Water and Manganese Control
http://slidepdf.com/reader/full/occurrence-of-manganese-in-drinking-water-and-manganese-control 422/463
396
0.000
0.015
0.030
0.045
0.060
0 5 10 15 20
Temperature (°C)
M a n g a n e
s e - T o t a l ( m g / L )
Filter p
Filter p
Filter p
Figure E.8 Manganese as a function of temperature, at < 0.040 mg/L free chlorine
©2006 AwwaRF. All Rights Reserved.
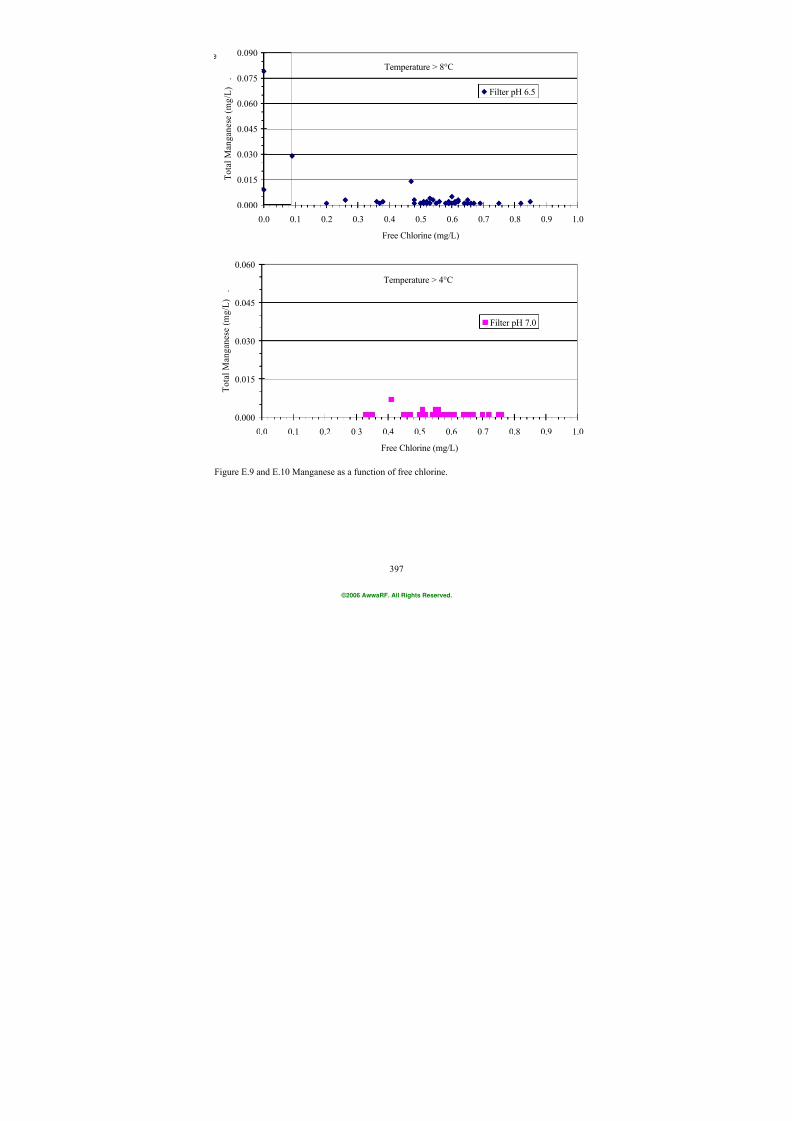
7/21/2019 Occurrence of Manganese in Drinking Water and Manganese Control
http://slidepdf.com/reader/full/occurrence-of-manganese-in-drinking-water-and-manganese-control 423/463
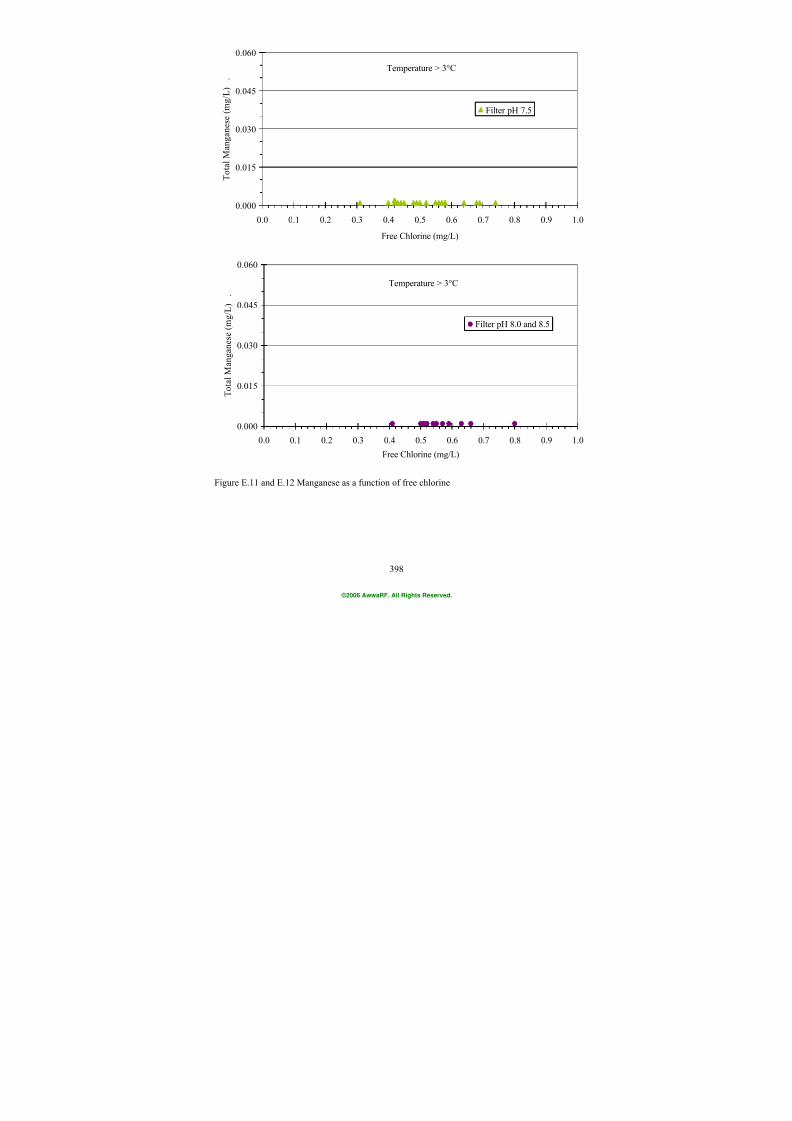
7/21/2019 Occurrence of Manganese in Drinking Water and Manganese Control
http://slidepdf.com/reader/full/occurrence-of-manganese-in-drinking-water-and-manganese-control 424/463
398
0.000
0.015
0.030
0.045
0.060
0.0 0.1 0.2 0.3 0.4 0.5 0.6 0.7 0.8 0.9 1.0
Free Chlorine (mg/L)
T o t a l M a n g a n e s e
( m g / L )
.
Filter pH 7.5
Temperature > 3°C
0.000
0.015
0.030
0.045
0.060
0.0 0.1 0.2 0.3 0.4 0.5 0.6 0.7 0.8 0.9 1.0
Free Chlorine (mg/L)
T o t a l M a n g
a n e s e ( m g / L )
.
Filter pH 8.0 and 8.5
Temperature > 3°C
Figure E.11 and E.12 Manganese as a function of free chlorine
©2006 AwwaRF. All Rights Reserved.
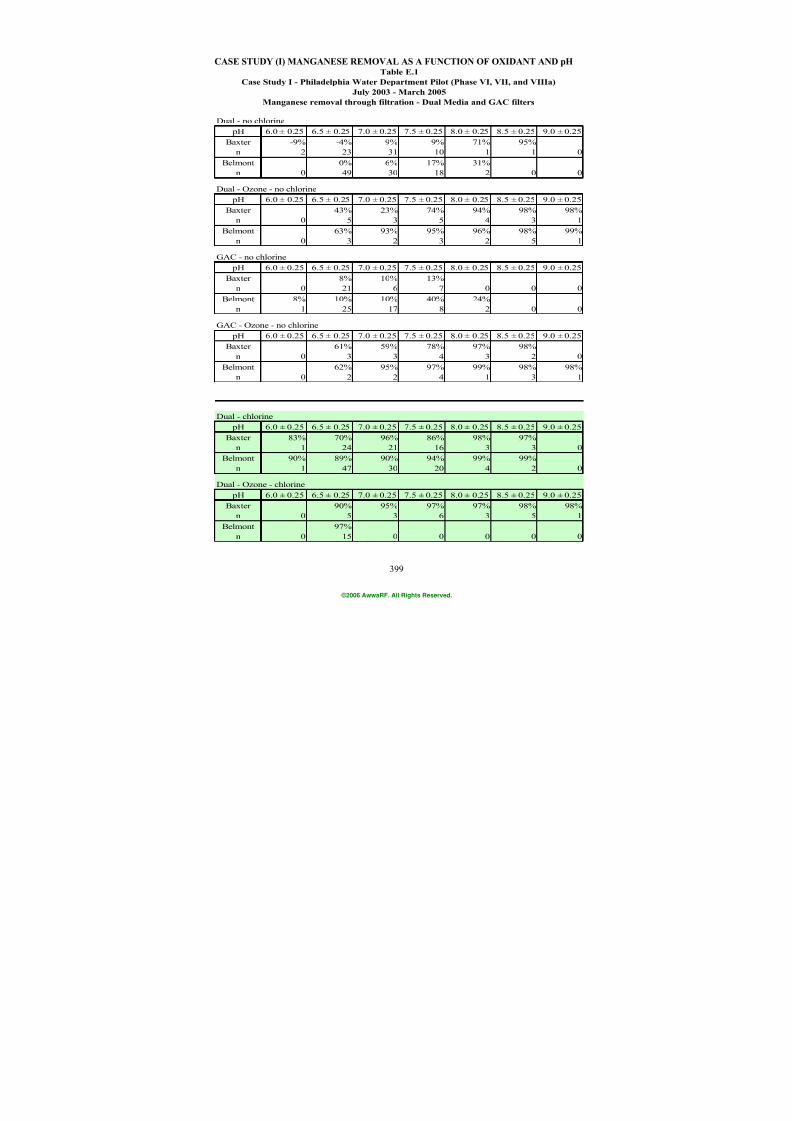
7/21/2019 Occurrence of Manganese in Drinking Water and Manganese Control
http://slidepdf.com/reader/full/occurrence-of-manganese-in-drinking-water-and-manganese-control 425/463
399
CASE STUDY (I) MANGANESE REMOVAL AS A FUNCTION OF OXIDANT AND pH
Dual - no chlorine
pH 6.0 ± 0.25 6.5 ± 0.25 7.0 ± 0.25 7.5 ± 0.25 8.0 ± 0.25 8.5 ± 0.25 9.0 ± 0.25
Baxter -9% -4% 9% 9% 71% 95%
n 2 23 31 10 1 1 0
Belmont 0% 6% 17% 31%
n 0 49 30 18 2 0 0
Dual - Ozone - no chlorine
pH 6.0 ± 0.25 6.5 ± 0.25 7.0 ± 0.25 7.5 ± 0.25 8.0 ± 0.25 8.5 ± 0.25 9.0 ± 0.25
Baxter 43% 23% 74% 94% 98% 98%
n 0 5 3 5 4 3 1
Belmont 63% 93% 95% 96% 98% 99%
n 0 3 2 3 2 5 1
GAC - no chlorine
pH 6.0 ± 0.25 6.5 ± 0.25 7.0 ± 0.25 7.5 ± 0.25 8.0 ± 0.25 8.5 ± 0.25 9.0 ± 0.25
Baxter 8% 10% 13%
n 0 21 6 7 0 0 0
Belmont 8% 10% 10% 40% 24%
n 1 25 17 8 2 0 0
GAC - Ozone - no chlorine
pH 6.0 ± 0.25 6.5 ± 0.25 7.0 ± 0.25 7.5 ± 0.25 8.0 ± 0.25 8.5 ± 0.25 9.0 ± 0.25
Baxter 61% 59% 78% 97% 98%
n 0 3 3 4 3 2 0Belmont 62% 95% 97% 99% 98% 98%
n 0 2 2 4 1 3 1
Dual - chlorine
pH 6.0 ± 0.25 6.5 ± 0.25 7.0 ± 0.25 7.5 ± 0.25 8.0 ± 0.25 8.5 ± 0.25 9.0 ± 0.25
Baxter 83% 70% 96% 86% 98% 97%
n 1 24 21 16 3 3 0
Belmont 90% 89% 90% 94% 99% 99%
n 1 47 30 20 4 2 0
Dual - Ozone - chlorine
pH 6.0 ± 0.25 6.5 ± 0.25 7.0 ± 0.25 7.5 ± 0.25 8.0 ± 0.25 8.5 ± 0.25 9.0 ± 0.25
Baxter 90% 95% 97% 97% 98% 98%
n 0 5 3 6 3 5 1
Belmont 97%
n 0 15 0 0 0 0 0
Table E.1
Case Study I - Philadelphia Water Department Pilot (Phase VI, VII, and VIIIa)
July 2003 - March 2005
Manganese removal through filtration - Dual Media and GAC filters
©2006 AwwaRF. All Rights Reserved.
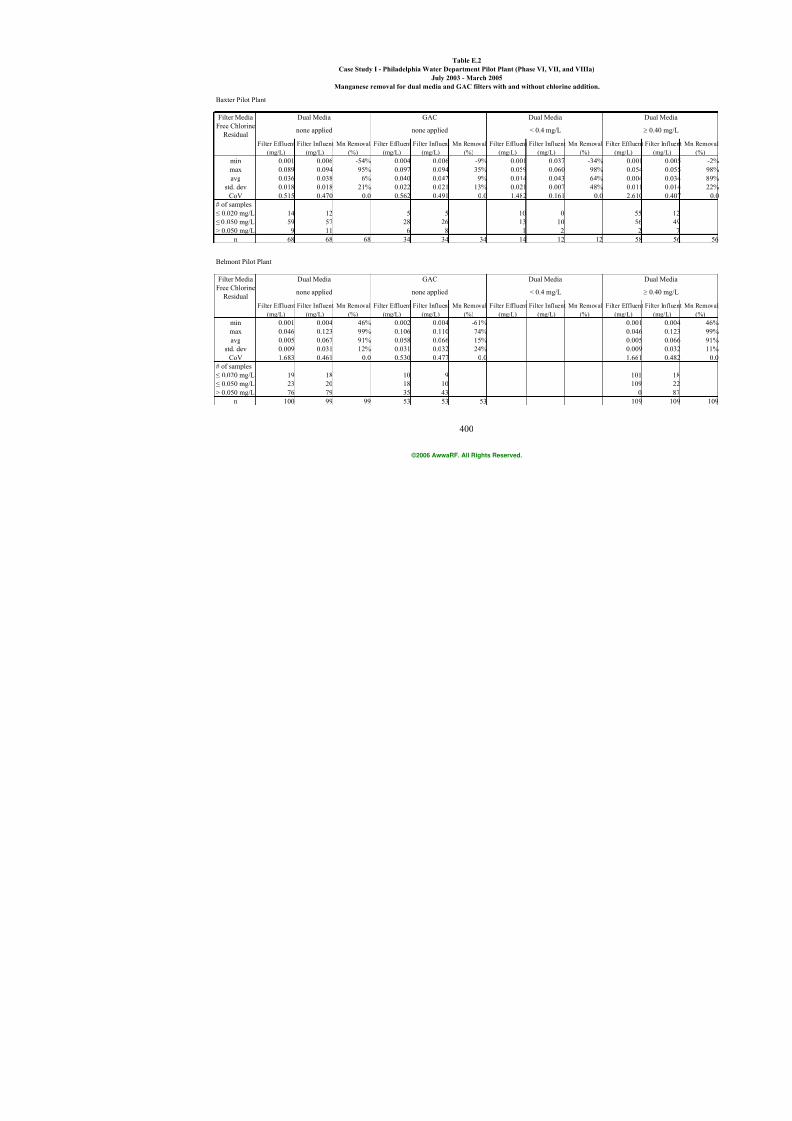
7/21/2019 Occurrence of Manganese in Drinking Water and Manganese Control
http://slidepdf.com/reader/full/occurrence-of-manganese-in-drinking-water-and-manganese-control 426/463
400
Baxter Pilot Plant
Filter MediaFree Chlorine
Residual
Filter Effluent Filter Influent Mn Removal Filter Effluent Filter Influent Mn Removal Filter Effluent Filter Influent Mn Removal F
(mg/L) (mg/L) (%) (mg/L) (mg/L) (%) (mg/L) (mg/L) (%)
min 0.001 0.006 -54% 0.004 0.006 -9% 0.001 0.037 -34%
max 0.089 0.094 95% 0.097 0.094 35% 0.059 0.060 98%
avg 0.036 0.038 6% 0.040 0.042 9% 0.014 0.043 64%
std. dev 0.018 0.018 21% 0.022 0.021 13% 0.021 0.007 48%
CoV 0.515 0.470 0.0 0.562 0.491 0.0 1.482 0.161 0.0
# of samples
≤ 0.020 mg/L 14 12 5 5 10 0
≤ 0.050 mg/L 59 57 28 26 13 10
> 0.050 mg/L 9 11 6 8 1 2
n 68 68 68 34 34 34 14 12 12
Belmont Pilot Plant
Filter Media
Free Chlorine
Residual
Filter Effluent Filter Influent Mn Removal Filter Effluent Filter Influent Mn Removal Filter Effluent Filter Influent Mn Removal F
(mg/L) (mg/L) (%) (mg/L) (mg/L) (%) (mg/L) (mg/L) (%)
min 0.001 0.004 46% 0.002 0.004 -61%
max 0.046 0.123 99% 0.106 0.110 74%
avg 0.005 0.067 91% 0.058 0.066 15%
std. dev 0.009 0.031 12% 0.031 0.032 24%
CoV 1.683 0.461 0.0 0.530 0.477 0.0
# of samples
≤ 0.020 mg/L 19 18 10 9
≤ 0.050 mg/L 23 20 18 10
> 0.050 mg/L 76 79 35 43
n 100 99 99 53 53 53
Dual Media
none applied
none applied < 0.4 mg/Lnone applied
GAC
Dual Media
< 0.4 mg/L
GAC
Dual Media Dual Media
Table E.2
Case Study I - Philadelphia Water Department Pilot Plant (Phase VI, VII, and VIIIa)
Manganese removal for dual media and GAC filters with and without chlorine addition.
July 2003 - March 2005
none applied
©2006 AwwaRF. All Rights Reserved.
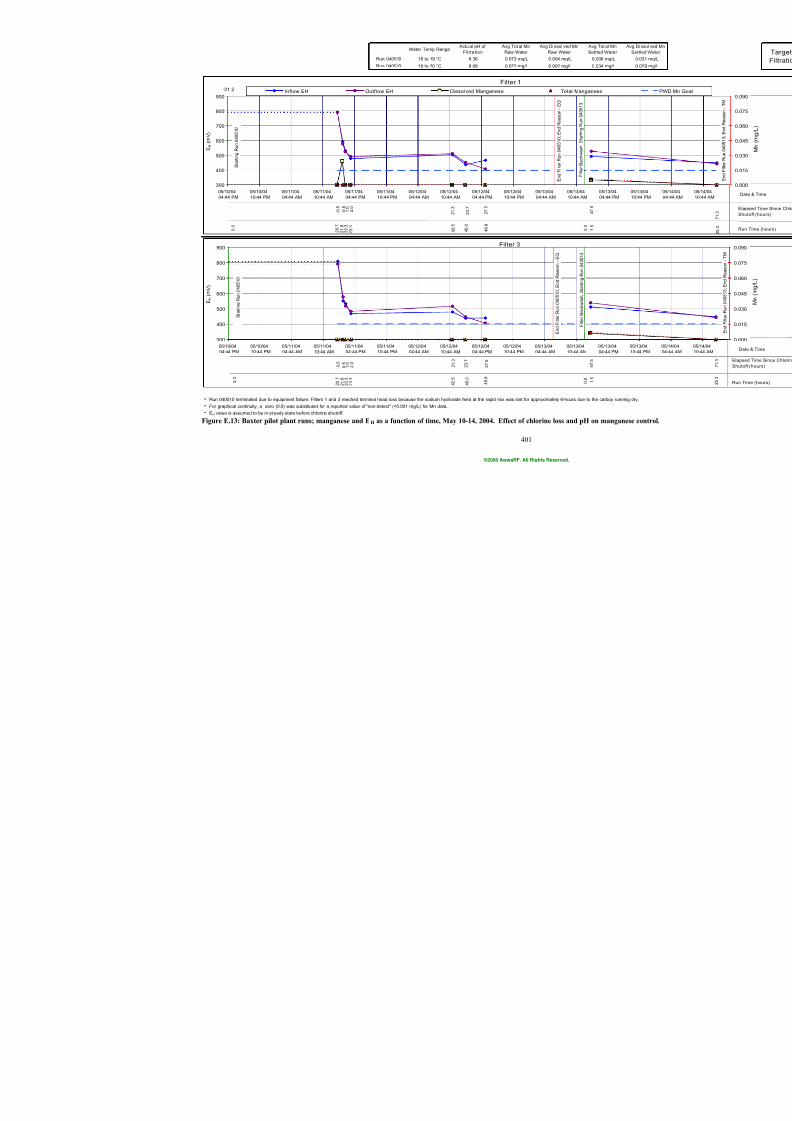
7/21/2019 Occurrence of Manganese in Drinking Water and Manganese Control
http://slidepdf.com/reader/full/occurrence-of-manganese-in-drinking-water-and-manganese-control 427/463
401
Water Temp Range Actu al pH of
Filtration
Avg Tot al Mn
Raw Water
Avg Di ssol ved Mn
Raw Water
Avg Tot a
Settled W
Run 040510 18 to 19 °C 8.36 0.073 mg/L 0.004 mg/L 0.036 m
Run 040513 19 to 20 °C 8.06 0.072 mg/L 0.002 mg/L 0.034 m
h
h
h EH value is assumed to be in steady state before chlorine shutoff.
For graphical continuity, a zero (0.0) was substituted for a reported value of "non-detect" (<0.001 mg/L) for Mn data.
Run 040510 terminated due to equipment failure. Filters 1 and 3 reached terminal head loss because the sodium hydroxide feed at the rapid mix was lost for approximately 6-hours due to the carbo
Filter 1
0 . 5
- 0 . 5
4 7 . 5
2 7 . 5
2 3 . 7
2 1 . 3
1 . 0 2 . 0
4 8 . 8
4 5 . 0
4 2 . 5
2 3 . 3
2 2 . 3
2 1 . 8
2 0 . 7
1 . 5
300
400
500
600
700
800
900
05/10/04
04:44 PM
05/10/04
10:44 PM
05/11/04
04:44 AM
05/11/04
10:44 AM
05/11/04
04:44 PM
05/11/04
10:44 PM
05/12/04
04:44 AM
05/12/04
10:44 AM
05/12/04
04:44 PM
05/12/04
10:44 PM
05/13/04
04:44 AM
05/13/04
10:44 AM
05/1
04:4
E H
( m V )
-21.2 -11.2 -1.2 8.8 18.8 28.8 38.8 48.8Inflow EH Outflow EH Dissolved Manganese Total Manganese
F i l t e r B a c k w a s h ,
S t a r t i n g R u n 0 4 0 5 1 3
S t a r t i n g R u n 0 4 0 5 1 0
0 . 0
0 . 0
E n d F i l t e r R u n 0 4 0 5 1 0 ; E n d R e a s o n - E Q
Filter 3
0 . 5
- 0 . 5
4 7 . 5
2 7 . 5
2 3 . 7
2 1 . 3
1 . 0 2 . 0
4 8 . 8
4 5 . 0
4 2 . 5
2 3 . 3
2 2 . 3
2 1 . 8
2 0 . 7
1 . 5
300
400
500
600
700
800
900
05/10/04
04:44 PM
05/10/04
10:44 PM
05/11/04
04:44 AM
05/11/04
10:44 AM
05/11/04
04:44 PM
05/11/04
10:44 PM
05/12/04
04:44 AM
05/12/04
10:44 AM
05/12/04
04:44 PM
05/12/04
10:44 PM
05/13/04
04:44 AM
05/13/04
10:44 AM
05/1
04:4
E H
( m V )
F i l t e r B a c k w a s h ,
S t a r t i n g R u n 0 4 0 5 1 3
S t a r t i n g R u n 0 4 0 5 1 0
E n d F i l t e r R u n 0 4 0 5 1 0 ; E n d R e a s o n - E Q
0 . 0
0 . 0
Figure E.13: Baxter pilot plant runs; manganese and EH as a function of time, May 10-14, 2004. Effect of chlorine loss and pH on m
©2006 AwwaRF. All Rights Reserved.
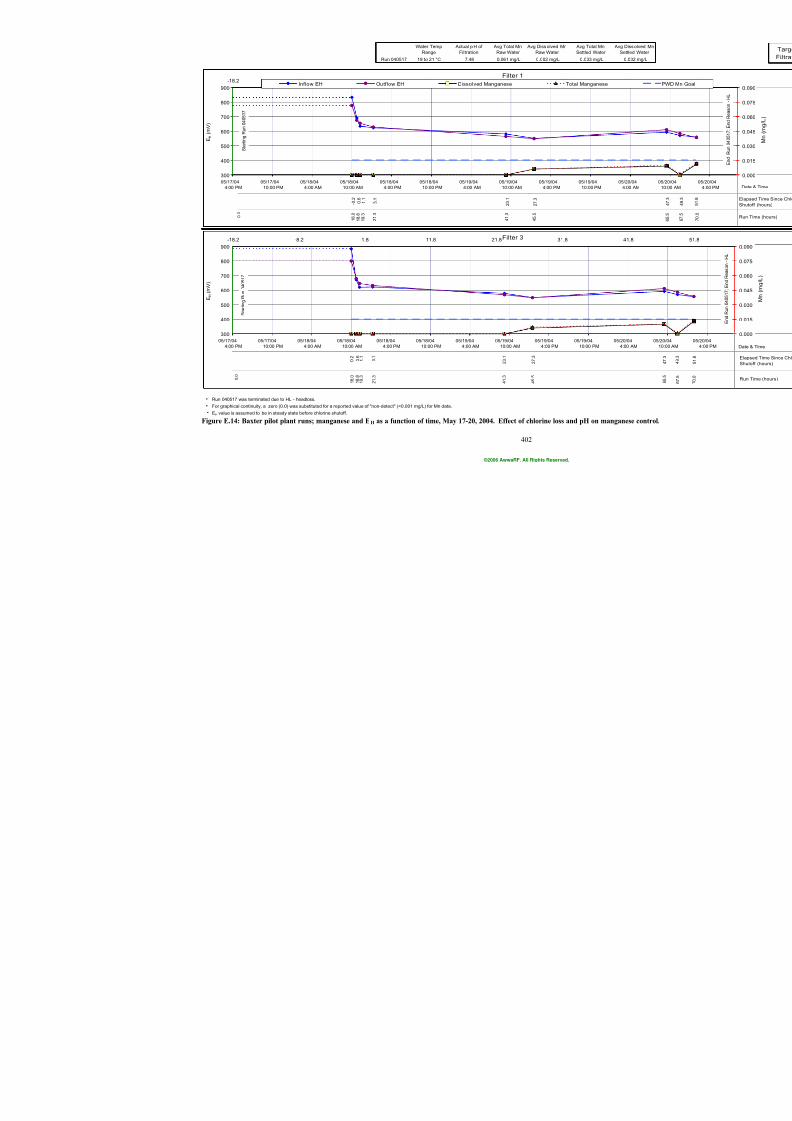
7/21/2019 Occurrence of Manganese in Drinking Water and Manganese Control
http://slidepdf.com/reader/full/occurrence-of-manganese-in-drinking-water-and-manganese-control 428/463
402
Water Temp
Range
Actual p H of
Filtration
Avg Total Mn
Raw Water
Avg Diss olved Mn
Raw Water
Avg Total Mn
Settled Water
Run 040517 19 to 21 °C 7.48 0.061 mg/L 0.002 mg/L 0.033 mg/L
h
h For graphical continuity, a zero (0.0) was substituted for a reported value of "non-detect" (<0.001 mg/L) for Mn data.
h EH value is assumed to be in steady state before chlorine shutoff.
Run 040517 was terminated due to HL - headloss.
Filter 1
3 . 1
1 . 1
2 3 . 1
2 7 . 3
- 0 . 2 0 . 6
1 8 . 0
1 8 . 8
1 9 . 3
2 1 . 3
4 1 . 3
4 5 . 5
300
400
500
600
700
800
900
05/17/04
4:00 PM
05/17/04
10:00 PM
05/18/04
4:00 AM
05/18/04
10:00 AM
05/18/04
4:00 PM
05/18/04
10:00 PM
05/19/04
4:00 AM
05/19/04
10:00 AM
05/19/04
4:00 PM
05/19/04
10:00 PM
E H
( m V )
-18.2 -8.2 1.8 11.8 21.8 31.8Inflow EH Outflow EH Dissolved Manganese Total Manganes
S t a r t i n g R u n 0 4 0 5 1 7
0 . 0
Filter 3
3 . 1
1 . 1
2 3 . 1
2 7 . 3
- 0 . 2 0 . 6
1 8 . 0
1 8 . 8
1 9 . 3
2 1 . 3
4 1 . 3
4 5 . 5
300
400
500
600
700
800
900
05/17/04
4:00 PM
05/17/04
10:00 PM
05/18/04
4:00 AM
05/18/04
10:00 AM
05/18/04
4:00 PM
05/18/04
10:00 PM
05/19/04
4:00 AM
05/19/04
10:00 AM
05/19/04
4:00 PM
05/19/04
10:00 PM
E H
( m V )
-18.2 -8.2 1.8 11.8 21.8 31.8
0 . 0
S t a r t i n g R u n 0 4 0 5 1 7
Figure E.14: Baxter pilot plant runs; manganese and EH as a function of time, May 17-20, 2004. Effect of chlorine loss and pH on m
©2006 AwwaRF. All Rights Reserved.
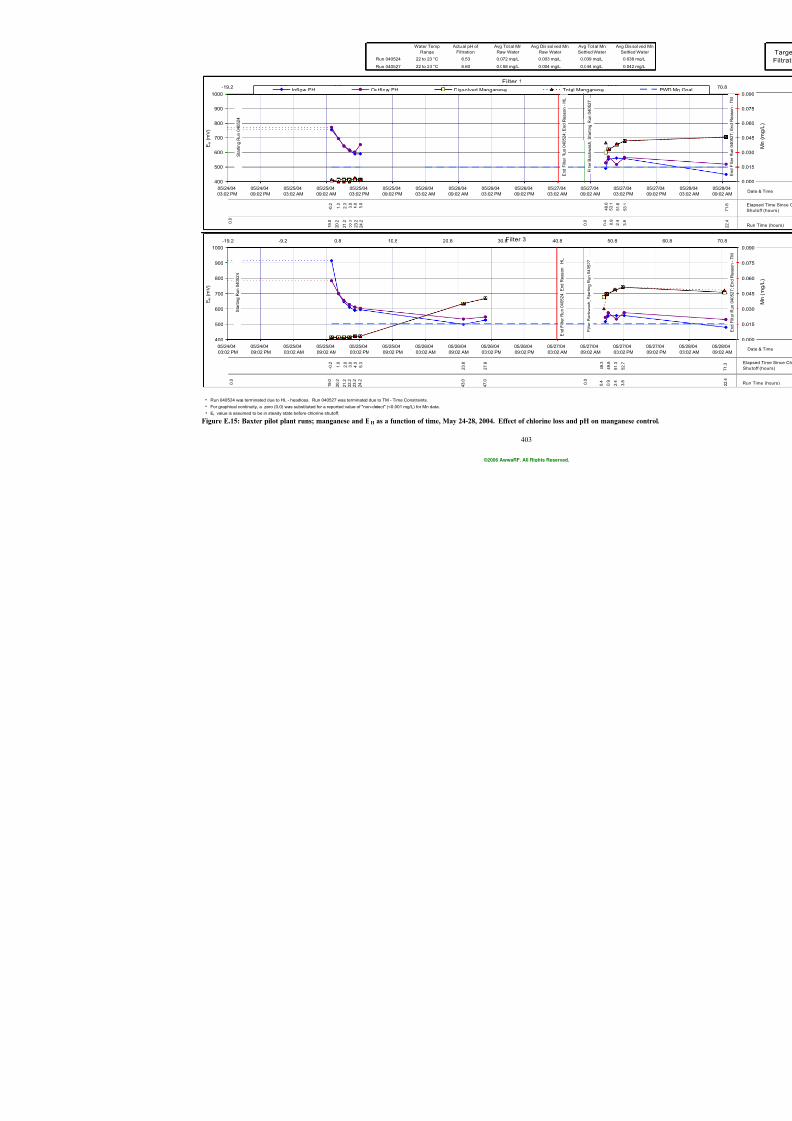
7/21/2019 Occurrence of Manganese in Drinking Water and Manganese Control
http://slidepdf.com/reader/full/occurrence-of-manganese-in-drinking-water-and-manganese-control 429/463
403
Water Temp
Range
Actu al pH of
Filtration
Avg Tot al Mn
Raw Water
Avg Dis sol ved Mn
Raw Water
Avg Tot al Mn
Settled Water
Run 040524 22 to 23 °C 6.53 0.072 mg/L 0.003 mg/L 0.039 mg/L
Run 040527 22 to 23 °C 6.60 0.058 mg/L 0.004 mg/L 0.044 mg/L
h
h For graphical continuity, a zero (0.0) was substituted for a reported value of "non-detect" (<0.001 mg/L) for Mn data.
h EH value is assumed to be in steady state before chlorine shutoff.
Run 040524 was terminated due to HL - headloss. Run 040527 was terminated due to TM - Time Constraints.
Filter 1
1 . 0
- 0 . 2
4 9 6
5 . 0
4 . 0
2 . 0 3 . 0
2 3 . 2
2 2 . 2
2 1 . 2
2 0 . 2
2 4 . 2
1 9 . 0
0 4
400
500
600
700
800
900
1000
05/24/04
03:02 PM
05/24/04
09:02 PM
05/25/04
03:02 AM
05/25/04
09:02 AM
05/25/04
03:02 PM
05/25/04
09:02 PM
05/26/04
03:02 AM
05/26/04
09:02 AM
05/26/04
03:02 PM
05/26/04
09:02 PM
05/27/04
03:02 AM
05/27/04
09:02 AM
E H
( m V )
-19.2 -9.2 0.8 10.8 20.8 30.8 40.8Inflow EH Outflow EH Dissolved Manganese Total Manganese
0 . 0
0 . 0
F i l t e r B a c k w a s h ,
S t a r t i n g R u n 0 4 0 5 2 7
E n d F i l t e r R u n 0 4 0 5 2 4 ; E n d R e
a s o n - H L
S t a r t i n g R u n 0 4 0 5 2 4
Filter 3
3 . 0
2 . 0
4 . 0 5 . 0
2 3 . 8
4 9 . 3
- 0 . 2
1 . 0
2 7 . 8
0 . 4
1 9 . 0
2 0 . 2
2 1 . 2
2 2 . 2
2 3 . 2
2 4 . 2
4 3 . 0
4 7 . 0
400
500
600
700
800
900
1000
05/24/04
03:02 PM
05/24/04
09:02 PM
05/25/04
03:02 AM
05/25/04
09:02 AM
05/25/04
03:02 PM
05/25/04
09:02 PM
05/26/04
03:02 AM
05/26/04
09:02 AM
05/26/04
03:02 PM
05/26/04
09:02 PM
05/27/04
03:02 AM
05/27/04
09:02 AM
E H
( m V )
-19.2 -9.2 0.8 10.8 20.8 30.8 40.8
0 . 0
0 . 0
E n d F i l t e r R u n 0 4 0 5 2 4 ; E n d R e a s o n - H L
F i l t e r B a c k w a s h ,
S t a r t i n g R u n 0 4 0 5 2 7
S t a r t i n g R u n 0 4 0 5 2 4
Figure E.15: Baxter pilot plant runs; manganese and EH as a function of time, May 24-28, 2004. Effect of chlorine loss and pH on m
©2006 AwwaRF. All Rights Reserved.
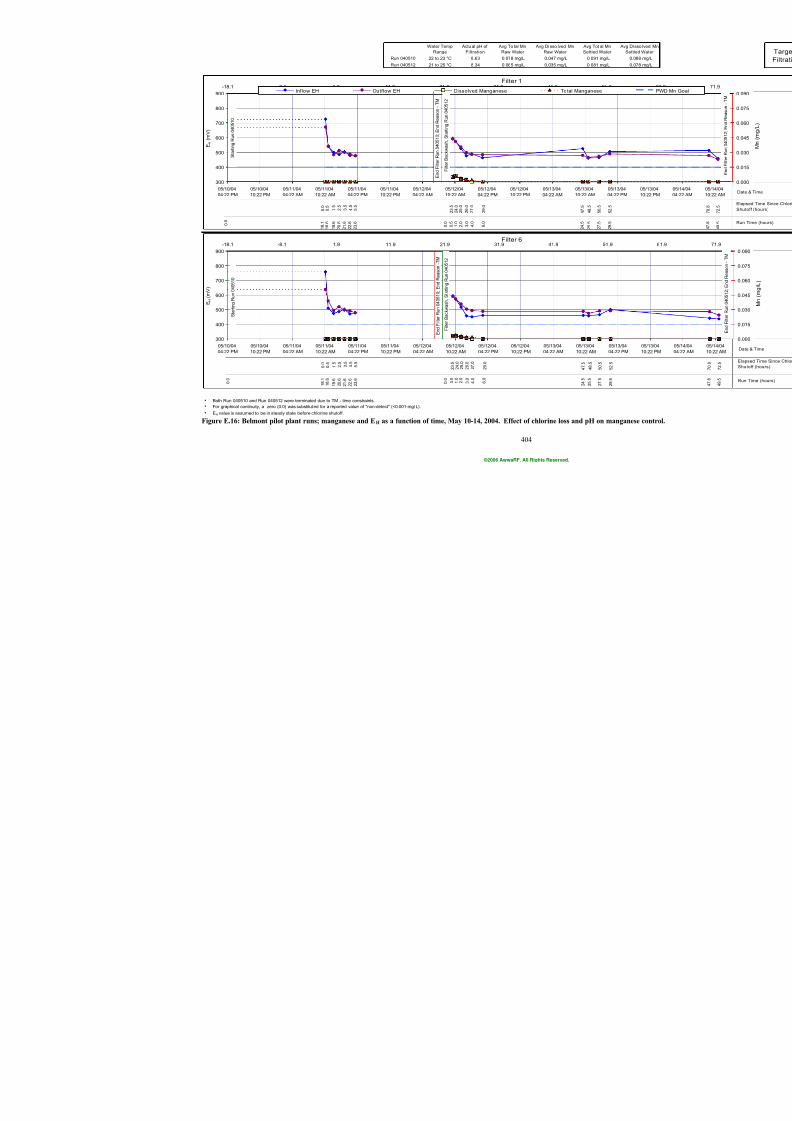
7/21/2019 Occurrence of Manganese in Drinking Water and Manganese Control
http://slidepdf.com/reader/full/occurrence-of-manganese-in-drinking-water-and-manganese-control 430/463
404
Water Temp
Range
Actu al pH of
Filtration
Avg To tal Mn
Raw Water
Avg Di sso lved Mn
Raw Water
Avg Tot al M
Settled Wa
Run 040510 22 to 23 °C 8.63 0.078 mg/L 0.047 mg/L 0.091 mg/
Run 040512 21 to 25 °C 8.34 0.065 mg/L 0.035 mg/L 0.081 mg/
h
h
h EH value is assumed to be in steady state before chlorine shutoff.
For graphical continuity, a zero (0.0) was substituted for a reported value of "non-detect" (<0.001-mg/L).
Both Run 040510 and Run 040512 were terminated due to TM - time constraints.
Filter 1
5 0 . 5
4 8 . 5
4 7 . 5
2 9 . 0
2 7 . 0
2 6 . 0
2 5 . 0
2 . 5
1 . 5
3 . 5 4 . 5 5 . 5
2 3 . 5
2 4 . 0
0 . 0 0 . 5
2 7 . 5
2 5 . 5
2 4 . 5
6 . 0
4 . 0
3 . 0
2 . 0
1 . 0
0 . 5
1 8 . 1
1 8 . 6
1 9 . 6
2 0 . 6
2 1 . 6
2 2 . 6
2 3 . 6
300
400
500
600
700
800
900
05/10/04
04:22 PM
05/10/04
10:22 PM
05/11/04
04:22 AM
05/11/04
10:22 AM
05/11/04
04:22 PM
05/11/04
10:22 PM
05/12/04
04:22 AM
05/12/04
10:22 AM
05/12/04
04:22 PM
05/12/04
10:22 PM
05/13/04
04:22 AM
05/13/04
10:22 AM
E H
( m V )
-18.1 -8.1 1.9 11.9 21.9 31.9 41.9 51Inflow EH Outflow EH Dissolved Manganese Total Manganese
F i l t e r B a c k w a s h ,
S t a r t i n g R u
n 0 4 0 5 1 2
E n d F i l t e r R u n 0 4 0 5 1 0 ; E n d R e a s o n - T M
0 . 0
S t a r t i n g R u n 0 4 0 5 1 0
0 . 0
Filter 6
5 0 . 5
4 8 . 5
4 7 . 5
2 9 . 0
2 7 . 0
2 6 . 0
2 5 . 0
2 . 5
1 . 5
3 . 5 4 . 5 5 . 5
2 3 . 5
2 4 . 0
0 . 0 0 . 5
2 7 . 5
2 5 . 5
2 4 . 5
6 . 0
4 . 0
3 . 0
2 . 0
1 . 0
0 . 5
1 8 . 1
1 8 . 6
1 9 . 6
2 0 . 6
2 1 . 6
2 2 . 6
2 3 . 6
300
400
500
600
700
800
900
05/10/04
04:22 PM
05/10/04
10:22 PM
05/11/04
04:22 AM
05/11/04
10:22 AM
05/11/04
04:22 PM
05/11/04
10:22 PM
05/12/04
04:22 AM
05/12/04
10:22 AM
05/12/04
04:22 PM
05/12/04
10:22 PM
05/13/04
04:22 AM
05/13/04
10:22 AM
E H
( m V )
-18.1 -8.1 1.9 11.9 21.9 31.9 41.9 5
F i l t e r B a c k w a s h ,
S t a r t i n g R u n 0 4 0 5 1 2
E n d F i l t e r R u n 0 4 0 5 1 0 ; E n d R e a s o n - T M
0 . 0
S t a r t i n g R u n 0 4 0 5 1 0
0 . 0
Figure E.16: Belmont pilot plant runs; manganese and EH as a function of time, May 10-14, 2004. Effect of chlorine loss and pH on
©2006 AwwaRF. All Rights Reserved.
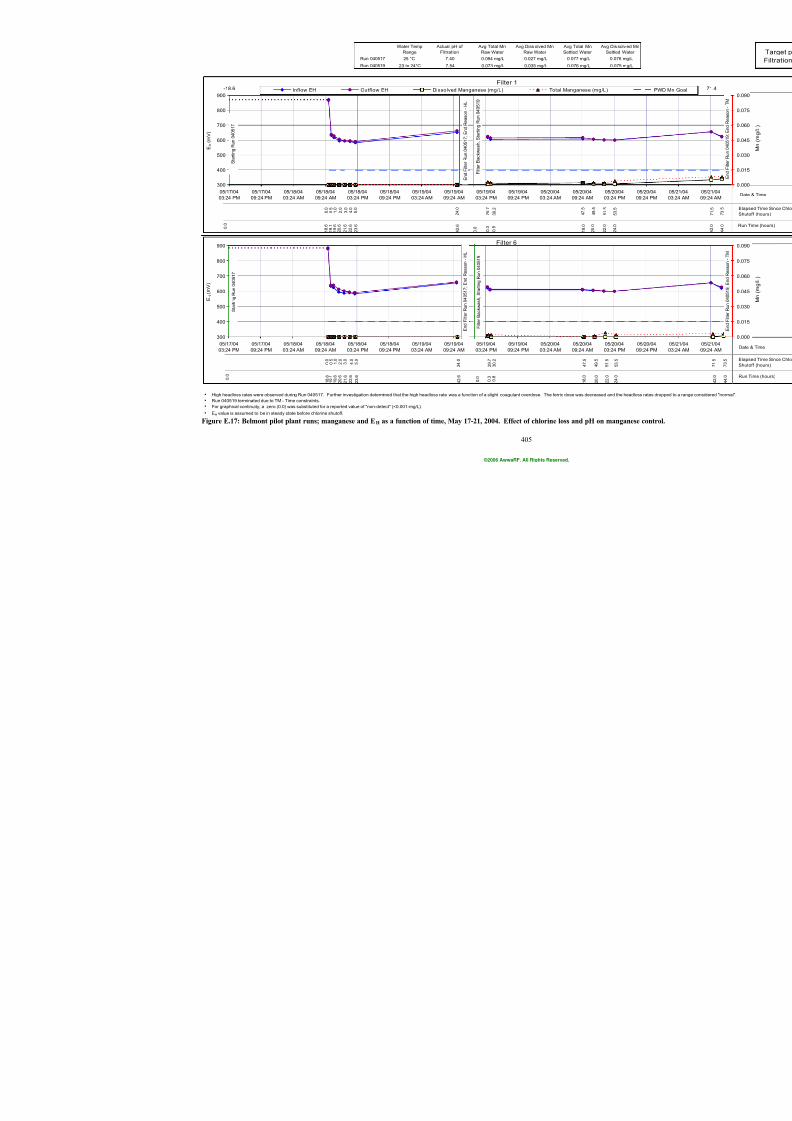
7/21/2019 Occurrence of Manganese in Drinking Water and Manganese Control
http://slidepdf.com/reader/full/occurrence-of-manganese-in-drinking-water-and-manganese-control 431/463
405
Water Temp
Range
Actual pH of
Filtration
Avg Total Mn
Raw Water
Avg Diss olved Mn
Raw Water
Avg Total Mn
Settled Water
Av
Run 040517 25 °C 7.40 0.094 mg/L 0.027 mg/L 0.077 mg/L
Run 040519 23 to 24°C 7.54 0.073 mg/L 0.035 mg/L 0.076 mg/L
h
h
h
h
Run 040519 terminated due to TM - Time constraints.
High headloss rates were observed during Run 040517. Further investigation determined that the high headloss rate was a function of a slight coagulant overdose. The ferric dose was decreased a
EH value is assumed to be in steady state before chlorine shutoff.
For graphical continuity, a zero (0.0) was substituted for a reported value of "non-detect" (<0.001-mg/L).
Filter 1
5 1 5
4 9 . 5
4 7 . 5
3 0 . 2
2 4 . 0
0 . 5
0 . 0
2 9 . 7
5 . 0
4 . 0
3 . 0
1 . 0 2 . 0
2 2 . 0
2 0 . 0
0 . 8
4 2 . 6
2 3 . 6
2 2 . 6
2 1 . 6
2 0 . 6
1 9 . 6
1 9 . 1
1 8 . 6
0 . 3
1 8 . 0
300
400
500
600
700
800
900
05/17/04
03:24 PM
05/17/04
09:24 PM
05/18/04
03:24 AM
05/18/04
09:24 AM
05/18/04
03:24 PM
05/18/04
09:24 PM
05/19/04
03:24 AM
05/19/04
09:24 AM
05/19/04
03:24 PM
05/19/04
09:24 PM
05/20/04
03:24 AM
05/20/04
09:24 AM
0
0
E H
( m V )
-18.6 -8.6 1.4 11.4 21.4 31.4 41.4 51.Inflow EH Outflow EH Dissolved Manganese (mg/L) Total Manganese (mg/L)
S t a r t i n g R u n 0 4 0 5 1 7
0 . 0
E n d F i l t e r R u n 0 4 0 5 1 7 ; E n d R e a s o n - H L
0 . 0
F i l t e r B a c k w a s h ,
S t a r t i n g R u n 0 4 0 5 1 9
Filter 6
0 . 5
0 . 0
2 9 . 7
5 . 0
4 . 0
3 . 0
1 . 0 2 . 0
2 4 . 0
3 0 . 2
4 7 . 5
4 9 . 5
5 1 5
2 3 . 6
2 2 . 6
2 1 . 6
2 0 . 6
1 9 . 6
1 9 . 1
1 8 . 6
0 . 3
4 2 . 6
0 . 8
1 8 . 0
2 0 . 0
2 2 0
300
400
500
600
700
800
900
05/17/04
03:24 PM
05/17/04
09:24 PM
05/18/04
03:24 AM
05/18/04
09:24 AM
05/18/04
03:24 PM
05/18/04
09:24 PM
05/19/04
03:24 AM
05/19/04
09:24 AM
05/19/04
03:24 PM
05/19/04
09:24 PM
05/20/04
03:24 AM
05/20/04
09:24 AM
0
0
E H
( m V )
F i l t e r B a c k w a s h ,
S t a r t i n g R u n 0 4 0 5 1 9
E n d F i l t e r R u n 0 4 0 5 1 7 ; E n d R e a s o n - H L
0 . 0
0 . 0
S t a r t i n g R u n 0 4 0 5 1 7
Figure E.17: Belmont pilot plant runs; manganese and EH as a function of time, May 17-21, 2004. Effect of chlorine loss and pH on
©2006 AwwaRF. All Rights Reserved.
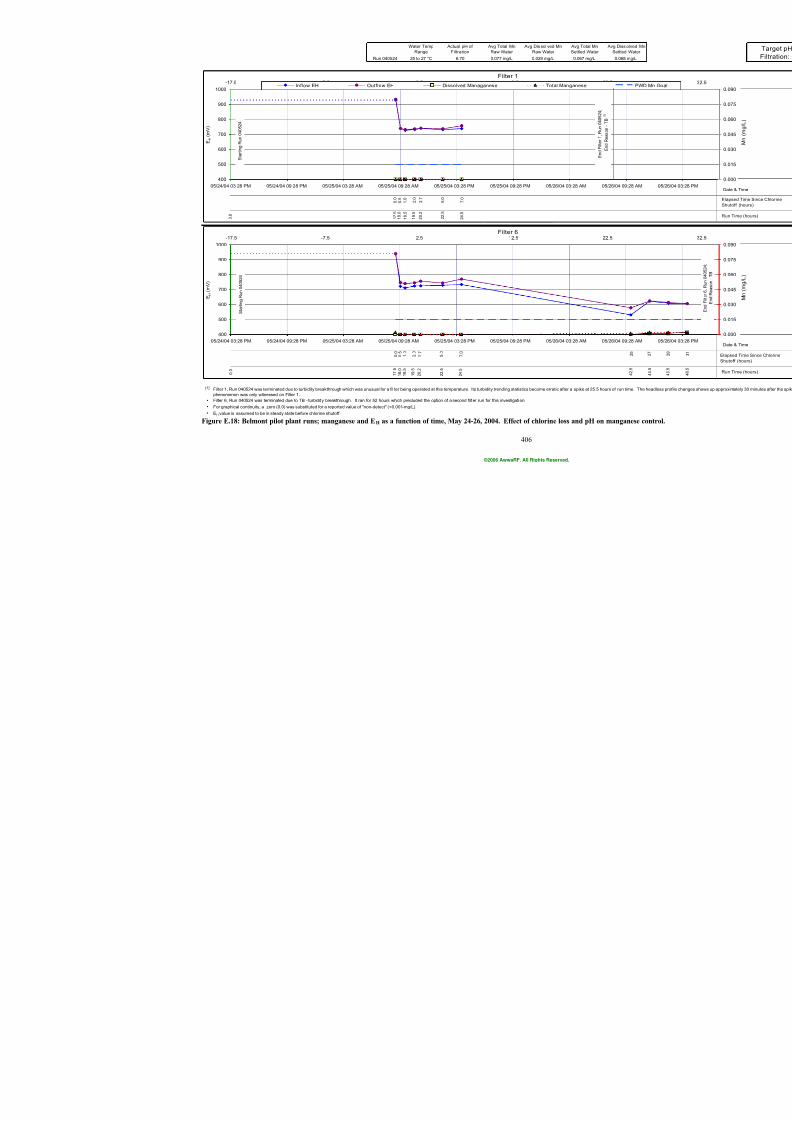
7/21/2019 Occurrence of Manganese in Drinking Water and Manganese Control
http://slidepdf.com/reader/full/occurrence-of-manganese-in-drinking-water-and-manganese-control 432/463
406
Water Temp
Range
Actual pH of
Filtration
Avg Total Mn
Raw Water
Avg Dissol ved Mn
Raw Water
Avg Total Mn
Settled Water
Run 040524 25 to 27 °C 6.70 0.077 mg/L 0.029 mg/L 0.067 mg/L
[1]
h
h
h EH value is assumed to be in steady state before chlorine shutoff.
For graphical continuity, a zero (0.0) was substituted for a reported value of "non-detect" (<0.001-mg/L).
Filter 6, Run 040524 was terminated due to TB - turbidity breakthrough. It ran for 52 hours which precluded the option of a second filter run for this investigation.
Filter 1, Run 040524 was terminated due to turbidity breakthrough which was unusual for a fil ter being operated at this temperature. Its turbidity trending statistics become erratic after a spike at 25.5 ho
phenomenon was only witnessed on Filter 1.
Filter 1
0 . 5
0 . 0
7 . 0
5 . 0
2 . 7
1 . 0
2 . 0
2 4 . 5
2 2 . 5
2 0 . 2
1 9 . 5
1 8 . 5
1 8 . 0
1 7 . 5
400
500
600
700
800
900
1000
05/24/04 03:28 PM 05/24/04 09:28 PM 05/25/04 03:28 AM 05/25/04 09:28 AM 05/25/04 03:28 PM 05/25/04 09:28 PM 05/26/04 03:28 AM
E H
( m V )
-17.5 -7.5 2.5 12.5 22Inflow EH Outflow EH Dissolved Managanese Total Manganese
S t a r t i n g R u n 0 4 0 5 2 4
0 . 0
E n d F i l t e r 1 ,
R u n 0 4 0 5 2 4 ;
E n d R e a s o n T B
[ 1 ]
Filter 6
0 . 5
0 . 0
7 . 0
5 . 0
2 . 7
1 . 0
2 . 0
2 4 . 5
2 2 . 5
2 0 . 2
1 9 . 5
1 8 . 5
1 8 . 0
1 7 . 5
400
500
600
700
800
900
1000
05/24/04 03:28 PM 05/24/04 09:28 PM 05/25/04 03:28 AM 05/25/04 09:28 AM 05/25/04 03:28 PM 05/25/04 09:28 PM 05/26/04 03:28 AM
E H
( m V )
-17.5 -7.5 2.5 12.5 22
S t a r t i n g R u n 0 4 0 5 2 4
0 . 0
Figure E.18: Belmont pilot plant runs; manganese and EH as a function of time, May 24-26, 2004. Effect of chlorine loss and pH on
©2006 AwwaRF. All Rights Reserved.
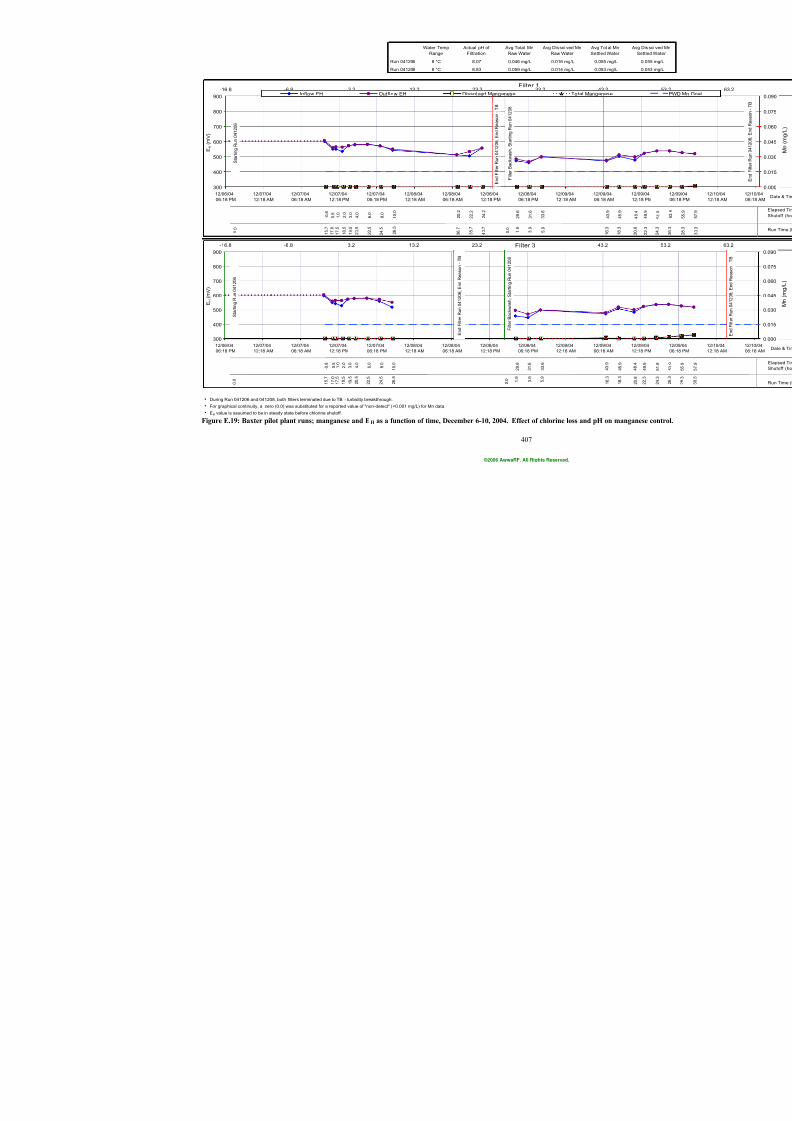
7/21/2019 Occurrence of Manganese in Drinking Water and Manganese Control
http://slidepdf.com/reader/full/occurrence-of-manganese-in-drinking-water-and-manganese-control 433/463
407
Water Temp
Range
Actual pH of
Filtration
Avg Total Mn
Raw Water
Avg Dissol ved Mn
Raw Water
Avg To
Settled
Run 041206 8 °C 8.07 0.046 mg/L 0.016 mg/L 0.055
Run 041208 8 °C 8.83 0.059 mg/L 0.014 mg/L 0.053
h
h
h EH value is assumed to be in steady state before chlorine shutoff.
For graphical continuity, a zero (0.0) was substituted for a reported value of "non-detect" (<0.001 mg/L) for Mn data.
During Run 041206 and 041208, both filters terminated due to TB - turbidity breakthrough.
Filter 1
2 . 0
1 . 0
3 . 0 4 . 0
6 . 0
2 0 . 2
2 2 . 2
- 0 . 8
0 . 5
8 . 0
1 0 . 0
2 4 . 2
2 9 . 6
3 1 . 6
3 3 . 6
3 8 . 7
3 6 . 7
1 5 . 7
1 7 . 0
1 7 . 5
1 8 . 5
1 9 . 5
2 0 . 5
2 2 . 5
2 4 . 5
2 6 . 5
4 0 . 7
1 . 9
3 . 9
5 . 9
1 6 3
300
400
500
600
700
800
900
12/06/04
06:18 PM
12/07/04
12:18 AM
12/07/04
06:18 AM
12/07/04
12:18 PM
12/07/04
06:18 PM
12/08/04
12:18 AM
12/08/04
06:18 AM
12/08/04
12:18 PM
12/08/04
06:18 PM
12/09/04
12:18 AM
12/09/
06:18
E H
( m V )
-16.8 -6.8 3.2 13.2 23.2 33.2 43.2Inflow EH Outflow EH Dissolved Manganese Total Mangane
F i l t e r B a c k w a s h ,
S t a r t i n g R u n 0 4
1 2 0 8
S t a r t i n g R u n 0 4 1 2 0 6
0 . 0
0 . 0
E n d F i l t e r R u n 0 4 1 2 0 6 ; E n d R e a s o
n - T B
4 3 9
3 3 . 6
3 1 . 6
2 9 . 6
1 0 . 0
8 . 0
0 . 5
- 0 . 8
6 . 0
4 . 0
3 . 0
1 . 0 2 . 0
1 6 3
5 . 9
3 . 9
1 . 9
2 6 . 5
2 4 . 5
2 2 . 5
2 0 . 5
1 9 . 5
1 8 . 5
1 7 . 5
1 7 . 0
1 5 . 7
300
400
500
600
700
800
900
12/06/04
06:18 PM
12/07/04
12:18 AM
12/07/04
06:18 AM
12/07/04
12:18 PM
12/07/04
06:18 PM
12/08/04
12:18 AM
12/08/04
06:18 AM
12/08/04
12:18 PM
12/08/04
06:18 PM
12/09/04
12:18 AM
12/09/
06:18
E H
( m V )
-16.8 -6.8 3.2 13.2 23.2 33.2 43.2
F i l t e r B a c k w a s h ,
S t a r t i n g R u n 0 4 1 2 0 8
S t a r t i n g R u n 0 4 1 2 0 6
0 . 0
0 . 0
E n d F i l t e r R u n 0 4 1 2 0 6 ; E n d R e a s o n - T B
Filter 3
Figure E.19: Baxter pilot plant runs; manganese and EH as a function of time, December 6-10, 2004. Effect of chlorine loss and pH o
©2006 AwwaRF. All Rights Reserved.
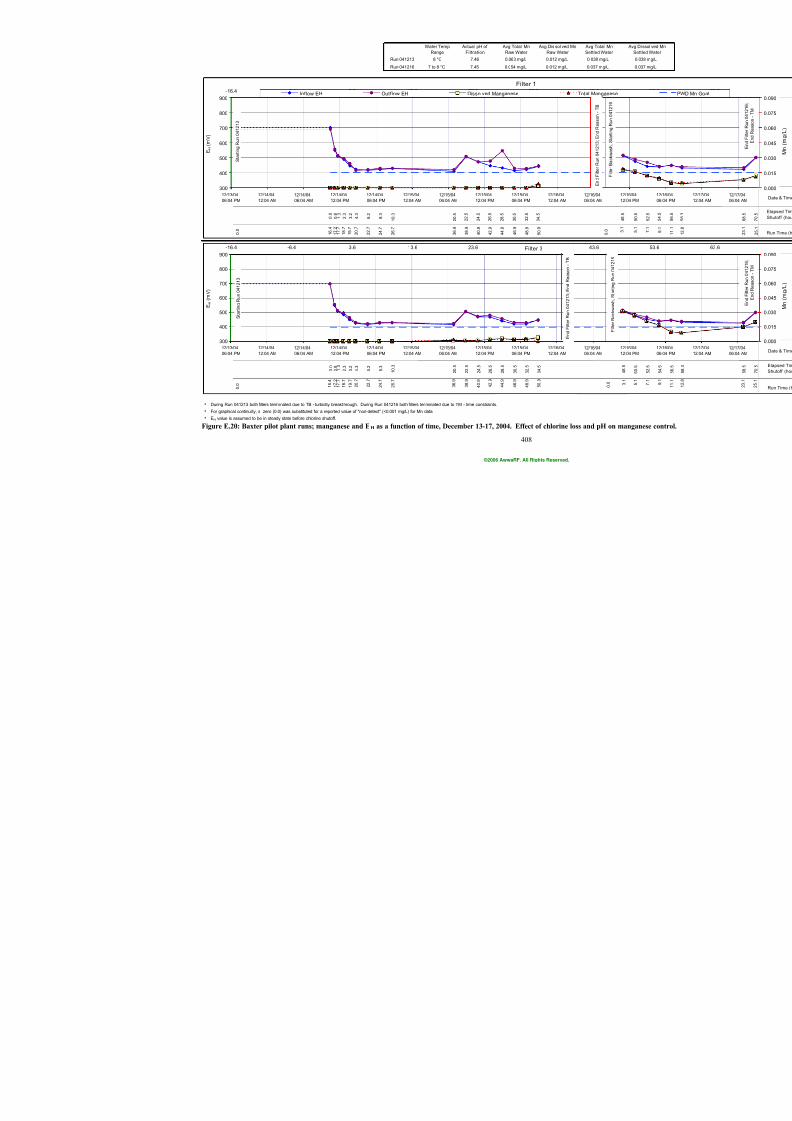
7/21/2019 Occurrence of Manganese in Drinking Water and Manganese Control
http://slidepdf.com/reader/full/occurrence-of-manganese-in-drinking-water-and-manganese-control 434/463
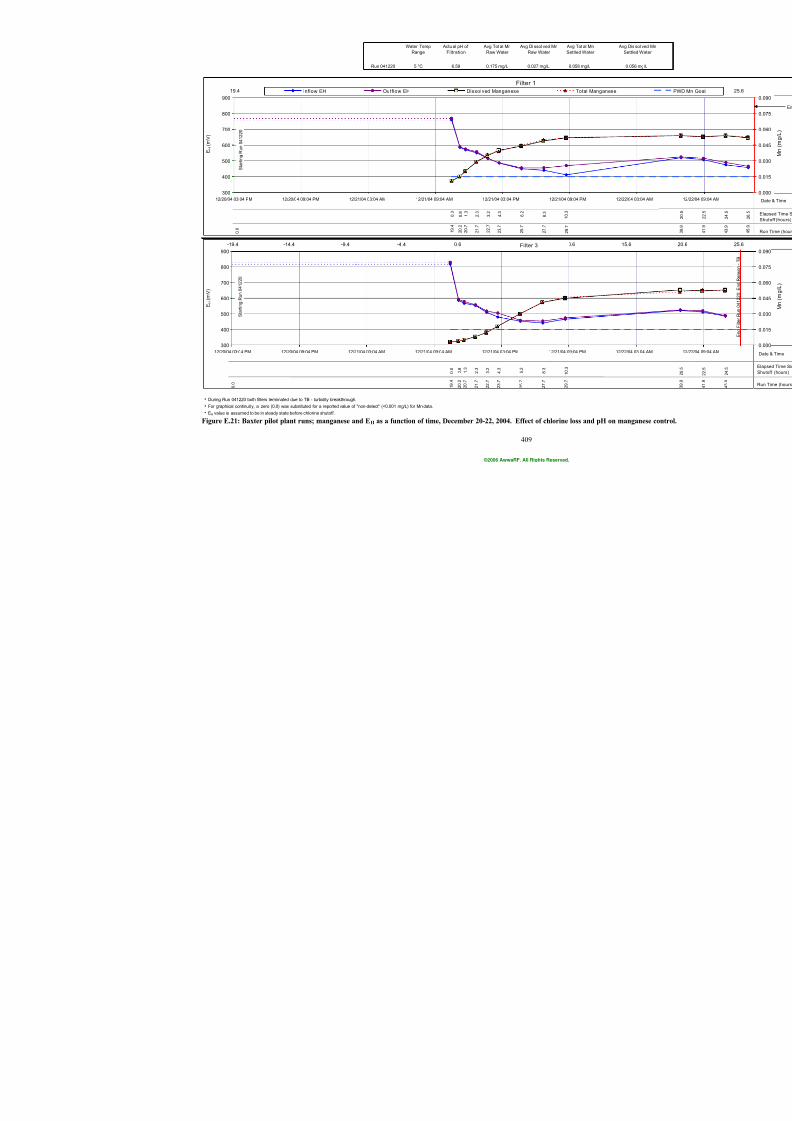
7/21/2019 Occurrence of Manganese in Drinking Water and Manganese Control
http://slidepdf.com/reader/full/occurrence-of-manganese-in-drinking-water-and-manganese-control 435/463
409
Water Temp
Range
Actu al pH of
Filtration
Avg Tot al Mn
Raw Water
Avg Dissol ved Mn
Raw Water
Avg Tot al Mn
Settled Water
Run 041220 5 °C 6.59 0.175 mg/L 0.027 mg/L 0.058 mg/L
h
h
h
For graphical continuity, a zero (0.0) was substituted for a reported value of "non-detect" (<0.001 mg/L) for Mn data.
During Run 041220 both filters terminated due to TB - turbidity breakthrough.
EH value is assumed to be in steady state before chlorine shutoff.
Filter 1
1 0 . 3
8 . 3
0 . 8
0 . 0
6 . 2
4 . 3
3 . 2
1 . 3
2 . 3
2 9 . 7
2 7 . 7
2 5 . 7
2 3 . 7
2 2 . 7
2 1 . 7
2 0 . 7
2 0 . 2
1 9 . 4
300
400
500
600
700
800
900
12/20/04 03:04 PM 12/20/04 09:04 PM 12/21/04 03:04 AM 12/21/04 09:04 AM 12/21/04 03:04 PM 12/21/04 09:04 PM
E H
( m V )
-19.4 -14.4 -9.4 -4.4 0.6 5.6 10.6Inflow EH Outflow EH Dissolved Manganese Total Mangan
S t a r t i n g R u n 0 4 1 2 2 0
0 . 0
2 . 3
1 . 3
3 . 2
4 . 3
6 . 2
0 . 0
0 . 8
8 . 3
1 0 . 3
1 9 . 4
2 0 . 2
2 0 . 7
2 1 . 7
2 2 . 7
2 3 . 7
2 5 . 7
2 7 . 7
2 9 . 7
300
400
500
600
700
800
900
12/20/04 03:04 PM 12/20/04 09:04 PM 12/21/04 03:04 AM 12/21/04 09:04 AM 12/21/04 03:04 PM 12/21/04 09:04 PM
E H
( m V )
-19.4 -14.4 -9.4 -4.4 0.6 5.6 10.6
S t a r t i n g R u n 0 4 1 2 2 0
0 . 0
Filter 3
Figure E.21: Baxter pilot plant runs; manganese and EH as a function of time, December 20-22, 2004. Effect of chlorine loss and pH
©2006 AwwaRF. All Rights Reserved.
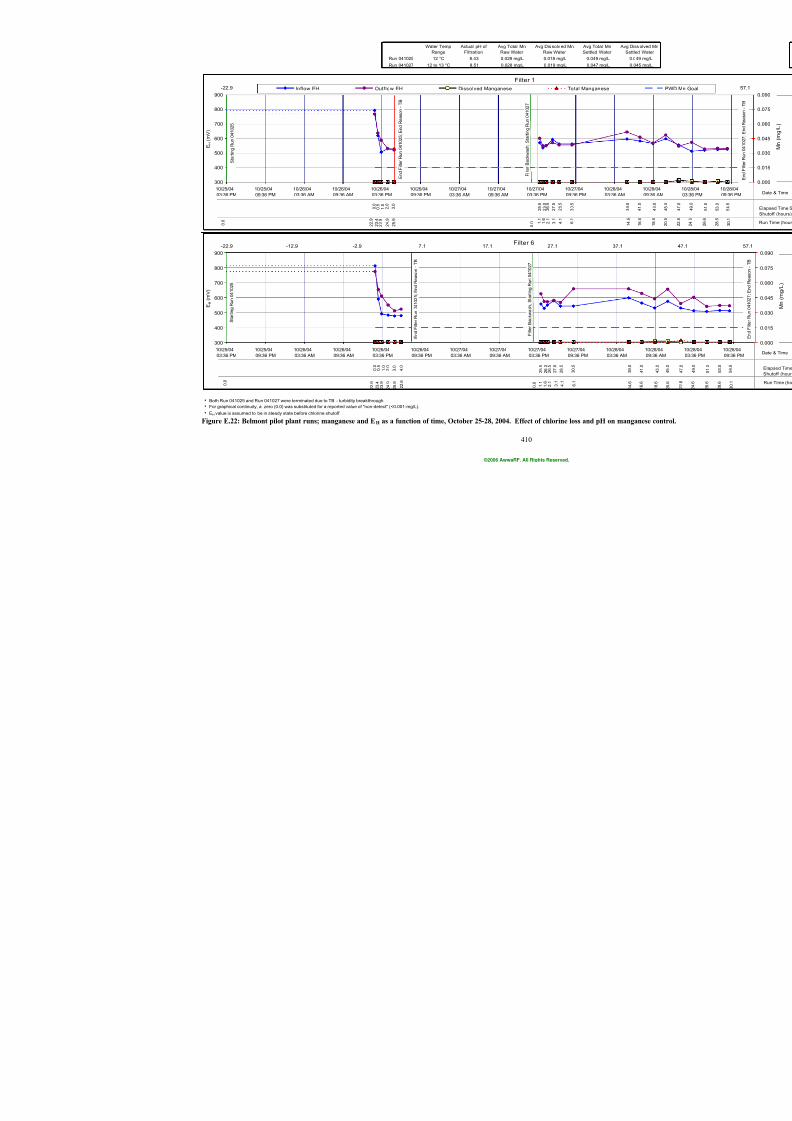
7/21/2019 Occurrence of Manganese in Drinking Water and Manganese Control
http://slidepdf.com/reader/full/occurrence-of-manganese-in-drinking-water-and-manganese-control 436/463
410
Water Temp
Range
Actual pH of
Filtration
Avg Total Mn
Raw Water
Avg Dissolv ed Mn
Raw Water
Avg Total M
Settled Wa
Run 041025 12 °C 8.43 0.029 mg/L 0.018 mg/L 0.049 mg/
Run 041027 12 to 13 °C 8.51 0.028 mg/L 0.019 mg/L 0.047 mg/
h
h
h
For graphical continuity, a zero (0.0) was substituted for a reported value of "non-detect" (<0.001-mg/L).
Both Run 041025 and Run 041027 were terminated due to TB - turbidity breakthrough.
EH value is assumed to be in steady state before chlorine shutoff.
Filter 6
0 . 5
0 . 0
2 6 . 5
2 6 . 0
4 . 0
3 . 0
1 . 0 2 . 0
2 7 . 5
2 8 . 5
3 0 . 5
2 5 . 5
2 2 . 6
2 5 . 9
2 4 . 9
2 3 . 9
2 3 . 4
2 2 . 9
1 . 6 2 . 1 3 . 1 4 . 1
6 . 1
1 . 1
300
400
500
600
700
800
900
10/25/04
03:36 PM
10/25/04
09:36 PM
10/26/04
03:36 AM
10/26/04
09:36 AM
10/26/04
03:36 PM
10/26/04
09:36 PM
10/27/04
03:36 AM
10/27/04
09:36 AM
10/27/04
03:36 PM
10/27/04
09:36 PM
E H
( m V )
-22.9 -12.9 -2.9 7.1 17.1 27.1
F i l t e r B a c k w a s h ,
S t a r t i n g R u n 0 4 1 0 2 7
E n d F i l t e r R u n 0 4 1 0 2 5 ; E n d R e a s o n - T B
0 . 0
S t a r t i n g R u n 0 4 1 0 2 5
0 . 0
Filter 1
0 . 5
0 . 0
2 6 . 5
2 6 . 0
3 . 0
1 . 0 2 . 0
2 7 . 5
2 8 . 5
3 0 . 5
2 5 . 5
2 5 . 9
2 4 . 9
2 3 . 9
2 3 . 4
2 2 . 9
1 . 6 2 . 1 3 . 1 4 . 1
6 . 1
1 . 1
300
400
500
600
700
800
900
10/25/04
03:36 PM
10/25/04
09:36 PM
10/26/04
03:36 AM
10/26/04
09:36 AM
10/26/04
03:36 PM
10/26/04
09:36 PM
10/27/04
03:36 AM
10/27/04
09:36 AM
10/27/04
03:36 PM
10/27/04
09:36 PM
1
0
E H
( m V )
-22.9 -12.9 -2.9 7.1 17.1 27.1Inflow EH Outflow EH Dissolved Manganese Total Manganes
F i l t e r B a c k w a s h ,
S t a r t i n g R u n 0 4 1 0 2 7
E n d F i l t e r R u n 0 4 1 0 2 5 ; E n d R e a
s o n - T B
0 . 0
S t a r t i n g R u n 0 4 1 0 2 5
0 . 0
Figure E.22: Belmont pilot plant runs; manganese and EH as a function of time, October 25-28, 2004. Effect of chlorine loss and pH
©2006 AwwaRF. All Rights Reserved.
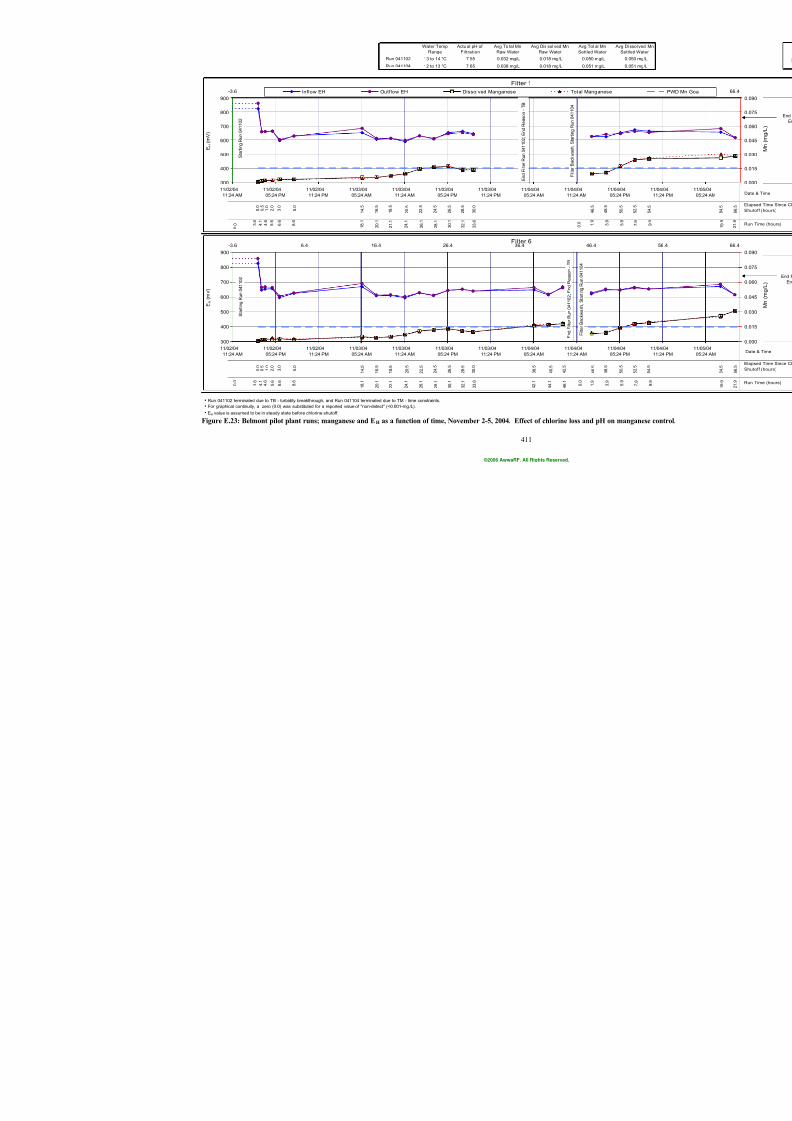
7/21/2019 Occurrence of Manganese in Drinking Water and Manganese Control
http://slidepdf.com/reader/full/occurrence-of-manganese-in-drinking-water-and-manganese-control 437/463
411
Water Temp
Range
Actu al pH of
Filtration
Avg To tal Mn
Raw Water
Avg Dis sol ved Mn
Raw Water
Avg Tot al Mn
Settled Water
Run 041102 13 to 14 °C 7.55 0.032 mg/L 0.018 mg/L 0.050 mg/L
Run 041104 12 to 13 °C 7.65 0.038 mg/L 0.018 mg/L 0.051 mg/L
h
h
hEH value is assumed to be in steady state before chlorine shutoff.
For graphical continuity, a zero (0.0) was substituted for a reported value of "non-detect" (<0.001-mg/L).
Run 041102 terminated due to TB - turbidity breakthrough, and Run 041104 terminated due to TM - time constraints.
Filter 1
1 8 . 5
4 8 5
4 6 . 5
3 0 . 0
2 8 . 5
2 6 . 5
2 4 . 5
2 . 0
1 . 0
3 . 0
5 . 0
1 4 . 5
2 0 . 5
2 2 . 5
0 . 0 0 . 5
1 6 . 5
2 1 . 1
3 9
1 . 9
3 3 . 6
3 2 . 1
3 0 . 1
2 8 . 1
2 6 . 1
2 4 . 1
3 . 6 4 . 1 4 . 6 5 . 6
6 . 6
8 . 6
1 8 . 1
2 0 . 1
300
400
500
600
700
800
900
11/02/04
11:24 AM
11/02/04
05:24 PM
11/02/04
11:24 PM
11/03/04
05:24 AM
11/03/04
11:24 AM
11/03/04
05:24 PM
11/03/04
11:24 PM
11/04/04
05:24 AM
11/04/04
11:24 AM
E H
( m V )
-3.6 6.4 16.4 26.4 36.4 46.4Inflow EH Outflow EH Dissolved Manganese Total Manganes
F i l t e r B a c k w a s h ,
S t a r t i n g R u n 0
4 1 1 0 4
E n d F i l t e r R u n 0 4 1 1 0 2 ; E n d R e a s
o n - T B
0 . 0
S t a r t i n g R u n 0 4 1 1 0 2
0 . 0
Filter 6
1 8 . 5
4 8 5
4 6 . 5
4 2 . 5
4 0 . 5
3 8 . 5
3 0 . 0
2 8 . 5
2 6 . 5
2 4 . 5
2 . 0
1 . 0
3 . 0
5 . 0
1 4 . 5
2 0 . 5
2 2 . 5
0 . 0 0 . 5
1 6 . 5
2 2 . 1
3 9
1 . 9
4 6 . 1
4 4 . 1
4 2 . 1
3 3 . 6
3 2 . 1
3 0 . 1
2 8 . 1
2 6 . 1
2 4 . 1
3 . 6 4 . 1 4 . 6
5 . 6
6 . 6
8 . 6
1 8 . 1
2 0 . 1
300
400
500
600
700
800
900
11/02/04
11:24 AM
11/02/04
05:24 PM
11/02/04
11:24 PM
11/03/04
05:24 AM
11/03/04
11:24 AM
11/03/04
05:24 PM
11/03/04
11:24 PM
11/04/04
05:24 AM
11/04/04
11:24 AM
E H
( m V )
-3.6 6.4 16.4 26.4 36.4 46.4
F i l t e r B a c k w a s h ,
S t a r t i n g R u n 0 4 1 1 0 4
E n d F i l t e r R u n 0 4 1 1 0 2 ; E n d R e a s o n - T B
0 . 0
S t a r t i n g R u n 0 4 1 1 0 2
0 . 0
Figure E.23: Belmont pilot plant runs; manganese and EH as a function of time, November 2-5, 2004. Effect of chlorine loss and pH
©2006 AwwaRF. All Rights Reserved.
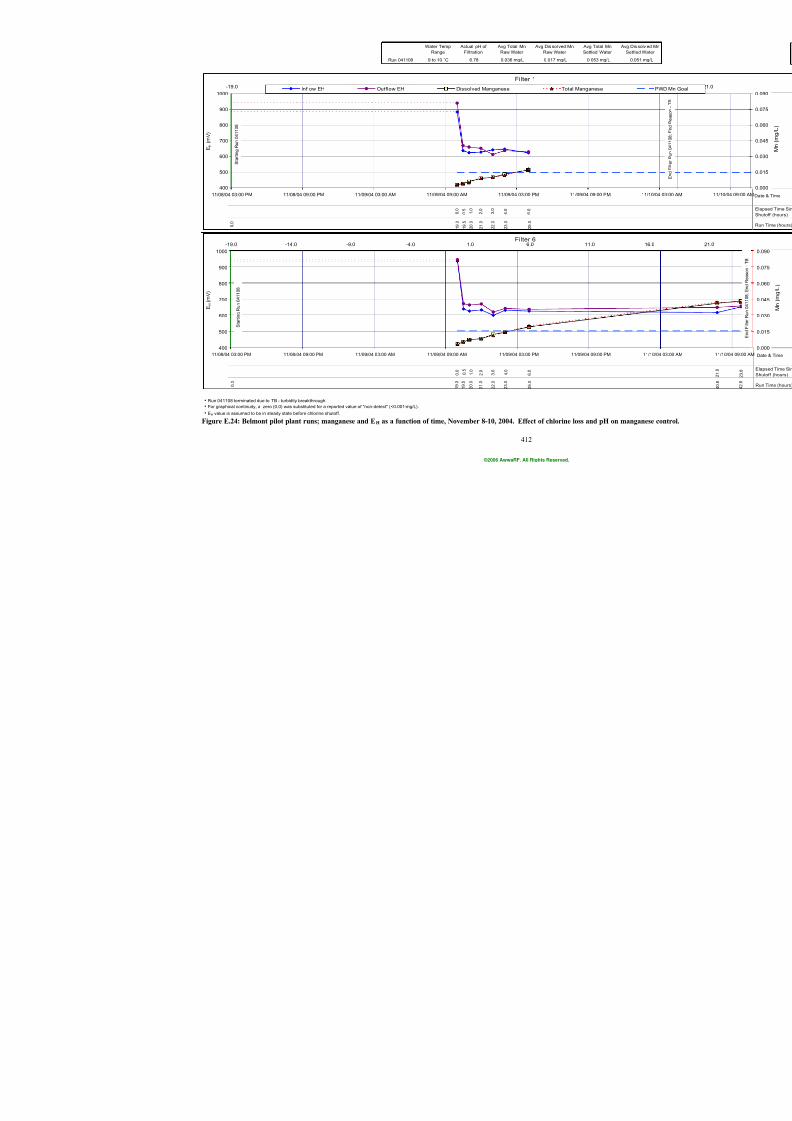
7/21/2019 Occurrence of Manganese in Drinking Water and Manganese Control
http://slidepdf.com/reader/full/occurrence-of-manganese-in-drinking-water-and-manganese-control 438/463
412
Water Temp
Range
Actual pH of
Filtration
Avg Total Mn
Raw Water
Avg Dissol ved Mn
Raw Water
Avg Total M
Settled Wa
Run 041108 9 to 10 °C 6.78 0.036 mg/L 0.017 mg/L 0.053 mg/
h
h
hEH value is assumed to be in steady state before chlorine shutoff.
For graphical continuity, a zero (0.0) was substituted for a reported value of "non-detect" (<0.001-mg/L).
Run 041108 terminated due to TB - turbidity breakthrough.
Filter 1
0 . 5
0 . 0
6 . 0
4 . 0
3 . 0
1 . 0
2 . 0
2 5 . 0
2 3 . 0
2 2 . 0
2 1 . 0
2 0 . 0
1 9 . 5
1 9 . 0
400
500
600
700
800
900
1000
11/08/04 03:00 PM 11/08/04 09:00 PM 11/09/04 03:00 AM 11/09/04 09:00 AM 11/09/04 03:00 PM 11/09/04 09:00 PM
E H
( m V )
-19.0 -14.0 -9.0 -4.0 1.0 6.0 11.0Inflow EH Outflow EH Dissolved Manganese Total Manganese
0 . 0
S t a r t i n g R u n 0 4 1 1 0 8
Filter 6
2 . 0
1 . 0
3 . 0
4 . 0
6 . 0
0 . 0
0 . 5
1 9 . 0
1 9 . 5
2 0 . 0
2 1 . 0
2 2 . 0
2 3 . 0
2 5 . 0
400
500
600
700
800
900
1000
11/08/04 03:00 PM 11/08/04 09:00 PM 11/09/04 03:00 AM 11/09/04 09:00 AM 11/09/04 03:00 PM 11/09/04 09:00 PM
E H
( m V )
-19.0 -14.0 -9.0 -4.0 1.0 6.0 11.0
0 . 0
S t a r t i n g R u n 0 4 1 1 0 8
Figure E.24: Belmont pilot plant runs; manganese and EH as a function of time, November 8-10, 2004. Effect of chlorine loss and pH
©2006 AwwaRF. All Rights Reserved.
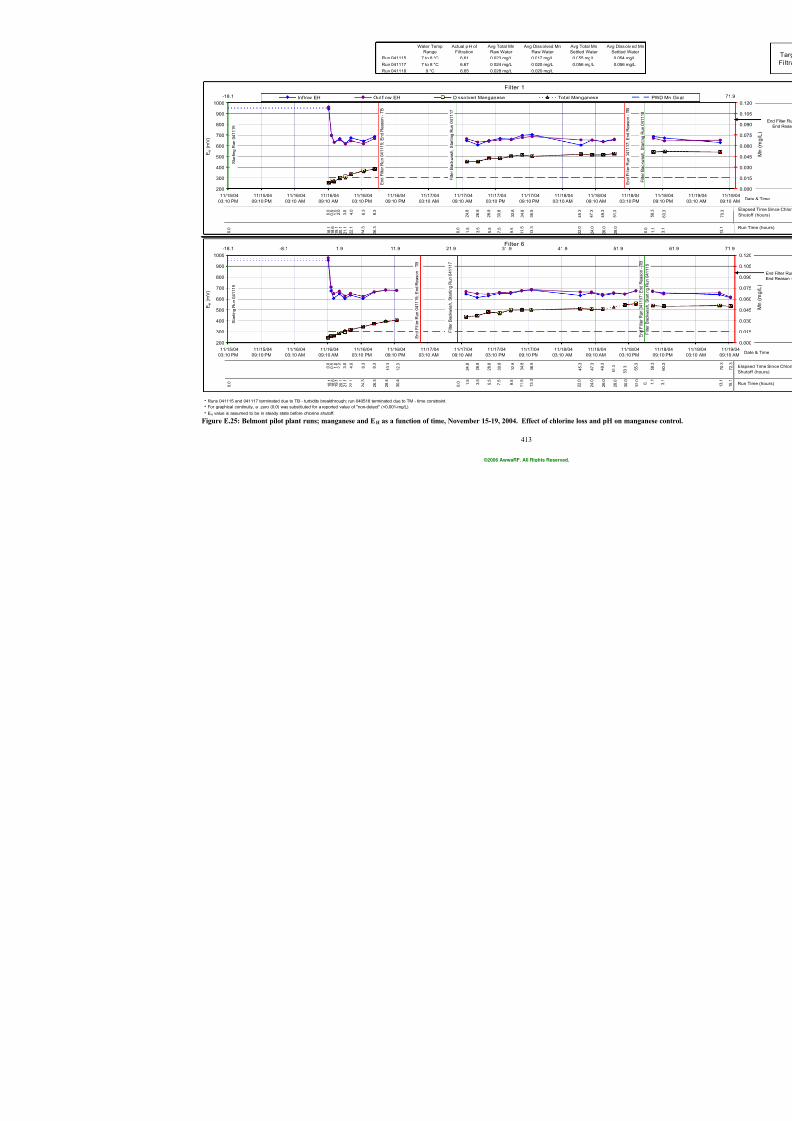
7/21/2019 Occurrence of Manganese in Drinking Water and Manganese Control
http://slidepdf.com/reader/full/occurrence-of-manganese-in-drinking-water-and-manganese-control 439/463
413
Water Temp
Range
Actual p H of
Filtration
Avg Total Mn
Raw Water
Avg Diss olved Mn
Raw Water
Avg Total Mn
Settled Water
Run 041115 7 to 8 °C 6.61 0.023 mg/L 0.017 mg/L 0.055 mg/L
Run 041117 7 to 8 °C 6.67 0.024 mg/L 0.020 mg/L 0.056 mg/L
Run 041118 9 °C 6.65 0.028 mg/L 0.020 mg/L
h
h
hEH value is assumed to be in steady state before chlorine shutoff.
For graphical continuity, a zero (0.0) was substituted for a reported value of "non-detect" (<0.001-mg/L).
Runs 041115 and 041117 terminated due to TB - turbidity breakthrough; run 040518 terminated due to TM - time constraint.
Filter 1
4 9 . 3
4 7 . 3
4 5 . 3
3 6 . 5
3 4 . 8
3 2 . 8
3 0 . 8
2 8 . 8
2 6 . 8
2 4 . 8
2 . 0
1 . 0
3 . 0
4 . 0
6 . 3
0 . 0 0 . 5
8 . 3
2 6 . 0
2 4 . 0
2 2 . 0
1 3 . 3
1 1 . 5
9 . 5
7 . 5
5 . 5
3 . 5
1 . 5
1 8 . 1
1 8 . 6
1 9 . 1
2 0 . 1
2 1 . 1
2 2 . 1
2 4 . 3
2 6 . 3
200
300
400
500
600
700
800
900
1000
11/15/04
03:10 PM
11/15/04
09:10 PM
11/16/04
03:10 AM
11/16/04
09:10 AM
11/16/04
03:10 PM
11/16/04
09:10 PM
11/17/04
03:10 AM
11/17/04
09:10 AM
11/17/04
03:10 PM
11/17/04
09:10 PM
11/18/04
03:10 AM
11/18/04
09:10 AM
E H
( m V )
-18.1 -8.1 1.9 11.9 21.9 31.9 41.9Inflow EH Outflow EH Dissolved Manganese Total Manganese
F i l t e r B a c k w a s h ,
S t a r t i n g R u n 0 4 1
1 1 7
E n d F i l t e r R u n 0 4 1 1 1 5 ; E n d R e a s o n
- T B
0 . 0
S t a r t i n g R u n 0 4 1 1 1 5
0 . 0
Filter 6
8 . 3
0 . 5
0 . 0
1 2 . 3
6 . 3
4 . 0
3 . 0
1 . 0 2 . 0
2 4 . 8
2 6 . 8
2 8 . 8
3 0 . 8
3 2 . 8
3 4 . 8
3 6 . 5
4 5 . 3
4 7 . 3
4 9 . 3
1 0 . 3
2 6 . 3
2 4 . 3
2 2 . 1
2 1 . 1
2 0 . 1
1 9 . 1
1 8 . 6
1 8 . 1
3 0 . 4
1 . 5
3 . 5
5 . 5
7 . 5
9 . 5
1 1 . 5
1 3 . 3
2 2 . 0
2 4 . 0
2 6 . 0
2 8 . 4
200
300
400
500
600
700
800
900
1000
11/15/04
03:10 PM
11/15/04
09:10 PM
11/16/04
03:10 AM
11/16/04
09:10 AM
11/16/04
03:10 PM
11/16/04
09:10 PM
11/17/04
03:10 AM
11/17/04
09:10 AM
11/17/04
03:10 PM
11/17/04
09:10 PM
11/18/04
03:10 AM
11/18/04
09:10 AM
E H
( m V )
-18.1 -8.1 1.9 11.9 21.9 31.9 41.9
F i l t e r B a c k w a s h ,
S t a r t i n g R u n 0 4 1 1 1 7
E n d F i l t e r R u n 0 4 1 1 1 5 ; E n d R e a s o n - T B
0 . 0
S t a r t i n g R u n 0 4 1 1 1 5
0 . 0
Figure E.25: Belmont pilot plant runs; manganese and EH as a function of time, November 15-19, 2004. Effect of chlorine loss and p
©2006 AwwaRF. All Rights Reserved.

7/21/2019 Occurrence of Manganese in Drinking Water and Manganese Control
http://slidepdf.com/reader/full/occurrence-of-manganese-in-drinking-water-and-manganese-control 440/463
414
©2006 AwwaRF. All Rights Reserved.
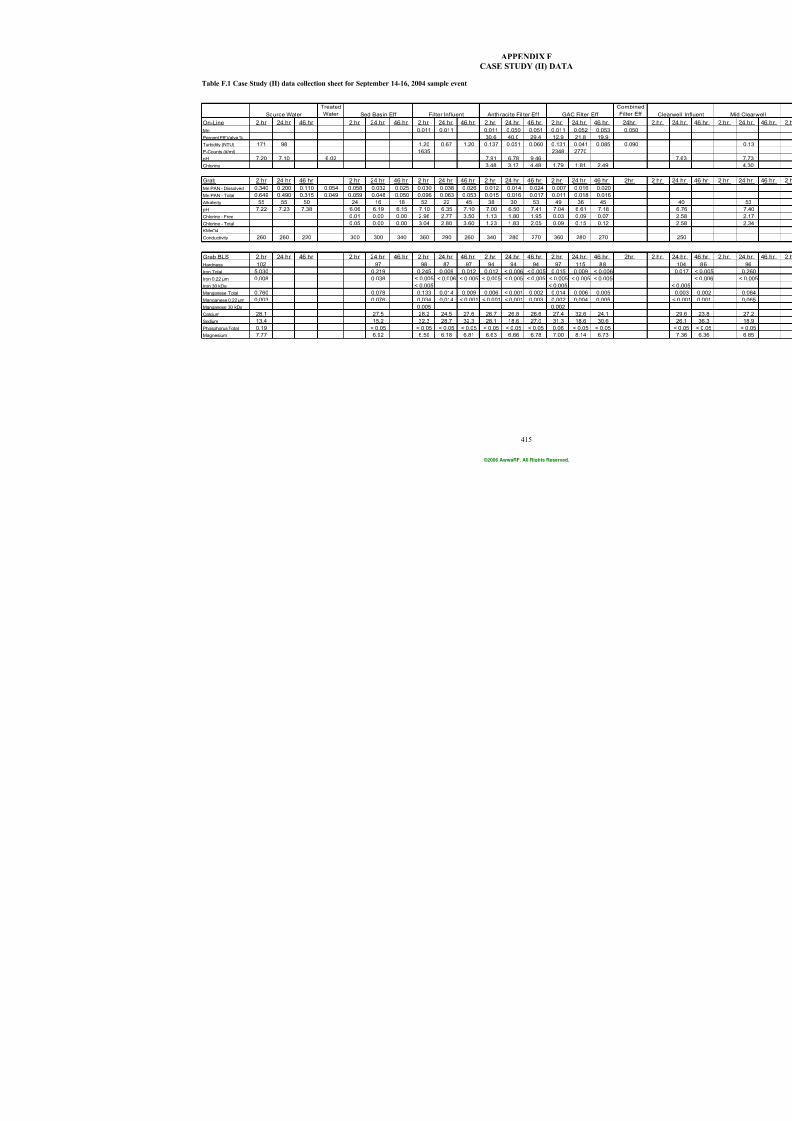
7/21/2019 Occurrence of Manganese in Drinking Water and Manganese Control
http://slidepdf.com/reader/full/occurrence-of-manganese-in-drinking-water-and-manganese-control 441/463
415
APPENDIX F
CASE STUDY (II) DATA
Table F.1 Case Study (II) data collection sheet for September 14-16, 2004 sample event
Treated
Water
On-Line 2 hr 24 hr 46 hr 2 hr 24 hr 46 hr 2 hr 24 hr 46 hr 2 hr 24 hr 46 hr 2 hr 24 hr 46 h
Mn 0.011 0.011 0.011 0.050 0.051 0.011 0.052 0.05
Percent Eff Valve % 30.6 40.0 29.4 12.9 21.8 19.9
Turbidity (NTU) 171 98 1.20 0.67 1.20 0.137 0.051 0.060 0.131 0.041 0.08
P-Counts (#/ml) 1635 2348 2770
pH 7.20 7.10 6.02 7.91 6.78 9.46
Chlorine 3.48 3.17 4.48 1.79 1.81 2.49
Grab 2 hr 24 hr 46 hr 2 hr 24 hr 46 hr 2 hr 24 hr 46 hr 2 hr 24 hr 46 hr 2 hr 24 hr 46 h
Mn PAN - Dissolved 0.340 0.200 0.110 0.054 0.058 0.032 0.025 0.030 0.038 0.026 0.012 0.014 0.024 0.007 0.016 0.02
Mn PAN - Total 0.649 0.490 0.315 0.049 0.059 0.048 0.050 0.096 0.063 0.053 0.015 0.016 0.017 0.011 0.018 0.01
Alkalinity 55 55 50 24 16 18 52 22 45 38 30 53 49 36 45
pH 7.22 7.23 7.38 6.06 6.19 6.15 7.10 6.35 7.10 7.00 6.50 7.41 7.04 6.61 7.18
Chlorine - Free 0.01 0.00 0.00 2.96 2.77 3.50 1.13 1.80 1.95 0.03 0.09 0.07
Chlorine - Total 0.05 0.00 0.00 3.04 2.80 3.60 1.23 1.83 2.05 0.09 0.15 0.12
KMnO4
Conductivity 260 260 220 300 300 340 360 290 260 340 280 270 360 280 270
Grab BLS 2 hr 24 hr 46 hr 2 hr 24 hr 46 hr 2 hr 24 hr 46 hr 2 hr 24 hr 46 hr 2 hr 24 hr 46 h
Hardness 102 97 98 87 97 94 94 94 97 115 88
Iron Total 5.030 0.219 0.245 0.009 0.012 0.012 < 0.006 < 0.005 0.015 0.009 < 0.0
Iron 0.22 µm 0.008 0.038 < 0.005 < 0.006 < 0.005 < 0.005 < 0.005 < 0.005 < 0.005 < 0.005 < 0.0
Iron 30 kDa < 0.005 < 0.005
Manganese Total 0.760 0.078 0.133 0.014 0.009 0.006 < 0.001 0.002 0.014 0.006 0.00
Manganese 0.22 µm 0.003 0.076 0.034 0.014 < 0.001 < 0.001 < 0.001 0.003 0.002 0.004 0.00
Manganese 30 kDa 0.005 0.002
Calcium 28.1 27.5 28.2 24.5 27.6 26.7 26.8 26.6 27.4 32.6 24.1
Sodium 13.4 15.2 32.3 28.7 32.3 28.1 18.6 27.0 31.3 18.6 30.6
Phosphorus Total 0.19 < 0.05 < 0.05 < 0.05 < 0.05 < 0.05 < 0.05 < 0.05 0.06 < 0.05 < 0.0
Magnesium 7.77 6.92 6.59 6.18 6.81 6.63 6.66 6.78 7.00 8.14 6.73
Anth raci te Fil ter Ef f Filter InfluentSource Water Sed Basin Eff GAC Filter Eff
©2006 AwwaRF. All Rights Reserved.
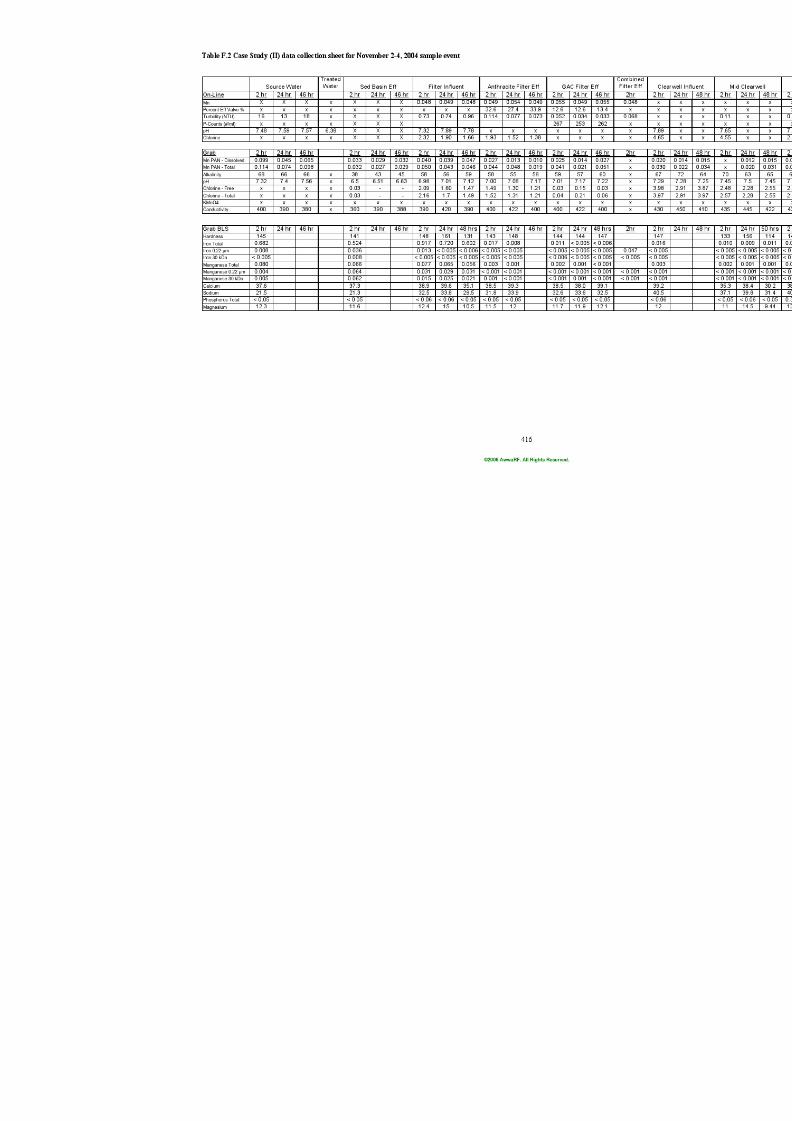
7/21/2019 Occurrence of Manganese in Drinking Water and Manganese Control
http://slidepdf.com/reader/full/occurrence-of-manganese-in-drinking-water-and-manganese-control 442/463
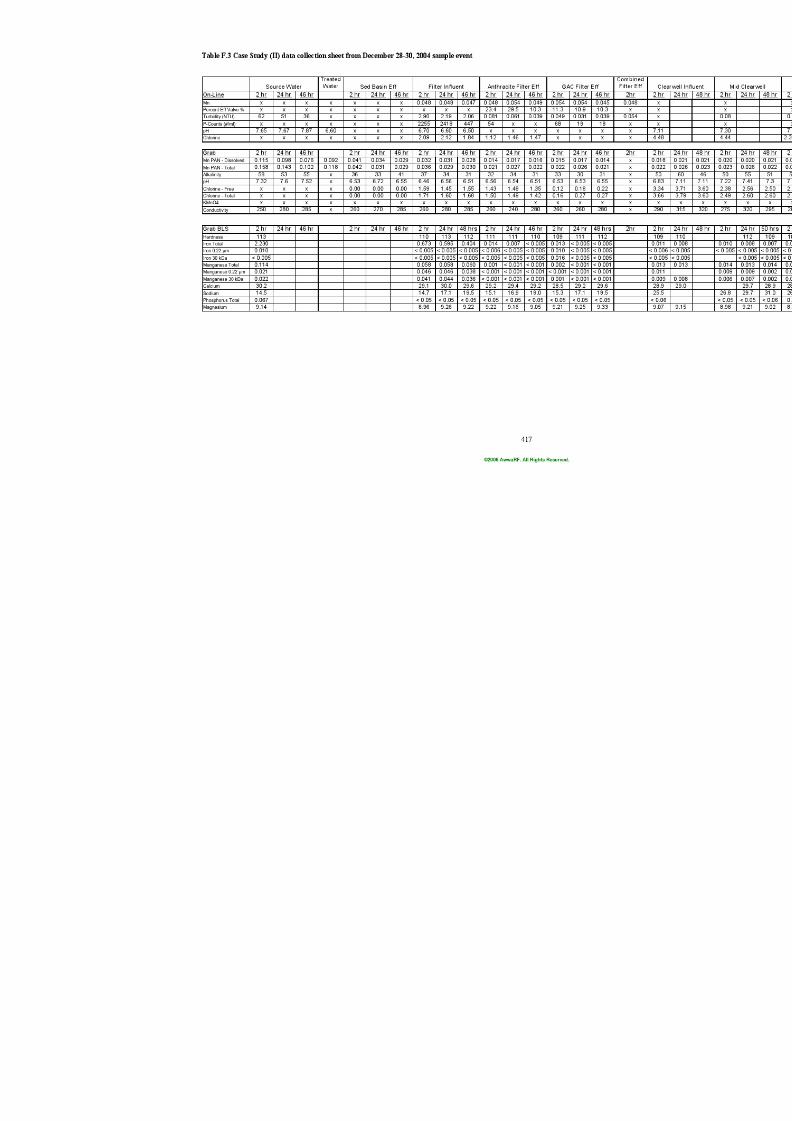
7/21/2019 Occurrence of Manganese in Drinking Water and Manganese Control
http://slidepdf.com/reader/full/occurrence-of-manganese-in-drinking-water-and-manganese-control 443/463

7/21/2019 Occurrence of Manganese in Drinking Water and Manganese Control
http://slidepdf.com/reader/full/occurrence-of-manganese-in-drinking-water-and-manganese-control 444/463
418
©2006 AwwaRF. All Rights Reserved.
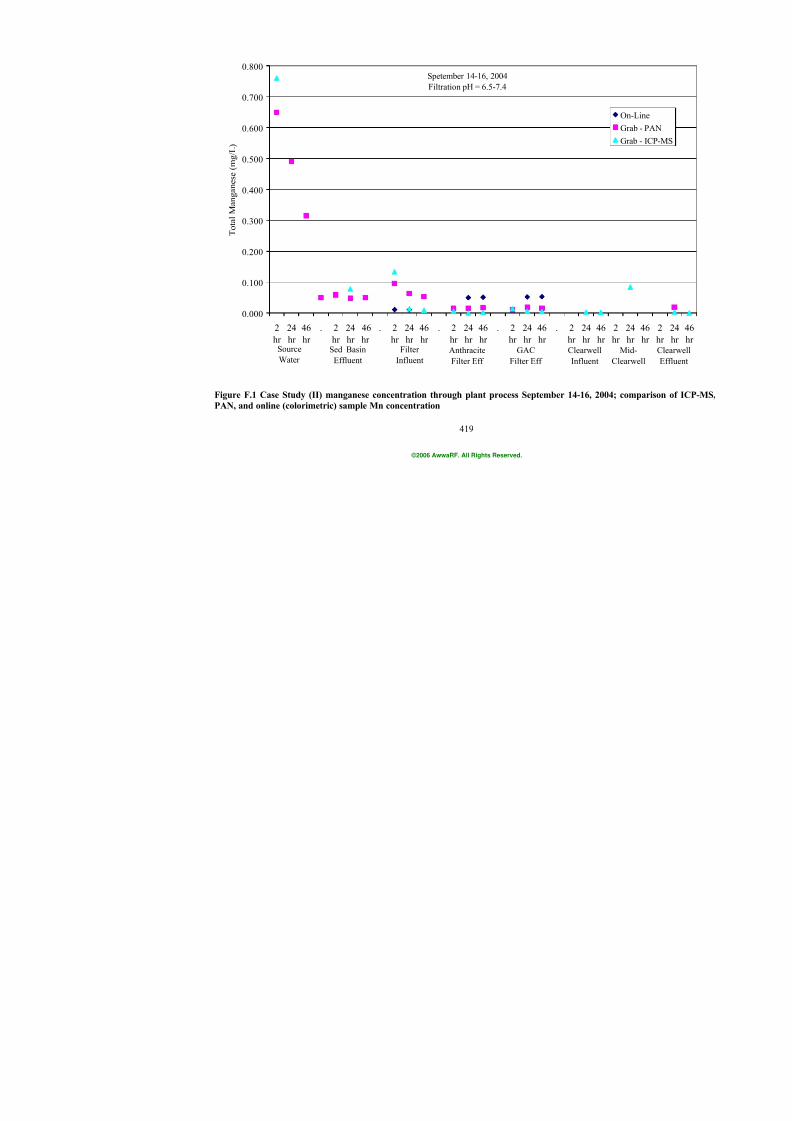
7/21/2019 Occurrence of Manganese in Drinking Water and Manganese Control
http://slidepdf.com/reader/full/occurrence-of-manganese-in-drinking-water-and-manganese-control 445/463
419
Spetember 14-16, 2004
Filtration pH = 6.5-7.4
0.000
0.100
0.200
0.300
0.400
0.500
0.600
0.700
0.800
2
hr
24
hr
46
hr
. 2
hr
24
hr
46
hr
. 2
hr
24
hr
46
hr
. 2
hr
24
hr
46
hr
. 2
hr
24
hr
46
hr
. 2
hr
24
hr
46
hr
T o t a l M a n g a n e s e ( m g / L )
Source
Water
Sed Basin
Effluent
Anthracite
Filter Eff
GAC
Filter Eff
Filter
Influent
Clearwell
Influent
Figure F.1 Case Study (II) manganese concentration through plant process September 14-16, 20
PAN, and online (colorimetric) sample Mn concentration
©2006 AwwaRF. All Rights Reserved.
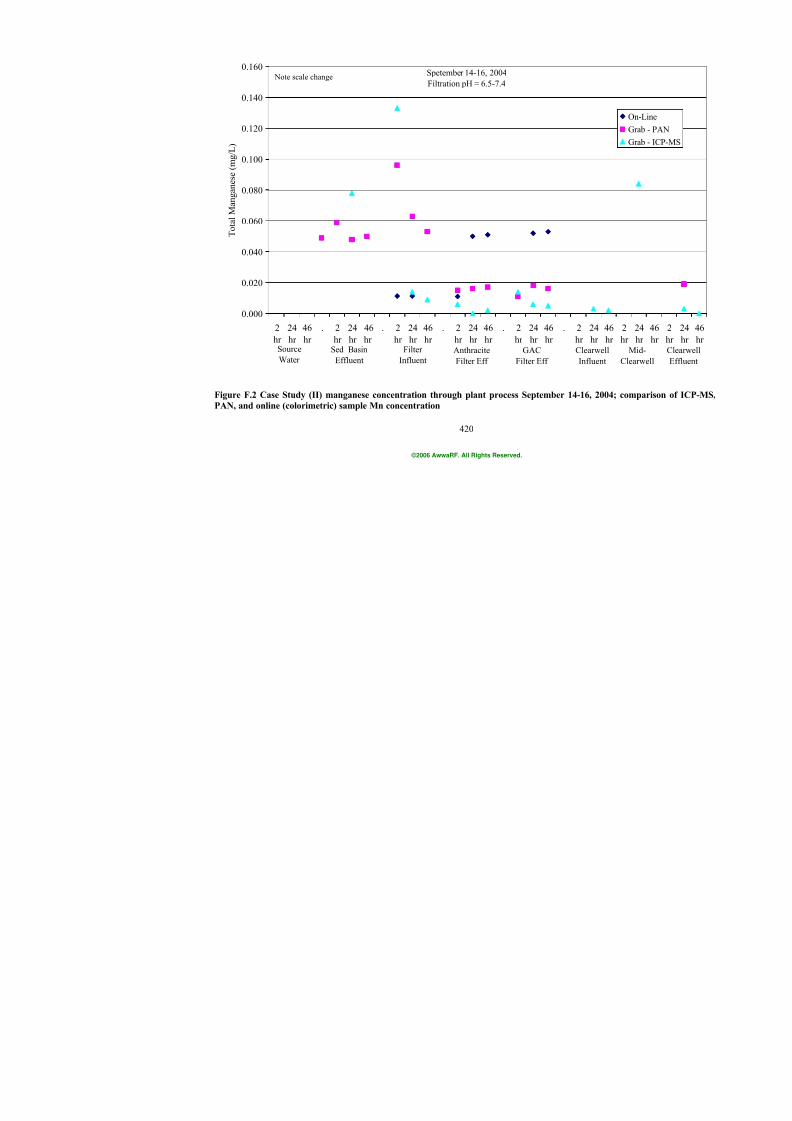
7/21/2019 Occurrence of Manganese in Drinking Water and Manganese Control
http://slidepdf.com/reader/full/occurrence-of-manganese-in-drinking-water-and-manganese-control 446/463
420
Spetember 14-16, 2004
Filtration pH = 6.5-7.4
0.000
0.020
0.040
0.060
0.080
0.100
0.120
0.140
0.160
2
hr
24
hr
46
hr
. 2
hr
24
hr
46
hr
. 2
hr
24
hr
46
hr
. 2
hr
24
hr
46
hr
. 2
hr
24
hr
46
hr
. 2
hr
24
hr
4
h
T
o t a l M a n g a n e s e ( m g / L )
Source
Water
Sed Basin
Effluent
Anthracite
Filter Eff
GAC
Filter Eff
Filter
Influent
Clearwel
Influent
Note scale change
Figure F.2 Case Study (II) manganese concentration through plant process September 14-16, 20
PAN, and online (colorimetric) sample Mn concentration
©2006 AwwaRF. All Rights Reserved.
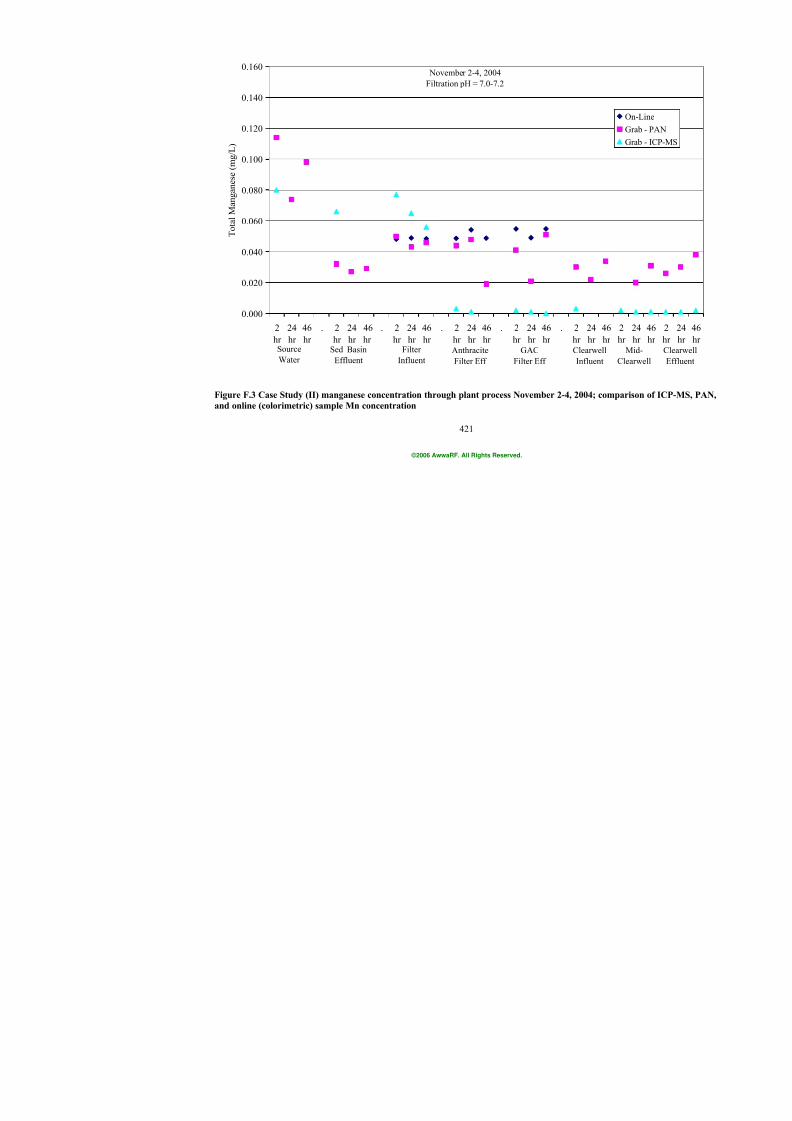
7/21/2019 Occurrence of Manganese in Drinking Water and Manganese Control
http://slidepdf.com/reader/full/occurrence-of-manganese-in-drinking-water-and-manganese-control 447/463
421
November 2-4, 2004
Filtration pH = 7.0-7.2
0.000
0.020
0.040
0.060
0.080
0.100
0.120
0.140
0.160
2
hr
24
hr
46
hr
. 2
hr
24
hr
46
hr
. 2
hr
24
hr
46
hr
. 2
hr
24
hr
46
hr
. 2
hr
24
hr
46
hr
. 2
hr
24
hr
4
h
T
o t a l M a n g a n e s e ( m g / L )
Source
Water
Sed Basin
Effluent
Anthracite
Filter Eff
GAC
Filter Eff
Filter
Influent
Clearwell
Influent
Figure F.3 Case Study (II) manganese concentration through plant process November 2-4, 2004; co
and online (colorimetric) sample Mn concentration
©2006 AwwaRF. All Rights Reserved.
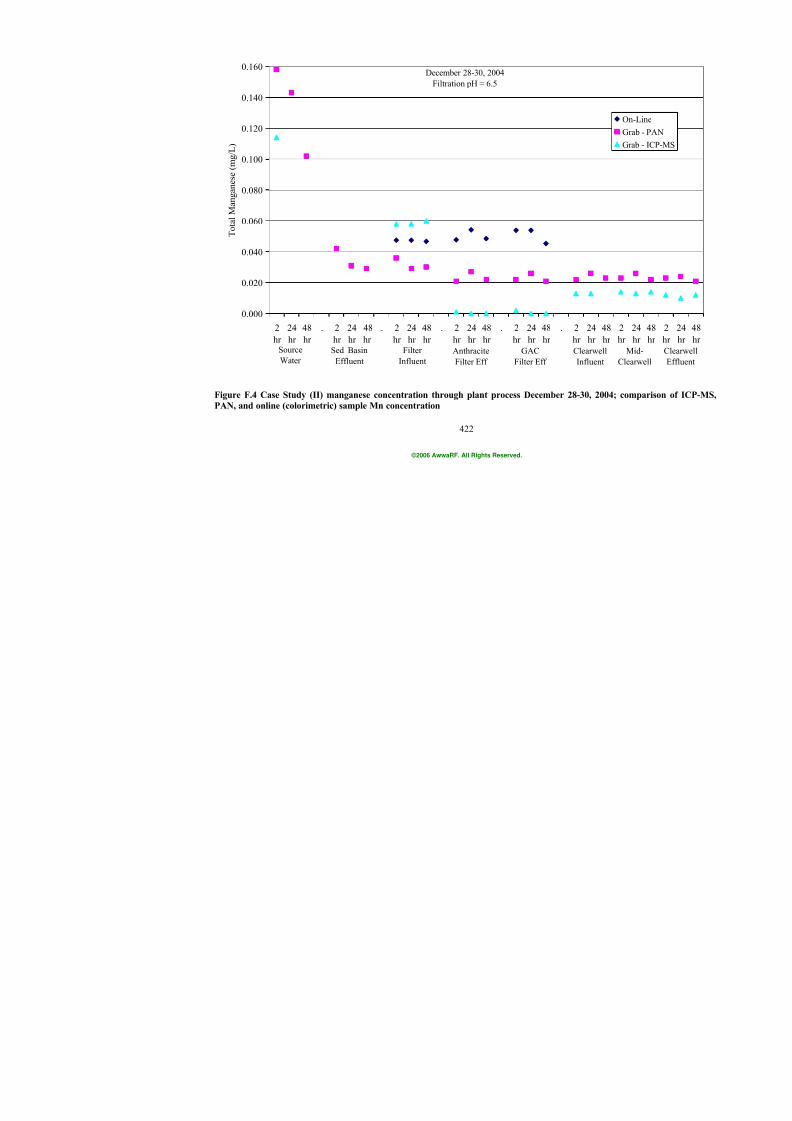
7/21/2019 Occurrence of Manganese in Drinking Water and Manganese Control
http://slidepdf.com/reader/full/occurrence-of-manganese-in-drinking-water-and-manganese-control 448/463
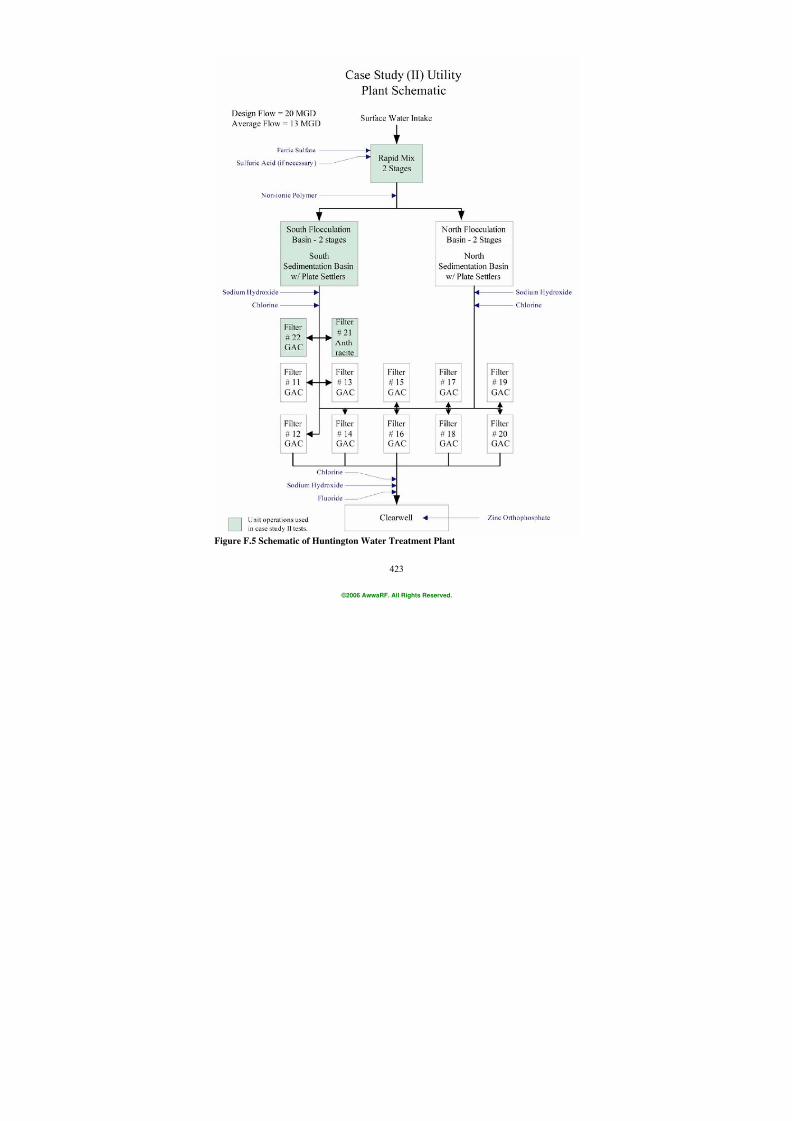
7/21/2019 Occurrence of Manganese in Drinking Water and Manganese Control
http://slidepdf.com/reader/full/occurrence-of-manganese-in-drinking-water-and-manganese-control 449/463
423
Figure F.5 Schematic of Huntington Water Treatment Plant
©2006 AwwaRF. All Rights Reserved.
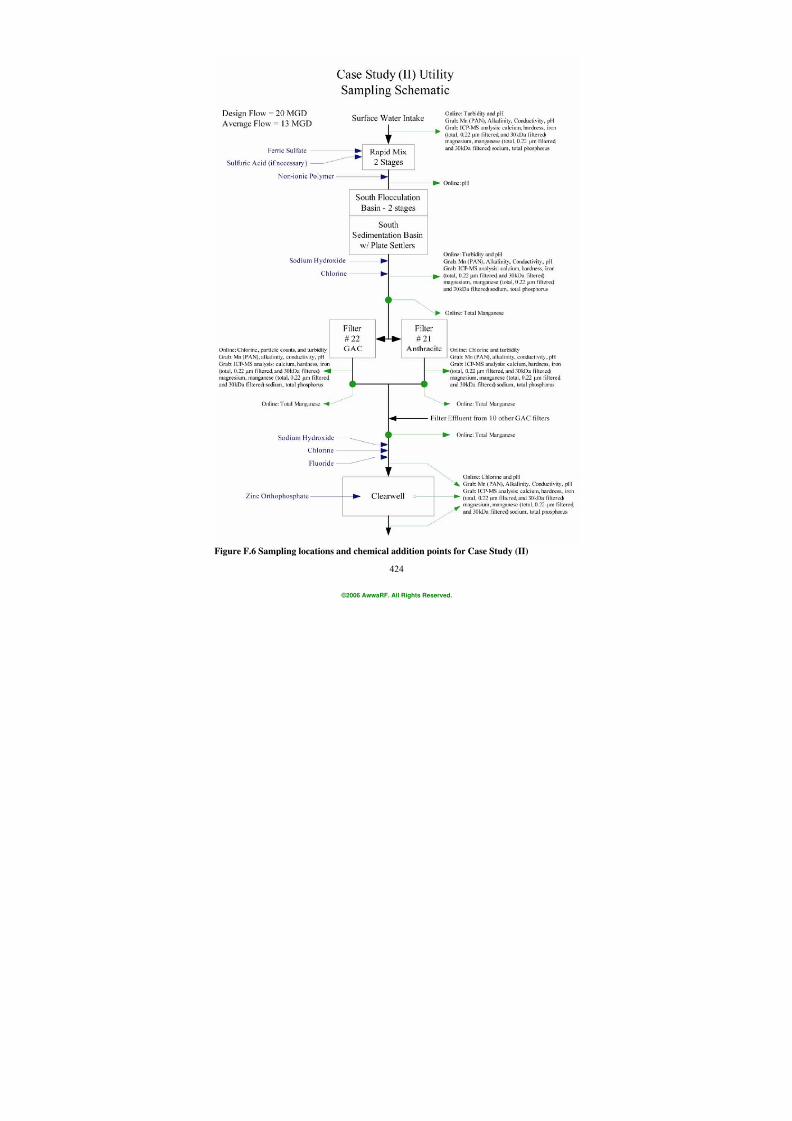
7/21/2019 Occurrence of Manganese in Drinking Water and Manganese Control
http://slidepdf.com/reader/full/occurrence-of-manganese-in-drinking-water-and-manganese-control 450/463
424
Figure F.6 Sampling locations and chemical addition points for Case Study (II)
©2006 AwwaRF. All Rights Reserved.
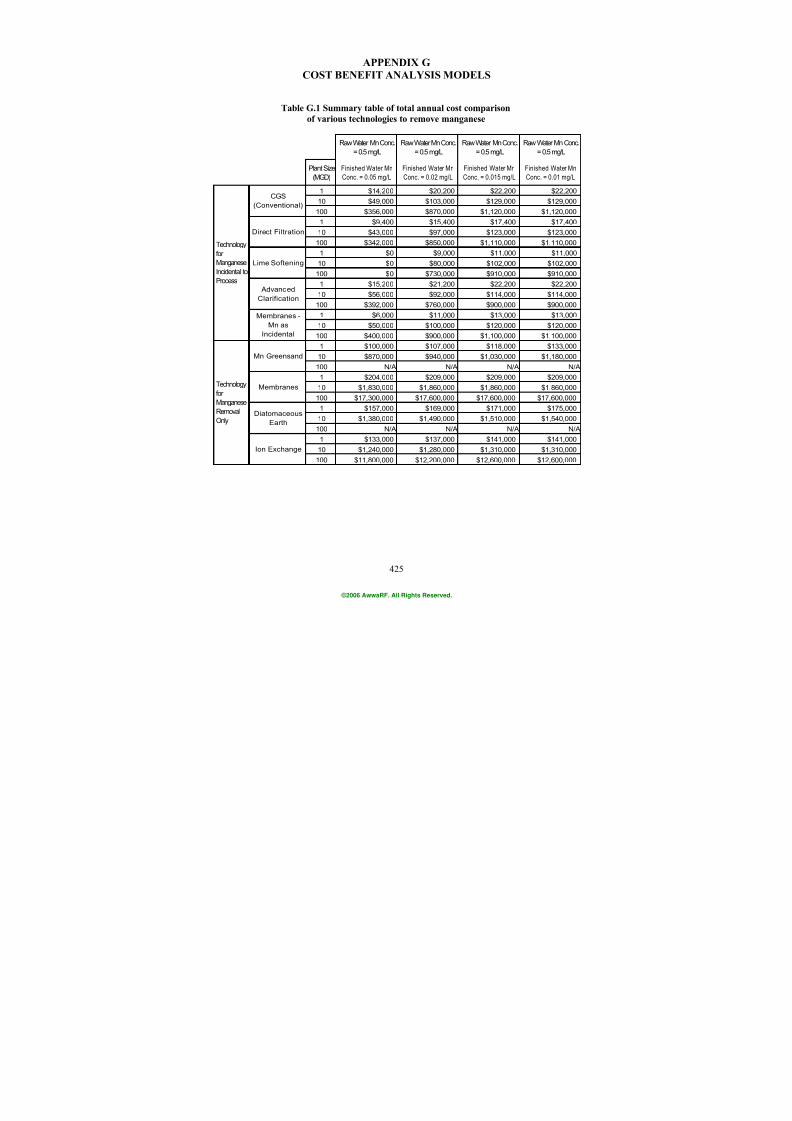
7/21/2019 Occurrence of Manganese in Drinking Water and Manganese Control
http://slidepdf.com/reader/full/occurrence-of-manganese-in-drinking-water-and-manganese-control 451/463
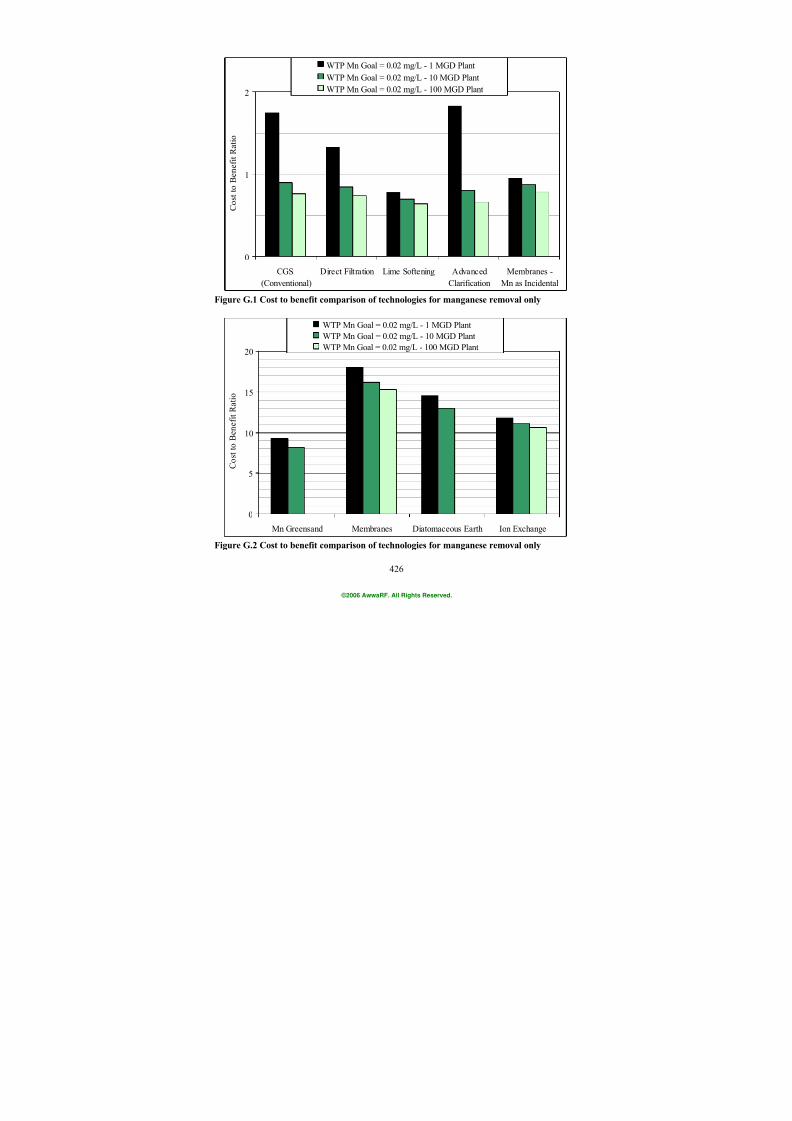
7/21/2019 Occurrence of Manganese in Drinking Water and Manganese Control
http://slidepdf.com/reader/full/occurrence-of-manganese-in-drinking-water-and-manganese-control 452/463
426
0
1
2
CGS
(Conventional)
Direct Filtration Lime Softening Advanced
Clarification
Membranes -
Mn as Incidental
C o s t t o B e n e f i t R a t i o
WTP Mn Goal = 0.02 mg/L - 1 MGD Plant
WTP Mn Goal = 0.02 mg/L - 10 MGD Plant
WTP Mn Goal = 0.02 mg/L - 100 MGD Plant
Figure G.1 Cost to benefit comparison of technologies for manganese removal only
0
5
10
15
20
Mn Greensand Membranes Diatomaceous Earth Ion Exchange
C o s t t o B e n e f i t R a t i o
WTP Mn Goal = 0.02 mg/L - 1 MGD Plant
WTP Mn Goal = 0.02 mg/L - 10 MGD Plant
WTP Mn Goal = 0.02 mg/L - 100 MGD Plant
Figure G.2 Cost to benefit comparison of technologies for manganese removal only
©2006 AwwaRF. All Rights Reserved.
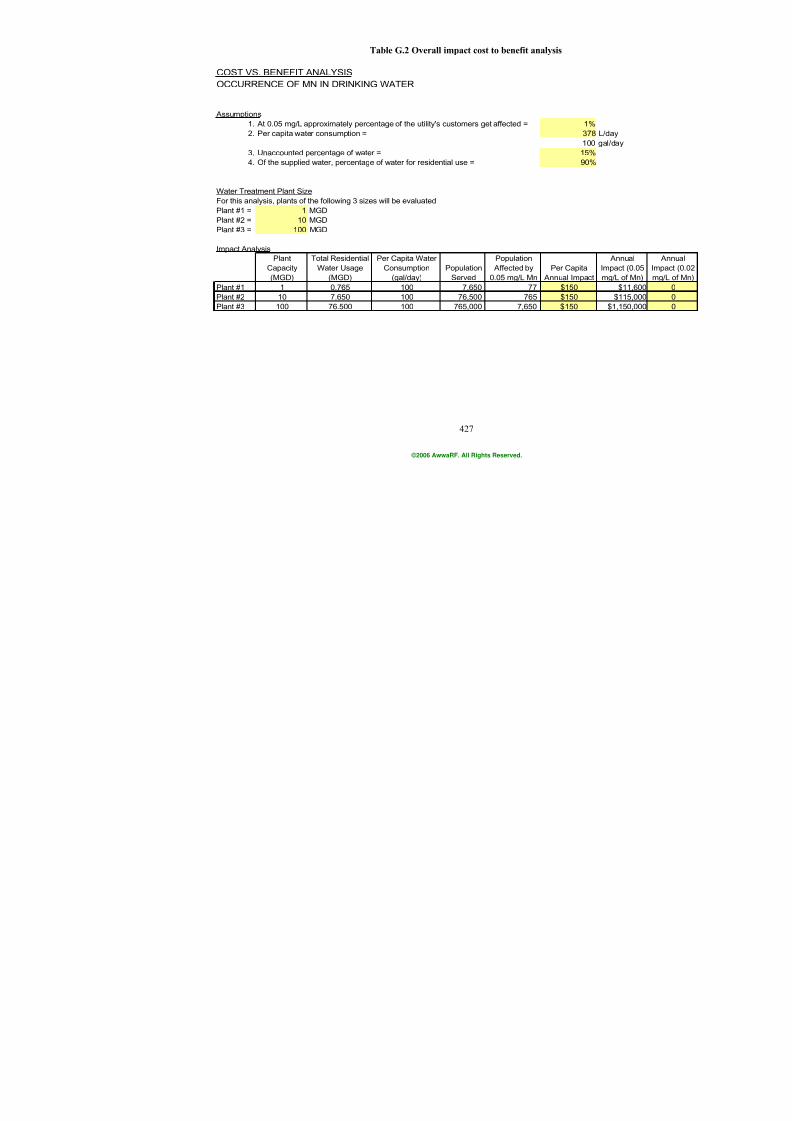
7/21/2019 Occurrence of Manganese in Drinking Water and Manganese Control
http://slidepdf.com/reader/full/occurrence-of-manganese-in-drinking-water-and-manganese-control 453/463
427
Table G.2 Overall impact cost to benefit analysis
COST VS. BENEFIT ANALYSIS
OCCURRENCE OF MN IN DRINKING WATER
Assumptions1. At 0.05 mg/L approximately percentage of the utility's customers get affected = 1%
2. Per capita water consumption = 378 L/d
100 ga
3. Unaccounted percentage of water = 15%
4. Of the supplied water, percentage of water for residential use = 90%
Water Treatment Plant Size
For this analysis, plants of the following 3 sizes will be evaluated
Plant #1 = 1 MGD
Plant #2 = 10 MGD
Plant #3 = 100 MGD
Impact Analysis
Plant
Capacity
(MGD)
Total Residential
Water Usage
(MGD)
Per Capita Water
Consumption
(gal/day)
Population
Served
Population
Affected by
0.05 mg/L Mn
Per Capita
Annual Impact
Im
m
Plant #1 1 0.765 100 7,650 77 $150
Plant #2 10 7.650 100 76,500 765 $150
Plant #3 100 76.500 100 765,000 7,650 $150
©2006 AwwaRF. All Rights Reserved.
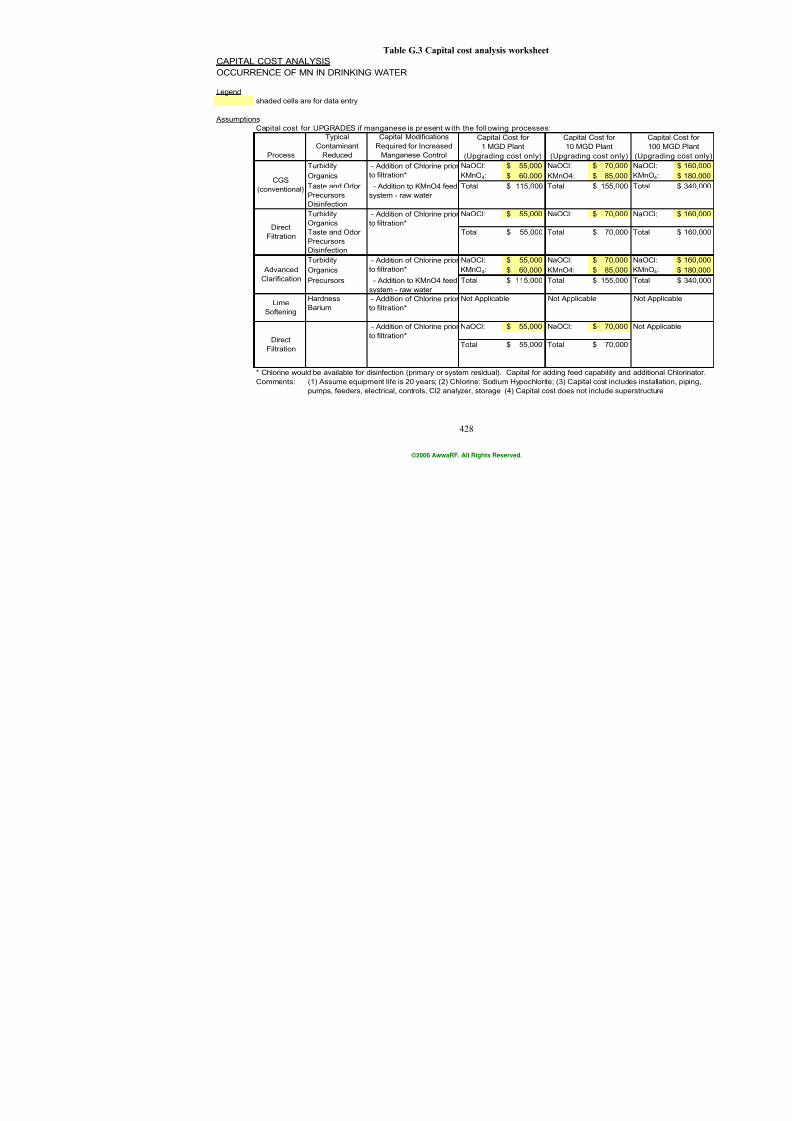
7/21/2019 Occurrence of Manganese in Drinking Water and Manganese Control
http://slidepdf.com/reader/full/occurrence-of-manganese-in-drinking-water-and-manganese-control 454/463
428
Table G.3 Capital cost analysis worksheet
CAPITAL COST ANALYSIS
OCCURRENCE OF MN IN DRINKING WATER
Legend
shaded cells are for data entry
AssumptionsCapital cost for UPGRADES if manganese is present w ith the following processes:
Process
Typical
Contaminant
Reduced
Capital Modifications
Required for Increased
Manganese Control
Turbidity NaOCl: 55,000$ NaOCl: 7$
Organics KMnO4: 60,000$ KMnO4: 8$
Taste and Odor Total 115,000$ Total 15$
Precursors
Disinfection
Turbidity NaOCl: 55,000$ NaOCl: 7$
Organics
Taste and Odor Total 55,000$ Total 7$
Precursors
Disinfection
Turbidity NaOCl: 55,000$ NaOCl: 7$
Organics KMnO4: 60,000$ KMnO4: 8$
Precursors Total 115,000$ Total 15$
Hardness Not Applicable Not Applicable
Barium
NaOCl: 55,000$ NaOCl: 7$
Total 55,000$ Total 7$
* Chlorine would be available for disinfection (primary or system residual). Capital for adding feed capabil
Comments: (1) Assume equipment life is 20 years; (2) Chlorine: Sodium Hypochlorite; (3) Capital cost
pumps, feeders, electrical, controls, Cl2 analyzer, storage (4) Capital cost does not includ
- Addition of Chlorine prior
to filtration*
- Addition of Chlorine prior
to filtration*
Capital Cost
10 MGD Pla
(Upgrading cos
- Addition to KMnO4 feed
system - raw water
- Addition of Chlorine prior
to filtration*
Capital Cost for
1 MGD Plant
(Upgrading cost only)
- Addition to KMnO4 feed
system - raw water
Direct
Filtration
- Addition of Chlorine prior
to filtration*
CGS
(conventional)
Direct
Filtration
Advanced
Clarification
Lime
Softening
- Addition of Chlorine prior
to filtration*
©2006 AwwaRF. All Rights Reserved.
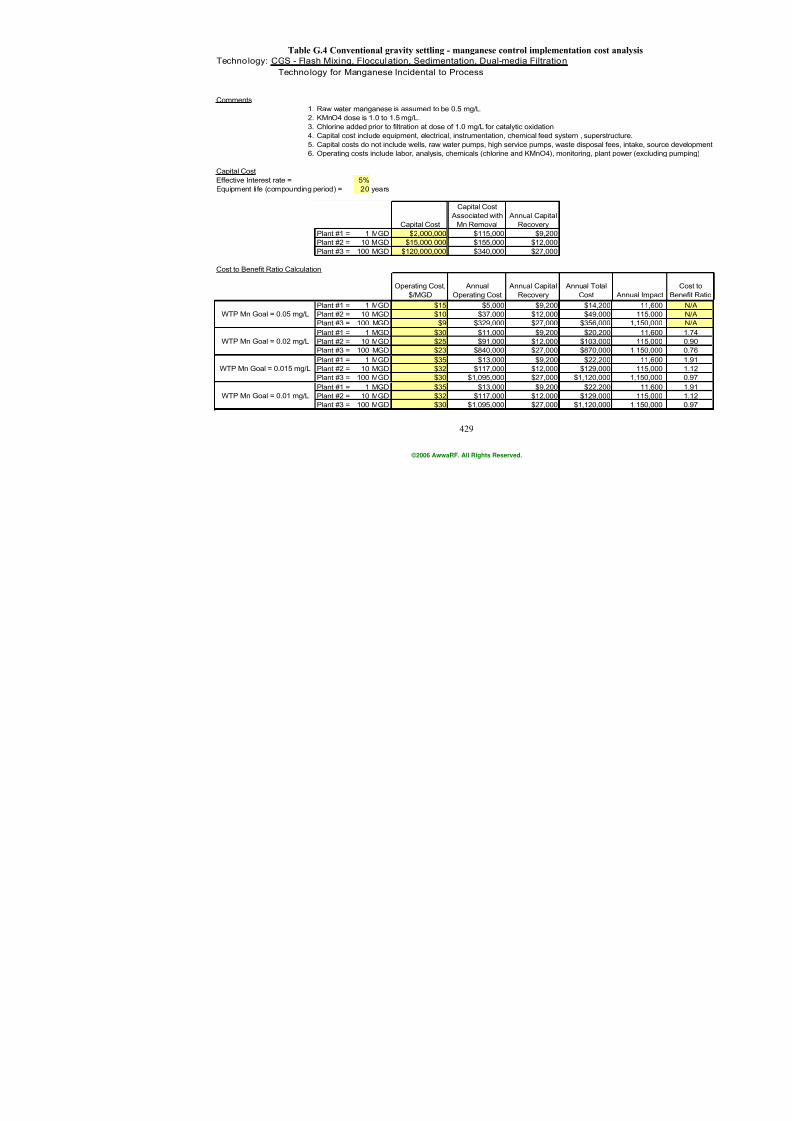
7/21/2019 Occurrence of Manganese in Drinking Water and Manganese Control
http://slidepdf.com/reader/full/occurrence-of-manganese-in-drinking-water-and-manganese-control 455/463
429
Table G.4 Conventional gravity settling - manganese control implementation cosTechnology: CGS - Flash Mixing, Flocculation, Sedimentation, Dual-media Filtration
Technology for Manganese Incidental to Process
Comments
1. Raw water manganese is assumed to be 0.5 mg/L.
2. KMnO4 dose is 1.0 to 1.5 mg/L.3. Chlorine added prior to filtration at dose of 1.0 mg/L for catalytic oxidation
4. Capital cost include equipment, electrical, instrumentation, chemical feed system , supers
5. Capital costs do not include wells, raw water pumps, high service pumps, waste disposal
6. Operating costs include labor, analysis, chemicals (chlorine and KMnO4), monitoring, pla
Capital Cost
Effective Interest rate = 5%
Equipment life (compounding period) = 20 years
Capital Cost
Capital Cost
Associated with
Mn Removal
Annual Capital
Recovery
Plant #1 = 1 MGD $2,000,000 $115,000 $9,200
Plant #2 = 10 MGD $15,000,000 $155,000 $12,000
Plant #3 = 100 MGD $120,000,000 $340,000 $27,000
Cost to Benefit Ratio Calculation
Operating Cost,
$/MGD
Annual
Operating Cost
Annual Capital
Recovery
Annual Tota
Cost
Plant #1 = 1 MGD $15 $5,000 $9,200 $14,20
Plant #2 = 10 MGD $10 $37,000 $12,000 $49,00Plant #3 = 100 MGD $9 $329,000 $27,000 $356,00
Plant #1 = 1 MGD $30 $11,000 $9,200 $20,20
Plant #2 = 10 MGD $25 $91,000 $12,000 $103,00Plant #3 = 100 MGD $23 $840,000 $27,000 $870,00
Plant #1 = 1 MGD $35 $13,000 $9,200 $22,20
Plant #2 = 10 MGD $32 $117,000 $12,000 $129,00Plant #3 = 100 MGD $30 $1,095,000 $27,000 $1,120,00
Plant #1 = 1 MGD $35 $13,000 $9,200 $22,20
Plant #2 = 10 MGD $32 $117,000 $12,000 $129,00Plant #3 = 100 MGD $30 $1,095,000 $27,000 $1,120,00
WTP Mn Goal = 0.01 mg/L
WTP Mn Goal = 0.05 mg/L
WTP Mn Goal = 0.02 mg/L
WTP Mn Goal = 0.015 mg/L
©2006 AwwaRF. All Rights Reserved.
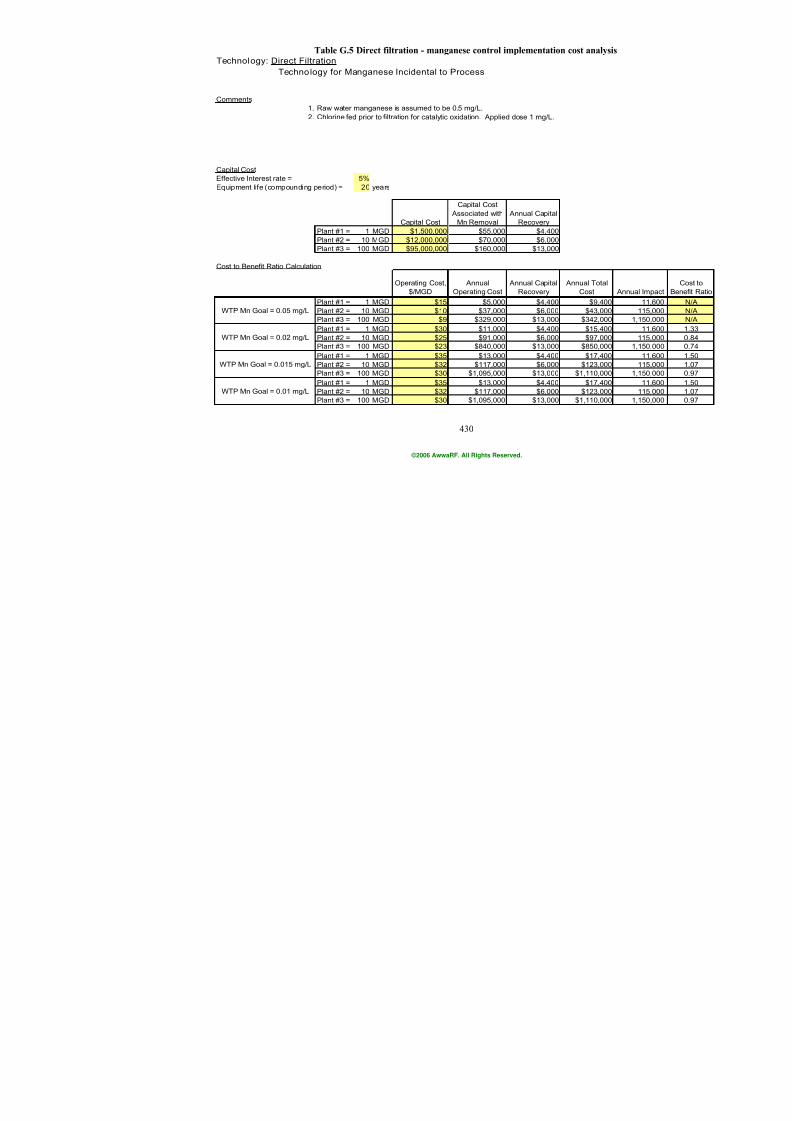
7/21/2019 Occurrence of Manganese in Drinking Water and Manganese Control
http://slidepdf.com/reader/full/occurrence-of-manganese-in-drinking-water-and-manganese-control 456/463
430
Table G.5 Direct filtration - manganese control implementation cost analyTechnology: Direct Filtration
Technology for Manganese Incidental to Process
Comments
1. Raw water manganese is assumed to be 0.5 mg/L.
2. Chlorine fed prior to filtration for catalytic oxidation. Applied dose 1 mg/L.
Capital Cost
Effective Interest rate = 5%
Equipment life (compounding period) = 20 years
Capital Cost
Capital Cost
Associated with
Mn Removal
Annual Capital
Recovery
Plant #1 = 1 MGD $1,500,000 $55,000 $4,400
Plant #2 = 10 MGD $12,000,000 $70,000 $6,000
Plant #3 = 100 MGD $95,000,000 $160,000 $13,000
Cost to Benefit Ratio Calculation
Operating Cost,
$/MGD
Annual
Operating Cost
Annual Capital
Recovery
Annual Tota
Cost
Plant #1 = 1 MGD $15 $5,000 $4,400 $9,40
Plant #2 = 10 MGD $10 $37,000 $6,000 $43,00Plant #3 = 100 MGD $9 $329,000 $13,000 $342,00
Plant #1 = 1 MGD $30 $11,000 $4,400 $15,40
Plant #2 = 10 MGD $25 $91,000 $6,000 $97,00Plant #3 = 100 MGD $23 $840,000 $13,000 $850,00
Plant #1 = 1 MGD $35 $13,000 $4,400 $17,40Plant #2 = 10 MGD $32 $117,000 $6,000 $123,00Plant #3 = 100 MGD $30 $1,095,000 $13,000 $1,110,00
Plant #1 = 1 MGD $35 $13,000 $4,400 $17,40
Plant #2 = 10 MGD $32 $117,000 $6,000 $123,00Plant #3 = 100 MGD $30 $1,095,000 $13,000 $1,110,00
WTP Mn Goal = 0.01 mg/L
WTP Mn Goal = 0.05 mg/L
WTP Mn Goal = 0.02 mg/L
WTP Mn Goal = 0.015 mg/L
©2006 AwwaRF. All Rights Reserved.
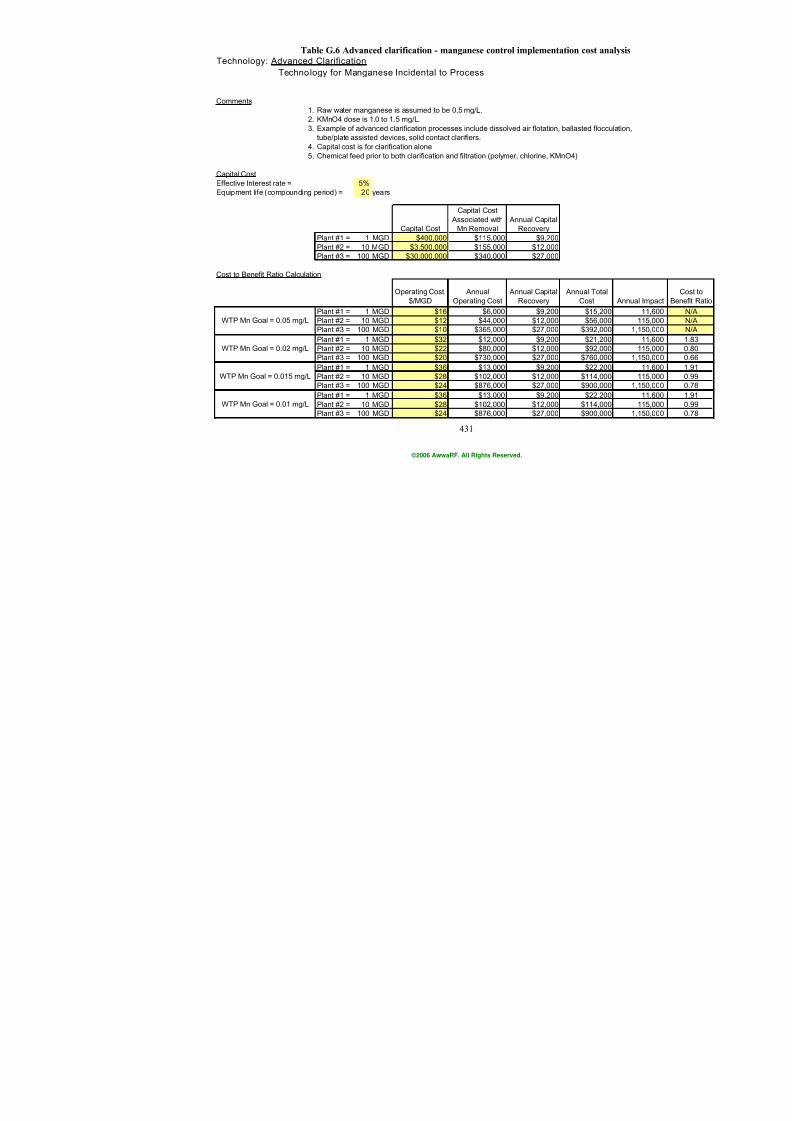
7/21/2019 Occurrence of Manganese in Drinking Water and Manganese Control
http://slidepdf.com/reader/full/occurrence-of-manganese-in-drinking-water-and-manganese-control 457/463
431
Table G.6 Advanced clarification - manganese control implementation cost a
Technology: Advanced Clarification
Technology for Manganese Incidental to Process
Comments1. Raw water manganese is assumed to be 0.5 mg/L.
2. KMnO4 dose is 1.0 to 1.5 mg/L.3. Example of advanced clarification processes include dissolved air flotation, ballasted flocc
tube/plate assisted devices, solid contact clarifiers.4. Capital cost is for clarification alone5. Chemical feed prior to both clarification and filtration (polymer, chlorine, KMnO4)
Capital CostEffective Interest rate = 5%Equipment life (compounding period) = 20 years
Capital Cost
Capital Cost Associated with
Mn Removal Annual Capital
Recovery
Plant #1 = 1 MGD $400,000 $115,000 $9,200Plant #2 = 10 MGD $3,500,000 $155,000 $12,000Plant #3 = 100 MGD $30,000,000 $340,000 $27,000
Cost to Benefit Ratio Calculation
Operating Cost,$/MGD
AnnualOperating Cost
Annual CapitalRecovery
Annual TotaCost
Plant #1 = 1 MGD $16 $6,000 $9,200 $15,20Plant #2 = 10 MGD $12 $44,000 $12,000 $56,00Plant #3 = 100 MGD $10 $365,000 $27,000 $392,00
Plant #1 = 1 MGD $32 $12,000 $9,200 $21,20Plant #2 = 10 MGD $22 $80,000 $12,000 $92,00
Plant #3 = 100 MGD $20 $730,000 $27,000 $760,00Plant #1 = 1 MGD $36 $13,000 $9,200 $22,20Plant #2 = 10 MGD $28 $102,000 $12,000 $114,00Plant #3 = 100 MGD $24 $876,000 $27,000 $900,00
Plant #1 = 1 MGD $36 $13,000 $9,200 $22,20Plant #2 = 10 MGD $28 $102,000 $12,000 $114,00Plant #3 = 100 MGD $24 $876,000 $27,000 $900,00
WTP Mn Goal = 0.01 mg/L
WTP Mn Goal = 0.05 mg/L
WTP Mn Goal = 0.02 mg/L
WTP Mn Goal = 0.015 mg/L
©2006 AwwaRF. All Rights Reserved.
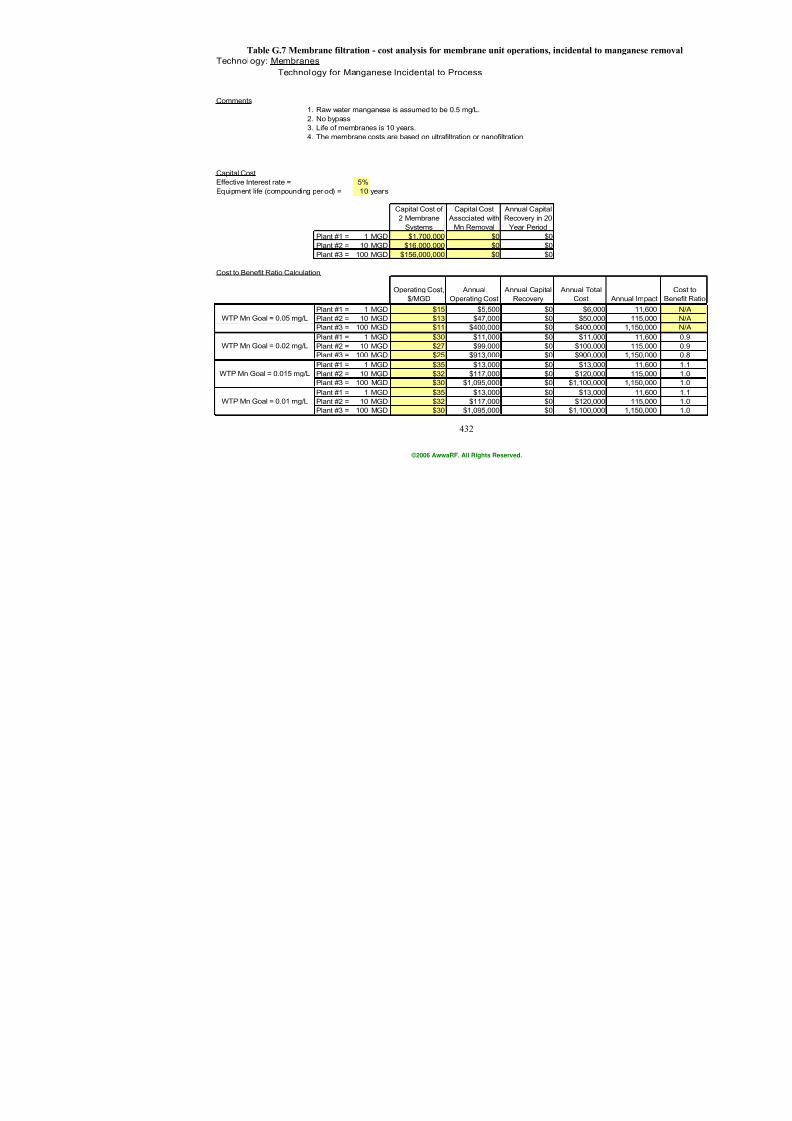
7/21/2019 Occurrence of Manganese in Drinking Water and Manganese Control
http://slidepdf.com/reader/full/occurrence-of-manganese-in-drinking-water-and-manganese-control 458/463
432
Table G.7 Membrane filtration - cost analysis for membrane unit operations, incidental to Technology: Membranes
Technology for Manganese Incidental to Process
Comments
1. Raw water manganese is assumed to be 0.5 mg/L.
2. No bypass3. Life of membranes is 10 years.
4. The membrane costs are based on ultrafiltration or nanofiltration
Capital Cost
Effective Interest rate = 5%
Equipment life (compounding period) = 10 years
Capital Cost of
2 Membrane
Systems
Capital Cost
Associated with
Mn Removal
Annual Capital
Recovery in 20
Year Period
Plant #1 = 1 MGD $1,700,000 $0 $0Plant #2 = 10 MGD $16,000,000 $0 $0
Plant #3 = 100 MGD $156,000,000 $0 $0
Cost to Benefit Ratio Calculation
Operating Cost,
$/MGD
Annual
Operating Cost
Annual Capital
Recovery
Annual Total
Cost
Plant #1 = 1 MGD $15 $5,500 $0 $6,000
Plant #2 = 10 MGD $13 $47,000 $0 $50,000
Plant #3 = 100 MGD $11 $400,000 $0 $400,000
Plant #1 = 1 MGD $30 $11,000 $0 $11,000
Plant #2 = 10 MGD $27 $99,000 $0 $100,000
Plant #3 = 100 MGD $25 $913,000 $0 $900,000Plant #1 = 1 MGD $35 $13,000 $0 $13,000
Plant #2 = 10 MGD $32 $117,000 $0 $120,000
Plant #3 = 100 MGD $30 $1,095,000 $0 $1,100,000
Plant #1 = 1 MGD $35 $13,000 $0 $13,000
Plant #2 = 10 MGD $32 $117,000 $0 $120,000
Plant #3 = 100 MGD $30 $1,095,000 $0 $1,100,000
WTP Mn Goal = 0.05 mg/L
WTP Mn Goal = 0.02 mg/L
WTP Mn Goal = 0.015 mg/L
WTP Mn Goal = 0.01 mg/L
©2006 AwwaRF. All Rights Reserved.
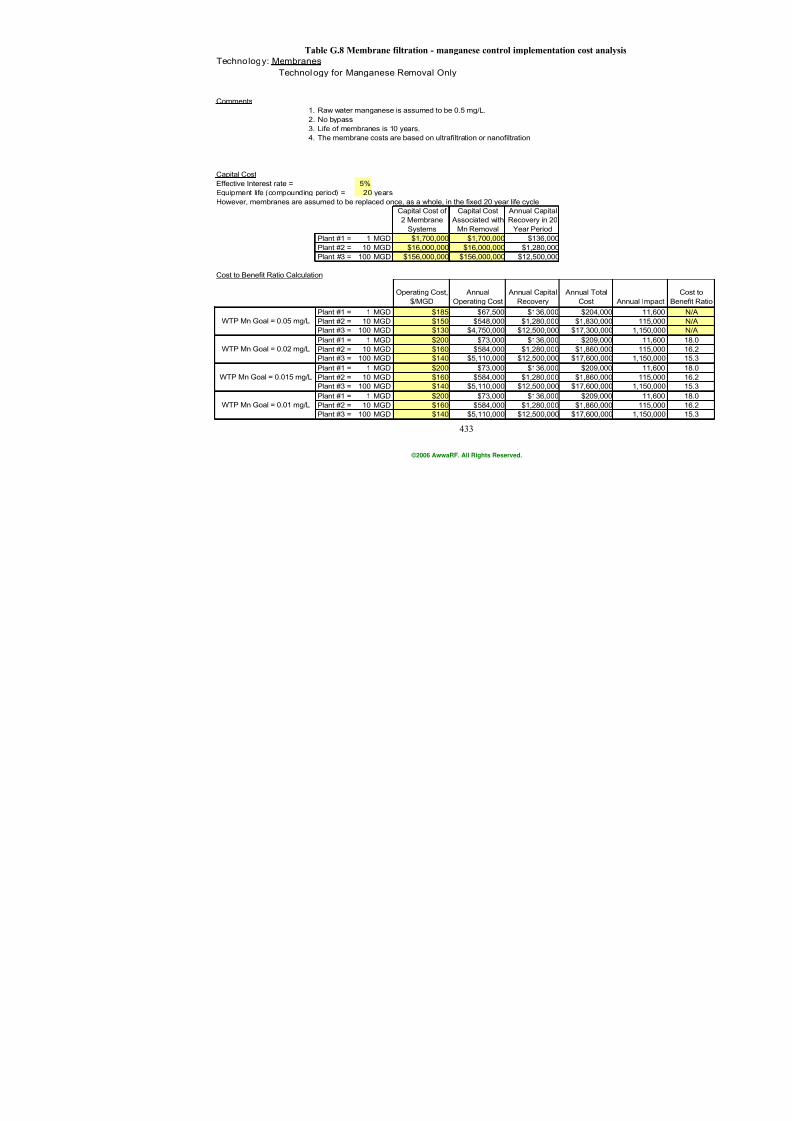
7/21/2019 Occurrence of Manganese in Drinking Water and Manganese Control
http://slidepdf.com/reader/full/occurrence-of-manganese-in-drinking-water-and-manganese-control 459/463
433
Table G.8 Membrane filtration - manganese control implementation cost an
Technology: Membranes
Technology for Manganese Removal Only
Comments
1. Raw water manganese is assumed to be 0.5 mg/L.
2. No bypass3. Life of membranes is 10 years.
4. The membrane costs are based on ultrafiltration or nanofiltration
Capital Cost
Effective Interest rate = 5%
Equipment life (compounding period) = 20 years
However, membranes are assumed to be replaced once, as a whole, in the fixed 20 year life cycle
Capital Cost of
2 Membrane
Systems
Capital Cost
Associated with
Mn Removal
Annual Capital
Recovery in 20
Year Period
Plant #1 = 1 MGD $1,700,000 $1,700,000 $136,000Plant #2 = 10 MGD $16,000,000 $16,000,000 $1,280,000
Plant #3 = 100 MGD $156,000,000 $156,000,000 $12,500,000
Cost to Benefit Ratio Calculation
Operating Cost,
$/MGD
Annual
Operating Cost
Annual Capital
Recovery
Annual Tota
Cost
Plant #1 = 1 MGD $185 $67,500 $136,000 $204,00
Plant #2 = 10 MGD $150 $548,000 $1,280,000 $1,830,00
Plant #3 = 100 MGD $130 $4,750,000 $12,500,000 $17,300,00
Plant #1 = 1 MGD $200 $73,000 $136,000 $209,00
Plant #2 = 10 MGD $160 $584,000 $1,280,000 $1,860,00
Plant #3 = 100 MGD $140 $5,110,000 $12,500,000 $17,600,00
Plant #1 = 1 MGD $200 $73,000 $136,000 $209,00
Plant #2 = 10 MGD $160 $584,000 $1,280,000 $1,860,00
Plant #3 = 100 MGD $140 $5,110,000 $12,500,000 $17,600,00
Plant #1 = 1 MGD $200 $73,000 $136,000 $209,00
Plant #2 = 10 MGD $160 $584,000 $1,280,000 $1,860,00
Plant #3 = 100 MGD $140 $5,110,000 $12,500,000 $17,600,00
WTP Mn Goal = 0.01 mg/L
WTP Mn Goal = 0.05 mg/L
WTP Mn Goal = 0.02 mg/L
WTP Mn Goal = 0.015 mg/L
©2006 AwwaRF. All Rights Reserved.
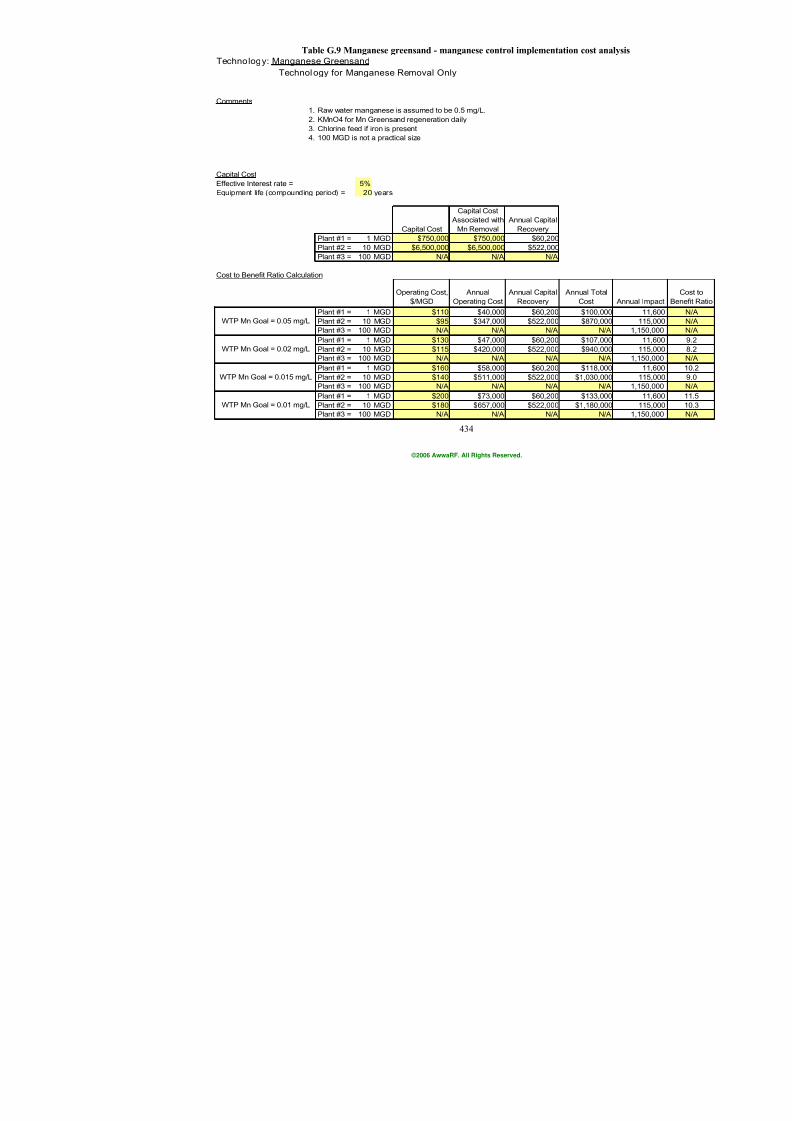
7/21/2019 Occurrence of Manganese in Drinking Water and Manganese Control
http://slidepdf.com/reader/full/occurrence-of-manganese-in-drinking-water-and-manganese-control 460/463
434
Table G.9 Manganese greensand - manganese control implementation cost an
Technology: Manganese Greensand
Technology for Manganese Removal Only
Comments
1. Raw water manganese is assumed to be 0.5 mg/L.
2. KMnO4 for Mn Greensand regeneration daily3. Chlorine feed if iron is present
4. 100 MGD is not a practical size
Capital Cost
Effective Interest rate = 5%
Equipment life (compounding period) = 20 years
Capital Cost
Capital Cost
Associated with
Mn Removal
Annual Capital
Recovery
Plant #1 = 1 MGD $750,000 $750,000 $60,200Plant #2 = 10 MGD $6,500,000 $6,500,000 $522,000
Plant #3 = 100 MGD N/A N/A N/A
Cost to Benefit Ratio Calculation
Operating Cost,
$/MGD
Annual
Operating Cost
Annual Capital
Recovery
Annual Tota
Cost
Plant #1 = 1 MGD $110 $40,000 $60,200 $100,00
Plant #2 = 10 MGD $95 $347,000 $522,000 $870,00
Plant #3 = 100 MGD N/A N/A N/A N/
Plant #1 = 1 MGD $130 $47,000 $60,200 $107,00
Plant #2 = 10 MGD $115 $420,000 $522,000 $940,00
Plant #3 = 100 MGD N/A N/A N/A N/
Plant #1 = 1 MGD $160 $58,000 $60,200 $118,00
Plant #2 = 10 MGD $140 $511,000 $522,000 $1,030,00
Plant #3 = 100 MGD N/A N/A N/A N/
Plant #1 = 1 MGD $200 $73,000 $60,200 $133,00
Plant #2 = 10 MGD $180 $657,000 $522,000 $1,180,00
Plant #3 = 100 MGD N/A N/A N/A N/
WTP Mn Goal = 0.01 mg/L
WTP Mn Goal = 0.05 mg/L
WTP Mn Goal = 0.02 mg/L
WTP Mn Goal = 0.015 mg/L
©2006 AwwaRF. All Rights Reserved.

7/21/2019 Occurrence of Manganese in Drinking Water and Manganese Control
http://slidepdf.com/reader/full/occurrence-of-manganese-in-drinking-water-and-manganese-control 461/463
435
Table G.10 Diatomaceous earth - manganese control implementation cost an
Technology: Diatomaceous Earth
Technology for Manganese Removal Only
Comments
1. Raw water manganese is assumed to be 0.5 mg/L.
2. Single pass3. No bypass
4. Vacuum or pressure system
5. Capital cost is same as direct filtration
6. Chlorine fed prior to filtration for catalytic oxidation. Applied dose 1 mg/L.
Capital Cost
Effective Interest rate = 5%
Equipment life (compounding period) = 20 years
Capital Cost
Capital Cost
Associated with
Mn Removal
Annual Capital
Recovery
Plant #1 = 1 MGD $1,000,000 $1,000,000 $80,200Plant #2 = 10 MGD $9,000,000 $9,000,000 $722,000
Plant #3 = 100 MGD N/A N/A N/A
Cost to Benefit Ratio Calculation
Operating Cost,
$/MGD
Annual
Operating Cost
Annual Capital
Recovery
Annual Tota
Cost
Plant #1 = 1 MGD $210 $77,000 $80,200 $157,00
Plant #2 = 10 MGD $180 $657,000 $722,000 $1,380,00
Plant #3 = 100 MGD N/A N/A N/A N/
Plant #1 = 1 MGD $245 $89,000 $80,200 $169,00
Plant #2 = 10 MGD $210 $767,000 $722,000 $1,490,00
Plant #3 = 100 MGD N/A N/A N/A N/
Plant #1 = 1 MGD $250 $91,000 $80,200 $171,00
Plant #2 = 10 MGD $215 $785,000 $722,000 $1,510,00
Plant #3 = 100 MGD N/A N/A N/A N/
Plant #1 = 1 MGD $260 $95,000 $80,200 $175,00
Plant #2 = 10 MGD $225 $821,000 $722,000 $1,540,00
Plant #3 = 100 MGD N/A N/A N/A N/
WTP Mn Goal = 0.01 mg/L
WTP Mn Goal = 0.05 mg/L
WTP Mn Goal = 0.02 mg/L
WTP Mn Goal = 0.015 mg/L
©2006 AwwaRF. All Rights Reserved.
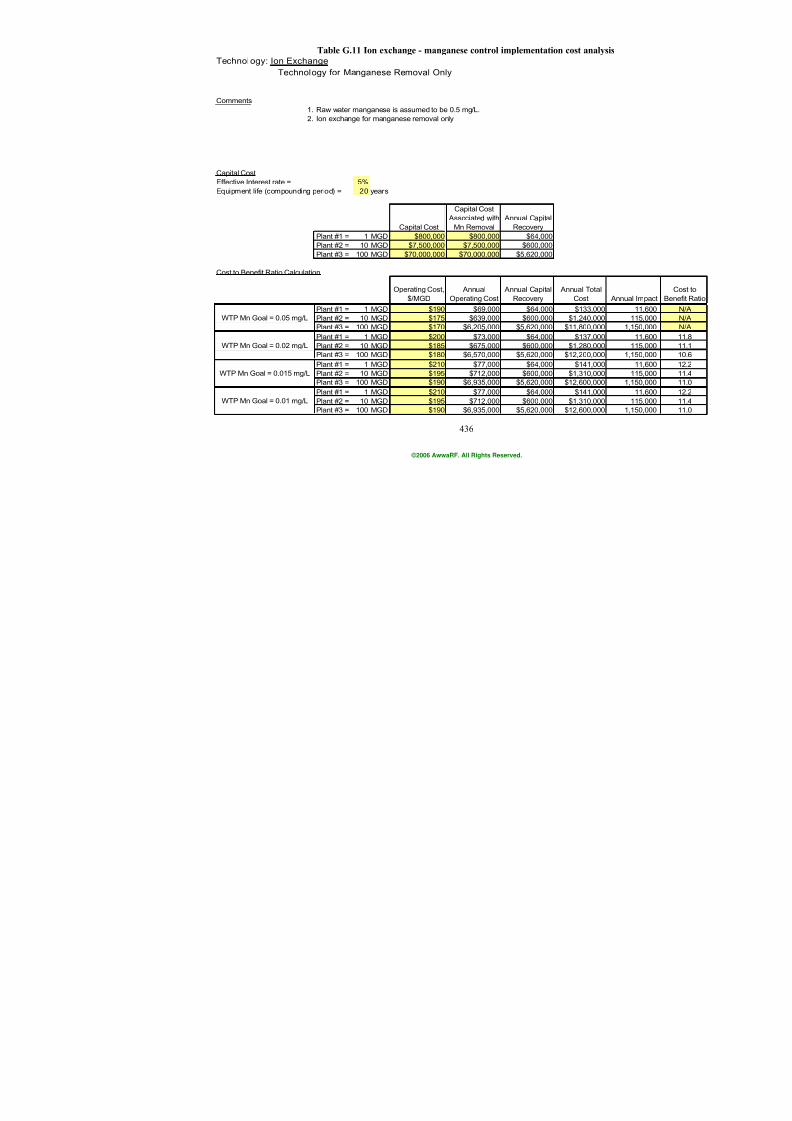
7/21/2019 Occurrence of Manganese in Drinking Water and Manganese Control
http://slidepdf.com/reader/full/occurrence-of-manganese-in-drinking-water-and-manganese-control 462/463
436
Table G.11 Ion exchange - manganese control implementation cost analyTechnology: Ion Exchange
Technology for Manganese Removal Only
Comments
1. Raw water manganese is assumed to be 0.5 mg/L.
2. Ion exchange for manganese removal only
Capital Cost
Effective Interest rate = 5%
Equipment life (compounding period) = 20 years
Capital Cost
Capital Cost
Associated with
Mn Removal
Annual Capital
Recovery
Plant #1 = 1 MGD $800,000 $800,000 $64,000Plant #2 = 10 MGD $7,500,000 $7,500,000 $600,000
Plant #3 = 100 MGD $70,000,000 $70,000,000 $5,620,000
Cost to Benefit Ratio Calculation
Operating Cost,
$/MGD
Annual
Operating Cost
Annual Capital
Recovery
Annual Total
Cost
Plant #1 = 1 MGD $190 $69,000 $64,000 $133,000
Plant #2 = 10 MGD $175 $639,000 $600,000 $1,240,000
Plant #3 = 100 MGD $170 $6,205,000 $5,620,000 $11,800,000
Plant #1 = 1 MGD $200 $73,000 $64,000 $137,000
Plant #2 = 10 MGD $185 $675,000 $600,000 $1,280,000
Plant #3 = 100 MGD $180 $6,570,000 $5,620,000 $12,200,000Plant #1 = 1 MGD $210 $77,000 $64,000 $141,000
Plant #2 = 10 MGD $195 $712,000 $600,000 $1,310,000
Plant #3 = 100 MGD $190 $6,935,000 $5,620,000 $12,600,000
Plant #1 = 1 MGD $210 $77,000 $64,000 $141,000
Plant #2 = 10 MGD $195 $712,000 $600,000 $1,310,000
Plant #3 = 100 MGD $190 $6,935,000 $5,620,000 $12,600,000
WTP Mn Goal = 0.01 mg/L
WTP Mn Goal = 0.05 mg/L
WTP Mn Goal = 0.02 mg/L
WTP Mn Goal = 0.015 mg/L
©2006 AwwaRF. All Rights Reserved.

7/21/2019 Occurrence of Manganese in Drinking Water and Manganese Control
http://slidepdf.com/reader/full/occurrence-of-manganese-in-drinking-water-and-manganese-control 463/463