occupational exposure to foreigners and attitudes towards
TRANSCRIPT

Occupational exposure to foreigners and attitudes towards equal opportunities
Marco Pecoraro
and
Didier Ruedin
POST-PRINT
This is the final draft after refereeing
Published as: Pecoraro, Marco, and Didier Ruedin. 2019. ‘Occupational Exposure to Foreigners and Attitudes towards Equal Opportunities’. Migration Studies. doi:10.1093/migration/mnz006
https://doi.org/10.1093/migration/mnz006
AbstractWe examine the relationship between attitudes to foreigners and the share of foreigners at the occupational level. Using a question on equal opportunities for foreigners from the Swiss Household Panel, ordered probit regression models show a negative association between the share of foreigners in one’s occupation and positive attitudes to foreigners: workers seem to react to competition with foreigners. When we add the occupational unemployment rate, objective pressures in the labour market appear as relevant as contact at the occupational level. Further controlling for occupational heterogeneity establishes that both factors—particularly objective pressures—are probably accounted for by sorting on job quality. We also show that the association between the occupational share of foreigners and attitudes decreases for workers with better job prospects. This implies that workers welcome foreigners to overcome labour market shortages.

Occupational Exposure to Foreigners andAttitudes towards Equal Opportunities
January 11, 2019
Abstract
We examine the relationship between attitudes to foreigners and the share of foreigners at the occupational level. Using a question on equal opportunities for foreigners from the Swiss Household Panel, ordered probit regression models show a negative association between the share of foreigners in one’s occupation and positive attitudes to foreigners: Workers seem to react to competition with foreigners. When we add the occupational unemployment rate, objective pressures in the labour market appear as relevant as contact at the occupational level. Further controlling for occupational heterogeneity establishes that both factors – particularly objective pressures – are probably accounted for by sorting on job quality. We also show that the association between the occupational share of foreigners and attitudes decreases for workers with better job prospects. This implies that workers welcome foreigners to overcome labour market shortages.
Keywords: immigration, attitudes to foreigners, labour market, occupational classification, ethnic concentration, unemployment, instrumental variables
1 Introduction
Throughout the history of mankind people have migrated (Goldin et al., 2011), but recent years have seen a concentration of immigrants in receiving countries (Czaika and Haas, 2014). Politicians and the media often portray this rapid growth of the number of immigrants in Western countries in dramatic terms (Van der Brug et al., 2015; Pecoraro and Ruedin, 2016). Some individuals have followed the growing share of immigrants with unease, and parties politicizing against immigration have received significant support across Western Europe (Ford and Goodwin, 2014; Green et al., 2016). Policies continue to exclude a significant part of the resident population from full membership in social and political life, which can lead to conflict as riots in Sweden (in 2003) and Paris (in 2005) remind us.
1

Researchers from fields as diverse as economics, sociology, political science, social psychology, and migration studies have examined the covariates of negative attitudes to immigrants and foreigners (see Rustenbach, 2010; Hainmueller and Hopkins, 2014; Hatton, 2014, for reviews). A naive economic model – also known as the canonical model (Peri, 2016) – often serves as the basis, assuming that opposition to immigrants and foreigners is a direct consequence of unwanted competition in the labour market (Ceobanu and Escandell, 2010; Polavieja, 2016; Finseraas et al., 2017). Economic studies generally find support for the labour-market competition hypothesis (Scheve and Slaughter, 2001; Mayda, 2006; Ortega and Polavieja, 2012). Other contributions seek to refine, extend, even refute this basic model with various success. For instance, some emphasize the dominant role of non-economic considerations over labour market concerns by drawing on identities, values, and beliefs (e.g., Hainmueller and Hiscox, 2007; Sides and Citrin, 2007; Lahav et al., 2013). More recently, Hainmueller et al. (2015) find no evidence for the competition hypothesis using a battery of tests devised to assess different relationships between detailed economic characteristics of U.S. workers and their attitudes to low- and high-skilled immigrants.
The mixed empirical evidence on the link between economic competition and attitudes to immigrants may stem from inadequate attention to the segmented nature of the labour market in the literature: The reduction of the labour market into low- and high-skilled workers in many studies renders these unable to draw valid inferences about actual labour force competition and its impact on attitudes to immigrants and foreigners (compare Hainmueller et al., 2015). To a large extent, these shortcomings reflect the nature of available data. Here we use linked data from the Swiss Household Panel and the Swiss Labour Force Survey to overcome shortcomings that are important for investigating how occupational exposure to foreigners relates to attitudes towards them.
Contrary to most existing studies, we use an outcome variable measuring attitudes to competition with foreign workers more directly: a measure of individual preferences for equal opportunities for foreign citizens, which is well-suited to study the labour market determinants of attitudes to immigration (Pecoraro and Ruedin, 2016). We believe our attitudinal variable improves on standard outcomes that measure the desired level of immigration, because the latter may reflect a wide range of reasons as to why natives have negative attitudes to immigrants. Moreover, we draw on the Swiss Labour Force Survey for reliable information on the labour market outcomes of migrants. Since 2003, the Swiss Labour Force Survey includes an additional sample of 15,000 immigrants per year, allowing us to calculate the occupational share of foreigners – our predictor variable – at the level of ISCO 4-digits. Using the same data, we can also compute the occupational unemployment rate as an objective measure of pressures in the current job. With this, not only can we differentiate intergroup contact at the workplace from objective pressures in the
2

labour market, but we also follow recent research highlighting the importance of unemployment as a key determinant of anti-immigration attitudes (Finseraas et al., 2016; Pardos-Prado and Xena, 2018) and racial prejudice (Johnston and Lordan, 2016).
Building on Hirsch and Macpherson (2004), we use a broad set of occupational indicators derived from both the Swiss Household Panel and the Swiss Labour Force Survey to control for quality sorting into occupations, a mechanism generally ignored in the literature on attitudes to immigrants and foreigners. Quality sorting may matter especially in cases where the occupational share of foreigners correlates with the attitudes of native citizens due to differences in skill-related job characteristics. A common interpretation provided by the quality sorting hypothesis is that a higher share of foreign workers in an occupation leads to lower earnings for all workers in this occupation. This is a result of low-skilled immigrants being sorted into occupations with low skill requirements. One aspect of quality sorting is that human capital is unequally distributed between the native population and immigrants. Another aspect is that immigrant workers sort into occupations based on comparative advantage, tending to complement native workers in terms of skills or occupations (Patel et al., 2013). This means that the apparent wage effects associated with the occupational share of foreigners primarily originate from differences in skill endowments between individuals and differences in skill requirements between occupations.
Here we show that – following standard controls – negative attitudes are associated with the occupational share of foreigners, as well as objective pressures captured through occupational unemployment. Once we control for a full set of job characteristics, it appears that especially differences in attitudes resulting from unemployment reflect a sorting of workers into occupations on the basis of skills. Considering quality sorting, contact at the occupational level still tends to induce anti-foreigner attitudes. When we allow the association between the occupational share of foreigners and attitudes to vary with the degree of job prospects, the results reveal that workers also welcome the contribution of foreigners to overcome labour shortages.
2 Attitudes to Foreigners and Labour Market
CompetitionWhen different groups meet, individuals frequently reject the other and tread carefully when dealing with members of the other group. This universal phenomenon applies to different ethnic and racial groups, social groups, as well as immigrants and foreigners (e.g. McLaren, 2003; Pasek et al., 2014). However, individuals differ in their tendency to reject the other. Various reasons have been proposed for these differences, ranging from simple conservatism to
3
personalities and indeed genetic influence (e.g. Gallego and Pardos-Prado, 2014; Hatemi et al., 2013).
Blumer (1958) shifted the focus from individual feelings to relations between groups. Today, researchers generally include this position in group threat theory: Prejudice towards other groups and inter-group hostility are primarily regarded as reactions to (perceived) threats by subordinate groups. Empirical studies often draw on a naive economic model focusing exclusively on (presumed) labour force competition, but group threat theory does not include references to specific threats and can therefore equally refer to economic threats as to cultural or symbolic threats (Bobo and Hutchings, 1996).
In the naive economic model, immigrants threaten the economic position of natives by potentially undercutting wages or ‘taking away’ the jobs of natives. Translated to attitudes, researchers expect that native workers who are more exposed to competition with immigrants have more negative attitudes: Workers have an interest to protect their wages and jobs. Economic research has generally supported this competition hypothesis, particularly that the relative skills composition of natives to immigrants in the receiving country determines the sign of correlations between education and attitudes to immigrants (e.g. Mayda, 2006; O’Rourke and Sinnott, 2006).
Studies often imply that immigrants are predominantly low-skilled and draw on levels of education to capture the degree to which workers are exposed to economic competition with immigrants (e.g. Espenshade and Hempstead, 1996; Scheve and Slaughter, 2001). Arguably, we should use skill groups and occupations as indicators of labour market exposure (Borjas, 2003; Orrenius and Zavodny, 2007). Using skill- and occupation-based measures, some studies have also provided support for the labour-market competition hypothesis: Individuals in jobs less exposed to competition with immigrants are relatively more pro-immigration (Ortega and Polavieja, 2012; Lee and Lee, 2015; Polavieja, 2016). Labour market competition at the occupation level appears as an important economic channel for the formation of immigration attitudes (Kunovich, 2013, 2017).
While initially people often reject and oppose new immigrants, studies also commonly find that contact between groups reduces tensions and opposition (Tausch and Hewstone, 2010; Allport, 1954; Ford, 2008). Attitudes to immigrants and foreigners are therefore necessarily a dynamic phenomenon (DeWaard, 2015), and matters are made more difficult for researchers because new immigrants arrive at the same time as contact with immigrants takes place. Attitudes to immigrants and foreigners seem to be affected particularly at the local level and when immigrants arrive suddenly (Hopkins, 2011; Dancygier, 2010; van Heerden and Ruedin, 2017). Here we argue that more attention should be paid to the labour market given that immigrants and natives often come into contact at the workplace (Zorlu, 2017; Laurence et al., 2018).
4

We examine how competition with immigrants affects attitudes to immigrants in the case of Switzerland. Like in other Western European countries, many immigrants have arrived in Switzerland in the past decades. With the Swiss People’s Party, the biggest party in Switzerland politicizes against immigration (Van der Brug et al., 2015). Until recently, however, few studies have examined the impact of immigrant competition on the labour-market outcomes of Swiss workers and their attitudes. Applying Borjas’ (2003) skill-cell approach in Switzerland,1 Gerfin and Kaiser (2010) find no evidence of negative long-term wage effects on native workers. Basten and Siegenthaler (2018) similarly find no detrimental impact on wages while the unemployment of Swiss workers was reduced. Exploiting the opening of the Swiss border regions to European cross-border workers in a difference-in-difference analysis, Beerli and Peri (2015) come to the same conclusion. The liberalization of labour market access led to no more than a 5 per cent increase in cross-border workers, but this had on average no significant effect for natives in the border regions. By contrast, highly educated workers experienced positive wage effects, while some less educated workers experienced positive employment effects.
Following the literature on attitudes to immigration, Müller and Tai (2010) confirmed the significantly positive relationship between education and positive attitudes to equal opportunities for foreigners. In line with the arguments of Scheve and Slaughter (2001) and Hainmueller and Hiscox (2007), they conclude that both competition and non-labour market considerations play a significant role. Pecoraro and Ruedin (2016) also support the relevance of both economic and cultural explanations. They show that highly educated workers tend to exhibit anti-foreigner attitudes with an increasing risk of unemployment, while non-economic determinants are more relevant for the low-educated.
All in all, the Swiss literature suggests that immigration barely affects natives’ wages and employment, contradicting the expectations of the naive economic model. One explanation for this is that immigrants sort into occupations based on comparative advantage: Immigrants and natives are imperfect substitutes within skill groups (Ottaviano and Peri, 2012). Put differently, immigrants and natives have a comparative advantage in different skills or occupations and will then tend to specialize in those skills (Peri and Sparber, 2009; Ortega and Polavieja, 2012). The preferences of employers may reinforce this sorting (Auer et al., 2018). Because of complementarity in skills, the wages of some native workers may decrease because of an increased supply of foreign workers, while the wages for others may increase and then compensate for the wage losses on average. Accordingly, some workers may
1 The skill-cell approach proposed by Borjas (2003) assumes a national labour market disaggregated into skill segments defined by educational attainment and experience level. Borjas presents estimation results from a reduced-form model in which the wage impact of immigration is identified using time-variation within education-experience groups. In a second step, Borjas relies on a structural approach to simulate the wage effects of immigrant influx that arrived in the U.S. between 1980 and 2000.
5

exhibit anti-immigrant attitudes because they are negatively affected in the labour market.
3 Theory and Expectations
As is common in the literature (Ceobanu and Escandell, 2010), this article draws on competitive threat theory. We regard attitudes to foreigners as a reaction to unwanted competition in the labour market where skills of foreign and native workers are substitutable (Borjas, 2001). The intuition behind competitive threat in our case is that a higher share of foreign workers potentially lowers wages in the occupation an individual works in and could increase the risk of unemployment. This constitutes an economic threat and following the theory we assume that workers express this threat as negative attitudes.
We measure labour market competition at the occupation level without reference to regional labour markets because we assume a single national labour market given the small size of Switzerland (Favre, 2011; Basten and Siegenthaler, 2018). This assumption allows us to avoid attenuation bias due to labour mobility across regions (on this argument, see e.g. Friedberg, 2001; Borjas, 2003; Ger n and Kaiser, 2010). Extensive infrastructure and public transport connect Swiss cities and regions well: Around six out of ten workers in Switzerland do not live in the same municipality where they work. This ratio has remained relatively stable during the 2000s (OFS, 2013).
Throughout the paper we use the following notation to allow a formal statement of the hypotheses. The observed outcome variable yi captures the attitudes to (equal opportunities for) foreigners of individual i. We consider the following predictor variable: Sj(i) refers to the share of foreigners in occupation j of individual i and is shared by all individuals in the same occupation. The corresponding regression coefficient is α.
We derive a first set of hypotheses from a neoclassical competitive model of supply and demand in the labour market, according to which immigration leads to lower wages for native workers whose skills are substituted by immigrants (i.e. negative wage effect). These pressures on wages translate into negative attitudes to foreigners. If attitudes to foreigners reflect competition in the labour market, we need to take into consideration the segmented nature of the labour market.Hypothesis 1
We expect that a larger share of foreigners in an occupation is associated with larger pressures on wages in this particular occupation, which in turn leads to more negative attitudes to foreigners, formally: < α 0.
Approaching competition solely in terms of the share of foreigners by occupation provides an incomplete test of the labour-market-based hypothesis. Following contact theory, we can expect that interpersonal contact between
6

groups reduces negative feelings (Allport, 1954; Amir, 1969). At the same time, empirical evidence has remained inconclusive as to whether contact is positively, negatively or simply not linked to attitudes to immigrants (Dustmann and Preston, 2001). Because competitive threat and contact likely occur concurrently, they are empirically difficult to disentangle (Wagner et al., 2006; Laurence et al., 2018). It follows that estimates of α may bias the strength of the relationship between the share of foreigners and attitudes.
To statistically differentiate contact from competition, we propose to account for the economic situation at the occupational level using the occupational unemployment rate Uj(i) (the corresponding regression coefficient is γ). This extension allows us to control for objective pressures and differentiate the effect of contact from that of competition.
Hypothesis 2
Objective pressures in the labour market are associated with negative attitudes to foreigners. Formally, < γ 0.
We take a third hypothesis from Hirsch and Schumacher (1992) and Hirsch and Macpherson (2004). Hirsch and Macpherson indicate a spurious relationship between the racial composition of jobs and individual wages due to the omission of individual and occupational skills in the analysis of wage determination. Their study provides support for a quality sorting explanation in the sense that the occupational share of Black workers correlates with worker quality and job skill differences that standard models generally do not account for, leading to omitted variable bias. Sorting means that wages vary with the share of Black workers in an occupation, but this share may not be a causal determinant of individual wages if individual human capital and occupational requirements are omitted.
The quality sorting hypothesis is a related explanation for the relationship between the share of foreigners in occupations and attitudes. If foreigners – but not Swiss workers – are crowded into low-paying occupations because of past or present discriminatory barriers (possibly linked to national Swiss immigration policy, e.g. Ruedin et al., 2015), then the share of foreigners in an occupation becomes an indicator or proxy of labour quality for Swiss workers. For instance, consider that relatively less productive Swiss workers accept lower-paying jobs in occupations predominantly held by foreigners. Using an identification strategy based on cross-variation in the share of foreigners, where the share is assumed to be uncorrelated with unobserved heterogeneity, may explain why these Swiss workers appear to have less positive attitudes. Once (unobserved) individual and occupation heterogeneity is controlled for, a substantively reduced and non-significant association between positive attitudes and the occupational share of foreigners is then consistent with the quality sorting explanation.
Hypothesis 3A
7

The correlation between the share of foreigners in an occupation and attitudes (through wages) may simply reflect differences in (unobserved) human capital endowments and job skills when there is sorting on labour quality. Formally, α ≈ 0 once job-specific factors are taken into consideration.
A high share of immigrants in an occupation may devalue or depreciate this occupation (Heizmann et al., 2017). Such occupational devaluation is likely to emerge when immigrants experience adjustment difficulties upon arrival in the host labour market and end up working in low-status occupations with poor pay. Devaluation of an occupation is then reinforced over time and affects all the workers in an occupation – native or immigrant. Under the devaluation hypothesis, a negative association between the occupational share of foreigners and wages is expected to persist even when differences in individual human capital or occupational requirements are taken into account. In this case, we can assume that workers in this occupation not only tend to be paid less but also exhibit anti-foreigner attitudes. The reverse process is also possible if an important presence of high-status foreigners in an occupation enhances the prestige of this occupation.
Hypothesis 3B
Devaluation arises only in the case where the negative impact of the occupational share of foreigners on attitudes (through wages) is above and beyond that of quality sorting. Formally, < α 0 once job-specific factors are taken into consideration. On the other hand, the composition of foreigners in an occupation could increase wages and induce positive attitudes for workers in an occupation after sorting-relevant components are accounted for. That is, > α 0.
Indeed, not all foreign workers constitute unwanted competition. But it is difficult to identify the extent of skill complementarity when looking at natives and foreigners in the same 4-digit occupation, since each occupational unit is defined by a common set of tasks and skills. Sectors of activities are more appropriate because they span groups of related occupations; here we operationalize sectors as economic activities at the 1-digit level. In economic activities where immigrant and native skills complement one another, foreign workers do not constitute competitors and there are no pressures on wages. This applies particularly to economic activities with labour shortages, in which case employers frequently recruit immigrant workers. Let Lk(i) denote an indicator of labour shortages in economic activity k and α˜ is the coefficient associated with the interaction effect between Sj(i) and Lk(i).
Hypothesis 4
We assume that the occupational share of foreigners in an economic activity with labour shortages benefits natives working in this occupation-related
8

activity, and their attitudes are expected to be more positive. Formally, we expect α˜ > 0.
4 Data and Methods
4.1 Swiss Household Panel
The analysis uses data from the Swiss Household Panel (SHP), an unbalanced panel where respondents may leave the sample due to attrition. Data collection started in 1999 with a random sample of about 5,000 households (SHP_I sample), and a refreshment sample of about 2,500 households was added in 2004 (SHP_II sample) to compensate for attrition in the initial sample. We complement the SHP data with aggregate and contextual data on permanent foreign workers from the Swiss Labour Force Survey (SLFS).2Since 2003, the Labour Force Survey includes an additional sample of 15,000 immigrants, the only Swiss survey capable of providing reliable information on the labour market outcomes of immigrants.
We retain individuals from the initial and refreshment samples (SHP_I and SHP_II) who were interviewed between 2004 and 2009 (6 waves). Since 2010, the question on attitudes to foreigners is no longer asked every wave but only every other wave. The final sample includes Swiss citizens of at least 18 years who are employed. We only include respondents with valid information for the variables retained in the empirical analysis.
4.2 Analytical Approach
Our modelling strategy builds on Dustmann and Preston (2001) who studied the relationship between attitudes to foreigners and the local (geographical) share of ethnic minorities. We modify the baseline model proposed by Dustmann and Preston to capture the share of foreigners within occupational categories:
(1)
where yi ∗ is the unobserved latent variable of positive attitudes to (equal
opportunities for) foreigners of individual i, Sj(i) the occupational composition of foreigners of the individual’s occupation j, Xi a vector of observed personal characteristics, namely levels of education, a dummy for gender, age, age squared, a dummy for being Swiss since birth, canton, sample and year dummies, as well as a constant. We provide a full description of these variables and summary statistics in Tables 7, 9 and 10 in the appendix.
2 The permanent foreign resident population is the reference population in the Swiss population statistics (STATPOP). It includes all foreign nationals who hold a residence permit for a minimum duration of 12 months or who have resided in Switzerland for 12 months.
9

All models control for individual values and beliefs because they constitute important predictors of attitudes (Ceobanu and Escandell, 2010; Facchini et al., 2013; Pecoraro and Ruedin, 2016). We include general trust in people (with ten response categories treated as dummy variables to account for nonlinearities, with ‘most people can be trusted’ as the reference category) and political left–right (with ten response categories treated as dummy variables to account for non-linearities, with ‘right’ as the reference category, plus two dummy variables for individuals who do not want/cannot place themselves, and those without any particular political position).
The share of foreign citizens by occupation, denoted by j, is computed using weighted data from the Swiss Labour Force Survey to produce nationally representative estimates. Occupations are classified by the 4-digit International Standard Classification of Occupations (ISCO-88), considering all occupations with at least 10 individuals in a year (∑j ≈ 250 occupations).3 In this framework, the classification of a job is based on the nature of the skills that are required to carry out the tasks and duties of the job – not the way these skills are acquired (Hoffmann, 2003, p. 143). Using this finely disaggregated level of occupation allows us to classify workers into specific skill segments, providing a detailed and realistic picture of labour-force exposure to foreigners. While the skill-cell idea has the flavour of Borjas’ (2003) approach of estimating the labour market impact of immigration, we avoid the problem of job downgrading according to which immigrants with foreign-acquired human capital receive lower returns than natives for given levels of education and experience (Dustmann et al., 2016). We do not define skill segments as a function of actual education and work experience (as in Borjas, 2003) but consider the 4-digit ISCO-88 code as the level of analysis, measuring the skills used in a comparable way between natives and immigrants.
To better capture labour-market competition and distinguish it from the contact channel, we propose an extended model in which we add the occupational unemployment rate (Uj(i), calculated at the 4-digit level) in equation (1):
. (1’)
We can determine the rate of unemployment by ISCO-88 occupational group j since unemployed respondents were asked to provide their last occupation. To control for occupation heterogeneity, we further add a vector of job
3 The total number of occupations based on the ISCO-88 classification in the data is 390. Restricting the analysis to occupations with at least 10 individuals in a year reduces the number of occupations to around 250, but only leads to a small percentage of excluded observations (6.5%). Setting the restriction to a number higher than 10 observations per cell-year, for instance 30, would lead to a twofold increase in the percentage of excluded observations. The main results reported are not sensitive to a change in the threshold from 10 to 30. Tables 18 and 19 in the appendix show these results when occupations with less than 30 observations are excluded.
10
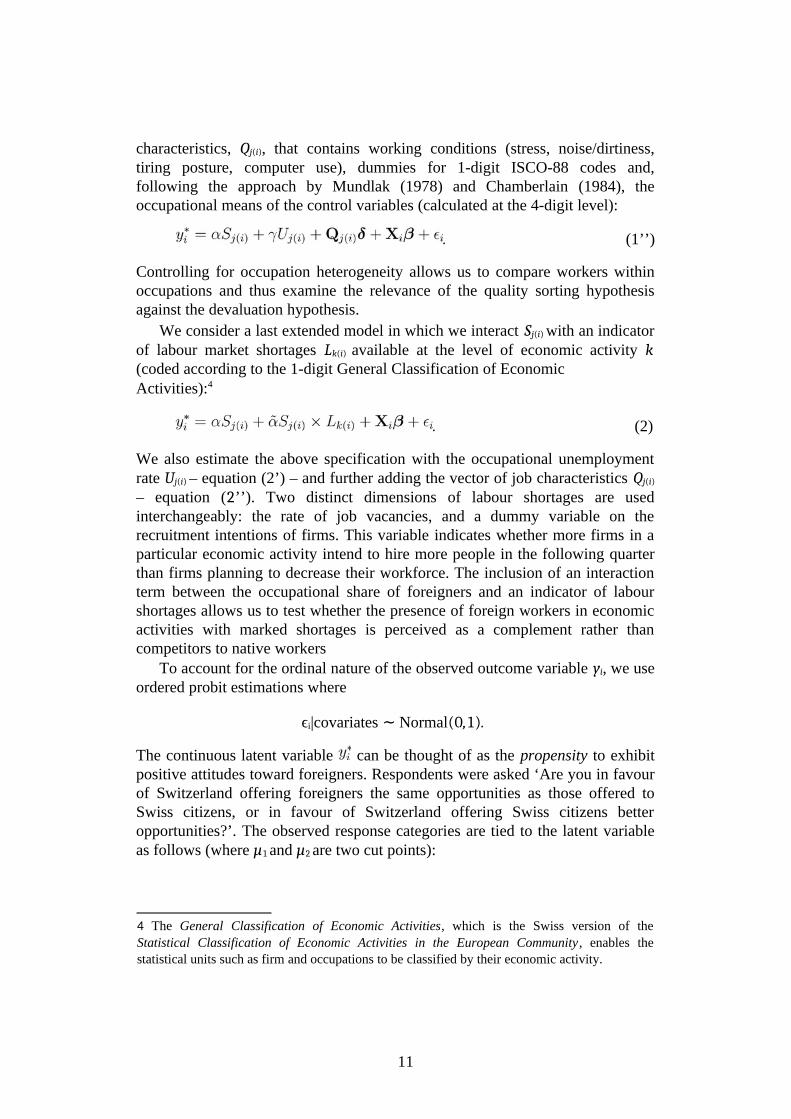
characteristics, Qj(i), that contains working conditions (stress, noise/dirtiness, tiring posture, computer use), dummies for 1-digit ISCO-88 codes and, following the approach by Mundlak (1978) and Chamberlain (1984), the occupational means of the control variables (calculated at the 4-digit level):
. (1’’)
Controlling for occupation heterogeneity allows us to compare workers within occupations and thus examine the relevance of the quality sorting hypothesis against the devaluation hypothesis.
We consider a last extended model in which we interact Sj(i) with an indicator of labour market shortages Lk(i) available at the level of economic activity k (coded according to the 1-digit General Classification of EconomicActivities):4
. (2)
We also estimate the above specification with the occupational unemployment rate Uj(i) – equation (2’) – and further adding the vector of job characteristics Qj(i)
– equation (2’’). Two distinct dimensions of labour shortages are used interchangeably: the rate of job vacancies, and a dummy variable on the recruitment intentions of firms. This variable indicates whether more firms in a particular economic activity intend to hire more people in the following quarter than firms planning to decrease their workforce. The inclusion of an interaction term between the occupational share of foreigners and an indicator of labour shortages allows us to test whether the presence of foreign workers in economic activities with marked shortages is perceived as a complement rather than competitors to native workers
To account for the ordinal nature of the observed outcome variable yi, we use ordered probit estimations where
ϵi|covariates ∼ Normal(0,1).
The continuous latent variable can be thought of as the propensity to exhibit positive attitudes toward foreigners. Respondents were asked ‘Are you in favour of Switzerland offering foreigners the same opportunities as those offered to Swiss citizens, or in favour of Switzerland offering Swiss citizens better opportunities?’. The observed response categories are tied to the latent variable as follows (where µ1 and µ2 are two cut points):
4 The General Classification of Economic Activities, which is the Swiss version of the Statistical Classification of Economic Activities in the European Community , enables the statistical units such as firm and occupations to be classified by their economic activity.
11

1 In favour of better opportunities for Swiss citizens If yi∗ ≤ µ1
yi = 2 Neither of them if µ2
3 In favour of equal opportunities for foreigners if
5 Results
5.1 Negative Attitudes with More Foreigners
Table 1 shows the ordered probit results from equation (1). Working in occupations with a higher share of foreigners (Sj) is associated with more negative attitudes to foreigners. Individuals working in an occupation with a ten percentage points higher share of foreigners have a lower probability of reporting positive attitudes to equal opportunities for foreigners (i.e. y = 3, at the right of Table 1) by at least 1.8 percentage point. The same workers have a 1.6 percentage point higher probability of reporting preference for better opportunities for Swiss workers (i.e. y = 1). This finding corresponds to labour-market competition: Swiss workers more exposed to competition with foreigners at the workplace are more likely to express negative sentiments about foreigners. In line with many existing studies, we find a positive relationship between education and positive attitudes to foreigners (coefficient not shown), but here we use education as a control variable.5
((TABLE 1 AROUND HERE))
5.2 Negative Attitudes with More Exposure to Unemployment and
More Contact with Foreigners
Table 2 presents the results from equation (1’) in which the occupational unemployment rate is included as an additional predictor variable. This allows us to differentiate objective pressures in the labour market from contact. According to these results, both contact and competition at the workplace are associated with negative attitudes to foreigners. The coefficient of the share of foreigners remains negative while the corresponding estimates of the average marginal effects are now lower in absolute terms (a reduction of about 15% compared to those in Table 1).
5 The variance inflation factor (VIF) indicates that the inclusion of individual values and beliefs in
the model is not a concern (VIF =3.25, lower than the common threshold of 5).
12

((TABLE 2 AROUND HERE))
As an exploratory check, we run a new regression in which unemployment is interacted with the proportion of foreigners. The intuition is to capture possible attitudinal effects where unemployment is high and while the share of foreigners is also high. The results of this extension are presented in the second column of Table 13 (cf. appendix), while the coefficients in the first column correspond to those in Table 2. It appears that the negative association between contact at work and pro-foreigner attitudes is reinforced with an increasing rate of unemployment – in line with labour-force competition.
5.3 Sorting on Occupational Quality Mostly Accounts for
Competition
We find support for quality sorting as an explanation for the competition channel. When we add job indicators to capture potential sorting on occupational skills, the negative association between occupational unemployment and attitudes to foreigners outlined in Table 2 is not statistically significant, with the corresponding estimates of the average marginal effects reduced to near zero (Table 3). On the other hand, the negative association between the share of foreigners in the occupation and positive attitudes remains statistically significant, although the size of the average marginal effects is slightly reduced (by about 12%). This means that the relevance of the quality sorting explanation is marginally supported when it comes to contact, suggesting that devaluation seems to play a more important role in that respect. Other factors may also be involved as we are not able to measure devaluation directly.
((TABLE 3 AROUND HERE))
When we look at the interaction between unemployment and the share of foreigners in the occupation after controlling for occupation heterogeneity (fourth column of Table 13, cf. appendix), the interaction is not significant, and we cannot reject the quality sorting hypothesis. This is in line with the coefficients in Table 3, also presented in the third column of Table 13, and
13

confirms that the differences in attitudes associated with unemployment – interacted or not with the share of foreigners – are due to differences in occupational requirements (proxied by our set of job indicators).
5.4 Causality and RobustnessWe carried out additional tests to ascertain the robustness of the reported findings. The standard ordered probit results are likely to be biased if Swiss citizens who oppose foreigners choose to work in occupations with few foreigners. As shown by Dustmann and Preston (2001) in terms of location choice, ignoring this simultaneity problem may lead to biased estimates of the attitudinal effects associated with the share of foreign citizens. Instrumental variables (IV) can account for such potential self-selection into occupations with few foreigners. Ortega and Polavieja (2012) follow the empirical strategy by Dustmann and Preston to tackle this issue when studying the labour market determinants of attitudes using a cross-country data set for Europe. More specifically, they use the regional availability of low-exposure jobs as an instrument for actual exposure in an individual’s current job. Their results show that, indeed, natives with a dislike for immigrants are more likely to move to jobs less exposed to competition from immigrants, thus biasing the OLS estimates for competition downwards. Here we adopt a variant of this approach by considering alternative instruments for the occupational share of foreigner calculated at the 4-digit level. We assume that occupational mobility is limited within a specific job; in other words, the share of foreigners at more aggregated occupation levels are considered to be beyond the control of individuals – i.e. Swiss citizens do not sort into more aggregated levels of occupation based on their attitudes to foreigners. For example, an insulation worker (ISCO 7134) can possibly move to a related job like plasterer (ISCO 7133) or painter (ISCO 7141) but is unlikely to leave the building sector (ISCO 71) altogether. At the same time, we expect the share of foreigners at more aggregated levels of occupation to predict the share of foreigners in a specific occupation and regard them as a valid instrument.
Another source of bias may come from the endogenous allocation of foreigners into particular segmented labour markets. To estimate the causal effects of immigration on the labour market outcomes of low-skilled natives, Altonji and Card (1991) have proposed an instrumental variables strategy in which the settlement pattern of previous immigrants is used as an instrument for the location choice of current immigrants. This kind of instrument has been widely adopted in the literature on the effect of immigration on wages (e.g., Dustmann et al., 2013). Studies generally find that settlement patterns of previous immigrants determine to a large degree the location choices of new immigrants. We follow this approach and use as instruments the share of foreigners in the previous year in occupations at the 3-, 2- and 1-digit level.
We apply both IV strategies to estimate the attitudinal impact of the occupational unemployment rate. Given the positive correlation between the
14

occupational share of foreigners and unemployment (r = 0.37), Swiss citizens who prefer better opportunities for themselves may choose to work in occupations with few foreigners and low rates of unemployment. Accordingly, in addition to the aforementioned instruments, we choose the occupational unemployment rate in the current year and the previous year at the 3-, 2- and 1-digit level as instruments for unemployment disaggregated at the 4-digit level.The coefficient estimates from IV ordered probit regressions in the upper and middle panels of Table 4 are qualitatively the same as those obtained based on the standard ordered probit model in Table 1 and Table 2. As we generally observe with instrumental variables, the standard errors are larger, especially when instruments are calculated from more aggregated levels of occupation. The coefficients for the occupational share of foreigners and the occupational unemployment rate, however, remain statistically significant (upper and middle panels of Table 4). Interestingly, the estimated average marginal effects on the probability of being in favour of equal opportunities for foreigners derived from IV ordered probit regressions (see Table 11 in the appendix) are higher in absolute value than those derived from standard ordered probit. This means that the standard estimates for Sj and Uj are downwardly biased because workers tend to sort into jobs with few foreigners and low rates of unemployment. This endogeneity bias is comparable to Dustmann and Preston (2001) and Ortega and Polavieja (2012).
((TABLE 4 AROUND HERE))
Once occupation-level characteristics are controlled for, the results displayed in the lower panel of Table 4 appear to differ considerably from those outlined above. Almost all the coefficient estimates associated with the occupational share of foreigners are not statistically significant. The exception is when the level of aggregation for the computation of instruments is at the 3-digit level in the current year. The corresponding estimates of the average marginal effects are also reduced in absolute value compared those estimated from standard ordered probit (see Table 11 in the appendix). This suggests that the omission of job-related characteristics may lead us to overestimate the negative impact of contact on positive attitudes when estimates are not corrected for the self-selection into jobs with few foreigners. Accounting for both quality sorting and job sorting based on attitudes to foreigners shows that the standard ordered probit estimates of α can be seen as lower bounds on the attitudinal effect of the occupational share of foreigners.
Most earlier research neglects the problem of omitted variables (an exception is Lancee and Pardos-Prado, 2013). For instance, unmeasured worker skills are likely to be correlated with the propensity to work in an occupation with an important share of foreigners. Omitting these worker attributes would lead to biased estimates not only of α but also of γ, both derived from the pooled
15

ordered probit model. This type of endogeneity can be addressed by using the panel structure of the data. As an additional robustness check we estimate a random effects (RE) ordered probit model in which we add the individual group means of time-variant control variables to filter out the correlation between the error term and the predictor variables (Greene, 2010; Mundlak, 1978). By doing so, we can control for unobserved individual heterogeneity as in a fixed effects analysis.
((TABLE 5 AROUND HERE))
The first, third and fifth columns of Table 5 display the coefficient estimates from pooled ordered probit that have been already presented in Tables 1, 2 and 3 (columns ‘POP’). The results shown in the second, fourth and sixth columns rely on the Mundlak form of the RE ordered probit model, which includes the individual means of time-variant variables (columns ‘REOP’). Applying the Mundlak approach gives support to the quality sorting hypothesis, as the estimates associated with the occupational share of foreigners and the occupational unemployment rate are not statistically significant. This is consistent with the results of the IV ordered probit with occupation-specific factors in the lower panel of Table 4.6
As a final check, we follow Hirsch and Macpherson (2004) by directly estimating the relationship between earnings and the share of foreigners within occupations. In this way we further verify the relevance of the quality sorting explanation – that is, whether the absolute value of the estimated coefficient for the occupational share of foreigners decreases as job (skill) indicators are introduced into the wage equation. Table 12 in the appendix presents the regression results where the outcome variable is the log of the yearly gross earnings (adjusted to full-time equivalent basis). Consistent with quality sorting, not only the occupational shares of foreigners but also the unemployment rate at the occupation level are not statistically significant and their estimated coefficients reduced in size once job (skill) indicators are accounted for.
The robustness checks confirm the results around labour-market competition and its link with quality sorting. First, we observe an ex ante negative relationship between positive attitudes and the occupational unemployment rate,
6 Following Greene (2010), we test the null hypothesis of the random effects model in which the means of the time-variant predictor variables do not add any explanatory power. According to the F statistic, we reject this hypothesis: The random effects model without the Mundlak correction is not consistent. When estimating a fixed effects model, sufficient variation over time in the occupational distribution of foreigners and in the unemployment rate within occupations is needed for identifying their impact on attitudes, but the annual average values of Sj and Uj are rather stable over time (see Table 10 in the appendix). While the Mundlak approach yields consistent results (relative to a random effects approach), this lack of time variation in the variables of interest may produce inefficient estimates. This cast some doubt on whether the attitudinal effects of the occupational share of foreigners and occupational unemployment could be identified with the Mundlak approach.
16

consistent with labour-market competition. Second, this relationship is accounted for by quality sorting – i.e. sorting into occupations with a high rate of unemployment is driven by differences in occupational requirements. Overall, both these statements are robust to occupational sorting of Swiss workers based on their attitudes to foreigners.
In the case of contact, we need to be more cautious about the estimation results. First, standard estimates show that contact in occupations is associated with more negative attitudes, net of the competition effect. Second, quality sorting plays a marginal role in this relationship: mostly devaluation seems to take place. Third, considering simultaneously job sorting based on occupational skills and attitudes to foreigners allows us to fully explain the relationship between contacts and attitudes. Given that both the occupational share of foreigners and occupation unemployment are treated as exogenous in standard ordered probit, these models may face omitted variable bias. In this context, the negative estimates can be understood as the lower bounds of the impact of the share occupational share of foreigners on attitudes. On the other hand, dealing with both types of sorting produces a non-significant relationship between contacts and attitudes. This means that IV estimates with occupation-specific controls can be understood as upper bounds of the attitudinal effect of contact. We also note that, controlling for occupational unemployment and occupation-level factors, the wage equation estimates of the occupational share of foreigners depart from the attitude equation estimates of the share of foreigners. This discrepancy demonstrates that the possible negative impact of contact on attitudes is driven by cultural considerations and has nothing to do with economic considerations.
5.5 More Positive Attitudes with both a Shortage of Labour and a
Higher Share of ForeignersThe negative relationship between positive attitudes and the occupational share of foreigners tends to be weaker for workers in economic activities with high levels of labour shortages. Table 6 presents the ordered probit estimates for equations (2), (2’) and (2’’), in which the occupational share of foreigners is interacted with indicators of labour shortages at the level of economic activity. Shown in the table are results where the first indicator of shortages is the rate of job vacancies, and the second indicator captures future employment prospects. We obtain substantively equivalent results with both definitions of shortages.
The results for the occupational share of foreigners in case of no vacancy (see the first row of the 1st, 3rd and 5th columns) are like those presented in Tables 1, 2 and 3: the larger the share of foreigners in an occupation, the more likely are individuals to express negative attitudes towards foreigners. The second row shows that positive attitudes towards foreigners are positively associated with the share of foreigners in economic activities with marked shortages. This suggests that favourable labour market conditions in the form of economic activities with a high demand for workers seems to offset negative attitudes due
17

to the presence of foreign workers. The same pattern is found when future employment prospects is used as alternative indicator of shortages (see estimates in the 2nd, 4th and 6th columns). The occupational share of foreigners in economic activities where the share of firms intending to lay o workers exceeds that of firms intending to hire more workers reduces positive attitudes towards foreigners. This negative association, however, is attenuated when the share of firms intending to increase employment is higher. All these results remain valid when occupation-level factors are included to control for quality sorting. This indicates that occupations belonging to economic activities with important shortages can be considered as more prestigious than others.
((TABLE 6 AROUND HERE))
In Figures 1 and 2, the average marginal effects of the share of foreigners are plotted as a function of each indicator of shortages. The most negative effects of the share of foreigners on attitudes to foreigners (i.e., yi = 3, green) are found in economic activities with a rate of vacancy equal to zero or where the share of firms intending to lay o workers is higher than that of firms Figure 1: Average marginal effects of the occupational share of foreigner by vacancy rate intending to hire more. As illustrated in Figure 1, the negative association between attitudes and the share of foreigners diminishes with an increase in the rate of vacancy and becomes statistically insignificant for high rates of vacancy. As shown in Figure 2, the average marginal effect on Pr(yi = 3) also tends to be less negative when the share of firms expecting to increase employment is higher than that of firms expecting to decrease it. While this change is statistically significant at a level of 5%, the negative effect is not cancelled out.
Figure 1: Average marginal effects of the occupational share of foreigners by vacancy rate
((FIGURE 1 HERE))
Notes: Calculation from the fifth column of Table 6 (with both unemployment and job indicators). The average marginal
effects are plotted with the 95% confidence intervals. Outcome variable y: In favour of better opportunities for Swiss
citizens (y = 1), Neither of them (y = 2), In favour of equal opportunities for foreigners (y = 3).
Figure 2: Average marginal effects of the occupational share of foreigners by future employment prospects
((FIGURE 2 HERE))
Notes: Calculation from the sixth column of Table 6 (with both unemployment and job indicators). The average marginal
effects are plotted with the 95% confidence intervals. Outcome variable y: In favour of better opportunities for Swiss
citizens (y = 1), Neither of them (y = 2), In favour of equal opportunities for foreigners (y = 3). ∆+: Share of firms within
18

an economic activity intending to increase employment in the following quarter. ∆−: Share of firms within an economic
activity intending to decrease employment in the following quarter. The expression ∆+< ∆− indicates that the share of firms
within an economic activity intending to increase employment, ∆+, is lower than the share of firms intending to decrease
employment, ∆−. This translates into lower prospects for workers.
6 Discussion and ConclusionWe have examined individual attitudes to (equal opportunities for) foreigners, focusing on the occupational share of foreigners. Contrary to most of the literature, by so doing, we took into consideration the segmented nature of the labour market to adequately capture labour market competition. We could demonstrate that reactions to immigrants in the Swiss labour market vary with the share of foreigners in one’s occupation. This is particularly the case when objective pressures are high, as demonstrated in the case where occupational unemployment is relatively higher (compare Kunovich, 2013, 2017). By contrast, when firms report shortages, attitudes to foreigners tend to be more positive. We interpreted these nuanced reactions as support for threat theories that highlight competition, but add that workers seem to appreciate foreign colleagues if they help overcome labour shortages.
Our findings support the view that intergroup contacts as well as objective pressures in the current job influence attitudes to foreigners. In both instances, competition with foreigners seems to shape attitudes, and the labour market may be a major channel for such fears and feelings of unease (Polavieja, 2016). Studies using the share of immigrants in geographical units are likely to miss these effects. It may be that geography captures a general unease with the presence of immigrants (Markaki and Longhi, 2013; Pottie-Sherman and Wilkes, 2017), while the labour market is more clearly about competition. Further research is necessary to understand how these effects of labour force competition interact with perceived cultural and symbolic threats.
The findings in this paper suggest that the level of analysis is important when examining attitudes to foreigners and immigrants – and by extension inter-group relations. Just like research has demonstrated that the composition of the population at the local level is an important factor (Hopkins, 2011; Dancygier, 2010; Markaki and Longhi, 2013), here we consider the segmented nature of labour markets into occupations. Labour force competition as an explanation for attitudes to foreigners indeed remains an important channel when the labour market is addressed in a realistic manner (see also Ortega and Polavieja, 2012; Lee and Lee, 2015; Polavieja, 2016). Rather than trying to identify a single influence to explain differences in attitudes to foreigners, immigrants, or ethnic/racial minorities, in our view future research should focus on the different paths by which attitudes can be shaped, and especially on the interaction between paths (Berg, 2015; Gravelle, 2017).
19
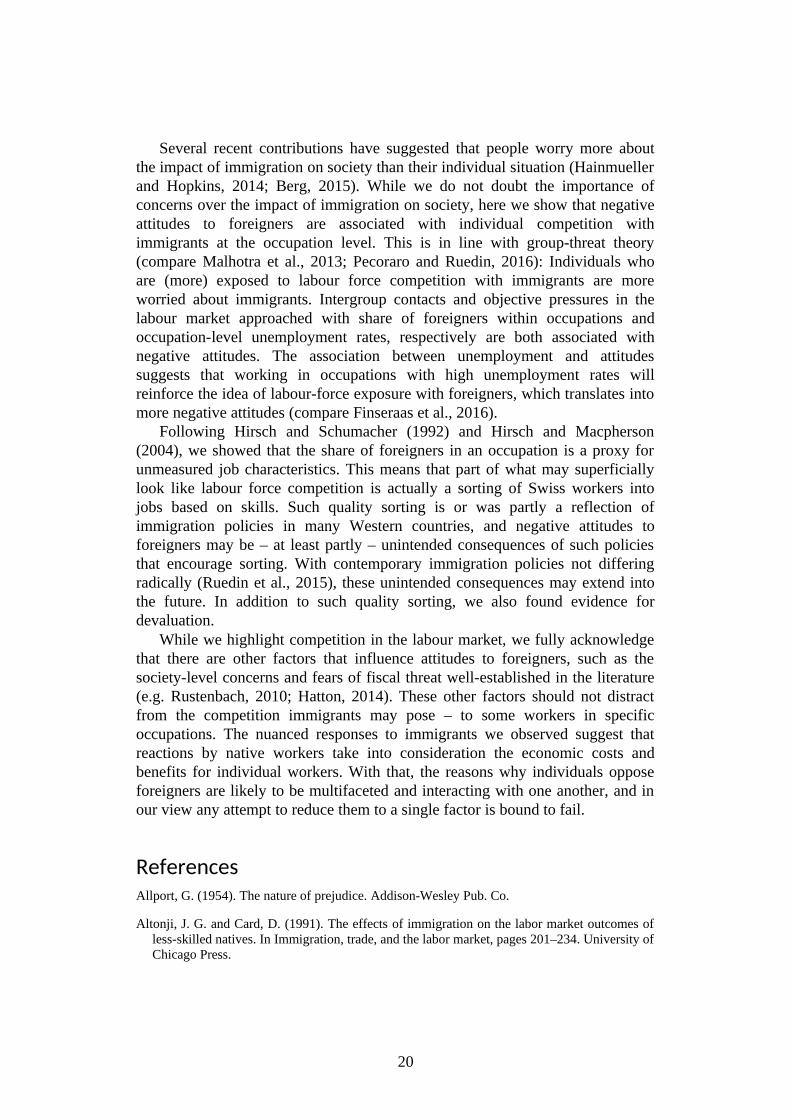
Several recent contributions have suggested that people worry more about the impact of immigration on society than their individual situation (Hainmueller and Hopkins, 2014; Berg, 2015). While we do not doubt the importance of concerns over the impact of immigration on society, here we show that negative attitudes to foreigners are associated with individual competition with immigrants at the occupation level. This is in line with group-threat theory (compare Malhotra et al., 2013; Pecoraro and Ruedin, 2016): Individuals who are (more) exposed to labour force competition with immigrants are more worried about immigrants. Intergroup contacts and objective pressures in the labour market approached with share of foreigners within occupations and occupation-level unemployment rates, respectively are both associated with negative attitudes. The association between unemployment and attitudes suggests that working in occupations with high unemployment rates will reinforce the idea of labour-force exposure with foreigners, which translates into more negative attitudes (compare Finseraas et al., 2016).
Following Hirsch and Schumacher (1992) and Hirsch and Macpherson (2004), we showed that the share of foreigners in an occupation is a proxy for unmeasured job characteristics. This means that part of what may superficially look like labour force competition is actually a sorting of Swiss workers into jobs based on skills. Such quality sorting is or was partly a reflection of immigration policies in many Western countries, and negative attitudes to foreigners may be – at least partly – unintended consequences of such policies that encourage sorting. With contemporary immigration policies not differing radically (Ruedin et al., 2015), these unintended consequences may extend into the future. In addition to such quality sorting, we also found evidence for devaluation.
While we highlight competition in the labour market, we fully acknowledge that there are other factors that influence attitudes to foreigners, such as the society-level concerns and fears of fiscal threat well-established in the literature (e.g. Rustenbach, 2010; Hatton, 2014). These other factors should not distract from the competition immigrants may pose – to some workers in specific occupations. The nuanced responses to immigrants we observed suggest that reactions by native workers take into consideration the economic costs and benefits for individual workers. With that, the reasons why individuals oppose foreigners are likely to be multifaceted and interacting with one another, and in our view any attempt to reduce them to a single factor is bound to fail.
ReferencesAllport, G. (1954). The nature of prejudice. Addison-Wesley Pub. Co.
Altonji, J. G. and Card, D. (1991). The effects of immigration on the labor market outcomes of less-skilled natives. In Immigration, trade, and the labor market, pages 201–234. University of Chicago Press.
20

Amir, Y. (1969). Contact hypothesis in ethnic relations. Psychological bulletin, 71(5):319.
Auer, D., Bonoli, G., Fossati, F., and Liechti, F. (2018). The Matching Hierarchies Model: Evidence from a Survey Experiment on Employers’ Hiring Intent Regarding Immigrant Applicants. International Migration Review, https://doi.org/10.1177/0197918318764872.
Basten, C. and Siegenthaler, M. (2018). Do Immigrants Take or Create Residents’ Jobs? Evidence from Free Movement of Workers in Switzerland. The Scandinavian Journal of Economics, Accepted Author Manuscript. doi:10.1111/sjoe.12293.
Beerli, A. and Peri, G. (2015). The labor market effects of opening the border: New evidence from Switzerland. Working Paper 21319, National Bureau of Economic Research.
Berg, J. A. (2015). Explaining Attitudes toward Immigrants and Immigration Policy: A Review of the Theoretical Literature. Sociology Compass, 9(1):23–34.
Blumer, H. (1958). Race prejudice as a sense of group position. The Pacific Sociological Review, 1(1):3–7.
Bobo, L. and Hutchings, V. L. (1996). Perceptions of racial group competition: Extending Blumer’s theory of group position to a multiracial social context. American Sociological Review, 61(6):951–972.
Borjas, G. J. (2001). Heaven’s door: Immigration policy and the American economy. Princeton University Press.
Borjas, G. J. (2003). The labor demand curve is downward sloping: Reexamining the impact of immigration on the labor market. The quarterly journal of economics, 118(4):1335–1374.
Ceobanu, A. M. and Escandell, X. (2010). Comparative analyses of public attitudes toward immigrants and immigration using multinational survey data: A review of theories and research. Annual Review of Sociology, 36(1):309–328.
Chamberlain, G. (1984). Panel data. In Griliches, Z. and Intriligator, M. D., editors, Handbook of Econometrics, volume 2, chapter 22, pages 1247–1318. Elsevier.
Czaika, M. and Haas, H. (2014). The globalization of migration: Has the world become more migratory? International Migration Review, 48(2):283–323.
Dancygier, R. (2010). Immigration and Conflict in Europe. Cambridge University Press, Cambridge.
DeWaard, J. (2015). Beyond group-threat: Temporal dynamics of international migration and linkages to anti-foreigner sentiment. Journal of Ethnic and Migration Studies, 41(7):1041–1067.
Dustmann, C., Frattini, T., and Preston, I. P. (2013). The effect of immigration along the distribution of wages. The Review of Economic Studies, 80(1):145–173.
Dustmann, C. and Preston, I. (2001). Attitudes to ethnic minorities, ethnic context and location decisions. Economic Journal, 111(470):353–73.
Dustmann, C., Schönberg, U., and Stuhler, J. (2016). The impact of immigration: Why do studies reach such different results? The Journal of Economic Perspectives, 30(4):31–56.
21

Espenshade, T. J. and Hempstead, K. (1996). Contemporary American Attitudes Toward U.S. Immigration. International Migration Review, 30(2):535–570.
Facchini, G., Mayda, A. M., and Puglisi, R. (2013). Individual attitudes towards immigration: Economic vs. non-economic determinants. In Freeman, G. P., Hansen, R., and Leal, D. L., editors, Immigration and Public Opinion in Liberal Democracies, chapter 5, pages 129–157. Routledge.
Favre, S. (2011). The impact of immigration on the wage distribution in Switzerland. ECON - Working Papers 22, Department of Economics University of Zurich.
Finseraas, H., Pedersen, A. W., and Bay, A.-H. (2016). When the going gets tough: The differential impact of national unemployment on the perceived threats of immigration. Political Studies, 64(1):60–73.
Finseraas, H., Røed, M., and Schøne, P. (2017). Labor market competition with immigrants and political polarization. Quarterly Journal of Political Science, 12(3):347-373.
Ford, R. (2008). Is racial prejudice declining in Britain? British Journal of Sociology, 59(4):609–36.
Ford, R. and Goodwin, M. J. (2014). Revolt on the Right: Explaining Support for the Radical Right in Britain. Routledge, Abingdon.
Friedberg, R. M. (2001). The impact of mass migration on the Israeli labor market. The Quarterly Journal of Economics, 116(4):1373–1408.
Gallego, A. and Pardos-Prado, S. (2014). The big five personality traits and attitudes towards immigrants. Journal of Ethnic and Migration Studies, 40(1):79–99.
Gerfin, M. and Kaiser, B. (2010). The effects of immigration on wages: An application of the structural skill-cell approach. Swiss Journal of Economics and Statistics, 146(4):709–739.
Goldin, I., Cameron, G., and Balarajan, M. (2011). Exceptional People: How Migration Shaped Our World and Will De ne Our Future. Princeton University Press, Oxford.
Gravelle, T. B. (2017). Partisanship, local context, group threat, and Canadian attitudes towards immigration and refugee policy. Migration Studies, 6(3):448-467.
Green, E. G., Sarrasin, O., Baur, R., and Fasel, N. (2016). From stigmatized immigrants to radical right voting: A multilevel study on the role of threat and contact. Political Psychology, 37(4):465–480.
Greene, W. H. (2010). Econometric Analysis. Prentice Hall, Upper Saddle River, NJ, 7th ed. edition.
Hainmueller, J. and Hiscox, M. J. (2007). Educated preferences: Explaining attitudes toward immigration in Europe. International Organization, 61(02):399–442.
Hainmueller, J., Hiscox, M. J., and Margalit, Y. (2015). Do concerns about labor market competition shape attitudes toward immigration? New evidence. Journal of International Economics, 97(1):193–207.
Hainmueller, J. and Hopkins, D. J. (2014). Public attitudes toward immigration. Annual Review of Political Science, 17:225–249.
22

Hatemi, P., McDermott, R., Eaves, L., Kendler, K., and Neale, M. (2013). Fear as a disposition and an emotional state: A genetic and environmental approach to out-group political preferences. American Journal of Political Science, 57(2):279–93.
Hatton, T. J. (2014). The economics of international migration: A short history of the debate. Labour Economics, 30:43–50.
Heizmann, B., Busch-Heizmann, A., and Holst, E. (2017). Immigrant Occupational Composition and the Earnings of Immigrants and Natives in Germany: Sorting or Devaluation? International Migration Review, 51(2):475–505.
Hirsch, B. T. and Macpherson, D. A. (2004). Wages, sorting on skill, and the racial composition of jobs. Journal of Labor Economics, 22(1):189–210.
Hirsch, B. T. and Schumacher, E. J. (1992). Labor earnings, discrimination, and the racial composition of jobs. The Journal of Human Resources, 27(4):602–628.
Hoffmann, E. (2003). International statistical comparisons of occupational and social structures. In Hoffmeyer-Zlotnik, J. H. and Wolf, C., editors, Advances in cross-national comparison: A European working book for demographic and socio-economic variables, chapter 8, pages 137–158. Springer Science & Business Media.
Hopkins, D. J. (2011). National debates, local responses: The origins of local concern about immigration in Britain and the United States. British Journal of Political Science, 41(03):499–524.
Johnston, D. W. and Lordan, G. (2016). Racial prejudice and labour market penalties during economic downturns. European Economic Review, 84:57–75.
Kunovich, R. M. (2013). Labor market competition and anti-immigrant sentiment: Occupations as contexts. International Migration Review, 47(3):643–685.
Kunovich, R. M. (2017). Labour market competition and immigration attitudes in an established gateway. Ethnic and Racial Studies, 40(11):1961–1980.
Lahav, G., Messina, A. M., and Vasquez, J. P. (2013). Were political elite attitudes toward immigration securitized after 11 September? survey evidence from the European parliament. Migration Studies, 2(2):212–234.
Lancee, B. and Pardos-Prado, S. (2013). Group conflict theory in a longitudinal perspective: Analyzing the dynamic side of ethnic competition. International Migration Review, 47(1):106–131.
Laurence, J., Schmid, K., and Hewstone, M. (2018). Ethnic Diversity, Intergroup Attitudes and Countervailing Pathways of Positive and Negative Inter-group Contact: An Analysis Across Workplaces and Neighbourhoods. Social Indicators Research, 136(2):719–749.
Lee, N. and Lee, C.-S. (2015). Relational skill assets and anti-immigrant sentiments. Social science research, 52:270–289.
Malhotra, N., Margalit, Y., and Mo, C. (2013). Economic explanations for opposition to immigration: Distinguishing between prevalence and conditional impact. American Journal of Political Science, 57(2):391–410.
Markaki, Y. and Longhi, S. (2013). What determines attitudes to immigration in European countries? an analysis at the regional level. Migration Studies, 1(3):311–337.
23

Mayda, A. M. (2006). Who is against immigration? A cross-country investigation of individual attitudes toward immigrants. The Review of Economics and Statistics, 88(3):510–530.
McLaren, L. (2003). Anti-immigrant prejudice in Europe: Contact, threat perception and preferences for the exclusion of migrants. Social Forces, 81(3):909–37.
Müller, T. and Tai, S. H. (2010). Who opposes immigrants’ integration into the labor market? the Swiss case. Swiss Journal of Economics and Statistics, 146(4):741–767.
Mundlak, Y. (1978). On the Pooling of Time Series and Cross Section Data. Econometrica, 46(1):69–85.
OFS (2013). La pendularité en Suisse 2011. Actualités OFS, 11 Mobilité et transports, Neuchâtel.
O’Rourke, K. H. and Sinnott, R. (2006). The determinants of individual attitudes towards immigration. European Journal of Political Economy, 22(4):838–861.
Orrenius, P. M. and Zavodny, M. (2007). Does immigration affect wages? A look at occupation-level evidence. Labour Economics, 14(5):757–773.
Ortega, F. and Polavieja, J. G. (2012). Labor-market exposure as a determinant of attitudes toward immigration. Labour Economics, 19(3):298–311.
Ottaviano, G. I. and Peri, G. (2012). Rethinking the effect of immigration on wages. Journal of the European economic association, 10(1):152–197.
Pardos-Prado, S. and Xena, C. (2018). Skill specificity and attitudes towards immigration. American Journal of Political Science, doi:10.1111/ajps.12406.
Pasek, J., Stark, T. H., Krosnick, J. A., Tompson, T., and Payne, B. K. (2014). Attitudes toward blacks in the Obama era changing distributions and impacts on job approval and electoral choice, 2008 2012. Public Opinion Quarterly, 78(S1):276–302.
Patel, K., Savchenko, Y., and Vella, F. (2013). Occupational sorting of ethnic groups. In International Handbook on the Economics of Migration, chapter 12, pages 227–241. Edward Elgar Publishing.
Pecoraro, M. and Ruedin, D. (2016). A foreigner who does not steal my job: The role of unemployment risk and values in attitudes toward equal opportunities. International Migration Review, 50(3):628–666.
Peri, G. (2016). Immigrants, productivity, and labour markets. Journal of Economic Perspectives, 30(4):3–30.
Peri, G. and Sparber, C. (2009). Task Specialization, Immigration, and Wages. American Economic Journal: Applied Economics, 1(3):135–169.
Polavieja, J. G. (2016). Labour-market competition, recession and anti-immigrant sentiments in Europe: Occupational and environmental drivers of competitive threat. Socio-Economic Review, 14(3):395–417.
Pottie-Sherman, Y. and Wilkes, R. (2017). Does Size Really Matter? On the Relationship between Immigrant Group Size and Anti-Immigrant Prejudice. International Migration Review, 51(1):218–250.
24

Ruedin, D., Alberti, C., and D’Amato, G. (2015). Immigration and integration policy in Switzerland, 1848 to 2014. Swiss Political Science Review, 21(1):5–22.
Rustenbach, E. (2010). Sources of negative attitudes toward immigrants in Europe: A multi-level analysis. International Migration Review, 44(1):53–77.
Scheve, K. F. and Slaughter, M. J. (2001). Labor market competition and individual preferences over immigration policy. The Review of Economics and Statistics, 83(1):133–145.
Sides, J. and Citrin, J. (2007). European opinion about immigration: The role of identities, interests and information. British Journal of Political Science, 37(3):477.
Tausch, N. and Hewstone, M. (2010). Intergroup contact. In Dovidio, J., Hewstone, M., Glick, P., and Esses, V., editors, The SAGE Handbook of Prejudice, Stereotyping and Discrimination. Sage, Thousand Oaks.
Van der Brug, W., D’Amato, G., Berkhout, J., and Ruedin, D., editors (2015). The Politicisation of Migration. Routledge, Abingdon.
van Heerden, S. and Ruedin, D. (2017). How attitudes towards immigrants are shaped by residential context: the role of neighbourhood dynamics, immigrant visibility, and areal attachment. Urban Studies. https://doi.org/10.1177/0042098017732692.
Wagner, U., Christ, O., Pettigrew, T. F., Stellmacher, J., and Wolf, C. (2006). Prejudice and minority proportion: Contact instead of threat effects. Social Psychology Quarterly, 69(4):380–390.
Zorlu, A. (2017). Attitudes toward asylum seekers in small local communities.International Migration, 55(6):14–36.
7 Appendix
((TABLES 7 TO 19 AROUND HERE))
25

Table 1: Baseline model: Ordered probit resultsCoefficients Average Marginal Effects
y=1 y=2 y=3
Sj: Share of foreigners -0.552**(0.103)
0.162**(0.030)
0.014**(0.003)
-0.176**(0.032)
Control variables yes
Canton, sample and year dummies
yes
Proxies for values and beliefs
yes
Uj: Occ. unemployment rate noQj: Job (skill) indicators no
Observations 22,241Percentage correctly predicted
69.04%
Test for joint significance of values and beliefs
>F statistic 2487.17**
Source: Swiss Household Panel 2004-2009, data are unweighted.Notes: Robust standard errors in parentheses (clustered by occupation and year), ** p<0.05, * p<0.10. Outcome variable y: positive attitudes to equal opportunities for foreigners. Proxies for values and beliefs are general trust in people and political position left-right. We also tested a specification with local labour market dummies based on approximately 100 Swiss commuting zones (MS regions, MS standing for spatial mobility) instead of (or along with) canton dummies, leading to substantively equivalent results (see upper and middle panels of Table 14 in the appendix). We also tested another specification including the number of cross-border migrants by canton (based on the data from the Cross-border Commuters Statistics) as an additional explanatory variable: the cantonal number of cross-border migrants is not statistically significant, while the main estimates are not affected (see lower panel of Table 14 in the appendix).
1

Table 2: Adding occupational unemployment rate: Ordered probit resultsCoefficients Average Marginal Effects
y=1 y=2 y=3
Sj: Share of foreigners -0.465**(0.102)
0.136**(0.030)
0.012**(0.003)
-0.148**(0.032)
Uj: Occ. unemployment rate
-1.094**(0.431)
0.320**(0.126)
0.028**(0.011)
-0.348**(0.137)
Control variables yesCanton, sample and year dummies
yes
Proxies for values and beliefs
yes
Qj: Job (skill) indicators noObservations 22,241Percentage correctly predicted
69.01%
Test for joint significance of values and beliefs>F statistic 2487.96**
Source: Swiss Household Panel 2004-2009, data are unweighted.Notes: Robust standard errors in parentheses (clustered by occupation and year), ** p<0.05, * p<0.10. Outcome variable y: positive attitudes to equal opportunities for foreigners. The occupational unemployment rate is calculated at the 4-digit ISCO level. Proxies for values and beliefs are general trust in people and political position left-right. We also tested a specification with local labour market dummies based on approximately 100 Swiss commuting zones (MS regions, MS standing for spatial mobility) instead of (or along with) canton dummies, leading to substantively equivalent results (see upper and middle panels of Table 15 in the appendix). We also tested another specification including the number of cross-border migrants by canton (based on the data from the Cross-border Commuters Statistics) as an additional explanatory variable: the cantonal number of cross-border migrants is not statistically significant, while the main estimates are not affected (see lower panel of Table 15 in the appendix).
2
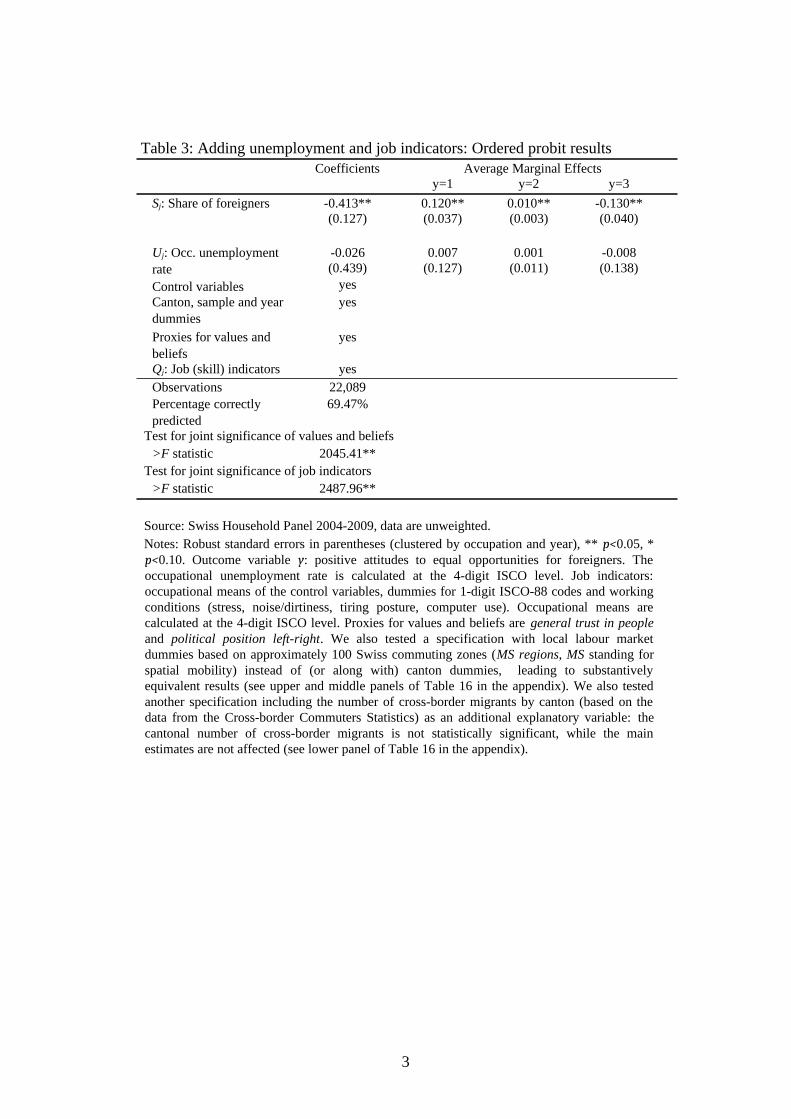
Table 3: Adding unemployment and job indicators: Ordered probit resultsCoefficients Average Marginal Effects
y=1 y=2 y=3
Sj: Share of foreigners -0.413**(0.127)
0.120**(0.037)
0.010**(0.003)
-0.130**(0.040)
Uj: Occ. unemployment rate
-0.026(0.439)
0.007(0.127)
0.001(0.011)
-0.008(0.138)
Control variables yesCanton, sample and year dummies
yes
Proxies for values and beliefs
yes
Qj: Job (skill) indicators yesObservations 22,089Percentage correctly predicted
69.47%
Test for joint significance of values and beliefs>F statistic 2045.41**
Test for joint significance of job indicators>F statistic 2487.96**
Source: Swiss Household Panel 2004-2009, data are unweighted.Notes: Robust standard errors in parentheses (clustered by occupation and year), ** p<0.05, * p<0.10. Outcome variable y: positive attitudes to equal opportunities for foreigners. The occupational unemployment rate is calculated at the 4-digit ISCO level. Job indicators: occupational means of the control variables, dummies for 1-digit ISCO-88 codes and working conditions (stress, noise/dirtiness, tiring posture, computer use). Occupational means are calculated at the 4-digit ISCO level. Proxies for values and beliefs are general trust in people and political position left-right. We also tested a specification with local labour market dummies based on approximately 100 Swiss commuting zones (MS regions, MS standing for spatial mobility) instead of (or along with) canton dummies, leading to substantively equivalent results (see upper and middle panels of Table 16 in the appendix). We also tested another specification including the number of cross-border migrants by canton (based on the data from the Cross-border Commuters Statistics) as an additional explanatory variable: the cantonal number of cross-border migrants is not statistically significant, while the main estimates are not affected (see lower panel of Table 16 in the appendix).
3
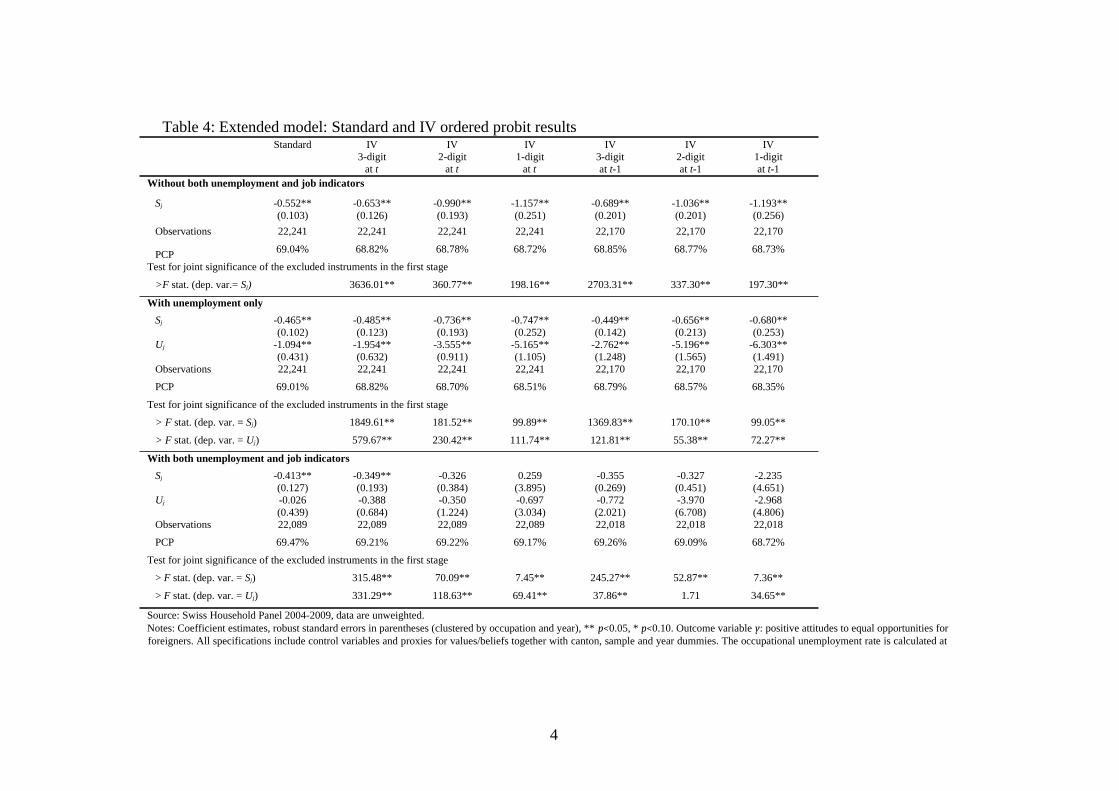
Table 4: Extended model: Standard and IV ordered probit resultsStandard IV
3-digitat t
IV2-digit
at t
IV1-digit
at t
IV3-digitat t-1
IV2-digitat t-1
IV1-digitat t-1
Without both unemployment and job indicators
Sj -0.552**(0.103)
-0.653**(0.126)
-0.990**(0.193)
-1.157**(0.251)
-0.689**(0.201)
-1.036**(0.201)
-1.193**(0.256)
Observations 22,241 22,241 22,241 22,241 22,170 22,170 22,170
PCP 69.04% 68.82% 68.78% 68.72% 68.85% 68.77% 68.73%
Test for joint significance of the excluded instruments in the first stage
>F stat. (dep. var.= Sj) 3636.01** 360.77** 198.16** 2703.31** 337.30** 197.30**
With unemployment only
Sj -0.465**(0.102)
-0.485**(0.123)
-0.736**(0.193)
-0.747**(0.252)
-0.449**(0.142)
-0.656**(0.213)
-0.680**(0.253)
Uj -1.094**(0.431)
-1.954**(0.632)
-3.555**(0.911)
-5.165**(1.105)
-2.762**(1.248)
-5.196**(1.565)
-6.303**(1.491)
Observations 22,241 22,241 22,241 22,241 22,170 22,170 22,170
PCP 69.01% 68.82% 68.70% 68.51% 68.79% 68.57% 68.35%
Test for joint significance of the excluded instruments in the first stage
> F stat. (dep. var. = Sj) 1849.61** 181.52** 99.89** 1369.83** 170.10** 99.05**
> F stat. (dep. var. = Uj) 579.67** 230.42** 111.74** 121.81** 55.38** 72.27**
With both unemployment and job indicators
Sj -0.413**(0.127)
-0.349**(0.193)
-0.326(0.384)
0.259(3.895)
-0.355(0.269)
-0.327(0.451)
-2.235(4.651)
Uj -0.026(0.439)
-0.388(0.684)
-0.350(1.224)
-0.697(3.034)
-0.772(2.021)
-3.970(6.708)
-2.968(4.806)
Observations 22,089 22,089 22,089 22,089 22,018 22,018 22,018
PCP 69.47% 69.21% 69.22% 69.17% 69.26% 69.09% 68.72%
Test for joint significance of the excluded instruments in the first stage
> F stat. (dep. var. = Sj) 315.48** 70.09** 7.45** 245.27** 52.87** 7.36**
> F stat. (dep. var. = Uj) 331.29** 118.63** 69.41** 37.86** 1.71 34.65**
Source: Swiss Household Panel 2004-2009, data are unweighted.Notes: Coefficient estimates, robust standard errors in parentheses (clustered by occupation and year), ** p<0.05, * p<0.10. Outcome variable y: positive attitudes to equal opportunities for foreigners. All specifications include control variables and proxies for values/beliefs together with canton, sample and year dummies. The occupational unemployment rate is calculated at
4

the 4-digit ISCO level. Job indicators: occupational means, working conditions and 1-digit ISCO-88 codes. Occupational means are calculated at the 4-digit ISCO level. Instruments: share of foreigners / occupational unemployment rate in the current year (t) in more aggregated levels of occupation (at the 3-, 2- or 1-digit level) and share of foreigners /occupational unemployment rate in the previous year (t − 1) in occupations at the 3-, 2- or 1-digit level. The null hypothesis of weak instruments is almost always rejected using the F test on excluded instruments. The estimated average marginal effects on the probability of being in favour of equal opportunities for foreigners, Pr(y = 3), are presented in Table 11 in the appendix. PCP: Percentage correctly predicted.
5

Table 5: Pooled ordered probit and Correlated RE ordered probitMain model With unemployment
onlyWith unemployment and job indicators
POP Mundlak REOP
POP Mundlak REOP
POP Mundlak REOP
Sj: Share of early foreigners -0.552** 0.262 -0.465** 0.212 -0.413** 0.061(0.103) (0.280) (0.102) (0.286) (0.127) (0.335)
Uj: Occ. unemployment rate -1.094** 0.879 -0.026 0.925
(0.431) (0.758) (0.439) (0.778)
Qj: Job (skill) indicators no no no no yes yes
Number of i 7,002 7,002 7,002 7,002 6,985 6,985Observations 22,241 22,241 22,241 22,241 22,089 22,089Percentage correctly predicted 69.04% 69.56% 69.01% 69.60% 69.47% 70.00%Test for joint significance of the means of the time-variant predictor variables
> F statistic 715.45** 716.47** 677.95**Source: Swiss Household Panel 2004-2009, data are unweighted.Notes: Coefficient estimates, robust standard errors in parentheses (clustered by individual), ** p<0.05. Outcome variable: positive attitudes to equal opportunities for foreigners. All specifications include control variables, controls for values and beliefs, canton, sample and year dummies. The occupational unemployment rate is calculated at the 4-digit ISCO level. Job indicators: occupational means, working conditions and 1-digit ISCO-88 codes. Occupational means are calculated at the 4-digit ISCO level. POP: Pooled Ordered Probit. Mundlak REOP: Random Effects Ordered Probit with the Mundlak correction.
6

Table 6: Interacting Sj and indicators of shortages: Ordered probit resultsMain model With unemployment
onlyWith unemployment and job indicators
Sj: Share of foreigners -0.953** -1.067** -0.851** -0.932** -0.787** -0.850**
(0.110) (0.118) (0.110) (0.126) (0.141) (0.159)Sj× Rate of job vacancies 65.213** 76.474** 66.983**
(18.954) (19.477) (20.348)Sj × 1[∆+> ∆−] 0.378** 0.329** 0.283*
*(0.110) (0.112) (0.108)
Uj: Occ. unemployment rate -1.797** -1.348** -0.315 0.038(0.447) (0.456) (0.488) (0.491)
Qj: Job (skill) indicators no no no no yes yes
Observations 18,877 18,877 18,877 18,877 18,759 18,759Percentage correctly predicted 69.91% 69.80% 69.91% 69.93% 70.18% 70.13
%Test for joint significance of values and beliefs
> F statistic 2173.74** 2161.72** 2166.12** 2160.45** 1831.84**1829.30**
Test for joint significance of job indicators > F statistic 242.68**
249.34**
Source: Swiss Household Panel 2004-2009, data are unweighted.Notes: Coefficient estimates, robust standard errors in parentheses (clustered by occupation and year), ** p<0.05. Outcome variable: positive attitudes to equal opportunities for foreigners. All specifications include control variables, controls for values and beliefs, canton, sample and year dummies. The occupational unemployment rate is calculated at the 4-digit ISCO level. Job indicators: occupational means, working conditions and 1digit ISCO-88 codes. Occupational means are calculated at the 4-digit ISCO level. The rate of job vacancies by economic activity (1-digit level) is equal to the ratio between the number of job vacancies and the sum of the number of occupied posts and the number of job vacancies. 1[∆+> ∆−] is a dummy indicator of future employment prospects equal to 1 if the share of firms within an economic activity intending to increase employment, ∆+, is higher than the share of firms intending to decrease employment, ∆−. The number of job vacancies is taken from the Labour Market Data Analysis (LAMDA) provided by the State Secretariat for Economic A airs (SECO). The number of occupied posts is taken from the Job Statistics provided by the Swiss Federal Statistical Office (SFSO). The shares of firms within an economic activity are taken from the Job Statistics provided by the Swiss Federal Statistical Office (SFSO). It should be noted that there is no available indicator of labour shortages for the following 1-digit economic activities: (1) Agriculture, hunting, forestry; (2) Fishing and fish farming; (3) Private households with employed persons; (4) Extra-territorial organizations and bodies. We also tested a specification with local labour market dummies based on approximately 100 Swiss commuting zones (MS regions, MS standing for spatial mobility) instead of (or along with) canton dummies, leading to substantively equivalent results (see upper and middle panels of Table 17 in the appendix). We also tested another specification including the number of cross-border migrants by canton (based on the data from the Cross-border Commuters Statistics) as an additional explanatory variable: the cantonal number of cross-border migrants is not statistically significant, while the main estimates are not affected (see lower panel of Table 17 in the appendix).
7

Table 7: Predictor variables included in the empirical analysisContinuous variables Dummy variables Ref.
Baseline and extended models
Age in years Levels of education
(at the time of the interview) Compulsory
Age squared Upper secondaryTertiary
×
Share of foreign citizens Gender
by level of occupation (Sj) MaleFemale
×
Swiss since birthYes No ×Canton of residence1 (AG Argovia)...26 (ZH Zurich)
×
SampleSHP_ISHP_II
×
Year2004...2009
×
Adding occupational unemploymentUnemployment rate by level of occupation
Adding job indicators
Share of women Working conditions: stress
by level of occupation yes no ×
Average age Working conditions: noise/dirtiness
by level of occupation yes no ×
Average age squared Working conditions: tiring posture
by level of occupation yes no ×
Share of compulsory-educated Working conditions: computer use
by level of occupation yes no ×
Share of tertiary-educated 1-digit ISCO-88 code
by level of occupation 1 (Legislators, senior officials, managers)...9 (Elementary occupations)
×
Adding indicators of labour market shortages
Vacancy rate by economic Increasing vs. decreasing employment
8

activity at the 1-digit level Higher share of firms intending to decrease Higher share of firms intending to increase
×
Notes: Control variables only include gender, education, age and its square. Levels of education are defined in Table 8. Occupation is disaggregated at the 4-digit level.
9

Table 8: Definition for levels of educationDescription Values for the
education variableCompulsory educationIncomplete compulsory school 0Compulsory school, elementary vocational training 1Domestic science course, 1-year school of commerce 2Upper secondary educationGeneral training school 3Apprenticeship 4Full-time vocational school 5Maturity (high school) 6Tertiary educationVocational high school with master/federal certificate 7Technical or vocational school 8Higher vocational college 9University, PhD 10
Note: EDUCAT is used as the education variable.
10

Table 9: Summary statistics for 2004-2009
Variables Mean S.E. 95% C.I.Lower Uppe
r
Panel 1Attitudes to foreigners
In favour of better opportunities for Swiss citizens 0.281 0.003 0.2750.287
Neither of them 0.061 0.002 0.058 0.064
In favour of equal opportunities for foreigners 0.658 0.003 0.652 0.664
Sj: Share of all foreigners 0.190 0.001 0.189 0.192
Levels of education Compulsory education 0.107 0.002 0.103
0.111
Upper secondary education 0.527 0.003 0.520 0.533
Tertiary education 0.367 0.003 0.360 0.373
Female 0.527 0.003 0.521 0.534
Age 43.281 0.087 43.110 43.452
Swiss since birth 0.905 0.002 0.901 0.909
Second sample (SHP_II) 0.622 0.003 0.616 0.629
Year 2004 0.190 0.003 0.185
0.195
2005 0.157 0.002 0.152 0.162
2006 0.154 0.002 0.149 0.159
2007 0.165 0.002 0.160 0.170
2008 0.165 0.002 0.160 0.170
2009 0.169 0.003 0.164 0.174
Uj: Unemployment rate by 4-digit occupation 0.031 0.000 0.031 0.032
Panel 2Share of women by 4-digit occupation 0.492 0.002 0.488
0.496
Average age by 4-digit occupation 41.519 0.019 41.483 41.556
Share of compulsory-educated by 4-digit occupation 0.111 0.001 0.110 0.11
11
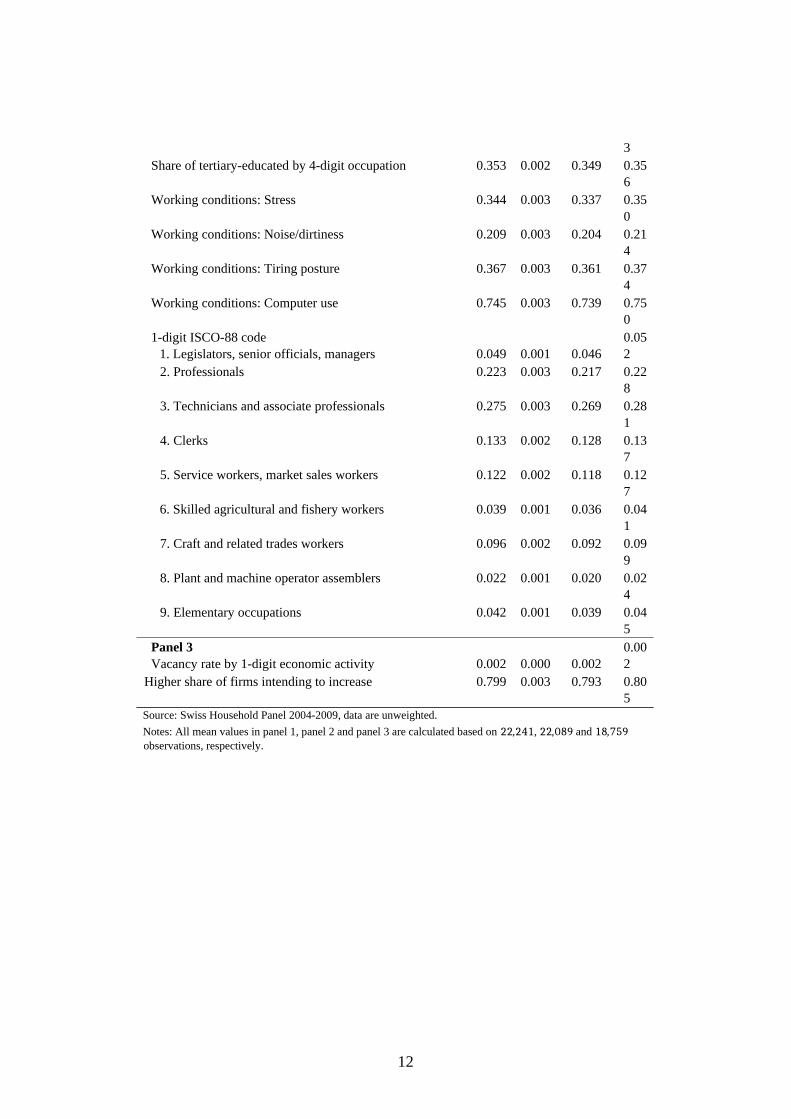
3Share of tertiary-educated by 4-digit occupation 0.353 0.002 0.349 0.35
6Working conditions: Stress 0.344 0.003 0.337 0.35
0Working conditions: Noise/dirtiness 0.209 0.003 0.204 0.21
4Working conditions: Tiring posture 0.367 0.003 0.361 0.37
4Working conditions: Computer use 0.745 0.003 0.739 0.75
01-digit ISCO-88 code 1. Legislators, senior officials, managers 0.049 0.001 0.046
0.052
2. Professionals 0.223 0.003 0.217 0.228
3. Technicians and associate professionals 0.275 0.003 0.269 0.281
4. Clerks 0.133 0.002 0.128 0.137
5. Service workers, market sales workers 0.122 0.002 0.118 0.127
6. Skilled agricultural and fishery workers 0.039 0.001 0.036 0.041
7. Craft and related trades workers 0.096 0.002 0.092 0.099
8. Plant and machine operator assemblers 0.022 0.001 0.020 0.024
9. Elementary occupations 0.042 0.001 0.039 0.045
Panel 3Vacancy rate by 1-digit economic activity 0.002 0.000 0.002
0.002
Higher share of firms intending to increase 0.799 0.003 0.793 0.805
Source: Swiss Household Panel 2004-2009, data are unweighted.
Notes: All mean values in panel 1, panel 2 and panel 3 are calculated based on 22,241, 22,089 and 18,759 observations, respectively.
12

Table 10: Summary statistics for attitudes and foreigner shares over years
2004 2005 2006 2007 2008 2009 2004-2009Attitudes to foreigners> In favour of better opportunities for Swiss citizens (y=1)
0.291(0.007)
0.277(0.008)
0.280(0.008)
0.273(0.007)
0.261(0.007)
0.304(0.008)
0.281(0.003)
> Neither of them (y=2) 0.081(0.004)
0.063(0.004)
0.058(0.004)
0.057(0.004)
0.056(0.004)
0.047(0.003)
0.061(0.002)
> In favour of equal opportunities for foreigners (y=3)
0.628(0.007)
0.659(0.008)
0.662(0.008)
0.670(0.008)
0.683(0.008)
0.650(0.008)
0.658(0.003)
Share of foreigners by occupation (Sj) 0.184(0.002)
0.183(0.002)
0.185(0.002)
0.191(0.002)
0.195(0.002)
0.203(0.002)
0.190(0.001)
Occupational unemployment rate (Uj) 0.035(0.000)
0.034(0.000)
0.031(0.000)
0.028(0.000)
0.027(0.000)
0.032(0.000)
0.031(0.000)
Observations 4,223 3,486 3,423 3,677 3,673 3,759 22,241Source: Swiss Household Panel 2004-2009 data are unweighted.
Notes: Mean values over years, standard errors in parentheses
13

Table 11: AME on Pr(y = 3): Standard and IV ordered probit resultsStandard IV
3-digitat t
IV2-digit
at t
IV1-digit
at t
IV3-digitat t-1
IV2-digitat t-1
IV1-digitat t-1
Without both unemployment and job indicators
Sj -0.176**(0.032)
-0.207**(0.040)
-0.314**(0.061)
-0.366**(0.079)
-0.219**(0.041)
-0.328**(0.063)
-0.378**(0.080)
Observations 22,241 22,241 22,241 22,241 22,170 22,170 22,170
PCP 69.04% 68.82% 68.78% 68.72% 68.85% 68.77% 68.73%
Test for joint significance of the excluded instruments in the first stage
>F stat. (dep. var.= Sj) 3636.01** 360.77** 198.16** 2703.31** 337.30** 197.30**
With unemployment only
Sj -0.148**(0.032)
-0.154**(0.039)
-0.233**(0.061)
-0.236**(0.079)
-0.142**(0.045)
-0.207**(0.067)
-0.214**(0.079)
Uj -0.348**(0.137)
-0.620**(0.200)
-1.125**(0.286)
-1.631**(0.345)
-0.876**(0.394)
-1.640**(0.489)
-1.986**(0.461)
Observations 22,241 22,241 22,241 22,241 22,170 22,170 22,170
PCP 69.01% 68.82% 68.70% 68.51% 68.79% 68.57% 68.35%
Test for joint significance of the excluded instruments in the first stage
> F stat. (dep. var. = Sj) 1849.61** 181.52** 99.89** 1369.83** 170.10** 99.05**
> F stat. (dep. var. = Uj) 579.67** 230.42** 111.74** 121.81** 55.38** 72.27**
With both unemployment and job indicators
Sj -0.130**(0.040)
-0.110**(0.061)
-0.103(0.121)
0.081(1.224)
-0.111(0.085)
-0.103(0.141)
-0.699(1.445)
Uj -0.008(0.138)
-0.122(0.215)
-0.110(0.385)
-0.219(0.953)
-0.243(0.635)
-1.246(2.100)
-0.928(1.510)
Observations 22,089 22,089 22,089 22,089 22,018 22,018 22,018
PCP 69.47% 69.21% 69.22% 69.17% 69.26% 69.09% 68.72%
Test for joint significance of the excluded instruments in the first stage
> F stat. (dep. var. = Sj) 315.48** 70.09** 7.45** 245.27** 52.87** 7.36**
> F stat. (dep. var. = Uj) 331.29** 118.63** 69.41** 37.86** 1.71 34.65**
Source: Swiss Household Panel 2004-2009, data are unweighted.
14

Notes: Coefficient estimates, robust standard errors in parentheses (clustered by occupation and year), ** p<0.05, * p<0.10. Outcome variable: In favour of equal opportunities for foreigners (y = 3). All specifications include control variables and proxies for values/beliefs together with canton, sample and year dummies. The occupational unemployment rate is calculated at the 4-digit ISCO level. Job indicators: occupational means, working conditions and 1-digit ISCO-88 codes. Occupational means are calculated at the 4-digit ISCO level. Instruments: share of foreigners / occupational unemployment rate in the current year (t) in more aggregated levels of occupation (at the 3-, 2- or 1-digit level) and share of foreigners /occupational unemployment rate in the previous year (t − 1) in occupations at the 3-, 2or 1-digit level. The null hypothesis of weak instruments is always rejected using the F test on excluded instruments. PCP: Percentage correctly predicted. AME: Average marginal effects.
15
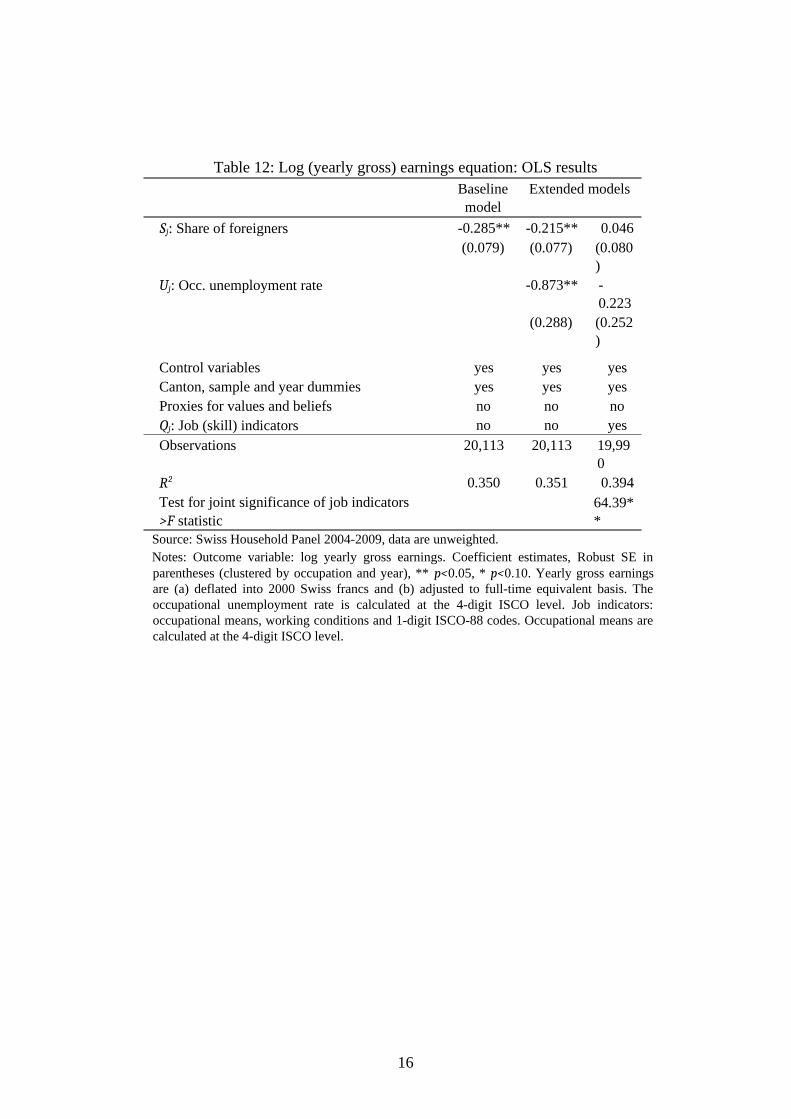
Table 12: Log (yearly gross) earnings equation: OLS resultsBaseline model
Extended models
Sj: Share of foreigners -0.285** -0.215** 0.046(0.079) (0.077) (0.080
)Uj: Occ. unemployment rate -0.873** -
0.223(0.288) (0.252
)
Control variables yes yes yesCanton, sample and year dummies yes yes yesProxies for values and beliefs no no noQj: Job (skill) indicators no no yesObservations 20,113 20,113 19,99
0R2 0.350 0.351 0.394Test for joint significance of job indicators>F statistic
64.39**
Source: Swiss Household Panel 2004-2009, data are unweighted.Notes: Outcome variable: log yearly gross earnings. Coefficient estimates, Robust SE in parentheses (clustered by occupation and year), ** p<0.05, * p<0.10. Yearly gross earnings are (a) deflated into 2000 Swiss francs and (b) adjusted to full-time equivalent basis. The occupational unemployment rate is calculated at the 4-digit ISCO level. Job indicators: occupational means, working conditions and 1-digit ISCO-88 codes. Occupational means are calculated at the 4-digit ISCO level.
16

Table 13: Interacting Sj and Uj in Extended models: Ordered probit results
With unemployment only
With unemployment and job indicators
Sj: Share of foreigners -0.465** -0.314** -0.413** -0.400**(0.102) (0.141) (0.127) (0.143)
Uj: Occ. unemployment rate -1.094** -0.026(0.431) (0.439)
Sj ×Uj -3.928** -0.279(1.437) (1.438)
Control variables yes yes yes yesCanton, sample and year dummies yes yes yes yesProxies for values and beliefs yes yes yes yesQj: Job (skill) indicators no no yes yesObservations 22,241 22,241 22,089 22,089Percentage correctly predicted 69.01% 68.99% 69.47% 69.49%Test for joint significance of values and beliefs
>F statistic 2487.96** 2485.88** 2045.41** 2038.25**Test for joint significance of job indicators>F statistic 324.99** 322.80**
Source: Swiss Household Panel 2004-2009, data are unweighted.Notes: Robust standard errors in parentheses (clustered by occupation and year), ** p<0.05, * p<0.10. Outcome variable y: positive attitudes to equal opportunities for foreigners. The occupational unemployment rate is calculated at the 4-digit ISCO level. Job indicators: occupational means of the control variables, dummies for 1-digit ISCO-88 codes and working conditions (stress, noise/dirtiness, tiring posture, computer use). Occupational means are calculated at the 4-digit ISCO level. Proxies for values and beliefs are general trust in people and political position left-right.
17

Table 14: Baseline model: Additional ordered probit resultsCoefficients Average Marginal Effects
y=1 y=2 y=3
Sj: Share of foreigners -0.559**
(0.096)0.161**
(0.028)0.014**
(0.003)-0.175**
(0.030)
Canton dummies no
MS region dummies yes
Qj: Job (skill) indicators no
Observations 20,885
Percentage correctly predicted
69.55%
Sj: Share of foreigners -0.573**
(0.097)0.164**
(0.028)0.015**
(0.003)-0.179**
(0.030)
Canton dummies yes
MS region dummies yes
Qj: Job (skill) indicators no
Observations 20,885
Percentage correctly predicted
69.71%
Sj: Share of foreigners -0.553**
(0.103)0.162**
(0.030)0.014**
(0.003)-0.176**
(0.032)No. of cross-border migrants by canton
0.000(0.000)
-0.000(0.000)
-0.000(0.000)
0.000(0.000)
Canton dummies yes
MS region dummies no
Qj: Job (skill) indicators no
Observations 22,241
Percentage correctly predicted
69.03%
Source: Swiss Household Panel 2004-2009, data are unweighted.Notes: Robust standard errors in parentheses (clustered by occupation and year), ** p<0.05, * p<0.10. Outcome variable y: positive attitudes to equal opportunities for foreigners. All specifications include control variables and proxies for values/beliefs together with sample and year dummies.
18

Table 15: Adding occupational unemployment rate: Additional ordered probit results
Coefficients Average Marginal Effectsy=1 y=2 y=3
Sj: Share of foreigners -0.490**
(0.097)0.141**
(0.028)0.013**
(0.003)-0.154**
(0.030)Uj: Occ. unemployment rate -0.862**
(0.427)0.248**
(0.123)0.022**
(0.011)-0.270**
(0.134)
Canton dummies no
MS region dummies yes
Qj: Job (skill) indicators no
Observations 20,885
Percentage correctly predicted
69.55%
Sj: Share of foreigners -0.500**
(0.098)0.144**
(0.028)0.013**
(0.003)-0.156**
(0.030)Uj: Occ. unemployment rate -0.911**
(0.426)0.262**
(0.122)0.023**
(0.011)-0.285**
(0.133)
Canton dummies yes
MS region dummies yes
Qj: Job (skill) indicators no
Observations 20,885
Percentage correctly predicted
69.70%
Sj: Share of foreigners -0.465**
(0.102)0.136**
(0.030)0.012**
(0.003)-0.148**
(0.032)Uj: Occ. unemployment rate -1.094**
(0.431)0.320**
(0.126)0.028**
(0.011)-0.348**
(0.137)No. of cross-border migrants by canton
0.000(0.000)
-0.000(0.000)
-0.000(0.000)
0.000(0.000)
Canton dummies yes
MS region dummies no
Qj: Job (skill) indicators no
Observations 22,241
Percentage correctly predicted
69.01%
Source: Swiss Household Panel 2004-2009, data are unweighted.Notes: Robust standard errors in parentheses (clustered by occupation and year), ** p<0.05, * p<0.10. Outcome variable y: positive attitudes to equal opportunities for foreigners. All specifications include control variables and proxies for values/beliefs together with sample and year dummies.
19

Table 16: Adding unemployment and job indicators: Additional ordered probit results
Coefficients Average Marginal Effectsy=1 y=2 y=3
Sj: Share of foreigners -0.446**
(0.125)0.127**
(0.036)0.011**
(0.003)-0.138**
(0.039)Uj: Occ. unemployment rate 0.296
(0.443)-0.084
(0.126)-0.007
(0.011)0.092
(0.138)
Canton dummies no
MS region dummies yes
Qj: Job (skill) indicators yes
Observations 20,743
Percentage correctly predicted
69.97%
Sj: Share of foreigners -0.451**
(0.125)0.128**
(0.036)0.011**
(0.003)-0.140**
(0.039)Uj: Occ. unemployment rate 0.248
(0.445)-0.070
(0.127)-0.006
(0.011)0.077
(0.138)
Canton dummies yes
MS region dummies yes
Qj: Job (skill) indicators yes
Observations 20,743
Percentage correctly predicted
70.02%
Sj: Share of foreigners -0.413**
(0.127)0.120**
(0.037)0.010**
(0.003)-0.130**
(0.040)Uj: Occ. unemployment rate -0.026
(0.439)0.007
(0.127)0.001
(0.011)-0.008
(0.138)No. of cross-border migrants by canton
-0.000(0.000)
0.000(0.000)
0.000(0.000)
-0.000(0.000)
Canton dummies yes
MS region dummies no
Qj: Job (skill) indicators yes
Observations 22,089
Percentage correctly predicted
69.47%
Source: Swiss Household Panel 2004-2009, data are unweighted.Notes: Robust standard errors in parentheses (clustered by occupation and year), ** p<0.05, * p<0.10. Outcome variable y: positive attitudes to equal opportunities for foreigners. All specifications include control variables and proxies for values/beliefs together with sample and year dummies.
20

Table 17: Interacting Sj and indicators of shortages: Additional ordered probit results
Main model With unemployment only
With unemployment and job indicators
Sj: Share of foreigners -0.942** -1.015** -0.863** -0.923** -0.799** -0.858**
(0.116) (0.124) (0.117) (0.132) (0.146) (0.164)Sj× Rate of job vacancies 77.103** 86.078** 75.274**
(19.277) (19.849) (20.933)Sj × 1[∆+> ∆−] 0.359** 0.326** 0.292**
(0.114) (0.117) (0.113)Uj: Occ. unemployment rate -1.386** -0.901* 0.087 0.483
(0.453) (0.462) (0.492) (0.495)
Canton dummies no no no no no no
MS region dummies yes yes yes yes yes yes
Qj: Job (skill) indicators no no no no yes yes
Observations 17,807 17,807 17,807 17,807 17,695 17,695Percentage correctly predicted 70.47% 70.52% 70.64% 70.55% 70.87% 70.86%Sj: Share of foreigners -0.957** -1.038** -0.874** -0.940** -0.801** -0.864**
(0.117) (0.124) (0.118) (0.132) (0.147) (0.165)Sj× Rate of job vacancies 77.416** 86.882** 75.979**
(19.415) (19.984) (21.078)Sj × 1[∆+> ∆−] 0.370** 0.335** 0.301**
(0.114) (0.116) (0.113)Uj: Occ. unemployment rate -1.457** -0.962** 0.024 0.427
(0.452) (0.461) (0.495) (0.497)
Canton dummies yes yes yes yes yes yes
MS region dummies yes yes yes yes yes yes
Qj: Job (skill) indicators no no no no yes yes
Observations 17,807 17,807 17,807 17,807 17,695 17,695Percentage correctly predicted 70.56% 70.69% 70.70% 70.69% 70.92% 70.88%Sj: Share of foreigners -0.953** -1.067** -0.851** -0.932** -0.787** -0.850**
(0.110) (0.118) (0.110) (0.126) (0.141) (0.159)Sj× Rate of job vacancies 65.213** 76.474** 66.976**
(18.953) (19.476) (20.346)Sj × 1[∆+> ∆−] 0.378** 0.329** 0.283**
(0.110) (0.112) (0.109)Uj: Occ. unemployment rate -1.797** -1.348** -0.315 0.038
(0.447) (0.456) (0.488) (0.491)
No. of cross-border migrants by canton
-0.000 -0.000 -0.000 -0.000 -0.000 -0.000
(0.000) (0.000) (0.000) (0.000) (0.000) (0.000)
Canton dummies yes yes yes yes yes yes
MS region dummies no no no no no no
Qj: Job (skill) indicators no no no no yes yes
Observations 18,877 18,877 18,877 18,877 18,759 18,759Percentage correctly predicted 69.91% 69.80% 69.91% 69.93% 70.19% 70.13%
Source: Swiss Household Panel 2004-2009, data are unweighted.Notes: Coefficient estimates, robust standard errors in parentheses (clustered by occupation and year), ** p<0.05, * p<0.10. Outcome variable y: positive attitudes to equal opportunities for foreigners. All specifications include control variables, controls for values and beliefs, canton, sample and year dummies. See notes below Table 6 for more details.
21

Table 18: Baseline and extended models: Additional ordered probit results when occupations with less than 30 individuals in a year are excluded
Coefficients Average Marginal Effectsy=1 y=2 y=3
Sj: Share of foreigners -0.598**
(0.112)0.174**
(0.032)0.015**
(0.003)-0.190**
(0.035)Uj: Occ. unemployment rate no
Qj: Job (skill) indicators no
Observations 20,735
Percentage correctly predicted
69.08%
Sj: Share of foreigners -0.483**
(0.110)0.141**
(0.032)0.012**
(0.003)-0.153**
(0.035)Uj: Occ. unemployment rate -1.402**
(0.505)0.409**
(0.147)0.036**
(0.013)-0.445**
(0.160)Qj: Job (skill) indicators no
Observations 20,735
Percentage correctly predicted
69.06%
Sj: Share of foreigners -0.487**
(0.145)0.140**
(0.042)0.012**
(0.004)-0.153**
(0.045)Uj: Occ. unemployment rate 0.054
(0.514)-0.016
(0.148)-0.001
(0.013)0.017
(0.161)Qj: Job (skill) indicators yes
Observations 20,598
Percentage correctly predicted
69.48%
Source: Swiss Household Panel 2004-2009, data are unweighted.Notes: Robust standard errors in parentheses (clustered by occupation and year), ** p<0.05, * p<0.10. Outcome variable y: positive attitudes to equal opportunities for foreigners. All specifications include control variables and proxies for values/beliefs together with canton, sample and year dummies.
22

Table 19: Interacting Sj and indicators of shortages: Additional ordered probit results when occupations with less than 30 individuals in a year are excluded
Main model With unemployment only
With unemployment and job indicators
Sj: Share of foreigners -0.991** -1.111** -0.863** -0.934** -0.812** -0.883**
(0.118) (0.124) (0.118) (0.134) (0.158) (0.180)Sj× Rate of job vacancies 57.408** 71.861** 60.539**
(19.009) (19.863) (20.684)Sj × 1[∆+> ∆−] 0.370** 0.303** 0.272**
(0.114) (0.118) (0.113)Uj: Occ. unemployment rate -2.247** -1.707** -0.215 0.238
(0.515) (0.530) (0.576) (0.583)
Qj: Job (skill) indicators no no no no yes yes
Observations 17,565 17,565 17,565 17,565 17,461 17,461Percentage correctly predicted 69.97% 69.98% 70.05% 70.01% 70.13% 70.20%
Source: Swiss Household Panel 2004-2009, data are unweighted.Notes: Coefficient estimates, robust standard errors in parentheses (clustered by occupation and year), ** p<0.05, * p<0.10. Outcome variable y: positive attitudes to equal opportunities for foreigners. All specifications include control variables, controls for values and beliefs together with canton, sample and year dummies. See notes below Table 6 for more details.
23

