occupant-seat contact pressure characteristics of
TRANSCRIPT

Occupant-Seat Contact Pressure Characteristics of Polyurethane Foam Seats Using Explicit Finite-Element Analyses
Kabir Krishan
A Thesis
in
The Department
of
Mechanical and Industrial Engineering
Presented in Partial Fulfillment of the Requirements
for the Degree of Master of Applied Science (Mechanical Engineering)
at
Concordia University
Montreal, Quebec, Canada
January 2017
© Kabir Krishan, 2017
ii
CONCORDIA UNIVERSITY
SCHOOL OF GRADUATE STUDIES
This is to certify that the thesis was prepared
By: Kabir Krishan
Entitled: Occupant-Seat Contact Pressure Characteristics of Polyurethane Foam Seats Using Explicit Finite-Element Analyses
and submitted in partial fulfilment of the requirements for the degree of
Master of Applied Science (Mechanical Engineering)
complies with the regulations of the University and meets the accepted standards with respect to originality and quality.
Signed by the final examining committee:
Chair Dr. I. Stiharu, MIE Examiner Dr. A. K. W. Ahmed, MIE Examiner Dr. A. Nazemi, BCEE External to the Program
Supervisor Dr. S. Rakheja, MIE
Approved by:
Dr. S. Narayanswamy, M.A.Sc. Program Director Department of Mechanical and Industrial Engineering
Dr. A. Asif, Dean
Faculty of Engineering & Computer Science
Date: January 20, 2017

iii
ABSTRACT
Occupant-Seat Contact Pressure Characteristics Of Polyurethane Foam Seats Using Explicit Finite-Element Analyses
Kabir Krishan
The occupant-seat contact properties are investigated through analyses of interface pressure using
explicit dynamic finite element (FE) simulations. A finite-element analysis model of a seat is
developed in the LS-DYNA platform, where the material model is formulated on the basis of
reported stress-strain properties of different polyurethane materials. The seat model is coupled
with the finite-element models of the occupant based on the well-established frontal crash
anthropomorphic test devices (ATD). The validity of the seat model is initially illustrated through
simulation of a compression test model, which suggested that the hyperelastic stress-strain
responses of the PUF materials can be reliably estimated using the explicit dynamic finite element
platform, LS-DYNA®. The validity of the coupled seat-ATD model is also illustrated through
comparisons of the contact pressure and contact area responses with the reported measured data.
It is shown that the coupled occupant-seat finite element model can provide reasonable good
predictions of the interface pressure and contact area, which have been correlated with occupant’s
sensation of comfort. This suggested that FE models of ATD can be effectively used for predicting
occupant-seat contact pressure and thus the comfort performance of seats for different body sizes,
ranging from 5th percentile female to 50th and 95th percentile male population. The simulation
results are obtained to illustrate significance of various factors affecting the contact pressure
distribution, namely the material property, material thickness, dimensions of ATD, occupant load
distribution, seat geometry and design of side wings. The contact pressure distribution and contact
area responses of different design configurations of the seat are subsequently obtained and
iv
discussed so as to build guidance towards designs of seats with reduced contact pressure
distributions. It is shown that the side wings constitute an additional load path and can contribute
significantly in distributing the occupant load over a wider contact area and thereby limit the peak
contact pressure.

v
Acknowledgements
I would like to deeply thank my supervisor Dr. Subhash Rakheja for his guidance and tremendous
support during the course of my studies. Dr. Rakheja has mentored me and supported my education
every step of the way. Especially I want to thank him for allowing me to change my research topic
in the second year of my master’s program. I would like to thank my younger brother Arjun
Krishan for assuming the role of the elder sibling and taking care of our grandfather, father and
mother while I was pursuing my academic goals. I want to thank my father and mother for always
supporting my endeavors and for their love and support throughout my life.
I would also like to thank my colleagues and friends at Bombardier Ercan Afacan, Aya Amany
Danny Gelinas, and Cesar Roudiere for their mentorship, friendship and support during the course
of my studies. Without their support this research work would not have been possible.
I would like to thank my very good friend Korhan Turker, who has always supported me. Finally,
I want to thank Dr. Rituanjali Kumar for her love and support during the writing of this thesis.
Thank you for being the foundation of my life.
vi
Dedicated to my grandfather Kewal Krishan and my uncle Brij Bedi
– you are deeply missed

vii
TABLE OF CONTENTS
ABREVIATIONS ........................................................................................................................... x
LIST OF FIGURES ....................................................................................................................... xi
LIST OF TABLES ....................................................................................................................... xvi
Chapter 1 ......................................................................................................................................... 1
INTRODUCTION ....................................................................................................................... 1
1.1 Motivation .................................................................................................................... 1
1.2 Research objective ........................................................................................................ 2
1.3 Organization of the thesis ............................................................................................. 3
Chapter 2 ......................................................................................................................................... 4
BACKGROUND AND SIGNIFICANCE .................................................................................. 4
2.1 Review of Relevant Literature ...................................................................................... 6
2.1.1 Objective Measures of Comfort Assessment .................................................................... 6
2.1.2 Relationship of Pressure with contact properties ............................................................ 9
2.1.3 Measurement of Interface Pressure and Contact Area .................................................. 12
2.1.4 Occupant-Seat Models .................................................................................................... 16
2.1.5 Numerical modeling of polyurethane foam .................................................................... 20
2.2 Significance of Current Research ........................................................................................... 23
Chapter 3 ....................................................................................................................................... 25
MODEL DEVELOPMENT AND VALIDAITON ................................................................... 25
3.1 Material model of polyurethane foam ........................................................................ 27

viii
3.1.1 Deformation Gradient and its Relation to Principle Stretches ....................................... 27
3.1.2 MAT_57: Low density polyurethane foam material model ............................................ 30
3.1.3 Explicit FE model of the foam material and its validation .............................................. 31
3.2 Modeling the Seat Cushion......................................................................................... 42
3.2.1 Seat Cushion Model Formulation ................................................................................... 45
3.3 Occupant Model ......................................................................................................... 48
3.4 Development of the Seat-ATD model ........................................................................ 53
3.4.1 Method of analysis and model verification .................................................................... 54
3.4.2 Comparisons with Reported Pressure and Contact Area Measurements ...................... 59
3.5 Summary ..................................................................................................................... 63
Chapter 4 ....................................................................................................................................... 65
DESIGN EXPLORATION OF THE SEAT CUSHION VIA INTERFACE CONTACT
PRESSURE MEASUREMENTS ............................................................................................. 65
4.1 General ........................................................................................................................ 65
4.2 Evaluations of seat design features ............................................................................. 66
4.3 Method of analysis...................................................................................................... 70
4.4 Results and discussions .............................................................................................. 73
4.4.1 Effect of seat cushion material properties ...................................................................... 74
4.4.2 Effect of seat cushion and wing angle ............................................................................ 79
4.4.3 Effect of seat cushion thickness ...................................................................................... 91
4.5 Multilayer seat cushion design ................................................................................... 95
4.5.1 Design Configurations ..................................................................................................... 96
4.5.2 Peak contact pressure response characteristics ............................................................. 98
4.6 Summary and conclusion.......................................................................................... 114

ix
Chapter 5 ..................................................................................................................................... 115
CONCLUSIONS AND RECOMMENDATIONS FOR FUTURE WORK ........................... 115
5.1 Major Contributions ................................................................................................. 115
5.2 Major Conclusions .................................................................................................... 116
5.2 Recommendations for Future Work ......................................................................... 117
REFERENCES ........................................................................................................................... 119
APPENDIX ............................................................................................................................. 123
A.1 Performance of parameter based strain energy density formulations in curve fitting
experimental uniaxial polyurethane foam compression test data. .............................................. 123

x
ABREVIATIONS
ATD – Anthropomorphic test device
CAE – Computer Aided Engineering
CEM – Crash Energy Management
DOF – Degree of freedom
FE – Finite element
FE-ATD – Finite element Anthropomorphic Test Device
LSTC – Livermore Software Technology Corporation
MDOF – Multi degrees of freedom
MLSD – Multi Layer Seat Design
NCAC – National crash analysis center
NHTSA – National highway traffic safety administration
PUF – Polyurethane foam
SBM – Standing Body Mass
SDOF – Single Degree of Freedom

xi
LIST OF FIGURES
FIGURE 2.1: FOAM CELL MODEL [40] .......................................................................................................................... 10
FIGURE 2.2: (A) BENDING DOMINATED FOAM BEHAVIOR [40] (B) MEASURED STRESS-STRAIN RESPONSE OF THE
SEAT CUSHION FOAM [38] ................................................................................................................................. 11
FIGURE 2.3: (A) A LUMPED PARAMETER MDOF OCCUPANT-SEAT CUSHION MODEL [17] (B) MULTIBODY DYNAMIC
OCCUPANT-SEAT MODEL WITH VISCOELASTIC FOAM [19] ............................................................................... 17
FIGURE 2.4: POLYURETHANE FOAM COMPRESSION WITH NEGLIGIBLE LATERAL DEFORMATION [61] ..................... 21
FIGURE 2.5: MODELS BASED ON HYPERELASTIC STRAIN ENERGY FUNCTION IN ANSYS® SOFTWARE PACKAGE [65] 23
FIGURE 2.6: COMPARISON OF STRESS-STRAIN RESPONSE FOR PARAMETER BASED STRAIN ENERGY DENSITY
FORMULATIONS OF POLYURETHANE FOAM WITH A SAMPLE (62 𝑘𝑘𝑘𝑘/𝑚𝑚3) FOAM (A) 9 PARAMETER MOONEY
RIVLIN (B) 3RD ORDER ODGEN (C) 3RD ORDER YEOH (D) GENT (E) ARRUDA-BOYCE (F) BLATZ-KO ..................... 24
FIGURE 3.1: MAPPING OF A CELL VOLUME FROM THE REFERENCE CONFIGURATION Ω0 TO THE DEFORMED
CONFIGURATION Ω𝑡𝑡 .......................................................................................................................................... 28
FIGURE 3.2: PHYSICAL INTERPRETATION OF POLAR DECOMPOSITION OF DEFORMATION GRADIENT ...................... 29
FIGURE 3.3: FINITE ELEMENT MODEL OF FOAM BLOCK DEVELOPED TO REPLICATE THE FOAM COMPRESSION TEST
........................................................................................................................................................................... 32
FIGURE 3.4: FORCE TIME HISTORIES OF THE LOAD CELL ELEMENT FOR DIFFERENT STIFFNESS VALUES .................... 35
FIGURE 3.5: CONTROLLED DISPLACEMENT LOADING CURVE OF THE RAM LEADING TO STRAIN RATE OF 10 S-1 UP TO
60% STRAIN ........................................................................................................................................................ 37
FIGURE 3.6: FORCE-DISPLACEMENT RESPONSE OBTAINED FROM THE FCTM SIMULATIONS..................................... 38
FIGURE 3.7: VARIATIONS IN THE HOURGLASS ENERGY AND THE INTERNAL ENERGY ................................................ 38
FIGURE 3.8: STRESS-STRAIN RESPONSES FOR JC FOAMS(80, 90, 100 OR 120) WITH DIFFERENT DENSITIES AT A
CONSTANT STRAIN RATE OF 10 S-1 AND CONSTANT SPECIMEN DIMENSION OF 5 X 5 X 3 CM [38] .................. 40
FIGURE 3.9: THE DEFORMATION AND FORCE RESPONSES OF FE MODEL OF THE FOAM SAMPLE AT DIFFERENT
INSTANTS ........................................................................................................................................................... 41
FIGURE 3.10: TEST VS FEA FOR JC80 FOAM SPECIMEN (58 𝑘𝑘𝑘𝑘/𝑚𝑚3) .......................................................................... 42

xii
FIGURE 3.11: PICTORIAL VIEWS OF (A) CANDIDATE SEAT; AND (B) FE MODEL .......................................................... 44
FIGURE 3.12: OCCUPANT-SEAT MODEL DEVELOPMENT METHODOLOGY .................................................................. 44
FIGURE 3.13: FINITE ELEMENT MODEL OF THE SEAT WITH (A) DISCRETIZED SEAT BACK; AND (B) WITH SEAT BACK
REPLACED BY A RIGID SUPPORTING WALL ........................................................................................................ 46
FIGURE 3.14: MESH ALIGNMENT WITH LOAD DIRECTION (-Z) AND SHAPE OF THE MESH ........................................ 47
FIGURE 3.15: FINITE ELEMENT MODELS OF ANTHROPOMORPHIC TEST DEVICES REPRESENTING 5TH, 50TH AND 95TH
PERCENTILE ADULT POPULATION ...................................................................................................................... 49
FIGURE 3.16: HUMAN FE ATD MODEL DEVELOPMENT METHODOLOGY [57] ............................................................. 50
FIGURE 3.17: THREE DIMENSIONAL SCANS OBATAINED FROM HYBRID III ATD’S [51] ............................................... 50
FIGURE 3.18: PICTORIAL VIEWS OF FE-ATD’S (A) BUTTOCKS, PELVIS, ABDOMEN; AND (B) SPINE, SPINE BRACKET,
HIP-JOINT ........................................................................................................................................................... 52
FIGURE 3.19: QUALITATIVE COMPARISON OF PELVIS: (A) HUMAN MALE PELVIS [75] AND (B) PELVIS MODEL IN THE
50TH PERCENTILE FE-ATD .................................................................................................................................... 52
FIGURE 3.20: POSITIONING OF THE ATD ON THE SEAT: (A) SEAT ANGLES WITH RESPECT TO GLOBAL AXES AND
CONSTRAINTS; AND (B) INITIAL POSITION OF ATD WITH RESPECT TO THE SEAT CUSHION .............................. 54
FIGURE 3.21: VARIATION IN THE CONTACT FORCE BETWEEN THE ATD AND SEAT CUSHION ................................... 55
FIGURE 3.22: CALCULATION OF WEIGHTED AREA FOR CONTACT PRESSURE MEASUREMENT................................... 56
FIGURE 3.23: (A) ENERGY RATIO; AND (B) HOURGLASS VERSUS INTERNAL ENERGY OF THE COUPLED SEAT-ATD
MODEL ............................................................................................................................................................... 57
FIGURE 3.24: SEAT CUSHION FE MODELS FOR MESH CONVERGENCE STUDY ............................................................ 58
FIGURE 3.25: SCHEMATIC ILLUSTRATION OF THE NOVEL ELECTRONICS PRESSURE MAT (UNITS ARE IN MM) [31] ... 60
FIGURE 3.26: SCHEMATIC PRESENTATION OF REGIONS ON THE CUSHION (DIGITS INDICATE NUMBER OF SENSORS
OCCUPIED) [31] .................................................................................................................................................. 61
FIGURE 4.1: DIFFERENT CUSHION THICKNESS CONSIDERED ....................................................................................... 67
FIGURE 4.2: VARIATIONS IN SEAT CUSHION ANGLE WITH RESPECT TO THE HORIZONTAL AXIS ............................... 68
FIGURE 4.3: VARIATIONS IN SEAT CUSHION WING ANGLES ........................................................................................ 69
FIGURE 4.4: OCCUPANT-SEAT PRESSURE DISTRIBUTION OBTAINED FROM THE SIMULATION MODEL ..................... 70

xiii
FIGURE 4.5: IDENTIFICATION OF CA90 AND CA70 REGIONS OF THE OCCUPANT-SEAT INTERFACE............................ 72
FIGURE 4.6: FE-ATD FOR 50TH PERCENTILE HYBRID III MALE WITH A RIGID SEAT BACK ............................................. 73
FIGURE 4.7: DEFORMATION (MM), 5TH FE-ATD SEATED ON (A) JC120, AND (B) JC80 SEAT CUSHION ........................ 76
FIGURE 4.8: VISUAL COMPARISONS OF PRESSURE DISTRIBUTIONS OF THE 5TH, 50TH AND 95TH FE-ATD’S COUPLED
WITH JC80 AND JC120 SEATS ............................................................................................................................. 78
FIGURE 4.9: ILLUSTRATIONS OF THE WING GEOMETRY: (A) NOMINAL SEAT CONFIGURATION; (B) MODIFIED SEAT
WITH UNIFORM WINGS ..................................................................................................................................... 79
FIGURE 4.10: VARIATIONS IN PEAK CONTACT PRESSURE AS FUNCTIONS OF CUSHION AND WING ANGLES (A) 5TH
PERCENTILE ATD; (B) 50TH PERCENTILE ATD; AND (C) 95TH PERCENTILE ATD .................................................... 81
FIGURE 4.11: EFFECTS OF VARIATIONS IN CUSHION AND WING ANGLES ON THE PERCENT BODY WEIGHT
SUPPORTED BY THE CUSHION AND BACK SUPPORT: (A) 5TH PERCENTILE ATD; (B) 50TH PERCENTILE ATD; AND
(C) 95TH PERCENTILE ATD ................................................................................................................................... 82
FIGURE 4.12: INFLUENCES IN VARIATIONS IN SEAT CUSHION AND WING ANGLES ON MEAN CONTACT PRESSURE
(MP90): (A) 5TH PERCENTILE ATD; (B) 50TH PERCENTILE ATD; AND (C) 95TH PERCENTILE ATD ........................... 85
FIGURE 4.13: INFLUENCES IN VARIATIONS IN SEAT CUSHION AND WING ANGLES ON MEAN CONTACT PRESSURE
(MP70): (A) 5TH PERCENTILE ATD; (B) 50TH PERCENTILE ATD; AND (C) 95TH PERCENTILE ATD ........................... 86
FIGURE 4.14: INFLUENCES IN VARIATIONS IN SEAT CUSHION AND WING ANGLES ON MEAN CONTACT PRESSURE
(OMP): (A) 5TH PERCENTILE ATD; (B) 50TH PERCENTILE ATD; AND (C) 95TH PERCENTILE ATD ............................ 87
FIGURE 4.15: INFLUENCES IN VARIATIONS IN SEAT CUSHION AND WING ANGLES ON CONTACT AREA (CA90): (A) 5TH
PERCENTILE ATD; (B) 50TH PERCENTILE ATD; AND (C) 95TH PERCENTILE ATD .................................................... 88
FIGURE 4.16: INFLUENCES IN VARIATIONS IN SEAT CUSHION AND WING ANGLES ON CONTACT AREA (CA70): (A) 5TH
PERCENTILE ATD; (B) 50TH PERCENTILE ATD; AND (C) 95TH PERCENTILE ATD .................................................... 89
FIGURE 4.17: INFLUENCES IN VARIATIONS IN SEAT CUSHION AND WING ANGLES ON CONTACT AREA (OCA): (A) 5TH
PERCENTILE ATD; (B) 50TH PERCENTILE ATD; AND (C) 95TH PERCENTILE ATD .................................................... 90
FIGURE 4.18: COMPARISONS OF PROPORTIONS OF ATD WEIGHTS SUPPORTED BY THE CUSHION AND THE BACK
SUPPORT OF DIFFERENT SEAT LAYER CUSHION DESIGN VARIATIONS............................................................... 91

xiv
FIGURE 4.19: EFFECT OF SEAT CUSHION THICKNESS ON PEAK & MEAN PRESSURE UNDER THE TUBEROSITIES FOR
5TH, 50TH AND 95TH PERCENTILE HUMAN MALE FE-ATD ..................................................................................... 93
FIGURE 4.20: EFFECT OF SEAT CUSHION THICKNESS ON CONTACT AREA (CA90) UNDER THE TUBEROSITIES FOR 5TH,
50TH AND 95TH PERCENTILE HUMAN MALE FE-ATD ........................................................................................... 94
FIGURE 4.21: EFFECT OF SEAT CUSHION THICKNESS ON CONTACT AREA (CA70) UNDER THE TUBEROSITIES FOR 5TH,
50TH AND 95TH PERCENTILE HUMAN MALE FE-ATD ........................................................................................... 94
FIGURE 4.22: EFFECT OF SEAT CUSHION THICKNESS ON CONTACT AREA (OCA) UNDER THE TUBEROSITIES FOR 5TH,
50TH AND 95TH PERCENTILE HUMAN MALE FE-ATD ........................................................................................... 95
FIGURE 4.23: MULTILAYER SEAT CUSHION FE MODEL ................................................................................................ 96
FIGURE 4.24: LAYOUT OF JC120 AND JC80 PUF MATERIALS WITHIN THE SEAT CUSHION .......................................... 97
FIGURE 4.25: MLSD VARIATIONS WITH LOWEST PEAK CONTACT PRESSURES BENEATH THE ISCHIUM REGION ..... 100
FIGURE 4.26: COMPARISONS OF PEAK CONTACT PRESSURE RESPONSES OF DIFFERENT MULTILAYER SEAT CUSHION
DESIGN VARIATIONS (‘H’ AND ‘S’ REFER TO HIGH AND LOW DENSITY FOAM MATERIAL WINGS, AND ‘H’ AND
‘S’ DENOTE THE HIGH AND LOW-DENSITY FOAM LAYERS IN THE MID-SECTION) ........................................... 102
FIGURE 4.27: COMPARISONS OF PROPORTIONS OF ATD WEIGHTS SUPPORTED BY THE CUSHION AND THE BACK
SUPPORT OF DIFFERENT MULTILAYER SEAT CUSHION DESIGN VARIATIONS (‘H’ AND ‘S’ REFER TO HIGH AND
LOW DENSITY FOAM MATERIAL WINGS, AND ‘H’ AND ‘S’ DENOTE THE HIGH AND LOW-DENSITY FOAM
LAYERS IN THE MID-SECTION) .......................................................................................................................... 103
FIGURE 4.28: DEFORMATION PLOTS OF T1, T2 AND T3 SEAT DESIGNS COUPLED WITH THE 95TH PERCENTILE FE-ATD
......................................................................................................................................................................... 107
FIGURE 4.29: COMPARISONS OF CONTACT AREAS (CA90) DUE TO CELLS EXPERIENCING PRESSURE EQUAL TO OR
ABOVE 90% OF THE PEAK PRESSURE OF THE DESIGN VARIATIONS COUPLED WITH 5TH, 50TH AND 95TH
PERCENTILE ATDS ............................................................................................................................................. 108
FIGURE 4.30: COMPARISONS OF CONTACT AREAS (CA70) OF THE DESIGN VARIATIONS COUPLED WITH 5TH, 50TH
AND 95TH PERCENTILE ATDS ............................................................................................................................. 109
FIGURE 4.31: COMPARISONS OF OVERALL CONTACT AREAS (OCA) OF THE DESIGN VARIATIONS COUPLED WITH 5TH,
50TH AND 95TH PERCENTILE ATDS. .................................................................................................................... 110

xv
FIGURE 4.32: COMPARISONS OF MEAN PRESSURE (MP90) RESPONSES OF THE DESIGN VARIATIONS COUPLED WITH
5TH, 50TH AND 95TH PERCENTILE ATDS. ............................................................................................................. 111
FIGURE 4.33: COMPARISONS OF MEAN PRESSURE (MP70) RESPONSES OF THE DESIGN VARIATIONS COUPLED WITH
5TH, 50TH AND 95TH PERCENTILE ATDS. ............................................................................................................. 112
FIGURE 4.34: COMPARISONS OF OVERALL MEAN PRESSURE (OMP) RESPONSES OF THE DESIGN VARIATIONS
COUPLED WITH 5TH, 50TH AND 95TH PERCENTILE ATDS. ................................................................................... 113
xvi
LIST OF TABLES
TABLE 2.1: STUDIES REPORTING OCCUPANT-SEAT PRESSURE DISTRIBUTIONS AND THEIR CORRELATIONS WITH
COMFORT/DISCOMFORT ..................................................................................................................................... 8
TABLE 3.1: COMPARISON OF COMPUTATION TIME OBSERVED WITH DIFFERENT ELEMENT FORMULATIONS .......... 34
TABLE 3.2: MECHANICAL PROPERTIES OF POLYURETHANE FOAM SAMPLES [38] ...................................................... 39
TABLE 3.3: PEAK PRESSURE AND COMPUTATION TIME FOR SEAT CUSHION MODELS WITH 2, 4, 8 ELEMENTS
THROUGH THE INDIVIDUAL CUSHION LAYERS. .................................................................................................. 58
TABLE 3.4: COMPARISONS OF MODEL PREDICTED PEAK AND MEAN CONTACT PRESSURE OVER THE BUTTOCKS
REGIONS WITH THE MEASURED DATA (PUF MATERIAL: JC120; DENSITY = 62 𝑘𝑘𝑘𝑘/𝑚𝑚3) ................................... 62
TABLE 4.1: PEAK PRESSURE UNDER THE ISCHIAL TUBEROSITIES FOR 5TH, 50TH AND 95TH PERCENTILE HYBRID III
FAMILY COUPLED WITH FOUR DIFFERENT SEATS .............................................................................................. 75
TABLE 4.2: COMPUTED CONTACTS AREA FOR THE 5TH, 50TH AND 95TH PERCENTILE FE-ATD’S COUPLED WITH FOUR
DIFFERENT SEATS ............................................................................................................................................... 75
TABLE 4.3: MEAN CONTACT PRESSURES FOR PUF SEATS COUPLED WITH 5TH, 50TH AND 95TH PERCENTILE FE-ATD’S 77

1
Chapter 1
INTRODUCTION
1.1 Motivation
Discomfort perceived by a seated occupant in a vehicle while driving may result in health
issues like muscle fatigue and pressure sores under the buttocks [1, 2]. Muscular fatigue
contributes to impaired coordination, increased tracking errors and higher risk of accidents [3].
Studies have shown that discomfort is strongly related to contact properties of seat cushion such
as geometry and hyperelasticity [4-7]. Contact pressure generated at the interface has been
identified as a primary objective measure of discomfort for a seated occupant [8]. At the contact
interface, high pressure is generated when large force is transmitted over a small contact area. This
causes high stress in a localized zone under the skin that may cause muscle fatigue and occlusion
of blood in the arteries.
Contact pressure under the buttocks and consequently the comfort/discomfort of a seated
occupant has been studied experimentally [7, 9-11] as well as numerically [5, 7, 9, 10, 12-18].
Experimental studies help to evaluate particular seats but cannot be used to generate seat design
guidelines since the parametric studies involving many physical prototypes is a costly activity. On
the other hand, numerical simulations can provide in-depth understanding of the seat design
without incurring prototype manufacturing and experimental test costs. Further, with simulations
one can explore seat design avoiding the uncertainties of experimental errors.
The three widely used numerical simulation methods for prediction of pressure at the
occupant-seat interface are: a) lumped parameter [17] b) multibody approach [19] and c)
distributed mass models [9, 10, 12, 15, 20]. The lumped parameter models represent the occupant
2
seat structure by either single or multi degree of freedom (DOF) systems with lumped masses
coupled via springs and dampers. The multibody dynamic models consist of interconnected rigid
or deformable bodies [21]. Few studies have over the years used the lumped parameter and
multibody approaches to simulate pressure distribution at the seated human occupant system
interface [17, 19]. The disadvantage of a lumped mass and multibody approach is that it does not
take into account the geometry of the different masses in the model. Since the geometry is not
representative of the actual physical system, the contact area cannot be modeled accurately and
consequently the contact pressure. The distributed mass approach implemented via finite element
method for seat design, which includes the human body, has gained popularity in recent years [9,
10, 12, 15, 20] due to availability of low cost, high processing computational resources. Only a
few studies, however, explained the desirable seat design features using this approach, namely, the
seat geometry and properties of the polyurethane foam cushion.
A well-designed seat can help alleviate health issues for occupant’s, prevent accidents and
also can be a marketing point for vehicle manufacturers. This served as the primary motivation for
this dissertation research to build a design tool/process for gaining insight into the vehicle seat
design and to permit analysis of pressure distribution at human body seat interface that will
facilitate in creating essential design guidelines of a seat in a cost effective manner to enhance
comfort.
1.2 Research objective
The objective of this dissertation research is to develop a design tool to seek guidance in
reducing the pressure peaks at the interface of the human occupant and seat cushion so as to
enhance comfort. To this end, the specific goals in this thesis can be summarized as follows:
3
- Development and validation of a polyurethane foam compression test finite element (FE)
model using the explicit (FE) simulations demonstrating foam material modeling;
- Development of FE interaction model of the human body and seat cushion to measure
pressure at the seat cushion-occupant interface and examine the model validity;
- Investigate the effects of seat cushion with variable density foam layers, cushion and wing
angle, cushion thickness on the pressure peaks, contact area and mean pressure at the
occupant-seat interface and propose design guidelines for different body masses (5th, 50th
and 95th percentile)
1.3 Organization of the thesis
In chapter 2, the relevant literature is reviewed and the significance of this research will
be presented and discussed. In chapter 3, a polyurethane foam compression test FE model is
developed and validated using the reported test data. Further, a seat cushion and human occupant
FE interaction model is developed, to measure the interface pressure and contact area. The model
validity is also demonstrated using the reported data. In chapter 4, performance of the seat cushion
with variable density polyurethane foam layers under static seating conditions is assessed for 5th,
percentile female, 50th and 95th percentile human male finite element seat models. A parametric
study is further conducted by varying the wing and cushion angle and its position with respect to
the human occupant to observe the effects of variations on the peak and mean contact pressures
and contact area distribution. The effects of variations in seat cushion thickness on the peak and
mean contact pressure and contact area are also evaluated. Finally, chapter 5 summarizes the
conclusions of the study and provides recommendations for future work in generating seat design
guidelines via numerical simulations.
4
Chapter 2
BACKGROUND AND SIGNIFICANCE
The sensation of sitting comfort is related to various seat design factors, support
parameters, vehicle environment and anthropometry related factors in a highly complex manner.
The effect of these factors are generally studied considering static and dynamic comfort [8, 22-
24]. Static comfort relates to occupant’s perception of comfort in a static environment. It provides
valuable insight into the body weight distribution of the seat, occupant posture and support
properties of the seat such as backrest, seat pan, seat cushion and arm rests [8, 22]. The foam
thickness and hardness, seat geometry and support properties are known to be important seat
design features in view of occupant comfort [4, 5, 25]. The dynamic comfort relates to the effect
of vehicles dynamic environment such as vibration and noise on sensation of comfort. The
dynamic muscular loads under prolonged exposure to vehicle vibration in the 0.5 to 80 Hz
frequency range has been associated with fatigue, annoyance and spine and supporting structures
injuries [26]. Both the static and dynamic comforts are strongly linked to contact properties of the
seat while the static comfort is generally more significant in automobiles where noise and vibration
levels are relatively low.
Since the perception of seating comfort is highly subjective, a generally accepted
definition of comfort does not yet exist. According to De Looze et al. [8], comfort is a subjectively
defined reaction to the particular environment, and is affected by individual anthropometry. The
perception of comfort in a particular environment is merely a lack of discomfort, and is measured
by subjective ratings and objective methods [8]. The subjective assessments involve quantification
of individual’s feel of comfort level for a specific seat design and environment. These, invariably,
yield wide variations in assessments and are prone to human reporting biases. In automotive
5
seating, subjective evaluations are generally conducted to assess relative comfort performance of
a group of seat designs, which involve repetitive field trials [23, 27]. Large studies reported
subjective evaluations, invariably, show variability due to differences in occupant’s
anthropometry, individual preferences, seat geometry and resilient properties, subjective reporting
biases, environment and amount of time-spent sitting.
There a need to evaluate comfort from an objective point of view, hence a number of
objective measures have been proposed to evaluate comfort in a more reliable manner. These
generally involve measurements over short duration with fewer participants and are less prone to
measurement errors or subjective reporting biases. The objective measures based on occupant-seat
interface pressure distribution, electromyography (EMG) and posture analysis have been proposed
to assess comfort performance of seats [1, 4, 28]. The objective measures of comfort are
established from their correlations with the subjective data [27]. For instance, the measures related
to posture analysis are generated with a goal to correlate trunk flexion, back posture and lumbar
spinal angles with discomfort [28]. Similarly, high muscle fatigue and increase in back and muscle
activity measured through EMG has been associated with feeling of discomfort [29]. Both the
EMG and posture analysis, however, have shown poor correlations with subjective comfort, and
are not statistically significant. The measures based occupant-seat contact pressure, on the other
hand, have shown better correlation with subjective ratings of comfort [8]. These measures have
shown that higher localized pressure in the vicinity of ischial tuberosities yields greater sensation
of discomfort, while localized pressure near the soft thigh tissues could restrict blood flow to the
lower extremities resulting in discomfort.
The occupant-seat contact pressure distribution is strongly dependent upon several
occupant and seat design related factors, such as seat geometry, resilience of the polyurethane
6
foam cushion and backrest, cushion contours, and body weight and stature. Definite design
guidelines for seating comfort, however, do not yet exist due to highly complex and coupled effects
of these factors. The contact pressure distribution under the ischial tuberosities could be varied
substantially by introducing appropriate seat contours and cushions with non-uniform stiffness
properties. The studies reporting objective seating comfort assessments via contact pressure
distributions are critically reviewed in this chapter to build essential knowledge on the
measurement and analysis methods, and the roles of various seat design factors.
2.1 Review of Relevant Literature
2.1.1 Objective Measures of Comfort Assessment
Objective measures are quantitative assessments obtained from experiments that can
predict comfort among the reported measures. The body seat contact pressure distribution is the
most commonly used objective measure reported in the literature [8, 30, 31]. In a dynamic
environment, the RMS acceleration caused by the vibration of the seat-occupant interface has also
been widely used to quantify the dynamic nature of comfort [32]. Studies reporting contact
pressure generally emphasize the association of discomfort accompanied with high-localized
pressure at the occupant-seat interface. Clinical trials of the human–seat interface pressure
distribution have been conducted in elderly wheelchair users with an intent to provide relief from
the pressure ulcers. Brienza et al. [33] showed that the risk of developing pressure sores was
significantly higher when the peak contact pressure exceeded 7.99 kPa. More recent studies have
thus focused on understanding the mechanisms relating peak pressures with various
anthropomorphic and seat features [4, 5, 11, 34]. Continued efforts are evident in establishing
correlations between the contact pressure measures and the subjective data in order to derive

7
definite design guidelines for seats.
Gross et al. [35] investigated correlations between the weight distribution data for both the
seat-pan and the backrest to assess the subjective comfort perception for different automotive seats.
The study concluded that the body weight distribution pattern could help predict the seat comfort.
It was shown that an economy car seat supports 71.3% of the body weight in the ischial tuberosities
(IT) region, which was substantially lower (51-53%) for the region in sport and luxury car seat. A
number of studies have experimentally measured body-seat contact pressure distributions on
different seats. These are summarized in Table 2.1.
Frusti et al. [36], investigated correlations of objective interface pressure data with the
subjective comfort data obtained for a mid-sized car seat using 150 subjects. Subjective data
focused on individual’s comfort sensation over a number of predetermined zones of the seat
surface. They showed that the tuberosities support 58-64% and thighs support 21-28% of the total
seat pan load. The subjective data also suggested that back rests supporting 68%, 25% and 6% of
the back force in the lower, middle and upper portions respectively are preferred.

8
Table 2.1: Studies reporting occupant-seat pressure distributions and their correlations with comfort/discomfort
Brief Descriptions Study design Conclusion Naseri [31] Assessment of static and dynamic comfort assessment for a seat cushion with multiple air bladders
1 seat, 10 male subjects, 10 different inflation pressure combinations
Good correlation seen between pressure under the ischial tuberosities and feeling of comfort *Comments: sources of error - subjective reporting biases and experimental measurements
Porter et al. [37] Determine usefulness of pressure distribution data for prediction of discomfort
3 seats, 8 males and 10 female subjects No correlation between interface pressure and reported discomfort *Comments: sources of error - subjective reporting biases and experimental measurements
Wu et al. [24] Under dynamic conditions, contact pressure and forces are measured under vertical vibration
1 soft seat, 6 subjects, Results show maximum variation in pressure under the tuberosities happens under resonant conditions. *Comments: sources of error - experimental measurements
Jin et al. [7] Influence of occupant seating posture and its relationship with interface pressure variables
8 subjects, 1 seat design Good correlations between the pressure and subjective ratings *Comments: sources of error - subjective reporting biases and experimental measurements
Kyung et al. [11] Associations of subjective ratings and occupant interface pressure
27 participants, 2 seat designs interface pressure correlated better with comfort ratings compared to discomfort *Comments: sources of error - subjective reporting biases and experimental measurements
Ebe et al. [4] Relationships between occupant physical characteristics and static comfort
4 seat cushion designs, 12 male subjects with mean weight of 69.3 kg
Measurements with lower total pressure under the ischial tuberosities was rated as more comfortable compared to higher total pressure *Comments: sources of error - subjective reporting biases and experimental measurements
Gyi et al. [34] Investigate the effectiveness of interface pressure measurements to measure discomfort
Two experiments. Experiment 1: 7 male subjects and 7 female subjects, 7 seat designs. Experiment 2: 6 males and 6 females, 1 seat design
Interface pressure results do not provide a clear relationship between comfort and discomfort *Comments: sources of error - subjective reporting biases and experimental measurements
Marca et al. [10] Static pressure measurements recorded via experiments and simulation
1 seat design, 6 male volunteers Peak pressure slightly over estimated in simulation *Comments: sources of error - experimental measurements
*- comments by kabir Krishan
9
Reported studies have also shown that nearly uniform distribution of contact pressure on
the seat surface, other than the IT region, could yield improved sensation of comfort [7, 22].
Similar findings have also been reported for the backrest comfort [7]. Owing to the strong
dependence of the contact pressure on the human anthropometry, a seat design that could yield
uniform pressure distribution continues to be a daunting task.
2.1.2 Relationship of Pressure with contact properties
The distribution of body seat interface pressure is directly influenced by contact properties
of the seat namely, the seating dimensions, geometry, and stiffness of the seating material.
Automotive seats utilize the polyurethane foams (PUF), in the cushions and back respectively,
which are lightweight and hyperelastic in nature. The mechanical properties of different PUFs
have been widely investigated for their relationships with comfort performance [25, 38, 39].
The peak and mean values of contact pressure are directly affected by the effective contact
area, which is further dependent on mechanical properties of the seat material and seat geometry,
apart from occupant anthropometry. Both the static and dynamic comfort performances of the seat
are thus affected in a highly nonlinear manner by the occupant’s weight, stiffness of cushion
material and skin, thickness of cushion, deflection and rate of loading/strain rate of the material
[5, 25]. PUF seat cushions are industry standard due to many factors namely, flexibility and
variable stiffness to adapt to humans buttock shape, lightweight, rugged and low cost. Ashby et al.
[40] proposed an analytical model that describes the hyperelastic response of the PUF. The study
considered PUF cell structure by its dominant bending deflection under the application of a load.
A unit foam cell model under a compressive load is shown in Figure 2.1, which is initially in the
state of linear elastic bending (zone 1) until the plastic hinges start to buckle the structure (zone 2)

10
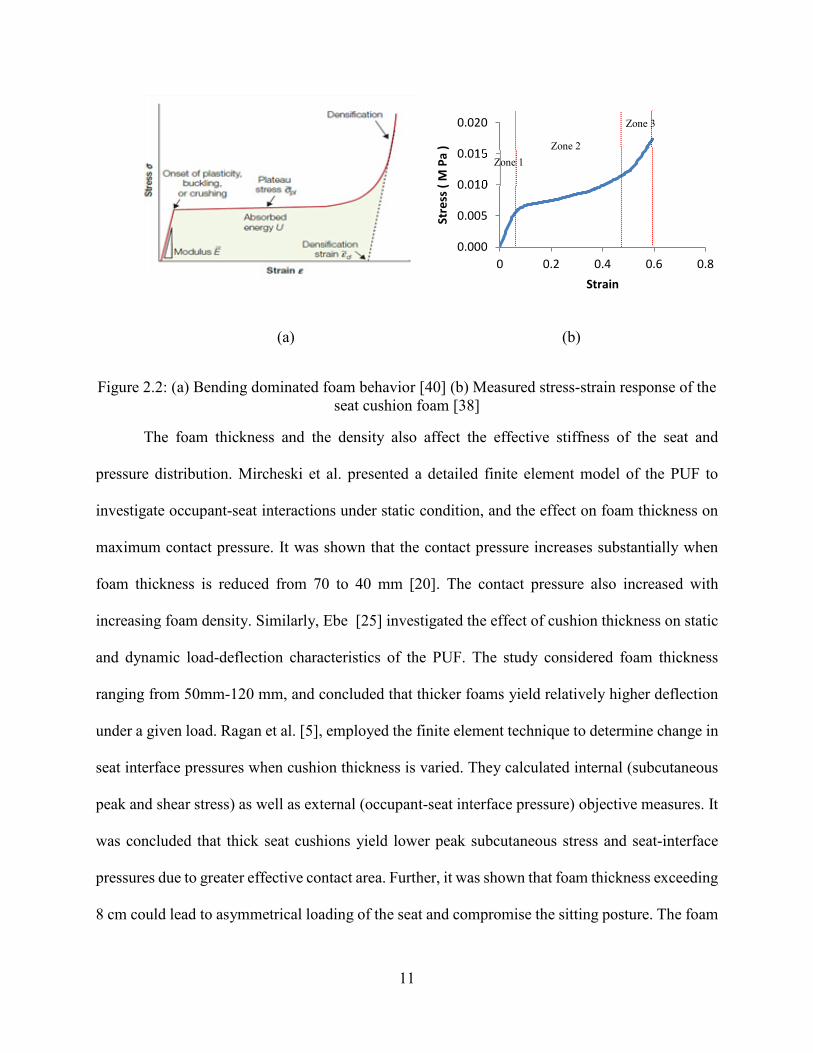
leading to the collapse of the cell walls (zone 3). The proposed structural arrangement and the
model resulted in stress-strain responses observed via testing on a sample of polyurethane foam
material (Figure 2.2 (b)), similar to those measured on a PUF sample, as seen in Figure 2.2 [40]
[38] .
Figure 2.1: Foam cell model [40]
The peak contact pressures measured in an automotive seat may range from 8 kPa to 30
kPa which typically occur in zones 1, and 2 (see Figure 2.2) [9, 13, 34]. For a 5th percentile human
(standing body mass (SBM) = 50 kg), the stress-strain response occurs primarily in zones 1 and 2.
Heavier subjects within the 50th (SBM=78.4 kg) and 95th percentile human male (SBM=100 kg)
population exhibit responses in zones 2 and 3. Increase in the seat load leads to prompt escalation
in the stiffness of the foam and thus higher stresses, referred to as bottoming. Hysteresis of the
PUF material and the airflow in the open cell structure contributes to the damping properties of
the seat, which further depends upon the seated body weight [31]. The PUF material and thickness
are thus chosen to yield sufficient deflection under lighter subjects, and sufficiently high stiffness
to avoid bottoming under higher weight occupant’s.
Zone 1 Zone 2 Zone 3
11
(a) (b)
Figure 2.2: (a) Bending dominated foam behavior [40] (b) Measured stress-strain response of the seat cushion foam [38]
The foam thickness and the density also affect the effective stiffness of the seat and
pressure distribution. Mircheski et al. presented a detailed finite element model of the PUF to
investigate occupant-seat interactions under static condition, and the effect on foam thickness on
maximum contact pressure. It was shown that the contact pressure increases substantially when
foam thickness is reduced from 70 to 40 mm [20]. The contact pressure also increased with
increasing foam density. Similarly, Ebe [25] investigated the effect of cushion thickness on static
and dynamic load-deflection characteristics of the PUF. The study considered foam thickness
ranging from 50mm-120 mm, and concluded that thicker foams yield relatively higher deflection
under a given load. Ragan et al. [5], employed the finite element technique to determine change in
seat interface pressures when cushion thickness is varied. They calculated internal (subcutaneous
peak and shear stress) as well as external (occupant-seat interface pressure) objective measures. It
was concluded that thick seat cushions yield lower peak subcutaneous stress and seat-interface
pressures due to greater effective contact area. Further, it was shown that foam thickness exceeding
8 cm could lead to asymmetrical loading of the seat and compromise the sitting posture. The foam
0.000
0.005
0.010
0.015
0.020
0 0.2 0.4 0.6 0.8
Stre
ss (
M P
a )
Strain
Zone 2 Zone 1
Zone 3
12
thickness and density also affect the static and dynamic stiffness of the seat and its damping
property. Seat cushions with moderate hardness and high thickness thus yield relatively lower
vibration transmissibility at low frequencies compared to that of stiffness in thin cushions [39].
Through experiments and FE modelling, Verver et al. [13] showed that the contact pressure
distribution at the occupant-seat interface is dependent upon stiffness property of the human flesh
apart from the seat cushion properties. It was concluded that the peak contact pressure tends to
substantially decrease when seated on a soft cushion in comparison to a rigid seat. Similar findings,
were also reported in earlier experimental studies by Wu et al.[24]. The average contact pressure
on a soft seat decreases due to an increase in the contact area, and further increasing or decreasing
the stiffness may yield higher maximum pressure in the local zones under the tuberosity. Wu et al.
[24] measured the contact pressure distribution at the human subject-seat interface and the
effective contact area on a rigid and an viscoelastic seat while exposed to vertical vibration. They
concluded that the human subject-seat interface contact pressure is more evenly distributed on an
elastic seat than on a rigid seat. This was attributed to greater contact area on an elastic seat. The
peak contact pressure on an elastic seat tends to be significantly lower when compared to a rigid
seat. Furthermore, lower contact pressure was noted for a soft flexible seat as it causes relative
motion across the legs, which is absent with a rigid seat [41].
2.1.3 Measurement of Interface Pressure and Contact Area
High significance of seat contact pressure in view of seating comfort in the automotive
sector and pressure ulcer prevention in the healthcare sector, have led to advances in human seat
contact sensing technologies. The contemporary pressure measurement technologies that have
been employed in investigations related to comfort/discomfort assessment are pneumatic, electro-
pneumatic and thin-film electronic (capacitive, resistive and strain gauges). Among these thin film
13
electronic sensing, is most widely reported in the literature [9, 10, 12, 13, 20, 31, 32]. The
pneumatic pressure sensing technology consist of air cavities and sensors connected to a pressured
reservoir via a control valve to permit the flow of air to/from the reservoir to the cavities/sensors
[42]. The electro-pneumatic sensors make use of electrical contacts within the air cavities/sensors.
The pressure required to inflate the air cavity is increased until the electrical contact on the faces
of the cavity are broken. The pressure required to break the contact is the interface pressure
recorded by the device [43].
The thin and flexible pressure sensors are the most commonly used among the electronic
sensors. The two types of thin and flexible pressure sensors are resistive and capacitive. The
resistive technology consists of a rigid and flexible substrate with each substrate covered by a thin
electrical conductor. On the application of force, the flexible substrate which, is suspended over
the rigid substrate comes in contact with it generating a signal. The capacitive sensors consist of
a membrane sandwiched between two plates. On application of pressure the membrane deforms
resulting in an electric signal [44]. These pressure sensors can measure the contact pressure as well
as force distributions over the elastic surface. These sensors generally have single sensor for
mapping pressure at the occupant-seat interface. The sensors are constructed typically in a 3 layer
configuration, the outer layers is made from a polymer material which is flexible and is covered
with conductive channels and the inner layer has the force sensing material or a non-conductive
elastomer [45].
A number of analytical/numerical models have been reported for predicting occupant-seat
interface pressures under static and dynamic seating conditions. These may be grouped in three
broad categories on the basis of the modelling approach: lumped [17] b) multibody approach [19]
and c) distributed mass [9, 10, 12, 15, 20]. The lumped parameter and multibody models however,
14
do not take into account the seat geometry and its distributed static and dynamic properties in the
model. The contact area and thus contact pressure cannot be accurately predicted from lumped
parameter and the multibody modeling approaches. The distributed mass approach is implemented
via finite element method for seat design, which includes the human body models, are increasingly
being developed for predicting body-seat contact properties considering the seat material
properties, seat geometry and the occupant anthropometry.
The interaction between the seated occupant and seat has been modeled as a nonlinear
dynamic system employing the finite element method [9, 13, 20, 46]. The overall dynamic contact
force 𝑅𝑅(𝑡𝑡)is evaluated from the inertia force 𝐹𝐹𝑖𝑖(𝑡𝑡) and damping force 𝐹𝐹𝑑𝑑(𝑡𝑡) and elastic force
𝐹𝐹𝑒𝑒(𝑡𝑡) due to seat cushion such that:
𝐹𝐹𝑖𝑖(𝑡𝑡) + 𝐹𝐹𝑑𝑑(𝑡𝑡) + 𝐹𝐹𝑒𝑒(𝑡𝑡) = 𝑅𝑅(𝑡𝑡) (2.1)
The solutions of nonlinear dynamic equations at discrete time intervals are obtained via
explicit and implicit direct integration methods [47]. In the implicit method, nodal displacements
are determined, when stiffness matrix is calculated and applied to the non-equilibrium forces. The
stiffness matrix needs to be reformulated often in order to achieve convergence, which requires
significant computational effort. In the explicit method, the external force is divided by the nodal
mass to compute nodal accelerations. The solution is advanced by integrating this acceleration in
time at discrete time steps. The explicit method is more suited since it permits analysis of a highly
nonlinear system without the need to calculate the stiffness matrix repeatedly.
During an explicit finite element simulation, the mass and momentum is conserved for all
elements of the model at each time step. In Lagrange formulations, the finite element mesh deforms

15
with the material, hence mass conservation is satisfied [48, 49] . The density at each time step can
be calculated from the mass and volume at that time step, such that:
𝜌𝜌0𝑉𝑉0𝑉𝑉
= 𝑚𝑚𝑉𝑉
= 𝜌𝜌 (2.2)
Where, 𝑚𝑚 is the mass,𝑉𝑉 is the volume,𝑉𝑉𝑜𝑜 is the initial volume, 𝜌𝜌 is the density, 𝜌𝜌0 is the initial
density. The conservation of momentum (equations 2.3 to 2.5) of the elements relates the
acceleration to the stress tensor 𝜎𝜎𝑖𝑖𝑖𝑖 via partial differential equations [48, 49].The energy (equation
2.6) of the system is monitored while its conservation is not enforced in commercially available
explicit solvers like ANSYS®, LS-DYNA®, ABAQUS®, PAM-CRASH and RADIOSS® [48].
𝜌𝜌��𝑥 = 𝑏𝑏𝑥𝑥 + 𝜕𝜕𝜎𝜎𝑥𝑥𝑥𝑥𝜕𝜕𝑥𝑥
+ 𝜕𝜕𝜎𝜎𝑥𝑥𝑥𝑥𝜕𝜕𝜕𝜕
+ 𝜕𝜕𝜎𝜎𝑥𝑥𝑥𝑥𝜕𝜕𝜕𝜕
(2.3)
𝜌𝜌��𝑦 = 𝑏𝑏𝜕𝜕 + 𝜕𝜕𝜎𝜎𝑥𝑥𝑥𝑥𝜕𝜕𝑥𝑥
+ 𝜕𝜕𝜎𝜎𝑥𝑥𝑥𝑥𝜕𝜕𝜕𝜕
+ 𝜕𝜕𝜎𝜎𝑥𝑥𝑥𝑥𝜕𝜕𝜕𝜕
(2.4)
𝜌𝜌��𝑧 = 𝑏𝑏𝜕𝜕 + 𝜕𝜕𝜎𝜎𝑥𝑥𝑥𝑥𝜕𝜕𝑥𝑥
+ 𝜕𝜕𝜎𝜎𝑥𝑥𝑥𝑥𝜕𝜕𝜕𝜕
+ 𝜕𝜕𝜎𝜎𝑥𝑥𝑥𝑥𝜕𝜕𝜕𝜕
(2.5)
The conservation of energy is expressed as:
𝑒𝑒 = 1𝜌𝜌�𝜎𝜎𝑥𝑥𝑥𝑥𝜀𝜀��𝑥𝑥𝑥 + 𝜎𝜎𝜕𝜕𝜕𝜕𝜀𝜀��𝜕𝜕𝜕 + 𝜎𝜎𝜕𝜕𝜕𝜕𝜀𝜀��𝜕𝜕𝜕 + 2𝜎𝜎𝑥𝑥𝜕𝜕𝜀𝜀��𝑥𝜕𝜕 + 2𝜎𝜎𝜕𝜕𝜕𝜕𝜀𝜀��𝜕𝜕𝜕 + 2𝜎𝜎𝜕𝜕𝑥𝑥𝜀𝜀��𝜕𝑥𝑥�
(2.6)
Where, ��𝑥, ��𝑦 and ��𝑧 are the accelerations along 𝑥𝑥, 𝑦𝑦 and 𝑧𝑧 axes respectively, 𝑏𝑏𝑥𝑥, 𝑏𝑏𝜕𝜕 𝑎𝑎𝑎𝑎𝑎𝑎 𝑏𝑏𝜕𝜕 are
body accelerations in the 𝑥𝑥,𝑦𝑦,𝑎𝑎𝑎𝑎𝑎𝑎 𝑧𝑧 axes and 𝜎𝜎𝑖𝑖𝑖𝑖 and 𝜀𝜀𝑖𝑖𝑖𝑖 are components of stress and strain
tensor. The dot above the strain tensor components signifies a partial derivative.
The explicit finite element method also permits modelling of the structural details of the
human buttocks and seat cushion required to accurately predict contact area and pressure

16
distribution at the interface of the FE analogue of the human occupant and the seat cushion [50-
52].
2.1.4 Occupant-Seat Models
The analysis of contact pressure necessitates consideration of a human body model and
body weight distribution forms the minimal requirement. The coupled human body and seat forms
a nonlinear dynamic system. Specifically, the foam material of the seat cushion undergoes large
deformation resulting from hyperelastic behaviour of the foam material, which contributes to
material and geometric non-linearity. The modeling of contact constitutes another nonlinear aspect
of the interaction. The static and dynamic properties of elastic seats and thus the comfort
performance are strongly influenced by both the anatomy and viscoelastic properties of the seated
body. A few reported studies have employed lumped-parameter and multibody models of the
occupant [17, 19]. The lumped-parameter model is described by mass, stiffness and damping
elements representing the human body, while it does not represent the anatomical structures. Such
occupant-seat models have primarily been used for assessment of biodynamic responses in terms
of mechanical impedance, vibration transmissibility and apparent mass under dynamic conditions
[17].
The multibody dynamic models of the human body consist of interconnected rigid and
deformable bodies [19]. Rosen et al. [17] have developed a multi degree of freedom (MDOF)
nonlinear lumped parameter model of the seat-occupant system to describe local occupant-seat
dynamics represented by human pelvis/vibrating seat contact using a cushioning interface as
shown in Figure 2.3(a). The study employed three cushion materials of different stiffness defined
as soft, medium and hard. The study suggested that soft material should lie in the vicinity of the
ischial tuberosities, where high local contact forces were measured. The also suggested to

17
distribute the hard material on the remaining top layer, to support the pelvic structure, and medium
stiffness material in the lower cushion layer. Such a lumped parameter model is computationally
efficient and can provide estimation of the load distribution at the occupant-seat interface in an
efficient manner. This model is limited to calculated local high pressure, since the contact between
the occupant and cushion is realized by only spring-damper elements.
(a) (b)
Figure 2.3: (a) A lumped parameter MDOF occupant-seat cushion model [17] (b) Multibody dynamic occupant-seat model with viscoelastic foam [19]
Alternatively, Aziz et al. [19] have employed a planar multibody model of the occupant
to describe distributed sagittal plane contact of the body with polyurethane seat cushion. The model
shown in Figure 2.3(b) was used to predict transient response, seat pressure distributions and
effects of occupant-seat parameters such as seat geometry and occupant’s seating characteristics.
The model, however, is limited for predicting resultant forces, pressure in the central plane, and
cannot be used to predict pressure distribution, study cushion contour and wing effects. A number
of studies have employed multibody occupant models in conjunction with FE models of the seat
18
cushions. In these studies, either the buttocks or complete human- body models and the occupant
contact geometry together with elastic properties of the tissues describe the occupant.
Verver et al. [13] developed a subject specific finite element model of the human buttock
based on anthropometry of an aged subject. The model was formulated using some approximations
of the seat curvature. Good correlation was obtained between the predicted contact pressure
distribution and the experimental measurements. Tang et al. [16] developed a 2D planar buttock-
seat cushion model to predict dynamic pressure distribution in frequency range of 0-20 Hz. The
2D planer model however, is not suited for predicting peak and mean pressure, and the effective
contact area. Ragan et al. [5] proposed an occupant-seat model for predicting contact pressure in
the subcutaneous layer of the buttocks of a wheelchair occupant. The study concluded that the
pressure within the subcutaneous layer decreases with increase in cushion thickness and thereby
decrease in static stiffness. Makhsous et al. [53] developed a similar model to study pressure ulcers
among wheelchair occupant’s. While the buttock models could yield good estimates of contact
pressure, the weigh distribution on the seat cannot be accurately described.
Verver et al. [12] employed a multibody dynamic model of the seated body to study the
contact pressure and area developed in MADYMO® for a 50th percentile male subject. The
occupant model coupled with FE model of the cushion revealed good correlations with
experimental measurements in terms of pressure distribution response. Marx et al. [9] used a
similar multi-body model MADYMO® 50th percentile male subject model for prediction of static
pressure distribution at the occupant-seat interface. The model results were in good agreement with
the experimental results. Such models, however, are extremely demanding on computing resources.
The model computation time was reported as one to two days on a workstation CPU [9]. Both the
hybrid multibody dynamic FE model (17.2 kPa) and experimental measurements (15.9-26.6 kPa)

19
revealed high-pressure concentrations under the ITs. The reported model, however, do not consider
load sharing between the seat cushion and the back, which is strongly related to the seat geometry
and the sitting posture.
In recent years, efforts have also been made to incorporate some anthropometric
dimensions in the occupant models. Mircheski et al. [20] discretized the human body builder used
for ergonomic analysis available in the CATIA® platform. In a recent study, Kim et al. [54]
performed scans of human volunteers to develop finite element models for north American
population ranging from 5th female percentile to 95th males percentile. The models represented
body masses in the 45-54.3 kg range for 5th percentile females, 81.5-89.9 kg for 50th percentile
males and 109.8-125.9 for 95th percentile males. These models, however, have not yet been
implemented for objective measures of comfort. Moreover, hybrid III family of anthropomorphic
manikins are industry standards for crash analysis and describe the occupant shape and weight
distribution for the male and female populations. No attempt has been made to apply these models
for analysis of occupant-seat response characteristics. Grujcic et al. [15] developed a combined
occupant body shell [55] and skeletal model from anybody software platform, where they report
peak pressure under the tuberosities as 30 kPa.
In order to observe the effect of impact/crash on the human occupant in automotive
crashworthiness, mechanical analogues of the human body were developed. These replicas of the
human body are also referred as anthropomorphic test devices (ATD’s). FE analogues of the
physical hybrid III models have been developed by National crash analysis center (NCAC) and
LSTC (Livermore software technology corporation)[50]. In order for the ATD’s to satisfy
requirements for crash analysis the physical ATD’s should have the following characteristics [56]:
representative anthropometry, bio fidelity, measurement capability, repeatability, durability,

20
sensitivity and maintainability. These hybrid III ATD’s have good bio fidelity and have been
extensively used in industry and research community for assessment of impact on human body.
Both the automotive manufacturers as well as developers of finite element simulation software
have developed the FE analogues of the physical ATD’s. Toyota developed the THUMS finite
element ATD [52]. On the other hand, LSTC developed many finite element ATD’s, which are
freely available for use with the simulation code LS-DYNA [50]. The Hybrid III family of frontal
crash finite element manikin models have been validated in various studies conducted at NASA,
LSTC, NCAC and others [50, 51, 57-59]. Such FE-ATD models represent accurate shape and
weight distribution of the seated body, and could be effectively applied to seat models for
predicting contact area and pressure distribution.
2.1.5 Numerical modeling of polyurethane foam
Organic units joined with urethane links form the polyurethane polymer [60]. The
polyurethane foam material is widely used in industry for seating comfort, injury protection,
packaging and numerous other applications, which take advantage of the low cost foam materials
ability to regain initial shape after application of high load. Polyurethane foam (PUF) from the
viewpoint of a material scientist is any material that is created by an expansion process of a
polyurethane base material, while for the numerical methods programmer, it is a foam-like
material with a negligible lateral deformation under a uniaxial compressive load as seen in Figure
2.4 [38, 61, 62].
As quoted from Vries [38] “The macroscopic constitutive behavior of polyurethane foams
is determined by a subtle interplay of (a) the intrinsic constitutive behavior of the polyurethane
material and (b) the complex microstructure”. The intrinsic characteristics of the foam are a result
of deformation behavior of the cells under application of load and flow of air between them.
21
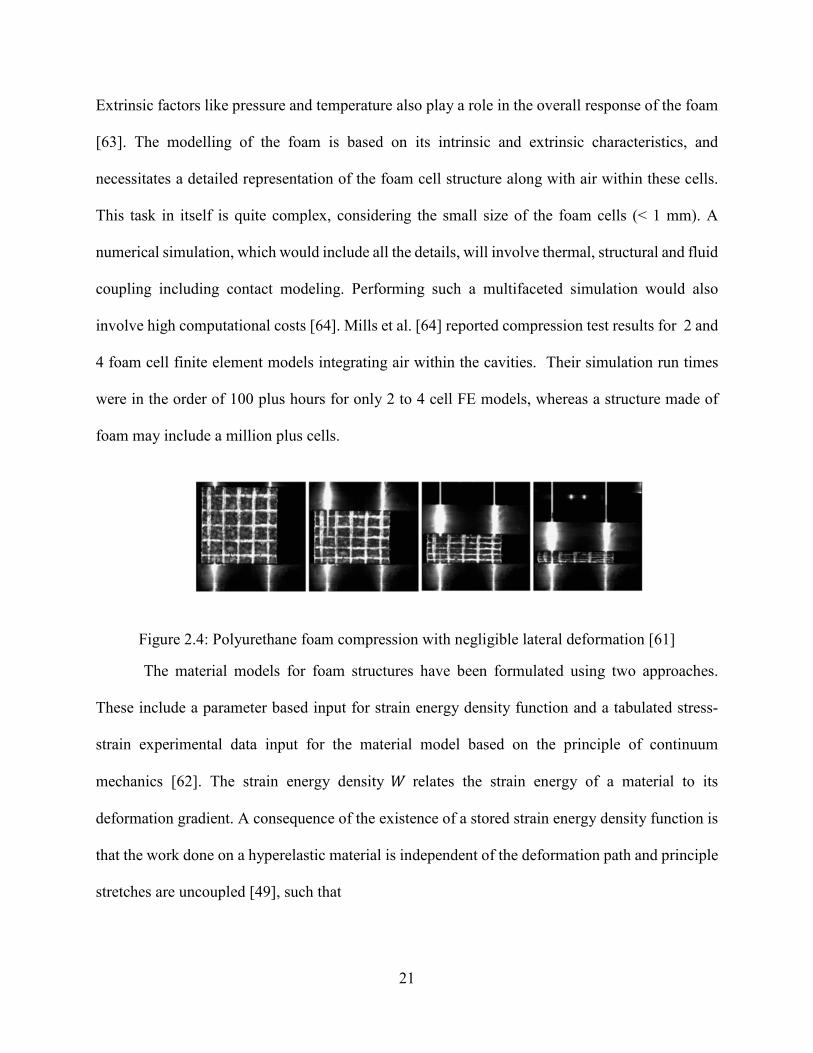
Extrinsic factors like pressure and temperature also play a role in the overall response of the foam
[63]. The modelling of the foam is based on its intrinsic and extrinsic characteristics, and
necessitates a detailed representation of the foam cell structure along with air within these cells.
This task in itself is quite complex, considering the small size of the foam cells (< 1 mm). A
numerical simulation, which would include all the details, will involve thermal, structural and fluid
coupling including contact modeling. Performing such a multifaceted simulation would also
involve high computational costs [64]. Mills et al. [64] reported compression test results for 2 and
4 foam cell finite element models integrating air within the cavities. Their simulation run times
were in the order of 100 plus hours for only 2 to 4 cell FE models, whereas a structure made of
foam may include a million plus cells.
Figure 2.4: Polyurethane foam compression with negligible lateral deformation [61]
The material models for foam structures have been formulated using two approaches.
These include a parameter based input for strain energy density function and a tabulated stress-
strain experimental data input for the material model based on the principle of continuum
mechanics [62]. The strain energy density 𝑊𝑊 relates the strain energy of a material to its
deformation gradient. A consequence of the existence of a stored strain energy density function is
that the work done on a hyperelastic material is independent of the deformation path and principle
stretches are uncoupled [49], such that

22
𝑊𝑊 = ∑ 𝑐𝑐𝑚𝑚
𝑚𝑚�𝜆𝜆1𝑚𝑚 + 𝜆𝜆2𝑚𝑚 + 𝜆𝜆3𝑚𝑚 − 3 + 1
𝑛𝑛(𝐽𝐽−𝑚𝑚𝑛𝑛 − 1)�𝑛𝑛
𝑚𝑚=1 (2.7)
Where, 𝜆𝜆1, 𝜆𝜆2,𝑎𝑎𝑎𝑎𝑎𝑎 𝜆𝜆3 are the principle stretches/ stretch ratios extracted from deformation
gradient, and 𝑐𝑐,𝑎𝑎𝑎𝑎𝑎𝑎 𝑚𝑚 are material constants.
A number of parameter-based models have been developed to describe the rubber and foam
materials. The most commonly used models are the Mooney-Rivlin, Ogden, Blatz-Ko, Arruda
Boyce, Yeoh and Gent models [65]. The parameter-based models require curve fitting of
experimental data onto a strain energy density based formulation using linear or nonlinear least
squares approach. Each model has variations where the number of parameters can be chosen to
define the order of each model being used. Such parametric approaches are commonly available
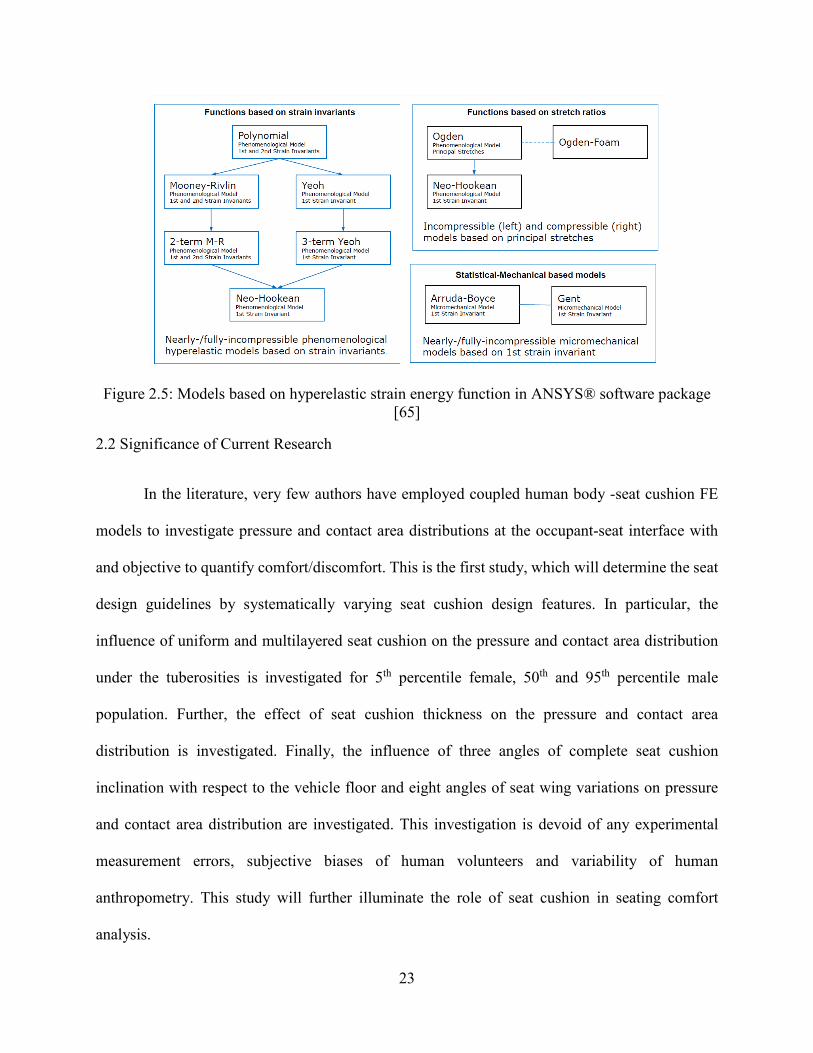
in popular software’s like ANSYS®, LS-DYNA®, ABAQUS® and RADIOSS®. Figure 2.5,
illustrates the organization of parameter phenomenological models based on strain energy density
function available in the ANSYS® platform. The relative performance of the highest parameter
version for each of the selected models is used to accurately fit the test data have also been
evaluated for foam materials as seen in Figure 2.6. The remaining parameter versions of each of
the selected models are summarized in appendix A.
The LS-DYNA software on the other hand, employs tabulated data for a few foam
materials. The tabulated stress-strain input based approach is most efficient as it interpolates the
stress based on the measured strain resulting from the deformation of the structure. This is the most
commonly used approach for modeling of polyurethane foam in seat cushions [62, 66].
23
Figure 2.5: Models based on hyperelastic strain energy function in ANSYS® software package [65]
2.2 Significance of Current Research
In the literature, very few authors have employed coupled human body -seat cushion FE
models to investigate pressure and contact area distributions at the occupant-seat interface with
and objective to quantify comfort/discomfort. This is the first study, which will determine the seat
design guidelines by systematically varying seat cushion design features. In particular, the
influence of uniform and multilayered seat cushion on the pressure and contact area distribution
under the tuberosities is investigated for 5th percentile female, 50th and 95th percentile male
population. Further, the effect of seat cushion thickness on the pressure and contact area
distribution is investigated. Finally, the influence of three angles of complete seat cushion
inclination with respect to the vehicle floor and eight angles of seat wing variations on pressure
and contact area distribution are investigated. This investigation is devoid of any experimental
measurement errors, subjective biases of human volunteers and variability of human
anthropometry. This study will further illuminate the role of seat cushion in seating comfort
analysis.

24
Figure 2.6: Comparison of stress-strain response for parameter based strain energy density formulations of polyurethane foam with a sample (62 𝑘𝑘𝑘𝑘/𝑚𝑚3) foam (a) 9 parameter Mooney
Rivlin (b) 3rd order Odgen (c) 3rd order Yeoh (d) Gent (e) Arruda-Boyce (f) Blatz-Ko
(a) (b)
(c) (d)
(e) (f)

25
Chapter 3
MODEL DEVELOPMENT AND VALIDAITON
Explicit dynamic finite element (FE) analysis is a versatile tool for analysis of structures
dynamic behaviour, which involve large displacement/strains, nonlinear material behaviour, and
contact, and impact loads [47-49, 67]. It can effectively describe hyperelastic deformation of the
seat cushion material, contact area and contact pressure distributions when coupled with a human
occupant model. The explicit dynamic FE simulation presents an alternative to experimental
investigations for understanding the human occupant seat interactions, although the accuracy of
the explicit dynamic method in predicting the response of the foam material needs to be thoroughly
assessed. The finite element occupant-seat models incorporate some assumptions and modeling
simplifications such that all components of the human occupant and seat are not exactly
represented. Many practical and economic limitations like subjective reporting biases of volunteers
during experimental investigations [34, 68], experimental measurement errors [33, 34] and high
manufacturing cost of multiple seat geometric and material prototypes hinder the development of
understanding of the occupant-seat responses through experimental investigations. The explicit
dynamic finite element method provides the freedom to create numerous seat design variations for
investigating the influence of seat design features on the pressure and contact area at the interface
of a seated occupant.
The human body is a complex system with substantial variability in its anthropometry [69].
It is clear that within the human anatomy there exist structures that bear morphological similarity,
while the size and shape of the human structure varies from one individual to another. In particular,
the body weight, shape, muscles and bones structure, and skin properties dictate distribution of
pressure and contact area at the occupant-seat interface. Large variations in such factors, pose a

26
daunting task to build subject specific-finite element model of the human occupant. A subject-
specific model however would not be efficient in seeking insight into the seating responses of the
human occupant’s. A set of models representative of a sample of the human population is thus
considered sufficient for each analysis. Frontal finite element crash test anthropomorphic test
devices (FE-ATD’s) have long been used to understand automotive crash scenarios, which are
based on 5th, 50th and 95th percentile of population [58] . The hybrid III physical models and their
FE analogues have been widely reported in the literature [50, 51, 58, 59, 70]. The correlated FE-
ATD’s offer geometric features, which are sufficient for a representative sitting, posture of the
occupant on a seat. These models could thus serve as reliable resources for investigating the
occupant-seat interactions, especially the contact pressure distribution and contact area.
In this Chapter, an occupant-seat model is formulated to study contact properties of the seat
cushion and human occupant. The model incorporates the FE model of an ATD together with FE
model of the seat cushion. The contact area and pressure distributions under static seating are
predicted via explicit dynamic finite element analysis. In section 3.1, the material model used to
simulate the response of hyperelastic polyurethane foam material is presented. For this purpose,
the MAT_57 low-density polyurethane foam material model in LS-DYNA® finite element
software is employed to solve FE model for replicating the foam compression test. Experimental
stress-strain data from a sample of polyurethane seat cushion is used as input for the MAT_57
material model assigned to the sample foam in the compression test FE model. The results from
the simulation are compared with the test data to demonstrate the validity of the explicit dynamic
FE method in accurately predicting the polyurethane foam material hyperelastic response. In
section 3.2, the selection of seat structure and its FE discretization is presented. In section 3.3, the
hybrid III finite element human body anthropomorphic test device (FE-ATD) is described along

27
with the specific FE modeling details, which make it suitable for predicting the occupant-seat
interface pressure and contact area. Finally, in section 3.4, the occupant-seat FE interaction model
(IM) is developed to compute peak and mean contact pressure and contact area at the occupant-
seat interface. The model responses are subsequently compared with data reported in the literature.
3.1 Material model of polyurethane foam
FE modeling technique is employed to evaluate deflection response of low-density
polyurethane foam materials. The approach employs the tabulated stress-strain experimental data
of the foam material as the input in addition to the Young’s modulus, density and tensile failure
stress. This minimalistic input approach helps the simulation to be computationally efficient, since
it does not require modelling of structural details of the polyurethane foam. This approach has
been widely used for simulation of seat cushion foam materials [62, 66, 71]. Moreover, the
MAT_57 material model available in LS-DYNA® platform can be conveniently applied which is
described in the following subsections.
3.1.1 Deformation Gradient and its Relation to Principle Stretches
The large deformations of the PUF cushion materials can be effectively described by the
hyperelastic foam material model (MAT_57) considering deformation gradient and its relation
with the strain. The deformation gradient F, a first order approximation of the deformation, can be
expressed as [49].
𝐹𝐹 = 𝑑𝑑𝐗𝐗𝑑𝑑𝐱𝐱
(3.1)

28
In the above relation 𝑎𝑎𝐱𝐱 defines an infinitesimal line segment (vector) in the reference
configuration of the material, and 𝑎𝑎𝐗𝐗 is the infinitesimal line segment (vector) in the deformed
configuration, such that:
𝑎𝑎𝐗𝐗 = 𝐹𝐹𝑎𝑎𝐱𝐱 (3.2)
Consider an infinitesimal volume within a reference configuration Ω0 and a deformed
configuration Ω𝑡𝑡 at an instant t, as shown in Figure 3.1. The mapping of infinitesimal volumes
from reference configuration Ω0 to deformed configuration Ω𝑡𝑡 can be written as:
Figure 3.1: Mapping of a cell volume from the reference configuration Ω0 to the deformed configuration Ω𝑡𝑡
𝑎𝑎𝑉𝑉 = (𝑎𝑎𝐱𝐱 × 𝑎𝑎𝐲𝐲) ∙ 𝑎𝑎𝐳𝐳
𝑎𝑎𝑑𝑑 = (𝐹𝐹𝑎𝑎𝐱𝐱 × 𝐹𝐹𝑎𝑎𝐲𝐲) ∙ 𝐹𝐹𝑎𝑎𝐳𝐳
𝑎𝑎𝑑𝑑 = det(𝐹𝐹)𝑎𝑎𝑉𝑉 (3.3)
Where, 𝑎𝑎V and 𝑎𝑎v are the infinitesimal volumes in the reference and deformed configurations,
respectively, 𝑎𝑎𝑒𝑒𝑡𝑡 (𝐹𝐹) is determinant of 𝐹𝐹, and det (F) > 0.
𝑎𝑎𝐱𝐱 𝑎𝑎𝐲𝐲
𝑎𝑎𝐳𝐳
𝑎𝑎𝐗𝐗
𝑎𝑎𝐘𝐘 𝑎𝑎𝐙𝐙 𝑦𝑦
𝑥𝑥
𝑧𝑧
Ω0 Ω𝑡𝑡
𝑎𝑎𝐕𝐕 𝑎𝑎𝑑𝑑

29
Polar decomposition technique helps to decompose the deformation gradient into a form,
which renders it into an eigenvalue problem. This decomposition helps to extract more information
about the nature of deformation gradient. The polar decomposition of 𝐹𝐹 can be expressed as [47]:
𝐹𝐹 = 𝑅𝑅 𝑈𝑈 = 𝑉𝑉𝑅𝑅 (3.4)
Where, 𝑅𝑅 is the rotation tensor, 𝑈𝑈 is the right stretch tensor and 𝑉𝑉 is the left stretch tensor.
Consider a two dimensional plane within the reference configuration Ω0 (Figure 3.2) and a
deformed configuration Ω𝑡𝑡 at an instant 𝑡𝑡. The effect of 𝑈𝑈 is that it stretches the material around
a point 𝑥𝑥 which lies within the reference body in the direction of eigenvectors 𝑁𝑁1𝑈𝑈,𝑁𝑁2𝑈𝑈 of 𝑈𝑈. The
effect of 𝑉𝑉 is that it stretches the material around a point 𝑥𝑥 which lies within the deformed body in
the direction of eigenvectors 𝑁𝑁1𝑉𝑉,𝑁𝑁2𝑉𝑉 of 𝑉𝑉. The Eigenvalues 𝜆𝜆1 and 𝜆𝜆2 of 𝑈𝑈 and 𝑉𝑉 are real and
identical which are also denoted as principal stretches of 𝐹𝐹 since they are extended along the
direction of eigenvectors of 𝑈𝑈 and 𝑉𝑉. In Figure 3.2, 𝑅𝑅 rotates the material around the same point
𝑥𝑥.
Figure 3.2: Physical interpretation of polar decomposition of deformation gradient
In summary, it is shown that deformation gradient, which maps volume of an undeformed
solid body to the deformed configuration, can be decomposed to determine principle stretches due
𝑁𝑁2𝑈𝑈 𝑁𝑁2𝑈𝑈 𝑁𝑁1𝑈𝑈 𝑁𝑁1𝑈𝑈
𝜆𝜆1 𝜆𝜆2
𝜆𝜆2
𝜆𝜆1
𝑁𝑁1𝑈𝑈
𝑈𝑈
𝐹𝐹 = 𝑅𝑅𝑈𝑈 𝑦𝑦 𝑥𝑥
𝑧𝑧
Ω0 Ω𝑡𝑡
𝑅𝑅 𝑁𝑁2𝑈𝑈

30
to deformation. The realization of principle stretches from the deformation gradient is necessary
to understand the MAT 57 material model implementation within the LS-DYNA software, which
is described in the next section 3.1.2.
3.1.2 MAT_57: Low density polyurethane foam material model
The low density urethane foam material model, *MAT_57, was developed at Ford Motor
Company, and Livermore software technology corporation (LSTC) [62]. The model uses tabulated
test data for the loading curve, where the nominal stresses are defined as a function of the
elongation 𝜀𝜀𝑒𝑒, which are further defined in terms of principle stretches 𝜆𝜆𝑖𝑖 = 𝐿𝐿𝑖𝑖𝐿𝐿0,𝑖𝑖
= 1 + 𝜀𝜀𝑒𝑒. The
principle stretches (𝜆𝜆𝑖𝑖) are obtained through solutions of eigenvalue problem for the left stretch
tensor 𝑉𝑉𝑖𝑖𝑖𝑖, which is further derived from a polar decomposition of the deformation gradient matrix
𝐹𝐹𝑖𝑖𝑖𝑖 [72]:
𝐹𝐹𝑖𝑖𝑖𝑖 = 𝑅𝑅𝑖𝑖𝑖𝑖𝑈𝑈𝑖𝑖𝑖𝑖 = 𝑉𝑉𝑖𝑖𝑖𝑖𝑅𝑅𝑖𝑖𝑖𝑖 (3.5)
The tensor 𝑉𝑉𝑖𝑖𝑖𝑖 is updated using the Taylors approach to ensure numerical stability [48], such that:
𝑉𝑉𝑖𝑖𝑖𝑖𝑛𝑛+1 = 𝑉𝑉𝑖𝑖𝑖𝑖𝑛𝑛 + ∆𝑡𝑡𝑉𝑉𝑖𝑖𝑖𝑖𝑛𝑛+12 (3.6)
Where 𝑎𝑎 is the cycle number and ∆𝑡𝑡 is the time step size.
After solving for principle stretches, the elongations of the material are subsequently computed
from the principle stretches for compressive deformations, the corresponding values of nominal
stresses 𝜎𝜎𝑖𝑖𝑖𝑖 are interpolated from the input stress-strain curve. For tensile elongations, the nominal
stresses are given by:
𝜎𝜎𝑖𝑖 = 𝐸𝐸𝜀𝜀𝑖𝑖 (3.7)

31
𝐸𝐸 is the Youngs modulus, 𝜀𝜀𝑖𝑖 denoted the strain and 𝜎𝜎𝑖𝑖 denotes the stress. The stresses are
subsequently transformed back to the global coordinate system for computing the nodal forces.
The appropriate material should be selected after observing the foam force vs deflection response.
[71]. The automotive seat cushion foam materials exhibit very low Poisson’s ratio, thereby
yielding relatively small transverse strain under uniaxial loading, even up to 70% compressive
longitudinal strain [38, 62]. The Poisson’s ratio of the material is thus generally neglected in the
model. Although, the model can also simulate the hysteresis behavior of the foam, the hysteresis
effect however is neglected since the study concerns the pressure and contact area distributions
under static loads. An alternative option to model foam in LS-DYNA® is MAT_083, which
additionally provides an option to model strain-rate dependent behavior, to study dynamic
performance of the seat cushion under investigation.
3.1.3 Explicit FE model of the foam material and its validation
As stated earlier, the polyurethane foam (PUF) can be modeled by extracting strains from
the deformation gradient, and the material model MAT 57, available in LS-DYNA®, could
adequately describe the foam behaviour. In order to establish that this modelling approach can
accurately simulate the foam response in an occupant-seat simulation, the first step would be to
replicate the widely used compression test, for characterizing the stress-strain response of the PUF
materials. In a foam compression test, the sample of foam is loaded in compression at a specific
strain rate.
An explicit dynamics FE model of a foam sample is developed to replicate a foam
compression test and the simulation results are compared with experimental data reported in [38]
in order to examine the model validity. The stress-strain response obtained from the foam
compression test of PUF materials, invariably exhibit highly nonlinear hyperelastic deformation
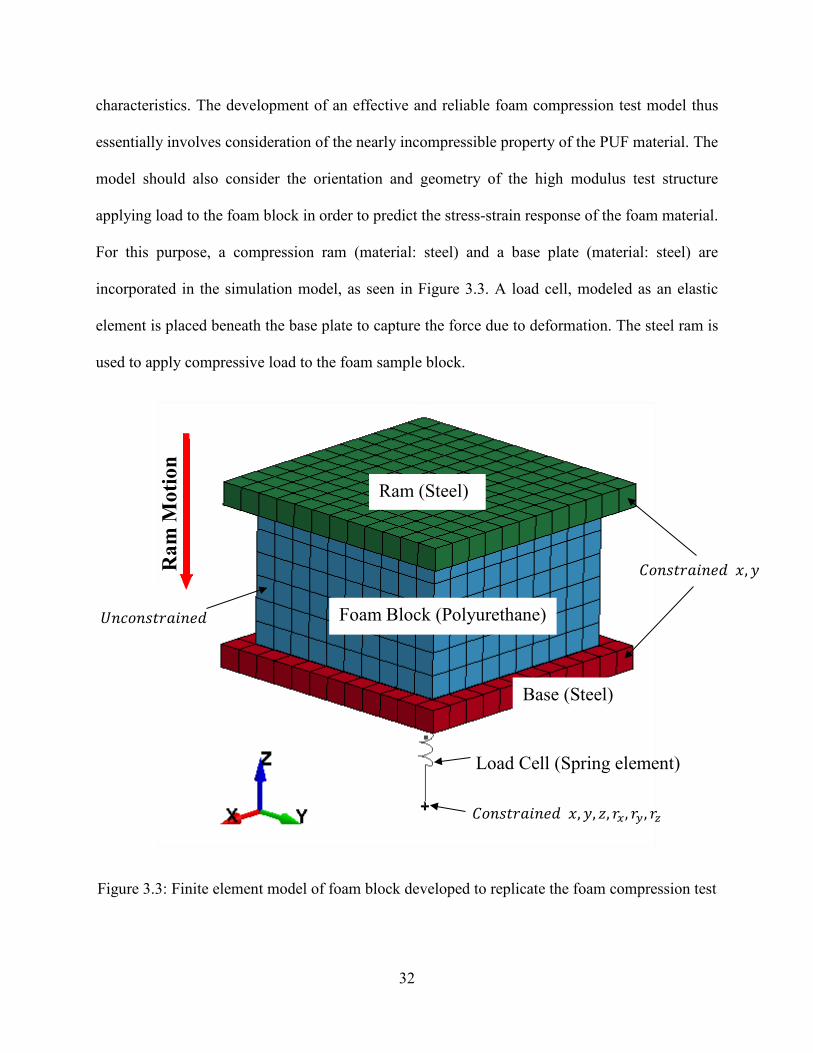
32
characteristics. The development of an effective and reliable foam compression test model thus
essentially involves consideration of the nearly incompressible property of the PUF material. The
model should also consider the orientation and geometry of the high modulus test structure
applying load to the foam block in order to predict the stress-strain response of the foam material.
For this purpose, a compression ram (material: steel) and a base plate (material: steel) are
incorporated in the simulation model, as seen in Figure 3.3. A load cell, modeled as an elastic
element is placed beneath the base plate to capture the force due to deformation. The steel ram is
used to apply compressive load to the foam sample block.
Figure 3.3: Finite element model of foam block developed to replicate the foam compression test
Foam Block (Polyurethane)
Ram (Steel)
Base (Steel)
Load Cell (Spring element)
𝐶𝐶𝐶𝐶𝑎𝑎𝐶𝐶𝑡𝑡𝐶𝐶𝑎𝑎𝐶𝐶𝑎𝑎𝑒𝑒𝑎𝑎 𝑥𝑥,𝑦𝑦, 𝑧𝑧, 𝐶𝐶𝑥𝑥, 𝐶𝐶𝜕𝜕, 𝐶𝐶𝜕𝜕
Ram
Mot
ion
𝐶𝐶𝐶𝐶𝑎𝑎𝐶𝐶𝑡𝑡𝐶𝐶𝑎𝑎𝐶𝐶𝑎𝑎𝑒𝑒𝑎𝑎 𝑥𝑥,𝑦𝑦
𝑈𝑈𝑎𝑎𝑐𝑐𝐶𝐶𝑎𝑎𝐶𝐶𝑡𝑡𝐶𝐶𝑎𝑎𝐶𝐶𝑎𝑎𝑒𝑒𝑎𝑎
33
The dimensions of the foam block are taken as 5 x 5 x 3 cm, which is identical to the foam
specimens used for the experimental data reported by Vries [38]. The foam block for the
compression test (FCTM) is modeled using essential features of the foam structure and material
properties such as volume of the foam sample, Young’s modulus, density and input stress-stress
curve, as reported by Vries [38].
3.1.3.1 Method of Analysis
The finite element model for the entire foam compression test is developed by performing
the meshing of the ram, base plate, foam block and load cell, in LSPREPOST® platform, as shown
in Figure 3.3. The ram and the base plate are composed of isotropic materials and the foam block
is assigned hyperelastic material property. The chosen materials are modeled using the 8 node
hexahedron solid elements, which are readily available within the LS-DYNA® element library.
Since, computational efficiency is an important concern for explicit FE simulations, different
element formulations available in LS-DYNA® were explored to obtain a computationally efficient
formulation. For this purpose, evaluations were performed using following elements.
• ELFORM = -2 (Fully integrated selectively reduced (S/R) solid intended for elements with
poor aspect ratio, accurate formulation)
• ELFORM = -1 (Fully integrated S/R solid intended for elements with poor aspect ratio,
efficient formulation)
• ELFORM = 1 (constant stress solid element, with 1-point integration)
• ELFORM = 2 (fully integrated S/R solid element)
Table 3.1 summarizes the computation times for the selected element formulations used for the
foam FE model. The table also lists the computing time normalized with respect to that observed

34
with the ELFORM 1 formulation. The computation times are obtained with the Intel Xeon CPU
E3-1280 V2 @ 3.6 G Hz and installed RAM of 32 GB on a 64 bit windows operating system,
while using 6 cores for each simulation. The results in the table suggest that ELFORM 1 element
formulation is most efficient compared to the other formulations. This finding has also been
reported in [48, 66, 72]. It has been further shown that this formulation can help realize rapid
convergence and stability in solving wide variety of nonlinear problems [72].
Table 3.1: Comparison of computation time observed with different element formulations
Element Formulation Time (wall clock: seconds) Normalized Computation Time ELFORM 1 106 1.0 ELFORM -1 164 1.6 ELFORM 2 154 1.5 ELFORM -2 296 2.8
Eight-node hexahedral ELFORM 1 element was subsequently implemented for large
deformation hyperelastic analysis. The ELFORM 1 is a one-point integration element, whose
major advantage is the superior computational efficiency. The use of single point integration
elements, however, necessitates the control of zero energy modes or the hourglassing modes.
In order to ensure accuracy of analysis, the stiffness of the spring element representing the
load cell is chosen to limit its deflection to minimal. The results obtained from preliminary
simulations revealed some oscillations in the force data, when the spring stiffness was chosen as
5000 N/mm, as seen in Figure 3.4. Such oscillations would cause motion of the base plate and
thereby introduce error in the foam deflection response. The stiffness value was subsequently
increased gradually until oscillations in the force response were not evident. Figure 3.4, illustrates
the force responses measured considering different stiffness values. Based on these results, the
stiffness value was chosen as 55000 N/mm, which revealed minimum oscillations.
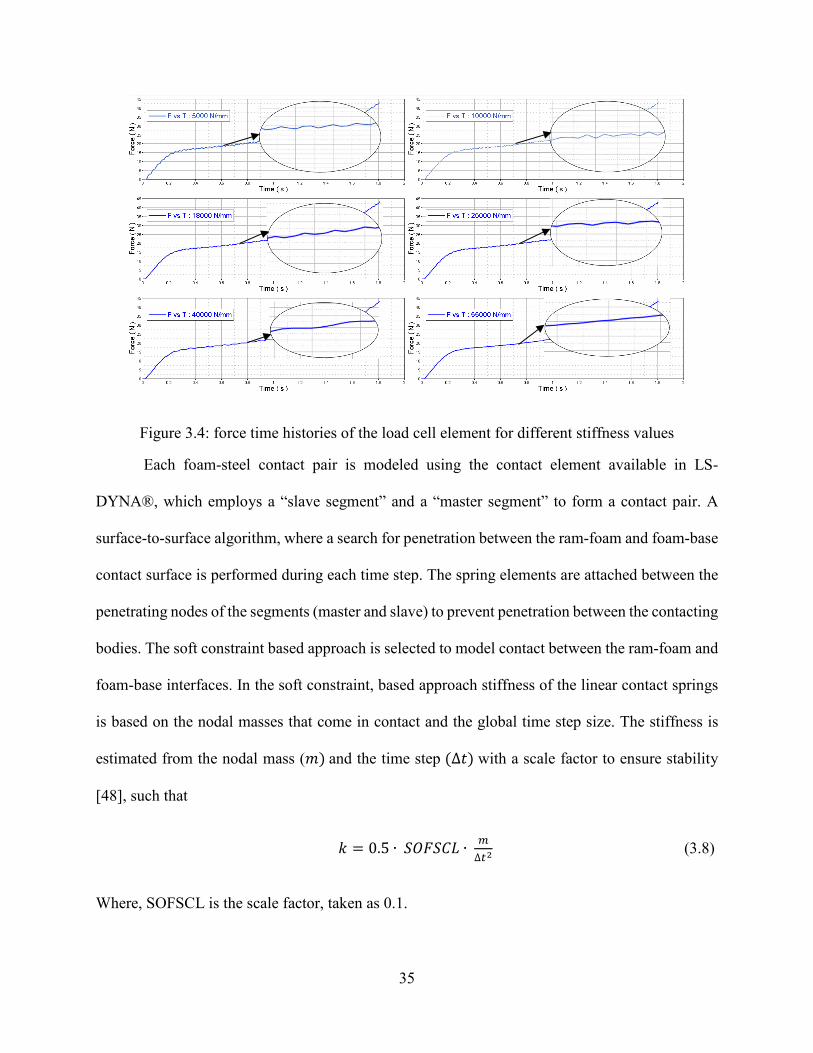
35
Figure 3.4: force time histories of the load cell element for different stiffness values
Each foam-steel contact pair is modeled using the contact element available in LS-
DYNA®, which employs a “slave segment” and a “master segment” to form a contact pair. A
surface-to-surface algorithm, where a search for penetration between the ram-foam and foam-base
contact surface is performed during each time step. The spring elements are attached between the
penetrating nodes of the segments (master and slave) to prevent penetration between the contacting
bodies. The soft constraint based approach is selected to model contact between the ram-foam and
foam-base interfaces. In the soft constraint, based approach stiffness of the linear contact springs
is based on the nodal masses that come in contact and the global time step size. The stiffness is
estimated from the nodal mass (𝑚𝑚) and the time step (∆𝑡𝑡) with a scale factor to ensure stability
[48], such that
𝑘𝑘 = 0.5 ∙ 𝑆𝑆𝑆𝑆𝐹𝐹𝑆𝑆𝐶𝐶𝑆𝑆 ∙ 𝑚𝑚∆𝑡𝑡2
(3.8)
Where, SOFSCL is the scale factor, taken as 0.1.

36
The contact spring stiffness is updated every time step. The contact segments/shells
(master/slave), which are 4-node quadrilateral shell elements, are created on the surface of the
solid hexahedron elements, representing the ram, base and the foam components of the FE model.
Furthermore, the hourglass energy is monitored during each integration step and the simulations
are accepted when the hourglass energy is below 10% of the internal energy of the system.
The FCTM simulations are performed by fixing the base of the load cell (spring element)
at its free end along the translational as well as rotational directions 𝑥𝑥,𝑦𝑦, 𝑧𝑧, 𝐶𝐶𝑥𝑥, 𝐶𝐶𝜕𝜕, 𝐶𝐶𝜕𝜕, as shown in
Figure 3.3. The base and the ram are also constrained in the 𝑥𝑥,𝑦𝑦 translation. The FE explicit
dynamics simulation is initiated as the ram is given a controlled displacement at a strain rate of 10
s-1 up to 60% strain, as seen in Figure 3.5. The maximum strain of 60% is achieved in 1.8 seconds
for the 3 cm thick test sample, at which time the simulation is terminated. The gravity effect is
neglected in the simulation. The force measured by the elastic load cell is thus entirely due to
deformation of the foam sample. The FCTM model is analyzed using the Altair® Hyperworks®
software and the results are obtained in terms of stress and strain. The solution to the FE model is
obtained by solving the discretized dynamic equations using explicit time integration. The solution
process is terminated when both mass and momentum are conserved for the FE model. During the
foam compression test simulations, the axial force in the spring is monitored along with the foam
displacement at a node in contact with the ram, the friction between the contacting surfaces is also
defined so as to constrain the foam within the FCTM domain. A coefficient of friction between
the steel and foam material was defined as 0.26 [73].

37
Figure 3.5: Controlled displacement loading curve of the ram leading to strain rate of 10 s-1 up to 60% strain
3.1.3.2 Model Solutions and Verification
Figure 3.6 presents the force deflection response of the foam specimen obtained from the
FCTM simulations. The energy was constantly monitored to ensure that no artificial energies are
added to the system, specifically the hourglass energy. Figure 3.7 illustrates variations in the
internal and hourglass energy obtained during the simulation. The results show nearly negligible
hourglass energy compared to the internal energy. The result also shows maximum force of 43.18
N corresponding to peak deflection ∆𝑧𝑧 of 18.1 mm (Figure 3.6). The peak strain energy 𝐸𝐸 can be
estimated from 𝐸𝐸 = 𝐹𝐹.∆𝑧𝑧/2, which yields strain energy of 391 N mm, comparable to the peak
internal energy of 393 N mm observed in Figure 3.7.

38
Figure 3.6: Force-displacement response obtained from the FCTM simulations
Figure 3.7: Variations in the hourglass energy and the internal energy
The model validity is further assessed on the basis of reported stress-strain responses of four
different seat cushion polyurethane foam (PUF) materials for automotive seats [38]. In the reported

39
study, the foam samples were subjected to constant strain rate compressive loading on an MTS
810 elastomer test system. The properties of the foam samples are summarized in Table 3.2, which
show density of the samples ranging from 58 to 62 kg/m3. The reported data represent the average
values measured with 4 samples of each type of foam. In experiments, each foam sample was
compressed at a strain rate of 10 s-1 up to 60% strain. No lateral expansion of the foam was
observed during the tests. The zero Poisson’s ratio assumption in MAT_57 is thus considered
valid.
Table 3.2: Mechanical properties of polyurethane foam samples [38]
Foam Name Density (ρ) [kg/m3] Young’s Modulus E [kPa] Elastic Collapse Stress (σel) [kPa] JC80 58 90.9 5.5 JC90 59 98.5 6.4
JC100 60 155.3 9.5 JC120 62 202.9 12.1
The measured stress-strain responses of the foam samples are shown in Figure 3.8. The
results suggest greater foam stiffness under very low deformation, and substantially lower stiffness
with increasing deformation. Under a very high deformation, the stiffness tends to be higher due
to collapse of the foam cells. The simulations are performed by loading the specimen at a strain
rate of 10 s-1 up to deformation of 1.8 cm, which corresponds to maximum strain of 60%. Figure
3.8 illustrates sample deformation and force response at different time instants. The mean stress at
each instant was estimated from the force response of the load-sensing element divided by the
contact area between the ram and the foam block (5 x 5 = 25 cm2). The corresponding strain is
determined using the computed displacement of the node of the foam block in contact with the
ram. The resulting stress-strain response of the foam model is compared with the reported
experimental stress-strain response in Figure 3.10. These stress-strain data will be used as input
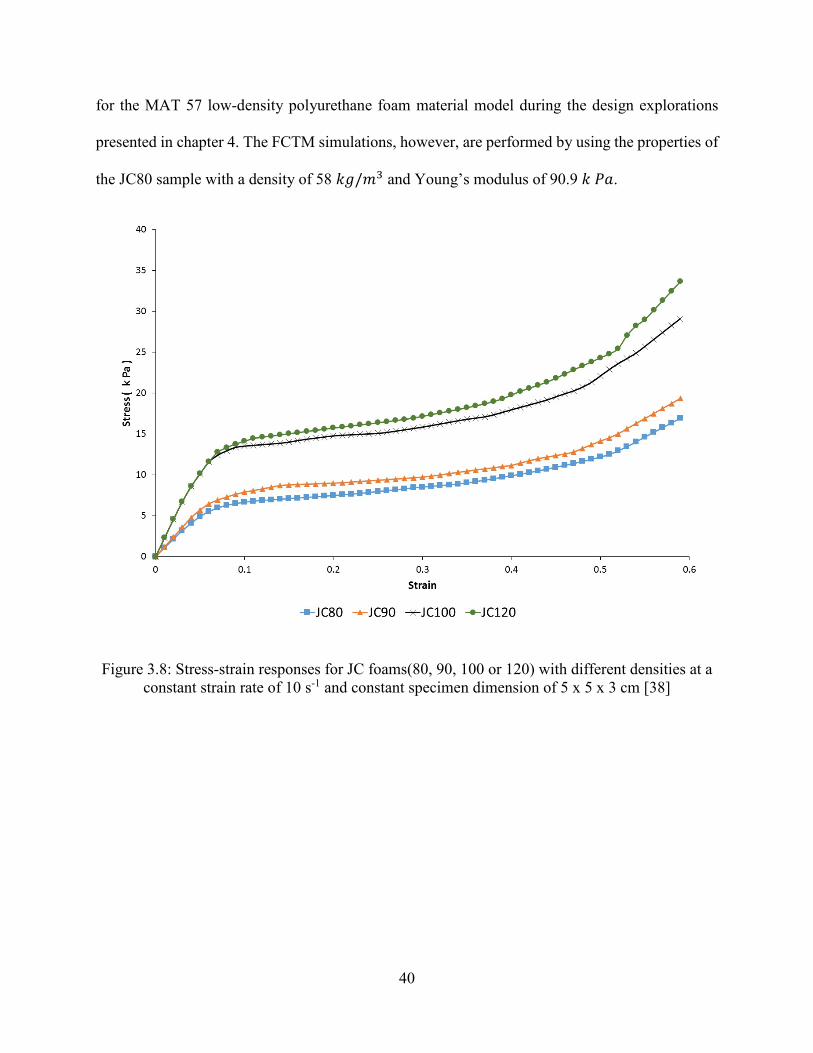
40
for the MAT 57 low-density polyurethane foam material model during the design explorations
presented in chapter 4. The FCTM simulations, however, are performed by using the properties of
the JC80 sample with a density of 58 𝑘𝑘𝑘𝑘/𝑚𝑚3 and Young’s modulus of 90.9 𝑘𝑘 𝑃𝑃𝑎𝑎.
Figure 3.8: Stress-strain responses for JC foams(80, 90, 100 or 120) with different densities at a constant strain rate of 10 s-1 and constant specimen dimension of 5 x 5 x 3 cm [38]
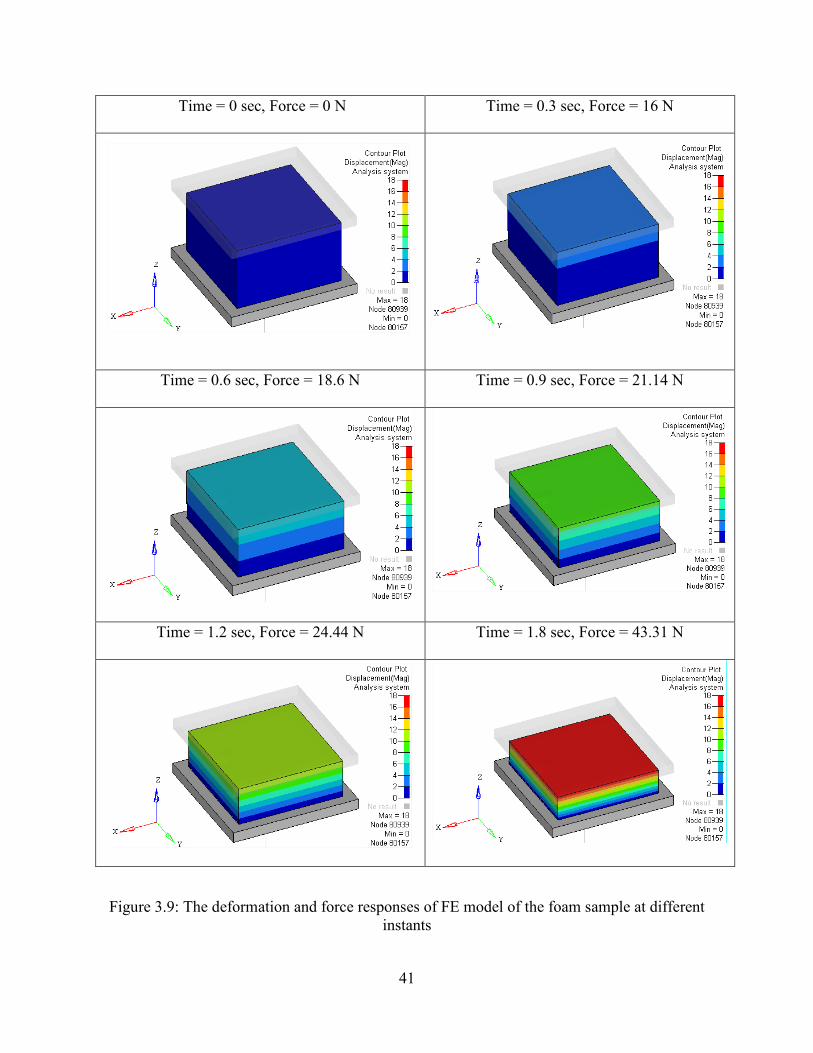
41
Time = 0 sec, Force = 0 N Time = 0.3 sec, Force = 16 N
Time = 0.6 sec, Force = 18.6 N Time = 0.9 sec, Force = 21.14 N
Time = 1.2 sec, Force = 24.44 N Time = 1.8 sec, Force = 43.31 N
Figure 3.9: The deformation and force responses of FE model of the foam sample at different instants
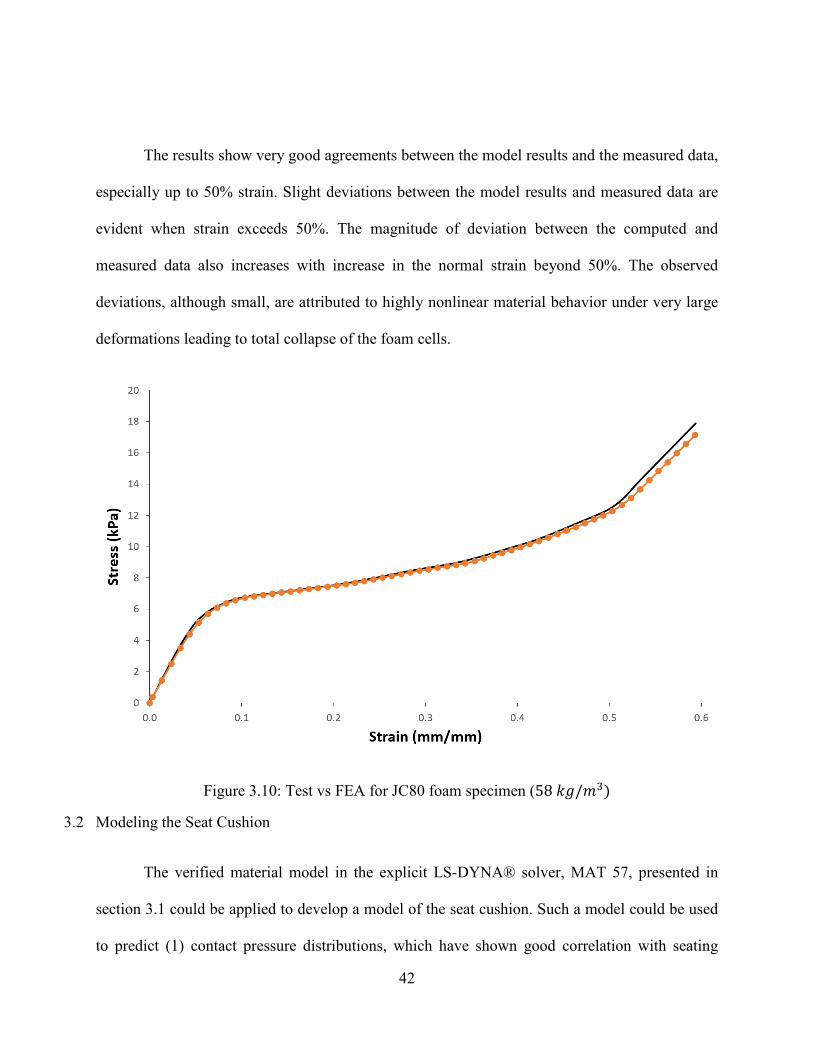
42
The results show very good agreements between the model results and the measured data,
especially up to 50% strain. Slight deviations between the model results and measured data are
evident when strain exceeds 50%. The magnitude of deviation between the computed and
measured data also increases with increase in the normal strain beyond 50%. The observed
deviations, although small, are attributed to highly nonlinear material behavior under very large
deformations leading to total collapse of the foam cells.
Figure 3.10: Test vs FEA for JC80 foam specimen (58 𝑘𝑘𝑘𝑘/𝑚𝑚3)
3.2 Modeling the Seat Cushion
The verified material model in the explicit LS-DYNA® solver, MAT 57, presented in
section 3.1 could be applied to develop a model of the seat cushion. Such a model could be used
to predict (1) contact pressure distributions, which have shown good correlation with seating
43
comfort; (2) effective contact area and deformations of the seat cushion when coupled with an
occupant model; and (3) distribution of contact forces developed at the occupant seat interface.
Apart from these, the model could serve as an important design tool for identifying optimal PUF
materials and their layout for realizing enhanced comfort performance. In this study, a FE model
of a commercial seat cushion is formulated, for which the experimental data were available. Naseri
[31], performed extensive measurements on a commercial vehicle seat to characterize the
occupant-seat contact pressure and force distributions for 5th, 50th and 95th percentile human male
subjects. This particular seat is selected for developing the FE model so as to examine its validity
using the available measured data. For this purpose, different occupant models are employed for
applications in seating dynamics, which are described in the subsequent section.
The seat cushion model is formulated with an objective to investigate the influences of
PUF material properties and seat geometry on the comfort measures, namely the force and pressure
distributions, and effective contact area. The candidate seat is pictorially shown in Figure 3.11(a).
The seat consists of a PUF cushion supported on a flat pan. The flat pan, owing to its uniform
support for the PUF material, permits more efficient study of seating contours and geometry effects
on measures of comfort. For developing the FE model of the seat, physical dimensions of the
candidate seat were measured and a CAD model was developed in CATIA® design software. The
CAD model was then exported in CAD geometry exchange format (. stp) and imported within the
Hypermesh® finite element preprocessing environment. Figure 3.11(b) shows the finite element
representation of the seat. Since the primary objective is to study the human occupant-seat
characteristics, a methodology was formulated to incorporate the occupant model in the LS-
DYNA® platform, as shown in Figure 3.12.
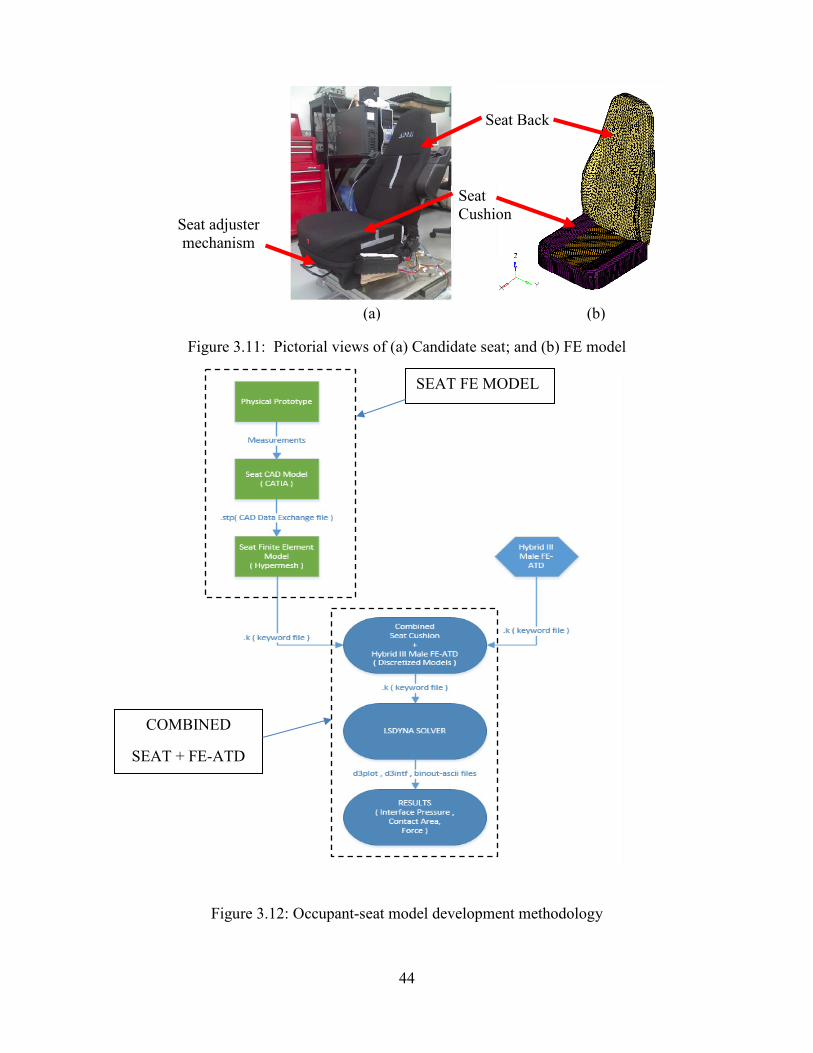
44
Figure 3.11: Pictorial views of (a) Candidate seat; and (b) FE model
Figure 3.12: Occupant-seat model development methodology
SEAT FE MODEL
COMBINED
SEAT + FE-ATD
Seat Back
Seat Cushion Seat adjuster
mechanism
(a) (b)

45
3.2.1 Seat Cushion Model Formulation
The candidate seat considered for the study also employs a vertical suspension. The
suspension is assumed to be locked and the flat seat pan is considered to be rigid compared to the
cushion. The simplifications permit analysis of the cushion deformations in an efficient manner.
Furthermore, it has been reported that occupant comfort is related to peak pressure developed at
the interface, which invariably occurs in the vicinity of the ischial tuberosities [4]. The seat
backrest is this assumed to be a flat rigid back so as to focus on the influence of the seat cushion
geometry and material variations on the pressure and contact area under the human buttocks. The
advantage of replacing the seat back with a rigid wall are twofold. Firstly, the seat model can be
formulated using relatively fewer elements and thereby reducing the simulation time. Secondly,
the weight distribution between the seat cushion and back can be controlled more easily, while
tuning the finite element anthropomorphic test device (FE-ATD) model weight distribution
between the seat cushion and the back.
The seat is discretized by primarily first order solid elements including 63980 hexagonal
and 17179 tetrahedral elements. The computationally efficient element formulation ELFORM 1 is
used, as established in the previous section. The MAT_57 material model, which has been verified
in the section 3.1, is assigned to the seat cushion. The stress-strain data for the JC120 foam with a
density of 62 𝑘𝑘𝑘𝑘/𝑚𝑚3 [38] served as the nominal MAT_57 material model. Figure 3.14 illustrates
the model structure comprising discretized FE models of the seat cushion and the back. A FE
model of the steering wheel is also formulated and incorporated in the global model to ensure
driving posture of the seated occupant. This also helped realize a representative weight distribution
and constraints for the occupant model. The steering wheel FE model is taken from a publically
available Ford Taurus 2001 FE model provided by NHTSA [74]. The base of the seat cushion is
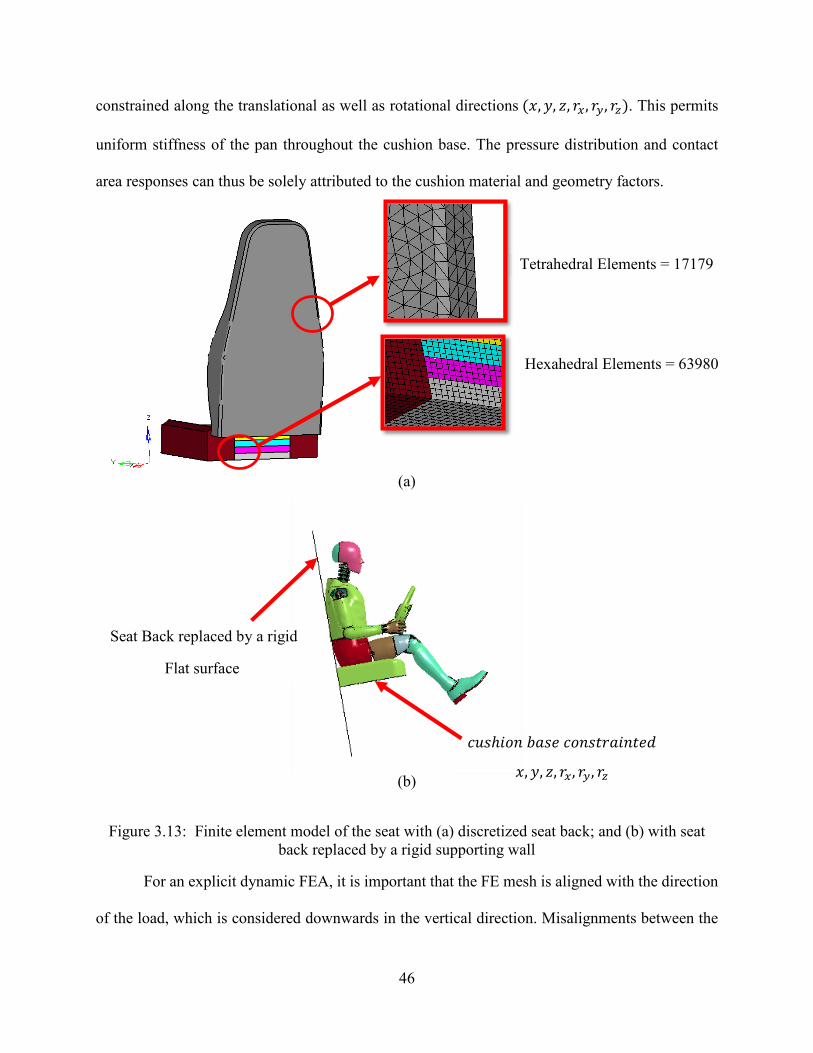
46
constrained along the translational as well as rotational directions (𝑥𝑥,𝑦𝑦, 𝑧𝑧, 𝐶𝐶𝑥𝑥, 𝐶𝐶𝜕𝜕, 𝐶𝐶𝜕𝜕). This permits
uniform stiffness of the pan throughout the cushion base. The pressure distribution and contact
area responses can thus be solely attributed to the cushion material and geometry factors.
(a)
(b)
Figure 3.13: Finite element model of the seat with (a) discretized seat back; and (b) with seat back replaced by a rigid supporting wall
For an explicit dynamic FEA, it is important that the FE mesh is aligned with the direction
of the load, which is considered downwards in the vertical direction. Misalignments between the
Tetrahedral Elements = 17179
Hexahedral Elements = 63980
Seat Back replaced by a rigid
Flat surface
𝑐𝑐𝑐𝑐𝐶𝐶ℎ𝐶𝐶𝐶𝐶𝑎𝑎 𝑏𝑏𝑎𝑎𝐶𝐶𝑒𝑒 𝑐𝑐𝐶𝐶𝑎𝑎𝐶𝐶𝑡𝑡𝐶𝐶𝑎𝑎𝐶𝐶𝑎𝑎𝑡𝑡𝑒𝑒𝑎𝑎
𝑥𝑥,𝑦𝑦, 𝑧𝑧, 𝐶𝐶𝑥𝑥, 𝐶𝐶𝜕𝜕, 𝐶𝐶𝜕𝜕

47
load and the mesh could cause small differences in displacements, which contribute to large
differences in the accelerations. Accurate predictions of peak acceleration thus require a mesh that
is uniform and parallel to the applied load. Accurate predictions of accelerations are vital, since
these are the basis of explicit time integration, at each node at each time step. Considering that seat
cushions are invariably installed at certain angle with respect to the horizontal axis, the alignment
of the mesh with the vertical occupant load is critical for accurate analysis. This is evidenced in
the model shown in Figure 3.15. In the model, the load due to the seated human occupant is
vertically downward, while the seat cushion is inclined. In order to efficiently transmit the seated
load, the hexagonal elements are used to model PUF material beneath the human buttocks with all
dimensions in each direction being equal for the elements directly under the tuberosities.
Figure 3.14: Mesh alignment with load direction (-Z) and shape of the mesh

48
3.3 Occupant Model
In order to accurately characterize interactions between the human occupant and the seat
cushion, it is essential that the occupant model represents the human body geometry, contact
properties and the weight distribution. For this purpose, finite element models of the
anthropomorphic test devices (FE-ATD’s) are reviewed. A number of ATD models have been
reported for crash simulations, which satisfy the above stated requirements. The numerical models
of ATD’s developed by the National Crash Analysis Center (NCAC) of George Washington
University in collaboration with Livermore software technology corporation (LSTC) [51] are
reviewed for applications in seating comfort. The reported models are built on the basis of
regulatory and consumer crash test programs [56]. The hybrid III family of crash test FE-ATD’s
have been developed to represent 5th percentile female (50 kg), 50th percentile male (78.6 kg), 95th
percentile male (100 kg), children of ages 3, 6, 10 and newborns. Figure 3.16 shows the
methodology used for developing FE models of ATD’s representing 5th, 50th and 95th percentile
population. For the current research, the FE-ATD’s representing 5th, 50th and 95th percentile adult
population are employed. The bio fidelity of the hybrid III physical models and their FE analogues
reported in many studies, have been correlated with crash data [50, 51, 58, 59, 70]. In the
subsequent section, the FE-ATD development process has been described together with the
specific model features.
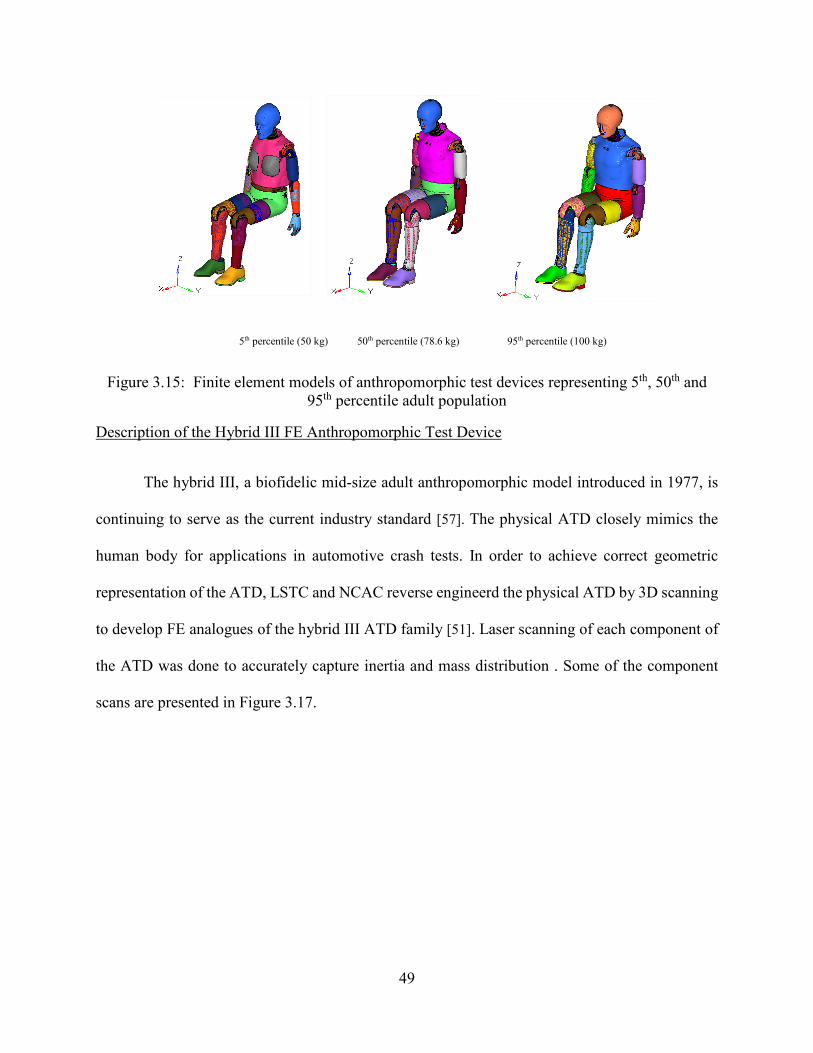
49
5th percentile (50 kg) 50th percentile (78.6 kg) 95th percentile (100 kg)
Figure 3.15: Finite element models of anthropomorphic test devices representing 5th, 50th and 95th percentile adult population
Description of the Hybrid III FE Anthropomorphic Test Device
The hybrid III, a biofidelic mid-size adult anthropomorphic model introduced in 1977, is
continuing to serve as the current industry standard [57]. The physical ATD closely mimics the
human body for applications in automotive crash tests. In order to achieve correct geometric
representation of the ATD, LSTC and NCAC reverse engineerd the physical ATD by 3D scanning
to develop FE analogues of the hybrid III ATD family [51]. Laser scanning of each component of
the ATD was done to accurately capture inertia and mass distribution . Some of the component
scans are presented in Figure 3.17.

50
Figure 3.16: Human FE ATD model development methodology [57]
Figure 3.17: Three dimensional scans obatained from hybrid III ATD’s [51]

51
The hybrid III ATD and the developed FE models represent the weight and geometry of
the 5th, 50th and 95th percentile adult population, which is denoted as FE-ATD’s hereafter. Their
weight and shape features also make them ideal for study of occupant-seat pressure and contact
area measurements. It is however, important to verify that the load path through the FE-ATD being
representative of a seated human. The FE-ATD mainly consists of 6 major components, which are
head, spine, chest, trunk, pelvis and legs [50, 51]. The geometry and material properties of the
buttocks and the pelvis assemblies of the FE-ATD are critical features for determining the body-
seat interface characteristics. The buttocks shape used in FE-ATD’s provide good bio fidelity,
when compared to an actual human being [51]. The buttocks are modeled using solid elements and
rubber material model. The rubber components are modeled using hyperelastic MAT_007
(MAT_BLATZ-KO_RUBBER) available in LS-DYNA®, which was based on the work by Blatz
and Ko [48]. This one parameter material model allows modeling of nearly incompressible
continuum rubber, representing buttock tissue properties. The Poisson’s ratio of the material is
taken as 0.463 [72]. The polyvinyl skin is modeled using shell elements with viscoelastic material
type 6 in LS-DYNA®. The remaining part of the buttock assembly is modeled using solid elements
with assigned foam material MAT_062 (MAT_VISCOUS_FOAM). The MAT_062 material
model was developed to represent the energy absorbing foam found on certain crash dummies [72].
The features of this model represent good discretization of the physical ATD, which is well suited
for study of buttocks interactions with the seat cushion.
Figure 3.18 (a) and (b) illustrates components of the FE-ATD’s pelvic assembly, which are
composed of buttocks, pelvis, abdomen, hip-joint, spine bracket and spine. The spine is modelled
with solid elements (material: viscoelastic), and is attached to the spine bracket [57]. A control
volume is used to define the abdomen, which is modeled with shell elements. The pelvis bone

52
(material: aluminum), which is the stiffest structure in the pelvic assembly and ensures majority
of the load transfer through the pelvis, as it is expected to occur in reality.
Figure 3.18: Pictorial views of FE-ATD’s (a) buttocks, pelvis, abdomen; and (b) spine, spine bracket, hip-joint
Figure 3.19: Qualitative comparison of pelvis: (a) human male pelvis [75] and (b) pelvis model in the 50th percentile FE-ATD
Spine bracket Buttocks
Pelvis
Abdomen Spine
Hip Joint
(a) (b)
(a)
(b)
(a) (b)

53
Figure 3.19 illustrates a qualitative comparison between an actual human pelvis and its FE
discretization. In the FE model of the human pelvis, it is important that the shape of the ischial
tuberosity is representative of the human pelvis. It can be observed from the figure that this
condition is met by the FE-ATD (see arrow illustrates comparisons of Figure 3.19(a) and Figure
3.19(b)).
3.4 Development of the Seat-ATD model
The FE model of the seat cushion developed in section 3.2 is integrated to the 50th
percentile hybrid III FE-ATD model to develop the coupled seat-ATD model for analysis of
occupant-seat interactions. The coupled model is formulated to simulate the contact area and
contact pressure at the seat interface. The validity of the coupled model and the analysis method
is examined by comparing the simulation results with experimental measurements reported by
Naseri [31] and other researchers [9, 13, 20].
In this dissertation, the coupled seat-occupant model for the purpose of verifying
simulation results with experimental measurements is limited to 50th percentile male population.
The majority of the studies reporting comfort performance of seats have also considered 50th
percentile population [9, 12, 13, 15, 20, 24, 34, 37]. The LS-PrePost® software provides an
option to integrate various FE models developed for individual components by incorporating
appropriate boundary/interface conditions. The occupant model is initially formulated so as to
adapt to desired seat cushion and backrest angles. The ATD model is then positioned slightly
above the seat cushion and forward of the backrest (3 to 7 mm). The ATD model is permitted to
drop on the seat such that it maintains the target seat cushion and backrest angles. Figure 3.20(a)
illustrates the initial position of the ATD with respect to the seat, where the ATD is constrained

54
along the translational and rotational axes. Note that the back seat is shown for illustration
purpose only, and has been replaced by a flat seat back. It has been reported that the seat cushion
supports nearly 60% of occupant weight supported by the seat, while 40% is supported by the
backrest [31, 36]. The FE-ATD body angles, shown in the Figure 3.20, ensured that 60% of the
ATD weight on the seat is supported by the cushion and 40% by the seat back. The seat cushion
normally supports around 75% of the occupant’s weight on the seat. The FE-ATD positioning
was further tuned to achieve desired weight distribution.
Figure 3.20: Positioning of the ATD on the seat: (a) seat angles with respect to global axes and constraints; and (b) initial position of ATD with respect to the seat cushion
3.4.1 Method of analysis and model verification
The boundary conditions are applied by fixing all degrees of freedom of the steering wheel,
feet, base of the seat cushion and seat back, as shown in Figure 3.20(a). The simulation is setup
as a dynamic event, where the human FE-ATD falls under gravitational load on the seat and
gradually settles down. The simulation results revealed that the 50th percentile FE-ATD
approaches its equilibrium state in about 2.7 seconds simulation time, which could be in the order
𝑐𝑐𝐶𝐶𝑎𝑎𝐶𝐶𝑡𝑡𝐶𝐶𝑎𝑎𝐶𝐶𝑎𝑎𝑒𝑒𝑎𝑎 𝑥𝑥,𝑦𝑦, 𝑧𝑧, 𝐶𝐶𝑥𝑥, 𝐶𝐶𝜕𝜕, 𝐶𝐶𝜕𝜕
15° 𝑐𝑐𝐶𝐶𝑎𝑎𝐶𝐶𝑡𝑡𝐶𝐶𝑎𝑎𝐶𝐶𝑎𝑎𝑒𝑒𝑎𝑎 𝑥𝑥,𝑦𝑦, 𝑧𝑧, 𝐶𝐶𝑥𝑥, 𝐶𝐶𝜕𝜕, 𝐶𝐶𝜕𝜕
10°
𝑘𝑘𝑔𝑔𝐶𝐶𝑏𝑏𝑎𝑎𝑔𝑔 𝑎𝑎𝑥𝑥𝑒𝑒𝐶𝐶
15°
10°
50°
80° 80°
50°
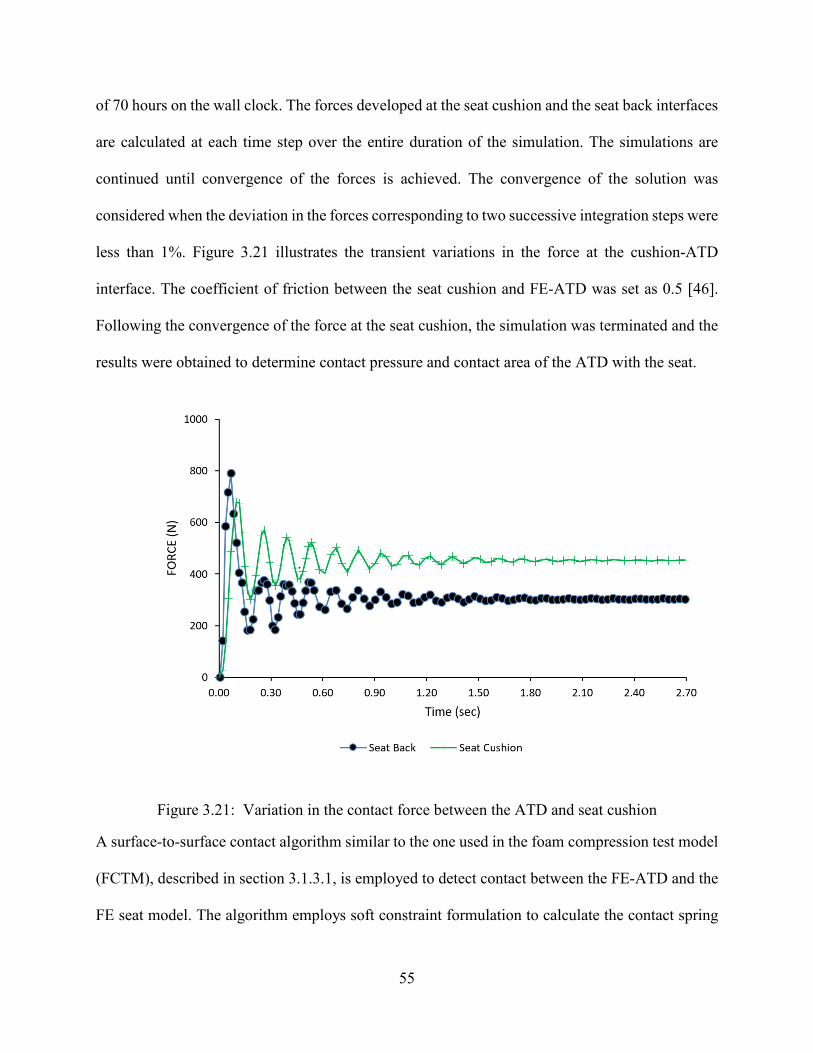
55
of 70 hours on the wall clock. The forces developed at the seat cushion and the seat back interfaces
are calculated at each time step over the entire duration of the simulation. The simulations are
continued until convergence of the forces is achieved. The convergence of the solution was
considered when the deviation in the forces corresponding to two successive integration steps were
less than 1%. Figure 3.21 illustrates the transient variations in the force at the cushion-ATD
interface. The coefficient of friction between the seat cushion and FE-ATD was set as 0.5 [46].
Following the convergence of the force at the seat cushion, the simulation was terminated and the
results were obtained to determine contact pressure and contact area of the ATD with the seat.
Figure 3.21: Variation in the contact force between the ATD and seat cushion
A surface-to-surface contact algorithm similar to the one used in the foam compression test model
(FCTM), described in section 3.1.3.1, is employed to detect contact between the FE-ATD and the
FE seat model. The algorithm employs soft constraint formulation to calculate the contact spring
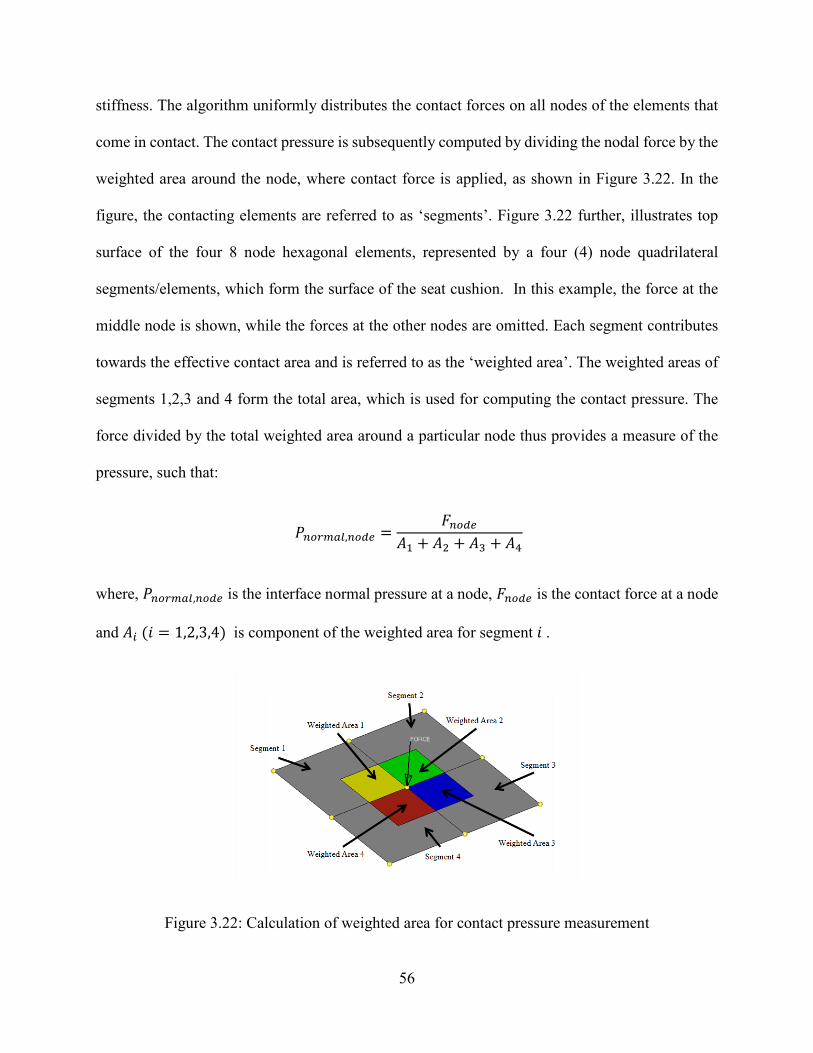
56
stiffness. The algorithm uniformly distributes the contact forces on all nodes of the elements that
come in contact. The contact pressure is subsequently computed by dividing the nodal force by the
weighted area around the node, where contact force is applied, as shown in Figure 3.22. In the
figure, the contacting elements are referred to as ‘segments’. Figure 3.22 further, illustrates top
surface of the four 8 node hexagonal elements, represented by a four (4) node quadrilateral
segments/elements, which form the surface of the seat cushion. In this example, the force at the
middle node is shown, while the forces at the other nodes are omitted. Each segment contributes
towards the effective contact area and is referred to as the ‘weighted area’. The weighted areas of
segments 1,2,3 and 4 form the total area, which is used for computing the contact pressure. The
force divided by the total weighted area around a particular node thus provides a measure of the
pressure, such that:
𝑃𝑃𝑛𝑛𝑜𝑜𝑛𝑛𝑚𝑚𝑛𝑛𝑛𝑛,𝑛𝑛𝑜𝑜𝑑𝑑𝑒𝑒 =𝐹𝐹𝑛𝑛𝑜𝑜𝑑𝑑𝑒𝑒
𝐴𝐴1 + 𝐴𝐴2 + 𝐴𝐴3 + 𝐴𝐴4
where, 𝑃𝑃𝑛𝑛𝑜𝑜𝑛𝑛𝑚𝑚𝑛𝑛𝑛𝑛,𝑛𝑛𝑜𝑜𝑑𝑑𝑒𝑒 is the interface normal pressure at a node, 𝐹𝐹𝑛𝑛𝑜𝑜𝑑𝑑𝑒𝑒 is the contact force at a node
and 𝐴𝐴𝑖𝑖 (𝐶𝐶 = 1,2,3,4) is component of the weighted area for segment 𝐶𝐶 .
Figure 3.22: Calculation of weighted area for contact pressure measurement
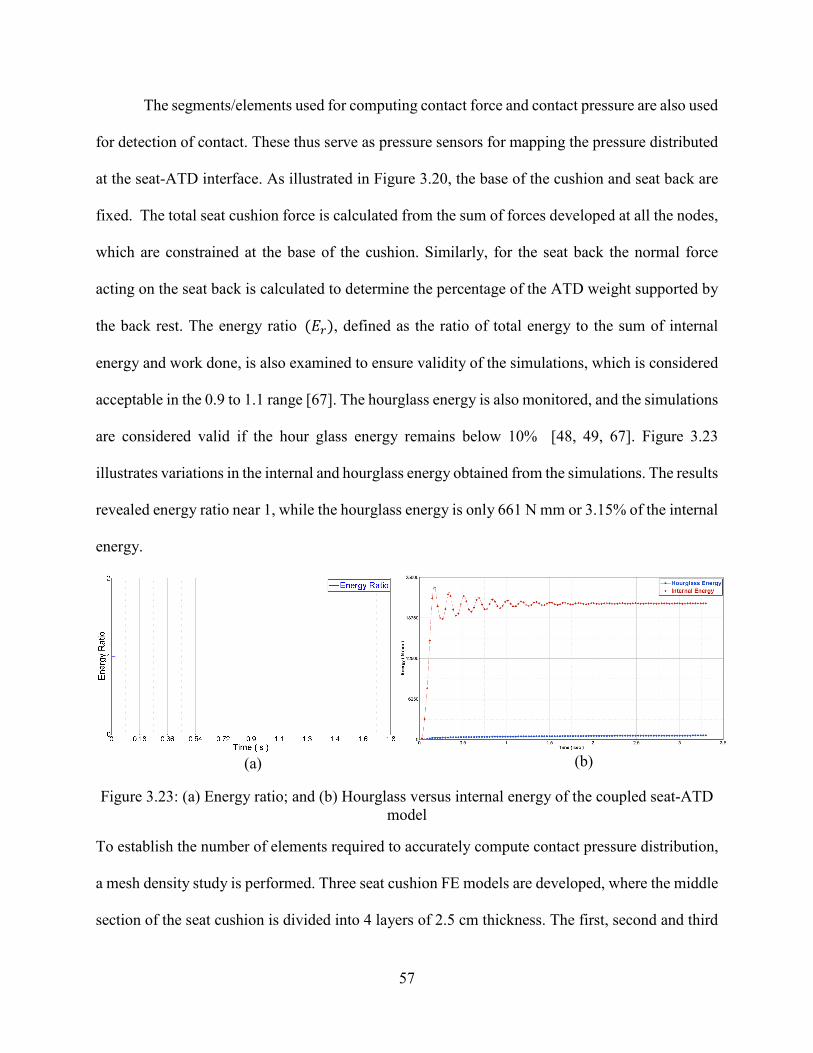
57
The segments/elements used for computing contact force and contact pressure are also used
for detection of contact. These thus serve as pressure sensors for mapping the pressure distributed
at the seat-ATD interface. As illustrated in Figure 3.20, the base of the cushion and seat back are
fixed. The total seat cushion force is calculated from the sum of forces developed at all the nodes,
which are constrained at the base of the cushion. Similarly, for the seat back the normal force
acting on the seat back is calculated to determine the percentage of the ATD weight supported by
the back rest. The energy ratio (𝐸𝐸𝑛𝑛), defined as the ratio of total energy to the sum of internal
energy and work done, is also examined to ensure validity of the simulations, which is considered
acceptable in the 0.9 to 1.1 range [67]. The hourglass energy is also monitored, and the simulations
are considered valid if the hour glass energy remains below 10% [48, 49, 67]. Figure 3.23
illustrates variations in the internal and hourglass energy obtained from the simulations. The results
revealed energy ratio near 1, while the hourglass energy is only 661 N mm or 3.15% of the internal
energy.
Figure 3.23: (a) Energy ratio; and (b) Hourglass versus internal energy of the coupled seat-ATD model
To establish the number of elements required to accurately compute contact pressure distribution,
a mesh density study is performed. Three seat cushion FE models are developed, where the middle
section of the seat cushion is divided into 4 layers of 2.5 cm thickness. The first, second and third
(a) (b)
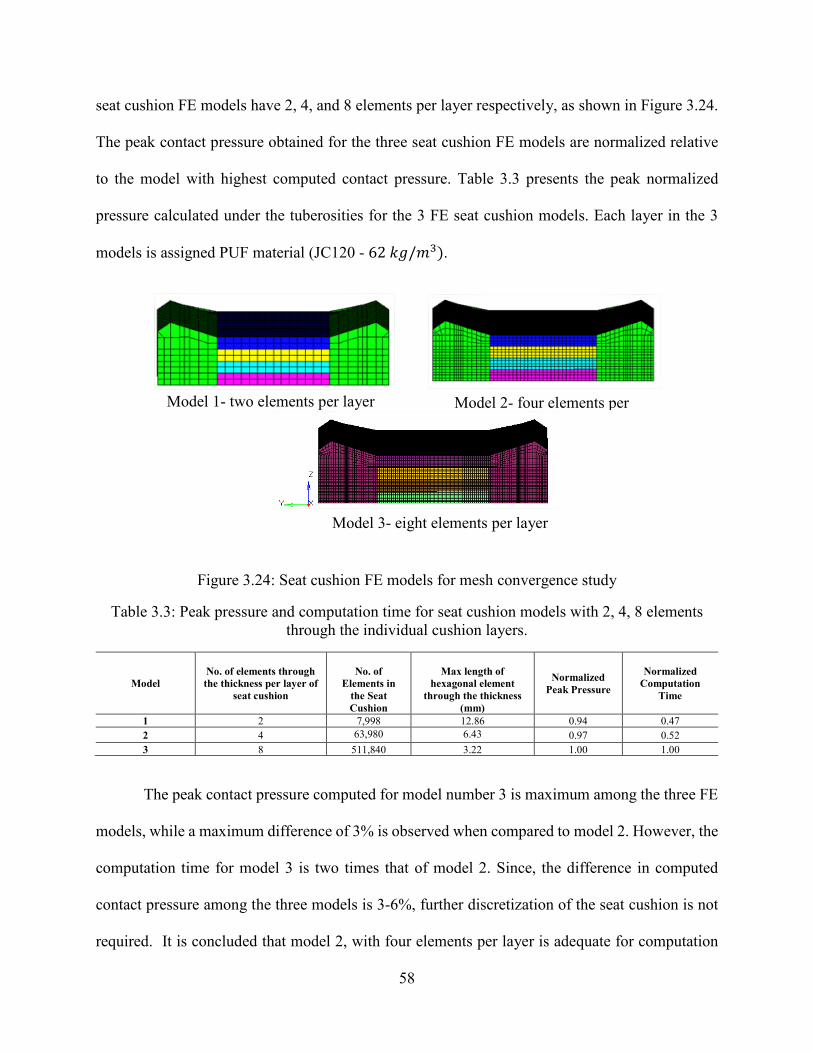
58
seat cushion FE models have 2, 4, and 8 elements per layer respectively, as shown in Figure 3.24.
The peak contact pressure obtained for the three seat cushion FE models are normalized relative
to the model with highest computed contact pressure. Table 3.3 presents the peak normalized
pressure calculated under the tuberosities for the 3 FE seat cushion models. Each layer in the 3
models is assigned PUF material (JC120 - 62 𝑘𝑘𝑘𝑘/𝑚𝑚3).
Figure 3.24: Seat cushion FE models for mesh convergence study
Table 3.3: Peak pressure and computation time for seat cushion models with 2, 4, 8 elements through the individual cushion layers.
Model No. of elements through the thickness per layer of
seat cushion
No. of
Elements in the Seat Cushion
Max length of
hexagonal element through the thickness
(mm)
Normalized Peak Pressure
Normalized Computation
Time
1 2 7,998 12.86 0.94 0.47 2 4 63,980 6.43 0.97 0.52 3 8 511,840 3.22 1.00 1.00
The peak contact pressure computed for model number 3 is maximum among the three FE
models, while a maximum difference of 3% is observed when compared to model 2. However, the
computation time for model 3 is two times that of model 2. Since, the difference in computed
contact pressure among the three models is 3-6%, further discretization of the seat cushion is not
required. It is concluded that model 2, with four elements per layer is adequate for computation
Model 1- two elements per layer
Model 3- eight elements per layer
Model 2- four elements per

59
of peak contact pressure. This study was performed on Briaree, which is a computer cluster setup
by Compute Canada for Canadian researchers at University of Montreal. For each model, 4 nodes
in the cluster were utilized where, each node has 2 Intel westmore EP X5650 6 core processors
running at 2.667 G Hz. Each processor has 12 MB of cache shared among the six cores. Each node
has 48GB of installed ram (4 GB per core) running on scientific Linux 6.3. The LS-DYNA®
version R-7.0.0 MPP double precision was installed to run the simulations.
3.4.2 Comparisons with Reported Pressure and Contact Area Measurements
The 50th percentile FE-ATD is the most commonly reported body weight in research
studies, which have employed experimental investigations and numerical simulations to compare
peak contact pressure under the tuberosities [9, 12, 13, 15, 20, 24, 34, 37]. The peak contact
pressures results are thus obtained for the 50th FE-ATD. The computed peak pressure values are
compared to experimental measurements reported by Naseri [31], whose prototype seat is the
inspiration for the seat cushion FEA model. Next, a few selected studies from literature are
compared to gain further confidence.
An experimental study was designed by Naseri [31] to measure human body-seat interface
pressure and contact area under static and dynamic conditions, for a prototype seat with air pockets
inside the seat cushion (Figure 3.11). The purpose of the study was to explore the influence of
using air pressure under the seated occupant and its effect on interface contact pressure. Pressure
data without the air pockets were also reported for subjects representing 5th, 50th and 95th percentile
of population. The contact pressure distributions were acquired using NOVEL EMED system. The
pressure measurement technology consists of a flexible capacitive type sensor matrix and a
portable data conditioning and acquisition PLIANCE system. The pressure mat consists of 16x16
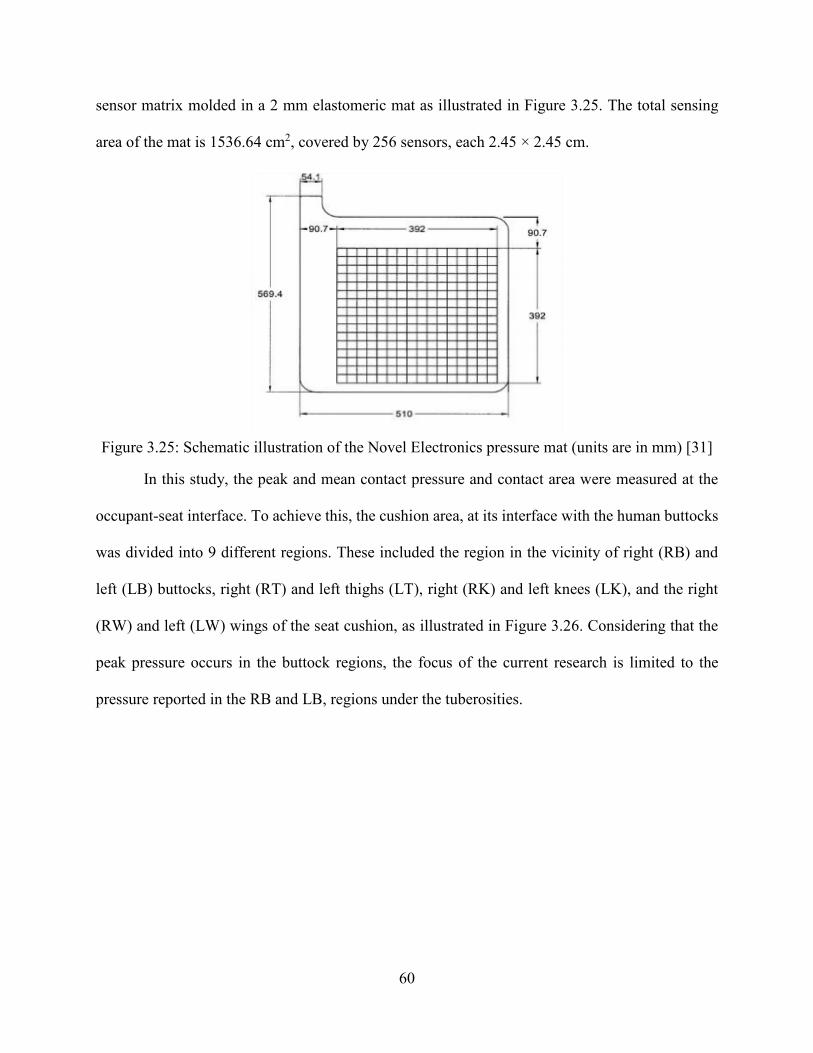
60
sensor matrix molded in a 2 mm elastomeric mat as illustrated in Figure 3.25. The total sensing
area of the mat is 1536.64 cm2, covered by 256 sensors, each 2.45 × 2.45 cm.
Figure 3.25: Schematic illustration of the Novel Electronics pressure mat (units are in mm) [31]
In this study, the peak and mean contact pressure and contact area were measured at the
occupant-seat interface. To achieve this, the cushion area, at its interface with the human buttocks
was divided into 9 different regions. These included the region in the vicinity of right (RB) and
left (LB) buttocks, right (RT) and left thighs (LT), right (RK) and left knees (LK), and the right
(RW) and left (LW) wings of the seat cushion, as illustrated in Figure 3.26. Considering that the
peak pressure occurs in the buttock regions, the focus of the current research is limited to the
pressure reported in the RB and LB, regions under the tuberosities.

61
Figure 3.26: Schematic presentation of regions on the cushion (digits indicate number of sensors occupied) [31]
Each of the RB and LB, zones covered a total area of 180.07 cm2. The data reported for an
80 kg 26-year-old male subject was considered for model verification since it was similar to the
weight of the 50th FE ATD (78.6 kg). Table 3.4 presents a comparison of the peak and mean
pressures obtained from the simulation model with the reported data [31]. The FE seat cushion in
the simulation is assigned JC120 PUF material (62 𝑘𝑘𝑘𝑘/𝑚𝑚3), whereas the PUF material of the
prototype seat is unknown. The contact area over which the average contact pressure under the
tuberosities was calculated was 180 cm2, which is comparable to that of the RB and LB regions in
the experimental investigation. The load sharing between the seat cushion (60% of body weight
on the seat) seat back (40% of body weight on the seat) was also similar for both the experiment
and simulation. The comparison suggests reasonably good agreements in the peak and mean
contact pressure under the tuberosities. The deviations between the predicted and measured
pressures are in the order of 5% and 13% for the peak and mean pressures, respectively. The

62
differences are likely due to unknown material properties of the PUF used in the prototype seat
cushion. Further, there is a 2% difference in body weight between the human subject considered
and 50th percentile FE-ATD model.
Table 3.4: Comparisons of model predicted peak and mean contact pressure over the buttocks regions with the measured data (PUF material: JC120; density = 62 𝑘𝑘𝑘𝑘/𝑚𝑚3)
Mircheski et al. [20] reported a difference of 2% in peak contact pressure predicted from
FE simulations and the measure data. The study reported data for a human male (78.5 kg) seated
on a seat cushion made from PUF material of density 50 𝑘𝑘𝑘𝑘/𝑚𝑚3. In their study, the computed
peak contact pressure under the tuberosities was reported as 16.95 kPa (simulation), while
experimental observations showed the peak pressure of 17.25 kPa. The study also investigated the
contact pressure of a modified seat design with additional PUF material underneath the
tuberosities. The simulation results for the modified thicker cushion revealed lower peak contact
pressure of 10.83 kPa. Mircheski et al. [20] concluded that the peak contact pressure under the
tuberosities can be reduced by increasing the cushion thickness and thereby reducing the stiffness.
The observed peak pressure is somewhat comparable with that obtained for the prototype seat in
this study. This is likely due to lower stiffness of the prototype seat integrating air bags.
M.M. Verver et al. [13] reported a maximum pressure under the ischia as 10.41 kPa for a
seat cushion made from PUF of comparable mass density (56.1 𝑘𝑘𝑘𝑘/𝑚𝑚3) which was obtained from
a numerical model of the occupant-seat system. The peak pressure measurements obtained with
different subjects showed between 8-10 kPa. The simulation model employed a 50th percentile FE-
63
ATD of mass 75.7 kg, while no information was provided on load sharing between the seat cushion
(thickness = 6 cm) and the back support. Amann et al. [9] employed a 50th percentile FE-ATD of
mass 74 kg and reported the peak contact pressure of 23 kPa under the tuberosities, while the
measurements revealed peak pressure in the 17-26 kPa range. The study, however, did not describe
the properties of the PUF used. Peak pressure is judged to be very high when compared to those
reported in other studies, which is likely due to relatively higher stiffness of the seat.
The above-mentioned studies have generally employed a 50th percentile human for both
simulations and experiments. The body weights of the human occupant’s and their FE analogues
lie in the range of 74 to 78 kg. The PUF material of density in those studies ranged from 50 −
56 𝑘𝑘𝑘𝑘/𝑚𝑚3. Based on these studies, it has been observed that the reported peak contact pressure
under the tuberosities lies anywhere in between 8 - 26 kPa. The above comparisons, although
qualitative, provide reasonable confidence in the simulation results obtained for the FE model of
the prototype seat coupled with the FE-ATD.
3.5 Summary
A nonlinear FE material model (MAT_57) based on continuum mechanics and tabulated
experimental stress-strain data is employed to predict the behavior of polyurethane foam material.
This material model was then incorporated in an FE model which mimics a compression test of a
5 x 5 x 3 cm sample of PUF seat cushion. The hyperelastic stress-strain characteristics of the foam
sample FE model revealed good agreements between the model results and the measured data.
This nonlinear FE polyurethane foam material model is then incorporated into a seat-ATD FE
model, developed to study the contact pressure distribution at the interface of occupant buttocks
and the seat cushion. The modeling approach employed a 50th percentile frontal crash test ATD

64
for seating comfort analysis and is capable of predicting the normal interface peak as well as mean
contact pressure. The pressure distributions predicted from the occupant-seat model suggested
high pressure peaks beneath the tuberosities, as reported in various experimental and numerical
studies [9, 12, 13, 15, 20, 24, 34]. The pressure measurements from the occupant-seat FE model
correlated reasonably well with the measured data reported by Naseri [31] for a prototype seat
comprising PUF and air bladders. The validated occupant-seat FE model is employed in the
following chapter to perform design exploration study. The influences of variations in the material
and geometric parameters of the seat cushion on the contact pressure and contact area are
particularly investigated for the 5th, 50th and 95th percentile seated occupant models.

65
Chapter 4
DESIGN EXPLORATION OF THE SEAT CUSHION VIA INTERFACE CONTACT
PRESSURE MEASUREMENTS
4.1 General
The developments in seat design guidelines require systematic evaluations of different seat
design features quantified by a set of objective and subjective measures. The vast majority of the
studies on seating comfort have employed various subjective and objective measures. These have
attempted to establish correlations among different objective measures and the subjective comfort
ratings. These, invariably, exhibit large inter-subject variabilities due to broad variations in
anthropometric dimensions of the seated body apart from those in seating preferences of
individuals [4, 6]. Large variabilities in the measured data do not permit the identification of a
more reliable measure. Among the various objective measures, interface contact pressure
distribution has been widely correlated with the seating comfort [8, 11, 30]. Unlike the objective
measures like stresses within the body substructures and muscles responses, the contact pressure
can be measured or quantified with relatively greater ease. Moreover, comfort assessment via
measurements alone cannot be considered feasible due to the high cost and high human resource
demand associated with repeated measurements with relatively large number of prototype seats.
Alternatively, computational models of the body-seat system could yield some of these measures,
especially the contact pressure distribution, in a more efficient and repeatable manner, as stated in
the previous chapter. Such a numerical model could provide essential design guidance for seating
in terms of type of material, material thickness and contouring.

66
The modeling of the human body poses enormous challenges due to lack of adequate
knowledge of properties of various joints and biological material. Since, the body-seat interface
pressure is mostly dependent upon the body weight distribution and anthropometry, the widely
reported anthropometric test devices (ATD’s) could effectively be used to determine the contact
pressure characteristics of different seat designs. The seat model together with the ATD model,
presented in Chapter 3, may thus be applied to assess contact pressure characteristics of different
seats. Moreover, the coupled model may serve as a virtual test platform for assessing seat designs.
In this chapter, the validated seat-ATD model is applied to evaluate body-seat interface
characteristics of different seat design features. These include the PUF material properties and the
seat geometry. The effects of PUF material density, thickness, seat cushion angle and seat wing
geometry on the resulting contact pressure are evaluated. The results are discussed in light of
guidance for the design of seats.
4.2 Evaluations of seat design features
The body-seat contact pressure and the effective contact area are strongly dependent on
various seat design features apart from the human anthropometry and sitting posture. The seat
design features include the material properties, specifically the foam density and stress-strain
characteristics, material thickness, seat cushion angle, back support, and the wing geometry. In
this study, effects of seat cushion design factors are investigated on the contact pressure
distributions considering 5th, 50th and 95th percentile hybrid III ATD models. The back support is
considered to be rigid, so as to eliminate the postural effects and contributions of the backrest
geometry and material properties. Further, the back rest and seat cushion are decoupled by
physically disconnecting the seat cushion from the seat back.
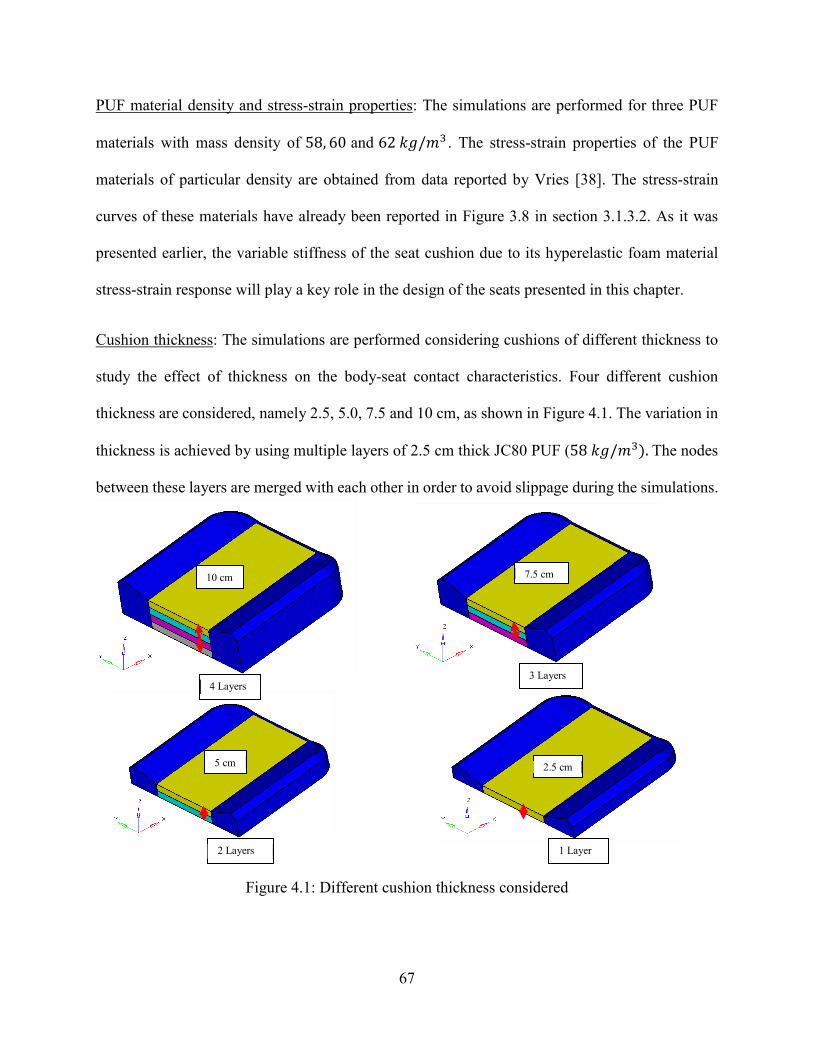
67
PUF material density and stress-strain properties: The simulations are performed for three PUF
materials with mass density of 58, 60 and 62 𝑘𝑘𝑘𝑘/𝑚𝑚3 . The stress-strain properties of the PUF
materials of particular density are obtained from data reported by Vries [38]. The stress-strain
curves of these materials have already been reported in Figure 3.8 in section 3.1.3.2. As it was
presented earlier, the variable stiffness of the seat cushion due to its hyperelastic foam material
stress-strain response will play a key role in the design of the seats presented in this chapter.
Cushion thickness: The simulations are performed considering cushions of different thickness to
study the effect of thickness on the body-seat contact characteristics. Four different cushion
thickness are considered, namely 2.5, 5.0, 7.5 and 10 cm, as shown in Figure 4.1. The variation in
thickness is achieved by using multiple layers of 2.5 cm thick JC80 PUF (58 𝑘𝑘𝑘𝑘/𝑚𝑚3). The nodes
between these layers are merged with each other in order to avoid slippage during the simulations.
Figure 4.1: Different cushion thickness considered
10 cm 7.5 cm
5 cm 2.5 cm
4 Layers 3 Layers
2 Layers 1 Layer

68
Seat cushion angle: Decreasing the seat cushion angle tends to shift greater body weight towards
the tuberosities and the tail bone [31]. Higher cushion angle, on the other hand, may cause higher
contact pressure near soft thigh tissues. The effect of cushion angle on the body-seat contact
characteristics is evaluated considering three angles with respect to the horizontal, namely 0, 5 and
10 degrees, as shown in Figure 4.2.
Figure 4.2: Variations in seat cushion angle with respect to the horizontal axis
Seat cushion wing angle: Increasing the seat wing angle tends to increase the overall occupant
body contact area. Based on subjective evaluations of comfort performance of car seats, Kamp
[76] concluded that steepest wings yield greater comfort sensation. The effect of cushion wing
angle on the body-seat contact characteristics is evaluated in this study considering 8 different
wing angles with respect to the lateral axis of the seat, ranging from 0 to 35 degrees, in increments
of 5 degrees, as shown in Figure 4.3.
0◦ 5◦
10◦
Vehicle Floor
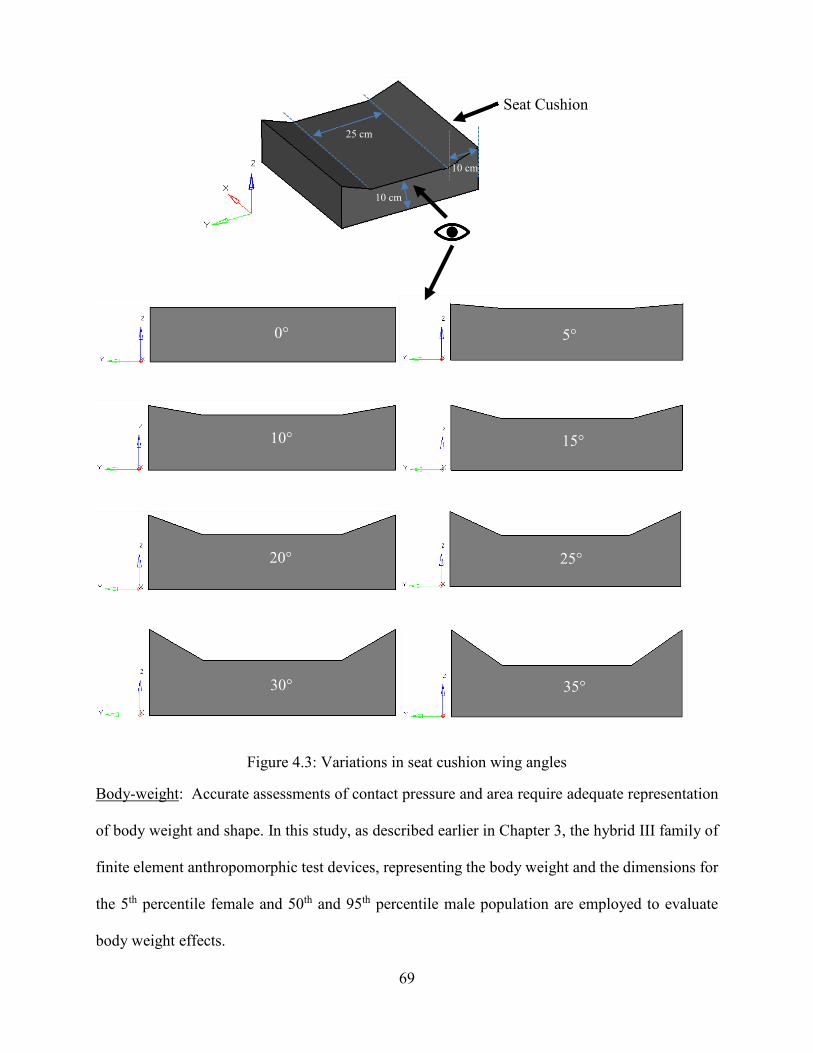
69
Figure 4.3: Variations in seat cushion wing angles
Body-weight: Accurate assessments of contact pressure and area require adequate representation
of body weight and shape. In this study, as described earlier in Chapter 3, the hybrid III family of
finite element anthropomorphic test devices, representing the body weight and the dimensions for
the 5th percentile female and 50th and 95th percentile male population are employed to evaluate
body weight effects.
0° 5°
10° 15°
20° 25°
30
30° 35°
Seat Cushion
25 cm
10 cm
10 cm

70
The above seat cushion design variations are chosen based on literature review, availability of
polyurethane foam material data and personal experience [7, 20, 31, 76].
4.3 Method of analysis
The seat-ATD model, described in Chapter 3, is employed to study the influences of variations
in the seat design features described in the previous section. The effect of different design features
are assessed using objective measures based on contact pressure and area, computed at the
occupant-seat interface, and described below.
The overall contact area (OCA) is defined as the sum of areas of all the elements of the seat
cushion in contact with the FE-ATD. The overall mean pressure (OMP) is the average of the
pressures computed over all elements defined by OCA. As an example, Figure 4.4 illustrates the
contact pressure distribution at the interface of the occupant and the seat cushion. The results
clearly show dominant contact pressure beneath the buttocks, while the peripheral elements
(shown in grey color) revealed pressure well below 2% of the computed peak contact pressure.
These elements are thus discarded in calculations of OCA and OMP.
Figure 4.4: Occupant-seat pressure distribution obtained from the simulation model

71
Most of the reported studies use peak and mean contact pressures over the total contact
region to quantify comfort [9, 13, 20, 46]. This approach of calculating the pressure over the overall
contact area is useful to compare two different seat designs for a particular occupant. However, to
understand the influence of variations of a particular design feature within a single seat, objective
measures which can provide insight into local variations in contact pressure and contact area are
required. Two additional measures of contact area and subsequently contact pressure are thus
proposed: (1) 90th percent contact area (CA90), which is defined as the sum of areas of all
elements where the computed pressure is higher than 90% of the peak contact pressure; and (2)
70th percent contact area (CA70) for areas where computed contact pressure is higher than 70%
of the peak contact pressure. Figure 4.5 illustrates these two measures of contact area, where CA90
includes all elements with pressure exceeding 8.65 kPa and CA70 with pressure above 6.73 kPa.
The legend in Figure 4.5 is divided in equal intervals such that each interval is 10% of the
computed peak pressure.
Similarly, 90th percent mean contact pressure (MP90) and 70th percent mean contact
pressure (MP70) are defined as mean contact pressures computed over the elements within the
CA90 and CA70 regions, respectively. This approach of calculating the contact pressure and
contact area can help identify the localized variations in contact pressure at the occupant-seat
interface, when the seat cushion design parameters are modified.
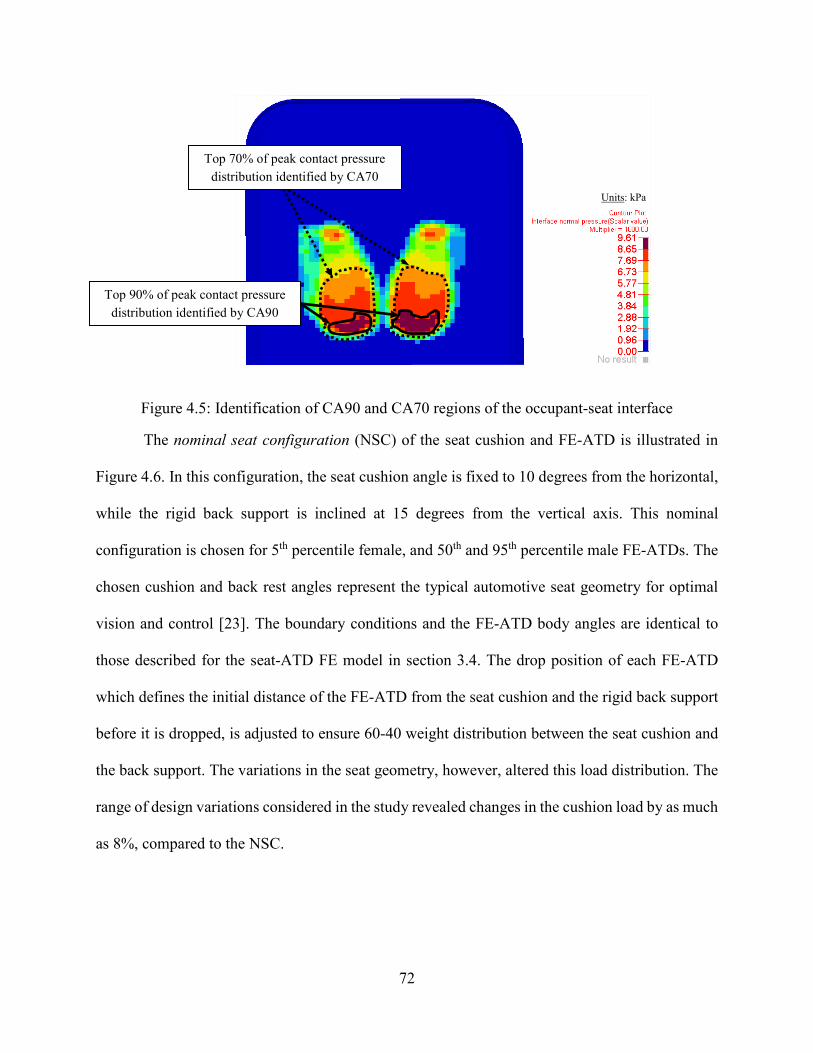
72
Figure 4.5: Identification of CA90 and CA70 regions of the occupant-seat interface
The nominal seat configuration (NSC) of the seat cushion and FE-ATD is illustrated in
Figure 4.6. In this configuration, the seat cushion angle is fixed to 10 degrees from the horizontal,
while the rigid back support is inclined at 15 degrees from the vertical axis. This nominal
configuration is chosen for 5th percentile female, and 50th and 95th percentile male FE-ATDs. The
chosen cushion and back rest angles represent the typical automotive seat geometry for optimal
vision and control [23]. The boundary conditions and the FE-ATD body angles are identical to
those described for the seat-ATD FE model in section 3.4. The drop position of each FE-ATD
which defines the initial distance of the FE-ATD from the seat cushion and the rigid back support
before it is dropped, is adjusted to ensure 60-40 weight distribution between the seat cushion and
the back support. The variations in the seat geometry, however, altered this load distribution. The
range of design variations considered in the study revealed changes in the cushion load by as much
as 8%, compared to the NSC.
Top 90% of peak contact pressure distribution identified by CA90
Top 70% of peak contact pressure distribution identified by CA70
Units: kPa
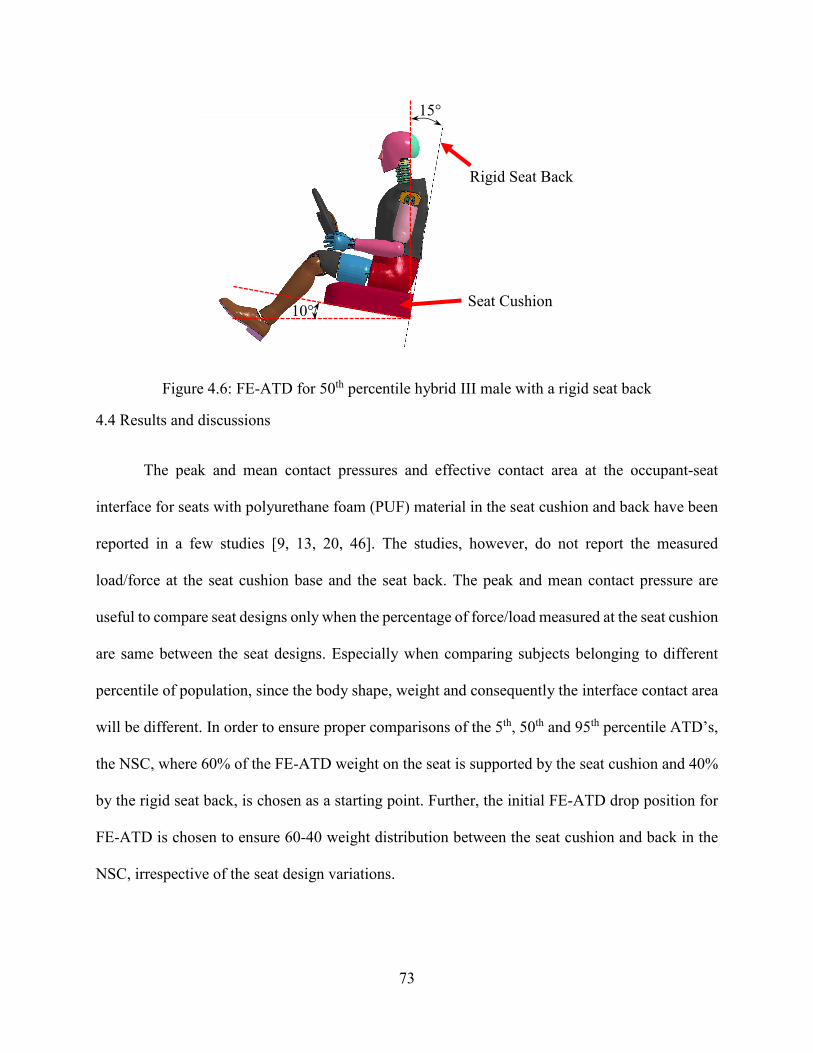
73
Figure 4.6: FE-ATD for 50th percentile hybrid III male with a rigid seat back
4.4 Results and discussions
The peak and mean contact pressures and effective contact area at the occupant-seat
interface for seats with polyurethane foam (PUF) material in the seat cushion and back have been
reported in a few studies [9, 13, 20, 46]. The studies, however, do not report the measured
load/force at the seat cushion base and the seat back. The peak and mean contact pressure are
useful to compare seat designs only when the percentage of force/load measured at the seat cushion
are same between the seat designs. Especially when comparing subjects belonging to different
percentile of population, since the body shape, weight and consequently the interface contact area
will be different. In order to ensure proper comparisons of the 5th, 50th and 95th percentile ATD’s,
the NSC, where 60% of the FE-ATD weight on the seat is supported by the seat cushion and 40%
by the rigid seat back, is chosen as a starting point. Further, the initial FE-ATD drop position for
FE-ATD is chosen to ensure 60-40 weight distribution between the seat cushion and back in the
NSC, irrespective of the seat design variations.
15°
Rigid Seat Back
10° Seat Cushion

74
4.4.1 Effect of seat cushion material properties
The occupant body weight, foam material density and stress-strain property influence the
peak and mean contact pressure distributions at the occupant-seat interface in addition to the
contact area. The simulations are performed for PUF materials JC80, JC100 and JC120 with foam
densities of 58 𝑘𝑘𝑘𝑘/𝑚𝑚3, 60 𝑘𝑘𝑘𝑘/𝑚𝑚3and 62 𝑘𝑘𝑘𝑘/𝑚𝑚3, respectively. Apart from these 3 PUF materials
peak pressure results are also computed for a rigid (material: steel) seat cushion. Four different
finite element simulations are thus setup for each FE-ATD.
The peak contact pressures (PP) obtained for the four seats coupled with three ATDs are
presented in Table 4.1. The load sharing between the seat cushion (60%) and back (40%) of the
occupant’s body weight on the seat is maintained for all FE-ATD’s. The rigid seat exhibits
significantly higher PP when compared to the PUF seats. Among the PUF seats, the contact PP is
the highest for PUF material JC120 (62 𝑘𝑘𝑘𝑘/𝑚𝑚3) and lowest for PUF material JC80 (58 𝑘𝑘𝑘𝑘/𝑚𝑚3)
for all the three FE-ATD’s. Further, it can be seen that the computed contact PP for the 95th
percentile FE-ATD is lower than 50th percentile FE-ATD seat model. This trend is consistent
among all JC80, JC100 and JC120 PUF materials. Although the body weight of 95th percentile FE-
ATD is higher (100 𝑘𝑘𝑘𝑘) compared to the 50th percentile FE-ATD (78.6 𝑘𝑘𝑘𝑘), the OCA in the case
of JC80 PUF for the 95th percentile FE-ATD (939 𝑐𝑐𝑚𝑚2) is larger compared to 50th percentile model
(656 𝑐𝑐𝑚𝑚2) (see Table 4.2). The contact load for the heavier 95th percentile ATD is thus distributed
over a larger contact area, which leads to relatively lower peak pressure.

75
Table 4.1: Peak pressure under the ischial tuberosities for 5th, 50th and 95th percentile hybrid III family coupled with four different seats
Table 4.2: Computed contacts area for the 5th, 50th and 95th percentile FE-ATD’s coupled with four different seats
The contact PPs obtained for the JC80 and JC100 seats exhibit significant differences for all the
three FE-ATDs. The JC80 seat exhibits 31%, 26% and 23% lower PP for the 5th, 50th and 95th
percentile ATDs, respectively, when combined to the JC100 seat. Only small differences in the
contact PPs, however, are observed between the JC100 and JC120 seats, which range from 3 to
8%. This is due to the face that elastic collapse stress for JC100 PUF is similar to that of JC120
(Table 3.2). The results suggest that higher density foams will produce higher contact PP at the
occupant-seat interface. Further, it should be noted that the difference in the density between JC80
and JC100 is only 2 𝑘𝑘𝑘𝑘/𝑚𝑚3, while the difference in computed contact PP is in the 31-23% range
for 5th, 50th and 95th percentile FE-ATD’s. This clearly suggests the significance of the stress-strain
property of the material, particularly the elastic collapse stress. The large reduction of contact PP
with only a small difference in PUF material densities, can provide flexibility to the design
engineer during the seat design cycle. It is thus concluded that the use of only material density data
for selection of PUF material would be insufficient during the seat design cycle.
5th 50th 95th
Density ( kg/m3)Rigid 7850 24.9 26.8 38.4JC120 62 8.84 9.6 9.3JC100 60 8.52 9.3 8.6JC80 58 5.89 6.9 6.6
FE-ATD Seat Material
Peak Pressure (PP, kPa)
5th 50th 95th 5th 50th 95th 5th 50th 95thDensity ( kg/m3)
JC120 62 86 28 15 158 207 177 323 488 669JC100 60 95 31 32 168 213 215 335 507 690JC80 58 56 37 40 221 341 259 483 656 939
FE-ATD
Contact Area (CA70) ( cm2)
FE-ATD
Overall Contact Area ( OCA ) (cm2)
Seat Material FE-ATD
Contact Area (CA90) ( cm2)

76
Table 4.2 summarizes the contact area in terms of CA90, CA70 and OCA obtained for the
four seats coupled with three FE-ATDs. The results show that for the 50th and 95th percentile FE-
ATD’s, the low density foam JC80 distributes high contact pressure exceeding 70% and 90% of
the PP over a larger area when compared to medium and high density foams (JC100 and JC120).
The OCA also tends to be higher for the low density foam, irrespective of the FE-ATD. The contact
area CA90 for the 5th percentile ATD, however, forms an exception, which shows relatively lower
CA90 with the low density foam (JC80) compared to JC100 and JC120. The high deformation of
the JC80 foam allows the 5th FE-ATD to sink deeper into the seat, leading to greater contact with
the seat cushion wings and thereby lower CA90. This contact with the wings changes the load
path, thereby resulting in lower PP and lower CA90. The contact areas and pressures of the 5th
percentile ATD are further shown in Figure 4.7 for JC80 and JC120 seats. It can be observed that
due to excessive deformation of the low density (JC80) seat leads to relatively greater contact with
the cushion wings when compared to JC120 seat.
Figure 4.7: Deformation (mm), 5th FE-ATD seated on (a) JC120, and (b) JC80 seat cushion
This contact with the cushion wings changes the load path leading to greater overall contact
(OCA). The 5th ATD load is thus distributed over a wider contact area, 483 𝑐𝑐𝑚𝑚2 for JC80
(a) (b)
wing line
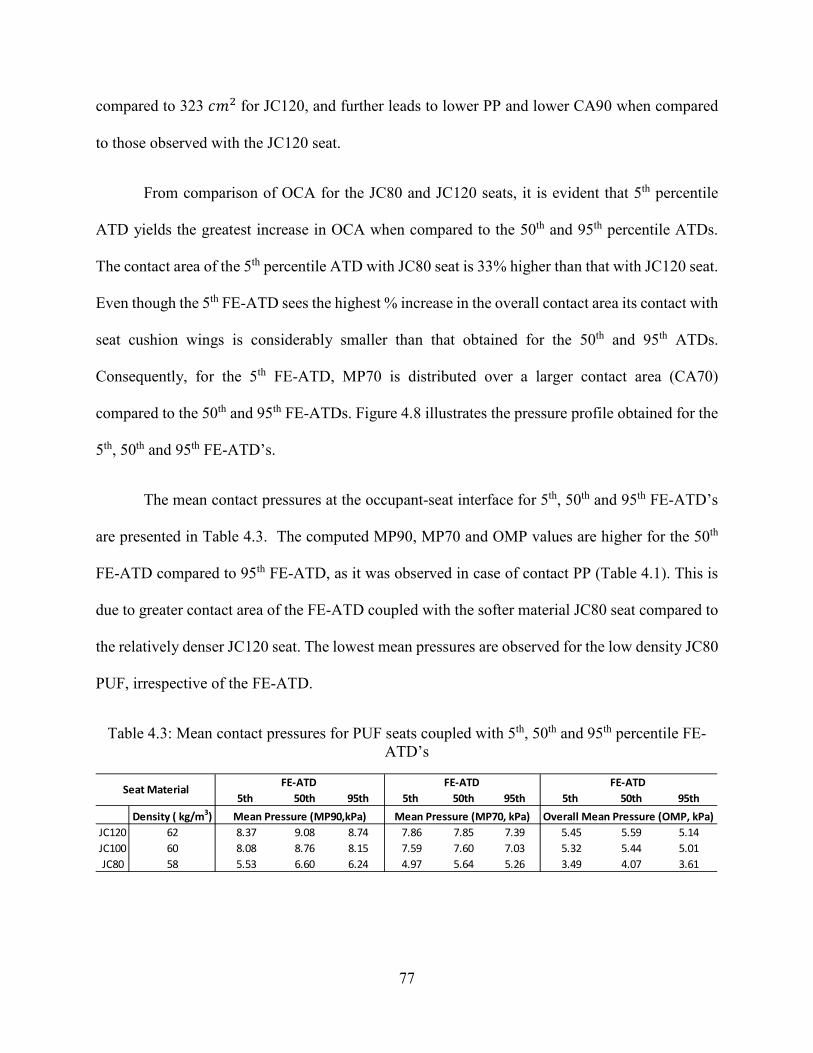
77
compared to 323 𝑐𝑐𝑚𝑚2 for JC120, and further leads to lower PP and lower CA90 when compared
to those observed with the JC120 seat.
From comparison of OCA for the JC80 and JC120 seats, it is evident that 5th percentile
ATD yields the greatest increase in OCA when compared to the 50th and 95th percentile ATDs.
The contact area of the 5th percentile ATD with JC80 seat is 33% higher than that with JC120 seat.
Even though the 5th FE-ATD sees the highest % increase in the overall contact area its contact with
seat cushion wings is considerably smaller than that obtained for the 50th and 95th ATDs.
Consequently, for the 5th FE-ATD, MP70 is distributed over a larger contact area (CA70)
compared to the 50th and 95th FE-ATDs. Figure 4.8 illustrates the pressure profile obtained for the
5th, 50th and 95th FE-ATD’s.
The mean contact pressures at the occupant-seat interface for 5th, 50th and 95th FE-ATD’s
are presented in Table 4.3. The computed MP90, MP70 and OMP values are higher for the 50th
FE-ATD compared to 95th FE-ATD, as it was observed in case of contact PP (Table 4.1). This is
due to greater contact area of the FE-ATD coupled with the softer material JC80 seat compared to
the relatively denser JC120 seat. The lowest mean pressures are observed for the low density JC80
PUF, irrespective of the FE-ATD.
Table 4.3: Mean contact pressures for PUF seats coupled with 5th, 50th and 95th percentile FE-ATD’s
5th 50th 95th 5th 50th 95th 5th 50th 95thDensity ( kg/m3)
JC120 62 8.37 9.08 8.74 7.86 7.85 7.39 5.45 5.59 5.14JC100 60 8.08 8.76 8.15 7.59 7.60 7.03 5.32 5.44 5.01JC80 58 5.53 6.60 6.24 4.97 5.64 5.26 3.49 4.07 3.61
FE-ATD
Mean Pressure (MP90,kPa) Mean Pressure (MP70, kPa) Overall Mean Pressure (OMP, kPa)
Seat Material FE-ATD FE-ATD
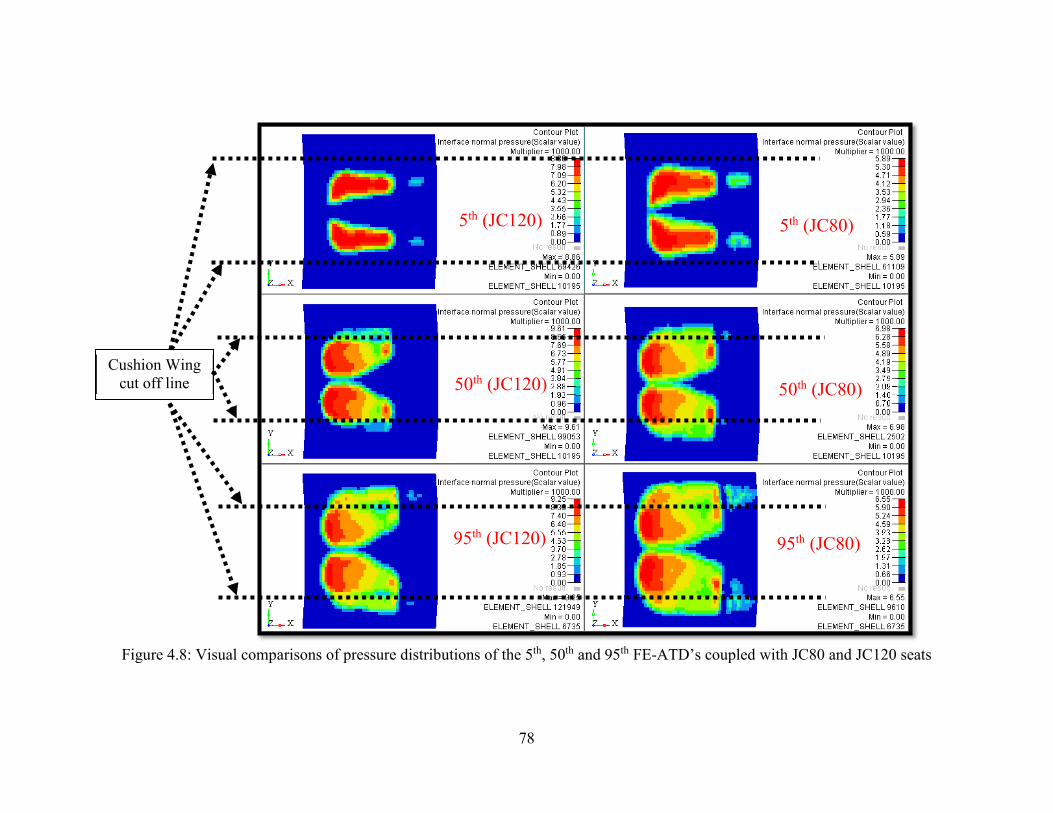
78
Figure 4.8: Visual comparisons of pressure distributions of the 5th, 50th and 95th FE-ATD’s coupled with JC80 and JC120 seats
5th (JC120) 5th (JC80)
50th (JC120) 50th (JC80)
95th (JC120) 95th (JC80)
Cushion Wing cut off line

79
4.4.2 Effect of seat cushion and wing angle
The pressure distributions, illustrated in Figure 4.8, suggest that the contact with the
cushion wings play an important role in distributing the contact pressure and reducing the peak
pressure. The contact with the wings could be enhanced by varying the seat geometry, particularly
the wing angle. The simulations are performed for different wing and cushion angles to study their
effects on contact pressure and contact areas. The seat cushion geometry is slightly modified when
compared to the nominal seat configuration (NSC). Unlike the NSC, the wing angle is kept
constant throughout the length of the seat cushion, as seen in Figure 4.9. The simulations are
limited to only to the PUF material JC80 (58 𝑘𝑘𝑘𝑘/𝑚𝑚3) so as to focus on the effects of cushion and
wing angles alone.
Figure 4.9: Illustrations of the wing geometry: (a) nominal seat configuration; (b) modified seat with uniform wings
Figure 4.10 illustrates the interface peak contact pressure at the seat for the 5th, 50th and
95th FE-ATD’s over the ranges of the wing and cushion angles considered in the study. The results
show only minimal effect of wing angle on the peak pressure obtained with the 5th FE-ATD. The
effect of cushion wing angle is quite significant for the 50th and 95th percentile ATD’s, which is
attributed to their relatively greater contact with the wings. In both cases the highest reduction in
Uniform wing along the seat length Contoured wing towards the front of seat
Modified seat Nominal seat (a) (b)

80
peak pressure is seen for seat with 10 degree fixed cushion angle. The results show 11% reduction
in peak pressure when wing angle is varied from 0 to 35 degrees for the 50th FE-ATD and 14%
reduction in peak pressure for the 95th FE-ATD.
For a fixed wing angle, increasing the cushion angle tends to reduce peak pressure,
irrespective of the FE-ATD’s. The results show that increasing the cushion angle to 10° can yield
reductions of 8%, 21%, 25% in peak pressure for the 5th, 50th and 95th FE-ATD’s, respectively,
when compared to those obtained with a flat cushion (cushion angle = 0°). The 8% reduction in
PP for the 5th FE-ATD is observed for all wing angles, when cushion angle is varied from 0 to 10
degrees. This is due to minimal contact of the ATD with the wings. However, the maximum
reduction of peak pressure of 21% is observed for the 50th FE-ATD for a fixed wing angle of 35
degrees, while the cushion angle is varied from 0 to 10 degrees. The maximum reduction of 25%
in peak pressure is observed for a fixed wing angle of 0 degrees in the case of 95th FE-ATD, while
cushion angle is varied from 0 to 10 degrees.
The results obtained for all 24 combinations of the wing and cushion angles show
maximum reductions in PP of 8%, 25% and 36% for the 5th, 50th and 95th FE-ATD’s, respectively,
when compared to the seat (cushion angle = 0°, wing angle = 35°). The greatest reduction in peak
pressure was observed with the 95th FE-ATD for cushion angle of 10 and wing angle of 35 degrees.
In this case, the seat cushion and the rigid back supported 68% and 32%, respectively, of the
occupant’s body weight on the seat (see Figure 4.11). Even though the seat cushion supports
highest percentage of the load, the PP tends to be the lowest, which is due to enlarged contact area.
This further emphasizes the significance of increasing the seat cushion and wing angle to reduce
peak contact pressure under the tuberosities.
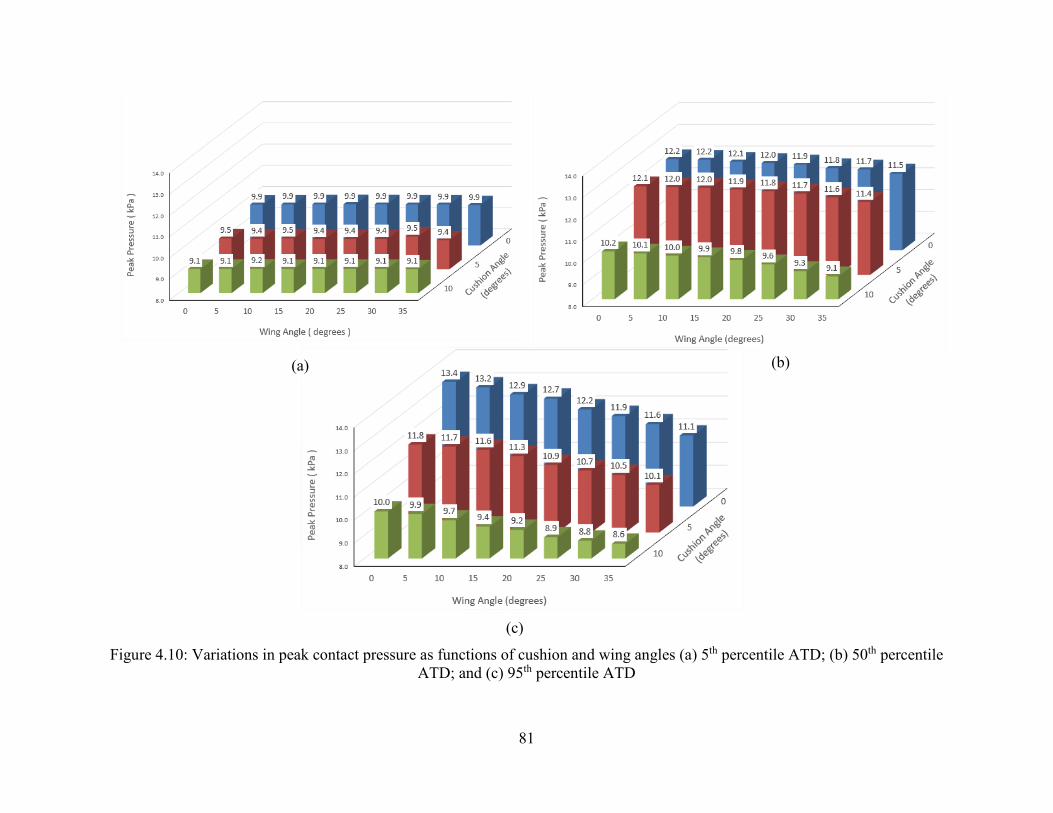
81
Figure 4.10: Variations in peak contact pressure as functions of cushion and wing angles (a) 5th percentile ATD; (b) 50th percentile ATD; and (c) 95th percentile ATD
(a) (b)
(c)

82
Figure 4.11: Effects of variations in cushion and wing angles on the percent body weight supported by the cushion and back support: (a) 5th percentile ATD; (b) 50th percentile ATD; and (c) 95th percentile ATD
(a) (b) (c)
CUSHION ANGLE 0° CUSHION ANGLE 0° CUSHION ANGLE 0°
CUSHION ANGLE 5° CUSHION ANGLE 5° CUSHION ANGLE 5°
CUSHION ANGLE 10° CUSHION ANGLE 10° CUSHION ANGLE 10°
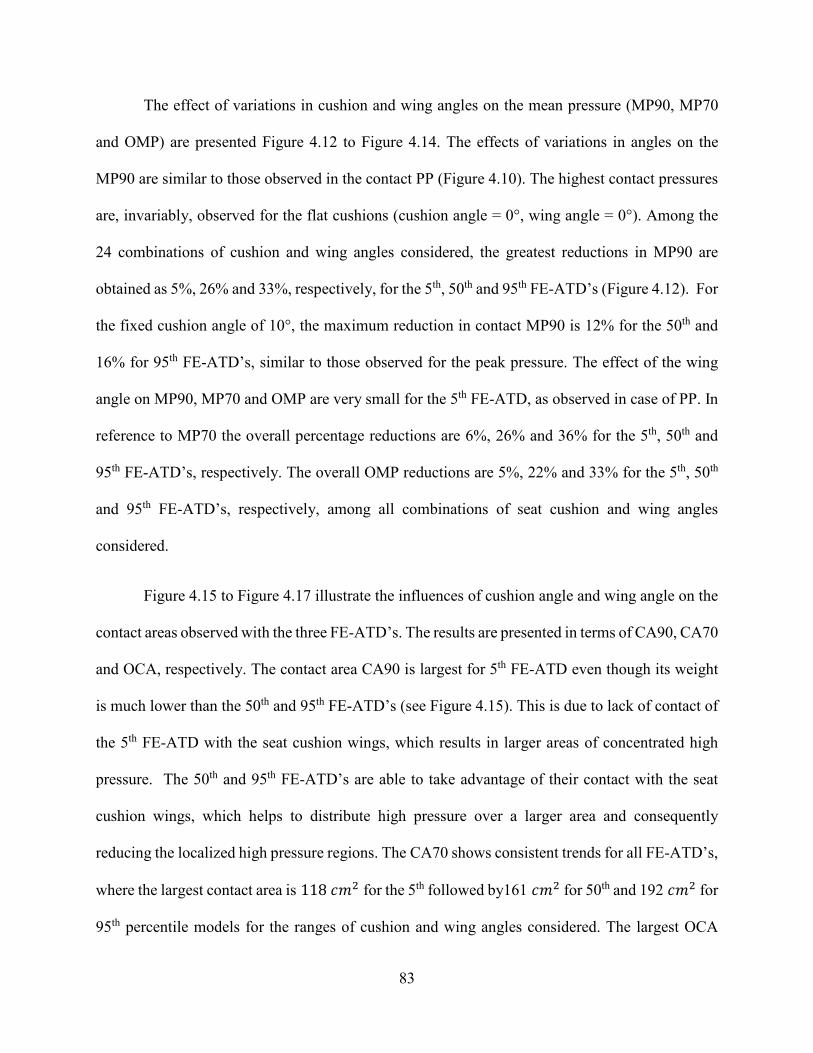
83
The effect of variations in cushion and wing angles on the mean pressure (MP90, MP70
and OMP) are presented Figure 4.12 to Figure 4.14. The effects of variations in angles on the
MP90 are similar to those observed in the contact PP (Figure 4.10). The highest contact pressures
are, invariably, observed for the flat cushions (cushion angle = 0°, wing angle = 0°). Among the
24 combinations of cushion and wing angles considered, the greatest reductions in MP90 are
obtained as 5%, 26% and 33%, respectively, for the 5th, 50th and 95th FE-ATD’s (Figure 4.12). For
the fixed cushion angle of 10°, the maximum reduction in contact MP90 is 12% for the 50th and
16% for 95th FE-ATD’s, similar to those observed for the peak pressure. The effect of the wing
angle on MP90, MP70 and OMP are very small for the 5th FE-ATD, as observed in case of PP. In
reference to MP70 the overall percentage reductions are 6%, 26% and 36% for the 5th, 50th and
95th FE-ATD’s, respectively. The overall OMP reductions are 5%, 22% and 33% for the 5th, 50th
and 95th FE-ATD’s, respectively, among all combinations of seat cushion and wing angles
considered.
Figure 4.15 to Figure 4.17 illustrate the influences of cushion angle and wing angle on the
contact areas observed with the three FE-ATD’s. The results are presented in terms of CA90, CA70
and OCA, respectively. The contact area CA90 is largest for 5th FE-ATD even though its weight
is much lower than the 50th and 95th FE-ATD’s (see Figure 4.15). This is due to lack of contact of
the 5th FE-ATD with the seat cushion wings, which results in larger areas of concentrated high
pressure. The 50th and 95th FE-ATD’s are able to take advantage of their contact with the seat
cushion wings, which helps to distribute high pressure over a larger area and consequently
reducing the localized high pressure regions. The CA70 shows consistent trends for all FE-ATD’s,
where the largest contact area is 118 𝑐𝑐𝑚𝑚2 for the 5th followed by161 𝑐𝑐𝑚𝑚2 for 50th and 192 𝑐𝑐𝑚𝑚2 for
95th percentile models for the ranges of cushion and wing angles considered. The largest OCA

84
measured among all combinations of seat cushion and wing angles is 243 𝑐𝑐𝑚𝑚2, 415 𝑐𝑐𝑚𝑚2 and 585
𝑐𝑐𝑚𝑚2 for 5th, 50th and 95th FE-ATD’s respectively (see Figure 4.17). Based on the computed data
for the 24 combinations of seat cushion and wing angles, the cushion angle of 10-degrees and wing
angle of 35-degrees are most efficient in reducing the contact pressure under the ischial tuberosities
for all FE-ATD’s. Kamp [76] during their subjective evaluations for car seats reported that the car
seats with steepest wings yields greatest sensation of comfort. Their subjective assessments are in
line with computed objective pressure data.
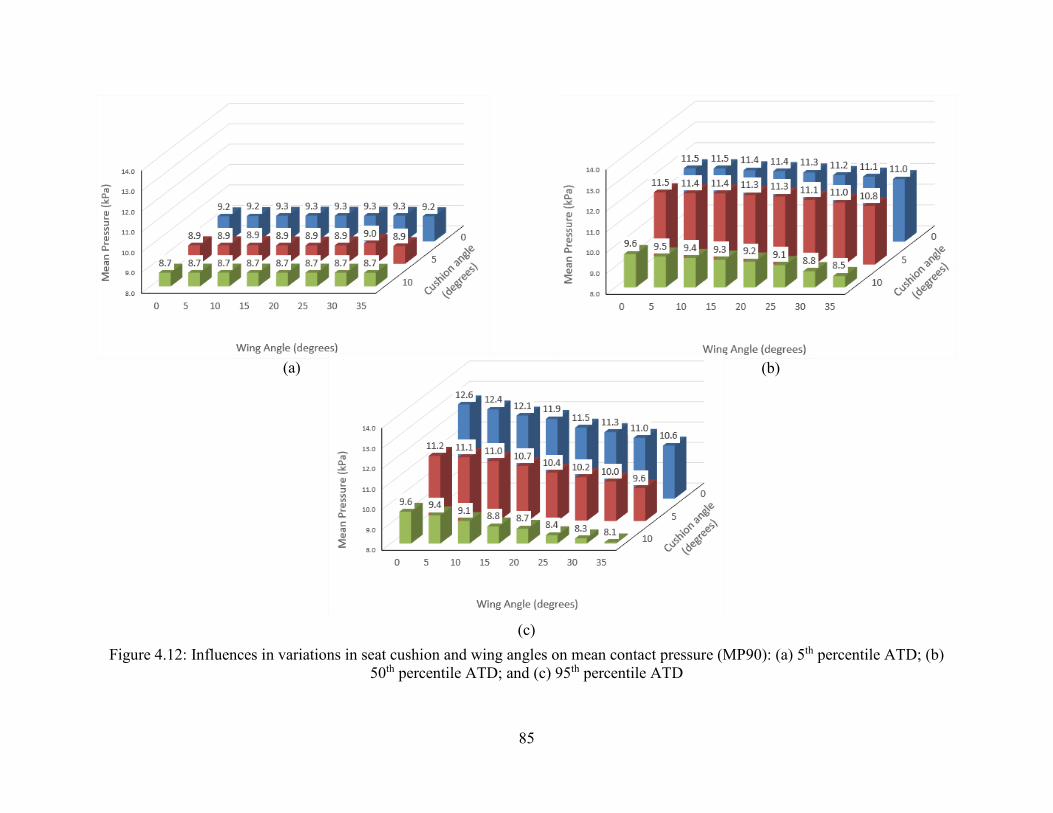
85
Figure 4.12: Influences in variations in seat cushion and wing angles on mean contact pressure (MP90): (a) 5th percentile ATD; (b) 50th percentile ATD; and (c) 95th percentile ATD
(a) (b)
(c)

86
Figure 4.13: Influences in variations in seat cushion and wing angles on mean contact pressure (MP70): (a) 5th percentile ATD; (b) 50th percentile ATD; and (c) 95th percentile ATD
(a) (b)
(c)
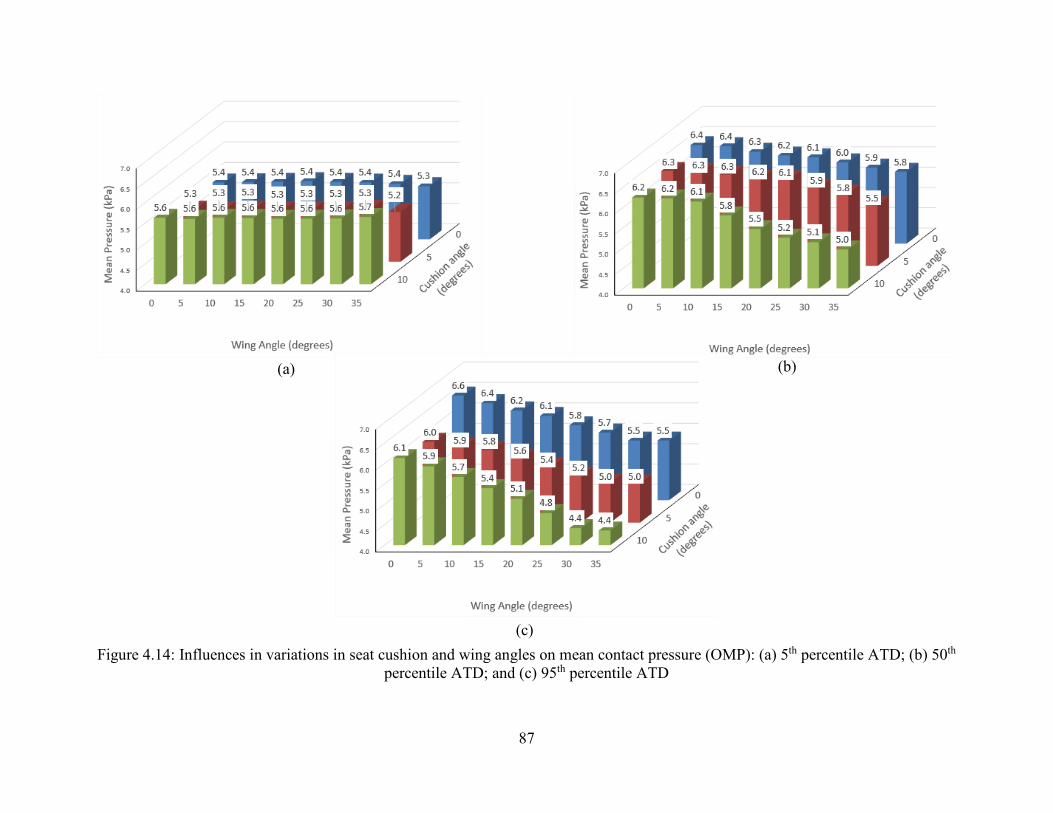
87
Figure 4.14: Influences in variations in seat cushion and wing angles on mean contact pressure (OMP): (a) 5th percentile ATD; (b) 50th percentile ATD; and (c) 95th percentile ATD
(a) (b)
(c)
88
Figure 4.15: Influences in variations in seat cushion and wing angles on contact area (CA90): (a) 5th percentile ATD; (b) 50th percentile ATD; and (c) 95th percentile ATD
(a) (b)
(c)
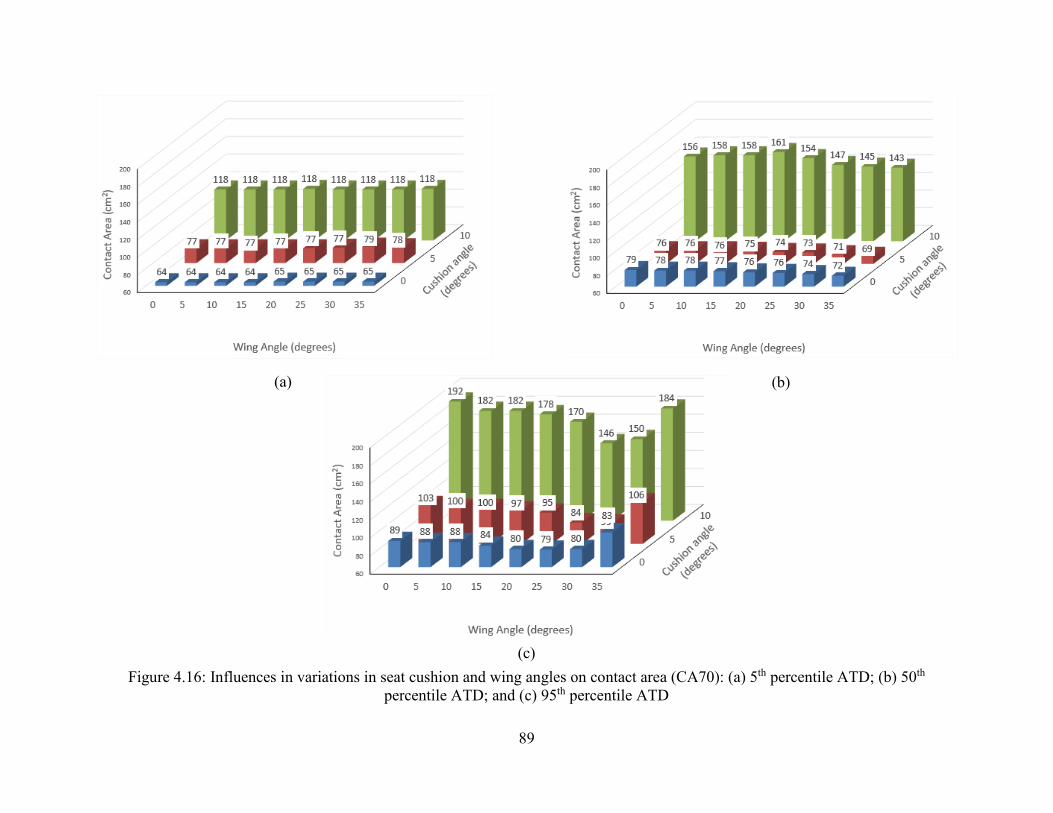
89
Figure 4.16: Influences in variations in seat cushion and wing angles on contact area (CA70): (a) 5th percentile ATD; (b) 50th percentile ATD; and (c) 95th percentile ATD
(a) (b)
(c)

90
Figure 4.17: Influences in variations in seat cushion and wing angles on contact area (OCA): (a) 5th percentile ATD; (b) 50th percentile ATD; and (c) 95th percentile ATD
(a) (b)
(c)

91
4.4.3 Effect of seat cushion thickness
It has been suggested that increasing the cushion thickness can help reduce the peak contact
pressure [20], which is due to lower overall stiffness and higher elastic collapse stress of the thick
cushion. The goal of this section is to determine the effect of variation in the seat cushion thickness
on the computed peak and mean contact pressures, and the contact area under the tuberosities for
the 5th, 50th and 95th FE-ATD’s. The simulations are performed considering four different cushion
thicknesses: 2.5, 5.0, 7.5, and 10 cm. These are realized by considering different number of layers
of the PUF, where each layer is 2.5 cm thick. The nominal seating configuration (NSC), described
in section 4.2, is used as a starting point for the 1 layer seat cushion model. Figure 4.18, illustrates
the reduction in percentage of body weight supported by the seat cushion, when the seat cushion
thickness is increased from 2.5 to 10 cm. The simulation results are presented for the JC80
(58 𝑘𝑘𝑘𝑘/𝑚𝑚3) PUF material.
Figure 4.18: Comparisons of proportions of ATD weights supported by the cushion and the back support of different seat layer cushion design variations

92
Figure 4.19(a) and Figure 4.19(b) compares the interface peak and MP90 pressure
obtained for three FE-ATD’s considering different cushion thickness. The cushion thickness in the
figure is donated by the number of layers, where each layer is 2.5 cm thick. The peak pressure and
mean pressure tends to decrease with increasing cushion thickness, for all FE-ATDs. Both the PP
and MP90 exhibit similar trends with respect to the cushion thickness. For the 5th percentile ATD,
the maximum reduction in peak pressure of 23% is observed when the thickness increase from 2.5
cm (1layer) to 10 cm (4 layers). The maximum reductions in contact PP are 33% for the 50th and
43% for the 95th percentile ATD model for the entire range of cushion thickness considered. The
contact PP for the 50th and 95th FE-ATD’s are very similar, in the ranges of 11.55-10.54 kPa for 1
layer seat cushion and 7.21-6.55 kPa for 2-4 layers. The relatively large contact of the 95th FE-
ATD with the seat cushion helps to lower the PP when compared to 50th FE-ATD. The maximum
contact PP for the 5th, however, is 7.6 kPa for 1 layer and between 6.02-5.88 kPa for 2 to 4 layers.
This is attributed to the lower body weight of the 5th FE-ATD compared to 50th and 95th FE-ATDs,
along with minimal contact with the seat cushion wings. The trend of reduction in high pressures
when cushion thickness is increased from 2.5 cm to 5 cm is consistent among all three FE-ATDs.
It should be noted that there is a reduction in load supported by the seat cushion when the thickness
is increased from 2.5 to 10 cm. The reduction of 3%, 5% and 7% is observed for the 5th, 50th and
95th FE-ATD respectively. Even though the load supported by the seat cushion the percentage
reduction in PP is quite significant.
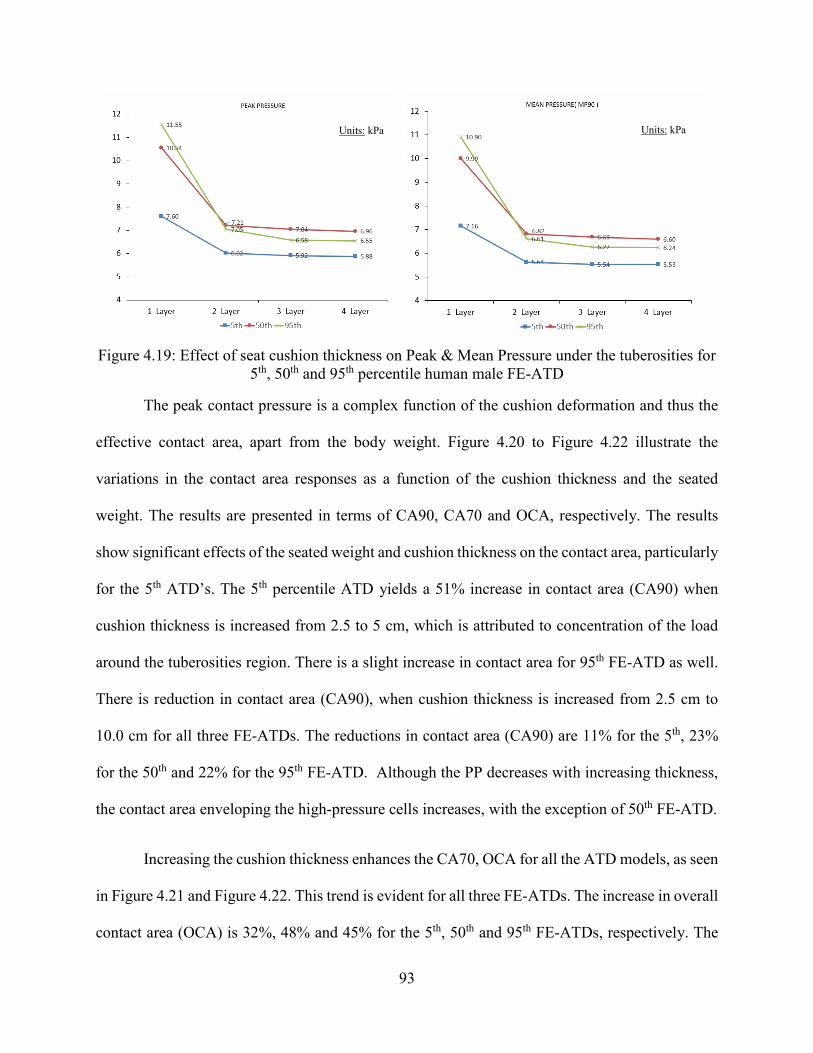
93
Figure 4.19: Effect of seat cushion thickness on Peak & Mean Pressure under the tuberosities for 5th, 50th and 95th percentile human male FE-ATD
The peak contact pressure is a complex function of the cushion deformation and thus the
effective contact area, apart from the body weight. Figure 4.20 to Figure 4.22 illustrate the
variations in the contact area responses as a function of the cushion thickness and the seated
weight. The results are presented in terms of CA90, CA70 and OCA, respectively. The results
show significant effects of the seated weight and cushion thickness on the contact area, particularly
for the 5th ATD’s. The 5th percentile ATD yields a 51% increase in contact area (CA90) when
cushion thickness is increased from 2.5 to 5 cm, which is attributed to concentration of the load
around the tuberosities region. There is a slight increase in contact area for 95th FE-ATD as well.
There is reduction in contact area (CA90), when cushion thickness is increased from 2.5 cm to
10.0 cm for all three FE-ATDs. The reductions in contact area (CA90) are 11% for the 5th, 23%
for the 50th and 22% for the 95th FE-ATD. Although the PP decreases with increasing thickness,
the contact area enveloping the high-pressure cells increases, with the exception of 50th FE-ATD.
Increasing the cushion thickness enhances the CA70, OCA for all the ATD models, as seen
in Figure 4.21 and Figure 4.22. This trend is evident for all three FE-ATDs. The increase in overall
contact area (OCA) is 32%, 48% and 45% for the 5th, 50th and 95th FE-ATDs, respectively. The
Units: kPa Units: kPa

94
addition of layers 2, 3 and 4, adds sufficient material within the seat cushion wings, which changes
the load path from under the tuberosities towards the cushion wings for all three FE-ATDs. This
change in load path underneath the tuberosities helps to reduce contact area CA90, while
increasing the MP70 and overall contact area (OCA).
Figure 4.20: Effect of seat cushion thickness on contact area (CA90) under the tuberosities for 5th, 50th and 95th percentile human male FE-ATD
Figure 4.21: Effect of seat cushion thickness on contact area (CA70) under the tuberosities for 5th, 50th and 95th percentile human male FE-ATD
Units: cm2
Units: cm2

95
Figure 4.22: Effect of seat cushion thickness on contact area (OCA) under the tuberosities for 5th, 50th and 95th percentile human male FE-ATD
The results suggest that increasing the seat thickness is generally advantageous in reducing
the contact pressure for all three FE-ATD’s. For the 5th percentile FE-ATD, however, there is an
initial increase in high pressure contact area CA90. The CA90 is increased by 51% when the
number of layers is increased from 1 to 2. The overall peak pressure reductions are 23%, 33% and
43% for the 5th, 50th and 95th FE-ATDs for all considered thicknesses.
4.5 Multilayer seat cushion design
The flow of force/load within any structure is essentially dictated by the stress
concentrations introduced due to variations in geometry or material. The results presented in the
previous section show strong dependence of contact pressure concentration on the seat geometry
and cushion thickness. The contact pressure in the vicinity of the tuberosities, which has been
correlated with sensation of comfort [7, 11, 31], may be reduced by designing a seat with multiple
layers of PUF material of varying stiffness or density. In this study, a multilayer seat cushion
design (MLSD) is configured by introducing four layers of the same or different PUF materials in
Units: cm2

96
the mid-section of the seat, as shown in Figure 4.23. Each layer is assigned the properties of either
JC80 or JC120 foams. The cushion wings represented by a single layer of either JC80 or JC120
foam of equivalent thickness, since these do not cause very high contact pressure.
Figure 4.23: Multilayer seat cushion FE model
4.5.1 Design Configurations
Eleven different configuration of MLSD are conceived by considering different
arrangements of JC80 and JC120 foam layers. These include the two nominal configurations with
JC80 and JC120 foam layers as shown in Figure 4.24(a) and Figure 4.24(b). Owing to the strong
contributions of the cushion wings, additional designs are realized by replacing the wings of the
nominal seat by the lighter/denser foams, as shown in Figure 4.24(c) and Figure 4.24(d). The
remaining 7 designs are realized by combining layers of two different foam materials, as shown in
Figure 4.24(e) to Figure 4.24(k). Each design configuration is labelled by 6 letters describing the
arrangements of the PUF material layers. Letters “H” and “h” are used for high-density foam
JC120 layers in the wings and mid-section of the seat cushion, respectively. The lighter foam JC80
within wings and the mid-section is denoted by letters “S” and “s”, respectively. The design
configuration is denoted by the property (label) of the right wing, four mid-section layers (from
Left Wing Right Wing
Layer 1 Layer 2
Layer 3 Layer 4

97
top to bottom layer) and left wing. For instance, notation [HssssH] implies right and left wings of
JC120 foam material (H) and 4 layers of JC80 foam material in the mid-section (s). Similarly, the
notation [ShhssS] refers to wings of JC80 foam (S), two top layers of high density JC120 foam (h)
and two bottom layers of low-density foam (s). Each design configuration is modeled using the
material properties described in section 3.1.3.2 and the nominal seat geometry (cushion angle =
10°; wing angle of 10° and rigid back support angle =15°). Each seat model is further coupled with
5th, 50th and 95th percentile ATD model. The coupled seat-ATD models are analyzed to assess the
effects of multilayer designs on the peak and mean contact pressure and the contact areas.
Figure 4.24: Layout of JC120 and JC80 PUF materials within the seat cushion
JC 120 (62 𝑘𝑘𝑘𝑘/𝑚𝑚3)
JC 80 (58 𝑘𝑘𝑘𝑘/𝑚𝑚3)
(a) – HhhhhH (b) – SssssS
(d) – ShhhhS (c) – HssssH
(f) – HsshhH
(h) – HhsssH
(i) – HhsshH
(e) – HhhssH
(g) – HhhhsH
(k) – HshhhH
(j) – HshhsH

98
4.5.2 Peak contact pressure response characteristics
Figure 4.26 presents the contact PP responses of the eleven seat designs coupled with 5th,
50th and 95th FE-ATD’s. The results show significant effects of the seat design layout on the
resulting peak contact pressure. The peak contact pressures of the two nominal designs ([HhhhhH]
and [SssssS]) range from 8.84 to 9.61 kPa and 5.89 to 6.93 kPa, respectively, for the three ATD
models, which have also been described in section 4.4.1. The results show significant effects of
the wings material property. Replacing the high-density foam in the mid-section of the nominal
cushion design [HhhhhH] with low density PUF material ([HssssH]) design yields most significant
reductions in the peak pressures. The high-density cushion wings help to the change in load path
under the tuberosities, by creating an alternate path of high stiffness towards the cushion wings
compared to the less dense cushion middle section. The results show strong dependence of the PP
on the ATD weight and dimensions. The seat design with wings of high density foam and low
density mid-section [HssssH] yields 35%, 33% and 42% reductions in PP for the 5th, 50th and 95th
percentile FE-ATD’s, respectively, when compared to the nominal [HhhhH] design. The largest
reduction in PP is observed for the 95th FE-ATD due to its wider body structure.
Variations in the material properties also alter the load distribution on the cushion and back
support. The observed differences in the PP may thus be partly caused by variations in the ATD
weight supported by the seat cushion. Figure 4.27 presents the load supported by the seat cushion
and seat back for all MLSD design configurations. It can be seen that the load supported by the
nominal high-density foam design [HhhhhH] is nearly identical to the target load distribution (60%
and 40% on the cushion and back support, respectively, for all the three FE-ATD’s. Replacing the
high-density foam in the mid-section by the low density foam [HssssH], however, reduced the
body weight supported by the cushion to 51-53% range for the three FE-ATD’s. This is partly due

99
to bottoming effect of the less dense PUF material in the vicinity of the ischial tuberosities, which
contributes to relatively lower PP.
The low-density material wings coupled with high-density foam cushion ([ShhhhS]) yield
substantially higher PP compared to other design configurations, especially with the 50th and 95th
percentile FE-ATDs. The poor performance of the soft wings is also evident from comparisons of
the PP performances of the [SssssS] and [HssssH] designs. The [HssssH] design configuration
yields 2%, 7% and 18% lower PP compared to the [SssssS] design for the 5th, 50th and 95th FE-
ATD’s, respectively. The largest reduction in peak contact pressure is seen for the 95th FE-ATD
due to larger contact with the seat cushion wings, as noted earlier. The results suggest that stiffness
of the seat cushion wings play an important role in distributing the body weight on the seat cushion
and thus the contact pressure. The high-density foam wings form an effective alternate load path,
which helps distribute the body weight more uniformly and thereby reduce the PP. Results further
show that the use of low-density foam in the upper layers of the mid-section is beneficial in
reducing the peak contact pressure. Introducing the high-density layers in the cushion bottom may
also reduce the bottoming effect, particularly with the higher body weight. The [HsshhH] design
reveals peak pressures of 5.85, 6.60 and 5.69 kPa for 5th, 50th and 95th percentile FE-ATD’s,
respectively, while the respective peak pressures of the [HssssH] design are 5.75, 6.44 and 5.39
kPa. Furthermore, the load supported by the [HsshhH] cushion design is in the 58-59% range,
which is close to the target value (NSC). The results clearly show that the design with high-density
foam top layers in the vicinity of the occupant’s buttocks is not beneficial for reducing the peak
contact pressure under the tuberosities. The seat configurations with dense PUF material in the
vicinity of the buttocks show pressures in the ranges of 8.58-8.9, 8.95-9.81 and 7.9-10.83 kPa for
the 5th, 50th and 95th percentile FE-ATD’s, respectively. This can be attributed to the localized

100
stiff/dense material directly underneath the tuberosities, which results in local high-pressure zones.
Based on the peak contact pressure and cushion support loads, it is evident that seat cushions with
dense cushion PUF wings together low-density foam layers in the mid-section of the seat would
be beneficial.
Figure 4.25: MLSD variations with lowest peak contact pressures beneath the ischium region
Among the 11 design configurations, three MLSD variations are considered most
promising for limiting the PP, while maintain the target load distributions. These include the
[SssssS], [HssssH] and [HsshhH] designs, as shown in Figure 4.25. These three MLSD variations,
hereafter referred to as MLSD T1, T2 and T3 designs, respectively, are further analyzed in terms
of peak and mean contact pressures, and contact areas. The loads supported by the cushion of the
T1 and T3 design configurations are comparable to the target values, which range from 58-61%
for the three FE-ATDs. The T2 design with low-density mid-section layers, however, exhibits
relatively lower proportions of the ATD weight on the cushion, which is attributed to bottoming
effect of low-density foam layers in the mid-section as stated earlier. In this case, the load
supported by the cushion ranges from 51 to 54% for the three FE-ATDs considered, as seen in
Figure 4.27. Despite the relatively smaller cushion load, the T2 design exhibits peak pressures that
are either comparable to or slightly lower than those observed for the T1 and T3 seat designs. This
is because all three designs incorporate low-density PUF material directly beneath the ischial
MLSD Variation (T2) MLSD Variation (T1)
MLSD Variation (T3)
JC120 (62 𝑘𝑘𝑘𝑘/𝑚𝑚3) JC80 (58 𝑘𝑘𝑘𝑘/𝑚𝑚3)

101
tuberosities. Comparing the load supported by the seat cushions of designs T1, T2 and T3 reveals
that T1and T3 report peak pressure comparable to T2, even when more load is supported by their
seat cushions. This observation further emphasizes the importance of computing the load
supported by the seat cushion and the back support, when assessing the peak contact pressure
performance of the seat, which has been neglected in vast majority of the reported studies [9, 10,
12, 14, 18, 20]. For the 5th percentile FE-ATD, the peak pressures of the T1, T2 and T3 design are
obtained as 5.89, 5.75 and 5.85 kPa, respectively, while the respective PP for the 50th percentile
FE-ATD are 6.93, 6.44 and 6.60 kPa. For the 95th percentile, the peak contact pressures of the T1,
T2 and T3 designs are obtained as 6.55, 5.39 and 5.69 kPa, respectively.
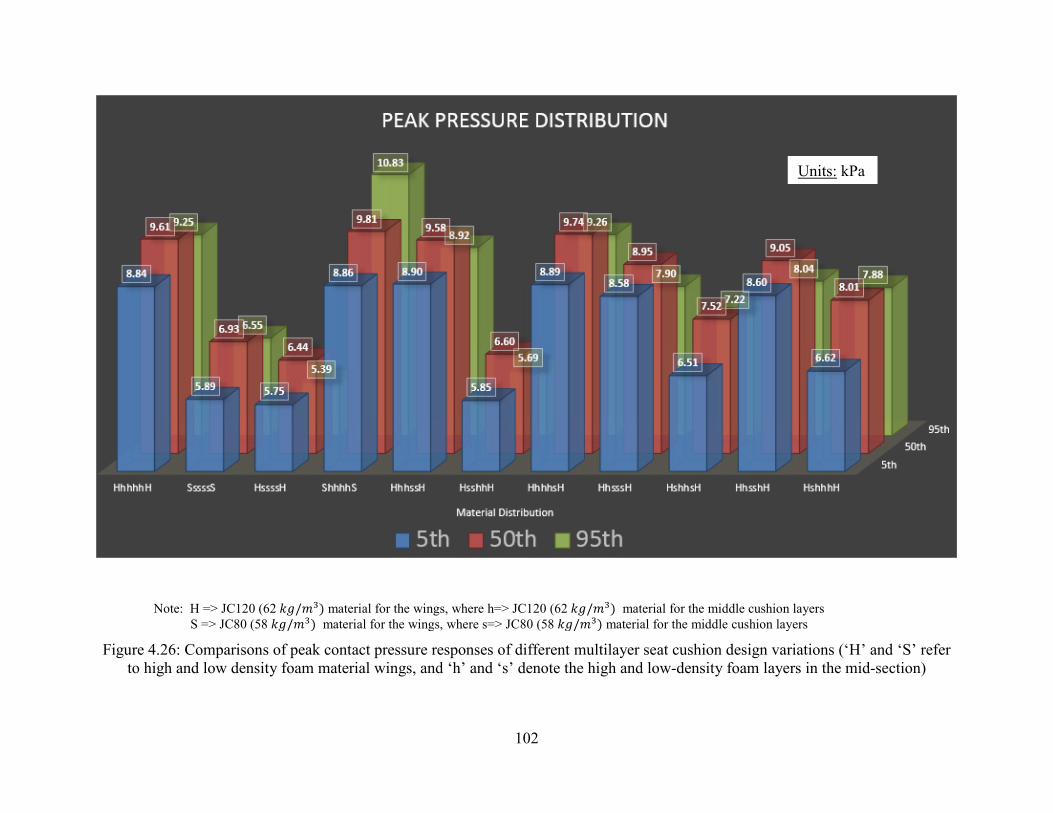
102
Figure 4.26: Comparisons of peak contact pressure responses of different multilayer seat cushion design variations (‘H’ and ‘S’ refer to high and low density foam material wings, and ‘h’ and ‘s’ denote the high and low-density foam layers in the mid-section)
Note: H => JC120 (62 𝑘𝑘𝑘𝑘/𝑚𝑚3) material for the wings, where h=> JC120 (62 𝑘𝑘𝑘𝑘/𝑚𝑚3) material for the middle cushion layers S => JC80 (58 𝑘𝑘𝑘𝑘/𝑚𝑚3) material for the wings, where s=> JC80 (58 𝑘𝑘𝑘𝑘/𝑚𝑚3) material for the middle cushion layers
Units: kPa

103
Figure 4.27: Comparisons of proportions of ATD weights supported by the cushion and the back support of different multilayer seat cushion design variations (‘H’ and ‘S’ refer to high and low density foam material wings, and ‘h’ and ‘s’ denote the high and low-
density foam layers in the mid-section)
Note: H => JC120 (62 𝑘𝑘𝑘𝑘/𝑚𝑚3) material for the wings, where h=> JC120 (62 𝑘𝑘𝑘𝑘/𝑚𝑚3) material for the middle cushion layers S => JC80 (58 𝑘𝑘𝑘𝑘/𝑚𝑚3) material for the wings, where s=> JC80 (58 𝑘𝑘𝑘𝑘/𝑚𝑚3) material for the middle cushion layers
104
Figure 4.29 to Figure 4.31 illustrate the interface contact areas of the MLSD variations in
terms of CA90, CA70 and OCA, respectively. The results clearly show wide variations in the
contact areas responses of different design variations coupled with the FE-ATD’s. The three
promising MLSD variations (T1, T2 and T3) with lower peak pressures exhibit comparable contact
area (CA90) when coupled with the 50th and 95th percentile FE-ATD’s. This is due to somewhat
comparable peak pressures of the three designs with relatively heavier ATDs. For the 50th and 95th
percentile ATDs, the CA90 for the three designs range from 22-24 𝑐𝑐𝑚𝑚2 and 39-42 𝑐𝑐𝑚𝑚2 ,
respectively, as seen in Figure 4.31. The T2 and T3 design variations, however, exhibit nearly 19%
greater high-pressure contact area compared to the T1 design, when coupled with the 5th percentile
ATD. This is likely due to relatively smaller contact of the 5th percentile ATD with the side wings.
Figure 4.30 compares the areas of mid to high ranges of contact pressure (CA70) of all the MLSD
variations considered in the study. The results show the benefits of employing dense PUF material
cushion wings relative to the mid- section, especially for the 50th and 95th percentile ATDs. The
mid-to high contact pressure areas (CA70) of the 50th and 95th percentile ATDs for the T2 and T3
are in the 184-185 cm2 and 426-442 cm2. These areas tend to be substantially smaller in case of
the T1 design (126 𝑐𝑐𝑚𝑚2 for the 50th and 226 𝑐𝑐𝑚𝑚2for the 95th), respectively, which yields relatively
higher contact pressures. The 95th FE-ATD is able to take advantage of its larger contact with the
cushion wings. The results suggest nearly 48% and 47% higher contact areas (CA70) for the T2
and T3 designs coupled with 95th FE-ATD when compared to the seat design T1. Similar trend is
also evident for the 50th percentile ATD, although the percentage differences in the CA70 contact
area relative to the T1 are not as large due to relatively lesser contact between the 50th FE-ATD
and the seat cushion wings. The results show about 32% larger contact area (CA70) for the T2 and
T3 designs coupled with the 50th FE-ATD, when compared to the T1 design. The three seat

105
designs, however, show comparable contact area CA 70 for the 5th FE-ATD due to minimal contact
with the seat cushion wings.
Considering the overall contact area (OCA), the T1 design seems to be the preferred seat
design when compared to the T2 and T3 designs in view of the body-seat contact area (Figure
4.31). Unlike the CA90 and CA70 areas, the OCA tends to be considerably larger with the
relatively soft T1 design, irrespective of the ATD dimensions. This is due to considerably larger
deformation of the T1 design with low-density materials in the wings and the mid-section. The T2
and T3 designs exhibit comparable OCA for the 50th and 95th percentile ATDs, ranging from 624-
633 cm2 and 807-811 cm2, respectively, results are only applicable for the 95th FE-ATD. There is
negligible change for both 5th and 50th FE-ATD’s. These are nearly 4% and 15% higher,
respectively, for the T1 design.
Figure 4.32 to Figure 4.34 compare the mean pressure distributions of the various designs
coupled with the three ATDs in terms of MP90, MP70 and TMP. The results exhibit comparable
trends in mean pressure variations at the occupant-seat interface for the three FE-ATD’s among
all the MLSD variations. The MP90, MP70 and TMP values lie between 5.07-10.31 kPa, 4.91-
8.56 kPa, and 3.48-5.79 kPa, respectively, across the three FE-ATD’s. The three seat designs (T1,
T2 and T3), however, exhibit notable differences in the mean pressure distributions, especially for
the 50th and 95th percentile ATD in view of MP90. These are observed in the 5.42-5.53 kPa, 6.06-
6.55 kPa and 5.07-6.24 kPa ranges for the 5th, 50th and 95th percentile ATDs, respectively. The
mean pressure MP70 values are also quite comparable for the three seat designs when coupled
with a particular ATDs. The results generally follow the trends in the contact areas. The larger
contact areas between the larger size ATDs (95th percentile) generally yield lower mean pressures
compared to the smaller size ATD (5th percentile).

106
The benefit of employing relatively high-density material cushion wings can also be
observed from the deformation plots of the seat designs, which are also indicative of the load path.
As an example, Figure 4.28 illustrates the deformation profiles of the three seat design variations
(T1, T2 and T3) coupled with the 95th percentile ATD, which also show the load path within each
design directly under the ischial tuberosities. The deformation plots are very similar for the T1 and
T2 designs. The deformation profile of the T3 design, however, shows bottoming effect in the T3
design comprising high-density (JC120) foam layers in the bottom of the cushion middle section.
The figures also show reference markers for each design. The deformation plots suggest relatively
greater deformation of T2 compared to the T1, as indicated by the relative positions of the markers.
This suggests that relatively larger load is transferred towards the wings in the T2 design when
compared to the T1 design. This further suggests that a seat design with soft material in the mid-
section together with high-density material wings helps transfer more load to the sides and thereby
reduce the peak and mean contact pressures. The T2 and T3 designs comprise high-density
material wings and low-density PUF material layers in the vicinity of the buttocks, the load
supported by the T3 design was 5-6% higher compared to the T2 design even though the mean and
peak pressures of the two designs were comparable. From the results, it is deduced that the T3 seat
design can help reduce the high contact pressures more efficiently. It is also proposed that a seat
with laterally adjustable seat cushion wings can help further reduce the peak pressure for all the
FE-ATD’s.
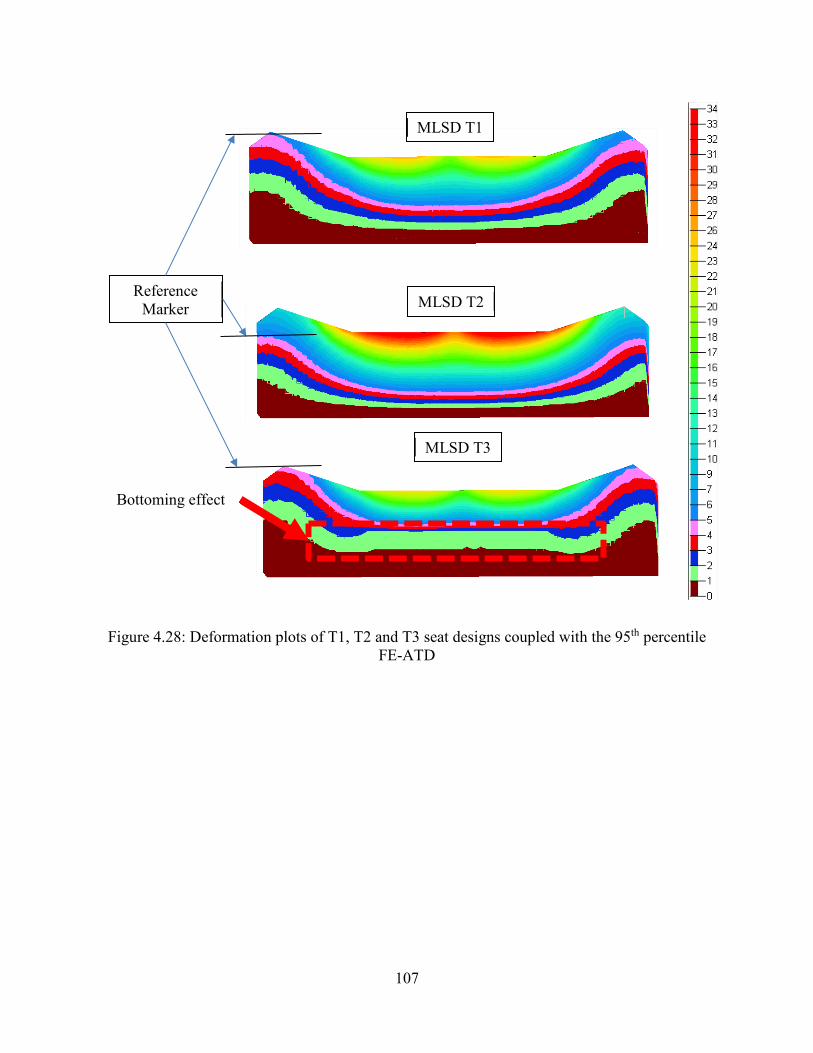
107
Figure 4.28: Deformation plots of T1, T2 and T3 seat designs coupled with the 95th percentile FE-ATD
MLSD T1
MLSD T2 Reference
Marker
Bottoming effect
MLSD T3

108
Figure 4.29: Comparisons of contact areas (CA90) due to cells experiencing pressure equal to or above 90% of the peak pressure of the design variations coupled with 5th, 50th and 95th percentile ATDs
Units: cm2
Note: H => JC120 (62 𝑘𝑘𝑘𝑘/𝑚𝑚3) material for the wings, where h=> JC120 (62 𝑘𝑘𝑘𝑘/𝑚𝑚3) material for the middle cushion layers S => JC80 (58 𝑘𝑘𝑘𝑘/𝑚𝑚3) material for the wings, where s=> JC80 (58 𝑘𝑘𝑘𝑘/𝑚𝑚3) material for the middle cushion layers

109
Figure 4.30: Comparisons of contact areas (CA70) of the design variations coupled with 5th, 50th and 95th percentile ATDs
Units: cm2
Note: H => JC120 (62 𝑘𝑘𝑘𝑘/𝑚𝑚3) material for the wings, where h=> JC120 (62 𝑘𝑘𝑘𝑘/𝑚𝑚3) material for the middle cushion layers S => JC80 (58 𝑘𝑘𝑘𝑘/𝑚𝑚3) material for the wings, where s=> JC80 (58 𝑘𝑘𝑘𝑘/𝑚𝑚3) material for the middle cushion layers

110
Figure 4.31: Comparisons of overall contact areas (OCA) of the design variations coupled with 5th, 50th and 95th percentile ATDs.
Units: cm2
Note: H => JC120 (62 𝑘𝑘𝑘𝑘/𝑚𝑚3) material for the wings, where h=> JC120 (62 𝑘𝑘𝑘𝑘/𝑚𝑚3) material for the middle cushion layers S => JC80 (58 𝑘𝑘𝑘𝑘/𝑚𝑚3) material for the wings, where s=> JC80 (58 𝑘𝑘𝑘𝑘/𝑚𝑚3) material for the middle cushion layers

111
Figure 4.32: Comparisons of mean pressure (MP90) responses of the design variations coupled with 5th, 50th and 95th percentile ATDs.
Units: kPa
Note: H => JC120 (62 𝑘𝑘𝑘𝑘/𝑚𝑚3) material for the wings, where h=> JC120 (62 𝑘𝑘𝑘𝑘/𝑚𝑚3) material for the middle cushion layers S => JC80 (58 𝑘𝑘𝑘𝑘/𝑚𝑚3) material for the wings, where s=> JC80 (58 𝑘𝑘𝑘𝑘/𝑚𝑚3) material for the middle cushion layers
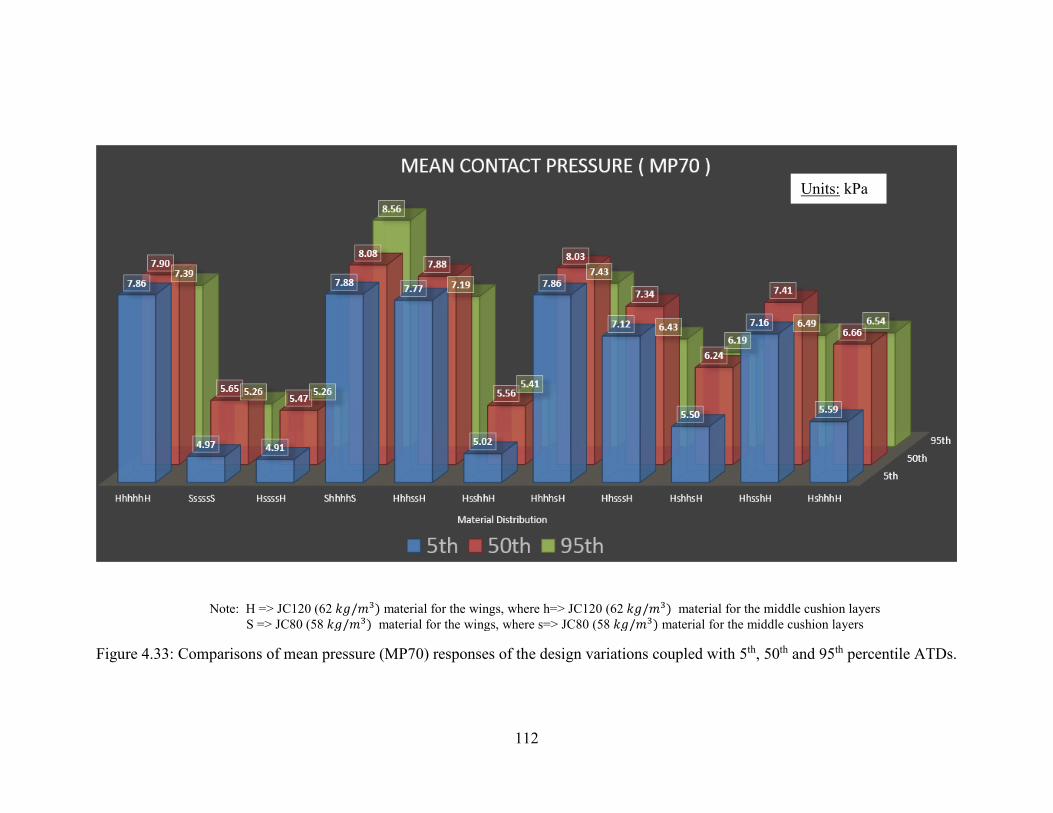
112
Figure 4.33: Comparisons of mean pressure (MP70) responses of the design variations coupled with 5th, 50th and 95th percentile ATDs.
Units: kPa
Note: H => JC120 (62 𝑘𝑘𝑘𝑘/𝑚𝑚3) material for the wings, where h=> JC120 (62 𝑘𝑘𝑘𝑘/𝑚𝑚3) material for the middle cushion layers S => JC80 (58 𝑘𝑘𝑘𝑘/𝑚𝑚3) material for the wings, where s=> JC80 (58 𝑘𝑘𝑘𝑘/𝑚𝑚3) material for the middle cushion layers

113
Figure 4.34: Comparisons of overall mean pressure (OMP) responses of the design variations coupled with 5th, 50th and 95th percentile ATDs.
Units: kPa
Note: H => JC120 (62 𝑘𝑘𝑘𝑘/𝑚𝑚3) material for the wings, where h=> JC120 (62 𝑘𝑘𝑘𝑘/𝑚𝑚3) material for the middle cushion layers S => JC80 (58 𝑘𝑘𝑘𝑘/𝑚𝑚3) material for the wings, where s=> JC80 (58 𝑘𝑘𝑘𝑘/𝑚𝑚3) material for the middle cushion layers

114
4.6 Summary and conclusion
In this chapter a systematic investigation was undertaken to explore the effects of seat design
parameters on the resulting contact pressure distributions and contact areas, using explicit finite
element analysis. The results showed significant effects of the stress-strain characteristics of the
polyurethane foam material on the seat deformation and thus the contact pressure distribution,
which was further affected by the dimensions of the ATD. The results further revealed important
effects of elastic collapse stress of the material on the contact pressure concentration. The high-
density cushion wings could serve as an additional load path and thus lead to significant reductions
in the peak contact pressure. Only minimal benefits of the cushion wings, however, were observed
for the 5th percentile FE-ATD due to its relatively small contact with the wings. Laterally
adjustable side wings may thus be considered to provide this additional low path for small size
occupant’s. The concentration of high contact pressure at the occupant-seat interface can be
substantially altered by considering a seat cushion design with multiple layers of different PUF
materials (MLSD). Such a design can provide additional flexibility to direct the load path towards
the wings, even when there is no significant body contact with the cushion wings. A seat cushion
design with wings made of relatively denser PUF material compared to the seat cushion middle
section can yield lower peak contact pressures.

115
Chapter 5
CONCLUSIONS AND RECOMMENDATIONS FOR FUTURE WORK
5.1 Major Contributions
This dissertation’s primary goals were to determine the body-seat contact properties using
explicit dynamic finite element simulations, and to seek design guidelines for PUF seats. The
coupled occupant-seat models were developed for different body sizes namely 5th percentile
female, and 50th and 95th percentile male population to evaluate the ranges of contact pressure and
area. The major insights gained from the influence of variations in the seat cushion material and
geometry on the interface contact pressure and contact area distributions are summarized below:
i. The polyurethane foam (PUF) material compression test FE model developed in the study
showed that the hyperelastic stress-strain responses of the PUF materials can be reliably
calculated employing explicit dynamic finite element platform, LS-DYNA®.
ii. The frontal crash anthropomorphic test devices (FE-ATD’s), which have been limited to crash
injury investigations can be effectively used for seating comfort analysis and to generate seat
cushion design guidelines
iii. The study of influencing factors related to seat cushion material and geometry revealed: (i)
the seat cushion wings play a critical role in reducing the contact pressure under the ischial
tuberosities and can help to distribute high contact pressure over a larger contact area; and (ii)
a seat cushion design with laterally adjustable seat cushion wings can reduce the peak contact
pressures developed under the ischial tuberosities, for all body sizes considered in the study.

116
5.2 Major Conclusions
The major findings of the study are briefly summarized below:
i. The seat cushion with a soft PUF material (less dense), underneath the ischial tuberosities,
yields beneficial effect in reducing the contact pressure peaks for the 50th and 95th subjects.
Only minimal reduction in contact pressure, however, could be realized for 5th percentile
population, due to negligible to minimal contact with the seat wings.
ii. Apart from the density, the comfort performance of the seat is strongly related to the stress-
strain characteristics of the PUF material.
iii. The seat cushions wings constitute an additional load path and thus have a significant role in
reducing peak and mean contact pressures under the ischial tuberosities. The peak and mean
contact pressures for the 95th FE-ATD were lower than those of the 50th percentile FE-ATD.
This was attributed to greater usage of the side wings by the 95th percentile FE-ATD.
iv. Relatively dense seat cushion wings compared to the cushion middle section helps to further
reduce the peak contact pressure under the tuberosities. A major factor for distribution of high
pressure over a larger area at the occupant-seat interface is achieved by having relatively
harder material in the wings compared to the seat cushion middle section.
v. Large seat cushion wing and cushion angles also help to reduce peak contact pressure
distributions by providing larger contact area and consequently redistributing the load over a
larger area.
vi. Comparable peak contact pressure values at the occupant-seat interface were obtained for 50th
and 95th percentile FE-ATD’s. The physical prototype testing phase in the seat design cycle,
may thus be limited to either 50th or 95th percentile subjects. Owing to the distinctly different

117
response characteristics of the seats loaded with the 5th FE-ATD, the prototype evaluations
need to be conducted for the 5th population.
vii. The coupled seat-ATD model could serve as an effective tool for design of the seats and
comfort performance analysis. A seat cushion design of multiple layers of PUF material with
only slightly different densities can lead to significant reductions in the peak contact pressures.
5.2 Recommendations for Future Work
The present study is considered as an important step towards the understanding of the
roles of different seat cushion design features and their influences on the occupant comfort,
particularly the body-seat contact pressure distribution. The numerical models and the analysis
methodology used in this study can be effectively used to seek near optimal design of seats and to
assess the contact properties of seats in an efficient manner. Furthermore, the model can help limit
the number of experimental trials for the design and assessment of prototype seats, which often
exhibit wide variabilities in the measured performance characteristics. The current study, however,
was limited to static seating comfort and the available PUF material properties. It is anticipated
that improved seat designs of seats could be realized to achieve enhanced static and dynamic
comfort by considering alternate PUF materials. For this purpose, it is suggested to undertake the
following further studies.
i. The coupled seat-occupant model needs to be enhanced considering dynamic properties of the
occupant and the seat. The available ATD models are not suited for analysis under continuous
vibration. The ATD model will thus needs to be modified to mimic the biodynamic behavior
of the seated body, which is described in an ISO standard (ISO-5982). The rate-dependent
stress-strain properties of the PUF material also need to be characterized for developing a
dynamic model. In LS-DYNA the rate effects can be modeled in low and medium density

118
foams using material model *MAT_FU_CHANG_FOAM / MAT_083. Hysteretic beahviour
of this model in particular, unloading is a function of the strain rate. The unified constitutive
equations for foam materials, reported by Chang [48], can provide the essential basis for
developing the dynamic comfort model of the seat.
ii. Thorough experimental evaluations of the materials and the seats coupled with human subjects
under vehicular vibration are essential for refinements of the material as well as seat-occupant
models.
iii. In the current study, the seat back was considered as a rigid support. The geometry and
compliance of the back support can significantly alter the load distribution and this the
sensation of comfort. It is thus suggested to incorporate compliant back support in the model.

119
REFERENCES
[1] W. El Falou, J. Duchene, M. Grabisch, D. Hewson, Y. Langeron, and F. Lino, "Evaluation of driver discomfort during long-duration car driving," Appl Ergon, vol. 34, pp. 249-55, May 2003.
[2] S. K. Lal and A. Craig, "A critical review of the psychophysiology of driver fatigue," Biological psychology, vol. 55, pp. 173-194, 2001.
[3] E. Grandjean, "Fatigue in industry," British Journal of Industrial Medicine, vol. 36, pp. 175-186, 1979.
[4] K. Ebe and M. J. Griffin, "Factors affecting static seat cushion comfort," Ergonomics, vol. 44, pp. 901-21, Aug 15 2001.
[5] R. Ragan, T. W. Kernozek, M. Bidar, and J. W. Matheson, "Seat-interface pressures on various thicknesses of foam wheelchair cushions: A finite modeling approach," Archives of Physical Medicine and Rehabilitation, vol. 83, pp. 872-875, 2002.
[6] N. M. Dunk and J. P. Callaghan, "Gender-based differences in postural responses to seated exposures," Clinical Biomechanics, vol. 20, pp. 1101-1110, 2005.
[7] X. Jin, B. Cheng, B. Wang, and B. Shen, "Assessment of driver's seating discomfort using interface pressure distribution," in Intelligent Vehicles Symposium, 2009 IEEE, 2009, pp. 1419-1424.
[8] M. P. DE Looze, L. F. Kuijt-evers, and J. Van Dieen, "Sitting comfort and discomfort and the relationships with objective measures," Ergonomics, vol. 46, pp. 985-997, 2003.
[9] B. Marx, C. Amann, and M. Verver, "Virtual assessment of seating comfort with human models," SAE Technical Paper, 2005.
[10] N. Montmayeur, C. Marca, H.-Y. Choi, and S. Sah, "Experimental and numerical analyses of seating pressure distribution patterns," SAE Technical Paper 0148-7191, 2005.
[11] G. Kyung and M. A. Nussbaum, "Driver sitting comfort and discomfort (part II): Relationships with and prediction from interface pressure," International Journal of Industrial Ergonomics, vol. 38, pp. 526-538, 2008.
[12] M. Verver and J. Van Hoof, "A seat sensitivity study on vertical vibrations and seat pressure distributions using numerical models," SAE Technical Paper, 2004.
[13] M. M. Verver, J. van Hoof, C. W. Oomens, J. S. Wismans, and F. P. Baaijens, "A finite element model of the human buttocks for prediction of seat pressure distributions," Comput Methods Biomech Biomed Engin, vol. 7, pp. 193-203, Aug 2004.
[14] S. Pankoke and A. Siefert, "Virtual simulation of static and dynamic seating comfort in the development process of automobiles and automotive seats: Application of finite-element-occupant-model casimir," SAE Technical Paper, 2007.
[15] M. Grujicic, B. Pandurangan, G. Arakere, W. C. Bell, T. He, and X. Xie, "Seat-cushion and soft-tissue material modeling and a finite element investigation of the seating comfort for passenger-vehicle occupants," Materials & Design, vol. 30, pp. 4273-4285, 2009.
[16] C. Y. Tang, W. Chan, and C. P. Tsui, "Finite Element Analysis of Contact Pressures between Seat Cushion and Human Buttock-Thigh Tissue," Engineering, vol. 02, pp. 720-726, 2010.
[17] J. Rosen and M. Arcan, "Modeling the human body/seat system in a vibration environment," Journal of biomechanical engineering, vol. 125, pp. 223-231, 2003.
[18] M. M. Verver, R. de Lange, J. van Hoof, and J. S. Wismans, "Aspects of seat modelling for seating comfort analysis," Applied Ergonomics, vol. 36, pp. 33-42, Jan 2005.
[19] Y. Azizi, "Development of a multi-body nonlinear model for a seat-occupant system," Purdue University, 2015.
[20] I. Mircheski, T. Kandikjan, and S. Sidorenko, "Comfort analysis of vehicle driver’s seat through simulation of the sitting process," Tehnički vjesnik, vol. 21, pp. 291-298, 2014.
[21] A. A. Shabana, Dynamics of multibody systems: Cambridge university press, 2013. [22] D. D. Harrison, S. O. Harrison, A. C. Croft, D. E. Harrison, and S. J. Troyanovich, "Sitting
biomechanics part I: review of the literature," Journal of manipulative and physiological therapeutics, vol. 22, pp. 594-609, 1999.

120
[23] D. D. Harrison, S. O. Harrison, A. C. Croft, D. E. Harrison, and S. J. Troyanovich, "Sitting biomechanics, part II: optimal car driver's seat and optimal driver's spinal model," Journal of Manipulative and Physiological Therapeutics, vol. 23, pp. 37-47, 2000.
[24] X. Wu, S. Rakheja, and P.-É. Boileau, "Distribution of human–seat interface pressure on a soft automotive seat under vertical vibration," International Journal of Industrial Ergonomics, vol. 24, pp. 545-557, 1999.
[25] K. Ebe, "Effect of thickness on static and dynamic characteristics of polyurethane foams," in The United Kingdom Group Meeting on Human Response to Vibration held at the ISVR, University of Southampton, Southampton, SO17 1BJ, England, 1997, pp. 17-19.
[26] M. J. Griffin, Handbook of human vibration: Academic press, 2012. [27] S.-J. Park, Y.-S. Lee, Y.-E. Nahm, J.-W. Lee, and J.-S. Kim, "Seating physical characteristics and
subjective comfort: design considerations," SAE Technical Paper 0148-7191, 1998. [28] S. J. Park, S. N. Min, M. Subramaniyam, D.-H. Lee, H. Lee, and D. G. Kim, "Analysis of body
pressure ratio for evaluation of automotive seating comfort," SAE Technical Paper 0148-7191, 2014.
[29] K. Lee, A. Waikar, and L. Wu, "Physical stress evaluation of microscope work using objective and subjective methods," International Journal of Industrial Ergonomics, vol. 2, pp. 203-209, 1988.
[30] S. Demontis and M. Giacoletto, "Prediction of car seat comfort from human-seat interface pressure distribution," SAE Technical Paper 0148-7191, 2002.
[31] A. Naseri, "Interface Pressure and Vibration Comfort Evaluations of an Air-Cushion Suspension Seat," Mechanical Engineering Masters, Concordia University Montreal, Quebec, Canada, 2011.
[32] X. Wu, S. Rakheja, and P.-É. Boileau, "Study of human–seat interface pressure distribution under vertical vibration," International journal of industrial ergonomics, vol. 21, pp. 433-449, 1998.
[33] D. M. Brienza, P. E. Karg, and C. E. Brubaker, "Seat cushion design for elderly wheelchair users based on minimization of soft tissue deformation using stiffness and pressure measurements," IEEE Transactions on Rehabilitation Engineering, vol. 4, pp. 320-327, 1996.
[34] D. E. Gyi and J. M. Porter, "Interface pressure and the prediction of car seat discomfort," Applied ergonomics, vol. 30, pp. 99-107, 1999.
[35] C. Gross, R. S. Goonetilleke, and K. Menon, "New developments in the biomechanical assessment and prediction of seat comfort," Hard facts about soft machines: The ergonomics of seating, 1994.
[36] T. M. Frusti and D. J. Hoffman, "Quantifying the comfortable seat developing measurable parameters relating to subjective comfort," Automotive Body Interior & Safety Systems, pp. 14-18, 1994.
[37] J. M. Porter, D. E. Gyi, and H. A. Tait, "Interface pressure data and the prediction of driver discomfort in road trials," Applied ergonomics, vol. 34, pp. 207-214, 2003.
[38] D. V. W. M. D. Vries, "Characterization of polymeric foams," Eindhoven University of Technology2009.
[39] G. R. Blair, R. So, A. Milivojevich, and J. Van Heumen, "Automotive Seating Comfort: Investigating the Polyurethane Foam Contribution-Phase 1," SAE Technical Paper 0148-7191, 1998.
[40] M. F. Ashby, Material Selection in Mechanical Design, 2011. [41] G. Paddan and M. Griffin, "The transmission of translational seat vibration to the head—I. Vertical
seat vibration," Journal of biomechanics, vol. 21, pp. 191-197, 1988. [42] D. E. Gyi, J. M. Porter, and N. K. Robertson, "Seat pressure measurement technologies:
considerations for their evaluation," Applied Ergonomics, vol. 29, pp. 85-91, 1998. [43] D. L. Bader, C. Bouten, and D. Colin, Pressure ulcer research: current and future perspectives:
Springer Science & Business Media, 2005. [44] R. Puers, "Capacitive sensors: when and how to use them," Sensors and Actuators A: Physical, vol.
37, pp. 93-105, 1993. [45] C. Ashruf, "Thin flexible pressure sensors," Sensor Review, vol. 22, pp. 322-327, 2002.

121
[46] M. Grujicic, B. Pandurangan, G. Arakere, W. Bell, T. He, and X. Xie, "Seat-cushion and soft-tissue material modeling and a finite element investigation of the seating comfort for passenger-vehicle occupants," Materials & Design, vol. 30, pp. 4273-4285, 2009.
[47] K. J. Bathe, Finite element procedures, 1996. [48] J. O. Hallquist, "LS-DYNA theory manual," vol. 3, ed: Livermore software Technology
corporation, 2006. [49] T. Belytschko, W. K. Liu, B. Moran, and K. Elkhodary, Nonlinear finite elements for continua and
structures: John Wiley & Sons, 2013. [50] P. Mohan, C.-K. Park, D. Marzougui, C.-D. Kan, S. Guha, C. Maurath, et al., "LSTC/NCAC
dummy model development," in 11th International LS-Dyna Users Conference, 2010. [51] P. Mohan, D. Marzougui, R. Van De Velde, and C.-D. S. Kan, "Development of Detailed Finite
Element Dummy Models," in 6th LS-DYNA Forum, Frankenthal, Germany, 2007. [52] T. Maeno and J. Hasegawa, "Development of a finite element model of the total human model for
safety (THUMS) and application to car-pedestrian impacts," in Proceedings of 17th international ESV conference, 2001, pp. 1-10.
[53] M. Makhsous, D. Lim, R. Hendrix, J. Bankard, W. Z. Rymer, and F. Lin, "Finite element analysis for evaluation of pressure ulcer on the buttock: development and validation," IEEE Transactions on Neural Systems and Rehabilitation Engineering, vol. 15, pp. 517-525, 2007.
[54] S. Kim, J. Pyun, and H. Choi, "Digital human body model for seat comfort simulation," International Journal of Automotive Technology, vol. 11, pp. 239-244, 2010.
[55] F. Summer, "Model no. 1045," Hampshire (UK): 3D Club, 2009. [56] T. A. M. Panel, "Anthropomorphic Dummies for Crash and Escape System Testing," AGARD
ADVISORY REPORT 330, 1996. [57] J. Ennis, "The Methodology and Development of a 50th Percentile Anthropomorphic Crash Test
Device Finite Element Model," Master's Thesis, The George Washington University, Washington, DC, 1999.
[58] A. Noureddine, A. Eskandarian, and K. Digges, "Computer modeling and validation of a hybrid III dummy for crashworthiness simulation," Mathematical and computer modelling, vol. 35, pp. 885-893, 2002.
[59] A. Tabiei, C. Lawrence, and E. L. Fasanella, "Validation of Finite Element Crash Test Dummy Models for Predicting Orion Crew Member Injuries During a Simulated Vehicle Landing," 2009.
[60] M. F. Sonnenschein, Polyurethanes: science, technology, markets, and trends vol. 11: John Wiley & Sons, 2014.
[61] S. Hiermaier, Predictive modeling of dynamic processes: Springer, 2009. [62] F. S. Chang, J. O. Hallquist, D. X. Lu, B. K. Shahidi, C. M. Kudelko, and J. P. Tekelly, "Finite
element analysis of low-density high-hysteresis foam materials and the application in the automotive industry," SAE Technical Paper 0148-7191, 1994.
[63] J. Zhang, Z. Lin, A. Wong, N. Kikuchi, V. Li, A. Yee, et al., "Constitutive modeling and material characterization of polymeric foams," Journal of engineering materials and technology, vol. 119, pp. 284-291, 1997.
[64] N. Mills, R. Stämpfli, F. Marone, and P. Brühwiler, "Finite element micromechanics model of impact compression of closed-cell polymer foams," International Journal of Solids and Structures, vol. 46, pp. 677-697, 2009.
[65] A. Inc., "ANSYS Mechanical Advanced Nonlinear Materials," ed, 2016. [66] J. Christensen, "CAE Correlation of Automotive foam material using LS-DYNA 971," Aalborg
University2006. [67] L.-D. A. W. Group, "Modeling Guidelines Document," ed: Version 15-1, 2015. [68] M. Kolich, "Automobile seat comfort: occupant preferences vs. anthropometric accommodation,"
Applied Ergonomics, vol. 34, pp. 177-184, 2003. [69] R. Chandler, C. E. Clauser, J. T. McConville, H. Reynolds, and J. W. Young, "Investigation of
inertial properties of the human body," DTIC Document1975.

122
[70] K. Friedman, J. Hutchinson, and D. Mihora, "Finite element modeling of rollover crash tests with Hybrid III dummies," in ASME 2007 Summer Bioengineering Conference, 2007, pp. 611-612.
[71] B. Croop, H. Lobo, and N. DatapointLabs, "Selecting material models for the simulation of foams in LS-DYNA," in Proceedings of the 7th European LS-DYNA conference, Dynamore Gmbh, Salzburg, Germany, 2009.
[72] J. Hallquist, "Manual, LS-DYNA Keyword User’s Version 971," in Livermore Software Technology Corporation, ed, 2007.
[73] A. Smith, C. S. Lo, M. K. Neilsen, V. I. Bateman, L. W. Carlson, W.-Y. Lu, et al., "Validation of a Viscoplastic Model for Foam Response Over a Wide Temperature Range," Sandia National Laboratories (SNL-NM), Albuquerque, NM (United States)2007.
[74] D. Marzougui, C.-D. Kan, and N. E. Bedewi, "Development and validation of an NCAP simulation using LS-DYNA3D," FHWA/NHTSA National Crash Analysis Center, The George Washington University, Virginia Camnpus, Ashburn, Virginia, USA, 1996.
[75] F. H. Netter, Atlas of human anatomy: Elsevier Health Sciences, 2014. [76] I. Kamp, "The influence of car-seat design on its character experience," Appl Ergon, vol. 43, pp.
329-35, Mar 2012.

123
APPENDIX
A.1 Performance of parameter based strain energy density formulations in curve fitting
experimental uniaxial polyurethane foam compression test data.
Figure A.1: Curve fitting Mooney Rivlin model with stress-strain test data from a polyurethane foam sample (62 𝑘𝑘𝑘𝑘/𝑚𝑚3)

124
Figure A.2: Curve fitting Ogden model with stress-strain test data from a polyurethane foam sample (62 𝑘𝑘𝑘𝑘/𝑚𝑚3)
Figure A.3: Curve fitting Yeoh model with stress-strain test data from a polyurethane foam sample (62 𝑘𝑘𝑘𝑘/𝑚𝑚3)
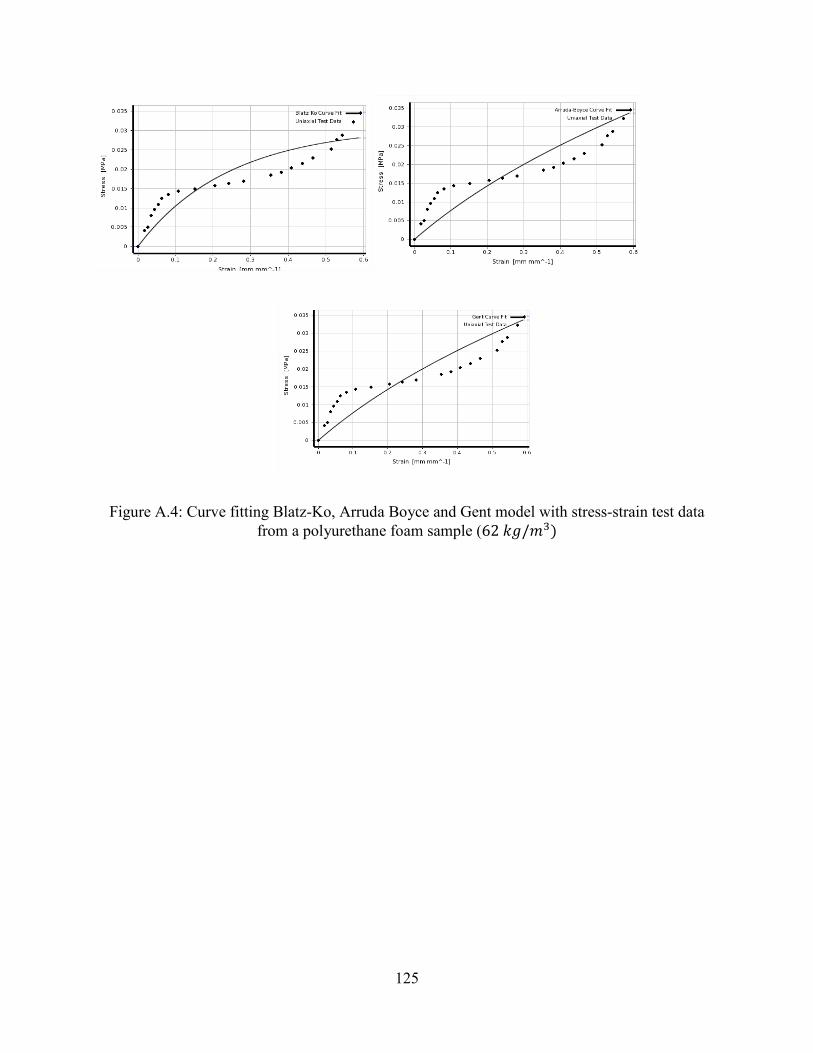
125
Figure A.4: Curve fitting Blatz-Ko, Arruda Boyce and Gent model with stress-strain test data from a polyurethane foam sample (62 𝑘𝑘𝑘𝑘/𝑚𝑚3)