compulsory seat belt wearing in australia: characteristics ... · compulsory seat belt wearing in...
TRANSCRIPT

rraKgport Australia
COMPULSORY SEAT BELT WEARING IN AUSTRALIA: CHARACTERISTICS OF WEARERS AND NON-WEARERS
C. J. Boughton
P. W. Milne
M. H. Cameron
Australian Government Publishing Service Canberra 1981

Document retrieval information
Date: January 1980
Keywords
Seat belt usagel seat belt adjustment, seating location, time of day, occupant age and sex.
Abstract
At least 90 per cent of passenger car occupants aged 8 years and over have a seat belt available in their seat position. Unfortunately many occupants do not wear the belts provided. The differences between wearers and non-wearers are described in terms of factors including age, sex, seating position, type of belt, time of day, day of week and weather condition. Additional data on socic-economic status and drinking habits may be required if the ‘hard-core’ group of non-users are to be effectively tackled.
Note: This report is disseminated in the interest of information exchange. The views expressed are those of the author(s) and do not necessarily represent those of the Commonwealth Government.
The Office of Road Safety publishes two series of reports resulting from internal research and external research, that is research conducted on behalf of the Common- wealth Government. Internal research reports are identified by OR while external reports are identified by C R
BComrnanwealth,of Australia 1981
ISBN0642 01723 9
Printed by Canberra Reprographic Pnnters, 119 Wollongong St, Fyshwick, A.C.T. 2609

Contents
Introduction Survey design
Sumeys undertaken Method of measurement Data collected
Vehicle occupancy Seat belt fitting Seat belt wearing
Introduction Use by seating position and type of seat belt Use by occupant age: sex and seating position Use by day of week Use by time of day Use by weather condition Use by drivers alone or accompanied by front left passengers
Survey results
Manner of seat belt wearing Summary
Conclusions References Appendix A -Operational definitions of correct seat belt wearing
Appendix B -Data collection forms from the 1978 surveys used in roadside surveys
11 8
11 12
13 14 16 20 20 21
22

Introduction
The Australian Design Rules (AD&)* for Motor Vehicle Safety ensure that seat belts are fitted to all new passenger cars and derivatives and trucks. The proportion of vehicles on the road with seat belts fitted is therefore continually rising. Recent surveys of seat belt fitting and wearing have shown that at least 90 per cent of passenger car occupants aged at least 8 years have a seat belt available in the seating position they were occupying when observed. Unfortunately not all those occupants with a seat belt available were restrained.
In view of the documented benefits of wearing seat belts (6th Inremational Conference of the International Association for Accident and Traffic Medicine,
as this would enable formulation of appropriate measures aimed at increasing usage 1977): the identification of differences between wearers and non-wearers is important,
rates.
past six pears by the Commonwealth Department of Transport. This report is based on data collected in extensive urban roadside sun'eys over the
vehicles other than passenger cars and derivatives, and because almost all motor Due to the physical difficulties of observing seat belt fitting and wearing in motor
vehicle occupant casualties are occupants of passenger cars and derivatives, the collection of seat belt fitting and wearing information has concentrated on these types of vehicles.
1

Survey design
Surveys undertaken
surveys related to the restraint ofoccupants in motor vehicles. These are described in Over the past six years the Office of Road Safety has undenaken a succession of
Table 1.
Table 1: Seat belt surveys, 1973-78 Dare City Ti’pe of sun,q Reason for surve? Projeer report
Before Assess campaigns Johnston and Miy 1973 Melboume Adelaide Hobart
X q 1974 Brishane Perth
Newcastle Sydney
Wollongong
December 1975 Melbourne Canberra
December 1976 Melbourne Canberra
March 1978 Melbohme Canberra Adelaide Perth
July 1978 Melbourne Perth Adelaide
campaign aimed at improving Cameron the manner of wearing (1979) lapsash seat belts by
Before campaign
drivers and front left passengers aged at least 8 years
Before Assess introduction Boughton. legislation of child restraint Lancashire
leaislation in Victoria and Johnston 11977)
After legislation
Assess introduction of child restraint legislation in Victoria
Before Assess publicity campaign
Boughton campaign aimed at increasing the use of Johnston
and
restraints by children (1979)
After Assess publicity campaign campaign aimed at
increasing the use of restraints by children
(both adult and child) to all seating positions and the wearing of restraints by all Information collected in all but the first two surveys includes the fitting of restraints
occupants. Details of the wearing of seat belts by occupants aged at least 8 years which are available from these surveys are also considered representative of normal wearing behaviour, as both the legislation and the publicity campaign were directed at restraint of children and not seat belt wearing by adults.
primarily undertaken for other purposes, they do provide some useful information for Although the six surveys (in 1973, 1974, 1975, 1976 and the two in 1978) were
describing the characteristics of seat belt wearers and non-wearers.
Method of measurement
derivatives, including those registered for commercial use, taxis and government In all six surveys the population of vehicles sampled comprised passenger cars and
vehicles.
2

following criteria: In each city, vehicles were'observed at five or six sites selected on the basis ofthe
heavy traffic flow and no turning lanes to ensure maximum observations per unit signalised intersections on urban arterial roads with central medians;
time; in the later surveys in Melbourne the restrictlon of no turning lanes could not
reasonable geographic spread over the city; and be met for all intersections;
good street lighting and other features to ensure the safety of the observers.
survey was undertaken. In general, the same intersections were used in each city where more than one
defined as the lead vehicle in the lane closest to the central median at each red-light Observers were stationed on the central median and the survey vehicles were
phase. Inthe 1975,1976 and 1978 surveys, iftwoormorevehicles werestationaryin this lane during the red-light phase, the observers were permitted to select whichever of the first three vehicles contained children, thus maximising the number of child occupants observed.
Sunday, except in May 1974 when observations ceased at 2300 hours in the five Observations were made between 0600 and 2400 hours on Thursday through
survey cities. The allocation of sites to interviewer shifts was made according to a truncated Latin square design in order to give a reasonable balance of times and locations.
Data collected
lapsash seat belts by occupanb of the two front outboard seating positions only.
were obtained
In the 1973 and 1974 surveys, observations were made of the fitting and wearing of
For each vehicle observed in the 1975, 1976 and 1978 surveys the following data
occupmcy by seating position: type of restraint fitted by seating position whether occupied or not; for each occupied seating position with restraint available, whether or not the restraint was in use; sex and estimated age (0-7, 8-13, 14-29, 30-49, 250) of all occupants - for children estimated to be less than 14 years of age the observer asked the driver the child's exact age; and if lapsash belts were in use in either of the front outboard seating positions - tightness of sash, flatness of sash and buckle position (see Appendix A for operational definitions of these adjustment variables).
and 1978 surveys, two observers were required at each site; one observed front Because of the quantity of additional information to be recorded in the 1975, 1976
seating positions while the other observed rear seating positions and/or the tailgate (luggage area) of station wagons, utilities and panel vans.
The following data were recorded in all sun'eys: time of day; day of week; location of site;
interviewer. weather (not in 1973); and
Copies of the data collection forms from the most recent surveys are at Appendix B.
3
Survey results
Vehicle occupancy
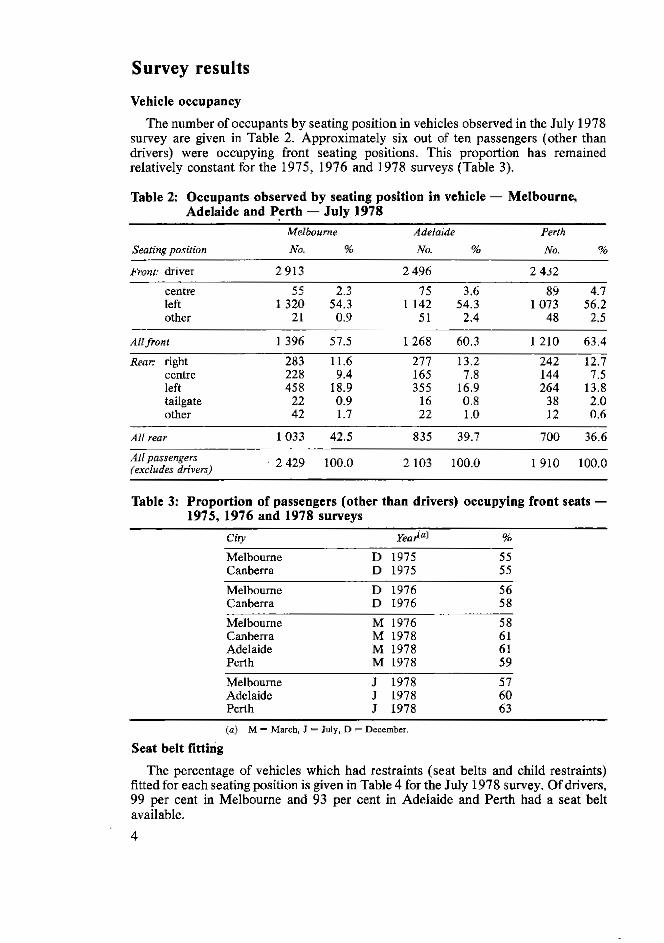
The number of occupants by seating position in vehicles observed in the July 1978
drivers) were occupying front seating positions. This proportion has remained survey are given in Table 2. Approximately six out of ten passengers (other than
relatively constant for the 1975, 1976 and 1978 surveys (Table 3).
Table 2: Occupants observed by seating position in vehicle - Melbourne, Adelaide and Perth - July 1978
Melbourne Adelaide Perth Searing position NO. % NO. % No. %
P r o w driver 2 913 2 496 2 432 centre 55 2.3 left
75 3.6 1320 54.3
85 4.7 1 142 54.3
other 21 0.9 51 2.4 48 2.5 1073 56.2
All fronl 1396 57.5 1268 60.3 1210 63.4 Reor right 283 11.6 277 13.2 242 12.7
centre 228 9.4 165 7.8 left 458 18.9
144 7.5 355 16.9
tailgate 264 13.8
other 42 22 0.9 16 0.8
1.7 22 1 .o 38 2.0 12 0.6
All reor 1033 42.5 835 39.7 700 36.6 Allpassengers (exexcludes drivers) 2429 100.0 2 103 100.0 1910 100.0
Table 3: Proportion of passengers (other than drivers) occupying front seats - 1975, 1976 and 1978 surveys
Cily YeOAU) %
Melbourne D 1975 Canberra D 1975
55 55
Melbourne D 1976 Canberra D 1976
56 58
Melbourne M 1576 Canberra
58 M 1978 61
Adelaide M 1978 Perth M 1978
61 59
Melbourne J 1978 Adelaide J 1978
57 60
P&h T 1978 6 3
( a ) M = March, J = July, D = Dccembcr.
Seat belt fitting
fitted for each seating position is given in Table 4 for the July 1978 survey. Ofdrivers, The percentage of vehicles which had restraints (seat belts and child restraints)
99 per cent in Melbourne and 93 per cent in Adelaide and Perth had a seat belt available.
4

Table 4 Percentage of each type of restraint fitted in each seating position (regardless of whether seat occupied) - Melbourne, Adelaide and Perth - Julv 1978

applies throughout Australia, Victoria also requires retrwtitting for front outboard While compulsory fitting of seat belts in new vehicles in compliance with ADRs
seating positions in older vehicles via two forms of legislation. On this basis more vehicles in Melbourne would be expected to have restraints fitted for the front outboard seating positions. Results of an evaluation of Victoria’s retrwfitting legis- lation reported by Boughton and Cameron (1979) support this hypothesis. For rear seating positions fewer vehicles in Adelaide (65 per cent) compared with Melbourne (72 per cent) and Perth (70 per cent) had restraints available. This suggests that Adelaide may have an older population of vehicles.
The only fitting information available from the 1973 and 1974 surveys is the percentage of occupants (.at least 8 years of age) in driver and front left passenger
5, including the comparative percentages for the later surveys. Fitting rates of l a p seating positions with lap-sash belts available. These percentages are given in Table
derivatwes have risen between May 1973 and July 1978 from 82 per cent to 97 per sash belts in occupied front outboard seating positions of passenger cars and
cent in Melbourne and from about 80 per cent to 91 per cent in Adelaide and Perth.
occupancy (Tables 2 and 3) results in the majority of occupants at least 8 years of age The availability of restraints in front seating positions combined with their high
having a restraint available in the seating position that they occupy.
Table 5: Percentage of occupants at least 8 years of age of front outboard seating positions with lap-sash belts available - all surveys
City
Melbourne Adelaide Hobart Sydney Brisbane Pedh Newcastle Wollongong Melbourne Canberra Melbourne Canberra Melbourne Canberra Adelaide Perth Melbourne Adelaide Perth
Dale
Ma, 1973 May 1973 May 1973 May 1974 May 1974 May 1974 May 1974 May 1974 December 1975 December 1975
December 1976 December 1976
March 1978 March 1978 March 1978 March 1978 July 1978 July 1978 July 1978
lapsash bell % with
82 x0 74 92 82 79 88 X8 94 93 95 96 96 97 91 91 97 91 91
N O .
- ofvehiclees
observed
5 160 6 977 5 150 4 053 4 105 5 878 4 389 3 748 2 970 2 170 2 551 2 832 2 985 2 595 2 775 2 544 2 913 2 496 2 432
Seat belt wearing
Introduction
front lek passengers at least 8 years of age were observed, whereas in the later surveys In the 1973 and 1974 surveys only wearing rates of lapsash belts by drivers and
occupants aged at least 8 years in all jurisdictions except the Australian Capital all occupants were included. Since compulsory wearing legislation only applies to
Territory(where it applies to occupants aged at least 14 years) and Western Australia
6

(where the minimum age was in effect reduced to 5 years in 1977), the results reported here are confined to occupants at least 8 years of age. Information on occupants aged less than 8 years has beer, reported by Boughton and Milne (1978).
Use by seatingposition and type of seat belt
the 1975, 1976 and 1978 surveys. Details are given in Table 6 for the July 1978 Wearing rates for all seating positions and all types of seat belt are available from
survey. Compared with other types of seat belt, lapsash belts are worn significantly more often in all cities (p<O.OOl).
Table 6 Percentage wearing available seat belts for occupants at least 8 years of age by seating position and type of belt - Melbourne, Adelaide and Perth - July 1978
Searingporimn Lop Sash Lopsash Harness Ail seat belrr
Driver M 56 56fb! 85 8 2 A 27 82 82
85
P 6 0 63(3)
] W(3' 82
87 1W(bi 87 Front centre M 52 - - -
A 5 2
35 P 45 - -
35 45
Front left M 56 5 0 @ ) 7 7 A 25!b) 45 76
1 W ( b ) 77 1 0 0 ( b )
P 67'6' - Rn - nn 7 5
- - -
-
- 34 35 All positions M 33 50 78 86 77
A 26 P 41
65 67I6J
77 6 7 ( b ! 76 82 1 0 0 ( b ) 81
-
( 0 ) M = Melbourne. A = Adelaide, P = Pmh. ( b ) Less than ten occ~pancs.
cent (see Table 4) were not lapsash belts. and their inclusion in the figures for 1975, Of the number of belts observed in front outboard seating positions less than 3 per
rates. This is illustrated in Table 7. In all following tables for occupants of front 1976 and 1978 results in only a slight (at most 1 per cent) decrease in the wearing
outboard seating position, data from the 1975, 1976 and 1978 survey refer only to lapsash belts so as to maintain comparability with the earlier surveys.
all survey cities. The wearing rates for drivers are significantly higher than those for Table 8 gives a comparison of wearing rates for front outboard seat occupants for
front left passengers in each city and year (p<O.OOl all cases). For those cities in which a number of surveys have been undertaken (Adelaide. Canberra, Melbourne
of both drivers and front left passengers between the first and last surveys conducted and Perth), only in Adelaide has there been a significant increase in the wearing rates
in each city (p<O.OOl). It has been suggested that increased enforcement in Adelaide 7

(IEOE) 08 (9LZP) Z8

Table 8: Wearing rates of available lapsash belts for front outboard occupants at least 8 years of age by seating position - all surveys
Dnverr
1973 - May Melbourne Adelaide Hobart
1974 - May
Brisbane Sydney
Perth Newcastle Wollongong
1975 -December Melbourne Canberra
1976 -December Melbourne Canberra
1978 - March Melbourne Canberra Adelaide Pertb
1978 ~ July Meiiioume Adelaide Perth
2 766 2 425 2 065
2 223 1 896
1327 567
927
3 333 X3 1168 741 34 1
465
24 8
I 509 77 3 752 2 992
65 69
1010 750
1751 1215
58 62
405
463 355
392
2 628 2 251 3 2x2 2 520
85 x4 86 84 81
837 855
1020 1067
748
1085 77 244
289 338
261
1099 1358 1356 1 009
78 75 79 74
2 819 2 128 1 872 431 2 303
2 364 1 670
426 35 3
2 790 2 023
85 83
1054 725
281 249
243 364
1335 974
79 74
79 74
2 069 2 273
355 433
2 424 2 706
2 875 2 515
85 84
908 998
1151 1 344
2 424 2 095 2 108 2 020
45 1 420
84 83
1020 778 852 822
258 240 250 224
1278 1018 1 102 1046
1256
80 76 77 79
414 290
42 3
2 522 2 310
84 87
85 2 401 2 824 973 283 77 1 865 1 943
396 280
2 261 2 223
82 x7
760 766
246 190
1 006 956
76 80
Table 9: Wearing rates of available lap-sash belts for front outboard occupants at least 8 years of age by occupant age, sex and seating position - all surveys combined
Drivers F m n ~ lafrposrenger~ Front oufboord oeeupanrs
Age (yeom) :\-Of 96 .%I 9; N O 1 % and sex Worn worn brom Worn worn worn FVorn worn worn
Male 8-29 12741 2 668 83 2 877 1 106 72 15618 3774 81
3 M 9 14442 3 367 81 1424 628 69 15 866 3 995 250 4722 1 102 81 631 283
80 69 5 353 1385 79
All ages(") 31 979 7 467 81 4957 2 116 70 36936 9 583 79
Female
3 M 9 4048 754 84 4763 1 326 8-29 4309 779 85 5 433 1 643 77 9742 2422 80
78 8 811 2080 250 1030 196 84 1946 601
81 76 2976 797 79
All agedc) 9404 1733 84 12 186 3 586 77 21590 5 319 80 All(b) 41 426 9366 82 17 163 5 749 75 58589 15 115 79
( n ) Age not h o w " Included. ( b ) Age not h o w , S E X not known included
9

& Table 1 0 Wearing of available lap-sash belts by front outboard occupants aged at least 8 years by day of week and city - 1973, 1974, 1975 and 1978 surveys(")
Melbourne 1973 Adelaide 1973 Hoborr 1973 Sydney 1974 Brisbanr 1974 Perth I974
Day of week Worn worn worn Worn worn worn Worn worn worn Worn worn worn Worn worn worn Worn worn wom Not % Not % Not % Not % Not 96
Friday Thursday
1113 241 82 784 468 63 740 368 67 746 152 83 654 143 82 943 137 87 657 171 79 760 394 66 636 364 64 775 117 87 719 133 84 1167 237 83
Saturday Sunday
1022 264 79 832 591 58 767 382 67 687 133 84 729 155 82 844 191 82 1150 251 82 1073 641 63 679 290 70 844 163 84 647 132 83 881 216 80
All days(b) 3 950 968 80 3 449 2094 62 2828 1418 67 3 060 653 82 2 751 599 82 3 839 800 83
Nor %
Thursday 712 122 85 726 162 82 819 145 85 674 182 79 689 134 84 793 197 80 Friday 551 136 80 480 132 78 845 178 83 705 138 84 824 163 83 868 181 83 Saturdav 523 123 81 648 151 81 810 180 82 372 86 81 642 153 81 777 164 83 Sunday 1405 273 84 764 175 81 944 204 82 644 196 77 822 148 85 833 237 78
All dad*) 3 195 681 82 2620 692 79 3418 707 83 2395 602 80 2977 598 83 3 271 779 81
~~~ ~~~ ~~ ~ ~
~
Melbourne Canberra Adelaide 1978 do)
Perth 1978 do)
Melbnume 1978 da)
Adelaide 1978 d")
Perth 1978 do) 1978 1978
Not % Not % Not % Not % Not % No1 '% Not % Day ofweek Worn worn worn Worn worn worn Worn worn worn Worn worn worn Worn worn worn Worn worn worn Worn worn worn
Thursday 786 142 85 744 155 83 746 150 83 608 94 87 779 166 82 635 149 81 608 76 89 Friday 844 159 84 772 175 82 684 157 81 703 104 87 884 179 83 672 153 81 673 88 88 Saturday 932 226 80 730 156 82 718 163 82 771 158 83 845 172 83 652 160 80 704 143 83 Sunday 892 182 83 627 174 78 812 194 81 760 158 83 866 189 ti2 666 180 79 724 163 82
All daydb) 3454 709 83 2873 660 81 2960 664 82 2842 514 85 3 374 706 83 2625 642 80 2709 470 85 ( 0 ) M = March, J = July. (6) 'Day of weck not known' Included
to wear seat belts less. Failure to reachstatistical significance may hwe beendue to the relatively small amount of data regarding females.
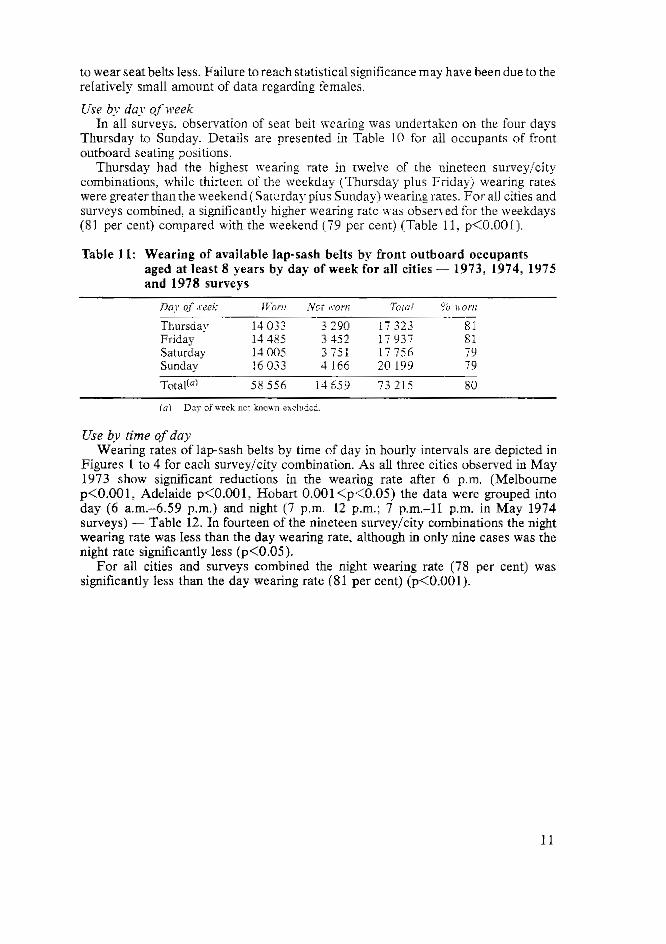
D>e b.v da: of week In all surveys, observation of seat belt ~ e a r i n g was undertaken on the four days
Thursday to Sunday. Details are presented in Table 10 for all occupants of front outboard seating positions.
combinations, while thirteen of the weekday (Thursday plus Friday) wearing rates Thursday had the highest wearing rate in Twelve of the nineteen survey!city
were greater than the weekend i Sarcrday plus Sunday) wearing rates. For all cities and
(81 per cent) compared with the weekend 1.79 per cent) (Table 11. p<0.001). surveys combined, a significanrly hisher wearing rate was observed for the weekdays
Table 11: Wearing of available lap-sash belts by front outboard occupants aged at least 8 years by day of week for all cities - 1973: 1974, 1975 and 1978 surveys
Total(a1 58556 14559 73215 80
( 0 ) Day ofveck not h o u ~ excluded.
Use by time of day
Figures I to 4 for each survey/city combination. As all three cities observed in May Wearing rates of lapsash belts by time of day in hourly intervals are depicted in
p<O.OOl. Adelaide p<O.oOl: Hobart 0.oOl<p<O.O5) the data were grouped into 1973 show significant reductions in the wearing rate after 6 p.m. (Melbourne
day (6 a.m.-6.59 p.m.) and night (7 p.m.-12 p.m.; 7 p.m.-11 p.m. in May 1974 surveys) - Table 12. In fourteen of the nineteen surveylcity combinations the night wearing rate was less than the day wearing rate, although in only nine cases was the night rate significantly less (p<O.OS).
significantly less than the day wearing rate (81 per cent) (p<O.OOl). For all cities and surveys combined the night wearing rate (78 per cent) was
11

Figure 1: Wearing rate oflap-sash seat belts, where belt fitted - May 1973 W""'i' , , , I C , ' , I
Use by weather condition Weather condition was analysedforthe 1975,1976 and 1978 surveys. Details for
occupants of front outboard seating position are given in Table 13. No correlation between weather condition and wearing of seat belts is obvious

Figure 3: Wearing rate of lap-sash seat belts, where belt fitted - December 1975 and December 1976
Use by drivers alone or accompanied by front lefpassengers The hypothesis that wearing rates of drivers difFer depending on whether or not
they are travelling with a front left passenger can be tested with the data available from the surveys. Table 14 gives use of lapsash belts by drivers with and without front left passengers aged at least 8 years in each of the survey/city combinations.
In fourteen of the nineteen combinations the proportion of drivers wearing seat belts when accompanied by a front left passenger is greater than the comparable proportion for drivers alone. However, in only four cases was the rate significantly greater (p<0.05). This suggests that while the wearing rates may not have any
with front left passengers aged at least 8 years to wear their lapsash belt more often. significant statistical difference for one city alone, the overall tendency is for drivers
On pooling the data from all cities and years, as in Table 15, a chi-square test indicates that, overall, significantly more drivers do wear their lapsash belt when accompanied by a front left passenger aged at least 8 years (p<O.OOl).
Further breakdown by age and sex of driver, as in Table 16, shows that the
two other age groups (3049,150) . significantly different wearing rates are associated with male drivers, in particular the
13

Figure 4: Wearing rate of lap-sash seat belts, where belt fitted - March and July 1978
"'"""g rill< ,',i,
70
- 3 - ~ ~ ~ ~ " " ~ ~ ~ ' " ' ~ ' 6 .I m 8 ,# m 10 2 81, Noon 2 p nl 4 p nl 6 p m 8 p m IO p m W d n l $ h l
( h ) July 1976
Manner of seat belt wearing
Compulsory wearing legislation as introduced throughout Australia requires not only the wearing of an available seat belt but also its correct adjustment. Unless a seat belt is worn correctly, that is belt not twisted, belt tight and buckle located beside the hip, benefits may be reduced considerably (Holt and Vazey 1977).
Since 1 January 1975, new passenger cars and derivatives have been required to be fitted with inertia reel belts having fixed buckle positions for the front outboard seating positions. Wearers of these belts do not have to adjust the belt manually for tightness and correct buckle location. However, in the July 1978 survey, the percentage of restrained occupants (aged at least 8 years) of front outboard seating positions that were using a static lapsash belt was 56 per cent in Melbourne, 60 per cent in Adelaide and 52 per cent in Pertb. Thus, at least one in two belt wearers needed to correctly adjust their seat belt themselves.
Information on manner of wearing of static belts located in front outboard seating positions has been recorded in all six surveys. Comparative results are presented in Table 11 for:
percentage with sash loose; percentage with sash twisted; percentage with buckle on abdomen; percentage incorrectly adjusted (ie. sash loose, sash twisted and buckle on abdomen); and ~~
14

Table 12: Wearing of available lap-sash belts by front outboard occupants aged at least 8 years by time of day - all surveys
6 a m -6.55 p ?I:
1973 - May Melbourne 2 733 Adelaide 2 746 Hobart 2 167
1974 - Mag Sydney 2 295 Brisbane Penb
1 924
Ncw-castle 2 616 2 450
Wollongne ! 92A
1975 -December Melbourne 2 569 Canberra 1674
1976 ~ December Melbourne 2 168 Canberra 2 464
1978 ~ March Melbourne 2 578
Adelaide Canberra 2 196
2 227 Perth 2 154
1978 ~ J u l y Melbourne 2 5 7 5 Adelaide Perth
1937 2 158
1 1
355 1101 545 3 278
019 3 186
366 2661 405 2 329 548 3 19.1 491 2941 .12 2 2 5 6
538 3 107 410 2084
415 2583 568 3032
499 3077 454 2650 484 2711 350 2504
507 3082 488 2425 347 2 505
All cities 2nd V P 1 T 9 43585 10221 53806
83 1185 67 615 68 640
86 717 E3 825
83 723 53 1187
E ? 693
83 849 80 721
81 809 81 8 O i
84 876 83 677 82 733 86 688
84 799 80 688 86 551
350 1535 102 1377 353 993
187 934
228 1415 158 983
153 876 1% 374
169 1018 192 913
211 1018 183 992
210 I086 206 883 179 912 164 852
199 998 154 842 123 674
~
81 14870 4305 19175
77 19 64
80 8 1 84 83 I Y
79 83
82 79
81 77
81 80
80 82 82
78
~
percentage correctly adjusted (Le. sash tight sash not twisted and buckle located
These measures are somewhat subjective and any changes over time or between
in each survey. Operational definitions of sash loose: sash tight and buckle on cities may be due to observer differences, since different teams of observers were used
abdomen are given in Appendix A.
changed during the six surveys; however, the proportion with buckle on abdomen is The proportions of occupants with sash loose or sash twisted appear not to have
significantly less in the 1975, 1976 and 1978 surveys compared with the 1973 and
p<O.OOl; for Adelaide 1973-78, July, comparison 0.005<p<0.05; for Perth 1974 surveys. (For Melbourne 1973-75, 1973-76 and 1973-78 comparisons
1974-78, March, comparison p<O.OOl). ADR 4A which came into force in January
result in the buckle being located at or below the hip. This may account for the 1974, was the first Australian Design Rule to specify a buckle location which would
reduction in buckles located on the abdomen. Apart from Wollongong in 1974, at most two out of ten front outboard seating
15
off hip).

Table 13: Percentage wearing of available lap-sasb belts by front outboard occupants aged at least 8 years and weather condition - 1975, 1976 and 1978 surveys@)
Weather
Survey gear and eily Fine O W C O S P ) Rainrng
1975 -December Melbourne 83 (3 238) Canberra
81 (707) 77 ( 1 305) 82 ( I 492)
80 (177) 81 (200)
1976 -December Melbourne 83 ( 1 789) Canberra
84 (1 715) ’ 81 (3791) 83 (257)
82 (71) ( 4
1978 - March Melhnume 81 (937) 84 (30741 82 (158)
Perth 85 ( 1 090) 89 (200) 1978 - July
Melbourne 82 (2 816) 85 ( 1 1511 79 (1131
(a) Figurer in brackets are the total sample SIX of which the percentages mhcated wcrc
(6) Defined as at leaat 80 per cent cloud cover, wearing available seat belt (all types).
(c) Loss than five observations.
. .
position occupants restrained by a static lapsash belt were wearing the seat belt correctly adjusted. Thus, in July 1978 at least 40 per cent (0.8 X 56 = 45 per cent in Melbourne, 0.8 X 60 = 48 per cent in Adelaide, 0.8 X 52 = 42 per cent in Perth) of restrained occupants of front outboard seating positions had incorrectly adjusted seat belts.
three adjustment criteria. Fortunately, few (at most 5 per cent) have their seat belt incorrectly adjusted for all
publicity campaigns to improve manner of wearing. Their analyses showed that the Johnston and Cameron (1979) have investigated the effectiveness of television
proportion with static belts incorrectly adjusted could be reduced via such publicity. However, the results from all six surveys suggest that the effects of the publicity did not continue over an extended time period. In view of the proportion of restrained
be desirable even though benefits may be short term only. occupants with incorrectly adjusted seat belts, further publicity campaigns may still
Summary
unless trends in wearing are continually monitored to determine the need for Seat belt wearing may well be the most important road safety countermeasure, but
additional engineering, enforcement and/or education, the full potential benefit of seat belt wearing may never be realised.
Australian States and Territories; consequently little is known about the character- Monitoring of seat belt wearing trends has not been done on a large scale in most
istics of wearers versus non-wearers and ‘correct’ wearers versus ‘incorrect’ wearers. However, the Department of Transport (DOT) has undertaken extensive roadside surveys seat belt fitting and wearing to assist in evaluating the effectiveness of educational campaigns and legislation for the protection of child car occupants.
16
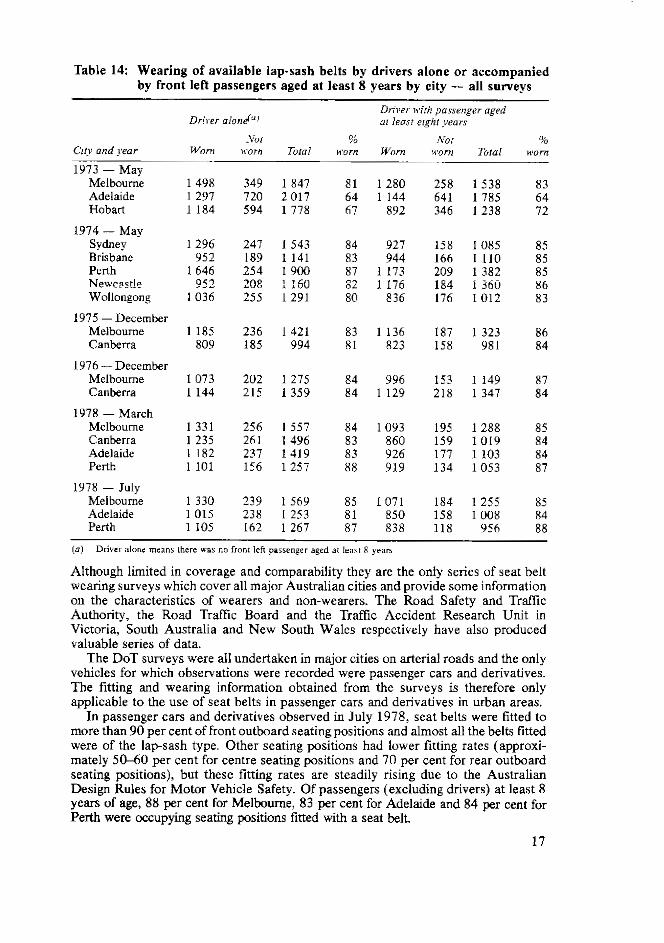
Table 1 4 Wearing of available lapsash belts by drivers alone or accompanied by front lefl passengers aged at least 8 years by city - all surveys
1973 - May Melbourne 149R Adelaide Hobart
1 297 1184
1974 - May
~ ~~
Sydney 1296 Brisbane 952 Perth Newr~zstk
1 646 052
Wollongong 1036
1975 -December Melbourne Canberra
1185 809
1976-December Melbourne Canberra
1073 1 144
1978 - March Melbourne 1331 Canberra 1235 Adelaide Pertk
1182 1101
1978 - July
Adelaide Melbourne 1 330
1015 Perth 1105
349 1847 720 2017 594 1778
241 I543
254 1900 189 1141
20E 1 I60 255 1291
236 1421 185 994
202 1275 215 1359
256 1 5 5 7 261 1 496 237 1419 156 1257
239 1569 238 1253 162 1267
81 1280 64 1144 67 892
84 927 8 3 944 87 1173 82 1176 80 836
83 1 136 81 823
84 996 84 1 129
84 1093
83 926 83 860
88 919
85 1071 81 850 87 838
258 1538 83 641 1785 64 346 1238 72
166 I110 158 1085 85
85 209 1382 85 184 1 36U X6 176 1012 83
187 1323 86 158 981 84
IC3 1149 218 1347 84
87
195 1288 85 159 1019 177 1103
84
134 1053 84 87
158 1008 184 1255 85
84 118 956 88
( 0 ) Driver alone means there was no from left pnssen#er aged a? least 8 years
Although limited in coverage and comparability they are the only series of seat belt wearing surveys which cover all major Australian cities and provide some information
Authority, the Road Tr&k Board and the Traffic Accident Research Unit in on the characteristics of wearers and non-wearers. The Road Safety and Traffic
Victoria, South Australia and New South Wales respectively have also produced valuable series of data.
The DOT surveys were all undertaken in major cities on arterial roads and the only vehicles for which observations were recorded were passenger cars and derivatives. The fitting and wearing information obtained from the surveys is therefore only applicable to the use of seat belts in passenger cars and derivatives in urban areas.
In passenger cars and derivatives observed in July 1978, seat belts were fitted to more than 90 per cent of front outboard seating positions and almost all the belts fitted were of the lapsash type. Other seating positions had lower fitting rates (approxi- mately 5 M O per cent for centre seating positions and 70 per cent for rear outboard seating positions), but these fitting rates are steadily rising due to the Australian Design Rules for Motor Vehicle Safety. Of passengers (excluding drivers) at least 8 years of age, 88 per cent for Melbourne, 83 per cent for Adelaide and 84 per cent for Perth were occupying seating positions fitted with a seat belt.
17

limited scope for retrofitting; however, Boughton and Cameron (1979) have shown In view of the high fitting rate in front outboard seating positions there is only
that the introduction of retrwfitting legislation in the Australian Capital Territory would be cost effective and beneficial in terms of a reduction in casualties.
seat belt in the occupied seating position were wearing the available seat belt. Overall approximately three out of four car occupants aged at least 8 years with a
Wearing rates were highest in front outboard seating positions (75-85 per cent) but much lower elsewhere, being less than 50 per cent for all rear seating positions. The low wearing rate for rear seat occupants is cause for concern especially in view of the known hazard for (restrained) front seat occupants from unrestrained rear seat occupants. (Huelke, Sherman and O D a y 1976).
Lapsash belts have the highest wearing rate except for full harnesses. Full harnesses would be expected to have a high wearing rate since they are fitted voluntarily. Evidence from New South Wales (Fleming 1976) suggested that wearing raiea may be higher for belts fitted with inertia reels. Analysis of the DuT survey results by Carter (1979) has confirmed this finding.
seat belt in the occupied seating position ideally should he restrained i.e. a 100 per Since wearing of an available seat belt is compulsory, all those occupants with a
cent wearing rate. As the wearing rate is not 100 per cent in reality, identification of differences between wearers and non-wearers could be of value in developing measures to improve wearing rates.
Table 15: Wearing of available lapsash belt by drivers alone or accompanied by front left passengers aged at least 8 years - all surveys combined
Wearing sf available Driver with pnssmger lapsash belt Driver alone aged at least 8 years All drivers
Worn 22 371 Not worn 5 203 3 979 9 182
19013 41 384
Total 27 574 22 992 50 566 Percentage we= 81 83 82
Table 1 6 Wearing of available lapsash belt by drivers alone or accompanied by front left passenger aged at least 8 years by age and sex of driver - all surveys combined
Male Female
Driver age Iveard Worn worn To141 worn Worn worn Total worn
Not % N O 1 %
5 2 9 5 549 1200 6749 30-49 6395 1678 8073
82 2245 423 2667 84
x n 79 2054 405 2459 84
209s S I 9 2 674 78 500 116 616 81
All aged") 14536 3 542 18078 80 4819 956 5 775 83
Dn'ver wztk front left passenger oged at leasr 8 pears 1 2 9 5 314 1 110 6424 83 1 274 222 1496 85
30-49 2 5 0
6017 1 317 7 334 82 1368 254 1622 84 1 863 398 2261 82 348 66 414 84
All ages(") 13237 2921 16 158 82 2995 543 3538 85 ( a ) Age not known included.
18

61

Conclusions
The annual cost to the Australian community ofroad accidents has been estimated to
most effective in reducing this cost is the compulsory wearing of seat belts. be in the order of $1000 million. There is little doubt that a measure which has been
Nevertheless, there are a number of reasons why all the potential benefits of seat belt wearing are not being realised.
The seat belt system needs to be continually monitored and upgraded but, even with the most comfortable and sophisticated systems available, many occupants will still not wear them. Although the data presented above indicate that significant relationships exist between usage and factors such as age, sex and seating position, the differences in many cases are small.
age and sex may not help to describe non-wearers. Other factors such as socie It may be that once high usage rates have been achieved, coarse variables such as
economic status and drinking habits may be more important in defining the character- istics of this ’hard-core’. There may well be scope for detailed interview and investigation of observed non-wearers to provide a better basis for future education and enforcement efforts.
References Boughton, C. J. & Milne, P. W. (1978), ‘Occupant restraint in motor vehicles in Australia’, paper presented at the International Meeting of the American Association of Automotive Medicine and the Seventh International Conference of the Inter- national Association for Accident and Traffic Medicine, Ann Arbor, Michigan. Boughton, C. J. & M. H. Cameron (1979), Compulsory fitting of seat belts in Australia: evaluation of retrefitting legislation, Commonwealth Department of
Boughton, C. J., B. R Lancashire & I. R Johnston (1977), ‘Child restraint usage in Transport, Working Document 1.
Melbourne and Canberra: evaluation of Victorian legislation - a preliminary analysis’, paper presented at the Sixth International Conference of the International Association for Accident and Traffic Medicine, Melbourne. Carter, A. J. (1979), Effect of seat belt design rules on wearing rates, Ofice of Road Safety, Department of Transport, OM. Commonwealth Department of Transport, Australian Design Rules for Motor Vehicle Safety. Fleming, D. (1976), N R M A survey - availability, wearing and adjustment of seat belts - 1976, National Roads and Motorists Association. Holt, B. W. & Vazey, B. A. (1977), In Depth Study of Seriously Injured Seat Belt Wearers, Traffic Accident Research Unit, 1/77. Huelke, D. F., Sherman, H. & ODay , J . (1976), ‘The Hazard of the Unrestrained Occupant’, Journal of Trauma, vol. 16, no. 5, pp. 383-9. Johnston, I. R & M. H. Cameron (1979), The effectiveness of television publicity in modgying seat belt wearing behaviour, Office of Road Safety, Department of Transport, OR3. Milne, P. W. (1979), Fitting and wearing of seat belts in Australia - the history of a successful countermeasure, Office of Road Safety, Department of Transport, OR2. Proceedings of the Sixth International Conference of the International Association for Accident and Trafic Medicine, Melbourne, Australia, 3 1 January - 4 February 1977.
20

4ppendiu A
Operational definitions of correct seat belt wearing used in roadside surveys
Tightness
- the occupant was asked to lean forward as far as he could -“tight‘ - where occupant had virtually no forward movement of body (during
training this was related to the passage of a clenched fist between sash and
- ‘in-between‘ - where movement was slight to moderate (equivalent to the chest, during observation a physical measure could not. of course; be employed)
- ‘loose‘ - when movement was greater than either of the above passage o f a laterally extended hand between sash and chest)
Buckle position
- ‘offbody’ - where buckle was by occupant’s side and r e w a r d of the hip joint - ‘in-between‘ - where buckle was in the forward region o f the hip area -‘too near middle’ - where buckle was on abdomen
Twist
- ‘twisf - where sash webbing was twisted whilst in contact with body (twist in
-‘no twisf lap webbing was not considered because it was too difficult to observe reliably)
21

Appendix B
Data collection forms from the 1918 surveys
Femal.
L
Other 5 6 6
22 I I I

REAR S E A T S
7
1 1 2 2
1 1 2 2 3 ' 3
5 E
23