occ exiiibit the public utilities commission...
TRANSCRIPT

OCC EXIIIBIT
BEF'ORETHE PUBLIC UTILITIES COMMISSION OF OHIO
In the Matter of the Review of SBC Ohio'sTELRIC Costs for Unbundled NetworkElements.
)) Case No. 02-1280-TP-UNC)
DIRECT TESTIMOIYYOF
DR J. RANDALL WOOLRIDGE
ON BEHALF OFTHE OFF'ICE OF THE OHIO CONSUMERS' COT]NSEL
10 West Broad Sheet, Suite 1800Columbus, Ohio 43215-3485
(614) 466-8s74
Dated: May28,2004

DIRECTTESNMOTIY OF J. MNDALL VOOLNDGECASE NO. 02. I 280-TP-UNC
I.
II.
ilI.
TV.
TABLE OF CONTENTS
Subject of Testimony and Summary of Recommendations. ................... I
Capital Sffucture... ...........8
Debt Cost Rate........... ......................10
The Cost of Common Equity Capital....... ........... 13
A. Overview. .........13
B. Discounted Cash Flow Analvsis.... .........17
C. Capital Asset Pricing ModelResults...... ..................30
D. Equity Cost Rate Summary... ..................45
Critique of Dr. Avera's Cost of Capital Testimony.............. ...................47
APPENDXA - Qualifications ofDr. J. Randall Woolridge
LIST OF SCHEDULES
V.
ScheduleJRW.lJRW-2JRW-3JRW-4JRW.5JRW-6JRW-7JRW-8JRW.9
TifleCost of Capital of SBC Communications,Inc.The Impact of the 2003 Tax kgislation on the Cost of CapitalBook and Market Value Capitalization of SBC Communications, Inc.Debt Cost Rate of SBC Communications,Inc.DCF Equity Cost RateCAPM Equity Cost Rate Summary Results for SBC Communications, Inc.Derrig-On Appendix BStandard Deviations of Stock and Bond Retums, Real Interest RatesMarket Risk Premium. Standard Deviations of Stock and Bond Returns,Real Interest Rates

DIRECT TESTIMOI{Y OF J. MNDALL WOOLRIDGECAS E NO. 02. I 2 8O.TP.LNC
Q1.
A 1 .
8
910 I .
1 1L2 Q2.
1-3 y'.2.
t 4
i-5
l_5
L'7
t_8
Q3.
A3.
PLEASE STATE YOUR FULL NAME, ADDRESS, AtlI) OCCUPATION.
My name is J. Randall Woolridge and my business address is 120 Haymaker Circle, State
College, PA 16801. I am a Professor of Finance and the Goldman, Sachs & Co. and Frank
P. Smeal Endowed University Fellow in Business Adminisfation at the University Park
Campus of the Pennsylvania State University. I am also the Director of the Smeal College
Trading Room. In addition, I am affiliated with the Columbia Group Inc., a public utility
consulting firm based in Ridgefield, CT. A summary of my educational background,
research, and related business experience is provided in Appendix A.
SUBJECT OF TESTIMOI{Y AND SUMMARY OF RECOMMENDATIONS
WHAT IS THE PT]RPOSE OF YOT]R TESTIMOI{Y IN TIIIS PROCEEDING?
I am provide an opinion about a forward-looking cost of capital to be used in a cost study of
SBC Ohio's interconnection and Unbundled Network Elements (JNEs), which is
consistent with Total Eleme,nt long-run Incremental Cost (TELRIC) methodology. I also
provide an evaluation of the testimony of SBC Ohio's cost of capital witness, Dr. William
E. Avera.
PLEASE REVIEW YOT]R COST OF CAPITAL FINDINGS.
I have independently arrived at a fonvard looking cost of capital. This involves a three-step
process: (1) establishing an appropriate capital stucture for SBC Ohio; (2) determining a
cost rate for the firm's debt; and (3) performing a study to estimate a cost of equity capital
1 9
2 0
23_
z z

1
2
3
+
5
o
I
9
1 0
1 1
L 2
l_3
Q4.
L 4 A + .
l_5
L 6
L 7
1 8
L 9
2 0
2 L
DIRECT TESTIMOT,IY OF J. MNDALL IYOOLNDGECASE NO. O 2 - I 2 8O-TP.LNC
for the company. The capital sfiucture that I am proposing is based on the capital structure
of SBC Ohio's parent, SBC Communications, Inc., and includes 23.42% long-term debt,
and 76.58% coilrmon equlty. I am employlng a long-term debt cost rate of 5.80%. To
detsmine an appropriate equity cost rate, I have evaluated investor return requirements for
a group of telecommunications companies using both Discounted Cash Flow (DCF) and
Capital Asset Pricing Model (CAPM) approaches. The companies that I have employed in
my analysis are the same seven firms used by Dr. Avera. Based on my analysis, I arrived at
an equity cost rate of 10.00%. Utilizing my capital stucture and debt and equity cost rates,
I am recommending an overall cost of capital of 9.02%. This recommendation is
summarized in Attachment JRW-I.
PLEASE SUMMARIZE YO[]R ASSESSMENT OF THE COMPAI{YIS RATE OF
RETURN POSITION.
Dr. Avera provides a recommendation for SBC Communications, Inc.'s capital structure,
senior capital cost rates, equity cost rate, and overall cost of capitat. SBC Communications,
Inc.'s proposed cost of capital is inflated due to an overstated debt cost rate, an
inappropriate capital structure, and an excessive equity cost rale. Dr. Avera's estimated
equity cost rate of 13.25% is unreasonably high primarily due to (1) reliance on an
inappropriate nonconstant DCF model that is highly sensitive to one analyst's forecast of
futrne stock prices and (2) biased and outdated equity risk premium estimates for his
CAPM.

DIRECT TESTIMONY OF J. MNDAU ITOOLNDGECASE NO. 02 - I 2 8O-TP.LINC
1 Q5.
z 45.
3
4
5
5
8
9
1 011_
PLEASE DISCUSS CAPITAL COSTS IN TODAY'S MARKETS.
Capital cost rates for U.S. corporations are currently at their lowest levels in more than four
decades. Corporate capital cost rates are determined by the level of interest rates and the risk
premium demanded by investors to buy the debt and equity capital of corporate issuers. The
base level of interest rates in the US economy is indicated by the rates on U.S. Treasury
bonds. The benchmark for long-term capital costs is the rate on ten-year Treasury bonds.
The rates are provided in the gaph below from 1953 to the present. As indicated, prior to
the secular decline in rates that began last year, the l0-year Treasuryhad not been in the 4-5
percent range since the 1960s.
Yields on Ten-Year Treasury Bonds
Source: http ://research.stlouisfed.org/fred2/data/Gs I 0.bd
The second base component of the corporate capital cost rates is the risk premium. The risk
premium is the return premium required by investors to purchase riskier securities. Risk
L21 3L 4l _ f
L 5
1953-Present
o e E e e o o o e o 6 0 0 0 E e o o o o o o o E e e o o € o
* + + d * + + * * F + E * + + * * + + E * + + * * t i + * E +$ E E E E H E $ E $ E $ E E E E E s $ $ $ E E E E E E H H H

5
6
I
91_0
DIRECT TESTIMOI"IY OF J. MNDALL WOOLNDGECASE NO. 02 - I 2 8O-TP-UNC
premiums for bonds are the yield differentials between different bond classes as rated by
agencies such as Moody's and Standard and Poor's. The gaph below provides the yield
differential between BBB-rate corporate bonds and l0-year Treasuries. This yield
differential peaked at 350 basis points @Ps) n2002 and has declined to 75 BPs. This is an
indication that the market price of risk has declined and therefore the risk premium has
declined in recent years.
Corporate Bond Yield SpreadsBBB-Rated Corporate Bond Yield Minus Ten-Year Treasury Bond Yield
The equity risk premium is the retum premium required to purchase stocks as opposed to
bonds. Since the equity risk premium is not readily observable in the markets (as are bond
risk premiums), and there are altemative approaches to estimating the equity premium, it is
1_ 1_t21 3L 4
J_tr
1,6
Menill Lynch BBB Rf,Ud f,rrporcts Eond Yiold rninurid:n6;6o,r";rneiirioniviara
fr
t
d
#\tl,ii \J - ' \
t,* h\*-'-
Ysr,'€rdI S r ' l f f i ' M g E I l K l l | t r m ' g m , ' [ F s ' i l N l i l ' l m
Source: http://www.cml.prusec.cor/yararch.nsfl(Files)/qs_c.pdfl$file/qs-c.pdf

8
9l_0L LL 21 31 4l_5L 6t 7
1 8
l-9
DIRECT TESNMOIIY OF J. MNDALL WOOLNDGEcAS E NO. 02 - I 2 8q-TP-(NC
the subject of much debate. One common way to estimate the equity risk premium is to
compare the mean returns on bonds and stocks over long historic periods. Measured in this
manner, the equity risk premium has been in the 5-7 perce,nt range. But recent studies by
leading academics indicate the forward-looking equity risk premium is in the 3-5 percent
range. These authors indicate that historic equity risk premiums are upwardly biased
measures of expected equity risk premiums. Jeremy Siegel, a Wharton finance professor
and author of the popular book Srocfrs for the Long Term, published a study entitled "The
Shrinking Equity Risk Premium."r He concludes:
The degree of the equity risk premium calculated from dataestimated from 1926 is unlikely to persist in the funne. The realretum on fixed-income assets is likely to be significantly higher thanestimated on earlier data. This is confirmed by the yields availableon Treasury index-linked securities, which currently exceed 4%o.Furthermore, despite the acceleration in earnings growth, the retumon equities is likely to fall from its historical level due to the veryhigh level of equity prices relative to fundamentals.
Even Alan Greenspan, the Chairman of the Federal Reserve Board, indicated in an October
14,1999 speech on financial risk that the fact that equity risk premiums have declined
' Jeremy J. Siegel, "The Shrinking Equity Risk Premium," Ihe Journal of Portfolio Management (Fall,l999), p.15.
)

z
3456789
1_01 1L 2I J
t 4l _ l
1_6L 71 8t 92 02 t2 22 32 42 52 62 7
2 8
2 9
3 0
3 1
DIRECT TESTIMONY OF J, MNDALL WOOLNDGEcAsE NO. 02-1280-TP-WC
dwing the past decade is'?rot in dispute." His assessment focused on the relationship
between information availability and equity risk premiums.2
There can be little doubt that the dramatic improvements ininformation technolory in recent years have altered our approach torisk. Some analysts perceive that information technolory haspermane'ntly lowered equity premiums and, hence, permanentlyraised the prices of the collateral that underlies all financial assets.
The reason, of course, is that information is critical to theevaluation of risk. The less that is known about the current state ofa market or a venture, the less the ability to project future outcomesand, hence, the more those potential outcomes will be discounted.
The rise in the availability of real-time information has reduced theuncertainties and thereby lowered the variances that we employ togurde portfolio decisions. At least part of the observed fall inequity premiums in our economy and others over the past fiveyears does not appear to be the result of ephemeral changes inperceptions. It is presumably the result of a permanent technology-driven increase in information availability, which by definitionreduces uncertainty and therefore risk premiums. This decline ismost evident in equity risk prerniums. It is less clear in thecorporate bond market, where relative supplies of corporate andTreasury bonds and other factors we cannot easily identiSr haveoutweighed the effects of more readily available information aboutborrowers.
In sum, the relatively low interest rates in today's markets as well as the lower risk
premiums required by investors indicate that capital costs for U.S. companies are the
lowest in decades. In addition, last year's new tax law further lowered capital cost rates
for companies.
" Alan Greenspan, 'Measuring Financial Risk in the Twenty-First Century," Office of the Comptroller of theCurrency Conference, October 14, 1999.

DIRECT TESTIMONY OF J. MNDAIL WOOLNDGECASE NO. 02- I 28O.TP-TNC
1 Q6.
2
: A6.
4
5
6
8
9
t-0
L 4
l_5
L 6
L 7
t 8
t_t
t2
HOW DID LAST YEAR'S NEW TAX LAW REDUCE THE COST OF CAPITAL
F'OR COMPAI\IES?
On May 28th of last yearo President Bush signed the Jobs and Growth Tax Retief
Reconciliation Act of 2003.3 The primary purpose of this legislation was to reduce taxes
to enhance economic growth. A primary component of the new tax law was a significant
reduction in the taxation of corporate dividends for individuals. Dividends have been
described as "double-taxed." First, corporations pay taxes on the income they earn before
they pay dividends to investors, then investors pay taxes on the dividends that they
receive from corporations. One of the implications of the double taxation of dividends is
that, all else equal, it results in a higher cost of raising capital for corporations. The new
tax legislation reduces the effect of double taxation of dividends by lowering the tax rate
on dividends from the 30 percent range (the average tax bracket for individuals) to 15
percent.
Overall, the new tCIr law reduced the pre-tax retum requirements of investors, thereby
reducing corporations' cost of equity capital. This is because the reduction in the taxation
of dividends for individuals enhances their after-tax retums and thereby reduces their pre-
tax required refurns. This reduction in pre-tax required retums (due to the lower tax on
1 3
' to8 P.L. zz.

I
2
DIRECT TESTIMOT'IY OF J. MNDALL WOOLNDGECASE NO. O2-I 280-TP-TNC
dividends) effectively reduces the cost of equity capital for companies. The new tax law
also reduced the tax rate on long-term capital gains from 20%to t5%. T\e magnitude of
the reduction in corporate equity cost rates is debatable, but my assessment indicates that
it could be as large as 100 basis points. (See Attachment JRW-2).
CAPITAL STRUCTURE
WIIAT IS SBC OHIO'S PROPOSED CAPITAL STRUCTT]RE?
Dr. Avera has proposed a capital sfiucture that consists of 81.0% common equity and
19.0% long-term debt. This capital sffucture is based on the market value capitalization of
SBC Communications,Inc. as of Septernber 30, 2003.
WHAT CAPITAL STRUCTURE RATIOS ARE YOU USING TO ESTIMATE A
COST OF CAPITAL FOR SBC OHIO?
Attachment JRW-3 provides the capitalization amounts and ratios for SBC
Communications, Inc. for the past 15 years. These amounts and ratios are provided on
both a book and market value basis. On a book value basis, SBC Communications, Inc.'s
average capitalization has been 40.42% long-term debt and 59.58o/o common equity. On
a market value basis, SBC Communications, Inc.'s average capitalization has been
17 .36% long-term debt and 82.64% common equity. There has been an upward trend in
the amount of equity financing employed by the company. Presumably this trend reflects
3
4
5
7
8
9
1_0
1_ 1_
L 2
1 3
L 4
il.
Q7.
/^7.
Q8.
r.s A8.
I O
L 7
1_8
1 9
2 0
2 t

DIRECT TESTIMONY OF J. MNDALL WOOLNDGECASE NO, O 2- 1 2 8O-TP.UNC
1 0
l_1
L Z
1 3
1 i
1_5
a higher degree of business risk faced by the company.
To arrive at an appropriate forward-looking capitalization using the data in Attachment
JRW-3, I used the average of the book and market value capitalizations over the past five
years. I employed only the past five years of data due to the upward trend in equity
financing. Also, the impact of any one-time financings, acquisitions, and/or significant
economic events is minimized by using five years of data. Book value capitalizations are
the most corlmon form of capitalization reported in financial reports and publications. In
addition, they are usually more stable over time. Straight market value capitalizations, on
the other hand, are rarely reported to investors and tend to vary significantly over time
due to their sensitivity to the prevailing stock price. And it is noteworthy that there is a
tendency for book and market value capitalizations to converge over time. Therefore, I
averaged the book and market value capitalizations over five years to provide for a
forward-looking, relatively stable capitalizatton for SBC Communications, Inc. My
propo sed capitalization is :
Capital Ratio
Long-Term Debt 23.36%
Common Equity 76.42%
I 6
l 7
9

DIRECT TESTIMOI,IY OF J. RANDAA WOOLNDGECASE NO. O2.I 280-TP.UNC
r III. DEBT COST RATE
WHAT IS SBC OHIO'S PROPOSED DEBT COST RATE?
Dr. Avera has proposed a debt cost rate of 6.18%. This figure reflects the prevailing yield
on long-term, 'A' rated indushial bonds as reported by Moody's as of December 8, 2003.
z
3
6
Qe.
A9.
1 0
L1_
L2
1 3
L 4
L 5
1 6
1 ' 7
1_8
1 9
Q10. rs THrs TrrE APPROPRIATE COST OF DEBT FOR SBC OHIO?
Al0. No, it is excessive. It simply reflects the rates on long-term 'A' rated debt. Bloomberg
reports that SBC Communications, Inc. and its subsidiaries have 126 different debt issues in
the market. These securities are of varying maturities, and are not all long-term. For
example, SBC Communications, Inc. and its subsidiaries have an extensive medium-term
note program. Medium-term notes have maturities of 5-12 years and almost always have
lower coupon rates than long-term bonds. This is because the yield curve, which plots the
relationship between yield-to-matrnity and time-to-maturity, is almost always upward
sloping since investors require higher yields to invest in longer maturity bonds (see below).
Companies like SBC Communications, Inc. take advantage of this to get lower cost
financing by issuing notes with intermediate maturities (5-12 years) as opposed to long-
term maturities (>12 years). In fact, three-quarters of SBC Communications, Inc.'s debt
issues are medium-term notes issued by eitho SBC Communications, Inc. or a subsidiary.
1 0

DIRECT TESNMOT'T OF J. MNDALL WOOLNDGECASE NO. 0 2 - I 2 80-7P-UNC
U.S. Treasury Yield CurveM;ay 17,2004
ffi Hl|lnmhnrI I
: - - - - - l -
I t t t lt l l t l
I
l l
t t lt l l
- + - - - t - - -{ - -
II
t ll l
- - l - - - l - -
t lt l
Source: http://www.bloomberg.com/markets/rates/index.hfirnl
Q11. WHAT DEBT RATE ARE YOU USING FOR SBC OHrO?
Al l. In Attachment JRW-4, I calculate a debt cost rate for SBC Communications, Inc. of 5.80%.
I base my debt cost rate on the l0-year Treasury yield. As of May 17,2004, the yield curve
is shown above, and the l0-yearTreasury yield was 4.76%.
On pages 2 ttrough 6 of JRW-4 I provide the data and a gaph of the yields on lO-year
Treasuries, as well as the yields on lO-year 'A' rated corporate and public utility bonds over
the past ten years. The median spreads between the l0-year Treasury and the corporate and
public utility bonds are 104 and 61 basis points (BPs), respectively. Whereas over 90% of
SBC Communications, [nc.'s debt issues have been issued through subsidiary operating
telephone companies, I am using the larger corporate bond spread in gauging SBC
Communications, Inc.'s cost of debt. Adding the average 'A' rated corporate - Treasury
13
6
7
I
9
1 0
Ll_
t2
l - J
L 4
t 5
t 6
L7
l l

DIRECT TESTIMONY OF J, MNDALL TIOOLNDGECASE NO. 02 - I 2 80-TP-IINC
l-
z
3
4
5
6
8
9
t-0
l_1
12 Q12.
l_3
L4 Al2.
1 5
spread of 104 BPs to the 4.76% lO-year Treasury yield provides a debt cost rate of 5.80%.
This debt cost rate is very fair on a forwardJooking basis for SBC Communications, Inc.
given the maturity stucture of the firm's debt. Only twenty-eigtrt of SBC Communications,
Inc.'s 126 debt issues have a maturity of longer than ten years. Forty-seven issues have
maturities of less than three years, and fifty-one issues have maturities of three to ten yeam.
And, as previously noted, three-quarters of SBC Communications, Inc.'s debt issues have
been in the form of medium-term notes. Therefore, the maturity stucture of SBC
Communications, Inc.'s debt and the company's financing patterns suggest that a lower
debt cost rate is more reflective of the actual borrowing costs.
WHY HAVE YOU NOT USED A}[Y FORECASTS OF INTEREST RATES IN
YOUR ANALYSIS?
I am not aware of any services that have demonsfated superior forecasting ability for
interest rates.
I2

r- fV.
.>
3a Q13.
5
e A l3 .
7
U
9
1_0
l_ 1-
L 2
L 3
L 4
I f
1_5
L I
1 8
L 9
2 0
DIRECT TESTIMOM OF J. MNDALL WOOLNDGECASE NO. 02-1280-TP-WC
TIIE COST OF COMMON EOUITY CAPITAL
A. O\rERVIEW
PLEASE PROVIDE AN OVER\IIEW OF THE COST OF CAPITAL IN TIIE
CONTEXT OF'TIIE THEORY OF THE FIRM.
The total cost of operating a business includes the cost of capital. The cost of common
equity capital is the expected retum on a firm's common stock that the marginal investor
would deem sufficient to compensate for risk and the time value of money. In equilibrium,
the expected and required rates of retum on a company's common stock are equal.
Normative economic models of the firm, developed under very resffictive assumptions,
provide insight into ttre relationship between firm performance or profitability, capital costs,
and the value of the firm. Under the economist's ideal model of perfect competition, where
enby and exit is costless, products me undifferentiated, and there are increasing marginal
costs of production, firms produce up to the point where price equals marginal cost. Over
time, a long-run equilibrium is established where price equals average cost, including the
firm's capital costs. In equilibrium, total revenues equal total costs, and because capital
costs represent investors' required return on the firm's capital, actual retums equal required
returns and the market value and the book value of the firm's securities must be equal.
1 3

1-0
DIRECT TESNMOI{Y OF J. MNDALL WOOLMDGECASE NO, 02 - I 2 8O-1P- UNC
In the real world, firms can and do achieve competitive advantage due to product market
imperfections - most notably tlrough product differentiation (adding real or perceived value
to products) and achieving economies of scale (decreasing marginal costs of production).
Competitive advantage allows firms to price products above average cost and thereby earn
accounting profits greater than those required to cover capital costs. When these profits are
in excess of that required by investors, or when a firm earns a return on equity in excess of
its cost of equity, investors respond by valuing the firm's equity in excess of its book value.
James M. McTaggart, founder of the international management consulting firm Marakon
Associates, has described this essential relationship between the return on equity, the cost of
equity, and the market-to-book ratio in the following mannetr:'
Fundamentally, the value of a company is determined by the cashflow it generates over time for its owners, and the minimumac,oeptable rate of retum required by capital investors. This "cost ofequity capital" is used to discount the expected equity cash flow,converting it to a present value. The cash flow is, in furn, producedby the interaction of a company's return on equity and the annualrate of equlty growth. High retum on equity (ROE) companies inlow-growth markets, such as Kellogg, are prodigrous generators ofcash flow, while low ROE companies in high-growth markets, suchas Texas Insfuments, barely generate enough cash flow to financegrowth.
A company's ROE over time, relative to its cost of equity, alsodetermines whether it is worth more or less than its book value. If itsROE is consistently greater than the cost of equlty capital (theinvestor's minimum acceptable return), the business is economicallyprofitable and its market value will exceed book value. If, however,the business eams an ROE consistently less than its cost of equity, it
'James M. McTaggart, "The lJltimate Poison Pill: Closing the Value Gup,"' Commentary (Spring 1988), p. 2.
t4
l_1
L 2l_3L41 51 6t 71 8t-92 02 L2 22 32 42 52 62 72 82 9

l_
2
4
5
5
7
I
9
i-o Q14.
1-1
L2 474.
l_3
t 4
1-5
l -b
1"7
1 8
1_9
DIRECTTESTIMONY OF I, MNDALL WOOLNDGECASE NO. 0 2 - I 2 8q-TP-UNC
is economically unprofitable and its market value will be less thanbook value.
As such, the relationship between a firm's return on equity, cost of equity, and market-to-
book ratio is relatively sfraightforward. A firm which earns a retum on equity above its cost
of equity will see its common stock sell at a price above its book value. Conversely, a firm
which eanx a retum on equity below its cost of equity will see its common stock sell at a
price below its book value.
wrrAT F'ACTORS DETERMINE II{VESTORS' EXPECTED OR REQUIRED
RATE OF RETURN ON EQUITY?
The expected or required rate of retum on common stock is a function of market-wide, as
well as company-specific, factors. The most important market factor is the time value of
money as indicated by the level of interest rates in the economy. Common stock investor
requirements generally increase and decrease with like changes in interest rates. The
perceived risk of a firm is the predominant factor that influences investor return
requirements on a company-specific basis. Firm risk is often separated into business and
financial risk. Business risk encompasses all factors that affect a firm's operating revenues
and expenses. Financial risk results from incurring fixed obligations in the form of debt in
financing its assets.2 0
2 L
l 5

r Q15.
z
r A l5 .
4
5
6
8
9
l-0
1l-
I 5
t_6
L7
I d
1"9
2 0
2 t
'J.2
l _ J
L4
DIRECT TESNMOIIY OF J. MNDALL IYOOLNDGEcAsE NO. 02- I 2 80-TP-(NC
HOW CAII THE EXPECTED OR REQUIRED RATE OF RETURN ON COMMON
EQUITY CAPITAL BE DETERMINED?
The costs of debt and prefened stock are normally based on historic or book values and can
be determined with a great degree of accuracy. The cost of cofllmon equity capital,
however, cannot be determined precisely and must instead be estimated from market data
and informed judgment. This retum to the equity owner should be commensurate with
retums on investnents in other enterprises having comparable risks.
According to valuation principles, the present value of an asset equals the discounted value
of its expected future cash flows. Investors discount these expected cash flows at their
required rate of return that, as noted above, reflects the time value of money and the
perceived riskiness of the expected future cash flows. As such, the cost of common equity
is the rate at which investors discount expected cash flows associated with common stock
ownership.
Models have been developed to ascertain the cost of common equity capital for a firm.
Each model, however, has bee,n developed using resfiictive economic assumptions.
Consequently, judgment is required in selecting appropriate financial valuation models to
estimate a firm's cost of common equity capital, in determining the data inputs for these
modelso and in interpreting the models' results.
t 6

r Q16.
2
r A16.
4
5
6
7
8
9
L 011 Q17.
7 2
13 477.
I 4
I 5
1_6
t7
1 8
L 9
2 0
2 L
DIRECT TESTIMOM OF J, MNDALL ITOOLNDGEcAS E NO. 0 2 - I 2 8q-TP-UNC
HOW DO YOU ESTIMATE TIrE COST OF EQUITY CAPITAL FOR SBC
COMMIINICATIONS, INC.?
I am onployrng two differelrt models to ascertain the company's cost of equity capital - the
DCF and the CAPM. I rely primarily on the DCF model to estimate the cost of equify
capital because I believe that, when properly applied, it provides a better indication of a
firm's cost of equity capital. I also use the CAPM which is one application of the risk
premium approach.
B. DISCOTJNTED CASH FLOW ANALYSIS
BRIEFLY DESCRIBE TIIE THEORY BEHIND THE TRADITIONAL DCF
MODEL.
According to the discounted cash flow model, the current stock price is equal to'the
discounted value of all future dividends that investors expect to receive from invesfrne'lrt in
the firm. As such, stockholders' returns ultimately result from current as well as future
dividends. As owners of a corporation, cofirmon stockholders are entitled to a pro-rata
share of the firm's eamings. The DCF model presumes that earnings that are not paid out in
the form of dividends are reinvested in the firm so as to provide for futrne growth in
eamings and dividends. The rate by whictr investors discount future dividends to reflect the
timing and riskiness of expected cash flows, is interpreted as the market's expected or
required retum on the cofilmon stock. Therefore this discount rate represents the cost of
t 7

DIRECT TESnMOl,il OF J. MNDALL WOOLNDGEcAsE NO. 02- I 2 8q-TP-(NC
DrP
l_
234567
I
9
1_0
l-1
L 2
1 3
1 i
1 5
1 6
L 71_8L 92 02 L
common equity. Algebraically, the DCF model canbe expressed as:
DrP : +
(1+k)'
D2
(1+kf
Dn
(1+k)"
where P is the current stock price, D, is the dividend in year n, and k is the cost of common
equlty.
Q18. PLEASE DISCUSS THE DItrT'ERENT FORMS OF THE DCF MODEL.
A18. There are two general forms of the DCF model - the constant-growth DCF and the
nonconstant-growth or multistage DCF models.
Under certain assumptions, including a constant and infinite expected growth rate, and
constant dividend/earnings and price/eamings ratios, the DCF model can be simplified to
the following:
k - g
l 8

t
z
DIRECT TESTIMOIIY OF J. MNDALL WOOLNDGECASE NO. 02- I 2 8O.TP.UNC
where D1 represerrts the expected dividend over the coming year and g is the expected
growth rate of dividends. This is known as the constant-growth version of the DCF model.
To use the constant-growth DCF model to estimate a firm's cost of equity, one solves for k
in the above expression to obtain the following:
P
In the constant-growth version of the DCF model, the current dividend payment and stock
price are directly observable. Therefore, the primary problem and confoversy in applytng
the DCF model to estimate equity cost rates entails estimating investors' expected dividend
growth rate.
Q19. PLEASE DESCRTBE THE NONCONSTATIT GROWTH DCF MODEL.
Al9. trn situations in which ttre constant growth assumption is not appropriate, a nonconstant-
growth or multistage DCF model is employed. This is typically the situation when applyrng
the DCF model to a firm that is growing its earnings veryrapidly- for example in excess of
l0Yo per yeat - and this growth is not expected to last indefinitely. In this case, earnings
and dividends are projected to grow at different rates during different stages of a firm's life
cycle. The stages in a three-stage DCF model are discussed below. This model presumes
that a company's dividend payout progresses initially through a growth stage, then proceeds
through a ftansition stage, and finally assumes a steady state stage. The dividend payment
3
4
5
6
7
8
9
I U
L T
L 2
1_3
L 4
1 s
Dr
L 6
L 7
I . '
1 9
2 0
Z L
2 2
2 3
1 9
3
4
5
6
8
9
l_0
Ll-
t 2
1_3
L 4
1 5
1 6
L 7
1 8
1 9
DIRECT TESNMONY OF J. MNDALL WOOLRIDGECASE NO. 02- I 280-TP-UNC
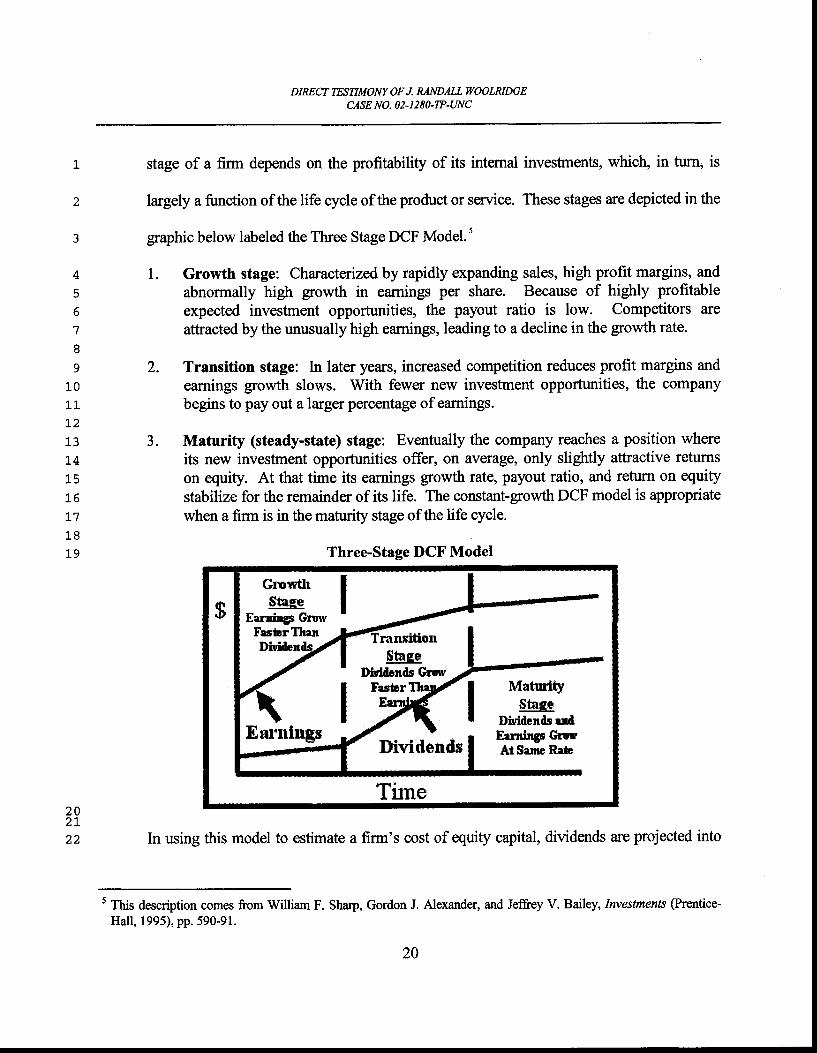
stage of a firm depends on the profitability of its intemal investnents, which, in turn, is
largely a function of the life cycle of the product or service. These stages are depicted in the
graphic below labeled the Three Stage DCF Model.5
1. Growth stage: Chancteized by rapidly expanding sales, high profit margins, andabnormally high growth in eamings per share. Because of higlrly profitableexpected investment opportunities, the payout ratio is low. Competitors areattracted by the unusually high earnings, leading to a decline in the growth rate.
2. Transition stage: ln later years, increased competition reduces profit margins andearnings growth slows. With fewer new investment opportunities, the companybegins to pay out a larger percentage ofearnings.
3. Maturity (steady-state) stage: Eventually the company reaches a position whereits new investment opportunities offer, on average, only slightly attractive returnson equity. At that time its earnings growth rate, payout ratio, and return on equitystabilize for the remainder of its life. The constant-growth DCF model is appropriatewhen a firm is in the maturity stage of the life cycle.
Three-Stage DCF Model
I cro*ttr I$ 1 , # * l
FesicrTlnn
$tageIliuirilcnds Gnrv
l ry l "F*Enr"nings f^. . .t , r Eerninge $uu,
Dividends I *ts"-" n"u
Tirnez v2 tz z In using this model to estimate a firm's cost of equity capital, dividends are projected into
5 This description comes from William F. Sharp, Gordon J. Alexander, and Jeftey V. Bailey, Investments @rentice-Hall, 1995), pp. 590-91.
20

\
2
DIRECTTESNMONY OF J. RANDALL WOOLMDGECASE NO. O 2 - I 2 8O.TP-UNC
the future using the different growttr rates in the alternative stages, and then the equity cost
rate is the discount rate that equates the present value of the future dividends to the current
stock price.3
4
s Q20.
6
e A20.
9
1_0
L 1
12
L 3
1 A
L 6
t 7
I 6
t 9
2 0
GTVEN THIS DISCUSSION. WHAT FORM OF TIIE DCF MODEL ARE YOU
USING TO ESTIMATE SBC COMMUNICATTONS, INC.'S COST OF EQUITY
CAPITAL?
I used the constant-growth DCF model with a composite of the seven telecommunications
firms (identified by Dr. Avera) in my DCF analysis. Using this approach, I averaged the
dividend yields and expected growth rates for the companies to estimate SBC
Communications, Inc.'s cost of equity capital. As is evident, whereas the constant-growth
DCF model would not be appropriate for several of the companies in the goup (such as
Sprint and Telephone & Data Systems), the expected gpwth figures indicate that it is
appropriate for the composite of the seven company group.
Q21. PLEASE DISCUSS ATTACHMENT JRW-s.
A2l. My DCF analysis is provided in Attachment JRW-S. The DCF summary is on page 1, of
this Attachment and the supporting data and analysis for the dividend yield and expected
growth rate then follow.
2 l

t Q22.
z
3 422.
4
DIRECT TESNMOM OF J. MNDALL WOOLNDGECASE NO. 02- I 2 80-TP-UNC
WHAT DIVIDEND YIELD DO YOU EMPLOY IN YOUR DCF'ANALYSIS FOR
THE GROUP?
The dividend yields on the common stock for the group are provided on page 2 of
Attachment JRW-5 for the five-month period ending May,2004. Over this period, the
average monthly dividend yield for this group has been in the 3.0o/o range, which I use in
my DCF analysis.
HOW DO YOU DETERMINE A GROWTH RATE COMPONENT FOR YOT]R
DCF MODEL?
I have analyzd many measures of growth for the companies in the goup. Initially, I
evaluated historic earnings, dividends, and book value per share growth rates as provided in
the Value Line Investment Survey. I have also used Value Line's 5-year projected growth
rate estimates for earnings, dividends, and book value per share. In addition, I have utilized
earnings growth rate forecasts as provided by Zacks, Reuters, and Yahoo First Call. These
5
6
I Q23. PLEASE DISCUSS THE GROWTH RATE COMPONENT OT THE DCF MODEL.
g y'e3. There is much debate about the proper methodology to employ in estimating the growth
10 component of the DCF model. By definition, this component is an investors' expectation of
i-i- the long-term dividend growth rate. Presumably, investors use some combination ofhistoric
tz and/or projected growth rates for eamings and dividends per share and for intemal or book
13 value growth to assess long-term potential.
L 4
I 5
L 6
L 7
t-8
L 9
2 0
2 L
Q24.
M4.
22

DIRECT TESNMOM OF J. MNDAA TTOOLRIDGECASENO, O2-1280-TP.WC
services solicit 5-year eamings per share growth rate projections from securities analysts
and compile and publish the averages of these forecasts on a monthly basis. They are
readily available on the Intemet. I have also assessed long-term growth trends for eamings
and dividends for the S&P 500. This provides a basis to compare the results for the goup
to a broader range of companies.
6
t Q25. PLEASE DISCUSS HISTORIC GROWTH IN DARNINGS AND DIVIDENDS AS
WELL AS INTERNAL GROWTH.
A25. Historic growth rates for eamings per share (EPS), dividends per share (DPS), and book
value per share (BVPS) are readily available to virtually all investors and are presumably an
important ingredient in forming expectations concerning future growth. However, historic
growth numbers as measures of investors' expectations should be relied on with caution. In
some cases, past growth may not reflect future growth potential. Also, employlng a single
growth rate number (for example, for five or ten years), is unlikely to accurately measure
investors' expectations due to the sensitivity of a single growth rate figure to fluctuations in
individual firm performance as well as overall economic fluctuations (i.e., business cycles).
In addition, one must appraise the context in which the growth rate is being employed.
According to the conve,ntional DCF model, the expected return on a security is equal to the
sum of the dividend yield and the expected long-term glowth in dividends. Therefore, to
best estimate the cost of common €quity capital using the conventional DCF model, one
must look to long-term gpwth rate expectations.
8
9
L 0
l- t-
L2
. l .5
L 4
L 5
1 6
I '7
1 8
L 9
2 0
2 1
23

1 Q26.
2
3 426.
4
5
6
8
9
1 0
1-1
3-2
13 Q27.
L 4
1s r'.27.
1_6
L I
l_8
1,9
2 0
DIRECT TESTIMO}'il OF J. MNDALL WOOLNDGECASE NO. 02- I 280-TP.UNC
PLEASE ST]MMARIZE YOUR ANALYSIS OF VALAE LINE'S HISTORIC AIID
PROJECTED GROWTII RATES FOR TIIE GROUP.
Page 3 of Attachment JRW-5 provides a sunmary of historic and projected growth rates for
the companies in the goup as provided in the Value Line Investment Survey. The average
historic growth rate figures for the goup are highly variable and range from 3.8% to 12.8%.
The average of the historic five- and ten-year EPS, DPS, and BVPS glowth rate figures is
8.4%.
Value Line's projected growth rates for the group are much less variable and lower. The
average projected growth rates for EPS, DPS, and BVPS for the goup are 4.IYo,4.8o/o, and
5.5o/o, respectively.
PLEASE ASSESS GROWTII FOR THE GROUP AS MEASURED BY ANALYSTS'
FORECASTS OF EXPECTED s-YEAR GROWTH IN EPS.
Zacks, Yatroo First Call, and Reuters collect, summarize, and publish Wall Skeet analysts'
projected 5-year EPS growttr rate forecasts for companies. These forecasts are provided for
the companies on page 4 of Attachment JRW-5. The average of the expected 5-year EPS
growth rates from the three services for the goup are7.4Yo,8.0o/o, andT.lo/o, with an overall
goup average of 7.5%.
24

L
z
3
4
5
6
7
8
9
l_0
l_ l_
7 2
l - J
L 4l_5
t 6L 7
DIRECT TESTIMONY OF J, MNDALL TTOOLRIDGECASE NO, O 2 - I 2 8O-TP-(NC
Q28. IIOW MUCH WEIGIIT DO yOU GIVE TrIE GROWTIT RATE FORECASTS OF
WALL STREET ANALYSTS?
A28. I believe they are important, but it must be recognized that there is a well'known upward
bias to these growth rate forecasts. I will cover this issue in-depth later in my testimony.
Q29. WIrAT OTHER INDICATORS OF TIrE LONG-TERM GROWTH RATE HAVE
YOU REVIEWED IN YOURANALYSIS?
M9. The growth of the telecommunications indusby tends to reflect the growth in the overall
economy. Edward Yardeni, Chief Economist for the Prudential Equity Group, fracks
growth of the economy and corporate profits on an ongoing basis. The gaph below shows
nominal Gross Domestic Product (GDP) and after-tax corporate profit growth since 1960.
The growth of both the economy and profits is about the same - 7o/oper year on a nominal
basis. Yardeni therefore concludes thatTYo is the appropriate number for long-term growth.
Source: htto://www.cml.prusec.com/yararch.nsfl(Files)/handpdfl$file/hand.pdf
$gminal GDP and After-Tax Corporate ProfitsMnff luLsBF itrF'n+Tax roFfmarE m6ftl${|e$qilerd
---- fllErnr{ifrr6r- fto[dmtmF
lfrr:Txl6orm$gfsft- 8|so$.dbHl$- Rwfr{wilFm&udu#
25

1 0
1 1
L2
L 3
DIRECT TESTIMOI,IY OF J. MNDALL ITOOLMDGECASE NO. O2-I 280-TP-UNC
Q30. rrow DoEs Trrrs EcoNoMrc AND PROFIT GROWTH RATE COMPARE
WITTI THE EARNINGS AND DTVIDENDS PER SHARE GROWTII RATES FOR
U.S. COMPANIES?
A30. In evaluating growth for cost of capital purposes, it is common to focus on the growth in
earnings and dividends per share. The S&P 500 is an index of firms that is tracked by
most professionals in the investment community. It was created by Standard and Poors'
in 1960. The S&P 500 consists of 500 companies that are listed on the New York Stock
Exchange as well as NASDAQ. A unique feature of the S&P 500 is that it is modeled
after the US economy with firms coming from 10 different economic sectors (technology,
health care, energy, telecommunications, utilities, etc.). On an ongoing basis, S&P
reviews the composition of the lndex and makes adjustments to insure that it continues to
reflect the make-up of the economy.
26

5
6
18
DIRECT TESNMONY OF J, MNDALL WOOANDGECASE NO, 02- I 2 8O-TP-UNC
The table below shows the earnings and dividends per share growth rates by decade and
overall since 1960 for the companies in the S&P 500. While the decade to decade results
vary somewhat, the growth rates for the entire 44-year period are 6.88% for EPS and
5.25% for DPS.
The S&P 500Average Annual Compounded Growth in Earnings and Dividends Per Share
Data Source: http://pages.stern.nyu.edu/-adamodarA.{ew Home Pase/datafile/implor.htnd9
1_0
Earning* DivirlendrFer Share Per $hare
Grswth Gruwth1960r1970r19ff0*1990r2000r
1960-1003
27

r Q31.
2
3
+ A3l.
5
6
7
8
9
1 0
11_
L 2
1_3L41_51 6
DIRECT TESTIMOT'IY OF J. MNDALL WOOLNDGECASE NO. 02-t 280-TP-(NC
HOW DOES THE ACTUAL LONG.TERM EPS GROWTII RATE T'OR THE S&P
5OO COMPANIES COMPARE TO THE GROWTH IN EPS PROJECTED BY
WALL STREET ANALYSTS?
As noted above, to estimate long-term projected growth, it is very corrmon to look at the 5-
year EPS gfowth rate forecasts of Wall Sfeet analysts. It was also noted that these
estimates are known to be upwardly biased. The gaph below shows the analysts' average
5-year earnings per share gpowth rate forecasts for the S&P 500 since 1984 (the first year
they became available). These growth rate forecasts hovered in the ll.5% range until 1995,
the,n increased dramatically to almost 19.0% by 2000 as analysts helped propel the Intemet
stock market bubble. They have since declined to the 12.0% range. Meanwhile, over the
same 1984-2003 period that is covered in the gaph the actual mean compounded annual
EPS growttr rate for the S&P 500 was or,ly 6.34%.
The S&P 500Analysts'Average Projected S-Year Earnings Per Share Growth Rate
r ffiH*l#m3i{tad*lF$rmine s'q'Gt
Source: http://www.cml.prusec.corn/yararch.nsfl(Files)/t 010603.odfl$file/t 010603.pdfL71 8
1984-2004
28

1
z
3
4
5
R
DIRECT TESNMOIIY OF J. MNDALL WOOLNDGECASE NO. 02 - ] 2 8O-TP.UNC
Q32. GIVEN TIIIS DISCUSSION ON EXPECTED GROWTII, WIIAT GROWTII RATES
DO YOU DEEM RELEVAI\T FOR THE GROUP OF TELECOMMUNICATIONS
COMPANIES?
A32. The table below provides a sunmary of the average growth rates discussed above.
Growth Rate Indicator Growth RateAverage 5- and 10- Year Historic Growth Rate in EPS, DPS, and BVPS for the
Group (Value Line)8.40%
Average 3-5 Year Projected Growth Rate in EPS, DPS, and BVPS for theGroup CValue Line)
4.80%
Average 5-Year Projected EPS Growth Rate for the Group(Zacks- Reuters. Yahoo Ffust Call)
7.50%
Compounded Annual Growth in GDP and After-Ta:r Corporate ProfitsfYardeni --1960-2003)
7.00%
Compounded Annual EPS Growttr Rate forthe S&P 500(1960-2003)
6.88%
Compounded Annual DPS Growth Rate forthe S&P 500(1960-2003)
5.2s%
Given these figures, and grving primary weight to the growth in earnings, I use a DCF
growth rate of 7.00Yofor the telecommunications companies.
7
8
o
29

L
z
3
4
5
5789
1 01 1I f
L 2
L3
1 A
l_51 6
L 7
1 8
1,9
Z U
2 L
2 2
z 5
2 4
DIRECTTESTIMOM OF J. MNDAU VOOLNDGECASE NO. 02 -l 2 8o-TP-UNC
Q33. BASED ON THE ABOVE ANALYSIS, WHAT IS YOUR INDICATED COMMON
EQUITY COST RATE FROM THE DCF MODEL FOR TIIE TELECOMMT]NICATIONS
GROUP?
A33. My DCF-derived equlty cost rate for the telecommunications goup is provided on page I
of Attachment JRW-5. My analysis indicates an equity cost rate of 10.21%.
DrDCF Equity Cost Rate ft)
Telecommunications Group
P
3.00% * 1.07
g
+ 7.00% : l0.2lo/o
C. CAPITAL ASSET PRICING MODEL RESULTS
Q34. PLEASE DTSCUSS TrrE CAPITAL ASSET PRTCING MODEL (CAPM).
A34. The CAPM is a more general risk prernium approach to gauging a firm's cost of equity
capital. According to the risk premium approach, the cost of equity is the sum of the
interest rate on a risk-free bond (R) and a risk premium (RP), as in the following:
The yield on long-term Treasury securities is normally used as \ Risk premiums are
measured in different ways. The CAPM is a theory of the risk and expected returns of
common stocks. ln the CAPM, two types of risk are associated with a stock: firm-specific
risk or unsystematic risk; and market or systematic risk, which is measured by a firm's
RP&
30

DIRECT TESNMOI,{Y OF J. MNDALL IryOOLNDGECASE NO, 02- I 2 8O-TP-UNC
z
3
4
5
67I9
1 0l_ l_
t 21 31 ^
l-5
L 6
L 7
o
O
beta. The only risk that investors receive a return for bearing is systematic risk.
According to the CAPM, the expected return on a company's stock, which is also the
equity cost rate (K), is equal to:
r: (Rl * Bn* * [E(R*) - (Rt]
Where:
K represents the estimated rate ofrefurn on the stock;E(R^) represents the expected refurn on the overall stock market. Frequently, the 'market'
refers to the S&P 500;(R7) represents the risk-free rate of interest;tE(Rr) - (R)l represents the expected equity or market risk premium-the excess returnthat an investor expects to receive above the risk-free rate for investing in risky stocks;BetaltJ) is a measure of the systematic risk of an asset.
To estimate the required return or cost of equity using the CAPM requires three inputs:
the risk-free rate of interest (R), the beta (B;), and the expected equity or market risk
premium, tE(R,,) - (Rtl. Ry is the easiest of the inputs to measure - it is the yield on
long-term Treasury bonds. B;, the measure of systematic risk, is a little more difficult to
measure because there are different opinions about what adjustments, if any, should be
rnade to historic betas due to their tendency to regress to 1.0 over time. And finally, an
even more difEcult input to measure is the expected equity or market risk premium,
tE(R) - (Ril. I will discuss eacl of these inputs, with most of the discussion focusing on
the expected equityrisk premium.
a
a
l_8
1_9
z v
2 t
z z
2 3
z 4
2 5
3 1

DIRECT TESTIMO}IY OF J. MNDALL WOOLNDGECASE NO. O 2 - I 2 8O-TP-LNC
r Q35.
z 435.
3
4
5
5 Q36.
7
e .'4.36.
9
1 0
l_1
t 2
1_3
t 4
1 5
L 6
3.7
PLEASE DISCUSS ATTACHMENT JRW-6.
Attachment JRW-6 provides the summary results for my CAPM study, which indicates an
equity cost rate for SBC Communications, Inc. of 8.38%. The individual inputs for my
CAPM are discussed in detail below.
PLEASE DISCUSS THE RISK-FREE INTEREST RATE AIYD BETA IN YOUR
CAPM?
In recent years, the yield on l0-year Treasurybonds has become the benchmark long-term
Treasuryrate. Asof May 17,2004,the l0-yearTreasuryyieldwas 4.76%.Iusethisrate
as Rr
B is a measure of the systematic risk of a stock. The market, usually taken to be the S&P
500, has a S of 1.0. The B of a stock with the sarne price movement as the market also has
a B of 1.0. A stock whose price movement is greater than that of the market, such as a
technology stock, is riskier than the overall market and has a B greater than 1.0. A stock
with a below average price movement, such as the stock of a regulated public utility, is
less risky than the overall market and has a B less than 1.0. Estimating a stock's fJ
32

l_
z
DIRECT TESTIMOI,'IY OF J. MNDALL IYOOLRIDGECASE NO. O 2 - 1 2 8O.TP-UNC
involves running a linear regression of the stock's return over time on the market return,
as shown in the gaph below:
Cakulatian of Beta
Slope=beta
The slope of the regression line is the stock's B. A steeper line indicates the stock is more
sensitive to the retum on the overall market. This means that the stock has a higher B and
greater than average market risk. A less steep line indicates a lower B and less market
risk.
Numerous online invesbnent information services, such Yahoo and Reuters, ptovide
estimates of stock betas. Most of the time these services report different betas for the
same stock. The differences are usually due to (1) the time period over which the B is
measured and (2) any adjustrnents that are made to reflect the fact that betas tend to
regress to 1.0 over time.
3
4
5
6
8
9
L 0
1 1
1 2
1 3
1 A
33

t-
, 2
3
45
DIRECT TESTIMONY OF J. MNDALL WOOLNDGECASE NO. 02. I 2 8O.TP-INC
In estimating an equity cost rate for SBC Communications, Inc. using the group of
telecommunications firms, like Dr. Avera, I will use the betas provided by the Value Line
Investment Survey. These betas are:
Betas for Telecommunications FirmsValue Line Investment
ALLTEL 1.00
BellSouth 0.95
CenturyTel 1 . 1 0
SBC Communications 1.05
Sprint 1.05
Telephone & Data Systems 1.00
Verizon 1.00
Average L.02
Data Source: Value Line Investment Survey, Api12,2004.
Given these figures, I will use a fJof 1.0 for the goup.
PLEASE DISCUSS TIIE DEBATE REGARDING TIIE EQUITY RISK PREMIUM.
The equity or market risk premium-f,E(R,) - Rd: is equal to the expected return on the
stock market (e.g., the expected return on the S&P 500 (E(R,) minus the risk'free rate of
interest (Rf). Th. equtty premium is the differe,nce in the expected total retum between
investing in equities and investing in "safe" fixed-income assets, such as long-term
govemment bonds. Howeve,r, while the equity risk premium is easy to define conceptually,
it is difficult to measure because it requires an estimate of the expected retum on the market.
6
U
9
r.o Q37.
1r- 437.
L 2
r_3
L 4
1 5
1 A
T 7
34

aI
2
3
56
7
8
9
1 0
1 1
t 2
t 3
Q38.
DIRECT TESTIMOTIY OF J. MNDALL VOOLNDGECASE NO, 02 - 1 2 8O-TP-UNC
PLBASE DISCUSS TIIE ALTERNATIVE APPROACHES TO ESTIMATING THE
EQUITY RISK PREMIUM.
The table below highlights the primary approaches to, and issues in, estimating the expected
equity risk premium.
The traditional way to measure the equity risk prernium was using the difFerence between
historic ex post average stock and bond retums. Therefore, ex post returns were used as
market expectations. This type of historic evaluation of stock and bond returns is often
called the "Ibbotson approach" after Professor Roger Ibbotson who popularized this method
of assessing historic financial market returns. Most historic assessments of the equity risk
premium suggest an equity risk premium of 5-7 percent above the rate on long-term
A38.
Histortf;al ExFo*tExce** Rsturttf,
$unrup Er ftile frfiudslt andMarket Dda
Meanr ofA*senxing theEquity-EnnilE"iskPremium
Histnrical arrcrage i* apopularprurry for theex arde premirnn -butlihelyto he mtobading
hnmrtorand e4tertFrursl* canprmddediruct ertinrde; ofpruvailing expectef,rnturrreSrumftuils
Cur:snt finaruial marttetprites (furyIe vatratisnmtips orDDM-basedmemureo) ean give mnsl.ubjectirru e*iirnnh* offennihle ex irte equity-hord riskprnndrm
Prnhlemrl
Debated Issuex
Time rruriatinn inrequirud mturrrc andsy*emadc sehctimrard uthcrhiasen hmrubnostef, vnhrntiomuver time, mrd hareemgerated realieedertessequity returrEcnr:Eared with exantperryectedpmmiurm
timited sunrulrhisto** ard questinruof nrweyrepDe*ntatitllerEss
SurrrcX* rnay bllmnreahout ttoped-furerqrected retur:ns tlmnahout otjoctftrcruquinedprumiunudue to irmtionnlbiasnsuch u extrqlolation
.*s*urrytinns needed fsrDDM irryuts, notntlY thetrend earningr grusth rtrte,rnaheermr thw mndels'nutlrutfi subjective.
Range dvkws on rhbgrurrth rate @lus debntesnn rukrnnrf. stndc md hurulYield"l -:'mnS ofpnemiumestimnls.
Source: Antti llmanen, Expected Refirnrs on Stocks and Bonds,"./ounal of Portfolio Managanenf, (Winter 2003).
35

l-
2
3
4
5
R
7
8
9
L 0
L L
t 2
l_3
I 4
L 5
l_6 Q39.
t7
18 A39.
i_9
DIRECT TESNMONY OF J. MNDALL WOOLRIDGECASE NO. 0 2- | 2 80-TP-UNC
Treasury bonds. However, this can be a problem because (1) ex post retums are not the
same as ex ante expectations, (2) market risk premiums can change over time, increasing
when investors become more risk-averse, and decreasing when investors become less
risk-averse, and (3) market conditions can change such that ex post historic retums are
poor estimates of ex ante expectations.
The use ofhistoric retums as market expectations has been qiticizdin numerous academic
studies.u The general theme of these studies is ttrat the large equity risk premium discovered
in historic stock and bond returns cannot be justified by the fundamental data. These
studies, which fall under the category "Ex Ante Models and Market Data," compute ex ante
expected retums using market data to arrive at an expected equity risk premium. These
studies have also been called "Pvrule Research" after the famous study by Mehra and
Prescott in which the authors first questioned the magnitude of historic equity risk
premiums relative to fundame,lrtals.t
PLEASE BRIEFLY SUMMARIZE SOME OF THE NEW ACADEMIC STUDIES
TIIAT DEVELOP EX ANTE EQUITY RISK PREMIUMS.
Two of the most prominent studies of ex ante expected equity risk premiums were by
Eugene Fama and Ken French (2002) and James Claus and Jacob Thomas (2001). The
6The problems with using ex post historic returns as measure of ex ante expectation will be discussed at length laterin my testimony.
tRahnish Mehra and Edward Prescott, "The EquityPremium: APuzzle," Journal of Monetary Economtc (1985).
36

L 0
l_1
t 2
DIRECT TESNMOI,{Y OF J. RANDALL WOOLNDGECASE NO. 02 - 1 2 8O-TP-UNC
primary debate in these studies revolves around two related issues: (l) the size of expected
equity risk premium, which is the retum equlty investors require above the yield on bonds;
and (2) the fact that estimates of the ex ante expected equity risk premium using
fundamental firm data (eamings and dividends) are much lower than estimates using
historic stock and bond return data. Fama and French Q002), two of the mqst preeminent
scholars in finance, use dividend and earnings growth models to estimate expected stock
returns and ex ante expected equity risk premiums.s They compare these results to actual
stock returns over the period 195l-2000. Fama and French estimate that the expected
equity risk premium from DCF models using dividend and earnings growth to be between
2.55% and 4.32%. These figures are much lower than the ex post historic equity risk
premium produced from the average stock and bond return returns over the same period,
which is7.40o/o.
Fama and French conclude that the ex ante equity risk premium estimates using DCF
models and fundamental data are superior to those using ex post historic stock returns for
three reasons: (1) the estimates are more precise (a lower standard enor); (2) the Sharpe
ratio, which is measured as the [(expected stock return - risk-free rate)/standard deviation],
is constant over time for the DCF models but more than doubles for the average stock-bond
return model; and (3) valuation theory specifies relationships between the market-to-book
ratio, retum on investnent, and cost of equity capital that favor estimates from
tEogeo" F. Fama and Kenneth R. French, "The Equity Premium," The Journal of Finance, April 2002' This paper
maybe dowrloaded from the Internet at htto://papers.ssm.com/sol3/papers.cfin?abstract id=236590.
37
t 4
1 5
1 6
1,-t
1 8
1 9
z v

1
2
DIRECT TESTIMONY OF J. MNDALL WOOLMDGECASE NO. O 2 - T 2 8O-TP-(NC
fundamentals. They also conclude that the high average stock returns over the past 50
yeils were the result of low expected retums and that the average equity risk premium has
been in the 3-4 percent range.
The study by Claus and Thomas of Columbia University provides direct support for the
findings of Fama and Fre,nch.e These authors compute ex ante expected equity risk
prerniums over the 1985-1998 period bV (1) computing the discount rate that equates market
values with the present value of expected future cash flows, and (2) then subfiacting the
risk-free interest rate. The expected cash flows are developod using analysts' earnings
forecasts. The authors conclude that over this period the ex ante expected equity risk
premium is in the range of 3.0%. Claus and Thomas note that over this period ex post
historic stock refurns overstate the ex ante expected equity risk prernium because as the
expected equity risk premium has declined, stock prices have rise,n (present values increase
when required rates of retum decline). The higher stock prices have produced stock returns
that have exceeded expectations and therefore ex post historic equity risk premium
estimates are biased upwards as measures of ex ante expected equity risk premiums.
8
9
t 0
Ll_
L2
L 3
L 4
1 6
t ]
18 Q40.
1 9
20 A40.
PLEASE PROVIDE A SUMMARY OF THE EX ANTE EXPECTED EQUITY RISK
PREMIUM STUDIES?
Richard Derrig and Elisha Orr (2003) recently completed the most comprehensive paper to
t Ja-es Claus and Jacob Thomas, "Equity Risk Premia as Low as Three Percent? Empirical Evidence from Analysts'
Earnings Forecasts forDomestic and International StockMarket," Journal of Finance' (October 2001).
38

7
8
DIRECT TESTIMONY OF J. MNDAU WOOLNDGECASE NO. O 2 - 1 2 8O.TP-LTNC
date which summarizes and assesses the many risk premium studies.lo Appendix B of their
study, which provides sunmary statistics for the different studies, is included as Attachment
JRW-7. The risk premium studies listed under the 'Social Security' and'Pluzzle Research'
sections are primarily ex ante expected equity risk premium studies. Most of these studies
are performed by leading academic scholars in finance and economics. A review of the
'ERP Estimate' column in Appendix B of the Derrig and On papsr suggests that the
ave,rage ex ante equity risk premium estimate is in the 4.0o/onnge.
s Q41. cMN THIS BACKGROUND INFORMATION, HOW WILL YOU ESTIMATE
r_0 AN EQUITY RrSK PREMIUM FOR YOUR CAPM?
11 A41. My equity risk premium is the average of, (l) the 4.0o/o average ex ante expected equity
L2 risk premiums from the studies covered in the Derrig and On (2003) paper and (2) an ex
i.3 ante expected equrty risk premium developed using Ibbotson and Chen's "building blocks
t4 methodology."
to Richard Denig and Elisha Orr, "Equity Risk Premium: Expectations Great and Small," Working Paper (version3.0), Automobile Insurers Bureau of Massachusetts, August 28,2003.
39

1 0
l_1
L2
l_3
1 A
l_5
DIRECT TESNMOI'ry OF J. MNDALL WOOLNDGECASE NO. 02 - 1 2 8O-TP.LTNC
Q42. PLEASE DISCUSS TIIE EX ANTE EXPECTED EQUITY RISK PREMIUM
COMPUTED USING THE "BUILDING BLOCKS METHODOLOGY.'
A42. Ibbotson and Chen (2002) evaluate the ex post historic mean stock and bond retums in what
is called a 'building blocks methodology."" They use 75 years of data and relate the
compounded historic retums to the different fundamental variables employed by different
researchers in building ex ante expected equity risk premiums. Among the variables
included were inflation, real EPS and DPS growttr, ROE and book value growth, and P/E
ratios. By relating the fundame,lrtal factors to the ex post historic returns, the methodology
bridges the gap between the ex post and ex ante equtty risk premiums. Ilmanen (2003)
illustrates this approach using the geomefric retums and five firndamental variables -
inflation (CPD, dividend Vield (D/P), real eamings growth (RG), repricing gains (PEGAIN)
and return interaction/reinvestrnent (INT). " This is shown in the graph below. The first
column breaks tJte 1926-2000 geometic mean stock retum of 10.7% into the different
return compone,nts demanded by investors: the historic Treasury bond return (5.2%), the
excess equlty retum (5,2%),and a small interaction term (0.3%). This 10.7% annual stock
tt Rog", Ibbotson and Peng Chen, "Long Run Returns: Participating in the Real Economyo" Financial AnalystsJoumal, January 2003.
"Anttillmanen,ExpectedReturnsonStocksandBonds,"../ournalofPortfolioManagement,(l,lintnr2003),p. 11.
40

57
8 Q43.
9
10 443.
Ll_
DIRECT TESTIMOI'{Y OF J. MNDALL TTOOI-RIDGECASE NO. 02 - I 2 8O-TP-UNC
return over the 1926-2000 period can then be broken down into the following fundamental
elements: inflation (3.1%), dividend yreld(.1'.3V$, real earnings growth (1.8%), re'pricing
gains (1.3%) associated with higher P/E ratios, and a small interaction term (0.2%).
Decomposing Equity Market RetumsThe Buildine Blocks
10.70 l0.7slo
v f,xAnte ErpectedEqulty ReturnReturn-1926-2000 Decomposed
HOW ARE YOU USING THIS METHODOLOGY TO DERTVE AI\ EX ANTE
E)PECTED EQUITY RISK PREMIUM?
The third column in the gaph above shows current inputs to estimate an ex ante expected
market return. These inputs include:
41

4
56I
I
DIRECT TESNMOI,IY OF J. MNDALL TYOOLMDGECASE NO. 02- I 280-TP-UNC
CPI - the gaph below shows the expected inflation over the coming year according to the
University of Michigan Survey Research Center. In April, expected inflation hrt 3.2%.
Given the frend in consumer prices, and especially oil-related energy prices, I used an
expected inflation figure of 3.5%.
Expected Inflation RateUniversity of Michigan Consumer Research
(Data Source: http://research.stlouisfed.orgl fred2l senes/IrdICFV98)
3.53.01.5x.01.51.00.50.0
nu***f ,"\.doCSs*dsn-cs.6f**u9
1 01_ 1_
L 2
1 3
I 4
D/P - As shown in the gaph below, the dividend yield on the S&P 500 has decreased
gradually over the past decade. Today, it is far below its norm of 4.3% over the 1926'2000
time period. Whereas the S&P dividend yield bottomed out at less than 1.4% in 2000, it is
currently at2.lYo which I use in the ex ante risk premium analysis.
42

DIRECT TESTIMONY OF J. MNDAA WOOLNDGECASE NO. 02-1280-TP-WC
L
z
3
S&P 500 Dividend Yield(Data Source: http://www.barra.comlResearch/fund-charts.asp)
Dividend Yields&P 500
3.5
2.8
2.1
1 .4
0.7
0.008191 04193 12,S4 08,S6 04rg$ 12JSS 08fi1 04103
RG - Previously, it was shown that over the 1960-2003 period, nominal growth in EPS for
ttre S&P 500 was 688%. On page 2 of Attachment JRW-6, real EPS growth is computed
using the CPI as a measure of inflation. Over fhe 1926-2000 period, real eamings growth
was 1.8%. The real growth figure over 1960-2003 period for the S&P 500 is2.5oh, which I
use in the ex ante risk premium analysis.
PEGAIN - the repricing gains associated with increases in the P/E ratio accounted for l.3Yo
of the 10.7% annual stock return in the 1926-2000 period. In estimating an ex ante
expected stock market return, one issue is whether investors expect PIE ratios to increase
from their current levels, The gaph below shows the P/E ratios for the S&P 500 over the
past 25 years. The run-up and eventuat peak in P/Es is most notable in the chart. The
relatively low PIE ratios (in the range of 10) over two decades ago are also quite notable. As
of May, 2004 the P/E for the S&P 500, using the tailing 12 months EPS, is 22.89
according to www.investor.reuters. com.
4
5
1 0
1,1"
t 2
l-3
l -4
L 5
1 6
3,7
t d
43

L
2
4
5
6
89
l_0L 1
t2 Q44.
1 3
1 A
r_s 1,+4.
1 6
t 7
DIKECT TESTIMONY OF J. RANDALL WOOLNDGECASE NO. 02- I 2 8O.TF-(NC
Given the current economic and capital markets environment, I do not believe that investors
expect even higher P/E ratios. Therefore, a PEGAIN would not be appropriate in
estimating an ex ante expected stock market return. There are two primary reasons for this.
Firs! the ayerugehistoric S&P 500 PIE ratio is 15 - thus the currelrt P/E exceeds this figure
by nearly 50%. Second, while the high curre,rt P/Es reflect the fact that interest rates are
relatively low, given their current levels, investors probably do not expect to get a big stock
market gain from lower interest rates.
S&P 500 P/E Ratios(Data Source: http://www.barra.com/Research/fund-charts.asp)
PriceiEarnings (lncl Negative)s&P 500
60.050.0
40.030.0
20,010.00.0
06f|g 12,81 06184 12/86 06/89 12191 06194 12€6 06199 12/U1
GIVEN TIIIS DISCUSSION. WIIAT IS YOUR EX A}[TE EXPECTED MARKET
RETURN AIID EQUITY RISK PREMIUM USING THE 6'BUILDING BLOCKS
METIIODOLOGY''?
My expected market return is re,presented by the last column on the right in the graph
entitled "Decomposing Equity Market Retums The Building Blocks Methodology" found
earlier in my testimony. I believe that the appropriate expected market retum is 8.1% which
44

DIRECTTESTIMONY OF J. MNDALL WOOLRIDGECASE NO. 02 - I 2 $O.TP-LNC
t
2
3
4
5
6
7
I
e Q45.
10 A45.
L1_
L 2
1 3
1 A
I f ,
1 6
L7 Q46.
18 A46.
L 9
is composed of 3.5% inflation, 2.lo/o dividend yield, and2.5% real earnings growth rate.
Previously I noted that I am using a risk-free interest rate of 4.76%. This is l0-year
Treasury yield as of the 3t week of May, 2004. My ex ante equity risk premium is simply
the expected market retum from the 'building blocks methodology" minus this risk-free
rate:
Ex Ante EquU Risk Premium = 8.10% 4.76% : 3.34o/o
WIIA*T EQUITY COST RATE IS INDICATED BY YOUR CAPM ANALYS$?
This is summarized on page I of Attachment JRW-6. My ex ante CAPM equity risk
premium is the average of the Derrig-Orr mean (4.00%) and my building blocks approach
(3.34%), or 3.670/o. Using a risk-free rate of 4.76% and a beta of 1.0, my CAPM estimate
cost rate is 8.38%.
D. EQUITY COST RATE SUMMARY
PLEASE SI]MMARIZE YOUR EQUITY COST RATE STUDY.
My DCF analysis for the comparable goup indicates an equity cost rate of 10.21%. My
CAPM study suggests an equity cost rate of 8.38%.
45

L Q47.
2
3 A47.
4
5
a Q48.
z A48.
8
9
1 0
1_1
L Z
l-3 Q49.
449.
DIRECT TESTIMOI{Y OF J. MNDALL WOOLNDGECASE NO.02-1280-TP-WC
GI-N THESE RESULTS, WHAT EQUITY COST RATE RECOMMENDATION
ARE YOU MAKING FOR SBC OHIO?
Since I primarily employ the DCF model to estimate an equity cost rate, I am
recommendrng the DCF equity cost rate of 10.00% for SBC Ohio.
ISN'T YOURRECOMMENDED RETURN LOW BY IIISTORIC STAI\DARDS?
Yes it is. My recommended rate of retum is low by historic standards for three reasons.
First, as discussed above, capitat costs are very low by historic standards. Sec,ond, the 2003
tax law, which reduces the tax rates on dividend income and capital gains, lowers the pre-
tax retum required by investors. And third, as discussed below, the equity or market risk
premium has declined.
FINALLY, PLEASE DISCUSS THIS RECOMMENDATION IN LIGHT OF
RECENT YIELDS ON BONDS.
In rece,lrt months the yields on SBC Communications, Inc.'s 'A' rated corporate bonds have
been in the 5.5-6.0 percent range. My equity return recommendation of L0.0% must be
viewed in the context of the significant shift in the risk and return characteristics of bonds
and stocks over the past two decades. This change and its implications for equity risk
premiums are discussed further in my critique of Dr. Avera's testimony. In short, the
relative risk of stocks and bonds has changed in recent years as stocks have become less
volatile and risky while bonds have become more volatile and risky. AccordinglY, the
l _ f
L 6
t 7
l-8
L 9
2 0
2 t
46

l_
z
3
45
6
7
89
1 01 1t 21_3
L 4
I 5
l_6
L 7
1_8
L 9
2 0
2 L
2 2
2 3
2 4
DIRECT TESTIMONY OF J. MNDALL WOOLRIDGECASE NO. O2.I 280-TP-UNC
return premium that equity investors require over bond yields is much lower than it was
when stock returns were much more volatile than bond retums.
v. CRTTIQUE OF DR. AVERA'�S COST OF CAPITAL TESTIMONY
Q50. PLEASE SIIMMARIZE DR. AVERA'S COST OF CAPITAL RECOMMENDATION.
A50. As summarized below. Dr. Avera's overall rate of retum recommendation is lt.gl%.
CapitalSourceL-T DebtCommon EquitvCost of Capital
Ratio19.0%8r.0%
Cost WeightedRate Cost Rate6.18% l . l7%13.25% 10.73%
tr.9r%
Q51. WrrAT CRITICTSMS DO yOU HAVE OF DR. AYERA'S RECOMMENDED
COST OF CAPITAL FOR THE COMPAI{Y?
A51. I address the three major areas of disagree,me,nt I have with Dr. Avera: (1) the appropriate
capital sfucture, Q) the debt cost ratg and (3) the equity cost rate.
Q52. PLEASE REVIEW THE DIFFERENCES YOU HAVE WITH DR. AVERA ON TIIE
APPROPRIATE CAPITAL STRUCTURE FOR TIIE COMPAIIY.
A52. Dr. Avera ernploys a market value capitalizatron as of a point in time, whereas I use an
average market value - book value capitalization over five years. As discussed, market
value capitalizations tend to vary significantly over the years due to their sensitivity of the
capitalization ratios to the stock price. Using the average market value - book value
47

1-
z
DIRECT TESNMOI'IY OF J. MNDALL VOOLNDGECASE NO. 02. I 28O.TP.UNC
capitalization over five years provides for a forward-looking, more stable capitalization
that is not overly affected by the current stock price and one-time financings and/or
significant economic events. In addition, book value capitalizations are important in that
they are the most common form of capitalization reported in financial reports and
publications. Finally, it is important to note that book and market value capitalizations
tend to converge over time.
lr summary, my proposed S-year average book and market value capitalization provides
the more appropriate forwardlooking market capitalization for SBC Ohio.
HOW DO YOU AND DR. AVERA DIF'FER IN TERMS OF' SBC'S DEBT COST
RATE?
Dr. Avera used a debt cost rate of 6.18% which is the yield on Moody's long-term, 'A'
rated industial bonds as of December 8, 2003. I used the current l0-year Treasury yield of
4.76% and then added 104 BPs which is the median yield difference between lO-year
Treasuries and 'A' rated corporate bonds over the past ten years.
I have two major concems with Dr. Avera's debt cost rate: (1) his "snapshot" approach to
rneasuring the debt cost rate, and (2) his failure to account for the maturity structure of
SBC's debt in that his debt cost rate is long-term, while SBC Communications, Inc.'s debt
is primarily medium term.
3
4
5
6
tt
9
1 0
11 Q53.
12
1_3 A53.
L 4
l-5
1_6
L 7
l_8
1"9
2 0
2 T
48

1 0
l_1
T2
1 3
L4
I f ,
DIRECT TESNMOI'IY OF J. MNDALL WOOLNDGECASE NO. 02. I 280-TP-UNC
First, as with the capital sffucture issue, Dr. Avera measures SBC Communications, Inc.'s
fonvardlooking debt cost rate at just one point in time. It is my opinion that Dr. Avera's
"snapshof' approach to determining SBC's capital structure and debt cost rate does not
provide for an appropriate forward-lookingcapitalization and debt cost for SBC Ohio. My
evaluation of capital structure over five years and average yield differe,lrtials over ten years
is more representative of a forwardJooking capital stnrcture and debt cost rate than Dr.
Avera's "snapshof ' approach.
Second, Dr. Avera's debt cost rate reflects the rates on long-term "A" rated debt. However,
as previously documented, the vast majority of SBC Communications, Inc.'s debt is
cheaper short- and medium- term financings. This is due, in large part, to the very
aggressive medium-term note financing program of SBC Communications, lnc. and its
subsidiaries. Medium-term notes have maturities of 5-12 years and usually have lower
coupon rates than long-term bonds. As such, Dr. Avera's debt cost rate is clearly excessive
and is not reflective of SBC's forward-looking financing stategy and debt cnst rate.
49

r Q54.
z A54.
3
4
567 .
8
9
1 n
l_ l_
L 2
1 3
L 4
I f
L6 Q55.
L7 A55.
l_8
L 9
DIRECT TESNMOI'fl OF J. MNDALL TTOOLNDGECASE NO. O 2. 1 2 8O.TP.LNC
PLEASE REVIEW DR. AVERA'S EQUITY COST RATE APPROACHES.
Dr. Avera estimates an equity cost rate for SBC by applying a nonconstant growth DCF
model and the CAPM to the goup of telecommunications companies. His equity cost rate
estimates are summarized below:
Summarvof Approaches and Results
TelecommunicationsGrouo
Non-Constant DCFAverage t3,6%Excludine Hieh and Inw 13.9o/o
CAPMForward-Lookins Returns 13.8%Historical Retums It.8%
Based on these figures, he arrives at an equity cost rate estimate for SBC Ohio of 13.25%.
The primary enors in his equity cost rate studies are (1) the use of an inappropriate
nonconstant DCF model that is highly se,nsitive to one analyst's forecast of future stock
prices and (2) biased and outdated equity risk premium estimates for his CAPM analyses.
These errors are discussed in detail below.
PLEASE SUMMARIZE DR. AVERA'S DCF ESTIMATE.
Dr. Avera claims to apply a nonconstant-gfowth DCF model to the goup of
telecommunications companies and arrives at an equity cost rate estimate of L3.6%. For
each companyin the group, he uses as future cash flows (l) Value Line's projected dividend
50

1
2
t 4
1"5
1 6
3
4 Q56.
s ,{56.
6
8
9
1 0
1_1
t 2
1 3
t 7
1 8
1 9
2 0
21,
DIRECT TESNMOIIT OF J. MNDALL WOOLNDGECASE NO. 02 - I 2 gO-TP-UNC
over the next four years, and (2) the projected stock price at the end of four years (computed
as the average of the high and low projections).
PLEASE EXPRESS YOUR CONCERNS WITH DR. AVERAOS DCF STUDY.
I have two concerns with Dr. Avera's DCF equity cost rate study.
First, I disagree with Dr. Avera claims this is a nonconstant-gpwttr DCF approach. I have
previously discussed nonconstant-growth DCF models, and his application is not a
traditional nonconstant-gfowth DCF. Nonconstant-growth DCF models involve projecting
future dividends over diffuent stages of a company's life cycle and then, in this case, using
these projections to find the discount rate that equates the current stock price with all fufure
dividends. Instead of using all future dividends, Dr. Avera is utilizing an estimate of the
future stock price.
Sgcond, Dr. Avera's DCF approach is higruy sensitive to the projected future stock price.
This is especially questionable since (a) it relies on the estimate of only one individual, and
thus it is not a consensus of the market, (b) Dr. Avera has provided no empirical support
ttrat this one individual at Value Line, or even Value Line rtself, is proficient at predicting
future stock prices, and (c) predicting future stock prices, as opposed to fundamental firm
variables such as earnings and dividends, is highly speculative grven the many
macroeconomic forces that affect stock prices.
5 l

1"0
1 1
r z
1 3
t 4
L 5
I 6
1,7
1 8
t 9
DIRECT TESNMOI,{Y OF J. MNDALL WOOLNDGECASE NO. 02 - t 2 8o-TP-UNC
Q57. PLEASE DISCUSS YOUR UPDATE TO DR. AVERA'�S NONCONSTAIIT-
GROWTH DCF MODEL.
A57. Value Line is updated quarterly, and therefore an updated, Value Line was published for
the telecommunications goup on April 2, 2004. We have moved ahead almost six
months from when Dr. Avera prepared his testimony, and Value Line is now forecasting
forward one additional year. In Attachment JRW-8, I have updated Dr. Avera's
nonconstant growth DCF, using the updated Value Line estimates and moving the
analysis forward one year. The ending period is now the years 2007-2009 which is a more
accurate four-year projection. Reflecting my eadier comments concerning the sensitivity
of the results to the projections, the average DCF equity cost rate has decreased to
10.20yo,which is consistent with my DCF equity cost rate estimate for the group.
Q58. PLEASE DESCRTBE DR. AVERA'S USE OF THE CAPM.
A58. Dr. Avera applies the CAPM to the telecommunications group to estimate an equity cost
rate for the Company. Dr. Averaperforms two CAPM analyses, the difference being in the
manner in which the equity risk prernium is calculated. In both cases, he uses a 2O'year
risk-free rate of 5.10% and a beta of 1.01. The first equity risk premium is based on the 5-
year projected EPS growth for the S&P 500, and the second uses historic stock and bond
returns. These two CAPM analyses provide equity cost rate estimates of 13.8% and 11.8%.
52

t_
2
DIRECT TESNMOM OF J. MNDAA ITOOLRIDGECASE NO. O 2. I 2 8O-TP-UNC
Q59. WHAT IS YOUR ASSESSMENT OF DR. AVERA'S TWO CAPM ANALYSES?
A59. I have concems with the calculation and magnitude of the equityrisk premium of each.
3
4 Q60.
s A60.
6
PLEASE ADDRESS DR. AVERA'S FIRST CAPM ANALYSIS.
In his first CAPM, Dr. Avera estimated an equity risk premium of 8.6%. The first equity
risk premium was computed in the following manner: (1) he started with the dividend yield
for the S&P 500 of l.60/o, (2) added an expected return for the market analysts' estimated 5-
year EPS forecast of 12.1%o, and (3) then subtacted the 2}-year risk-free of S.loh, to arrive
at an equity risk premium of 8.6%. His CAPM equity cost rate of 13.8% is then calculated
as the risk-free rate (5.1%) plus beta (1.01) times his equity risk premium (8.6%).
The primary issue here is the mannef, in which he calculated the equity risk premium. As I
have discussed previously in this testimony, analysts' 5-year projected EPS growth rates
have consistently been well above the EPS growth rates that the S&P 500 companies have
actually produced. As such, investors are wise e'nough to know that these are biased
forecasts and therefore are not meaningful measures of market expectations. As previously
noted, these growth rate forecasts are collected and published by Zacks, Yatroo First Call
and Reuters. These services reffieve and compile 5-year EPS forecasts from Wall Street
8
9
1 0
L1_
L2
l_3
f +
1 5
1 6
I 7
1_8
53

l_0
l_1
L2
L3
. l A
L 5
L 6
l7
DIRECT TESNMOM OF J. MNDAU TTOOLNDGECASE NO. 02 - I 2gq-TP-IINC
Analysts. These analysts come from both the sell side (Merrill Lynch, Paine Webber) and
the buy side (Prudential Insurance, Fidelity Invesfinents) investnent firms. It is well known
that the EPS forecasts of these analysts, especially those on the sell side, are overly
optimistic and therefore biased upwards.
Q61. WIIA'�T rS THE MAGNITUDE OF THE BIAS IN ANALYSTS' s-YEAR EPS
FORECASTS?
A61. It is significant. The long-term annual EPS growth for the S&P 500 is 6.88%. I previously
showed a gaph of analysts' 5-year EPS projections for the S&P 500. In the graph on page
55 labeled Actual versus Forcasted 5-year EPS Growth for the S&P 500 1985-2003, I have
overlayed these results on the actual S-year EPS growth that the S&P 500 firms actually
produced. For example, the 1995, analysts were projecting 5-Year compounded annual
EPS growth of 11.75%, but companies only generated annual compounded EPS growttt
over the next five years of 8.02%. The difterences are dramatic. Whereas Wall Street
analysts have continually forecasted 5-year EPS growth for the S&P 500 in the ll-16
percent range, these firms have delivered EPS growth in the 7.0 percent range. The only
years when firms met analysts' expectations were in the early 1990s. Over the entire period,
54
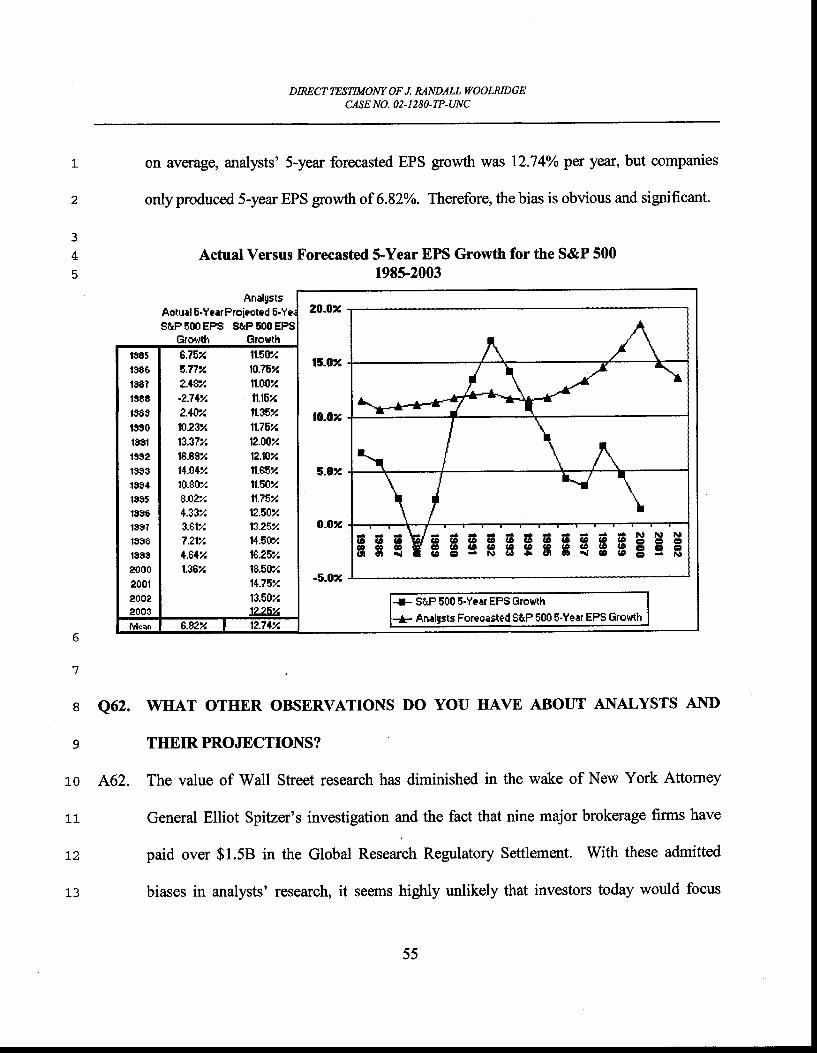
6
7
8
9
L 0
l_1
L 2
L 3
DIRECT TESNMONY OF J, MNDALL IYOOLNDGECASE NO. 02 - 1 2 8O-TP-UNC
on average, analysts' S-year forecasted EPS growth was l2.74o/o per year, but companies
only produced 5-year EPS growth of 6.82%. Therefore, the bias is obvious and significant.
ActualVersus Forecasted S-Year EPS Growth for the S&P 500
Q62. WHAT OTHER OBSERVATTONS DO YOU HAVE ABOUT ANALYSTS AND
TIIEIR PROJECTIONS?
A62. The value of Wall Street research has diminished in the wake of New York Attorney
General Elliot Spitzer's investigation and the fact that nine major brokerage firms have
paid over $1.58 in the Global Research Regulatory Settlernent. With these admitted
biases in analysts' research, it seems higtrly unlikely that investors today would focus
Actual 5-Ye*Prgiected 5-SEPEOOEPS S&PEOO
S&P 500 5-Yeet EPS Gtowth
Analgsts Fotecrsted 5&P 500 5-Yeat EPS Gtowth
EEEHHEHHEEEHHH
8.78t/.E.?7%2.18)l-2.74/�2.40:4lo.?ltA13.37'/.1S.89%1+.04'110.80it8.02:l4.33':43.6127.2171{.6+%1.362
ll.50z10.75%11.00%lt.t5z11.36z11.75i/..|2.002
12.10%ll.G5%ll.50z11.75.l12.80213.26:ll+.50'{$.e5%18.50%14.787�13.502
t$85t9E6ts8?t$6Et$60t9s0tssttss2ts931994t9s5t9s6t997ts9Etss94000e00te002
55

L 0
1l_
T2
1 3
I4
l-5
DIRECT TESTIMOI'IY OF J. MNDALL WOOLNDGECASE NO. 02-1280-TP-WC
squarely on the forecasts of securities analysts in ariving at expected growth. Clearly,
investors have leamed to be suspicious of the upwardly biased forecasts and stock
recommendations of securities analysts. In the academic world, the fact that the EPS
forecasts of securities' analysts are biased upwards is common knowledge.
Q63. DO yOU BELIEVE THAT THE CRACKDOWN ON WALL STREET FTRMS rrAS
LED TO MORE HONEST AI\D LESS BIASED FORECASTS A}[D
RECOMMENDATIONS?
A63. No. The fact is that analysts continue to provide overly positive outlooks for their stocks.
Two recent Wall Street Journal articles focus on this very issue. The first article ("Stock
Analysts Still Put Their Clients Firsf') higfiights the fact that that despite the recent
reforms, analysts still give higher ratings to companies that employ their firms for
invesftnent banking se,nric,es.l3 In the second article, the title says it all -- "Analysts Still
Coming Up Rosy - Over-Optimism on Growth Rates is Rampant - and the Estimates Fielp
to Buoy the Market's Valuation." The following quote also provides insight into the
continuing bias in analysts' forecasts:la
Hope springs eternalo says Mark Donovan, who manages BostonPartners Large Cap Value Fund. 'You would have thought that,glven what happened in the last three years, people would havegrven up the ghost. But in large measure they have not.'
Randall Smith,"Stock Analysts Still hrt Their Ctents First' Wall Street Journal, (April7, 2003), p. Cl.
Ken Brown,"Analysts Still Coming Up Rosy - Over-Optimism on Growth Rates is Rampant - and the EstimatesHelp to Buoy the Market's Valuation." l{all Street Journal, (Iautary 27,2003),p. CI.
56
t 6
l 7
L 8
1 9
2 0
13

DIRECT TESNMOM OF J. MNDALL WOOLNDGECASE NO, O2-I 28O.TP-UNC
1-
z
4
3
b
1_5
L 6
t 7
These overly optimistic gpowth estimates also show that, even withall the regulatory focus on too-bullish analysts allegedly influencedby their firms' investment-banking relationships, a lot of thingshaven't changed: Research remains rosy and many believe it alwayswill.
t Q64.
8 464.
9
1 0
L L
1,2
1_3
1 A The issue here again is the calculation of the equlty risk premium. In this second CAPM
application he is using historic ex post returns to compute the ex ante expected risk
premium. kr deriving my ex ante expected equity risk premium, I discussed some of the
general issues with using ex post historic return data to measure the expected ex ante equity
risk premium. I will expand on that discussion now.
t 9
20 Q65. PLEASE DISCUSS THE ERRORS IN USING HISTORIC STOCK AND BONI)
2L RE,TURNS TO ESTIMATE AI\ EQUITY RISK PREMIUM.
22 465. Using the historic relationship between stock and bond retums to measure an expected
23 equity risk premium is erroneous and, especially in this case, overstates the true market
PLEASE CRTTIQUE DR. AVERA'�S SECOND CAPM ANALYSIS.
In his second CAPM, Dr. Avera estimates an equity risk prernium of 6.6%. This represents
ttre difference between the arithmetic mean returns on the S&P 500 and long-term Treasury
bonds. This uses data from 1926 to 2003, and uses the so-called 'Ibbotson approach'
discussed previously. Dr. Avera's second CAPM equity cost rate of ll.8% is then
calculated as the risk-free rate (5.1%) plus beta (1.01) times his equity risk premium (6.6%).
1 8
57

t
z
3
A
5
o
7
8
DIRECT TESTIMOI'il OF J. MNDALL WOOLNDGECASE NO. O 2. I 2 8O-TP.L/NC
equity risk premium. There are a number of flaws in using historic retums over long time
periods to estimate expected equity risk premirms. These issues include:
(A) Biased historic bond returns;
(B) The arithmetic versus the geometric mean return;
(C) Unattainable and biased historic stock returns;
@) Survivorship bias;
(E) The'?eso Problem;"
(F) Market conditions today are significantly different than the past; and
(G) Changes in risk and return in the markets.
These issues will be addressed in order.
9
1 0
1 1
12 Biased Historic Bond Returns
1_3 Q66. HOW ARE HISTORTC BOND RETURNS BIASED?
t4 A66. An essential assumption of these studies is that over long periods of time investors'
15 expectations are realized. However, the experienced returns of bondholders in the past
1,6 violate this critical assumption. Historic bond retums are biased downward as a measure of
t7 expectancy because of capital losses suffered by bondholders in the past. As such, risk
18 premiums derived from this data are biased upwards.
58

DIRECTTESNMONY OF J, MNDALL WOOLNDGECASE NO, 02 - I 2 8O-TP.LTNC
L
z
The Arithmetic versus the Geometric Mean Return
Q67. PLEASE DTSCUSS TIrE ISSUE RELATING TO THE USE
ARITHMETIC VERSUS THE GEOMETRIC MEAN RETURNS
OF
IN
THE
TIIE
4 IBBOTSON METHODOLOGY.
s A67. The measure of investnent return has a significant effect on the interpretation of the risk
o premium results. When anallzing a single security price series over time (i.e., a time
7 series), the best measure of invesfine,nt performance is the geomehic mean return. Using
8 the arithmetic mean overstates the return experienced by investors. In a study entitled "Risk
s and Return on Equity: The Use and Misuse of Historical Estimates," Carleton and
10 Lakonishok make the following obsenration: "The geometric mean measures the changes in
11 wealth over more than one period on a buy and hold (with dividends invested) strategy."ls
Lz Since Dr. Avera's study covers more than one period (and he assumes that dividends are
13 reinvested), he should be employing the geometic mean and not the arithmetic mean.
l5 Willard T. Carleton and Josef Iakonisholg "Risk and Return on Equity: The Use and Misuse of Historical Estimates,"Financial Analysts Journal (January-February, 1985), pp. 3847.
59

DIRECT TESNMONY OF J. MNDAA WOOLNDGECASE NO. 02. I 2 8O-TP -UNC
1 Q68. PLEASE PROVIDE Al[ EXAMPLE DEMONSTRATING TIIE PROBLEM WITH
2 ASING THE ARITHMETIC MEAN RETURN.
: A68. To demonsffate the upward bias of ttre arithmetic mean, consider the following example.
4 Assume that you have a stock (that pays no dividend) that is selling for $100 today,
s increases to $200 in one year, and then falls back to $100 in two years. The table below
o shows the prices and retums.
Time Period Stock Price AnnualReturn
0 $100I $200 r00%2 $100 -s0%
U
9
1 0
1-L
L Z
1 3
I 4
The arithmetic mean retum is simply (100% + (-50%)y2:25o/o per year. The geometric
mean return is ((2 * .50)(t2) - I : 0o/o per year. Therefore, the arithmetic mean retum
suggests that your stock has appreciated at an annual rate of 25Yo, while the geomeffic mean
retum indicates an annual return of 0%. Since after two years, your stock is still only worth
$100, the geometic mean return is the appropriate return measure. For this reason, when
stock returns and eamings growth rates are reported in the financial press, they are generally
reported using the geometric mean. This is because of the upward bias of the arithmetic
mean. Therefore, Dr. Avera's arithmetic mean return measures are biased and should be
disregarded.
J_5
L 6
L 7
60

1 0
r l_
L 2
13
I +
l _3
t_6
t 7
L 8
1 9
DIRECT TESflMOI,E OF J. MNDALL ITOOLNDGECASE NO. 02. I 2 8O-TP-(NC
Unattainable and Biased Historic Stock Returns
Q69. yOU NOTE TIIAT HISTORIC STOCK RETURNS ARE BIASED USING TIIE
IBBOTSON METHODOLOGY. PLEASE ELABORATE.
A69. Returns developed using lbbotson's methodology are computed on stock indexes and
therefore (1) cannot be reflective of expectations because these retums are unattainable to
investors, and (2) produce biased results. This methodology assumes (a) monthly portfolio
rebalancing and O) reinvestnnent of interest and dividends. Monthly portfolio rebalancing
presumes that investors rebalance their portfolios at the end of each month in order to have
an equal dollar amount invested in each security at the beginning of each month. The
assumption would obviously generate exfiemd high transaction costs and, as such, these
retums are unattainable to investors. In addition, an acadernic study demonsfrates that the
monthly portfolio rebalancing assumption produces biased estimates of stock returns.l6
Transaction costs themselves provide another bias in historic versus expected retums. The
observed stock returns of the past were not the realized returns of investors due to the much
higher transaction costs ofprevious decades. These higher transaction costs are reflected
through the higher commissions on stock fiades, and the lack of low cost mutual funds like
index funds.
tt See Richard Roll, *On Computing Mean Retums and the Small Firm Premium," Journal of Financial Economics(1983), pp. 371-86.
6 1

l_
2 Q70.
3
a, 470.
)
6
7
8
9
1 0
11 Q71.
t 2
r-3 A7l.
L 4
1 6
t 7
L 8
L 9
DIMCT TESTIMOT{Y OF J. MNDALL TTOOLNDGECAS E NO, O 2. I 2 8O.TP.T]NC
Survivorship Bias
HOW DOES SURVMRSHIP BIAS TAINT DR. AVERA'S HISTORTC EQUITY
RISK PREMIUM?
Using historic data to estimate an equity risk premium suffers from survivorship bias.
Survivorship bias results when using rehrns from indexes like the S&P 500. The S&P 500
includes only companies that have survived. That returns of others that did not perform so
well were dropped from these indexes are not reflected. Therefore these stock returns are
upwardly biased because they only reflect the retums from more successful companies.
The toPeso Problemtt
WIIAT IS TIIE CPESO PROBLEM' AND IIOW DOES IT AFFECT HISTORIC
RETURNS AI\D EQUITY RISK PREMIUMS?
Dr. Avera's use of historic return data also suffers from the so-called "peso problem." This
issue involves the fact that past stock market retums were higher than were expected at the
time because despite war, depression, and other social, political, and economic events, the
US economy survived and did not suffer hl,perinflation, invasion, and the calamities of
other counhies. Therefore, historic stock retums are overstated as measures of expected
renrms.
62
1_0
1l-
L2
13
t4
1 6
L7
1_8
t 9
DIRECTIESNMOT,IY OF I, RANDALL WOOLNDGECASE NO. 02- I 2 8O-TP-UNC
Market Conditions Todav are Sicmificantlv Different than in the Past
Q72. FROM AN EQUITY RrSK PREMIUM PERSPECTTVE, PLEASE DTSCUSS HOW
MARKET CONDITIONS ARE DIFF'ERENT TODAY.
A72. The equity risk premium is based on expectations of the future. When past market
conditions vary significantly from the present, historic data does not provide a realistic or
accurate barometer of expectations of the future. As noted previously, stock valuations (as
measured by P/E) are relatively high and interest rates are relatively low, on a historic basis.
Therefore, gven the high stock prices and low interest rates, expected retums are likely to
be lower on a going forward basis.
Chanses in Risk and Refurn in the Markets
Q73. PLEASE DTSCUSS TrIE NOTION THAT IIISTORIC EQUITY RrSK PREMIUM
STUDIES DO NOT REFLECT THE CHANGE IN RISK AND RETURN IN
TODAY'S FINANCIAL MARIGTS.
A73. The historic equity risk premium methodology is unrealistic in that it makes the explicit
assumption that risk premiums do not change over time. Simply stated, using historic
retums to measure the equityrisk premium masks the dramatic change in the risk and return
relationship between stocks and bonds. The nature of the change is that bonds have
increased in risk relative to stocks. This change suggests that the equity risk premium has
declined in recent vears.2 0
63

1 0
1 1
DIRECT TESTIMONY OF J. MNDALL WOOLNDGECASE NO, 02- I 2 SO-TP-TNC
Page 1 of Attachment JRW-9 provides the annual market risk premiums for the 1926 to
2002period where the annual premium is defined as the retum on common stock minus
the return on long-term Treasury Bonds. There is considerable variability in this series
and a clear decline in recent decades. The high was 54o/o in 1933 and the low was -38%
in 193 I . Evidence of a change in the relative riskiness of bonds and stocks is provided on
page2 of Attachment JRW-9 which plots the standard deviation of annual stock and bond
returns since 1926. The plot shows that, whereas stock retums were much more volatile
than bond retums from the 1920s to the 1970s, bond returns became more variable than
stock returns during the 1980s. In recent years stocks and bonds have become much more
similar in terms of volatility. The decrease in the volatility of stocks relative to bonds has
been attributed to several stock related factors: the impact of technology on productivity
and the new economy; the role of information (see Federal Reserve Chairman
Greenspan's comments referred to earlier in this testimony) on the economy and markets;
better cost and risk management bybusinesses; and several bond related factors;
deregulation of the financial system; inflation fears and interest rates; and the increase in
the use of debt financing. Further evidence of the greater relative riskiness of bonds is
shown on page 3 of Attachment JR.W-9, which plots real interest rates (the nominal
interest rate minus inflation) from 1926 to 2002. Real rates have been well above historic
nonns during the past 10-15 years. These high real interest rates reflect the fact that
investors view bonds as riskier investments.
L3
L 4
1 5
1 6
'J.7
1 8
L 9
2 0
2L
64

1-0
1_L
L2
l_3
DIRECT TESTIMOI{Y OF J. MNDALL ITOOLNDGECASE NO, 02 - 1 2 SO-TP-UNC
The net effect of the change in risk and return has been a significant decrease in the refum
premium that stock investors require over bond yields. In short, the equity or market risk
premium has declined in recent years. This decline has been discovered in studies by
leading academic scholars and investrnent firmso and has been acknowledged by
govemment regulators. As such, using a historic equity risk premium analysis is simply
outdated and not reflective of current investor expectations and investnent fundamentals.
Q74. DOES THE II\WESTMENT COMMUNITY ALSO RECOGNIZE TIrAT TIrE
EQUITY RISK PREMIUM HAS DECLINED?
A74. Yes. One of the first studies in this area w.N by Stephen Einhorn, one of Wall Sfreet's
leading investnent stategists.lT His study showed that the market or equity risk premium
had declined to the 2.0 to 3.0 percent range by ttre early 1990s. Among the evidence he
provided in support of a lower equtty risk premium is the inverse relationship between real
interest rates (observed interest rates minus inflation) and stock prices. He noted that the
decline in the market risk pre,lnium has led to a significant change in the relationship
between interest rates and stock prices. One implication of this development was that stock
prices had increased higher than would be suggested by the historic relationship between
valuation levels and interest rates.
l_5
t 6
L 7
l_8
17 Steven G. Einhorn, "The Perplexing Issue of Valuation:Analysts Journal (July-August 1990), pp. 11-16.
65
Will the Real Value Please Stand Up?" Financial

DIRECT TESNMOIIY OF J. MNDALL YOOLNDGECASE NO. 02- I 2 80-TP-UNC
I
z
The equity risk premiums of some of the other leading investnent firms today support the
result of the acadernic studies. An article inThe Economist indicated that some other firms
like J.P. Morgan are estimating an equity risk premium for an average risk stock in the 2.0
to 3.0 percent range above the interest rate on U.S. Treasury bonds.ls
3
4
5
6 Q75.
8 A75.
9
l_0
1 L
1.2 Q76.
13 476.
IIAVE CORPORATE CFOs ALSO RECOGNIZED THAT THE EQUITY RISK
PREMIUM IIAS DECLINED?
Yes. John Gratram and Campbell Harvey of Duke University survey CFOs to ascertain
their ex ante equity risk premium. In Graham and Harvey's 2003 survey, the average ex
ante lO-year equityrisk premium of the CFOs was 3.8%.le '
DOES THIS CONCLUDE YOUR TESTIMOIYY AT TIIIS TIME?
Yes it does.
t8 For example, see 'TVelcome to Bull Country," Ihe Economlst (July 18, 1998), pp.2l-3, and "Choosing the RightMixture," Ihe Economist (F ebrwry 27, 1999), pp. 7 l-2.
'eJoho R. Graham and Campbell Harvey, "Expectations of Equity Risk Premia, Volatility, and Asymmetry," DukeUniversity Working Paper, 2003.
66

DIRECT TESNMOM OF J. MNDALL WOOLNDGECASE NO.02-1280-TP-WC
QUALIFTCATIONS OF DR J. RANDALL WOOLRTDGE
EDUCATIONAL BACKGROT]ND, RESEARCH,AND RELATED BUSINESS EXPERIENCE
J. RANDALL WOOLRIDGE
J. Randall Woolridge is a Professor of Finance and the Goldman, Sachs & Co. and Frank P. Smeal EndowedFaculty Fellow in Business Adminisfation in the College of Business Administation of the Pennsylvania StateUniversity in University Parb PA. In additiorU Professor Woolridge is Director of the Smeal College Trading Room.He is also a Vice President of the Columbia Group, a public utility consulting firm based in Ridgefield, CT and serveson the Invesfinent Committee of ARIS Corporation, an asset management firm based in State College, PA.
Professor Woolridge received a Bachelor of Arts degree in Economics from the University of North Carolina,a Master of Business Adrninistration degree from the Pennsylvania State Univenity, and a Doctor of Philosophy degreein Business Administation (major area-finance, minor area-statistics) from the University of Iowa. At Iowa he receiveda Graduate Fellowship and was awarded membership in Beta Gamma Sigma, a national business honorary society. Hehas taught Finance courses at the University of Iowa, Comell College, and the University of Pittsburgh, as well as thePennsylvania State University. These courses include corporation finance, cornmercial and investnent banking, andinves0nents at the undergraduate, graduate, and executive MBA levels.
Professor Woohidge's research has centered on the theoretical and ernpirical foundations of corporationfinance and financial markets and institutions. He has published over 25 articles in the best academic and professionaljoumals in the field, including he Journal of Finance, the Journal of Financial Economics, and the Harvard BusinessReview. His research has been cited extensively in the business press. His work has been featured rn the New YorkTimes, Forbes, Fortune, The Economist, Financial World, Barron's, Wall Street Jourual, Business l{eek, WashingtonPost, Investors' Business Daily, Worth Magazine, USA Today, and other publications. In addition, Dr. Woolridge hasappeared as a guest on CNN's Money Line arrd CNBC's Morzing Call and Business Today.
The second edition of Professor Woolridge's popular stock valuation book, The Streetsmart Guide toValuing a Stock (McGraw-Hill, 2003), was recently released. He has also co-authored Spinoffs and Equity Carve-Outs: Achieving Faster Growth and Better Performance (Financial Executives Research Foundation, 1999) as wellas a new textbook entitled Modern Corporate Finance, Capital Markets, and Valuation (Kendall Hunt, 2003). Dr.Woolridge is a founder and a managing director of www.valuepro.net - a stock valuation website.
Professor Woolridge has also consulted with and prepared research reports for major corporations, financialinstitutions, and investnent banking fimn, and govemment agencies. trn addition, he has directed and participated inover 500 university- and company- sponsored professional development programs for executives in 25 countries inNorth and South Americ4 Europe, Asia, and Africa.
Dr. Woolridge has prepared testimony and/or provided consultation services in the following cases:
Pennsylvania: Dr. Woolridge has prepared testimony on behalf of the Pennsylvania Office of Consumer Advocate inthe following cases before the Pennsylvania Public Utility Commission:
Bell Telephone Company (R-811819), Peoples Nahual Gas Company (R-832315), Pennsylvania Power Company(R-832409), Westem Pennsylvania Water Company (R-832381), Pennsylvania Power Company (R-842740),Pennsylvania Gas and Water Company (R-850178), Metopolitan Edison Company (R-860384), Pennsylvania ElectricCompany (R-860413), North Penn Gas Company (R-860535), Philadelphia Electic Company (R-870629), WesternPennsylvania Water Company @-870825), York Water Company @-870749), Pennsylvania-American Water

DIRECT TESNMOIIY OF J. MNDALL TYOOLNDGECASE NO. 02. I 2 8O-TP.UNC
Company (R-880916), Equitable Gas Company (R-880971), the Bloomsburg Water Co. (R-891494), Columbia Gas ofPuruylvania, Inc. (R-891468), Pennsylvania-American W.ater Company (R-90562), Breezewood Telephone Company(R-901666), York Water Company (R-901813), Columbia Gas of Pennsylvania,Inc. (R-901873), National Fuel GasDistibution Company (R-911912), Pennsylvania-American Water Company (R-911909), Borough of Media WaterFund (R-912150), UGI Utilities, Inc. - Elecfric Utility Division (R-922195), Dauphin Consolidated Water SupplyCompany - General Waterworls of Pennsylvania, Inc, @-932604), National Fuel Gas Distribution Company (R-932548), Corrmonwealth Telephone Company (I-920020), Conestoga Telephone and Telegraph Corpany (I-920015),Peoples Natural Gas Company (R-932866), Blue Mountain Consolidated Water Company &-932873), National FuelGas Company (R-942991), UGI - Gas Division (R-953297), UGI - Electric Division (R-953534), Pennsylvania-American Water Company @-9739M), Pennsylvania-American Water Company (R-994638), Philadelphia SuburbanWater Company (R-994868;R-994877;R-994878; R-9948790), Philadelphia Suburban Water Company (R-994868),Wellsboro Elecfiic Company (R-00016356), Philadelphia Suburban Water Company (R-00016750), National Fuel GasDistibution Company (R-00038168), Pennsylvania-American Water Company (R-0003830a).
New Jersey: Dr. Woolridge prepared testimony for the New Jersey Deparhnent of the Public Advocate, Division ofRate Counset New Jersey-American Water Company (R-91081399J), New Jersey-American Water Company @-92090908J), and Environmental Disposal Corp @-940703 l9).
Eawaii: Dr. Woolridge prepared testimony for the Hawaii Office of the Consumer Advocate: East HonoluluCommunity Services, Inc. @ocket No.7718).
Delaware: Dr. Woolridge prepared testimony for the Delaware Division of Public Advocate: Artesian Water Company(R-00-64e).
New York Dr. Woolridge prepared testimony for the County of Nassau in New York State: lnng Island LightingCompany (PSC Case No. 942354).
Connecticut: Dr. Woolridge prepared testimony for the Office of Consurner Counsel in Connecticut: UnitedIlluminating @ocket No. 9 6-03-29).
Washington, D.C.: Dr. V/oolridge prepared testimony for the Ofiice of the People's Counsel in ttre Distict ofColumbia: Potomac Electric Power Company (Formal Case No. 939).
Washington: Dr. Woolridge consulted with trial staff of the Washington Utilities and Transportation Commissionon the following cases: Puget Energy Corp. (Docket Nos. UE-011570 and UG-011571); and Avista Corporation(Docket No. UE-01 l5l4).
Kansas: Dr. Woolridge prepared testimony on behalf of the Kansas Citizens' Utility Ratepayer Board Utilities in thefollowing case: Western Resources Inc. @ocketNo. 01-WSRE-949-GIE).
FERC: Dr. Woolridge has prepared testimony on behalf of the Pennsylvania Offioe of Consumer Advocate in thefollowing cases before the Federal Energy Regulatory Commission: National Fuel Gas Supply Corporation (RP-92-73-000) and Columbia Gulf Transmission Company (RP97-52-000).

DIRECT TESNMONY OF J. RANDALL WOOLNDGECASE NO. 02- I 280-TP-UNC
J. Randall Woolridge
Office Address609-R Business Administation Bldg.The Pennsylvania State UniversityUniversity Park, PA 16802814-865-l 160
Home Address120 Hayrnaker Circle
State College, PA 16801814-238-9428
Academic Experience
Professor of Finance, the Smeal College of Business Administation, the Pennsylvania State University (July 1, 1990 tothe present).
Director, the Smeal College Trading Room (January 1, 2001 to the present)Goldman, Sachs & Co. and Frank P. Smeal Endowed University Fellow in Business Administration (Julyl,1987 to the present).
Associate Professor of Finance, College of Business Administation, the Pennsylvania State University (July 1, 1984 toJune 30, 1990).
Director, the Blankman Strategic Decision-Making Program (March 1, 1985 to June 30, 1987).
Assistant Professor of Finance, College of Business AdminisfatiorU the Pennsylvania State University (September,1979 to June 30, 1984).
Education
Doctor of Philosophy in Business Administration, the University of Iowa @ecember, 1979). Major field: Finance.
Master of Business Administration, the Pennsylvania State University @ecember, 1975).
Bachelor of Arts, the University of North Carolina (May, 1973) Major field: Economics.
Books
James A. Miles and J. Randall Woolridge Spinofs and Equity Carte-Outs: Achieving Faster Growth and BetterPedormance (Financial Executives Research Foundation), 1999
Patrick Cusatis, Gary Gray, and J. Randall Woolridge, The StreetSmart Guide to Valuing a Stock (2nd Edition,McGraw-Hill), 2003.
J. Randall Woolridge and Gary Gray, The New Corporate Finance, Capilal Markets, and Vqluation: AnIntoductory lert (Kendall Hunt, 2003).