kentucky power company depreciation …psc.ky.gov/pscecf/2017-00179/[email protected] kentucky...
TRANSCRIPT
KENTUCKY POWER COMPANY
DEPRECIATION STUDY REPORT
OF
ELECTRIC PLANT IN SERVICE
AT
DECEMBER 31, 2013
KPSC Case No. 2017-00179 Commission Staff's Initial Set of Data Requests
Dated May 22, 2017 Item No. 57
Attachment 1 Page 1 of 24
DEPRECIATION STUDY REPORT
Table of Contents
SUBJECT PAGE
I. Introduction . . . . . . . . . . . . . . . . . . . . . . . . . . . 3
II. Discussion of Methods and Procedures Used In The Study . . . . . . . . . . . . . . . . . . . . . . . . . . . 5
III. Net Salvage . . . . . . . . . . . . . . . . . . . . . . . . . . . 13
IV. Calculation of Depreciation Requirement at December 31, 2013 . . . . . . . . . . . . . . . . . . . . . . . . . . . 16
V. Study Results . . . . . . . . . . . . . . . . . . . . . . . . . . . 16
SCHEDULE I – Explanation of Columns . . . . . . . . . . . . . . . . . . . . . . . . . . . 19
SCHEDULE I – Calculation of Depreciation Rates by the Remaining Life Method . . . . . . . . . . . . . . . . . . . . . . . . . . . 20
SCHEDULE II – Compare Depreciation Rates Using Current and Study Rates . . . . . . . . . . . . . . . . . . . . . . . . . . . 22
SCHEDULE III – Comparison of Mortality Characteristics . . . . . . . . . . . . . . . . . . . . . . . . . . . 24
KPSC Case No. 2017-00179 Commission Staff's Initial Set of Data Requests
Dated May 22, 2017 Item No. 57
Attachment 1 Page 2 of 24

I. INTRODUCTION
This report presents the results of a depreciation study of Kentucky Power
Company’s (KPCo) depreciable electric utility plant in service at December 31, 2013.
The study was prepared by David A. Davis, Manager – Property Accounting Policy and
Research at American Electric Power Service Corporation (AEPSC). The purpose of
the depreciation study was to develop appropriate annual depreciation accrual rates for
each of the primary plant accounts that comprise the functional groups for which KPCo
computes its annual depreciation expense.
The recommended depreciation rates are based on the Average Remaining Life
Method of computing depreciation. Further explanation of this method is contained in
Section II of this report.
The definition of depreciation used in my Study is the same as that used by the
Federal Energy Regulatory Commission (FERC) and the National Association of
Regulatory Utility Commissioners:
"Depreciation, as applied to depreciable electric plant, means the
loss in service value not restored by current maintenance, incurred in
connection with the consumption or prospective retirement of electric plant
in the course of service from causes which are known to be in current
operation and against which the utility is not protected by insurance.
Among the causes to be given consideration are wear and tear, decay,
action of the elements, inadequacy, obsolescence, changes in the art,
changes in demand and requirements of public authorities."
"Service value means the difference between original cost and the
KPSC Case No. 2017-00179 Commission Staff's Initial Set of Data Requests
Dated May 22, 2017 Item No. 57
Attachment 1 Page 3 of 24

net salvage value (net salvage value means the salvage value of the
property retired less the cost of removal) of the electric plant." (FERC
Accounting and Reporting Requirements for Public Utilities and Licensees,
¶15.001.)
Schedule I of this report shows the recommended depreciation accrual rates by
primary plant accounts and composited to functional plant classifications. Schedule II
compares depreciation expense using rates approved by the Commission and rates
recommended by the depreciation study. Schedule III shows a comparison of the
current mortality characteristics that were used to compute the recommended
depreciation rates and the mortality characteristics used to determine the existing
depreciation rates and accruals for Transmission, Distribution and General Plant
Functions. A comparison of KPCo’s current functional group composite depreciation
rates and accruals to recommended functional group rates and accruals based on
December 31, 2013 depreciable plant balances follows:
Table 1 - Depreciation Rates and Accruals
Based on Depreciable Plant In Service at December 31, 2013
Existing
Study
Functional Plant Group Rates Accruals
Rates Accruals Difference
Steam Production (1) 3.80% 54,851,796
3.36% 48,418,617 (6,433,179)
Transmission 1.71% 8,478,288
2.66% 13,169,805 4,691,517
Distribution 3.52% 24,312,736
4.48% 30,971,933 6,659,197
General 2.54% 858,462
4.42% 1,492,241 633,779
Total Depreciable Plant 3.32% 88,501,282
3.50% 94,052,596 5,551,314
Note: (1) Includes Big Sandy and Mitchell plants. The Company is not recommending a change in depreciation rates for Big Sandy Plant due to the planned retirement of Unit 2 in 2015 and the coal related portions of Unit 1 in 2016.
KPSC Case No. 2017-00179 Commission Staff's Initial Set of Data Requests
Dated May 22, 2017 Item No. 57
Attachment 1 Page 4 of 24

Based on Total Company Depreciable Plant In-Service as of December 31,
2013, I am recommending an increase in depreciation rates that result in an increase in
annual depreciation expense of $5,551,314. The depreciation rate changes are
necessary because of changes in average service lives and net salvage estimates used
to calculate KPCo’s recommended depreciation rates that takes into account the
December 31, 2013 transfer of a 50% undivided interest in the Mitchell generating
station from AEP affiliate Ohio Power Company as approved by the Kentucky Public
Service Commission (or Commission) in Case No. 2012-00578. KPCo’s current
approved depreciation rates with the exception of Mitchell Plant rates are based on a
1991 settlement agreement in Case No. 91-066 and were made effective on April 1,
1991. The Stipulation and Settlement Agreement in Case No. 2012-00578 ordered
Kentucky Power to use the current Ohio Power Company depreciation rates for Mitchell
Plant until such rates are changed in a base rate case.
II. DISCUSSION OF METHODS AND PROCEDURES USED IN THE STUDY
1. Group Method
All of the depreciable property included in this report was considered on a
group plan. Under the group plan, depreciation expense is accrued upon the
basis of the original cost of all property included in each depreciable plant
account. Upon retirement of any depreciable property, its full cost, less any net
salvage realized, is charged to the accrued depreciation reserve regardless of
the age of the particular item retired. Also, under this plan, the dollars in each
primary plant account are considered as a separate group for depreciation
accounting purposes and an annual depreciation rate for each account is
determined. The annual accruals by primary account were then summed, to
arrive at the total accrual for each functional group. The total accrual divided by
the original cost yields the functional group accrual rate.
KPSC Case No. 2017-00179 Commission Staff's Initial Set of Data Requests
Dated May 22, 2017 Item No. 57
Attachment 1 Page 5 of 24
2. Annual Depreciation Rates Using the Average Remaining Life Method
KPCo’s current depreciation rates are based on the Average Remaining
Life Method. The Average Remaining Life Method recovers the original cost of
the plant, adjusted for net salvage, less accumulated depreciation, over the
average remaining life of the plant. By this method, the annual depreciation rate
for each account is determined on the following basis: Annual Depreciation Expense =
(Orig. Cost) (Net Salvage Ratio) - Accumulated Depreciation Average Remaining Life
Annual Depreciation = Annual Depreciation Expense Rate Original Cost
3. Methods of Life Analysis
Depending upon the type of property and the nature of the data
available from the property accounting records, one of three life analyses
was used to arrive at the historically realized mortality characteristics and
service lives of the depreciable plant investments. These methods are
identified and described as follows:
Life Span Analysis
The life span analysis was employed for Mitchell Plant. The life-
span method of analysis is particularly suited to specific location property,
such as generating plants, where all of the surviving investments are likely
to be retired in total at a future date. The key elements in the life span
KPSC Case No. 2017-00179 Commission Staff's Initial Set of Data Requests
Dated May 22, 2017 Item No. 57
Attachment 1 Page 6 of 24
analysis are the age of the surviving investments, the projected retirement
date of the facility and the expected interim retirements. Interim
retirements are those retirements that are expected to occur between the
date of the depreciation study and the expected final retirement date of the
generating plant. Examples of interim retirements include fans, pumps,
motors, a set of boiler tubes, a turbine rotor, etc. The interim retirement
history for each primary production plant account was analyzed and the
results of those analyses were used to project future interim retirements.
The age of Mitchell Plant’s surviving investments at December 31, 2013
was obtained from the accounting records of affiliate Ohio Power
Company (OPCo). American Electric Power Service Corporation
(AEPSC) provided the retirement date used in the life-span analysis for
Mitchell Plant.
The Company is not recommending any revision to Big Sandy
Plant’s depreciation rates in this filing since Unit 2 is planned for
retirement at the end of May 2015 and the coal related portions of Unit 1
are planned for retirement in April 2016. KPCo expects to repower Big
Sandy Unit 1 to use natural gas in 2016.
The order in the Mitchell transfer Case No. 2012-00578 allows
Kentucky Power to recover the coal-related retirement costs of Big Sandy
Unit 1, the retirement costs of Big Sandy Unit 2 and other site related
retirement costs that will not continue in use. New depreciation rates will
be required for Big Sandy Unit 1 after it is repowered to use natural gas in
2016.
Steam Production Plant
At December 31st, 2013, KPCo’s depreciable investment in Steam
KPSC Case No. 2017-00179 Commission Staff's Initial Set of Data Requests
Dated May 22, 2017 Item No. 57
Attachment 1 Page 7 of 24
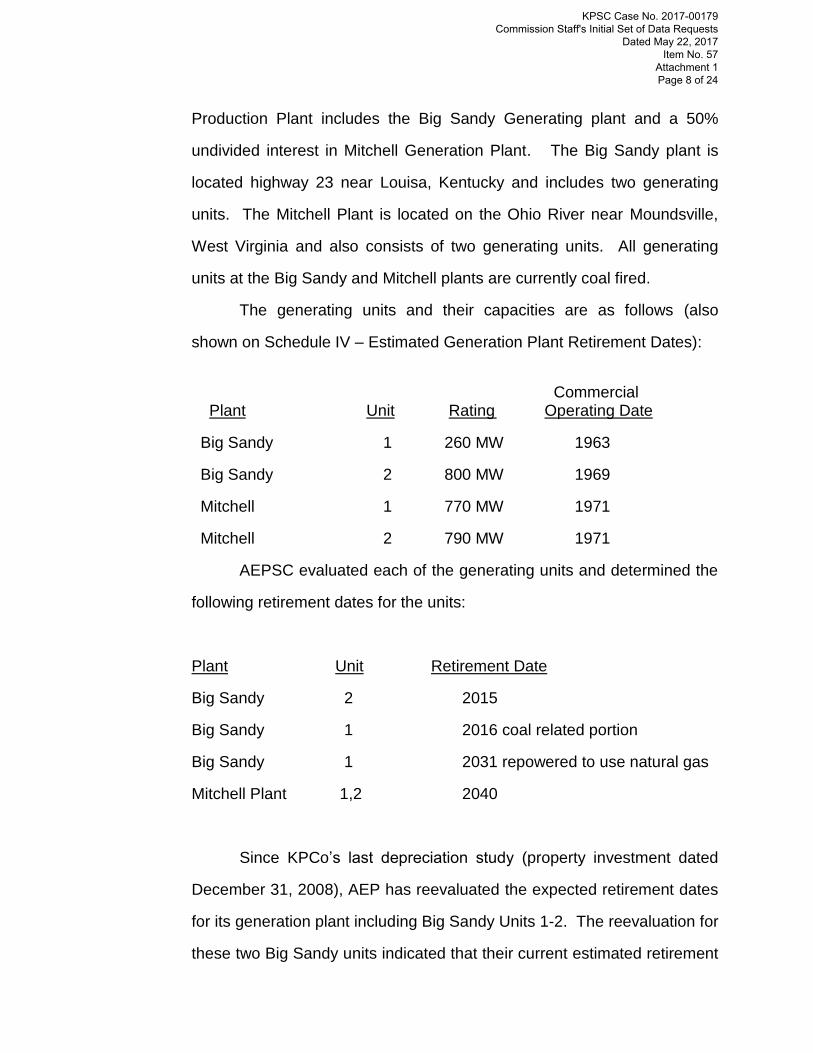
Production Plant includes the Big Sandy Generating plant and a 50%
undivided interest in Mitchell Generation Plant. The Big Sandy plant is
located highway 23 near Louisa, Kentucky and includes two generating
units. The Mitchell Plant is located on the Ohio River near Moundsville,
West Virginia and also consists of two generating units. All generating
units at the Big Sandy and Mitchell plants are currently coal fired.
The generating units and their capacities are as follows (also
shown on Schedule IV – Estimated Generation Plant Retirement Dates):
Commercial
Plant Unit Rating Operating Date
Big Sandy 1 260 MW 1963
Big Sandy 2 800 MW 1969
Mitchell 1 770 MW 1971
Mitchell 2 790 MW 1971
AEPSC evaluated each of the generating units and determined the
following retirement dates for the units:
Plant Unit Retirement Date
Big Sandy 2 2015
Big Sandy 1 2016 coal related portion
Big Sandy 1 2031 repowered to use natural gas
Mitchell Plant 1,2 2040
Since KPCo’s last depreciation study (property investment dated
December 31, 2008), AEP has reevaluated the expected retirement dates
for its generation plant including Big Sandy Units 1-2. The reevaluation for
these two Big Sandy units indicated that their current estimated retirement
KPSC Case No. 2017-00179 Commission Staff's Initial Set of Data Requests
Dated May 22, 2017 Item No. 57
Attachment 1 Page 8 of 24
dates should be 2015 for Big Sandy Unit 2, 2016 for the coal related
portion of Big Sandy Unit 1 and 2031 for Big Sandy Unit 1 after it is
repowered to use natural gas. AEP previously estimated individual unit
retirement dates of 2023 for Unit 1 and 2029 for Unit 2. According to AEP,
the earlier Big Sandy Unit 2 and the coal related portion of Unit 1
retirement dates are because it is not economically feasible to equip the
units with necessary environmental controls, not because they have
reached the end of their service lives.
Current plans are for the Mitchell Plant to operate for a total life of
69 years or until 2040.
Actuarial Analysis – Transmission, Distribution and General Plant
This method of analyzing past experience represents the
application to industrial property of statistical procedures developed in the
life insurance field for investigating human mortality. It is distinguished
from other methods of life estimation by the requirement that it is
necessary to know the age of the property at the time of its retirement and
the age of survivors, or plant remaining in service; that is, the installation
date must be known for each particular retirement and for each particular
survivor.
The application of this method involves the statistical procedure
known as the "annual rate method" of analysis. This procedure relates the
retirements during each age interval to the exposures at the beginning of
that interval, the ratio of these being the annual retirement ratio.
Subtracting each retirement ratio from unity yields a sequence of annual
survival ratios from which a survivor curve can be determined. This is
KPSC Case No. 2017-00179 Commission Staff's Initial Set of Data Requests
Dated May 22, 2017 Item No. 57
Attachment 1 Page 9 of 24
accomplished by the consecutive multiplication of the survivor ratios. The
length of this curve depends primarily upon the age of the oldest property.
Normally, if the period of years from the inception of the account to the
time of the study is short in relation to the expected maximum life of the
property, an incomplete or stub survivor curve results.
While there are a number of acceptable methods of smoothing and
extending this stub survivor curve in order to compute the area under it
from which the average life is determined, the well-known Iowa Type
Curve Method was used in this study.
By this procedure, instead of mathematically smoothing and
projecting the stub survivor curve to determine the average life of the
group, it was assumed that the stub curve would have the same mortality
characteristics as the type curve selected. The selection of the
appropriate type curve and average life is accomplished by plotting the
stub curve, superimposing on it Iowa curves of the various types and
average lives drawn to the same scale, and then determining which Iowa
type curve and average life best matches the stub.
The Actuarial Method of Life Analysis was used for the following
accounts:
352.0 Transmission Structures & Improvements
353.0 Transmission Station Equipment
361.0 Distribution Structures & Improvements
362.0 Distribution Station Equipment
390.0 General Structures & Improvements
KPSC Case No. 2017-00179 Commission Staff's Initial Set of Data Requests
Dated May 22, 2017 Item No. 57
Attachment 1 Page 10 of 24
The result of the actuarial analysis for the above accounts is
detailed in the depreciation study work papers.
Simulated Plant Record Analysis – Transmission and Distribution Plant
The “Simulated Plant Record” (SPR) method designates a class of
statistical techniques that provide an estimate of the age distribution,
mortality dispersion and average service life of property accounts whose
recorded history provides no indication of the age of the property units
when retired from service. For each such account, the available property
records usually reveal only the annual gross additions, annual retirements
and balances with no indication of the age of either plant retirements or
annual plant balances. For this study, the “Balances method” of analysis
was used.
The SPR Balances Method is a trial and error procedure that
attempts to duplicate the annual balance of a plant account by distributing
the actual annual gross additions over time according to an assumed
mortality distribution. Specifically, the dollars remaining in service at any
date are estimated by multiplying each year’s additions by the successive
proportion surviving at each age as given by the assumed survivor
characteristics. For a given year, the balance indicated is the
accumulation of survivors from all vintages and this is compared with the
actual book balance. This process is repeated for a different survivor
curves and average life combinations until a pattern is discovered which
produces a series of “simulated balances” most nearly equaling the actual
balances shown in a company’s books.
KPSC Case No. 2017-00179 Commission Staff's Initial Set of Data Requests
Dated May 22, 2017 Item No. 57
Attachment 1 Page 11 of 24
This determination is based on the distribution producing the
minimum sum of squared differences between the simulated balance and
the actual balances over a test period of years.
The iterative nature of the simulated methods makes them ideally
suited for computerized analysis. For each analysis of a given property
account, the computer program provides a single page summary
containing the results of each analysis indicating the “best fit” based on
criteria selected by the user.
The results of my analysis using the Balance Method is shown in
the depreciation study work papers. The analysis also shows the value of
the Index of Variation of the difference that is calculated according to the
the Balances Method where a lower value for the Index of Variation
indicates better agreement with the actual data.
The SPR Method of Life Analysis was utilized for the following accounts:
354.0 Transmission Towers & Fixtures
355.0 Transmission Poles & Fixtures
356.0 Transmission Overhead Conductor & Devices
364.0 Distribution Poles, Towers & Fixtures
365.0 Distribution OH Conductor & Devices
366.0 Distribution Underground Conduit
367.0 Distribution Underground Conductor & Devices
368.0 Distribution Line Transformers
369.0 Distribution Services
370.0 Distribution Meters
KPSC Case No. 2017-00179 Commission Staff's Initial Set of Data Requests
Dated May 22, 2017 Item No. 57
Attachment 1 Page 12 of 24
371.0 Installation on Customers Premises
373.0 Street Lighting & Signal Systems
Vintage Year Accounting – General Equipment
In 1998, the Company began using a vintage year accounting method for
general plant accounts 391 to 398 in accordance with Federal Energy Regulatory
Commission Accounting Release Number 15 (AR-15). This accounting method
requires the amortization of vintage groups of property over their useful lives.
AR-15 also requires that property be retired when it meets its average service
life.
As a result, my recommendation for these accounts is that the current
useful life approved by the Commission be retained and used to continue
amortization of the account balances.
4. Final Selection of Average Life and Curve Type
The final selection of average life and curve type for each depreciable
plant account analyzed by the Actuarial and SPR Methods was primarily based
on the results of the mortality analyses of past retirement history.
III. NET SALVAGE
1. Net Salvage - Steam Production Plant
The net salvage analysis for steam production plant included a review of
the plant’s experienced functional interim retirement, salvage and removal history
for the period 2001-2013. No interim retirements were estimated for Big Sandy
Plant in this depreciation study since Unit 2 is estimated to retire in 2015, the coal
KPSC Case No. 2017-00179 Commission Staff's Initial Set of Data Requests
Dated May 22, 2017 Item No. 57
Attachment 1 Page 13 of 24
related portions of Unit 1 are estimated to retire in 2016 and the repowered Unit 1
(to use natural gas) is expected to retire in 2031.
While a standard type of analysis was used by the depreciation study to
determine the net salvage characteristics applicable to interim retirements for the
plants, the most significant net salvage amounts for generating plants occurs at
the end of their life. Therefore, to assist in establishing total net salvage
applicable to Big Sandy and Mitchell plants, the Company contracted with
Sargent & Lundy (S&L) to prepare conceptual demolition cost estimates. The
S&L cost estimates to demolish the plants are based on current (2013) price
levels which were inflated to retirement dates in the depreciation study. These
estimates were incorporated into the calculation of a net salvage ratio for Steam
Production Plant. S&L’s demolition costs do not include Asset Retirement
Obligation (ARO) amounts associated with the removal of asbestos or any cost
associated with the final disposition of Big Sandy or Mitchell Plant landfills and
ash ponds. The costs to remove asbestos and cover ash ponds are included
separately in the cost of service through the accounting for asset retirement
obligations.
2. Net Salvage – Transmission, Distribution and General Plant
The net salvage percentages used in this report for Transmission,
Distribution and General Plant are expressed as percent of original cost and are
based on the Company’s experience combined with the judgment of the analyst.
KPCo maintains salvage and removal costs in its depreciation ledger at the
functional plant level, rather than by primary plant accounts. To determine gross
salvage, gross removal and net salvage percentages for individual plant
accounts, original cost retirements, salvage and removal were taken from the
Company’s account history in its PowerPlant software which detailed these
KPSC Case No. 2017-00179 Commission Staff's Initial Set of Data Requests
Dated May 22, 2017 Item No. 57
Attachment 1 Page 14 of 24
amounts by account for the period 2000 to 2013. Gross salvage and cost of
removal percentages were calculated using the data from this fourteen year time
period for each account. The salvage and removal percentages for each account
were then netted to determine a net salvage percentage for each account.
The net salvage percents were converted to net salvage ratios (1 minus
the net salvage percentage) and appear in Column IV on Schedule I and were
used to determine the total amount to be recovered through depreciation. The
same net salvage was also reflected in the determination of the calculated
depreciation requirement, which was used to allocate accumulated depreciation
at the functional group to the accounts comprising each group.
5. Net Salvage – Ratios
The net salvage ratios shown on Schedule I of this report may be
explained as follows:
a. Where the ratio is shown as unity (1.00), it was assumed that the net
salvage in that particular account would be zero.
b. Where the ratio is less than unity, it was assumed that the salvage
exceeded the removal costs. For example, if the net salvage were 20%,
the net salvage ratio would be expressed as .80.
c. Where the ratio is greater than unity, it was assumed that the salvage was
less than the cost of removal. For example, if the net salvage were minus
5%, the net salvage ratio would be expressed as 1.05.
KPSC Case No. 2017-00179 Commission Staff's Initial Set of Data Requests
Dated May 22, 2017 Item No. 57
Attachment 1 Page 15 of 24
IV. CALCULATION OF DEPRECIATION REQUIREMENT AT
DECEMBER 31, 2013
The accumulated depreciation by functional group was allocated to
individual plant accounts based on the calculation of a depreciation requirement
(theoretical reserve) for each plant account using the average service life, curve
type and net salvage amount recommended in this study.
V. STUDY RESULTS
Production, Transmission, Distribution and General plant results are
discussed below. In addition, Transmission, Distribution and General Plant
average service life, retirement dispersion pattern and net salvage percentages
used to calculate each primary plant account depreciation rate are shown on
Schedule III where the mortality characteristics and net salvage values for the
current rates are also shown. The changes to the mortality characteristics follow
trends shown by historical retirement experience. Gross salvage and gross cost
of removal percentages were largely based on the history of each account for the
period 2000-2013.
Steam Production Plant
Depreciation rates for Mitchell Plant were calculated by plant account with
the expectation that the total cost including net salvage would be recovered by
2040 which is the estimated retirement date for Mitchell Plant. New depreciation
rates for Big Sandy Plant were not recommended by the depreciation study. The
comparison of steam production depreciation accruals on Schedule II using the
currently approved depreciation rates and the study depreciation rates includes
KPSC Case No. 2017-00179 Commission Staff's Initial Set of Data Requests
Dated May 22, 2017 Item No. 57
Attachment 1 Page 16 of 24
Mitchell Plant. The original cost and accumulated depreciation amounts used for
Mitchell Plant are 50% of the plant’s original cost and accumulated depreciation
on KPCo’s books at December 31, 2013.
The decrease in steam production depreciation expense due to a change
in depreciation rates was primarily due to the longer life estimate for Mitchell
Plant in this proceeding (2040 retirement date) versus a previously estimated
2031 retirement date. The depreciation study doesn’t recommend any changes
to the Big Sandy Plant’s depreciation rates.
Terminal demolition costs are included in the steam production
depreciation rates. The estimates of demolition costs were developed by
Sargent & Lundy. S&L estimated demolition cost in 2013 dollars for Big Sandy
Plant and Mitchell Plant (KPCo’s 50% share) was $28,831,786 and $21,185,697,
respectively.
Transmission Plant
The depreciation rates for Transmission plant increased from 1.71% to
2.66% due to increases in the net salvage ratio for five accounts (accounts 352,
353, 354, 355 and 356) and decreases in the average service life for two
accounts (accounts 354, and 355). The increase was partially offset by an
increase in the average service life for account 352.
Distribution Plant
The depreciation rates for Distribution plant increased from 3.52% to
4.48% due to increases in the net salvage ratio for nine accounts (accounts 361,
362, 364, 365, 367, 368, 369, 371 and 373) and a decrease in the average
service life for one account (account 370). The increase was partially offset by a
decrease in the net salvage ratio for account 370 and by increases in the
KPSC Case No. 2017-00179 Commission Staff's Initial Set of Data Requests
Dated May 22, 2017 Item No. 57
Attachment 1 Page 17 of 24
average service life for five accounts (accounts 361, 362, 366, 369 and 373).
General Plant
The depreciation rates for General plant increased from 2.54% to 4.42%
due to increases in the net salvage ratio for three accounts (accounts 391, 394
and 398) and a reduction in the average service life for account 390. The
increase was partially offset by a decrease in the net salvage ratio for account
397.
KPSC Case No. 2017-00179 Commission Staff's Initial Set of Data Requests
Dated May 22, 2017 Item No. 57
Attachment 1 Page 18 of 24

SCHEDULE I – EXPLANATION OF COLUMN HEADINGS
Schedule I shows the determination of the recommended annual depreciation
accrual rate by primary plant accounts by the straight line remaining life method. An
explanation of the schedule follows:
Column I - Account number.
Column II - Account title.
Column III - Original Cost at December 31, 2013
Column IV - Net Salvage Ratio.
Column V - Total to be Recovered (Column III) * (Column IV).
Column VI - Calculated Depreciation Requirement.
Column VII - Allocated Accumulated Depreciation – accumulated depreciation
(book reserve) spread to each account on the basis of the
Calculated Depreciation Requirement shown in Column VI.
Column VIII - Remaining to be Recovered (Column V - Column VII).
Column IX - Average Remaining Life.
Column X - Recommended Annual Accrual Amount.
Column XI - Recommended Annual Accrual Percent or Depreciation Rate
(Column X/Column III).
KPSC Case No. 2017-00179 Commission Staff's Initial Set of Data Requests
Dated May 22, 2017 Item No. 57
Attachment 1 Page 19 of 24

Acct.
No.Account Title Original Cost
Net
Salvg.
Ratio
Total to be
Recovered
Calculated
Depreciation
Requirement
Accumulated
Depreciation
Remaining to Be
Recovered
Avg.
Remain
Life
Amount Percent
(I) (II) (III) (IV) (V) (VI) (VII) (VIII) (IX) (X) (XI)
STEAM PRODUCTION PLANT
Big Sandy Plant (1)
311 Structures & Improvements 43,291,665 (1) (1) (1) 30,726,379 (1) (1) 1,636,425 3.78%
312 Boiler Plant Equipment 362,456,070 (1) (1) (1) 177,325,748 (1) (1) 13,700,839 3.78%
312 Boiler Plant Equip SCR Catalyst (2) 8,147,622 (1) (1) (1) 5,742,300 (1) (1) 389,456 4.78%
314 Turbogenerator Units 109,522,949 (1) (1) (1) 61,149,688 (1) (1) 4,139,967 3.78%
315 Accessory Electrical Equip. 16,513,202 (1) (1) (1) 12,896,303 (1) (1) 624,199 3.78%
316 Misc. Power Plant Equip. 8,709,178 (1) (1) (1) 5,351,493 (1) (1) 329,207 3.78%
Total 548,640,686 293,191,911 20,820,093 3.79%
Mitchell Plant (3)
311 Structures & Improvements 42,000,197 1.07 44,940,211 18,282,178 16,183,402 28,756,809 25.01 1,149,812 2.74%
312 Boiler Plant Equipment 765,644,984 1.07 819,240,133 245,324,500 238,518,432 580,721,701 24.25 23,947,287 3.13%
312 Boiler Plant Equip SCR Catalyst (2) 8,190,115 1.00 8,190,115 4,023,394 2,378,493 5,811,622 4.07 1,023,764 12.50%
314 Turbogenerator Units 53,295,697 1.07 57,026,396 29,106,660 33,613,523 23,412,873 23.84 982,084 1.84%
315 Accessory Electrical Equip. 17,080,672 1.07 18,276,319 9,466,086 11,043,285 7,233,034 25.81 280,242 1.64%
316 Misc. Power Plant Equip. 7,693,412 1.07 8,231,951 3,289,590 3,072,520 5,159,431 23.96 215,335 2.80%
Total 893,905,077 1.07 955,905,125 309,492,408 304,809,655 651,095,470 23.59 27,598,524 3.09%
Total Steam Prod. Plant 1,442,545,763 0.66 955,905,125 309,492,408 598,001,566 651,095,470 13.45 48,418,617 3.36%
TRANSMISSION PLANT
350.1 Land Rights 26,456,147 1.00 26,456,147 8,498,622 7,016,166 19,439,981 50.91 381,850 1.44%
352 Structures & Improvements 6,636,668 1.10 7,300,335 3,172,075 2,618,754 4,681,581 33.93 137,978 2.08%
353 Station Equipment 170,843,671 1.03 175,968,981 34,476,675 28,462,741 147,506,240 40.20 3,669,309 2.15%
354 Towers & Fixtures 94,517,543 1.10 103,969,297 56,679,229 46,792,396 57,176,901 23.20 2,464,522 2.61%
355 Poles & Fixtures 74,696,720 1.61 120,261,719 28,658,583 23,659,527 96,602,192 32.75 2,949,685 3.95%
356 OH Conductor & Devices 122,537,908 1.27 155,623,143 70,585,347 58,272,803 97,350,340 27.32 3,563,336 2.91%
357 Undergrnd Conduit 11,590 1.00 11,590 4,345 3,587 8,003 23.13 346 2.99%
358 Undergrnd Conductor 106,066 1.00 106,066 49,568 40,922 65,144 23.44 2,779 2.62%
Total Transmission Plant 495,806,313 1.19 589,697,279 202,124,444 166,866,896 422,830,383 32.11 13,169,805 2.66%
DISTRIBUTION PLANT
360.1 Land Rights 5,343,520 1.00 5,343,520 1,411,791 1,371,633 3,971,887 55.18 71,981 1.35%
361 Structures & Improvements 4,372,006 1.12 4,896,647 1,354,850 1,316,312 3,580,335 50.63 70,716 1.62%
362 Station Equipment 83,664,562 1.07 89,521,081 18,549,279 18,021,648 71,499,433 26.16 2,733,159 3.27%
364 Poles, Towers, & Fixtures 180,551,331 1.30 234,716,730 68,606,654 66,655,150 168,061,580 19.82 8,479,394 4.70%
365 OH Conductor & Devices 179,538,721 0.94 168,766,398 33,083,601 32,142,543 136,623,855 20.90 6,537,027 3.64%
366 Underground Conduit 6,377,091 1.00 6,377,091 1,464,955 1,423,285 4,953,806 34.66 142,926 2.24%
367 Underground Conductor 9,812,956 1.13 11,088,640 1,655,544 1,608,452 9,480,188 37.43 253,278 2.58%
368 Line Transformers 119,012,919 1.01 120,203,048 28,150,578 27,349,840 92,853,208 19.15 4,848,731 4.07%
369 Services 53,900,363 1.38 74,382,501 17,054,558 16,569,444 57,813,057 15.41 3,751,658 6.96%
370 Meters 24,723,287 0.97 23,981,588 10,273,269 9,981,048 14,000,540 9.72 1,440,385 5.83%
371 Installations on Custs. Prem. 20,056,550 1.32 26,474,646 7,344,863 7,135,939 19,338,707 7.95 2,432,542 12.13%
373 Street Lighting & Signal Sys. 3,349,341 1.24 4,153,183 1,231,600 1,196,567 2,956,616 14.07 210,136 6.27%
Total Distribution Plant 690,702,647 1.11 769,905,074 190,181,542 184,771,861 585,133,213 18.89 30,971,931 4.48%
KENTUCKY POWER COMPANY
SCHEDULE I - CALCULATION OF DEPRECIATION RATES BY THE REMAINNG LIFE METHOD
BASED ON PLANT IN SERVICE AT DECEMBER 31, 2013
AVERAGE LIFE GROUP (ALG) METHOD ACCRUAL RATES
Annual Accrual
KPSC Case No. 2017-00179 Commission Staff's Initial Set of Data Requests
Dated May 22, 2017 Item No. 57
Attachment 1 Page 20 of 24
Acct.
No.Account Title Original Cost
Net
Salvg.
Ratio
Total to be
Recovered
Calculated
Depreciation
Requirement
Accumulated
Depreciation
Remaining to Be
Recovered
Avg.
Remain
Life
Amount Percent
(I) (II) (III) (IV) (V) (VI) (VII) (VIII) (IX) (X) (XI)
KENTUCKY POWER COMPANY
SCHEDULE I - CALCULATION OF DEPRECIATION RATES BY THE REMAINNG LIFE METHOD
BASED ON PLANT IN SERVICE AT DECEMBER 31, 2013
AVERAGE LIFE GROUP (ALG) METHOD ACCRUAL RATES
Annual Accrual
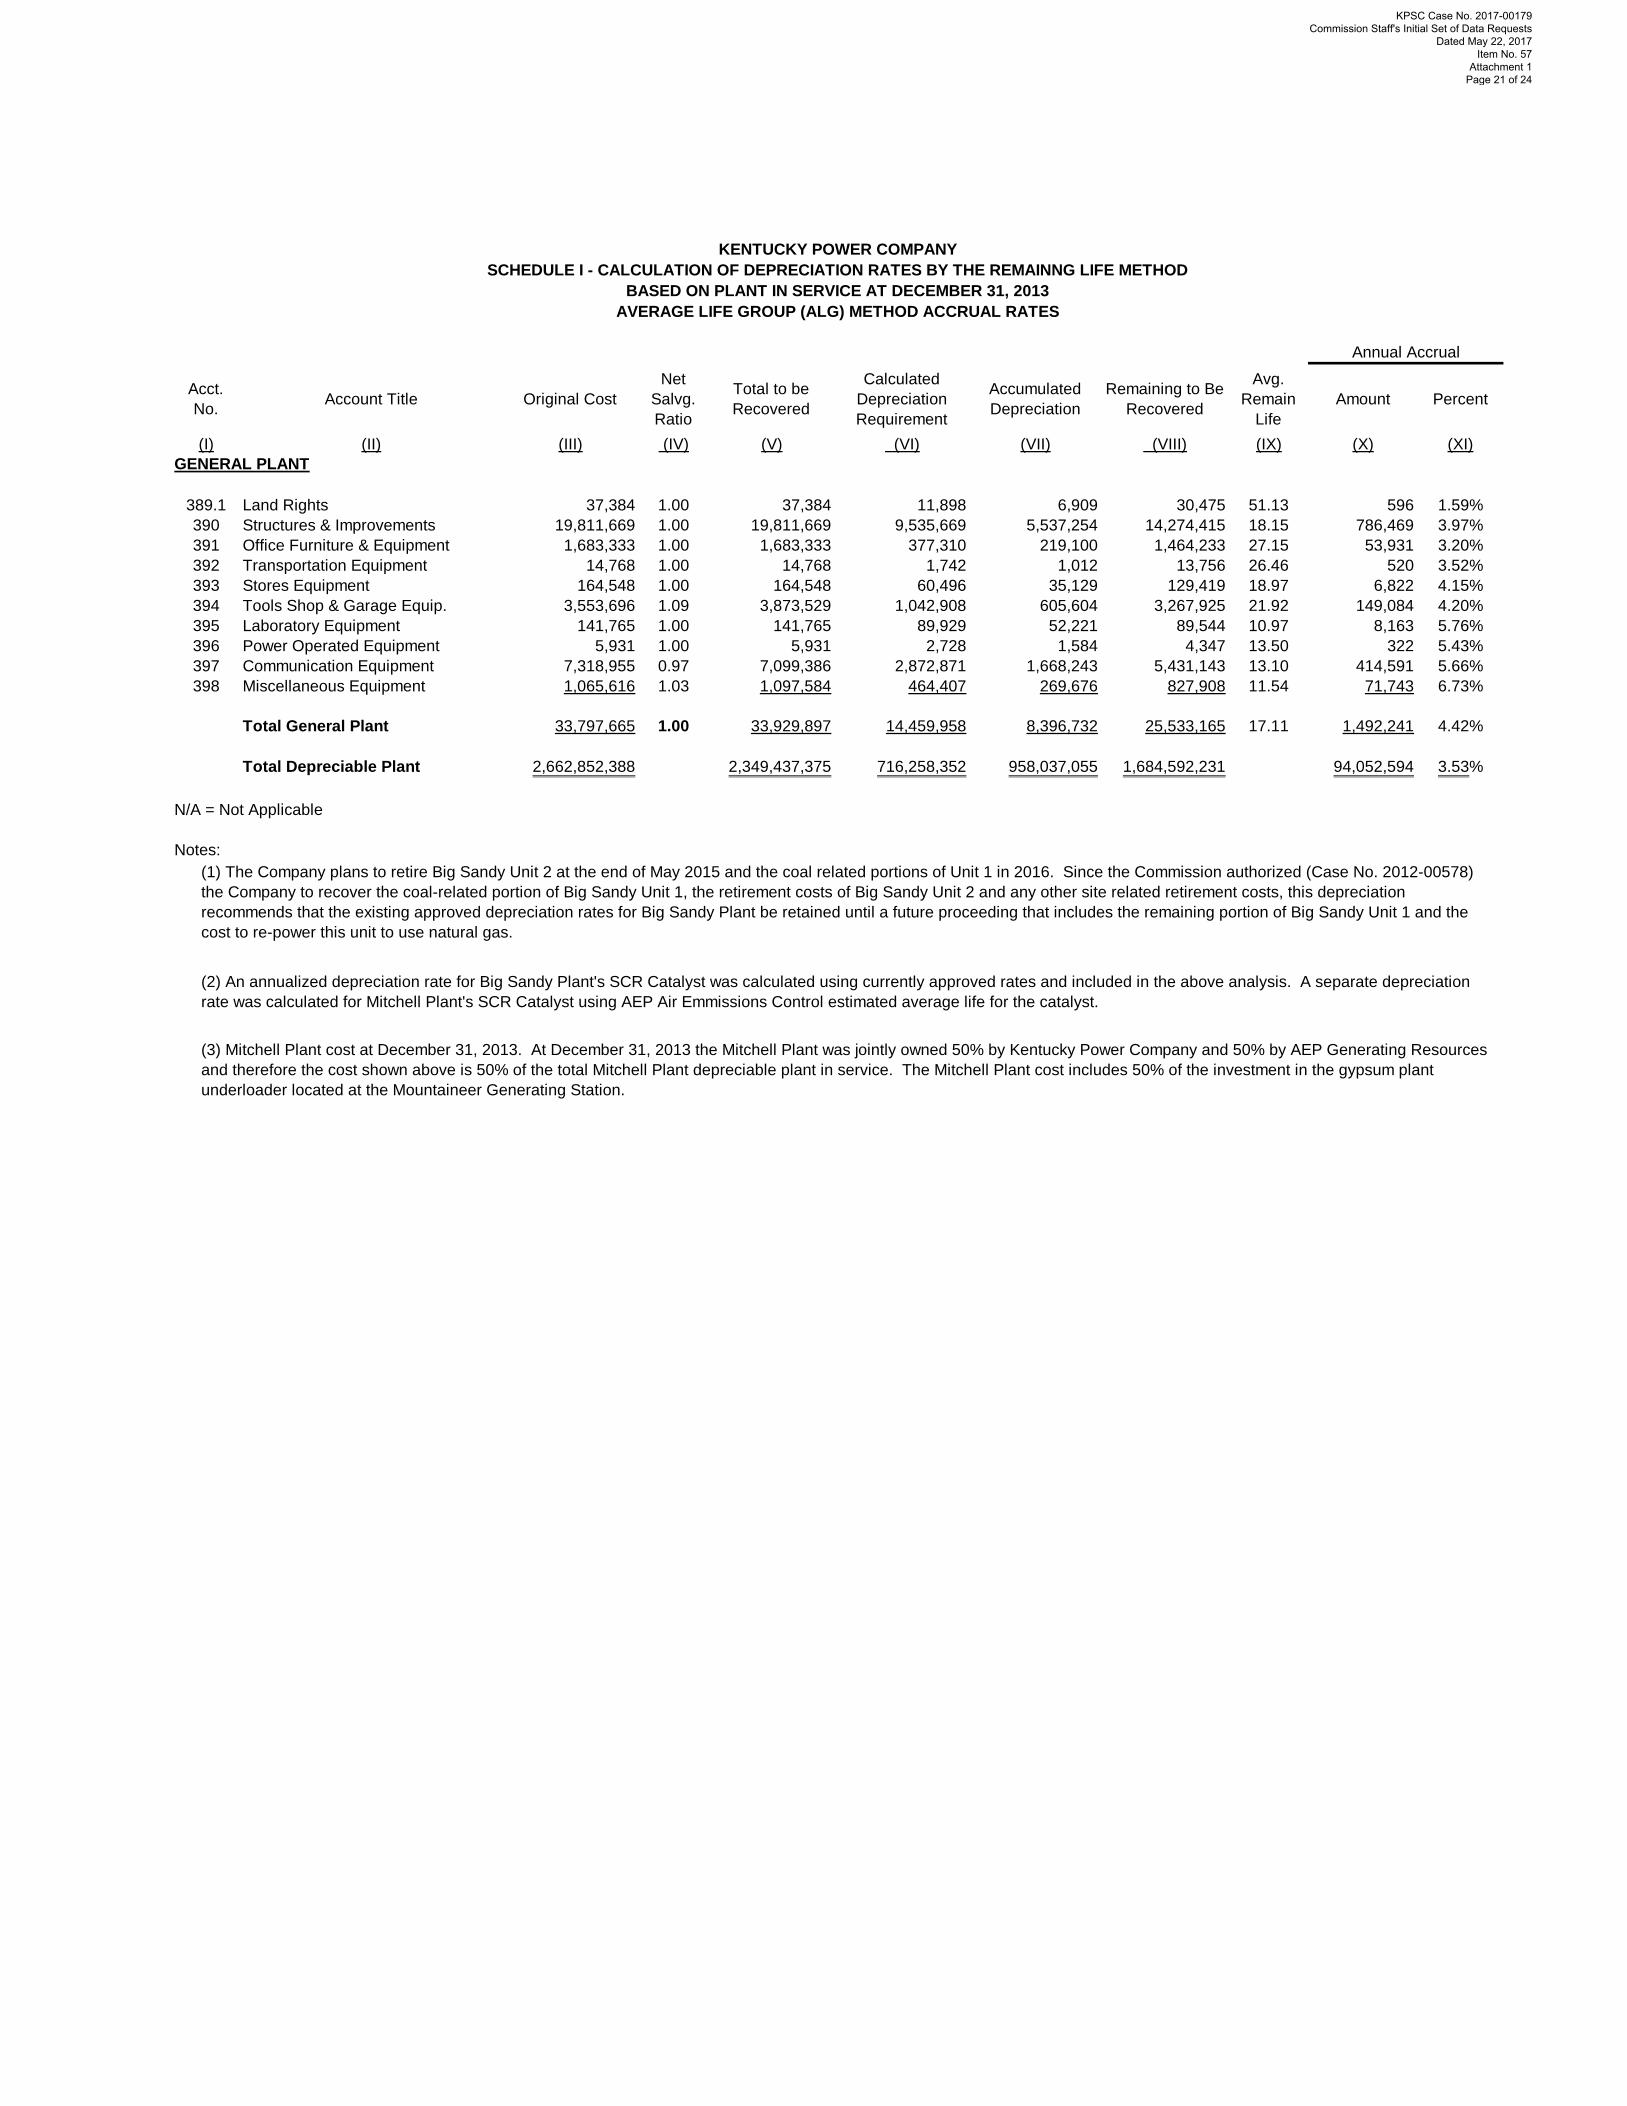
GENERAL PLANT
389.1 Land Rights 37,384 1.00 37,384 11,898 6,909 30,475 51.13 596 1.59%
390 Structures & Improvements 19,811,669 1.00 19,811,669 9,535,669 5,537,254 14,274,415 18.15 786,469 3.97%
391 Office Furniture & Equipment 1,683,333 1.00 1,683,333 377,310 219,100 1,464,233 27.15 53,931 3.20%
392 Transportation Equipment 14,768 1.00 14,768 1,742 1,012 13,756 26.46 520 3.52%
393 Stores Equipment 164,548 1.00 164,548 60,496 35,129 129,419 18.97 6,822 4.15%
394 Tools Shop & Garage Equip. 3,553,696 1.09 3,873,529 1,042,908 605,604 3,267,925 21.92 149,084 4.20%
395 Laboratory Equipment 141,765 1.00 141,765 89,929 52,221 89,544 10.97 8,163 5.76%
396 Power Operated Equipment 5,931 1.00 5,931 2,728 1,584 4,347 13.50 322 5.43%
397 Communication Equipment 7,318,955 0.97 7,099,386 2,872,871 1,668,243 5,431,143 13.10 414,591 5.66%
398 Miscellaneous Equipment 1,065,616 1.03 1,097,584 464,407 269,676 827,908 11.54 71,743 6.73%
Total General Plant 33,797,665 1.00 33,929,897 14,459,958 8,396,732 25,533,165 17.11 1,492,241 4.42%
Total Depreciable Plant 2,662,852,388 2,349,437,375 716,258,352 958,037,055 1,684,592,231 94,052,594 3.53%
N/A = Not Applicable
Notes:
(3) Mitchell Plant cost at December 31, 2013. At December 31, 2013 the Mitchell Plant was jointly owned 50% by Kentucky Power Company and 50% by AEP Generating Resources
and therefore the cost shown above is 50% of the total Mitchell Plant depreciable plant in service. The Mitchell Plant cost includes 50% of the investment in the gypsum plant
underloader located at the Mountaineer Generating Station.
(2) An annualized depreciation rate for Big Sandy Plant's SCR Catalyst was calculated using currently approved rates and included in the above analysis. A separate depreciation
rate was calculated for Mitchell Plant's SCR Catalyst using AEP Air Emmissions Control estimated average life for the catalyst.
(1) The Company plans to retire Big Sandy Unit 2 at the end of May 2015 and the coal related portions of Unit 1 in 2016. Since the Commission authorized (Case No. 2012-00578)
the Company to recover the coal-related portion of Big Sandy Unit 1, the retirement costs of Big Sandy Unit 2 and any other site related retirement costs, this depreciation
recommends that the existing approved depreciation rates for Big Sandy Plant be retained until a future proceeding that includes the remaining portion of Big Sandy Unit 1 and the
cost to re-power this unit to use natural gas.
KPSC Case No. 2017-00179 Commission Staff's Initial Set of Data Requests
Dated May 22, 2017 Item No. 57
Attachment 1 Page 21 of 24
ACCT.
NO. ACCOUNT TITLE
ORIGINAL
COST
CURRENT
APPROVED
RATE
ANNUAL
ACCRUAL
STUDY
RATE
STUDY
ACCRUAL
DIFFERENCE
(DECREASE)
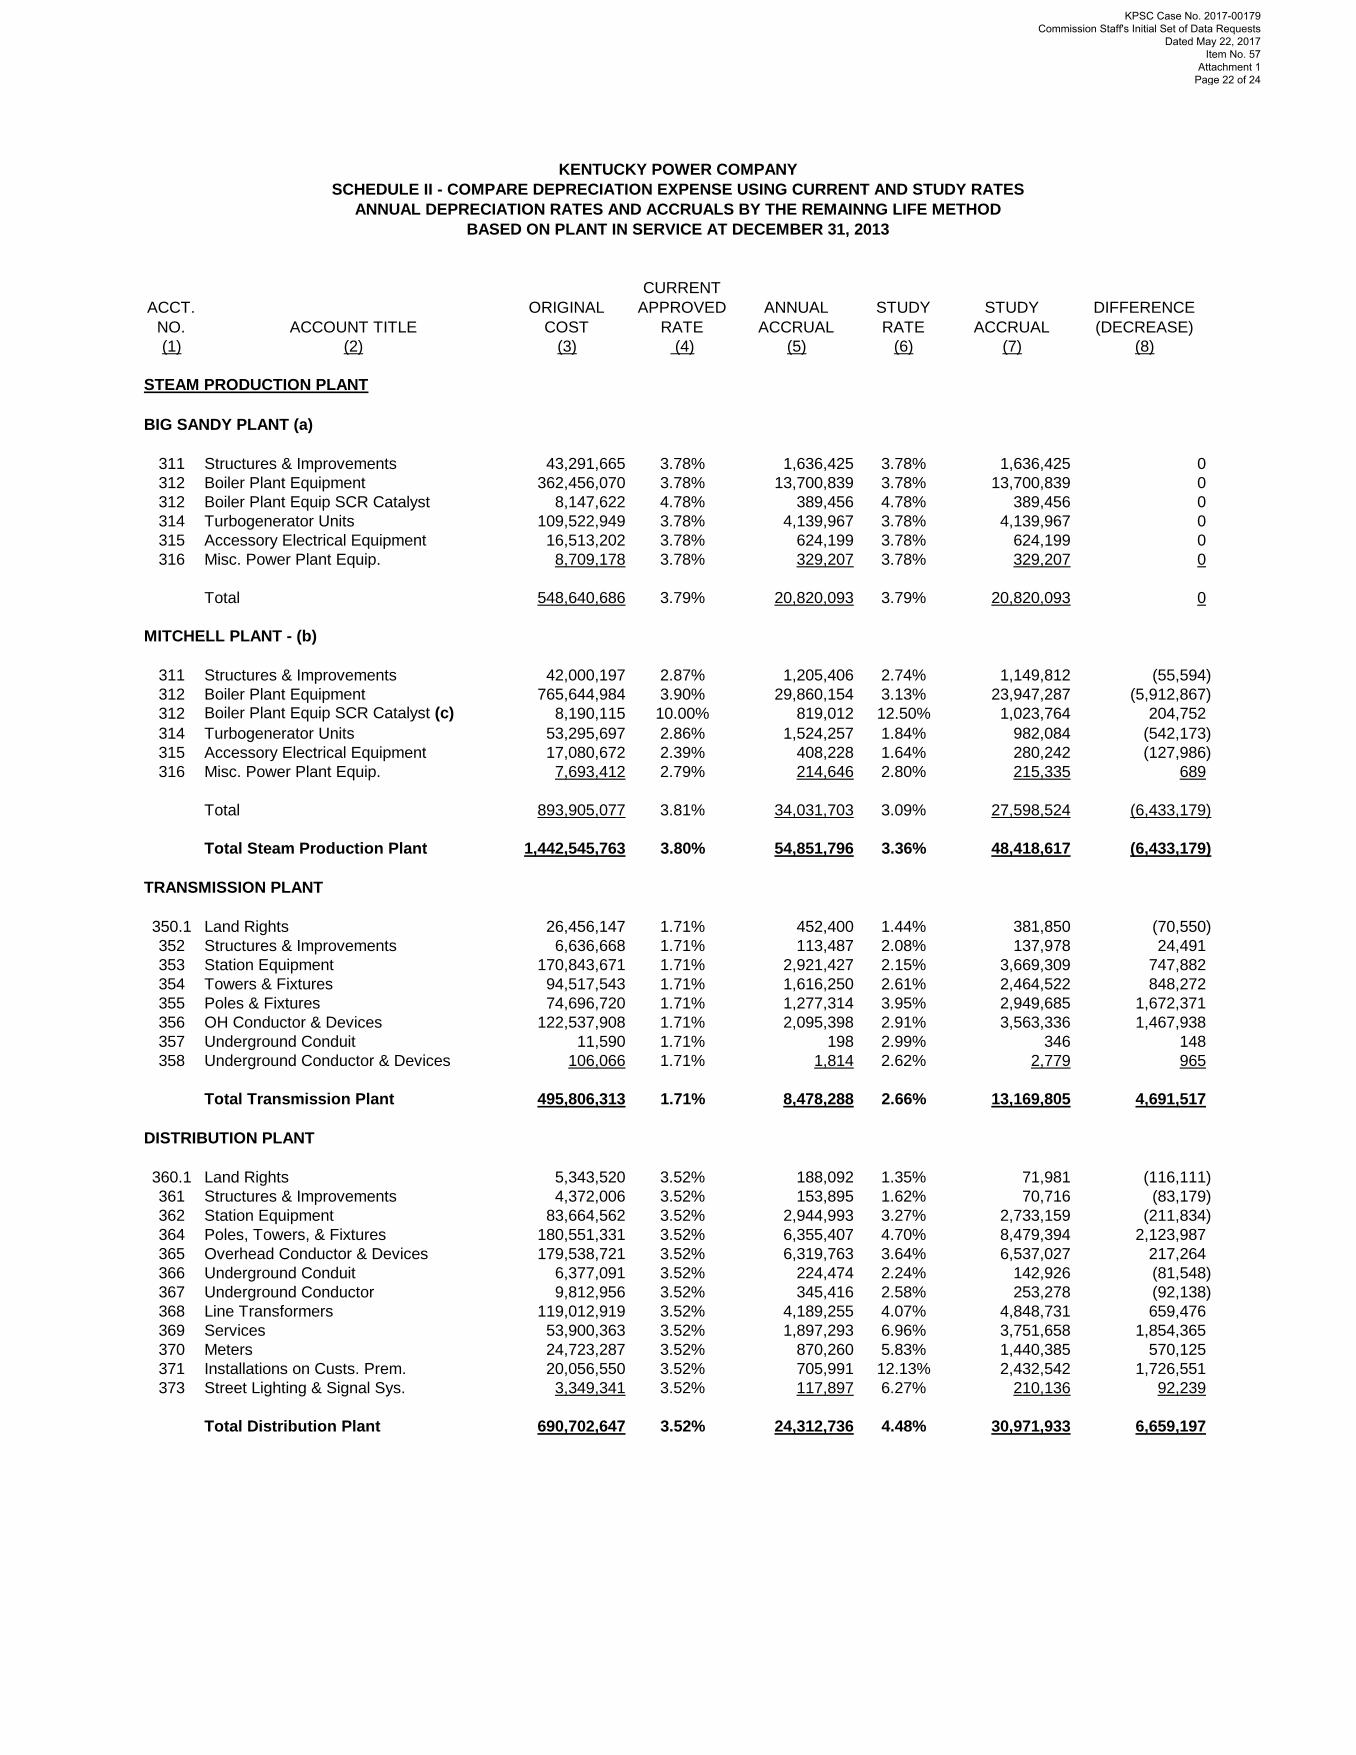
(1) (2) (3) (4) (5) (6) (7) (8)
STEAM PRODUCTION PLANT
BIG SANDY PLANT (a)
311 Structures & Improvements 43,291,665 3.78% 1,636,425 3.78% 1,636,425 0
312 Boiler Plant Equipment 362,456,070 3.78% 13,700,839 3.78% 13,700,839 0
312 Boiler Plant Equip SCR Catalyst 8,147,622 4.78% 389,456 4.78% 389,456 0
314 Turbogenerator Units 109,522,949 3.78% 4,139,967 3.78% 4,139,967 0
315 Accessory Electrical Equipment 16,513,202 3.78% 624,199 3.78% 624,199 0
316 Misc. Power Plant Equip. 8,709,178 3.78% 329,207 3.78% 329,207 0
Total 548,640,686 3.79% 20,820,093 3.79% 20,820,093 0
MITCHELL PLANT - (b)
311 Structures & Improvements 42,000,197 2.87% 1,205,406 2.74% 1,149,812 (55,594)
312 Boiler Plant Equipment 765,644,984 3.90% 29,860,154 3.13% 23,947,287 (5,912,867)
312 Boiler Plant Equip SCR Catalyst (c) 8,190,115 10.00% 819,012 12.50% 1,023,764 204,752
314 Turbogenerator Units 53,295,697 2.86% 1,524,257 1.84% 982,084 (542,173)
315 Accessory Electrical Equipment 17,080,672 2.39% 408,228 1.64% 280,242 (127,986)
316 Misc. Power Plant Equip. 7,693,412 2.79% 214,646 2.80% 215,335 689
Total 893,905,077 3.81% 34,031,703 3.09% 27,598,524 (6,433,179)
Total Steam Production Plant 1,442,545,763 3.80% 54,851,796 3.36% 48,418,617 (6,433,179)
TRANSMISSION PLANT
350.1 Land Rights 26,456,147 1.71% 452,400 1.44% 381,850 (70,550)
352 Structures & Improvements 6,636,668 1.71% 113,487 2.08% 137,978 24,491
353 Station Equipment 170,843,671 1.71% 2,921,427 2.15% 3,669,309 747,882
354 Towers & Fixtures 94,517,543 1.71% 1,616,250 2.61% 2,464,522 848,272
355 Poles & Fixtures 74,696,720 1.71% 1,277,314 3.95% 2,949,685 1,672,371
356 OH Conductor & Devices 122,537,908 1.71% 2,095,398 2.91% 3,563,336 1,467,938
357 Underground Conduit 11,590 1.71% 198 2.99% 346 148
358 Underground Conductor & Devices 106,066 1.71% 1,814 2.62% 2,779 965
Total Transmission Plant 495,806,313 1.71% 8,478,288 2.66% 13,169,805 4,691,517
DISTRIBUTION PLANT
360.1 Land Rights 5,343,520 3.52% 188,092 1.35% 71,981 (116,111)
361 Structures & Improvements 4,372,006 3.52% 153,895 1.62% 70,716 (83,179)
362 Station Equipment 83,664,562 3.52% 2,944,993 3.27% 2,733,159 (211,834)
364 Poles, Towers, & Fixtures 180,551,331 3.52% 6,355,407 4.70% 8,479,394 2,123,987
365 Overhead Conductor & Devices 179,538,721 3.52% 6,319,763 3.64% 6,537,027 217,264
366 Underground Conduit 6,377,091 3.52% 224,474 2.24% 142,926 (81,548)
367 Underground Conductor 9,812,956 3.52% 345,416 2.58% 253,278 (92,138)
368 Line Transformers 119,012,919 3.52% 4,189,255 4.07% 4,848,731 659,476
369 Services 53,900,363 3.52% 1,897,293 6.96% 3,751,658 1,854,365
370 Meters 24,723,287 3.52% 870,260 5.83% 1,440,385 570,125
371 Installations on Custs. Prem. 20,056,550 3.52% 705,991 12.13% 2,432,542 1,726,551
373 Street Lighting & Signal Sys. 3,349,341 3.52% 117,897 6.27% 210,136 92,239
Total Distribution Plant 690,702,647 3.52% 24,312,736 4.48% 30,971,933 6,659,197
KENTUCKY POWER COMPANY
ANNUAL DEPRECIATION RATES AND ACCRUALS BY THE REMAINNG LIFE METHOD
SCHEDULE II - COMPARE DEPRECIATION EXPENSE USING CURRENT AND STUDY RATES
BASED ON PLANT IN SERVICE AT DECEMBER 31, 2013
KPSC Case No. 2017-00179 Commission Staff's Initial Set of Data Requests
Dated May 22, 2017 Item No. 57
Attachment 1 Page 22 of 24
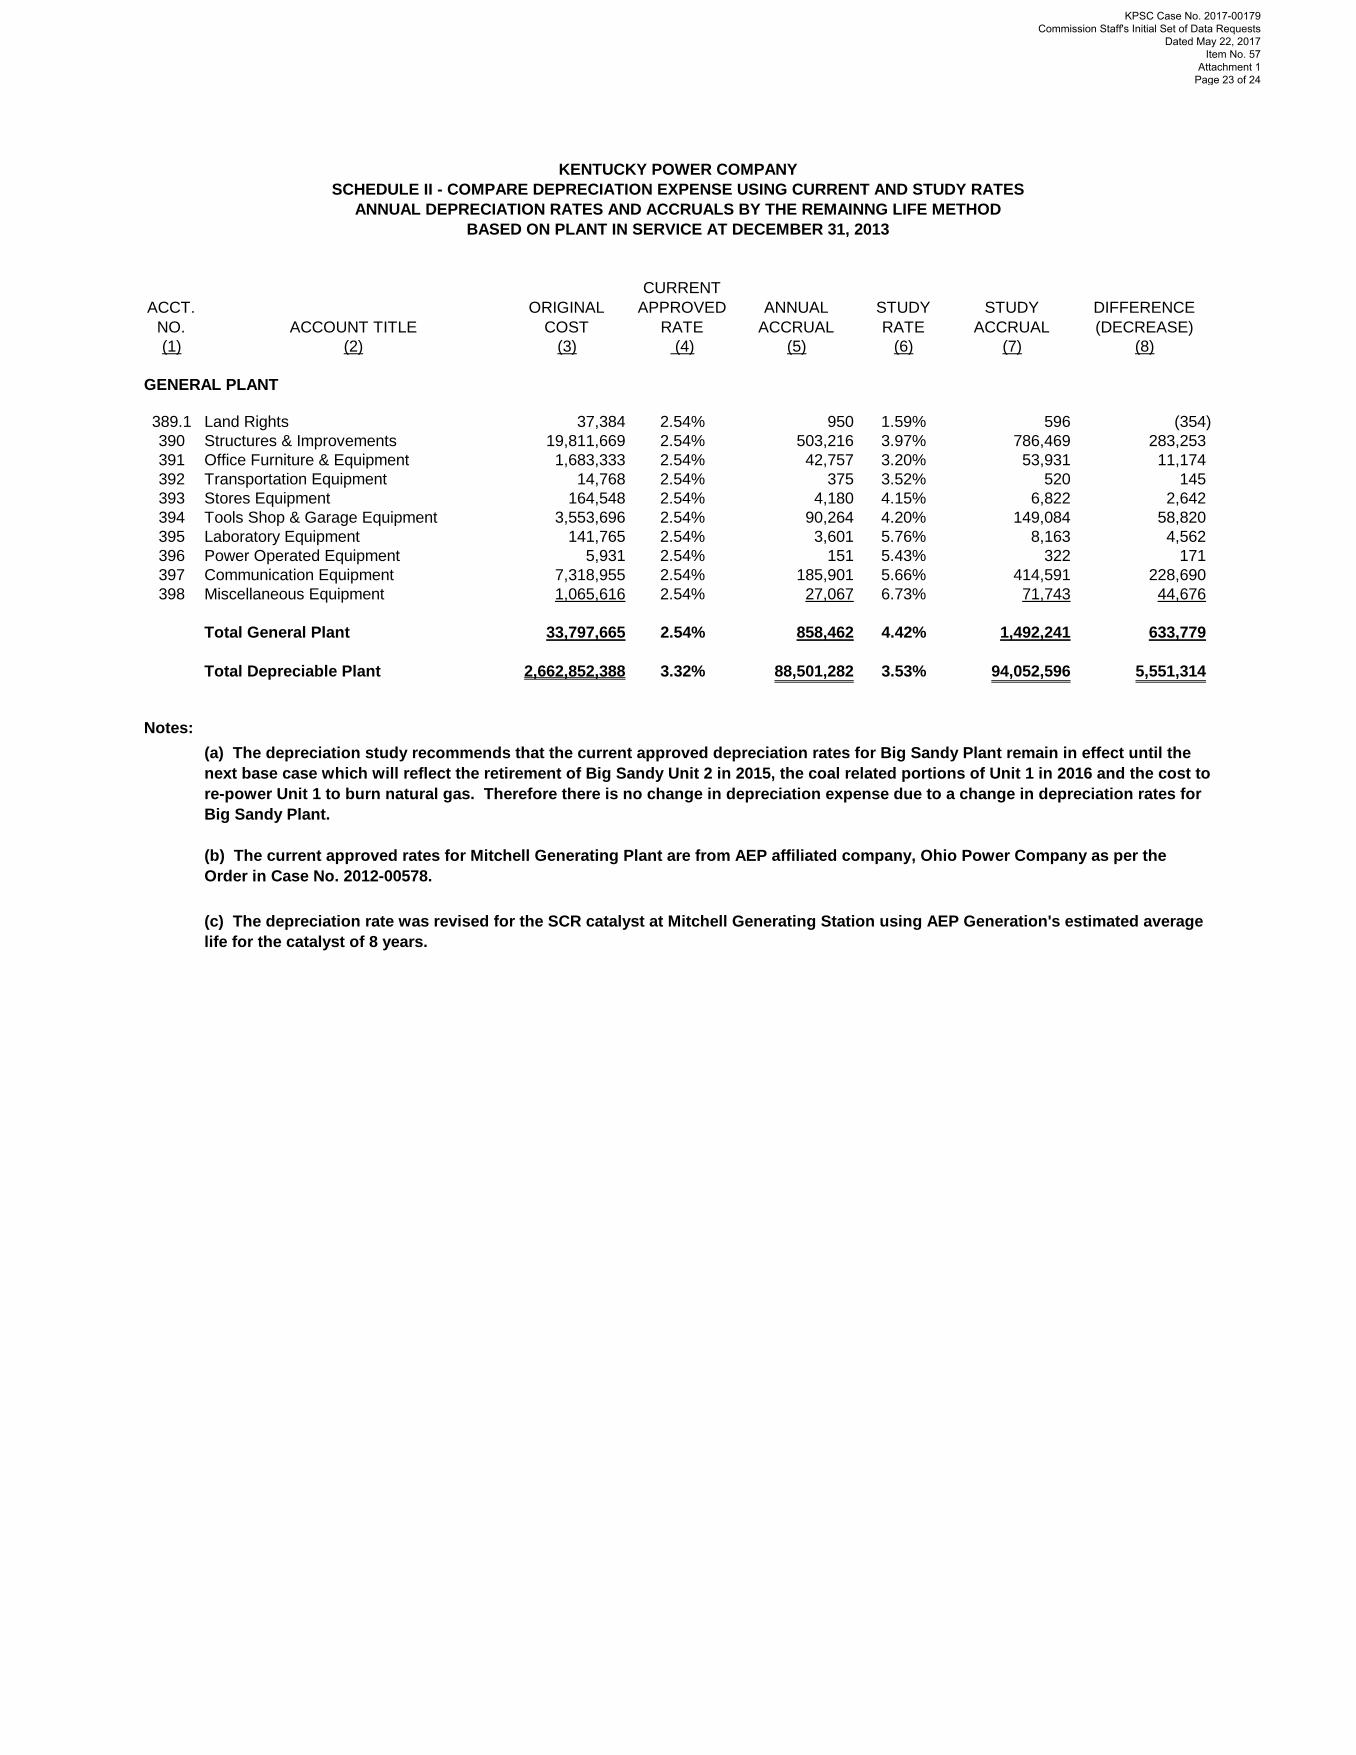
ACCT.
NO. ACCOUNT TITLE
ORIGINAL
COST
CURRENT
APPROVED
RATE
ANNUAL
ACCRUAL
STUDY
RATE
STUDY
ACCRUAL
DIFFERENCE
(DECREASE)
(1) (2) (3) (4) (5) (6) (7) (8)
KENTUCKY POWER COMPANY
ANNUAL DEPRECIATION RATES AND ACCRUALS BY THE REMAINNG LIFE METHOD
SCHEDULE II - COMPARE DEPRECIATION EXPENSE USING CURRENT AND STUDY RATES
BASED ON PLANT IN SERVICE AT DECEMBER 31, 2013
GENERAL PLANT
389.1 Land Rights 37,384 2.54% 950 1.59% 596 (354)
390 Structures & Improvements 19,811,669 2.54% 503,216 3.97% 786,469 283,253
391 Office Furniture & Equipment 1,683,333 2.54% 42,757 3.20% 53,931 11,174
392 Transportation Equipment 14,768 2.54% 375 3.52% 520 145
393 Stores Equipment 164,548 2.54% 4,180 4.15% 6,822 2,642
394 Tools Shop & Garage Equipment 3,553,696 2.54% 90,264 4.20% 149,084 58,820
395 Laboratory Equipment 141,765 2.54% 3,601 5.76% 8,163 4,562
396 Power Operated Equipment 5,931 2.54% 151 5.43% 322 171
397 Communication Equipment 7,318,955 2.54% 185,901 5.66% 414,591 228,690
398 Miscellaneous Equipment 1,065,616 2.54% 27,067 6.73% 71,743 44,676
Total General Plant 33,797,665 2.54% 858,462 4.42% 1,492,241 633,779
Total Depreciable Plant 2,662,852,388 3.32% 88,501,282 3.53% 94,052,596 5,551,314
Notes:
(c) The depreciation rate was revised for the SCR catalyst at Mitchell Generating Station using AEP Generation's estimated average
life for the catalyst of 8 years.
(a) The depreciation study recommends that the current approved depreciation rates for Big Sandy Plant remain in effect until the
next base case which will reflect the retirement of Big Sandy Unit 2 in 2015, the coal related portions of Unit 1 in 2016 and the cost to
re-power Unit 1 to burn natural gas. Therefore there is no change in depreciation expense due to a change in depreciation rates for
Big Sandy Plant.
(b) The current approved rates for Mitchell Generating Plant are from AEP affiliated company, Ohio Power Company as per the
Order in Case No. 2012-00578.
KPSC Case No. 2017-00179 Commission Staff's Initial Set of Data Requests
Dated May 22, 2017 Item No. 57
Attachment 1 Page 23 of 24

(2) (3) (4) (5) (6) (7) (8) (9) (10) (11)
Average Cost of Net Average Cost of Net
Service Iowa Salvage Removal Salvage Service Iowa Salvage Removal Salvage
Life Curve Factor Factor Factor Life Curve Factor Factor Factor
(Years) (Years)
TRANSMISSION PLANT
350.1 Rights of Way 75 R4.0 N/A N/A 0% 75 R4.0 0% 0% 0%
352.0 Structures & Improvements 55 S1.5 N/A N/A 0% 60 S3.0 0% 10% -10%
353.0 Station Equipment 50 R0.5 N/A N/A 25% 50 L0.5 8% 11% -3%
354.0 Towers & Fixtures 55 R4.0 N/A N/A 0% 51 S6.0 3% 13% -10%
355.0 Poles & Fixtures 45 R3.0 N/A N/A 0% 43 L3.0 2% 63% -61%
356.0 Overhead Conductor & Devices 50 R3.0 N/A N/A 10% 50 S6.0 6% 33% -27%
357.0 Underground Conduit 37 R2.0 N/A N/A 0% 37 R2.0 0% 0% 0%
358.0 Underground Conductor and Devices 44 R1.0 N/A N/A 0% 44 R1.0 0% 0% 0%
DISTRIBUTION PLANT
360.1 Rights of Way 75 R4.0 N/A N/A 0% 75 R4.0 0% 0% 0%
361.0 Structures & Improvements 65 L0.5 N/A N/A 0% 70 R2.0 4% 16% -12%
362.0 Station Equipment 25 L0.0 N/A N/A 25% 33 R0.5 10% 17% -7%
364.0 Poles, Towers, & Fixtures 28 L0.0 N/A N/A 25% 28 R0.5 18% 48% -30%
365.0 Overhead Conductor & Devices 26 R1.5 N/A N/A 25% 26 L0.0 30% 24% 6%
366.0 Underground Conduit 37 R2.0 N/A N/A 0% 45 R3.0 0% 0% 0%
367.0 Underground Conductor 44 R1.0 N/A N/A 0% 44 R0.5 1% 14% -13%
368.0 Line Transformers 25 R1.5 N/A N/A 15% 25 L0.0 29% 30% -1%
369.0 Services 18 R2.0 N/A N/A 0% 20 L0.0 1% 39% -38%
370.0 Meters 27 R0.5 N/A N/A 0% 17 R4.0 22% 19% 3%
371.0 Installations on Custs. Prem. 11 L0.0 N/A N/A 30% 11 L0.0 1% 33% -32%
373.0 Street Lighting & Signal Sys. 15 L0.0 N/A N/A 15% 20 L0.0 1% 25% -24%
GENERAL PLANT
389.1 Rights of Way 75 R4.0 N/A N/A 0% 75 R4.0 0% 0% 0%
390.0 Structures & Improvements 45 L3.0 N/A N/A 0% 35 L2.0 1% 1% 0%
391.0 Office Furniture & Equipment 35 R0.5 N/A N/A 10% 35 SQ 0% 0% 0%
392.0 Transportation Equipment 30 R3.0 N/A N/A 0% 30 SQ 0% 0% 0%
393.0 Stores Equipment 30 R1.0 N/A N/A 0% 30 SQ 0% 0% 0%
394.0 Tools Shop & Garage Equipment 30 R0.5 N/A N/A 0% 30 SQ 0% 9% -9%
395.0 Laboratory Equipment 30 L5.0 N/A N/A 0% 30 SQ 0% 0% 0%
396.0 Power Operated Equipment N/A N/A N/A N/A N/A 25 SQ 0% 0% 0%
397.0 Communication Equipment 22 L3.0 N/A N/A 0% 22 SQ 6% 3% 3%
398.0 Miscellaneous Equipment 20 S5.0 N/A N/A 0% 20 SQ 0% 3% -3%
Note: Kentucky Power Company's existing depreciation rates are from Case No. 91-066. No detail of Cost of Removal % and Salvage
Factor % is available from the order from that Case.
Existing Rates (See note, below) Current Study Rates
KENTUCKY POWER COMPANY
SCHEDULE III - COMPARISON OF MORTALITY CHARACTERISTICS
DEPRECIATION STUDY AS OF DECEMBER 31, 2013
(1)
KPSC Case No. 2017-00179 Commission Staff's Initial Set of Data Requests
Dated May 22, 2017 Item No. 57
Attachment 1 Page 24 of 24