observations of 12co (j= 1-0) in 44 cluster galaxies
TRANSCRIPT

THE ASTRONOMICAL JOURNAL, 115 :405È417, 1998 February1998. The American Astronomical Society. All rights reserved. Printed in the U.S.A.(
OBSERVATIONS OF 12CO (J \ 1È0) IN 44 CLUSTER GALAXIES
T. E. LAVEZZI
Dominion Astrophysical Observatory, Herzberg Institute of Astrophysics, National Research Council of Canada,5071 West Saanich Road, Victoria, BC V8X 4M6, Canada
AND
J. M. DICKEY
Department of Astronomy, University of Minnesota, 116 Church Street, SE, Minneapolis, MN 55455Received 1997 September 8 ; revised 1997 November 12
ABSTRACTWe present 12CO (J \ 1È0) (2.6 mm, 115 GHz) spectra from 44 galaxies in clusters between 3500 and
8000 km s~1. The data were obtained using the NRAO 12 m telescope at Kitt Peak. Forty galaxies aredetected. We deduce molecular gas masses from the line integrated intensities and upper limits for thefour nondetections. Although the sampleÏs Ðrst inclusion criterion is that a source have 60 km Ñuxgreater than 350 mJy, the galaxies in this survey are found to be neither ultraluminous in the far-IR norparticularly rich in molecular gas, nor do they exhibit evidence of interactions. Neither the molecular gasmass nor the far-IR luminosity shows variations as functions of the galaxiesÏ proximity to the clustercores. Because the CO line widths and central velocities agree overall with the 21 cm widths and red-shifts for these galaxies, we argue that CO spectra could be used in lieu of H I spectra for Tully-Fishercalculations.Key words : galaxies : clusters : general È galaxies : ISM
1. INTRODUCTION
In the approximately 10 years since millimeter-wavereceivers became sufficiently sensitive to routinely observeextragalactic molecular emission lines, several surveys ofcarbon monoxide have been undertaken to explore thevariations in molecular gas properties across a range ofenvironments and galactic types. Many surveys havefocused on nearby galaxies, studying the properties of COin the galactic centers and often mapping the disks as aresult of their high angular resolution. The largest of these is
et al. 300 galaxies ; but see also &Young (1995, SolomonSage 93 galaxies ; et al. 81 galaxies ;1988, Braine 1993,
et al. 168 galaxies ; Kru� gel, & LemkeElfhag 1996, Chini,98 galaxies ; and Casoli et al. hereafter1996, 1996a, 1996b,and 101 galaxies in Coma). Still others haveC96a C96b,
preferentially observed ultraluminous IRAS galaxieset al. et al. This paper pre-(Mirabel 1990 ; Solomon 1997).
sents observations of normal spirals in 11 clusters out to8000 km s~1 that are neither resolved nor ultraluminous inthe far-infrared (FIR).
& Dickey hereafter have studiedLavezzi (1997, LD97)the e†ects of disk resolution, conÐned gas density distribu-tions, and opacity on extragalactic single-dish spectra usingsynthetic emission proÐles, in order to determine whetherCO line widths are reliable for use in the Tully-Fisher rela-tion (TFR; & Fisher in lieu of H I 21 cm lineTully 1977)widths. Previous comparisons of CO and H I line widths
& Kazes & Sofue found no(Dickey 1992 ; Scho� niger 1994)systematic di†erences that might immediately disqualifyCO as appropriate for use in the TFR. Ðnd that mostLD97CO observations, like H I, adequately sample the high-velocity gas and are accurate measures of the disk rotationspeed. Moreover, the simulations in indicate that forLD97unresolved galaxies whose velocity Ðelds are typical forspirals (as opposed to, e.g., the nearly solid-body rotationcurves of dwarf galaxies), two-horned emission proÐles arethe norm, but are easily modiÐed by opacity [12CO (1È0)becomes opaque at column densities of only 1016 cm~2 (km
s~1)~1]. The changes in the spectra due to optical depthinclude sharp troughs at the line center and, in extremecases, a rounded line with no horns.
With the ultimate goal of a CO-TFR calibration, we haveobserved 44 galaxies in the 12CO (J \ 1È0) transition (2.6mm, 115 GHz). We leave for a later paper &(LavezziDickey a full discussion of CO in the TFR and simply1998)present here the CO spectra, obtained using the NRAO112 m telescope on Kitt Peak, and search for systematicdi†erences between the CO and H I data for these galaxies.
2. DATA
2.1. Sample SelectionTo maximize the chances of a CO detection, one relies on
the well-established CO-FIR correlation (see, e.g., thereviews of [hereafter or & ScovilleYoung 1990 Y90] Young
This selection criterion immediately biases the1991).sample, however, to IRAS sources. Some studies usingIRAS galaxies in the TFR Ðnd no systematic biases in theH I widths and no signiÐcant di†erence(Hutchings 1989),from the TFR with optically selected normal galaxies (vanDriel, van den Broek, & Baan On the other hand,1995).another Tully-Fisher study of IRAS galaxies (which usedHa rotation curves rather than H I line widths) found aparticularly large scatter in the relation (D0.5 mag, asopposed to 0.3 mag, which is typical ; Schlegel 1995).Whether the increased scatter was due to the sample beingÐeld galaxies or IRAS galaxies was unclear (D. J. Schlegel1997, private communication). Our Ðrst selection criterionwas therefore to place a threshold on 60 km Ñux, S60[ 350mJy, in order to maximize the CO detection rate (this is arather modest limit to impose, in the sense that most IRAS-selected CO surveys place their lower Ñux limit 3È5 timeshigher).
1 The National Radio Astronomy Observatory is a facility of theNational Science Foundation operated under cooperative agreement byAssociated Universities, Inc.
405
406 LAVEZZI & DICKEY Vol. 115
There are a number of other selection criteria with whichto construct a sample generally appropriate for luminosityÈline width calculations. We used to create an originalNED2sample set of galaxies according to these criteria, as follows :
1. Only northern (d [ 0¡) clusters with velocities between3500 and 8500 km s~1 were considered. We hoped to avoidresolving the galaxy disks. In practice, this means that weneed to assume some minimum radius within which most ofthe CO is distributed and select only galaxies far enoughaway that the NRAO 12 m telescopeÏs 55A beam sees at leastthat much of the disk. & Scoville show theYoung (1991)radial surface density of molecular gas (as traced by COÑux) for several galaxies. The surface density of moleculargas in Sc galaxies is centrally concentrated and drops o†almost exponentially with radius, with typical half-densityscale lengths of D3 kpc from the galactic center. By con-trast, some fraction of Sb and Sbc galaxies (three of eightshown) have nearly uniform radial gas distributions out toD7 kpc, beyond which the density decreases roughly expo-nentially. A few other galaxies (including the Milky Way;
show rings of molecular gas, peaking at radiiCombes 1991)of D4 kpc. Ðnd that, largely regardless of gas dis-LD97tribution, resolution does not become problematic from thestandpoint of measuring line width until the FWHM of thetelescope beam lies within the solid-body region of the disk.At 3500 km s~1, the 12 m beam covers 12 kpc (diameter) onthe sky, which is well outside any solid-body rotationregions known for spirals. Thus, even in the case of a galaxywith a roughly uniform gas distribution, by selecting gal-axies beyond 3500 km s~1, we ensure that the beamincludes most of the gas and adequately sample the Ñatrotation curve region.
2. An inclination i [ 40¡, as deduced from publishedaxial ratios, was required. Disks that are more face-onrequire greater corrections to deproject the measured linewidths and determine the rotation speed of the galaxy.Further, the error in axial ratio corresponds to a smalleruncertainty in inclination for more highly inclined galaxies.On the other hand, the more edge-on a disk, the greater thenecessary correction for internal extinction in the photo-metry. CCD photometry is very precise, however, and inter-nal extinction is well modeled. Most of the scatter inluminosityÈline width analyses arises from uncertainties inthe line width, rather than the photometry and correctionsto it, particularly for the I-band TFR, since internal andGalactic extinction at I are considerably smaller than at B.We therefore select galaxies to be more inclined to the lineof sight to minimize line width corrections.
3. We did not observe the Coma Cluster speciÐcally forthis work, as that has already been extensively studied inCO by et al. andLavezzi (1998), C96a, C96b.
4. We chose sources with T -type between 0 and 9. TheTFR is usually applied to later-type spirals. We allow abroad range of types, however, because the scatter in mor-phological typing can be rather large, and so anything clas-siÐed in the RC3 Vaucouleurs et al. as a likely(de 1991)spiral was considered. Some sources in the RC3 werebroadly designated as S or S? and were therefore includedin the sample, although we found more explicit types for
2 The NASA/IPAC Extragalactic Database (NED) is operated by theJet Propulsion Laboratory, California Institute of Technology, under con-tract with the National Aeronautics and Space Administration.
them in & Richter hereafter twoHuchtmeier (1989, HR89) ;of these (UGC 2759 and 9293) had T -types in HR89 beyondthe 0È9 range (T \ 10 and [2, respectively), but wereretained in the sample. A total of three sources do not havetypes more speciÐc than S or S? (CGCG 541-011, UGC8946, and CGCG 476-116).
5. We required a galaxyÏs position to be less than 3¡ fromthe published cluster center, and its velocity to be within1500 km s~1 of the average cluster velocity. (We work withH I velocities, from either the RC3 or except for theHR89,few cases that only had optical redshifts published.)
6. We Ðnally excluded any clusters that did not have atleast Ðve galaxies meeting the above criteria.
With these criteria, our full sample included 84 galaxies in12 clusters. Of these, we have observed 44 galaxies in 11clusters over D180 hours of observing time.
2.2. ObservationsWe present CO (J \ 1È0) (2.6 mm) spectra that were
obtained in two runs at the NRAO 12 m telescope, on KittPeak, during 1996 March and November. The telescopeÏsbeam size at 115 GHz is 55A. Focus and pointing werechecked before observing each source, using standardsources and planets (e.g., 3C 273 and Jupiter) ; pointingerrors were typically less than 5A. To calibrate the receivergain, we position-switched with a throw of ^2@ at 30 sintervals ; the resulting baselines were extremely Ñat.
For the March run, weather conditions were good, exceptfor 6 lost hours due to wind. Relative humidities rangedfrom 10% to 35%; a hot-cold calibration indicated that thereceiver temperature was D90 K, and typical system tem-peratures were 250È300 K. Weather conditions during partsof the November run, on the other hand, were considerablymore humid, with relative humidities reaching 90% (justbefore being closed down for rain). There was therefore agreater variation in system temperatures in November,from 250 to 400 K. Also during this run, a problem with theÐlter banks materialized when several channels showedspikes on the D10 mK level, which unfortunately is enoughto drown the galactic signals. Sources signiÐcantly a†ectedby this problem are so noted in Table 1.
The spectrometers were two 256 MHz Ðlter banks, withindividual channel widths of 2 MHz, run in series, for a totalbandwidth of 512 MHz (this corresponds to a bandwidthand resolution of roughly 1350 km s~1 and 5.2 km s~1 perchannel, at 5000 km s~1). Integration times, except in thecases of total nondetection after about an hour, were con-tinued long enough to achieve an rms of D1È3 mK in thespectra, or between 2 and 6 hr.
2.3. W idth-measuring Algorithmfound that the problem of noise broadeningLewis (1983)
in measuring spectral line widths can be somewhat allevi-ated by using a minimizing measurement algorithm, i.e.,locating the emission edges by searching out from the centerof the line, rather than inward. We use such an algorithmand apply it 4 times to each spectrum, after binning thespectrum to successively coarser resolutions (one-, two-,four- and eight-channel bins), taking care to deconvolve thebinning width, and Ðnally averaging the four measurements.Our procedure (described in more detail in requiresLD97)an initial guess as to the line center and width, however, andthe results depend slightly on these input values. We there-

No. 2, 1998 CO IN CLUSTER GALAXIES 407
TABLE 1
OBSERVATIONAL RESULTS
tint rmsa W20p W50p VCO ICOGalaxy (minutes) (mK) (km s~1) (km s~1) (km s~1) (K km s~1) Run
Pisces :UGC 540b . . . . . . . . . . . . 270 1.9 202 (13) 175 (17) 4967 0.59 (0.13) NovUGC 556 . . . . . . . . . . . . . 117 4.8 442 (12) 413 (7) 4611 2.90 (0.23) MarUGC 562 . . . . . . . . . . . . . 120 1.8 452 (4) 404 (3) 5441 5.32 (0.18) MarUGC 624 . . . . . . . . . . . . . 120 2.0 592 (16) 495 (10) 4786 5.16 (0.27) Mar
Abell 262 :UGC 1178 . . . . . . . . . . . . 120 2.0 449 (21) 381 (19) 5521 1.63 (0.19) MarUGC 1220 . . . . . . . . . . . . 120 1.7 261 (9) 238 (7) 5625 1.35 (0.15) MarUGC 1302 . . . . . . . . . . . . 255 1.7 455 (32) 385 (6) 4150 1.40 (0.21) NovUGC 1319 . . . . . . . . . . . . 210 2.1 236 (13) 224 (11) 5298 2.48 (0.21) NovUGC 1456 . . . . . . . . . . . . 180 3.1 284 (4) 266 (19) 4837 2.56 (0.29) NovUGC 1493 . . . . . . . . . . . . 108 1.8 343 (5) 292 (4) 4127 3.09 (0.18) MarUGC 1581 . . . . . . . . . . . . 234 2.0 . . . . . . . . . \2.26 Nov
Abell 426 :UGC 2586 . . . . . . . . . . . . 120 1.9 597 (28) 471 (11) 4401 4.22 (0.23) MarUGC 2640 . . . . . . . . . . . . 120 1.9 381 (14) 321 (9) 6111 2.50 (0.21) MarUGC 2718 . . . . . . . . . . . . 144 2.7 433 (45) 329 (18) 6793 3.00 (0.37) MarCGCG 541-011 . . . . . . . 102 1.9 314 (18) 279 (18) 4247 3.11 (0.14) MarUGC 2759 . . . . . . . . . . . . 90 2.3 350 (14) 312 (1) 4251 3.57 (0.20) Mar
Cancer :UGC 4299 . . . . . . . . . . . . 120 1.9 434 (16) 336 (18) 4269 2.07 (0.17) MarUGC 4312 . . . . . . . . . . . . 432 1.4 483 (5) 436 (14) 4138 2.17 (0.17) NovUGC 4332 . . . . . . . . . . . . 378 1.4 466 (11) 407 (8) 5480 2.35 (0.13) NovUGC 4386 . . . . . . . . . . . . 210 1.5 410 (18) 363 (15) 4610 2.30 (0.18) NovUGC 4422 . . . . . . . . . . . . 126 2.1 361 (19) 316 (15) 4330 2.28 (0.19) Mar
MKW 10:UGC 6661 . . . . . . . . . . . . 78 2.2 539 (7) 504 (11) 6141 6.61 (0.27) MarUGC 6700 . . . . . . . . . . . . 144 1.6 295 (20) 245 (10) 5902 1.79 (0.19) MarUGC 6734 . . . . . . . . . . . . 108 1.7 406 (13) 327 (6) 6251 2.23 (0.15) Mar
Abell 1367 :CGCG 97-068 . . . . . . . . 240 2.1 395 (22) 337 (14) 5958 3.01 (0.19) NovUGC 6724 . . . . . . . . . . . . 258 2.0 . . . . . . . . . \2.26 NovCGCG 127-068b . . . . . . 235 1.2 261 (6) 244 (4) 7668 0.47 (0.10) Nov
AWM 2:UGC 7248 . . . . . . . . . . . . 144 4.2 . . . . . . . . . \4.75 Novc
MKW 12:UGC 8944 . . . . . . . . . . . . 90 2.3 344 (24) 309 (4) 6223 2.77 (0.17) MarUGC 8946 . . . . . . . . . . . . 150 2.2 314 (10) 260 (14) 4575 1.43 (0.16) MarUGC 8967 . . . . . . . . . . . . 120 1.8 392 (32) 322 (8) 5638 1.62 (0.12) MarUGC 9041 . . . . . . . . . . . . 138 1.8 329 (19) 245 (17) 5736 1.37 (0.14) Mar
AWM 3:UGC 9165 . . . . . . . . . . . . 90 2.1 422 (12) 346 (8) 5212 4.49 (0.16) MarUGC 9166 . . . . . . . . . . . . 120 1.8 432 (5) 381 (7) 5128 3.15 (0.16) MarUGC 9230 . . . . . . . . . . . . 168 2.2 363 (7) 306 (7) 5034 3.19 (0.15) MarCGCG 133-067 . . . . . . . 231 2.4 266 (22) 231 (41) 4063 1.36 (0.18)UGC 9293 . . . . . . . . . . . . 168 2.2 351 (33) 256 (28) 5254 2.03 (0.18) Mar
Pegasus :UGC 12422 . . . . . . . . . . . 90 2.4 117 (13) 92 (8) 3530 1.51 (0.11) MarUGC 12486 . . . . . . . . . . . 120 2.4 434 (17) 397 (6) 4934 6.36 (0.26) NovUGC 12498 . . . . . . . . . . . 348 1.9 290 (19) 237 (13) 4145 1.19 (0.16) NovUGC 12511b . . . . . . . . . . 126 3.0 318 (11) 278 (14) 3574 1.71 (0.21) NovcUGC 12539 . . . . . . . . . . . 300 1.6 384 (26) 242 (25) 3752 1.11 (0.14) Nov
Abell 2666 :CGCG 476-116 . . . . . . . 78 3.9 . . . . . . . . . \4.41 NovUGC 12746 . . . . . . . . . . . 159 1.9 504 (22) 435 (12) 7403 2.18 (0.16) Mar, Nov
NOTE.ÈValues in parentheses are 1 p uncertainties.a Taken after three-channel boxcar smoothing in emission-free regions of spectrum.b CO detection, but spectrum is noisy or weak.c Su†ered from Ðlter-bank spikes.
fore run the code 50 times, each with slightly di†erent initialguesses. Also, for each of these 50 runs the spectrum ismodiÐed by adding a small amount of Gaussian noise toeach channel. We Ðnd the results to be quite robust, and theerrors quoted in are the 1 p uncertainties from theseTable 150 runs.
3. RESULTS
lists the integration times (on source) andTable 1 tint
sensitivities (rms) achieved, as well as the line widths mea-sured at 20% and 50% of the peak and their(W20p, W50p)uncertainties. Also in Table 1 are the central velocity of thedetected CO line and the line integral, deÐned as(VCO)
ICO4P
Tmb dv . (1)
In the cases of nondetection, we take the upper limit on ICOto be (377 km s~1), because 377 km s~1 is theICOmax\ 3(rms)
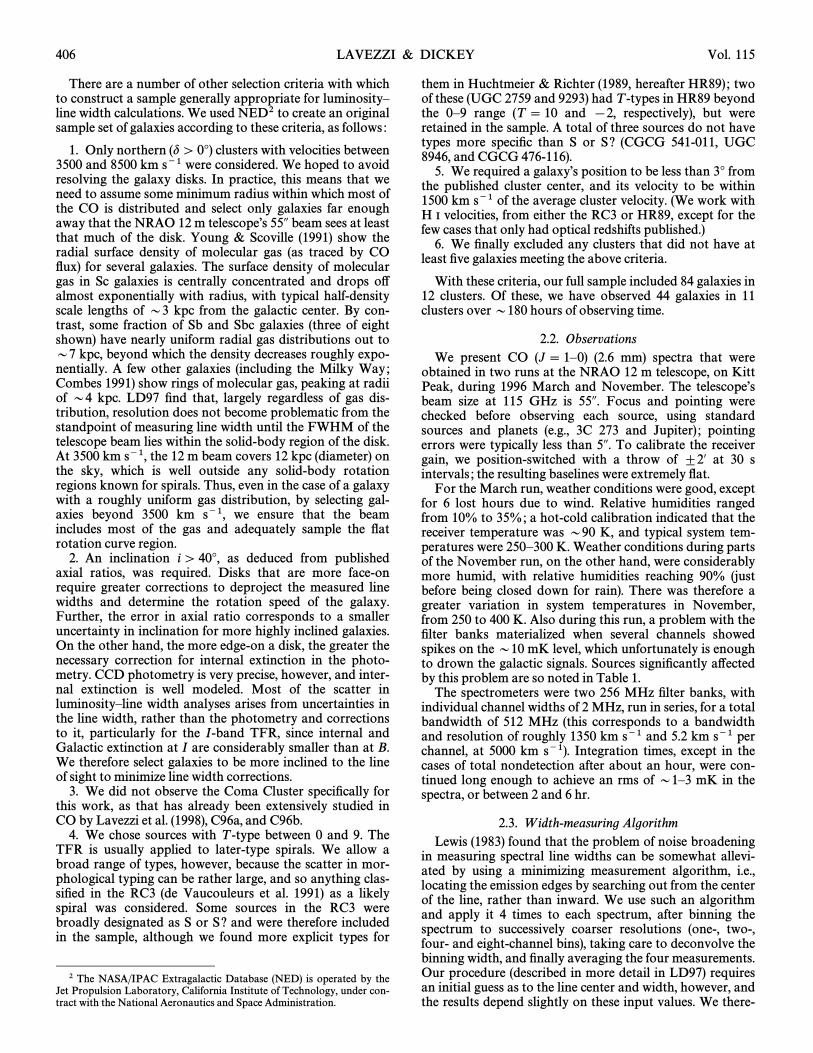
FIG
.1.
ÈA
ll44
spec
tra
for
the
obse
rved
sour
ces,
arra
nged
asin
the
tabl
es;a
xes
are
mai
n-be
amte
mpe
ratu
rein
mK
and
helio
cent
ric
radi
alve
loci
tyin
kms~
1.Sp
ectr
aw
ere
thre
e-ch
anne
lbox
car
(Tmb
)sm
ooth
edan
dth
enbi
nned
to21
kms~
1res
olut
ion,
exce
ptfo
rU
GC
540,
1251
1,an
d12
539,
whi
chw
erebi
nned
to42
kms~
1.
408

FIG
.1È
Con
tinue
d
409

FIG
.1È
Con
tinue
d
410

FIG
.1È
Con
tinue
d
411

FIG
.1È
Con
tinue
d

CO IN CLUSTER GALAXIES 413
average line width for the detected lines. The data are(W20p)taken on the scale (corrected for scattering and spilloverTR*
losses), and the system temperatures were quoted on thisscale. The sensitivities, spectra, and however, have beenICO,converted to the main-beam scale, as isTmb\ T
R*/0.88,
appropriate for sources that are very nearly the size of thetelescope beam.
We used UniPOPS to subtract linear baselines andmeasure the rms of all spectra. The spectra as presented in
have been three-channel boxcar smoothed andFigure 1then binned to 21 km s~1 resolution, except in three cases(UGC 540, 12511, and 12539), which are noisier detectionsand have been binned to 42 km s~1 resolution.
plots the distribution of redshifts in the observedFigure 2sample and the average cluster velocities. The undetectedgalaxies (black) are not biased to more distant sources.Figure 2 is to be compared with which shows theFigure 3,distribution of 60 and 100 km Ñuxes in the observed gal-axies. The four nondetections are among the FIR-weakestin the sample.
The central CO velocity is plotted versus the H I velocityin and on averageFigure 4, S*
VT \ SVCO[ VHIT \ [12
^ 4 km s~1. The crosses in Figure 4 are those sources thathad only optical redshifts available ; some have considerableuncertainties (D100 km s~1) associated with them. H I and
gas masses and CO and FIR luminosities are calculatedH2as described below, and presented in Table 2.
3.1. Comparisons with Previous Studies3.1.1. Atomic versus Molecular Gas Masses
show that (1) optically thick gas in a highlyLD97inclined disk will account for emission proÐles withouthorns in cases in which the solid-body rotation region of thedisk is not resolved and (2) at smaller optical depths orinclinations, opacity will commonly be manifested as asharp trough in the line center. & CombesBraine (1992)found that CO (1È0) and CO (2È1) line ratios for galacticnuclear emission do indicate optically thick gas, and in
we see a variety of proÐle shapes and severalFigure 1spectra exhibiting a central trough. In fact, spectra thatseem completely uninÑuenced by opacity in Figure 1 are inthe minority.
FIG. 2.ÈDistribution of redshifts in the observed sample. Undetectedsources are in black. Average velocities of the observed clusters are indi-cated.
FIG. 3.ÈDistribution of FIR Ñuxes in the observed sample. Undetectedsources are in black.
The usual caveats surrounding molecular mass estimatessay that the conversion factor between the CO line integraland gas mass may be a function of environment orH2galaxy type, or even that there may be no universal constantof proportionality between and Nevertheless, weICO N(H2).
FIG. 4.ÈDi†erence between the central CO line velocity, and H IVCO,velocity, (circles), or optical velocity (crosses).VH I

414 LAVEZZI & DICKEY Vol. 115
TABLE 2
GAS MASSES AND LUMINOSITIES
M(H I) M(H2) L CO L CO L FIRSource (109 M_
) (109 M_) (102 K km s~1 kpc2) (104 L
_) (109 L
_)
Pisces :UGC 540 . . . . . . . . . . . . 5.06 0.77 0.69 0.93 10.68UGC 556 . . . . . . . . . . . . 4.48 3.27 3.36 3.95 36.74UGC 562 . . . . . . . . . . . . 11.15 8.33 15.71 10.07 31.93UGC 624 . . . . . . . . . . . . 12.34 6.20 7.65 7.49 19.55
Abell 262 :UGC 1178 . . . . . . . . . . . 19.70 2.58 1.49 3.13 14.47UGC 1220 . . . . . . . . . . . 4.25 2.28 2.05 2.75 21.20UGC 1302 . . . . . . . . . . . 7.25 1.25 2.39 1.53 7.36UGC 1319 . . . . . . . . . . . 1.84 3.55 4.47 4.45 10.11UGC 1456 . . . . . . . . . . . 1.39 3.16 5.86 3.82 6.76UGC 1493 . . . . . . . . . . . 1.14 2.74 3.95 3.31 8.23UGC 1581 . . . . . . . . . . . 12.66 \2.30 \3.31 \2.09 6.09
Abell 426 :UGC 2586 . . . . . . . . . . . . . . 4.31 5.32 5.21 14.38UGC 2640 . . . . . . . . . . . 9.32 4.91 6.06 5.93 25.05UGC 2718 . . . . . . . . . . . . . . 7.25 6.13 9.00 22.16CGCG 541-011 . . . . . . . . . 2.95 1.95 3.56 27.90UGC 2759 . . . . . . . . . . . 2.90 3.37 4.86 4.07 26.94
Cancer :UGC 4299 . . . . . . . . . . . 3.08 2.00 0.99 2.42 8.17UGC 4312 . . . . . . . . . . . 1.88 1.97 3.72 2.38 4.11UGC 4332 . . . . . . . . . . . 2.61 3.72 5.36 4.50 8.80UGC 4386 . . . . . . . . . . . 3.64 2.61 2.68 3.15 6.35UGC 4422 . . . . . . . . . . . 10.99 2.25 4.24 2.72 6.97
MKW 10:UGC 6661 . . . . . . . . . . . . . . 13.22 24.93 15.97 38.77UGC 6700 . . . . . . . . . . . 15.08 3.30 3.39 3.98 43.94UGC 6734 . . . . . . . . . . . 6.13 4.59 2.84 5.55 26.48
Abell 1367 :CGCG 97-068 . . . . . . . 4.19 5.65 8.13 6.82 21.84UGC 6724 . . . . . . . . . . . 7.61 \3.07 \5.70 \2.77 5.03CGCG 127-068 . . . . . . . . . 1.47 0.79 1.77 13.38
AWM 2:UGC 7248 . . . . . . . . . . . 7.37 \9.66 \9.80 \8.73 6.02
MKW 12:UGC 8944 . . . . . . . . . . . 7.07 5.68 9.34 6.85 19.59UGC 8946 . . . . . . . . . . . 1.80 1.59 1.63 1.92 10.67UGC 8967 . . . . . . . . . . . 13.18 2.73 2.23 3.27 13.84UGC 9041 . . . . . . . . . . . . . . 2.34 2.89 2.83 13.74
AWM 3:UGC 9165 . . . . . . . . . . . 5.69 6.53 4.03 7.89 29.58UGC 9166 . . . . . . . . . . . 5.80 4.42 3.64 5.34 9.38UGC 9230 . . . . . . . . . . . . . . 4.34 6.26 5.25 37.52CGCG 133-067 . . . . . . 2.40 1.16 0.70 1.40 3.86UGC 9293 . . . . . . . . . . . 1.68 2.94 2.97 3.55 14.68
Pegasus :UGC 12422 . . . . . . . . . . 1.61 0.99 1.87 1.20 16.21UGC 12486 . . . . . . . . . . 17.51 8.22 13.53 9.93 54.18UGC 12498 . . . . . . . . . . 2.20 1.10 1.36 1.33 3.55UGC 12511 . . . . . . . . . . 1.13 1.14 2.14 1.37 3.08UGC 12539 . . . . . . . . . . 2.63 0.82 1.19 0.99 3.00
Abell 2666 :CGCG 476-116 . . . . . . 3.64 \12.73 \4.02 \11.49 16.11UGC 12746 . . . . . . . . . . 14.04 6.26 2.22 7.66 24.68
proceed to calculate global molecular gas masses, M(H2),for our sample, using the conversion between CO lineintegral and column density of et al.H2 Strong (1988),which assumes that the CO clouds are highly opticallythick, cm~2. Then ifN(H2) \ 2.3 ] 1020ICO M(H2)\we can derive, for the NRAO 12 m, whose(area)N(H2)2mH,beam size is 55A,
M(H2)\ 2.96] 105ICO DMpc2 M_
, (2)
where is on the main-beam scale (seeICO eq. [1]).3The H I masses are calculated from the 21 cm magnitudes
and the prescription of the RC3. For the few sources forwhich 21 cm magnitudes are unavailable, we take the H I
3 Note that and calculate the gas masses with a constant ofC96a C96b2.05] 105. This value assumes that the area of the telescope beam is 14nh2rather than 1.13h2, which is true for the integral of a Gaussian. Thus, if onewishes to compare those gas masses directly with these, the former must beincreased by a factor of 1.43.

No. 2, 1998 CO IN CLUSTER GALAXIES 415
FIG. 5.ÈRelationship between CO and FIR luminosity. Asterisks indi-cate weaker CO detections ; upper limits for the CO nondetections areplotted as arrows. Lines A, B, and C represent star formation efficiencies
of 100, 10, and 1 respectively, and indicate theL FIR/M(H2) (L /M)_
,expected range of CO luminosities based on the FIR Ñuxes (Y90).
line integral from and useHR89
M(H I) \ 2.3] 105DMpc2P
Svdv M
_. (3)
Distances were calculated assuming km s~1H0\ 75Mpc~1.
The mass of molecular gas in the Milky Way is (2È3) ] 109 In one can see thatM
_(Combes 1991). Table 2,
few galaxies in this sample signiÐcantly exceed this massand with the exception of UGC 6661 (a[M(H2) Z 6 ] 109],
Seyfert 2 galaxy) we do not see any very molecular gasÈrichgalaxies in the sample. For the 40 detected galaxies in thissample, (with a standard devi-SM(H2)T \ 3.7 ] 109 M
_ation of 2.6 ] 109 Our average value of SlogM_
).is in agreement with values[M(H2)/L B
]T \ [0.9^ 0.1derived in other studies ([1.05, et al. with aCasoli 1991,sample of cluster galaxies ; and [0.82, & KnezekYoung
with Ðeld galaxies). We conclude that these galaxies1989,have normal molecular gas masses. In agreement with
the atomic and molecular gas masses (when scaled byC96a,the blue luminosities) show only a broad correlation(r \ 0.32 ; rms about best-Ðt line D0.36).
3.1.2. CO versus FIR L uminosity
plots the CO luminosity versus FIR luminosity,Figure 5and one can see that no galaxies in the sample stand out asunusual. The points are coded such that the weaker detec-tions are asterisks and upper limits to the CO luminosityare indicated. Lines A, B, and C indicate L FIR/M(H2) \ 100,10, and 1 respectively, and bound the expected(L /M)
_,
range of CO luminosity as a function of FIR luminosityIn Figure 5, was calculated using(Y90). L CO
L CO\ ICO Akpc K km s~1 kpc2 , (4)
where is the area of the disk falling within the FWHMAkpcof the telescope beam, in kiloparsecs. In isTable 2, L COlisted in both K km s~1 kpc2 and in solar units for com-pleteness. To derive the latter, we know that for an unre-solved galaxy where G is the telescopeL CO\ 4nD2GICO,gain and D is the distance. For the 12 m telescope, withG\ 30 Jy K~1, we Ðnd
L CO\ 3.6ICO DMpc2 L_
\ 1.2] 10~5M(H2) L_
. (5)
is calculated according toL FIRL FIR\ 3.94] 105DMpc2 (2.58S60] S100) L
_. (6)
Insofar as the FIR luminosity traces the high-mass starformation rate in spiral galaxies, the ratio of toL FIR M(H2)is a measure of the star formation efficiency. Studies com-paring the star formation efficiencies in interacting versusisolated spirals (e.g., & Sage referencesSolomon 1988 ; Y90;therein) Ðnd a large scatter in the ratio but, on average,Ðnd the efficiency to be 12^ 3 in isolated galaxies,(L /M)
_compared with 78 ^ 14 in interacting galaxies. For(L /M)_our sample, [p \ 3.5SL FIR/M(H2)T \ 5.5^ 0.6 (L /M)
_None of the detections fall in a range that is obvi-(L /M)_
].ously due to interactions, but it should be noted that thereis signiÐcant overlap between interacting and noninter-acting galaxies according to Y90.
3.2. Molecular Gas in Cluster and Field GalaxiesWe have seen that these galaxies, taken on average, do
not appear to be deÐcient in molecular gas relative to eithertheir atomic gas content or their blue luminosities, nor dothey show evidence of interactions. The latter fact is notsurprising, as we avoided galaxy pairs and groups in con-structing the sample, but it would also not be surprising foronly those galaxies nearest the cluster cores to be experi-encing some degree of interaction. Because H I may bedepleted in the cores and the galaxiesÏ molecular masses arenormal relative to their H I masses, they might in fact besomewhat deÐcient in both. The blue luminosities of clusterand Ðeld spirals are already known to disagree by nearly0.25 mag, because of the e†ect of cluster environment onstar formation rates (Pierce & Tully 1988, 1992).
We can, therefore, further examine the potential e†ect ofthe cluster environment on the molecular gas properties bysearching for a variations in gas mass, star formation effi-ciency, and the ratio of molecular to atomic gas as functionsof projected distance from the cluster center. &GiovanelliHaynes probed the question of gas depletion and(1985)found that (1) depletion of H I does occur in cluster spiralsand (2) the degree of gas deÐciency correlates strongly withthe projected distance to the cluster core and the richness ofthe cluster core. Our much smaller sample size makes sucha detailed analysis impossible, but we can look for grosstrends.
Examination of versus the galaxiesÏ projectedM(H2)/L Bdistance from their respective cluster centers, shows norcl,trend whatever, implying that molecular mass does notsu†er depletion due to the cluster environment, in keepingwith other Ðndings et al. et al.(Boselli 1994 ; Casoli 1991 ;
& Young Further, the ratio of molecular toKenney 1989).atomic gas, I), also does not show any varia-M(H2)/M(Htion with proximity to the cluster cores. Because our molec-ular masses are normal, this further implies that these
416 LAVEZZI & DICKEY Vol. 115
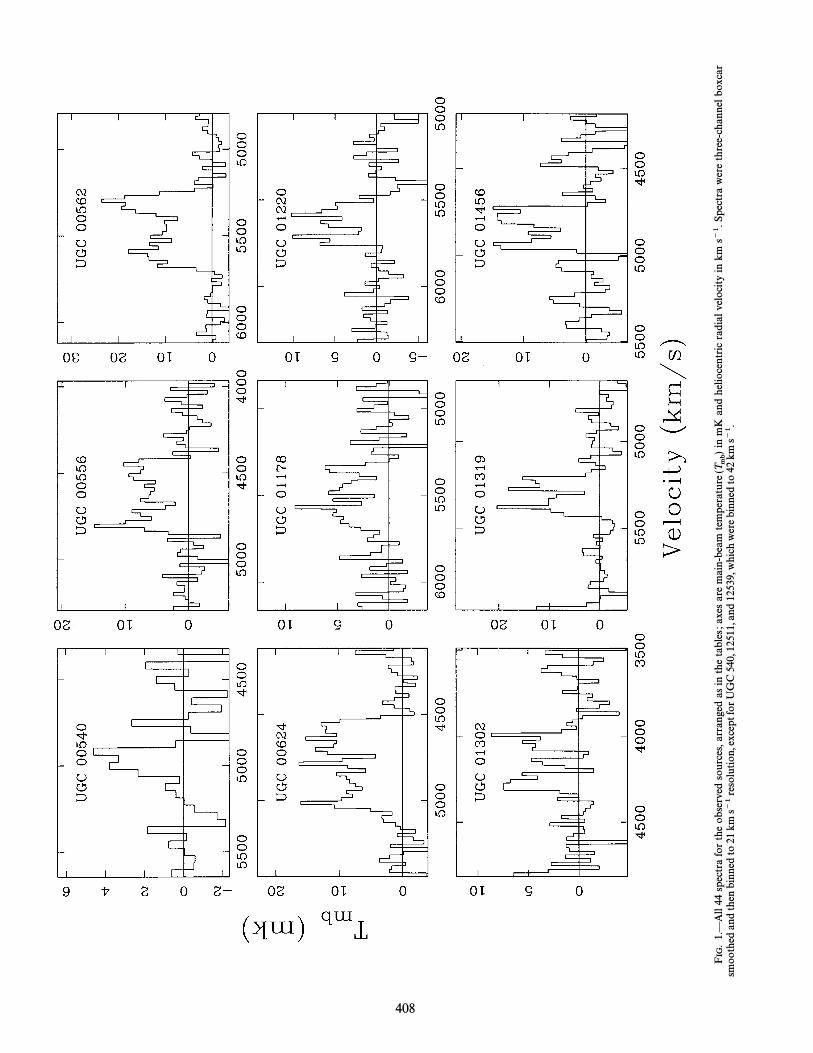
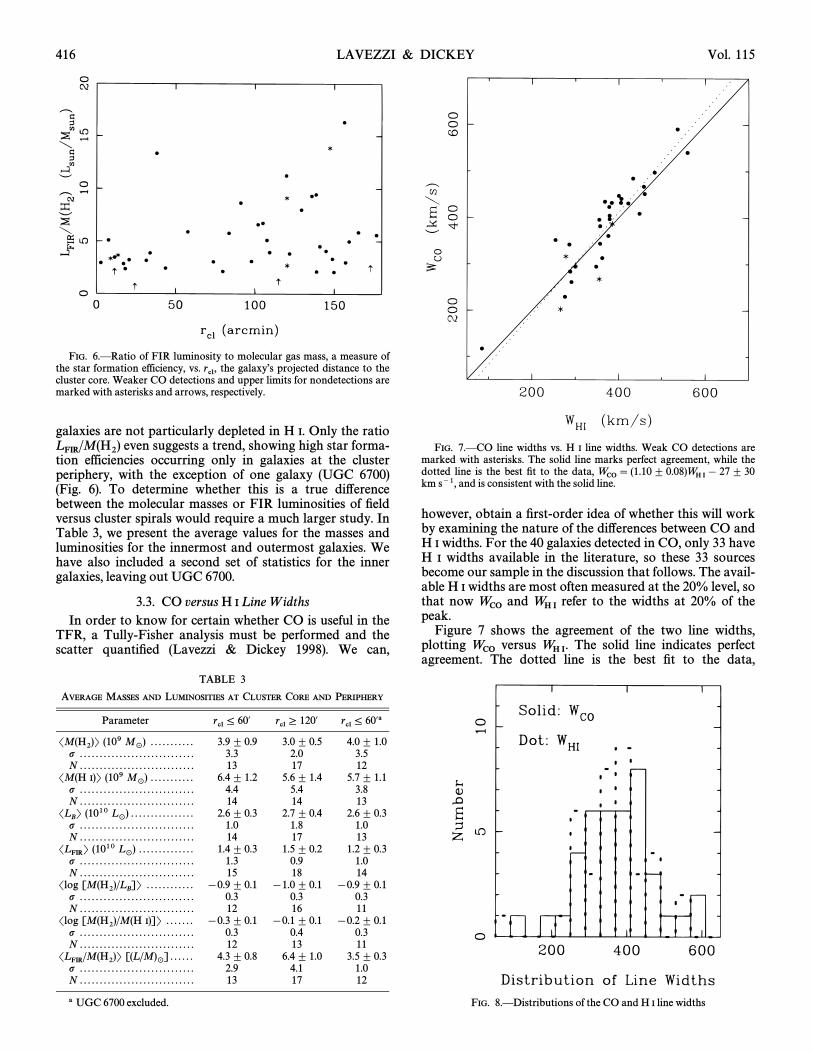
FIG. 6.ÈRatio of FIR luminosity to molecular gas mass, a measure ofthe star formation efficiency, vs. the galaxyÏs projected distance to thercl,cluster core. Weaker CO detections and upper limits for nondetections aremarked with asterisks and arrows, respectively.
galaxies are not particularly depleted in H I. Only the ratioeven suggests a trend, showing high star forma-L FIR/M(H2)tion efficiencies occurring only in galaxies at the cluster
periphery, with the exception of one galaxy (UGC 6700)To determine whether this is a true di†erence(Fig. 6).
between the molecular masses or FIR luminosities of Ðeldversus cluster spirals would require a much larger study. In
we present the average values for the masses andTable 3,luminosities for the innermost and outermost galaxies. Wehave also included a second set of statistics for the innergalaxies, leaving out UGC 6700.
3.3. CO versus H I L ine W idthsIn order to know for certain whether CO is useful in the
TFR, a Tully-Fisher analysis must be performed and thescatter quantiÐed & Dickey We can,(Lavezzi 1998).
TABLE 3
AVERAGE MASSES AND LUMINOSITIES AT CLUSTER CORE AND PERIPHERY
Parameter rcl ¹ 60@ rcl º 120@ rcl¹ 60@a
SM(H2)T (109 M_
) . . . . . . . . . . . 3.9^ 0.9 3.0^ 0.5 4.0^ 1.0p . . . . . . . . . . . . . . . . . . . . . . . . . . . . . 3.3 2.0 3.5N . . . . . . . . . . . . . . . . . . . . . . . . . . . . . 13 17 12
SM(H I)T (109 M_
) . . . . . . . . . . . 6.4^ 1.2 5.6^ 1.4 5.7^ 1.1p . . . . . . . . . . . . . . . . . . . . . . . . . . . . . 4.4 5.4 3.8N . . . . . . . . . . . . . . . . . . . . . . . . . . . . . 14 14 13
SLBT (1010 L
_) . . . . . . . . . . . . . . . . 2.6 ^ 0.3 2.7^ 0.4 2.6^ 0.3
p . . . . . . . . . . . . . . . . . . . . . . . . . . . . . 1.0 1.8 1.0N . . . . . . . . . . . . . . . . . . . . . . . . . . . . . 14 17 13
SL FIRT (1010 L_
) . . . . . . . . . . . . . . 1.4^ 0.3 1.5^ 0.2 1.2^ 0.3p . . . . . . . . . . . . . . . . . . . . . . . . . . . . . 1.3 0.9 1.0N . . . . . . . . . . . . . . . . . . . . . . . . . . . . . 15 18 14
Slog [M(H2)/L B]T . . . . . . . . . . . . [0.9^ 0.1 [1.0^ 0.1 [0.9^ 0.1
p . . . . . . . . . . . . . . . . . . . . . . . . . . . . . 0.3 0.3 0.3N . . . . . . . . . . . . . . . . . . . . . . . . . . . . . 12 16 11
Slog [M(H2)/M(H I)]T . . . . . . . [0.3^ 0.1 [0.1^ 0.1 [0.2^ 0.1p . . . . . . . . . . . . . . . . . . . . . . . . . . . . . 0.3 0.4 0.3N . . . . . . . . . . . . . . . . . . . . . . . . . . . . . 12 13 11
SL FIR/M(H2)T [(L /M)_] . . . . . . 4.3 ^ 0.8 6.4^ 1.0 3.5^ 0.3
p . . . . . . . . . . . . . . . . . . . . . . . . . . . . . 2.9 4.1 1.0N . . . . . . . . . . . . . . . . . . . . . . . . . . . . . 13 17 12
a UGC 6700 excluded.
FIG. 7.ÈCO line widths vs. H I line widths. Weak CO detections aremarked with asterisks. The solid line marks perfect agreement, while thedotted line is the best Ðt to the data, WCO\ (1.10 ^ 0.08)WH I [ 27 ^ 30km s~1, and is consistent with the solid line.
however, obtain a Ðrst-order idea of whether this will workby examining the nature of the di†erences between CO andH I widths. For the 40 galaxies detected in CO, only 33 haveH I widths available in the literature, so these 33 sourcesbecome our sample in the discussion that follows. The avail-able H I widths are most often measured at the 20% level, sothat now and refer to the widths at 20% of theWCO WH Ipeak.
shows the agreement of the two line widths,Figure 7plotting versus The solid line indicates perfectWCO WH I.agreement. The dotted line is the best Ðt to the data,
FIG. 8.ÈDistributions of the CO and H I line widths

No. 2, 1998 CO IN CLUSTER GALAXIES 417
km s~1. Overall,WCO\ (1.10^ 0.08)WH I[ 27 ^ 30km s~1, and so, en masse, theSWCO [ WH IT \ 10 ^ 7
widths agree. Some small disagreement is to be expectedbecause some studies from which the RC3 compiled WH Iapplied a 1] z correction factor and others did not. Whenapplied, it would cause the H I widths to be smaller than theuncorrected widths (and therefore by 5È10 km s~1. WeWCO)further note that the CO and H I widths agree over a rangeof widths ; if they agreed only for broad lines, for example,we would be led to suspect that narrow CO lines were theresult of resolution or gas distribution, rather than trulyrepresenting the velocity Ðeld.
shows the distributions of the line widths for theFigure 8CO and H I data. While the CO widths agree overall withthe H I, they do have a greater scatter, which may maketheir use in the TFR difficult.
4. SUMMARY
1. We observed 44 galaxies in the 12CO (J \ 1È0) 115GHz transition in order to eventually perform a calibrationof the Tully-Fisher relation based on CO line widths. Wedetected 40 of the galaxies.
2. In agreement with previous studies, we Ðnd that themolecular and atomic gas masses show only a broad corre-lation. The molecular-to-atomic gas mass ratios for thissample are consistent with lower luminosity systems, i.e.,those with The averageL tot \ L FIR] L
B\ 6 ] 1010 L
_.
molecular gas mass in the sample is 2.8] 109 which isM_
,roughly that of the Milky Way. Only one galaxy (UGC6661) has greater than 3 times the molecular gas mass of theMilky Way.
3. The ratios for the galaxies in this sampleL FIR/M(H2)further show no galaxies that are obviously interacting or inany way enhanced in the infrared.
4. We Ðnd no signiÐcant trends relating to a galaxyÏsdistance from the cluster core.
5. The CO line widths agree with the H I widths. Thelack of any systematic or even signiÐcant di†erencesbetween the CO and H I widths, combined with the com-plete ordinariness of the sample galaxies in other respects,leads one to be hopeful that CO will prove useful in theTFR. It is, however, possible that the lower signal-to-noiseratio typical of CO spectra and the greater scatter in COwidths will be problematic in the TFR.
The authors wish to thank the NRAO sta† for theirfriendly assistance with observations and, in particular,Simon Radford and Je† Mangum for their useful advice inplanning observations, and the several telescope operatorswho expertly bent the telescope to our will. In addition,many thanks go to Jennifer Mack for her help in observing,and we are deeply indebted to Lawrence Rudnick for hisadvice and insights. This research has made extensive use ofthe NASA/IPAC Extragalactic Database (NED).
REFERENCESA., Gavazzi, G., Combes, F., Lequeux, J., & Casoli, F. 1994, A&A,Boselli,
285, 69J., & Combes, F. 1992, A&A, 264,Braine, 433J., Combes, F., Casoli, F., Dupraz, C., Ge� rin, M., Klein, U., Wiele-Braine,
binski, R., & Brouillet, N. 1993, A&AS, 97, 887F., Boisse� , P., Combes, F., & Dupraz, C. 1991, A&A, 249,Casoli, 359F., Dickey, J., Kazes, I., Boselli, A., Gavazzi, G., & Baumgardt, K.Casoli,
1996a, A&A, 309, 43 (C96a)F., Dickey, J., Kazes, I., Boselli, A., Gavazzi, G., & Jore, K. 1996b,Casoli,
A&AS, 116, 193 (C96b)R., Kru� gel, E., & Lemke, R. 1996, A&AS, 118,Chini, 47
F. 1991, ARA&A, 29,Combes, 195Vaucouleurs, G., de Vaucouleurs, A., Corwin, H. G., Jr., Buta, R. J.,de
Paturel, G., & Fouque� , P. 1991, Third Reference Catalogue of BrightGalaxies (New York : Springer)
J. M., & Kazes, I. 1992, ApJ, 393,Dickey, 530T., Booth, R. S., Ho� glund, B., Johansson, L. E. B., & Sandqvist,Elfhag, A� .
1996, A&AS, 115, 439R., & Haynes, M. P. 1985, ApJ, 292,Giovanelli, 404
W. K., & Richter, O.-G. 1989, A General Catalog of HIHuchtmeier,Observations of Galaxies (New York : Springer) (HR89)
J. B. 1989, AJ, 98,Hutchings, 524
J. D. P., & Young, J. S. 1989, ApJ, 344,Kenney, 171T. E., & Dickey, J. M. 1997, AJ, 114, 2437Lavezzi, (LD97)1998, inÈÈÈ. preparationT. E., et al. 1998, inLavezzi, preparation
B. M. 1983, AJ, 88,Lewis, 962I. F., Booth, R. S., Garay, G., Johansson, L. E. B., & Sanders,Mirabel,
D. B. 1990, A&A, 236, 327M. J., & Tully, R. B. 1988, ApJ, 330,Pierce, 5791992, ApJ, 387,ÈÈÈ. 47D. J. 1995, Ph.D. thesis, Univ. California,Schlegel, Berkeley
F., & Sofue, Y. 1994, A&A, 283,Scho� niger, 21P. M., Downes, D., Radford, S. J. E., & Barrett, J. W. 1997, ApJ,Solomon,
478, 144P. M., & Sage, L. J. 1988, ApJ, 334,Solomon, 613
A. W., et al. 1988, A&A, 207,Strong, 1R. B., & Fisher, J. R. 1977, A&A, 54,Tully, 661
Driel, W., van den Broek, A. C., & Baan, W. A. 1995, ApJ, 444,van 80J. S. 1990, in The Interstellar Medium in Galaxies, ed. H. A. Thron-Young,
son, Jr., & J. M. Shull (Dordrecht : Kluwer), 67 (Y90)J. S., & Knezek, P. M. 1989, ApJ, 347,Young, L55J. S., & Scoville, N. Z. 1991, ARA&A, 29,Young, 581J. S., et al. 1995, ApJS, 98,Young, 219