hi observations of nearby galaxies · 470 w.k. huchtmeier et al.: hi observations of nearby...
TRANSCRIPT

ASTRONOMY & ASTROPHYSICS FEBRUARY I 2000, PAGE 469
SUPPLEMENT SERIES
Astron. Astrophys. Suppl. Ser. 141, 469–490 (2000)
HI observations of nearby galaxies
I. The first list of the Karachentsev catalog
W.K. Huchtmeier1, I.D. Karachentsev2, V.E. Karachentseva3, and M. Ehle4
1 Max-Planck-Institut fur Radioastronomie, Auf dem Hugel 69, D-53121 Bonn, Germany2 Special Astrophysical Observatory, Russian Academy of Sciences, N. Arkhyz, KChR, 357147, Russia3 Astronomical Observatory of Kiev University, Kiev, Ukraine4 Max-Planck-Institut fur Extraterrestrische Physik, Giessenbachstraße, D-85740 Garching bei Munchen, Germany
Received September 14; accepted November 16, 1999
Abstract. We present HI observations of the galaxiesin the first list of the Karachentsev catalog of previ-ously unknown nearby dwarf galaxies (Karachentseva &Karachentsev 1998). This survey covers all known nearbygalaxy groups within the Local Volume (i.e. within10 Mpc) and their environment, that is about 25% ofthe total sky. A total of 257 galaxies have been observedwith a detection rate of 60%. We searched a frequencyband corresponding to heliocentric radial velocities from−470 km s−1 to ∼+4000 km s−1. Non-detections areeither due to limited coverage in radial velocity, confusionwith Local HI (mainly in the velocity range −140 km s−1
to +20 km s−1), or lack of sensitivity for very weakemission. 25% of the detected galaxies are located withinthe Local Volume. Those galaxies are dwarf galaxiesjudged by their optical linear diameter (1.4 ± 0.2 kpc onthe average), their mean total HI mass (4.6 107 M�), andtheir observed linewidths (39 km s−1).
Key words: galaxies: distances and redshifts; dwarf;fundamental parameters; general
1. Introduction
The only way to study the smallest galaxies is tosearch for them in our cosmic neighborhood. The firstsystematic catalog of nearby galaxies was prepared byKraan-Korteweg & Tammann (1979) who collectedall known galaxies with corrected radial velocities v0
≤ 500 km s−1, a total of 179 objects (hereafter calledthe KKT sample). Since that time the number of knowngalaxies within the Local Volume (i.e. within a distance
Send offprint requests to: W.K. Huchtmeier,e-mail: [email protected]
of 10 Mpc) increased to 303 objects (Karachentsev et al.1999). For the past decade the initial KKT sample hasbeen increased almost two times in number due to themass redshift surveys of galaxies from the known cata-logues, revealing new nearby galaxies in the Milky Way“Zone of Avoidance”, as well as special searches for dwarfgalaxies in nearby groups. The increasing numbers ofgalaxies in the Local Volume is mainly due to many newdwarf galaxies. This fact demonstrates how incompleteour knowledge about the galaxy population of even theLocal Volume is.
A couple of years ago Karachentseva & Karachentsev(1998; hereafter KK98) initiated an all-sky search for can-didates for new nearby dwarf galaxies using the secondPalomar Sky Survey and the ESO/SERC plates of thesouthern sky. The results of the first two segments of thesurvey have been published, they cover large areas aroundthe known galaxy groups in the Local Volume (KK98) andthe area of the Local Void (Karachentseva et al. 1999). Ina next step to derive distances we will measure radial ve-locities. Later on we will aim for more exact photometricdistances. In this paper we present the first follow-up ob-servations, the HI search for the galaxies in KK98. The HIsearch for dwarf irregular galaxies seems quite efficient asthese galaxies are HI rich in general and with adequate ve-locity resolution, say 5 km s−1, all the HI of a given galaxywill be within a few velocity channels. The characteris-tic signature of a dwarf galaxy profile, a nearly gaussianstructure, is different from radio interference and easilywill lead to a good signal-to-noise ratio.
2. Observations
Observations were performed with three different radiotelescopes for different declination ranges. The 100-m ra-diotelescope at Effelsberg was used for declinations greater

470 W.K. Huchtmeier et al.: HI observations of nearby galaxies. I.
kk2
0.0 800.0-0.030
0.000
0.030
0.060kk16
0.0 800.0
0.000
0.020
0.040kk17
0.0 800.0
-0.020
0.000
0.020kk25
1600.0 2400.0
0.000
0.030
0.060
U2773
0.0 800.0
0.000
0.200
kk265
800.0 1600.0
0.000
0.080
0.160kk266
800.0 1600.0
0.000
0.300
0.600 kk30
800.0 1600.0
-0.010
0.000
0.010
0.020
kk267
800.0 1600.0
0.000
0.030
0.060
kk35
0.0 800.0
0.000
0.030
0.060
kk36
800.0 1600.0
0.000
0.020
0.040
kk37
800.0 1600.0
-0.010
0.000
0.010
0.020
kk268
800.0 1600.0
0.000
0.030
0.060kk39
800.0 1600.0
0.000
0.020kk270
800.0 1600.0
0.000
0.050
0.100 kk48
1600.0 2400.0-0.040
0.000
0.040
0.080
kk49
0.0 800.0
0.000
0.100
kk50
1600.0 2400.0
-0.010
0.000
0.010
0.020 kk52
800.0 1600.0
0.000
0.040
0.080kk54
0.0 800.0
0.000
0.080
kk57
800.0 1600.0
0.000
0.040
0.080kk62
3200.0 4000.0
0.000
0.020
0.040kk64
3200.0 4000.0
-0.010
0.000
0.010
0.020
0.030
kk65
0.0 800.0
0.000
0.050
0.100
kk66
3200.0 4000.0
-0.010
0.000
0.010
0.020
kk69
0.0 800.0
0.000
0.080
0.160 kk75
3200.0 4000.0
-0.020
0.000
0.020 U5005
3200.0 4000.0
0.000
0.040
0.080
kk78
0.0 800.0
0.000
0.100
0.200 kk79
800.0 1600.0-0.020
0.000
0.020 kk82
0.0 800.0
0.000
0.080
0.160 kk82
3200.0 4000.0
0.000
0.020
0.040
Fig. 1. HI profiles observed with the 100-m radio telescope at Effelsberg which has a HPBW of 9.′3 at a wavelength of 21 cm.Observations were obtained in the total power mode [ON – OFF] which yields a residual of the Local HI emission around0 km s−1. The profiles are arranged in ascending R.A. starting at the bottom left corner

W.K. Huchtmeier et al.: HI observations of nearby galaxies. I. 471
kk90
800.0 1600.0
0.000
0.020
0.040
kk92
800.0 1600.0
0.000
0.030
kk94
800.0 1600.0
0.000
0.030
kk98
800.0 1600.0-0.008
0.000
0.008
kk102
3200.0 4000.0
-0.010
0.000
0.010
0.020 kk104
800.0 1600.0
-0.010
0.000
0.010
0.020kk105
800.0 1600.0
0.000
0.020kk108
800.0 1600.0
0.000
0.040
0.080
kk109
0.0 800.0
0.000
0.030
0.060kk111
800.0 1600.0-0.020
0.000
0.020
0.040 kk115
800.0 1600.0
-0.020
0.000
0.020
0.040kk116
800.0 1600.0
0.000
0.080
kk117
800.0 1600.0-0.010
0.000
0.010kk119
800.0 1600.0-0.020
0.000
0.020 kk122
800.0 1600.0
-0.020
0.000
0.020
0.040kk126
800.0 1600.0
0.000
0.020
kk127
0.0 800.0
0.000
0.030
kk128
800.0 1600.0
0.000
0.020 U7298
0.0 800.0
0.000
0.100
0.200 kk137
0.0 800.0
0.000
0.030
0.060
kk138
3200.0 4000.0
0.000
0.030kk139
800.0 1600.0
0.000
0.030
0.060 kk140
800.0 1600.0
0.000
0.030
0.060kk141
0.0 800.0
0.000
0.030
kk143
800.0 1600.0
0.000
0.050
0.100 kk144
0.0 800.0
0.000
0.100
0.200kk145
800.0 1600.0
0.000
0.030
0.060kk148
0.0 800.0
0.000
0.050
0.100
kk149
0.0 800.0-0.030
0.000
0.030
0.060kk151
0.0 800.0
0.000
0.040
0.080kk152
800.0 1600.0
0.000
0.030
0.060 N4523
0.0 800.0
0.000
0.100
0.200
Fig. 1. continued

472 W.K. Huchtmeier et al.: HI observations of nearby galaxies. I.
I3521
800.0 1600.0
-0.010
0.000
0.010 kk154
0.0 800.0
0.000
0.030
kk158
0.0 800.0
-0.020
0.000
0.020kk159
800.0 1600.0-0.020
0.000
0.020
0.040
kk159
1600.0 2400.0-0.020
0.000
0.020
0.040kk160
0.0 800.0
0.000
0.030
kk161
1600.0 2400.0
-0.010
0.000
0.010
0.020 kk164
800.0 1600.0
0.000
0.100
0.200
kk167
800.0 1600.0
0.000
0.030
kk168
1600.0 2400.0
0.000
0.030
kk169
1600.0 2400.0
-0.030
0.000
0.030KK170
0.0 800.0
0.000
0.030
kk172
0.0 800.0
-0.030
0.000
0.030kk175
800.0 1600.0
0.000
0.040
0.080 kk176
800.0 1600.0
0.000
0.050
0.100kk181
1600.0 2400.0
0.000
0.030
kk187
1600.0 2400.0
-0.020
0.000
0.020
0.040kk191
0.0 800.0
0.000
0.030
kk192
800.0 1600.0
-0.020
0.000
0.020 kk200
0.0 800.0
0.000
0.030
0.060
kk212
800.0 1600.0
-0.020
0.000
0.020kk216
800.0 1600.0
0.000
0.050
0.100kk220
800.0 1600.0-0.020
0.000
0.020kk223
1600.0 2400.0
0.000
0.030
0.060
kk224
800.0 1600.0
-0.020
0.000
0.020 kk228
1600.0 2400.0
0.000
0.030kk230
0.0 800.0
0.000
0.080
0.160kk232
3200.0 4000.0
0.000
0.020
kk233
800.0 1600.0
0.000
0.030
0.060kk238
1600.0 2400.0-0.020
0.000
0.020
Fig. 1. continued

W.K. Huchtmeier et al.: HI observations of nearby galaxies. I. 473
Fig. 2. HI profiles observed with the Nancay radio telescope (HPBW of 3.′6× 22′ for the declination range in question)
than −31◦, the Nancay radio telescope was selected forgalaxies in the declination range −38◦ ≤ −31◦, and thecompact array of the Australia Telescope was used forgalaxies south of −38◦.
2.1. Effelsberg observations
The radio telescope at Effelsberg has been used in the to-tal power mode (ON – OFF) combining a reference field5 min earlier in R.A. with the on-source position. A dualchannel HEMT receiver had a system noise of 30 K.
The 1024 channel autocorrelator was split into 4 bands(bandwidth 6.25 MHz) of 256 channels each shifted in fre-quency by 5 MHz with respect to their neighbor in orderto cover a velocity range from −470 to 3970 km s−1 over-lapping 1.5 MHz between channels. The resulting chan-nel separation was 5.1 km s−1 yielding a resolution of6.2 km s−1 (10.2 km s−1 after Hanning smoothing). TheHI profiles observed with the 100-m radiotelescope are pre-sented in Fig. 1 in order of increasing R.A. as in Table 1.The half power beam widths (HPBW) of the Effelsbergtelescope at this wavelength is 9.′3.
2.2. Nancay observations
For 15 galaxies in the declination range −38◦ ≤ −31◦ theNancay radio telescope was used with the same velocityresolution and coverage. Major differences to the descrip-tion given for the Effelsberg observations were a differentsystem noise (45 K), a different antenna beam (3.′6× 22′
in R.A. and Dec. for this declination range), and shorterintegration phases with a cycle of 2 minutes for the ONand the OFF positions. Nine galaxies have been detected(Fig. 2).
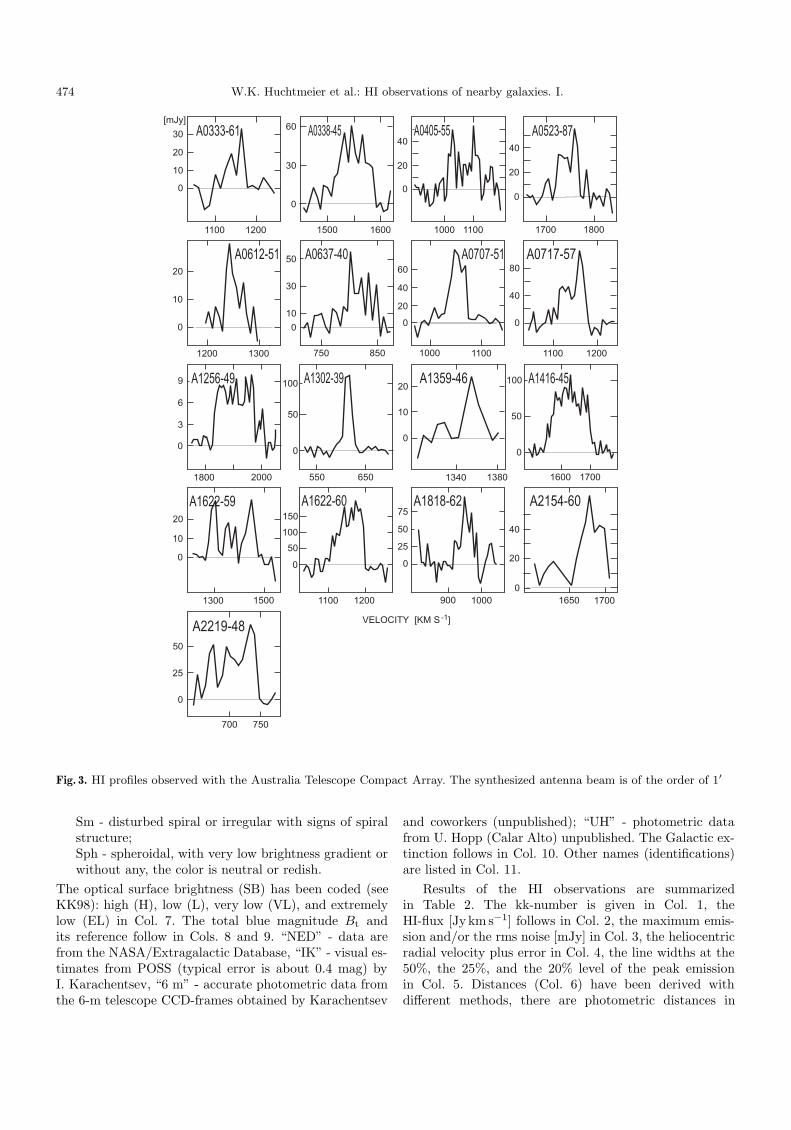
2.3. Compact Array of the Australia Telescope
40 of the 57 galaxies south of declination −38◦ havebeen observed with the Compact Array of the Australia
Telescope. For this HI search we have chosen the 750Aantenna array configuration in order to yield an antennabeam comparable to the optical size of the smallestgalaxies (i.e. ∼ 1′). The frequency setup and correlatorconfiguration was such that we obtained a velocity cover-age from −450 to +2900 km s−1 and a channel separationof 6.6 km s−1 (i.e. a resolution of 7.9 km s−1). Eachgalaxy was observed for 10 min every few hours. Withfive to six observations per target position we achieveda regular coverage of the uv plane for these “snapshotmode” observations. The resulting integrated HI profilesare given in Fig. 3 (for a more detailed discussion ofthese data see Huchtmeier et al. in preparation). We maymiss some flux with the interferometer (missing flux) asthe observed HI emission extends over more than 2′ perchannel for over 60% of the galaxies. Galaxies from thekk98 sample not observed are: kk 11, kk 63, kk179, kk 184,kk 189, kk 190, kk 197, kk 203, kk 211, kk 213, kk 214,kk 217, kk 221, kk 222, kk 235, kk 244, kk 248.
3. The data
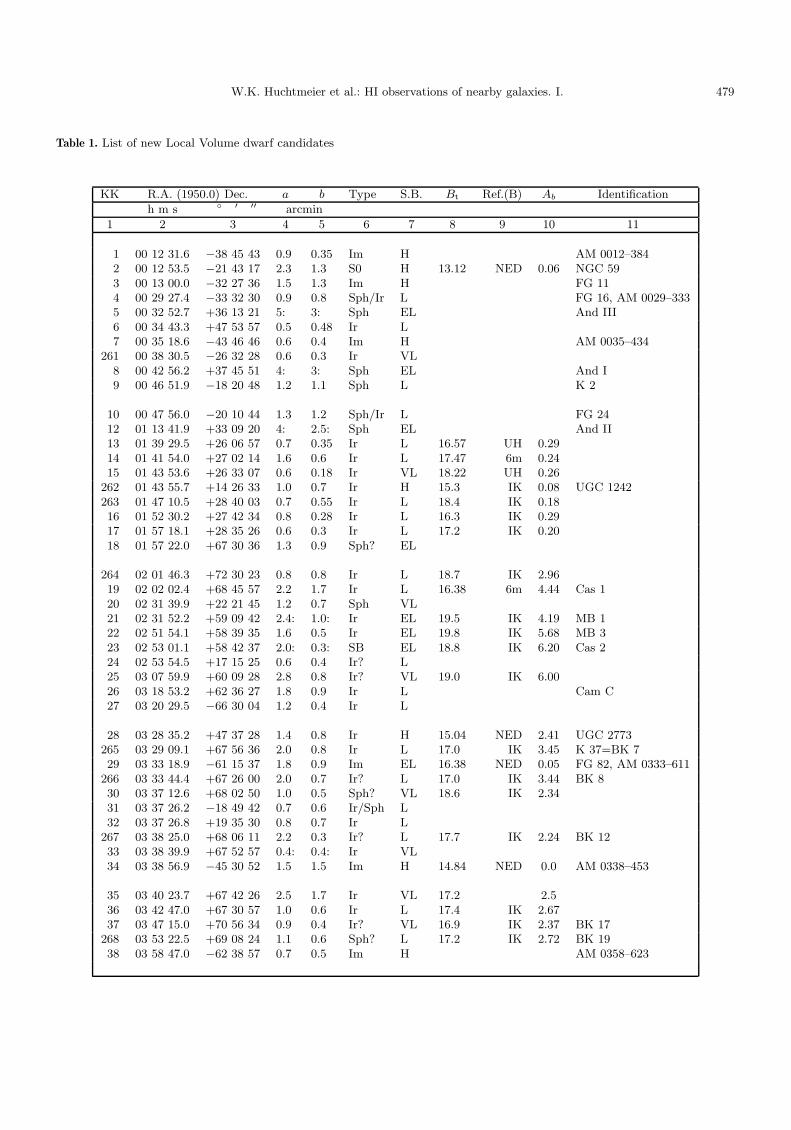
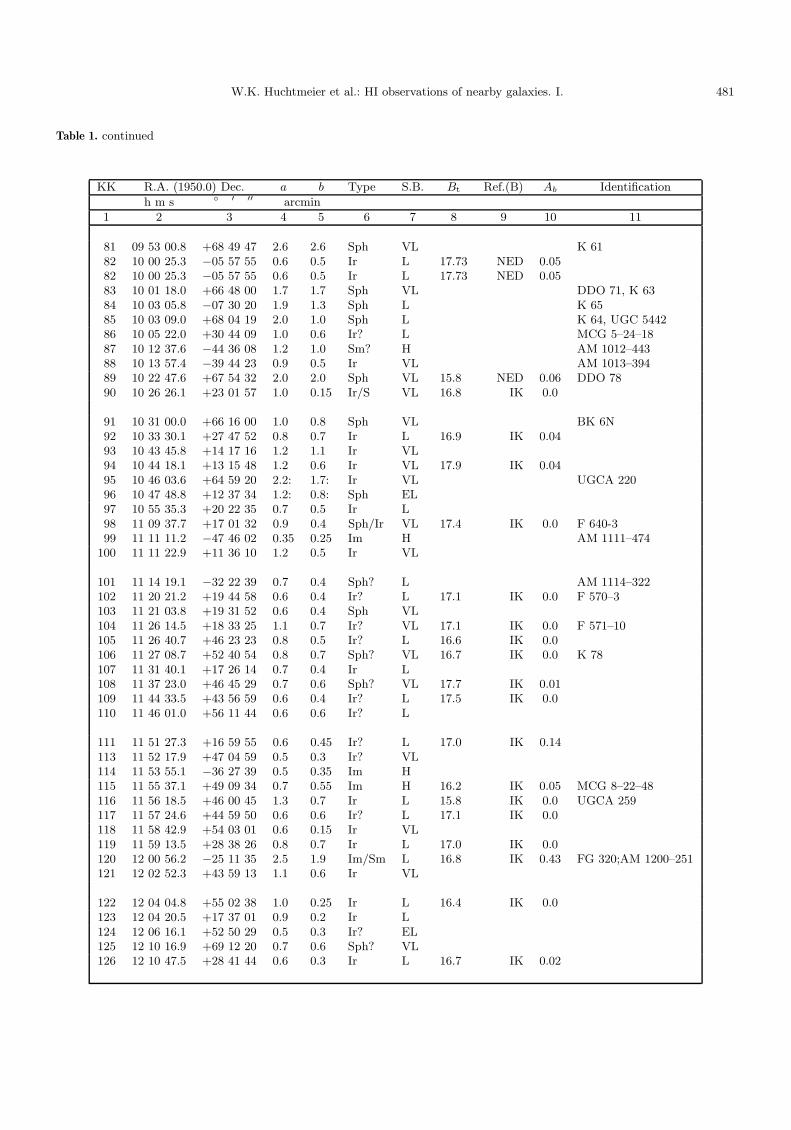
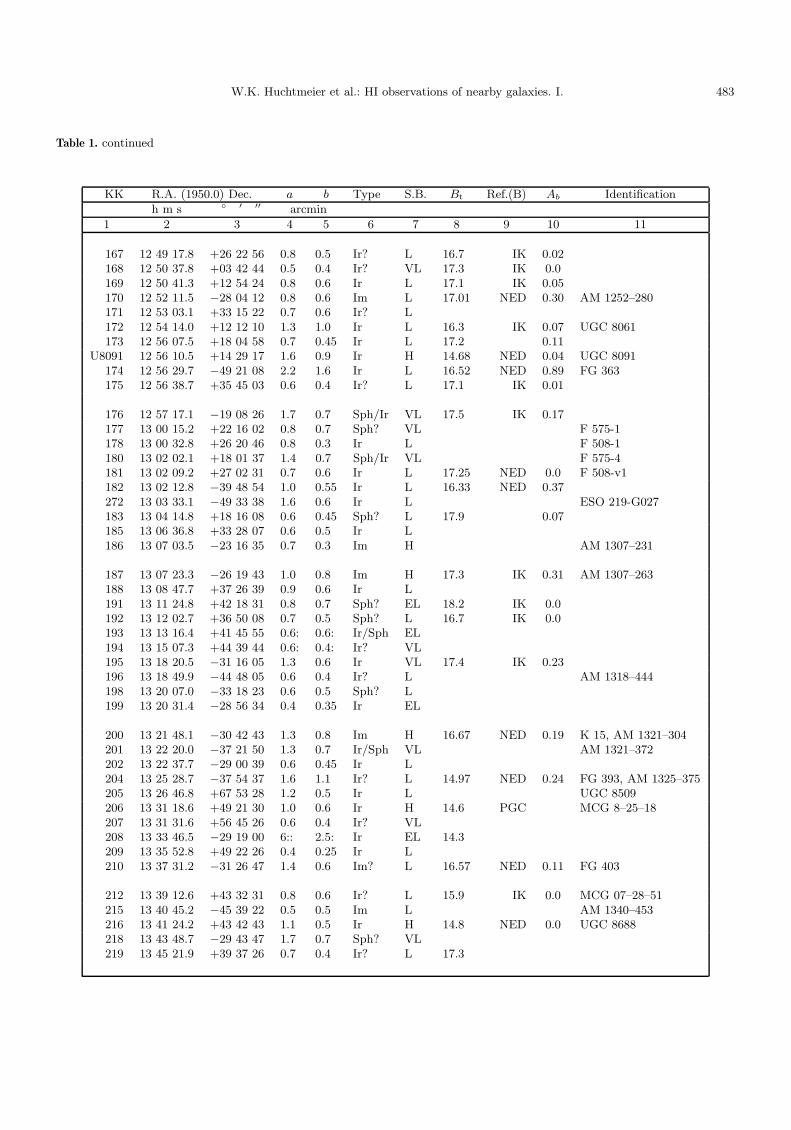
Our search list was an early version of the list of KK98containing a few additional galaxies which did not make itinto the final version because of their morphology and/orsize (i.e. they were too small). Particularly, we took intoaccount the results of HI searches for nearby dwarf galax-ies made by Kraan-Korteweg et al. (1994), Huchtmeieret al. (1995), Burton et al. (1996), Huchtmeier & van Driel(1996), Huchtmeier et al. (1997) and Cote et al. (1997).The optical data of our galaxies are given in Table 1.The kk-number (or other identification if there is no kk-number) is given in Col. 1, R.A. and Dec. (1950) followin Cols. 2 and 3. The optical diameters a and b in thede Vaucouleurs (D25) system follow in Cols. 4 and 5, themorphological type in Col. 6 where we use the followingcoding:
Im - irregular blue object with bright knot(s);Ir - irregular without knots or with amorphous con-densations, the colour is neutral or bluish;
474 W.K. Huchtmeier et al.: HI observations of nearby galaxies. I.
Fig. 3. HI profiles observed with the Australia Telescope Compact Array. The synthesized antenna beam is of the order of 1′
Sm - disturbed spiral or irregular with signs of spiralstructure;Sph - spheroidal, with very low brightness gradient orwithout any, the color is neutral or redish.
The optical surface brightness (SB) has been coded (seeKK98): high (H), low (L), very low (VL), and extremelylow (EL) in Col. 7. The total blue magnitude Bt andits reference follow in Cols. 8 and 9. “NED” - data arefrom the NASA/Extragalactic Database, “IK” - visual es-timates from POSS (typical error is about 0.4 mag) byI. Karachentsev, “6 m” - accurate photometric data fromthe 6-m telescope CCD-frames obtained by Karachentsev
and coworkers (unpublished); “UH” - photometric datafrom U. Hopp (Calar Alto) unpublished. The Galactic ex-tinction follows in Col. 10. Other names (identifications)are listed in Col. 11.
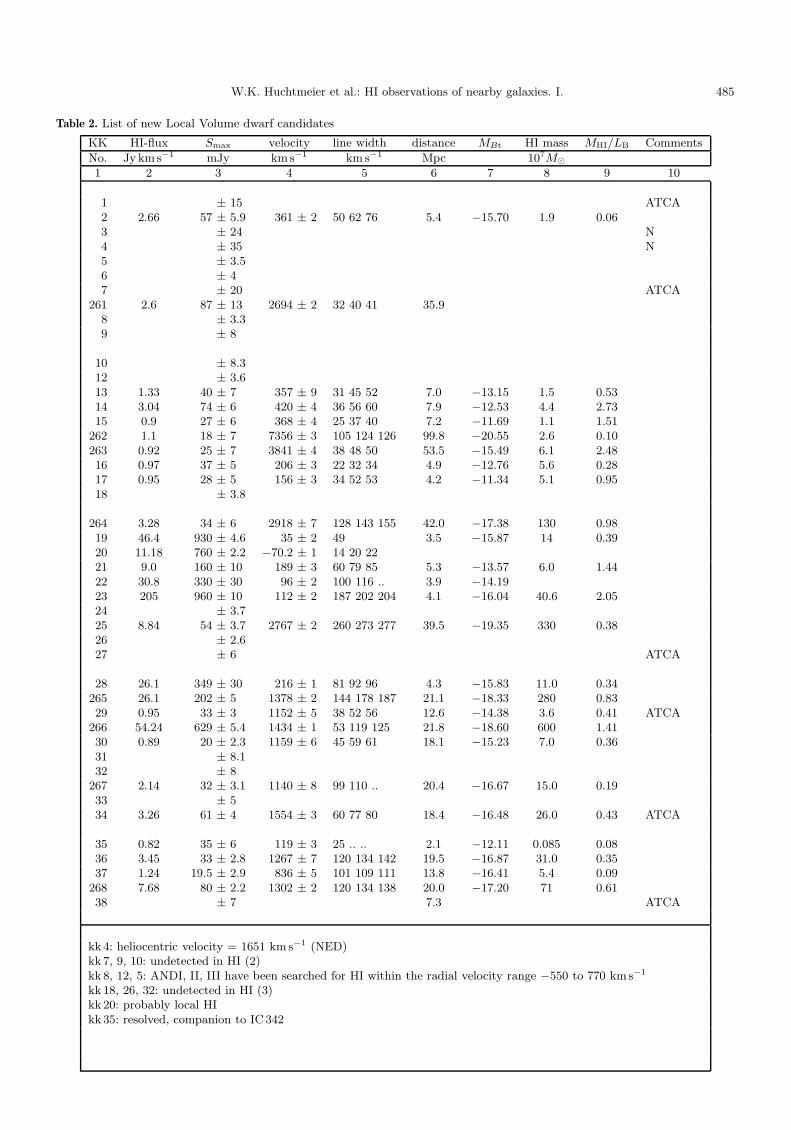
Results of the HI observations are summarizedin Table 2. The kk-number is given in Col. 1, theHI-flux [Jy km s−1] follows in Col. 2, the maximum emis-sion and/or the rms noise [mJy] in Col. 3, the heliocentricradial velocity plus error in Col. 4, the line widths at the50%, the 25%, and the 20% level of the peak emissionin Col. 5. Distances (Col. 6) have been derived withdifferent methods, there are photometric distances in

W.K. Huchtmeier et al.: HI observations of nearby galaxies. I. 475
Fig. 4. The histogram shows the number of galaxies per ve-locity interval of 200 km s−1. The distribution of corrected ra-dial velocities (v0) of our galaxy sample demonstrates the localcharacter of these galaxies
some cases, in other cases the group membership yieldsa distance. If no other distance estimate is available, weassumed a Hubble constant of 75 km s−1 Mpc−1 to derivea “kinematic” distance. The absolute magnitude is givenin Col. 7, the integrated HI mass (Col. 8) was calculatedas (e.g. Roberts 1969)
(MHI/M�) = 2.355 105 ×D2 ×∫Svdv
where D is the distance of the galaxy in Mpc and∫Svdv
is the integrated HI flux in Jy km s−1. The relative HI con-tent MHI/LB follows in Col. 9. Finally, Col. 10 containscomments relative to the telescope used for the observa-tion: unless otherwise noted observations have been per-formed with the 100-m radiotelescope at Effelsberg, N -marks the Nancay radio telescope, ATCA - the AustraliaTelescope Compact Array at Culgoora, NSW.
In a number of cases emission at negative radial veloc-ities has been observed (kk 20, kk 236, kk 237; only kk 236has been plotted as an example). The Dwingeloo HI survey(Hartmann & Burton 1997) has been consulted: in allcases of negative radial velocities extended HI emissionwas found suggesting that we observed high velocityclouds in our Galaxy.
4. Discussion
A great majority (73%) of our galaxies are of type Im (26)and Ir (162), about 20% are of type Sph/Ir (12) and Sph(39), while the rest of 8% is a collection of different typesfrom spiral to Im/Sm and BCD. The detection rate ofour sample galaxies depends on the morphological type.
Fig. 5. The distribution of the optical linear diameter A0 inkpc for the whole sample in the de Vaucouleurs (D25) systemis given here. Galaxies within 10 Mpc (i.e. within the LocalVolume) are shown by shaded areas. The medium value forthe shaded areas is 1.4± 0.2 kpc
75% of the spirals (type S0 to Sm/Im and BCD) weredetected; the detection rate for types Im and Ir is verysimilar close to 60%, whereas the detection rate for typesSph/Ir and Sph is considerable lower at 33 and 23%, re-spectively. The detection rate depends on the optical sur-face brightness (SB) class, too. From high SB to low, verylow, and extremely low SB the detection rate decreasesfrom 70% to 58%, 49%, and 43%, respectively. This trendreflects the type dependence and the fact that we dealwith fainter galaxies as we descend from high SB to verylow SB, the median absolute magnitudes for the detectedgalaxies change from −15.43 (H) to −13.92 (VL) for ourbrightness classes.
A number of the galaxies within the present sampleare associated with nearby groups of galaxies (e.g. Tully1988) according to their position, radial velocity and rel-ative resolution:
NGC 672 group: kk 13, kk 14, kk 15;NGC 784 group: kk 16, kk 17;Maffei group: kk 19, kk 21, kk 22, kk 23, kk35 kk 44;Orion group: kk 49;M 81 group: kk 81, kk 83, kk 85, kk 89, kk 89, kk 91;Leo group: kk 94;CVn cloud: kk 109, UGC 7298, kk 137, kk 141, kk 144,kk 148, kk 149, kk 151, kk 154, kk 158, kk 160, kk 191,kk 206, kk 220, kk 230;Centaurus group: kk 170, kk 179, kk 182, kk 190,kk 191, kk 195, kk 197, kk 200, kk 211, kk 217, kk 218;NGC 6946 group: kk 250, kk 251, kk 252;

476 W.K. Huchtmeier et al.: HI observations of nearby galaxies. I.
Fig. 6. The total mass of neutral hydrogen MHI of the galax-ies in our sample is plotted versus the linear extent (in kpc).The full line represents the regression line for the KKT sample(Huchtmeier & Richter 1988)
Virgo cluster: kk 111, kk 127, kk 128, kk 140,NGC 4523, IC3517, kk 164, kk 168, kk 169, kk 172,kk 173, U 8091.
There are a few cases of high MHI/LB values in Table 2.Four of the five galaxies with MHI/LB ≥ 5 are actuallyfound to be confused by emission from nearby galaxies(see footnotes to Table 2).
The present sample of galaxies as presented in Tables 1and 2 will be discussed now in some detail with the help ofglobal parameters. The distribution of radial velocity (v0,corrected for the rotation of our galaxy) is given in Fig. 4.Apart from a few background objects most of the galax-ies belong to the local supercluster, about 25% are withinthe Local Volume. From this situation it is clear that thegreat majority of the galaxies in the present sample aredwarfish in nature. This will be shown more convincinglybelow when we compare several other global parametersof these objects.
Next we will look at the optical linear diameter A0
(in kpc). The histogram in Fig. 5 presents the number ofgalaxies binned in intervals of 0.5 kpc width. The dis-tribution of the optical linear diameters of our galaxiesextends from 0.2 kpc to 26 kpc, yet the great majorityis smaller than 8 kpc in diameter (in the de VaucouleursD25 system). Galaxies in the Local Volume (indicated byshaded areas) are even smaller with a median value of 1.4± 0.2 kpc.
Now we will use the correlation of two global param-eters to compare the present sample of galaxies with thepreviously known galaxies in the Local Volume. In Fig. 6the total mass of neutral hydrogen MHI of the galaxiesis plotted versus their linear extent A0 for this sample ofgalaxies. The full line is the regression line for the KKTsample (Huchtmeier & Richter 1988). This regression lineseems to be an excellent fit for the present sample, too.
Fig. 7. The distribution of line widths of our galaxy sample isgiven for the observed values (dv) in the upper panel and forthe (for inclination corrected values (dvi) in the lower panel.Galaxies within the Local Volume (i.e. within 10 Mpc) aremarked by the shaded areas
The average HI mass of the galaxies in the Local Volumeis 4.6 107 M�.
The HI masses in Fig. 6 cover a range from 106 to 1010
solar masses. The HI luminosity function for galaxies hasbeen studied with galaxies of 107 and more solar masses inHI so far. With the data of the new dwarf galaxies withinthe Local Volume we will be able in the end to discuss theHI luminosity function starting from 106 solar masses.
The galaxies in our sample have small line widths onthe average. In Fig. 7 we present the distribution of ob-served line widths in the upper panel and the (for inclina-tion) corrected line widths in the lower panel. The opticalaxial ratio has been used here to derive the inclination.Galaxies within the Local Volume are indicated by theshaded areas. The peak of the line width distribution ofthe galaxies within the Local Volume is 39 km s−1 for theuncorrected and 47 km s−1 for the corrected line widths.
The three global parameters we have considered sofar point altogether toward the dwarfish character of theLocal Volume objects in our sample: the average lineardiameter of 1.4 ± 0.2 kpc (Fig. 5), the mean total HImass of 4.6 107 M� and the small line width of less than50 km s−1.
Two more global parameters are shown in Fig. 8,pseudo HI surface density ΣHI and the relative HI contentMHI/MT. The pseudo HI surface density is obtained bydividing the total HI mass MHI of the galaxy by the diskarea of the galaxy as defined by its optical diameter A0.This quantity is given in units of solar mass per square

W.K. Huchtmeier et al.: HI observations of nearby galaxies. I. 477
Fig. 8. The pseudo column density of neutral hydrogen (ΣHI
in M� pc−2) of our sample as plotted versus the relative HI-content (MHI/MT)
parsec as well as in the usual HI column density NHI inatoms cm−2. This quantity is plotted versus the relativeHI content MHI/MT. Our galaxies fill the usual range inHI surface density as well as in relative HI content as ob-served for normal galaxies (e.g. HR). The present sampleof galaxies is relatively rich in HI. Some of the scatter inthe diagram is due to uncertainties in observed quantities,especially the inclination which is used to correct the linewidth which itself enters the total mass calculation by thesquare. The optical diameters are uncertain for galaxiesat low galactic latitudes due to the high foregroundextinction, e.g. Cas 2, ESO 137–G27, BK12, ESO 558–11.If we exclude the confused galaxies and those withheavy galactic extinction all entries in Fig. 8 with ΣHI ≥100 M� pc−2 are gone. Low values of the HI surface den-sity are not only due to the uncertainties of observationaldata, the gas content of dwarf galaxies is very sensitive tooutside influences (tidal interactions) due to their shallowgravitational potential.
Finally we plot the HI surface brightness versus theoptical surface brightness (Fig. 9). The surface brightnessclass (Table 1, Col. 7) has been coded from 4 to 1 fromhigh SB to extremely low SB in steps of 1. The differenterrors of the mean values of each class essentially dependon the different population size of each SB class. However,there is a definite trend of the HI surface density to growwith increasing optical SB by a factor of 2 to 4 (e.g. vander Hulst et al. 1993; de Blok 1997).
5. Conclusion
In this paper we presented an HI search for 257 candi-dates for nearby dwarf galaxies. A detection rate of 60%on the average is quite high keeping in mind the limitedvelocity band and the fact that single-dish telescopes areliterally “blind” for weak emission in the velocity range of
Fig. 9. This figure presents a correlation between the pseudoHI column density with the optical surface brightness of thegalaxy in our actual sample. The surface brightness class istaken from KK98; 1 = extremely low, 2 = very low, 3 = low,1 = high SB. The error bars correspond to twice the rms errorof the mean of each SB class
the local HI emission (i.e. within −140 to +20 km s−1) andfor 20% of HI-poor (spheroidal and Sph/Ir) objects in thesample. Most of the detected galaxies are located withinthe local supercluster, and about 25% are members of theLocal Volume. The dwarfs within the Local Volume havea mean linear diameter of 1.4± 0.2 kpc, a mean observedlinewidths of 39 km s−1, and a mean total HI mass of 4.6107 M�. The smallest galaxies have HI masses of just over106 solar masses. Once this full-sky survey will be finishedwe will be able to discuss the luminosity function of theLocal Volume including these tiny dwarf galaxies. This in-vestigation is especially needed as recent determinationsof the galaxy luminosity function exhibit an increase forlow mass objects. The exact value of this increase willbe important for deriving the mass density in the localuniverse.
Acknowledgements. The Australia Telescope is funded bythe Commonwealth of Australia for operation as a NationalFacility managed by CSIRO.
The Nancay Radio Astronomy Observatory is the UniteScientifique de Nancay of the Observatoire de Paris, associ-ated as Unite de Service et de Recherche (USR) No. B704to the French Centre National de la Recherche Scientifique(CNRS). The Observatory also gratefully acknowledges the fi-nancial support of the Conseil Regional of the Region Centrein France.
This research has made use of the NASA/IPACExtragalactic Database (NED) which is operated by theJet Propulsion Laboratory, California Institute of Technology,under contract with the National Aeronautics and SpaceAdministration.

478 W.K. Huchtmeier et al.: HI observations of nearby galaxies. I.
This work has been partially supported by the DeutscheForschungsgemeinschaft (DFG) under project No. 436 RUS113/470/0 and Eh 154/1-1.
References
Burton W.B., Verheijen E.B., Kraan-Korteweg R.C., HenningP.A., 1996, A&A 293, L33
Cote S., Freeman K.C., Carignan C., Quinn P.J., 1997, AJ 114,1313
de Blok W.J.G., 1997, Ph.D. Thesis, University of GroningenGallagher J.S., Littleton J.E., Mathews L.D., 1995, AJ 109,
2003Hartmann D., Burton W.B., 1997, Atlas of Galactic Neutral
Hydrogen. Cambridge University Press, CambridgeHuchra J., 1995, A catalog of galaxy redshiftsHuchtmeier W.K., Bohnenstengel H.-D., 1981, A&A 100, 72Huchtmeier W.K., Lercher G., Seeberger R., Saurer W.,
Weinberger R., 1995, A&A 293, L33Huchtmeier W.K., van Driel W., 1996, A&A 305, L25Huchtmeier W.K., Karachentsev I.D., Karachentseva V.E.,
1997, A&A 322, 375
Huchtmeier W.K., Richter O.G., 1988, A&A 203, 237 (HR)Huchtmeier W.K., Richter O.-G., 1989, A general catalog of
HI observations of galaxies. Springer-Verlag, New Yorkvan der Hulst J.M., Skillman E.D., Smith T.R., Bothun G.D.,
McGaugh S.S., de Blok W.J.G., 1993, AJ 106, 548Karachentsev I.D., Makarov D.I., Huchtmeier W.K., 1999,
A&AS (in press)Karachentseva V.E., Karachentsev I.D., 1998, A&AS 127, 409Karachentseva V.E., Karachentsev I.D., Richter G.M., 1999,
A&AS 135, 221Kraan-Korteweg R.C., Tammann G.A., 1979, Astron. Nachr.
300, 181 (KKT)Kraan-Korteweg R.C., Loan A.J., Burton W.B., et al., 1994,
Nat 372, 77Matthews L.D., Gallagher J.S., Littleton J.E., 1995, AJ 110,
581Paturel G., Fouque P., Bottinelli L., Gouguenheim L., 1992,
Catalogue of Principal Galaxies, Lyon (PGC)Roberts M.S., 1969, AJ 74, 859Schombert J.M., Bothun G.D., Schneider S.E., McGaugh S.S.,
1992, AJ 103, 1107Tully R.B., 1988, Nearby Galaxy Catalog. Cambridge Univ.
Press
W.K. Huchtmeier et al.: HI observations of nearby galaxies. I. 479
Table 1. List of new Local Volume dwarf candidates
KK R.A. (1950.0) Dec. a b Type S.B. Bt Ref.(B) Ab Identification
h m s ◦ ′ ′′ arcmin
1 2 3 4 5 6 7 8 9 10 11
1 00 12 31.6 −38 45 43 0.9 0.35 Im H AM 0012–3842 00 12 53.5 −21 43 17 2.3 1.3 S0 H 13.12 NED 0.06 NGC 593 00 13 00.0 −32 27 36 1.5 1.3 Im H FG 114 00 29 27.4 −33 32 30 0.9 0.8 Sph/Ir L FG 16, AM 0029–3335 00 32 52.7 +36 13 21 5: 3: Sph EL And III6 00 34 43.3 +47 53 57 0.5 0.48 Ir L7 00 35 18.6 −43 46 46 0.6 0.4 Im H AM 0035–434
261 00 38 30.5 −26 32 28 0.6 0.3 Ir VL8 00 42 56.2 +37 45 51 4: 3: Sph EL And I9 00 46 51.9 −18 20 48 1.2 1.1 Sph L K 2
10 00 47 56.0 −20 10 44 1.3 1.2 Sph/Ir L FG 2412 01 13 41.9 +33 09 20 4: 2.5: Sph EL And II13 01 39 29.5 +26 06 57 0.7 0.35 Ir L 16.57 UH 0.2914 01 41 54.0 +27 02 14 1.6 0.6 Ir L 17.47 6m 0.2415 01 43 53.6 +26 33 07 0.6 0.18 Ir VL 18.22 UH 0.26
262 01 43 55.7 +14 26 33 1.0 0.7 Ir H 15.3 IK 0.08 UGC 1242263 01 47 10.5 +28 40 03 0.7 0.55 Ir L 18.4 IK 0.1816 01 52 30.2 +27 42 34 0.8 0.28 Ir L 16.3 IK 0.2917 01 57 18.1 +28 35 26 0.6 0.3 Ir L 17.2 IK 0.2018 01 57 22.0 +67 30 36 1.3 0.9 Sph? EL
264 02 01 46.3 +72 30 23 0.8 0.8 Ir L 18.7 IK 2.9619 02 02 02.4 +68 45 57 2.2 1.7 Ir L 16.38 6m 4.44 Cas 120 02 31 39.9 +22 21 45 1.2 0.7 Sph VL21 02 31 52.2 +59 09 42 2.4: 1.0: Ir EL 19.5 IK 4.19 MB 122 02 51 54.1 +58 39 35 1.6 0.5 Ir EL 19.8 IK 5.68 MB 323 02 53 01.1 +58 42 37 2.0: 0.3: SB EL 18.8 IK 6.20 Cas 224 02 53 54.5 +17 15 25 0.6 0.4 Ir? L25 03 07 59.9 +60 09 28 2.8 0.8 Ir? VL 19.0 IK 6.0026 03 18 53.2 +62 36 27 1.8 0.9 Ir L Cam C27 03 20 29.5 −66 30 04 1.2 0.4 Ir L
28 03 28 35.2 +47 37 28 1.4 0.8 Ir H 15.04 NED 2.41 UGC 2773265 03 29 09.1 +67 56 36 2.0 0.8 Ir L 17.0 IK 3.45 K 37=BK 729 03 33 18.9 −61 15 37 1.8 0.9 Im EL 16.38 NED 0.05 FG 82, AM 0333–611
266 03 33 44.4 +67 26 00 2.0 0.7 Ir? L 17.0 IK 3.44 BK 830 03 37 12.6 +68 02 50 1.0 0.5 Sph? VL 18.6 IK 2.3431 03 37 26.2 −18 49 42 0.7 0.6 Ir/Sph L32 03 37 26.8 +19 35 30 0.8 0.7 Ir L
267 03 38 25.0 +68 06 11 2.2 0.3 Ir? L 17.7 IK 2.24 BK 1233 03 38 39.9 +67 52 57 0.4: 0.4: Ir VL34 03 38 56.9 −45 30 52 1.5 1.5 Im H 14.84 NED 0.0 AM 0338–453
35 03 40 23.7 +67 42 26 2.5 1.7 Ir VL 17.2 2.536 03 42 47.0 +67 30 57 1.0 0.6 Ir L 17.4 IK 2.6737 03 47 15.0 +70 56 34 0.9 0.4 Ir? VL 16.9 IK 2.37 BK 17
268 03 53 22.5 +69 08 24 1.1 0.6 Sph? L 17.2 IK 2.72 BK 1938 03 58 47.0 −62 38 57 0.7 0.5 Im H AM 0358–623

480 W.K. Huchtmeier et al.: HI observations of nearby galaxies. I.
Table 1. continued
KK R.A. (1950.0) Dec. a b Type S.B. Bt Ref.(B) Ab Identification
h m s ◦ ′ ′′ arcmin
1 2 3 4 5 6 7 8 9 10 11
269 03 59 34.8 +71 25 44 1.2 0.5 Ir VL 17.0 IK 1.17 BK 2139 04 00 06.0 +71 20 00 1.1: 0.9: Ir? EL 18.5 IK 1.1240 04 05 56.0 −55 27 21 1.6 1.0 Im H 14.73 NED 0.0 AM 0405–552270 04 06 44.0 +70 38 33 0.9 0.4 Ir L 16.6 IK 1.1741 04 19 26.7 +72 41 27 3.7 2.1 Sph? VL Cam A42 04 39 44.4 +61 15 47 0.6 0.6 Ir? VL43 04 45 11.0 −36 00 18 2.2 0.8 Im/Sm H 15.23 NED 0.0 AM 0445–360271 04 46 40.8 +67 04 29 0.6 0.35 Sph? L 17.7 IK 0.9244 04 48 03.3 +67 01 02 2.2 1.1 Ir L 16.71 UH 0.9345 05 21 35.2 −34 37 13 0.55 0.4 Im H 16.8 IK 0.0 AM 0521–343
46 05 23 05.4 −87 05 14 1.4 0.7 Im L 15.90 NED 0.61 FG 154, AM 0522–87047 05 27 49.0 −87 37 36 1.0 0.45 Im L AM 0528–87348 05 28 26.3 −24 54 44 1.7: 0.3: Im/Sm VL 16.17 NED 0.06 AM 0528–24549 05 39 00.7 +06 39 28 0.7 0.5 Im? H 16.1 IK 2.8550 05 47 25.5 +02 52 10 0.5 0.4 Ir VL 18.3 IK 2.8751 05 48 47.9 +02 53 48 2.1 0.5 Ir EL52 06 02 18.4 −19 37 03 1.2 0.5 Ir L 17.06 NED 0.3853 06 12 51.5 −51 31 41 1.1 0.6 Im L 16.54 NED 0.15 AM 0612–51354 06 24 16.7 −26 14 06 0.6 0.3 Ir H 15.6 IK 0.43 AM 0624–26155 06 37 55.8 −40 40 24 0.7 0.45 Ir VL 16.23 NED 0.33 AM 0637–404
56 06 39 49.0 +36 41 03 1.3 0.4 Ir? L 17.9 IK 0.6657 07 04 49.9 −21 57 29 1.9 1.1 Ir L 15.8 IK 2.8158 07 07 56.2 −51 23 08 1.4 1.1 Ir L 15.31 NED 0.25 FG 20359 07 17 41.2 −57 19 06 2.1 1.6 Im/Sm VL 16.1 IK 0.43 FG 206, AM 0717–57160 07 20 23.0 +46 06 10 1.1 0.4 Ir L61 07 29 13.1 +66 59 40 3: 2: Sph VL DDO 4462 07 31 50.6 +42 12 13 0.6 0.4 Ir L 17.6 IK 0.2164 07 39 30.0 +69 41 09 0.6 0.2 Ir L 16.6 IK 0.1265 07 39 40.2 +16 40 47 0.9 0.5 Ir H 15.6 NED 0.0966 07 44 05.4 +40 18 42 0.7 0.4 Ir L 17.0 IK 0.22
67 08 00 34.9 +15 17 03 1.0 0.5 Ir L68 08 27 17.0 −84 58 57 1.1 1.0 Ir? H69 08 49 44.1 +33 59 13 2.4: 1.8: Sph? EL 16.8 IK 0.0770 08 52 16.3 +33 45 02 1.1 1.0 Sph? EL71 09 06 56.7 −23 09 51 0.45 0.35 Ir/Sph L 18.7 IK 0.73 AM 0906–23172 09 09 28.5 −23 46 35 0.6 0.5 Sph L73 09 10 15.6 −24 02 05 0.9 0.8 Sph L74 09 12 18.0 −23 20 55 0.8 0.4 Im L FG 247, AM 0912–23275 09 12 48.9 −25 40 30 0.9 0.6 Ir L 18.0 IK 0.73
U5005 09 21 37.4 +22 29 20 1.3 0.9 S? H 15.9 IK 0.10 UGC 5005
76 09 38 23.6 −76 21 41 2.1 0.8 Ir L77 09 46 08.5 +67 44 25 2.4 1.8 Sph VL78 09 47 23.6 +31 41 26 0.5 0.3 Ir H 17.6 IK 0.0379 09 50 03.5 +29 32 46 0.6 0.4 BCD? H 17.0 IK 0.0280 09 50 45.0 +29 40 57 1.1 0.6 Ir L
W.K. Huchtmeier et al.: HI observations of nearby galaxies. I. 481
Table 1. continued
KK R.A. (1950.0) Dec. a b Type S.B. Bt Ref.(B) Ab Identification
h m s ◦ ′ ′′ arcmin
1 2 3 4 5 6 7 8 9 10 11
81 09 53 00.8 +68 49 47 2.6 2.6 Sph VL K 6182 10 00 25.3 −05 57 55 0.6 0.5 Ir L 17.73 NED 0.0582 10 00 25.3 −05 57 55 0.6 0.5 Ir L 17.73 NED 0.0583 10 01 18.0 +66 48 00 1.7 1.7 Sph VL DDO 71, K 6384 10 03 05.8 −07 30 20 1.9 1.3 Sph L K 6585 10 03 09.0 +68 04 19 2.0 1.0 Sph L K 64, UGC 544286 10 05 22.0 +30 44 09 1.0 0.6 Ir? L MCG 5–24–1887 10 12 37.6 −44 36 08 1.2 1.0 Sm? H AM 1012–44388 10 13 57.4 −39 44 23 0.9 0.5 Ir VL AM 1013–39489 10 22 47.6 +67 54 32 2.0 2.0 Sph VL 15.8 NED 0.06 DDO 7890 10 26 26.1 +23 01 57 1.0 0.15 Ir/S VL 16.8 IK 0.0
91 10 31 00.0 +66 16 00 1.0 0.8 Sph VL BK 6N92 10 33 30.1 +27 47 52 0.8 0.7 Ir L 16.9 IK 0.0493 10 43 45.8 +14 17 16 1.2 1.1 Ir VL94 10 44 18.1 +13 15 48 1.2 0.6 Ir VL 17.9 IK 0.0495 10 46 03.6 +64 59 20 2.2: 1.7: Ir VL UGCA 22096 10 47 48.8 +12 37 34 1.2: 0.8: Sph EL97 10 55 35.3 +20 22 35 0.7 0.5 Ir L98 11 09 37.7 +17 01 32 0.9 0.4 Sph/Ir VL 17.4 IK 0.0 F 640-399 11 11 11.2 −47 46 02 0.35 0.25 Im H AM 1111–474
100 11 11 22.9 +11 36 10 1.2 0.5 Ir VL
101 11 14 19.1 −32 22 39 0.7 0.4 Sph? L AM 1114–322102 11 20 21.2 +19 44 58 0.6 0.4 Ir? L 17.1 IK 0.0 F 570–3103 11 21 03.8 +19 31 52 0.6 0.4 Sph VL104 11 26 14.5 +18 33 25 1.1 0.7 Ir? VL 17.1 IK 0.0 F 571–10105 11 26 40.7 +46 23 23 0.8 0.5 Ir? L 16.6 IK 0.0106 11 27 08.7 +52 40 54 0.8 0.7 Sph? VL 16.7 IK 0.0 K 78107 11 31 40.1 +17 26 14 0.7 0.4 Ir L108 11 37 23.0 +46 45 29 0.7 0.6 Sph? VL 17.7 IK 0.01109 11 44 33.5 +43 56 59 0.6 0.4 Ir? L 17.5 IK 0.0110 11 46 01.0 +56 11 44 0.6 0.6 Ir? L
111 11 51 27.3 +16 59 55 0.6 0.45 Ir? L 17.0 IK 0.14113 11 52 17.9 +47 04 59 0.5 0.3 Ir? VL114 11 53 55.1 −36 27 39 0.5 0.35 Im H115 11 55 37.1 +49 09 34 0.7 0.55 Im H 16.2 IK 0.05 MCG 8–22–48116 11 56 18.5 +46 00 45 1.3 0.7 Ir L 15.8 IK 0.0 UGCA 259117 11 57 24.6 +44 59 50 0.6 0.6 Ir? L 17.1 IK 0.0118 11 58 42.9 +54 03 01 0.6 0.15 Ir VL119 11 59 13.5 +28 38 26 0.8 0.7 Ir L 17.0 IK 0.0120 12 00 56.2 −25 11 35 2.5 1.9 Im/Sm L 16.8 IK 0.43 FG 320;AM 1200–251121 12 02 52.3 +43 59 13 1.1 0.6 Ir VL
122 12 04 04.8 +55 02 38 1.0 0.25 Ir L 16.4 IK 0.0123 12 04 20.5 +17 37 01 0.9 0.2 Ir L124 12 06 16.1 +52 50 29 0.5 0.3 Ir? EL125 12 10 16.9 +69 12 20 0.7 0.6 Sph? VL126 12 10 47.5 +28 41 44 0.6 0.3 Ir L 16.7 IK 0.02

482 W.K. Huchtmeier et al.: HI observations of nearby galaxies. I.
Table 1. continued
KK R.A. (1950.0) Dec. a b Type S.B. Bt Ref.(B) Ab Identification
h m s ◦ ′ ′′ arcmin
1 2 3 4 5 6 7 8 9 10 11
127 12 10 51.5 +30 12 00 0.9 0.25 Ir H 16.22 UH 0.04128 12 11 17.1 +05 37 54 0.6 0.4 Ir L 17.0 IK 0.0 GR 5129 12 11 38.9 +16 14 35 1.1 1.1 Sph VL K 88,VCC 108
U7298 12 14 02.2 +52 30 29 1.1 0.6 Ir L 15.95 6m 0.04 UGC 7298130 12 15 17.6 +28 45 09 0.6 0.3 Ir L K 95131 12 15 58.1 +28 55 31 0.6 0.5 Sph/Ir VL K 98132 12 16 38.5 +48 00 25 0.6 0.5 Sph/Ir VL133 12 17 04.1 +43 39 50 0.4 0.3 Ir L134 12 17 05.3 +47 43 54 0.3 0.3 Sph? L135 12 17 09.5 +58 19 18 0.8 0.4 Ir VL
136 12 18 13.5 +47 16 43 0.5 0.5 Sph? L137 12 19 13.0 +38 15 06 0.9 0.5 Ir VL 16.08 UH 0.0 K 105138 12 19 27.0 +28 31 09 0.9 0.5 Sph/Ir VL 17.8 IK 0.08139 12 19 37.9 +40 01 23 0.9 0.4 Ir L 16.7 IK 0.0140 12 20 15.7 +08 11 27 0.6 0.5 Ir L 15.8 NED 0.0 VCC 584141 12 20 23.2 +34 06 23 0.4 0.3 Ir L 17.5 IK 0.0142 12 21 48.5 −42 00 57 1.0 0.5 Ir? L AM 1221–420143 12 22 34.0 +61 20 20 1.0 0.7 Ir L 16.59 UH 0.0 MCG 10–18–44144 12 22 58.6 +28 45 33 1.5 0.5 Ir L 16.5 IK 0.09145 12 24 18.6 +62 39 23 1.1 0.7 Ir L 16.61 UH 0.01 UGC 7544
146 12 24 19.1 +13 27 15 1.0 0.35 Sm L DDO 124147 12 25 20.3 −37 03 12 2.0 0.25 Im/Sm? H 15.59 NED 0.20 AM 1225–370148 12 25 32.4 +22 51 57 0.8 0.4 Ir H 16.2 IK 0.07 UGC 7584149 12 26 25.8 +42 27 20 0.8 0.45 Ir L 15.01 NED 0.0 MCG 7–26–11150 12 27 28.2 +08 12 24 1.1 0.7 Im L UGC 7636151 12 27 57.5 +43 10 38 1.2 0.5 Ir? L 15.8 IK 0.0 MCG 7–26–12
VPC873 12 30 02.9 +14 51 23 0.2 0.2 Ir H152 12 30 58.4 +33 37 42 1.2 0.4 Ir H 16.5 IK 0.03 MCG 06–28–9
N4523 12 31 16.9 +15 26 39 2.3 2.0 SBd? H 14.42 NED 0.0 NGC 4523I3517 12 31 58.8 +09 25 52 1.0 0.6 Ir H 15.38 NED 0.0 IC3517
I3521 12 32 07.1 +07 26 12 1.2 0.6 BCD H 13.98 NED 0.0 IC3521153 12 32 44.4 +58 39 45 0.5 0.3 Ir L K 162154 12 34 56.4 +39 01 12 0.7 0.4 Ir H 15.74 6m 0.0 Arp 211155 12 35 13.0 +07 22 42 1.2 1.0 Ir L UGC 7795156 12 38 09.0 +47 38 21 0.5 0.2 Ir L157 12 38 31.3 −40 53 03 1.7 0.4 Ir VL AM 1238–405158 12 39 06.9 +40 05 13 1.1 0.7 Ir L 16.7 IK 0.0159 12 40 48.0 +35 41 16 0.7 0.5 Ir? L 17.4 IK 0.0160 12 41 35.8 +43 56 15 0.8 0.6 Ir L 17.0 IK 0.0161 12 42 10.0 +71 03 52 1.1 0.7 Ir? L 16.6 IK 0.0 K 195
162 12 42 57.3 +18 34 25 0.9 0.7 Ir? EL163 12 43 37.6 +62 14 21 0.9 0.4 Ir? VL164 12 45 26.9 +04 42 24 1.1 0.6 Ir H 15.5 IK 0.01165 12 46 27.6 +32 14 33 0.7 0.7 Ir? L166 12 46 49.5 +35 53 05 1.7 1.0 Sph L
W.K. Huchtmeier et al.: HI observations of nearby galaxies. I. 483
Table 1. continued
KK R.A. (1950.0) Dec. a b Type S.B. Bt Ref.(B) Ab Identification
h m s ◦ ′ ′′ arcmin
1 2 3 4 5 6 7 8 9 10 11
167 12 49 17.8 +26 22 56 0.8 0.5 Ir? L 16.7 IK 0.02168 12 50 37.8 +03 42 44 0.5 0.4 Ir? VL 17.3 IK 0.0169 12 50 41.3 +12 54 24 0.8 0.6 Ir L 17.1 IK 0.05170 12 52 11.5 −28 04 12 0.8 0.6 Im L 17.01 NED 0.30 AM 1252–280171 12 53 03.1 +33 15 22 0.7 0.6 Ir? L172 12 54 14.0 +12 12 10 1.3 1.0 Ir L 16.3 IK 0.07 UGC 8061173 12 56 07.5 +18 04 58 0.7 0.45 Ir L 17.2 0.11
U8091 12 56 10.5 +14 29 17 1.6 0.9 Ir H 14.68 NED 0.04 UGC 8091174 12 56 29.7 −49 21 08 2.2 1.6 Ir L 16.52 NED 0.89 FG 363175 12 56 38.7 +35 45 03 0.6 0.4 Ir? L 17.1 IK 0.01
176 12 57 17.1 −19 08 26 1.7 0.7 Sph/Ir VL 17.5 IK 0.17177 13 00 15.2 +22 16 02 0.8 0.7 Sph? VL F 575-1178 13 00 32.8 +26 20 46 0.8 0.3 Ir L F 508-1180 13 02 02.1 +18 01 37 1.4 0.7 Sph/Ir VL F 575-4181 13 02 09.2 +27 02 31 0.7 0.6 Ir L 17.25 NED 0.0 F 508-v1182 13 02 12.8 −39 48 54 1.0 0.55 Ir L 16.33 NED 0.37272 13 03 33.1 −49 33 38 1.6 0.6 Ir L ESO 219-G027183 13 04 14.8 +18 16 08 0.6 0.45 Sph? L 17.9 0.07185 13 06 36.8 +33 28 07 0.6 0.5 Ir L186 13 07 03.5 −23 16 35 0.7 0.3 Im H AM 1307–231
187 13 07 23.3 −26 19 43 1.0 0.8 Im H 17.3 IK 0.31 AM 1307–263188 13 08 47.7 +37 26 39 0.9 0.6 Ir L191 13 11 24.8 +42 18 31 0.8 0.7 Sph? EL 18.2 IK 0.0192 13 12 02.7 +36 50 08 0.7 0.5 Sph? L 16.7 IK 0.0193 13 13 16.4 +41 45 55 0.6: 0.6: Ir/Sph EL194 13 15 07.3 +44 39 44 0.6: 0.4: Ir? VL195 13 18 20.5 −31 16 05 1.3 0.6 Ir VL 17.4 IK 0.23196 13 18 49.9 −44 48 05 0.6 0.4 Ir? L AM 1318–444198 13 20 07.0 −33 18 23 0.6 0.5 Sph? L199 13 20 31.4 −28 56 34 0.4 0.35 Ir EL
200 13 21 48.1 −30 42 43 1.3 0.8 Im H 16.67 NED 0.19 K 15, AM 1321–304201 13 22 20.0 −37 21 50 1.3 0.7 Ir/Sph VL AM 1321–372202 13 22 37.7 −29 00 39 0.6 0.45 Ir L204 13 25 28.7 −37 54 37 1.6 1.1 Ir? L 14.97 NED 0.24 FG 393, AM 1325–375205 13 26 46.8 +67 53 28 1.2 0.5 Ir L UGC 8509206 13 31 18.6 +49 21 30 1.0 0.6 Ir H 14.6 PGC MCG 8–25–18207 13 31 31.6 +56 45 26 0.6 0.4 Ir? VL208 13 33 46.5 −29 19 00 6:: 2.5: Ir EL 14.3209 13 35 52.8 +49 22 26 0.4 0.25 Ir L210 13 37 31.2 −31 26 47 1.4 0.6 Im? L 16.57 NED 0.11 FG 403
212 13 39 12.6 +43 32 31 0.8 0.6 Ir? L 15.9 IK 0.0 MCG 07–28–51215 13 40 45.2 −45 39 22 0.5 0.5 Im L AM 1340–453216 13 41 24.2 +43 42 43 1.1 0.5 Ir H 14.8 NED 0.0 UGC 8688218 13 43 48.7 −29 43 47 1.7 0.7 Sph? VL219 13 45 21.9 +39 37 26 0.7 0.4 Ir? L 17.3

484 W.K. Huchtmeier et al.: HI observations of nearby galaxies. I.
Table 1. continued
KK R.A. (1950.0) Dec. a b Type S.B. Bt Ref.(B) Ab Identification
h m s ◦ ′ ′′ arcmin
1 2 3 4 5 6 7 8 9 10 11
220 13 45 22.2 +33 27 25 0.8: 0.7: Ir L 16.5 IK 0.0223 13 46 07.8 +40 48 08 0.4 0.3 Ir? L 17.4 IK 0.0224 13 46 52.8 +43 50 54 1.0 0.4 Ir L 16.9 IK 0.0225 13 52 51.5 +37 55 42 0.45 0.3 Ir L226 13 53 01.2 −45 24 47 1.1 0.7 Ir L227 13 54 03.7 +40 32 50 0.7 0.45 Ir L228 13 57 21.1 +52 36 16 0.9 0.8 Ir? L 16.6 IK 0.0 UGC 8914229 13 59 54.3 −46 51 45 0.8 0.6 Ir L 16.55 NED 0.49 AM 1359–465230 14 05 01.5 +35 18 09 0.6 0.5 Ir VL 16.9 IK 0.0274 14 06 37.4 −30 02 30 0.8 0.6 Im H 16.8 IK 0.22
231 14 15 34.6 +23 18 21 0.8 0.3 Ir L275 14 16 00.0 −45 05 15 1.2 0.6 Im H 14.62 NED 0.30 AM 1415–450232 14 40 48.0 +50 01 40 0.9 0.5 Ir VL 17.2 IK 0.05233 14 45 51.4 +53 02 31 1.1 0.7 Ir L 15.9 IK 0.0 MCG 9–24–40234 14 57 13.6 −51 31 55 1.7 0.6 Ir VL FG 434236 15 04 09.5 +56 03 24 0.9 0.7 Sph? VL 19.17 UH 0.01237 15 06 46.1 +56 27 03 0.7 0.5 Ir? L 18.21 UH 0.17 K 233238 15 11 59.0 −22 56 23 0.8 0.6 Im L 17.11 NED 0.47 FG 458, AM 1511–225239 15 25 33.2 −42 36 36 1.9 0.7 Ir L FG 444240 16 22 23.0 −59 50 33 2.9 0.7 Sm? L 14.8 IK 0.90 ESO 137- G27
241 16 22 59.4 −60 20 53 1.6 1.0 Ir VL 16.6 IK 0.89 FG 447242 17 53 18.0 +70 08 41 0.8 0.6 Sph? EL 19.0 IK 0.14243 18 18 05.0 −62 17 44 0.9 0.6 Ir L 16.59 NED 0.44 FG 458, AM 1818–622245 19 16 17.0 +63 52 54 1.5 1.2 BCD H NGC 6789246 20 00 48.0 −31 49 24 1.2: 0.5: Ir VL 17.06 NED 0.44 FG 492247 20 04 51.7 −61 12 30 0.9 0.6 Ir L AM 2004–611249 20 25 58.8 −31 51 07 0.8 0.4 Ir L 15.65 NED 0.26 AM 2025–315250 20 29 14.4 +60 16 22 1.8 0.8 Ir VL 15.74 UH 1.31 UGC 11583251 20 29 31.9 +60 11 03 1.6 0.8 Ir? VL 16.49 UH 1.28252 20 30 33.5 +60 38 34 0.9 0.9 Sph? VL 16.15 6m 1.95
253 20 33 30.7 −69 21 58 1.0 0.9 Ir L AM 2033–692254 20 33 46.2 +60 55 12 1.5 0.9 Ir? EL255 21 54 21.4 −60 32 42 2.5 1.2 Ir L 16.39 NED 0.0 FG 532, AM 2154–603256 22 09 04.6 −43 25 29 0.6 0.5 Im L AM 2209–432257 22 19 25.2 −48 39 26 2.2 1.3 Ir L 15.3 IK 0.0 FG 545258 22 37 56.3 −31 03 40 1.6 0.8 Ir? L K 20, FG 554, AM 2237–310259 23 09 36.4 −44 03 01 4: 2.2: Sm? L FG 569260 23 11 46.9 −43 52 39 4.5 1.8 Ir VL
W.K. Huchtmeier et al.: HI observations of nearby galaxies. I. 485
Table 2. List of new Local Volume dwarf candidates
KK HI-flux Smax velocity line width distance MBt HI mass MHI/LB Comments
No. Jy km s−1 mJy km s−1 km s−1 Mpc 107M�1 2 3 4 5 6 7 8 9 10
1 ± 15 ATCA2 2.66 57 ± 5.9 361 ± 2 50 62 76 5.4 −15.70 1.9 0.063 ± 24 N4 ± 35 N5 ± 3.56 ± 47 ± 20 ATCA
261 2.6 87 ± 13 2694 ± 2 32 40 41 35.98 ± 3.39 ± 8
10 ± 8.312 ± 3.613 1.33 40 ± 7 357 ± 9 31 45 52 7.0 −13.15 1.5 0.5314 3.04 74 ± 6 420 ± 4 36 56 60 7.9 −12.53 4.4 2.7315 0.9 27 ± 6 368 ± 4 25 37 40 7.2 −11.69 1.1 1.51
262 1.1 18 ± 7 7356 ± 3 105 124 126 99.8 −20.55 2.6 0.10263 0.92 25 ± 7 3841 ± 4 38 48 50 53.5 −15.49 6.1 2.4816 0.97 37 ± 5 206 ± 3 22 32 34 4.9 −12.76 5.6 0.2817 0.95 28 ± 5 156 ± 3 34 52 53 4.2 −11.34 5.1 0.9518 ± 3.8
264 3.28 34 ± 6 2918 ± 7 128 143 155 42.0 −17.38 130 0.9819 46.4 930 ± 4.6 35 ± 2 49 3.5 −15.87 14 0.3920 11.18 760 ± 2.2 −70.2 ± 1 14 20 2221 9.0 160 ± 10 189 ± 3 60 79 85 5.3 −13.57 6.0 1.4422 30.8 330 ± 30 96 ± 2 100 116 .. 3.9 −14.1923 205 960 ± 10 112 ± 2 187 202 204 4.1 −16.04 40.6 2.0524 ± 3.725 8.84 54 ± 3.7 2767 ± 2 260 273 277 39.5 −19.35 330 0.3826 ± 2.627 ± 6 ATCA
28 26.1 349 ± 30 216 ± 1 81 92 96 4.3 −15.83 11.0 0.34265 26.1 202 ± 5 1378 ± 2 144 178 187 21.1 −18.33 280 0.8329 0.95 33 ± 3 1152 ± 5 38 52 56 12.6 −14.38 3.6 0.41 ATCA
266 54.24 629 ± 5.4 1434 ± 1 53 119 125 21.8 −18.60 600 1.4130 0.89 20 ± 2.3 1159 ± 6 45 59 61 18.1 −15.23 7.0 0.3631 ± 8.132 ± 8
267 2.14 32 ± 3.1 1140 ± 8 99 110 .. 20.4 −16.67 15.0 0.1933 ± 534 3.26 61 ± 4 1554 ± 3 60 77 80 18.4 −16.48 26.0 0.43 ATCA
35 0.82 35 ± 6 119 ± 3 25 .. .. 2.1 −12.11 0.085 0.0836 3.45 33 ± 2.8 1267 ± 7 120 134 142 19.5 −16.87 31.0 0.3537 1.24 19.5 ± 2.9 836 ± 5 101 109 111 13.8 −16.41 5.4 0.09
268 7.68 80 ± 2.2 1302 ± 2 120 134 138 20.0 −17.20 71 0.6138 ± 7 7.3 ATCA
kk 4: heliocentric velocity = 1651 km s−1 (NED)kk 7, 9, 10: undetected in HI (2)kk 8, 12, 5: ANDI, II, III have been searched for HI within the radial velocity range −550 to 770 km s−1
kk 18, 26, 32: undetected in HI (3)kk 20: probably local HIkk 35: resolved, companion to IC 342

486 W.K. Huchtmeier et al.: HI observations of nearby galaxies. I.
Table 2. continued
KK HI-flux Smax velocity line width distance MBt HI mass MHI/LB Comment
No. Jy km s−1 mJy km s−1 km s−1 Mpc 107M�1 2 3 4 5 6 7 8 9 10
269 6.83 69 ± 5 1734 ± 2 120 133 136 25.8 −16.48 110 1.7539 2.0 21 ± 3.5 1732 ± 4 123 125 126 25.7 −14.73 17 1.4240 2.87 53 ± 5 1066 ± 2 101 109 112 11.4 −15.69 8.8 0.30 ATCA
270 4.6 110 ± 5 1159 ± 1 42 57 59 18.1 −16.09 36 0.8541 ± 4.142 ± 543 7.95 135 ± 26 1372 ± 6 46 111 130 15.7 −16.04 46 1.14
271 0.79 12 ± 4 1581 ± 25 23.4 −15.22 10 0.5444 4.47 220 ± 15 77 ± 1 18 28 32 2.2 −11.14 0.50 1.1245 4.5 108 ± 15 955 ± 3 58 78 83 9.9 −13.26 10 3.29
46 1.34 54 ± 5 1745 ± 3 43 48 50 21.0 −16.69 14 0.19 ATCA47 ± 6.4 ATCA48 6.87 72 ± 4.9 1850 ± 2 96 120 121 22 −16.11 80 1.8649 8.92 140 ± 6.7 455 ± 2 55 84 87 4.8 −15.26 4.9 0.2550 2.08 21 ± 5.1 1776 ± 4 111 117 118 22.1 −16.36 23 0.4251 ± 4.952 5.85 74 ± 4.1 883 ± 2 94 105 108 9.1 −13.36 11 3.2753 0.85 29 ± 3 1253 ± 3 34 42 44 13.2 −14.39 3.5 0.39 ATCA54 3.12 97 ± 6.4 491 ± 2 29 35 39 3.4 −12.71 0.89 0.4755 1.26 53 ± 5 824 ± 6 51 63 66 7.5 −13.59 1.7 0.39 ATCA
56 0.8 13 ± 3 2287 ± 6 58 83 85 30.6 −15.53 18.0 0.7057 7.26 73 ± 6 738 ± 3 116 132 136 6.7 −16.29 7.8 0.1558 2.15 82 ± 5 1054 ± 2 27 35 37 10.3 −15.07 5.4 0.32 ATCA59 4.04 94 ± 6 1145 ± 2 21 45 67 11.5 −14.71 13.0 1.06 ATCA60 ± 4.361 ± 662 2.71 37 ± 3.4 3100 ± 10 94 114 124 41.5 −15.90 110 3.0764 2.90 25 ± 3.5 3867 ± 5 125 153 156 53.5 −17.48 200 1.2865 3.43 86 ± 5 279 ± 5 38 60 68 2.2 −11.39 0.39 0.7066 1.61 17 ± 4 2976 ± 9 63 73 76 39.7 −16.38 60 1.08
67 ± 4.768 ± 6 ATCA69 3.58 154 ± 6 464 ± 1 20 30 33 5.7 −12.12 2.6 2.4270 ± 571 1.54 49 ± 5.7 179 ± 3 27 38 4172 ± 673 ± 5.374 ± 5.275 1.40 27 ± 5.1 2866 ± 4 68 79 81 34.6 −15.54 40 1.56
U5005 6.93 0.66 ± 3.6 3824 ± 4 109 122 126 49.7 −17.79 390 1.92
76 ± 7 ATCA77 ± 5.578 15.8 204 ± 4.9 520 ± 2 80 99 104 6.3 −11.56 15 22.9279 1.2 20 ± 4 1638 ± 8 61 73 90 21.0 −14.75 13 1.0180 ± 3.3
kk 42: undetected in HI (3)kk 61: undetected in HI (6), companion of NGC 2403kk 65: companion of UGC 3974kk 68: v = 738 km s−1 (1)kk 69, 70: companion of NGC 2683kk 71: local HI?kk 74: undetected in HI (5)kk 78: UGC 5272B, confusion with UGC 5272 at 1.9′

W.K. Huchtmeier et al.: HI observations of nearby galaxies. I. 487
Table 2. continued
KK HI-flux Smax velocity line width distance MBt HI mass MHI/LB Comment
No. Jy km s−1 mJy km s−1 km s−1 Mpc 108M� 109M�1 2 3 4 5 6 7 8 9 10
81 ± 8.582 3.94 165 ± 6 185 ± 1 21 31 3582 1.54 40 ± 3.2 3769 ± 6 35 48 55 47.3 −15.75 84 2.5383 ± 6.284 ± 785 ± 5.786 ± 4.687 ± 6 ATCA88 ± 7 ATCA89 0.84 27 ± 6.3 2788 ± 2 32 62 63 37.2 −17.11 27 0.2590 2.5 33 ± 3.8 1206 ± 4 95 105 108 14.9 −14.66 13 1.15
91 ± 6.892 2.74 46 ± 3.9 1371 ± 3 71 79 81 17.5 −14.39 19.0 2.1993 ± 694 1.52 42 ± 3.5 833 ± 3 28 52 55 9.4 −12.21 3.1 2.6395 ± 4.596 ± 6.797 ± 6.598 0.78 9 ± 2.2 1205 ± 20 48 118 120 14.7 −13.68 4.0 0.8799 ± 6 ATCA
100 ± 6
101 ± 26 N102 1.58 19.6 ± 3.3 3366 ± 5 86 117 120 43.8 −16.22 71 1.49103 ± 8.8104 1.36 21 ± 5.6 1303 ± 3 62 114 116 16.2 −14.08 8.4 1.26105 2.04 28 ± 3.7 1555 ± 3 80 96 98 21.4 −15.18 21 1.16106 0.28 15 ± 4.2 592 ± 5 23 30 32 8.9 −13.09 0.53 0.20107 ± 5108 6.99 72 ± 3.8 736 ± 3 88 110 138 10.5 −12.46 18 12.12109 0.7 37 ± 4.5 214 ± 3 11 23 36 3.4 −10.28 0.19 0.95110 ± 4
111 1.79 34 ± 3.8 980 ± 4 41 52 54 12.0 −13.62 0.61 1.40113 ± 4.3114 ± 31 N115 2.29 37 ± 3 826 ± 4 74 91 94 12.0 −14.32 7.4 0.90116 5.81 129 ± 3.1 1151 ± 2 41 52 54 16.1 −15.41 35 1.53117 0.44 14 ± 3 1171 ± 10 38 50 54 16.3 −13.96 2.5 0.42118 ± 4.8119 0.71 23 ± 3 841 ± 3 34 42 44 10.9 −13.23 2.0 0.65120 17.12 253 ± 6.5 1785 ± 1 70 85 89 20.8 −15.30 180 8.73121 ± 3.4
122 2.32 33 ± 4 850 ± 2 72 91 93 12.7 −14.52 8.5 0.85123 ± 7.6124 ± 4.6125 ± 4126 1.24 25 ± 3.5 1028 ± 10 36 57 62 13.5 −14.17 5.1 0.71
kk 82: 15′ from PGC 29086 (v = 662 km s−1)kk 84: companion of NGC 3115kk 87: heliocentric velocity 969 km s−1 (NED)kk 88: heliocentric velocity 263 and 2982 km s−1 (6)kk 89: highly probably member of M 81 group, HI emission probably not from this objectkk 94, 96: near Leo tripletkk 103: heliocentric velocity 1894 km s−1 (NED)kk 108: NGC 3782 (v = 739 km s−1) at 7.6′ NW, definitely confused in HI

488 W.K. Huchtmeier et al.: HI observations of nearby galaxies. I.
Table 2. continued
KK HI-flux Smax velocity line width distance MBt HI mass MHI/LB Comments
No. Jy km s−1 mJy km s−1 km s−1 Mpc 107M�1 2 3 4 5 6 7 8 9 10
127 2.87 41 ± 4.4 131 ± 6 64 112 117 1.6 −10.23 0.18 0.92128 1.80 24 ± 3.2 1690 ± 2 56 73 76 21.0 −14.72 19 1.58129 ± 6.1
U7298 5.44 193 ± 6.5 172 ± 1 26 38 41 3.5 −12.01 1.6 1.66130 ± 4.6131 ± 7.8132 ± 7.8133 ± 4.7134 ± 5135 ± 4.2
136 ± 3.9137 1.63 43 ± 5.2 567 ± 4 42 55 58 8.0 −13.60 2.6 0.60138 1.39 45 ± 7.7 3614 ± 2 47 61 63 48.0 −15.86 82 2.40139 3.85 65 ± 2.9 1074 ± 3 60 80 83 14.9 −14.40 20 2.22140 3.22 57 ± 3.7 1290 ± 3 90 100 115 15.8 −15.25 20 1.03141 0.83 38 ± 4.9 569 ± 2 22 28 30 7.8 −12.03 0.85 0.84142 ± 7 ATCA143 6.2 98 ± 3.8 706 ± 2 66 80 85 11.2 −13.75 19 3.88144 8.41 187 ± 3.7 483 ± 1 45 60 64 6.3 −12.91 7.9 3.48145 3.1 6.1 ± 9 707 ± 4 50 73 78 11.2 −13.78 9.5 1.88
146 ± 4.1147 21.3 121 ± 23 3026 ± 3 173 284 288 37.1 −18.06 6.90 2.64 N148 3.36 85 ± 3.6 602 ± 3 38 54 59 7.6 −13.46 4.6 1.21149 3.0 56 ± 4.2 407 ± 2 60 62 71 6.1 −14.10 2.7 0.39150 ± 6.1151 2.71 69 ± 3.6 431 ± 8 33 35 70 6.5 −13.53 2.7 0.68
VPC873 ± 2.9152 2.33 72 ± 2.2 838 ± 3 34 43 45 11.4 −14.13 7.4 1.05
N4523 20.54 194 ± 6.1 260 ± 2 120 134 139 2.6 −12.71 3.4 1.80I3517 1.81 29 ± 6.2 438 ± 3 74 106 108 4.7 −13.11 0.92 0.34
I3521 0.38 11 ± 3.2 932 ± 8 34 44 50 11.1 −16.45 1.1 0.2153 ± 4.9154 2.18 46 ± 5.4 455 ± 4 31 42 60 6.6 −13.53 2.3 0.56155 ± 4.1156 ± 4.7157 ± 6 ATCA158 0.66 26 ± 4.6 636 ± 2 27 33 34 9.1 −13.24 1.4 0.45159 1.83 38 ± 4.6 1822 ± 4 43 73 75 24.7 −14.66 26.0 2.28160 0.87 36 ± 4.7 299 ± 3 28 40 44 4.9 −11.53 0.51 0.80161 2.28 30 ± 3.1 1800 ± 5 72 82 88 26.3 −15.63 24 0.88
162 ± 4.5163 ± 4.6164 9.04 214 ± 4.5 993 ± 2 30 47 50 11.9 −15.07 30 1.82165 ± 3.7166 ± 7.6
kk 127: in spite of v = 131 km s−1 the galaxy looks distantkk 129: undetected in HI (7)kk 138: NGC 4295 (v = 8568 km s−1) at 4′, no confusing object to be seemkk 146: heliocentric velocity 162 km s−1 (6)kk 150: heliocentric velocity 468 km s−1 (6)kk 155: heliocentric velocity 61 km s−1 (6)kk 162: the object looks like an emulsion defectkk 164: v = 4660 km s−1 (NED), NGC 4688 (v = 987 km s−1) at 6.7′ SW: confused

W.K. Huchtmeier et al.: HI observations of nearby galaxies. I. 489
Table 2. continued
KK HI-flux Smax velocity line width distance MBt HI mass MHI/LB Comments
No. Jy km s−1 mJy km s−1 km s−1 Mpc 107M�1 2 3 4 5 6 7 8 9 10
167 1.99 51 ± 3.2 1247 ± 4 37 50 52 16.6 −14.55 13 1.24168 1.35 45 ± 4.3 2785 ± 4 39 41 54 35.8 −15.53 33 1.31169 1.65 39 ± 4.2 1818 ± 2 46 54 55 23.4 −14.88 20 1.40170 1.71 43 ± 4.3 641 ± 3 35 55 59 6.5 −12.57 1.7 1.04171 ± 10172 2.0 43 ± 5.1 560 ± 3 53 64 66 6.6 −12.96 2.1 0.88173 2.58 74 ± 8.4 1015 ± 2 20 70 75
U8091 8.78 310 ± 7 214 ± 1 27 38 41 2.2 -12.48 0.98 0.75174 8.76 9.2 ± 1 1905 ± 2 138 145 147 22.2 −16.19 100 2.18 ATCA175 2.28 68 ± 4 701 ± 3 38 43 48 9.9 −13.00 5.3 2.15
176 3.41 92 ± 5.0 828 ± 1 41 48 50 8.9 −12.62 6.2 3.58177 ± 4.8178 ± 7.2180 ± 8181 3.64 45 ± 6.5 1930 ± 3 88 100 102 25.8 −14.86 60 4.39182 2.12 108 ± 6 613 ± 1 16 22 24 5.2 −12.78 1.3 0.66 ATCA272 ± 7 ATCA183 2.23 29 ± 8.1 1573 ± 3 87 93 95 5.2 −10.75 1.4 4.53185 ± 5.7186 ± 9.8
187 1.70 39 ± 5.9 2087 ± 6 38 80 85 25.3 −15.27 26 1.31188 ± 8.5191 2.41 40 ± 6 368 ± 6 62 81 92 5.9 −10.71 2.0 6.69192 0.67 22 ± 5.8 1203 ± 9 27 37 40 16.8 −14.52 4.0 0.40193 ± 4.4194 ± 6195 5.5 200 ± 20 564 ± 4 21 27 30 4.9 −11.51 3.1 5.0 N196 ± 36 ATCA198 ± 32 N199 ± 7
200 1.33 57 ± 8 485 ± 3 20 31 34 3.9 −11.62 0.51 0.74201 ± 28 N202 ± 6.9204 5.6 95 ± 20 1463 ± 8 71 89 98 16.7 −16.50 37 0.60 N205 ± 4.3206 6.2 115 ± 9 588 ± 2 57 71 89 9 -15.43 12 0.51207 ± 5208 36.2 878 ± 12 400 ± 2 36 59 65209 ± 5.2210 6.4 100 ± 18 1650 ± 2 89 98 102 20.2 −15.31 62 2.97 N
212 1.07 23 ± 4.4 1241 ± 6 57 65 68 17.9 −15.44 9.0 0.39215 ± 7 ATCA216 5.30 90 ± 5.1 1355 ± 6 63 82 89 19.4 −16.77 50 0.63218 ± 15219 0.85 17 ± 4.6 1276 ± 3 68 98 99 17.9 -14.15 6.4 0.90
kk 170: HI detection by Matthewson & Gallagher (1995)kk 174: v = 1905 km s−1 conflicts with the galaxy morphologykk 177, 180: undetected in HI (7)kk 191: NGC 5055 (v = 510 km s−1, W = 406 km s−1) at 24.1′ E, possible confusion through far sidelobekk 192: NGC 5033 (v = 876 km s−1, W = 452 km s−1) at 10.8′ W, different velocity range, no confusionkk 205: undetected in HI (6)kk 208: 20′ from NGC 5236, confusion with the extended HI-halo of M 83 (4)

490 W.K. Huchtmeier et al.: HI observations of nearby galaxies. I.
Table 2. continued
KK HI-flux Smax velocity line width distance MBt HI mass MHI/LB Comments
No. Jy km s−1 mJy km s−1 km s−1 Mpc 107M�1 2 3 4 5 6 7 8 9 10
220 0.8 33 ± 5.6 769 ± 2 27 33 34 11.1 −13.76 2.3 0.47223 4.26 53 ± 5.5 2594 ± 8 69 130 138 35.8 −15.45 130 5.51224 0.84 25 ± 6.7 1156 ± 6 26 43 54 16.8 −14.49 5.3 0.55225 ± 6.3226 ± 7 ATCA227 ± 7.8228 1.55 41 ± 5.9 1972 ± 3 44 64 66 28.1 −15.68 30 1.02229 0.31 25 ± 3 1355 ± 1 14 21 24 15.3 -14.95 1.7 0.12 ATCA230 1.87 113 ± 6.4 61 ± 1 20 29 32 1.9 −9.57 0.17 1.58274 6.3 57 ± 15 2598 ± 6 62 73 78 32.5 −16.06 160 3.79 N
231 ± 7.1275 9.08 106 ± 5 1633 ± 3 122 148 153 19.2 −17.30 79 0.61 ATCA232 0.86 24 ± 5.5 2960 ± 9 37 47 51 41.5 −16.11 36 0.83233 4.18 55 ± 4.5 724 ± 2 76 91 93 11.9 −14.60 14 1.26234 ± 6 ATCA236 5.18 20 ± 6 −150 ± 1 21 34 36237 5.22 174 ± 5.6 −177 ± 1 24 34 37238 2.03 32 ± 5.9 2435 ± 9 58 88 92 36.0 −16.22 64 1.34239 ± 6 ATCA240 5.2 30 ± 3 1371 ± 5 176 188 191 16.1 −17.55 13 0.08 ATCA
241 12.32 174 ± 8 1152 ± 3 65 90 84 13.2 −15.03 51 3.17 ATCA242 2.03 44 ± 3 426 ± 6 100 118 133 9.1 −11.01 8 20.15243 2.17 957 ± 2 32 60 70 11.0 −14.18 6.8 0.78245 ± 4246 8.3 149 ± 30 358 ± 3 53 60 71 5.4 −12.28 5.3 3.68 N247 ± 7 ATCA249 18.8 68 ± 20 2089 ± 10 124 131 158 28.5 −17.09 360 2.93 N250 20.0 244 ± 6 127 ± 2 90 104 107 5.6 −14.54 15 1.44251 14.62 223 ± 8 126 ± 2 64 87 94 5.6 −13.72 11 2.23252 1.36 45 ± 5 132 ± 3 27 47 50 5.6 −14.56 1.1 0.10
253 ± 7 ATCA254 ± 8255 1.16 63 ± 4 1682 ± 1 36 44 48 21.1 −15.45 12 0.52 ATCA256 ± 7 ATCA257 3.36 70 ± 5 705 ± 1 77 80 84 8.8 −14.59 6.2 0.58 ATCA258 ± 32 N259 ± 7 ATCA260 ± 6 ATCA
kk 223: 6.5 arcmin NE of UGC 8726 (v = 2334 km s−1), confusedkk 227: companion of NGC 5371kk 236, 237: probably local HIkk 242: near NGC 6503, no obvious confusing object within the antenna beam and 1st sidelobeskk 245: resolved into stars with the 6-m telescope (SAO), v = −157 km s−1 (1)kk 254: undetected in HI (3)kk 260: near NGC 7531
1. Huchra J. (1995)2. Gallagher J.S. et al. (1995).3. Huchtmeier W.K. et al. (1997).4. Huchtmeier W.K. et al. (1981).5. Matthews L.D. et al. (1995).6. Huchtmeier W.K. & Richter O.G. (1989b).7. Schombert J.M. et al. (1992).