objectives: 1. determine whether a graph represents a function. 2. analyze graphs to determine...
TRANSCRIPT
O B J E C T I V E S :
1. D E T E R M I N E W H E T H E R A G R A P H R E P R E S E N T S A F U N C T I O N.
2. A N A LY Z E G R A P H S T O D E T E R M I N E D O M A I N A N D R A N G E , L O C A L M A X I M A A N D M I N I M A , I N F L E C T I O N P O I N T S , A N D I N T E RVA L S W H E R E T H E Y A R E I N C R E A S I N G, D E C R E A S I N G, C O N C AV E U P, A N D C O N C AV E D O W N.
3. G R A P H PA R A M E T R I C E Q UAT I O N S.
3.2 Graphs of Functions
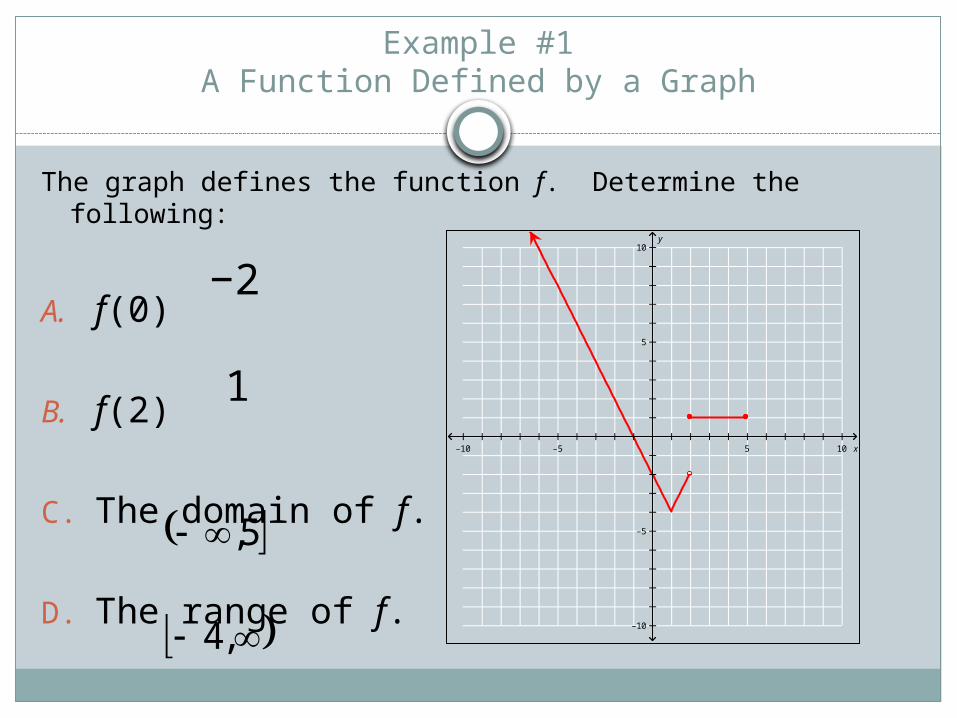
Example #1A Function Defined by a Graph
The graph defines the function f. Determine the following:
A. f(0)
B. f(2)
C. The domain of f.
D. The range of f.
5 10–5–10 x
5
10
–5
–10
y
−2
1
5,
,4
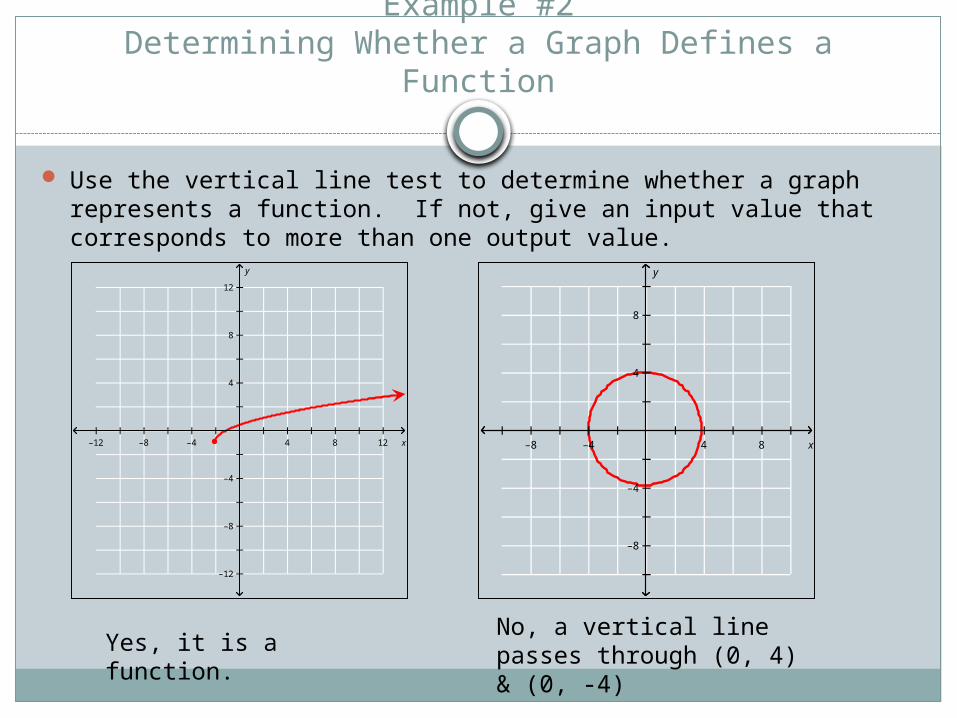
Example #2Determining Whether a Graph Defines a Function
Use the vertical line test to determine whether a graph represents a function. If not, give an input value that corresponds to more than one output value.
4 8 12–4–8–12 x
4
8
12
–4
–8
–12
y
4 8–4–8 x
4
8
–4
–8
y
Yes, it is a function.No, a vertical line passes through (0, 4) & (0, -4)
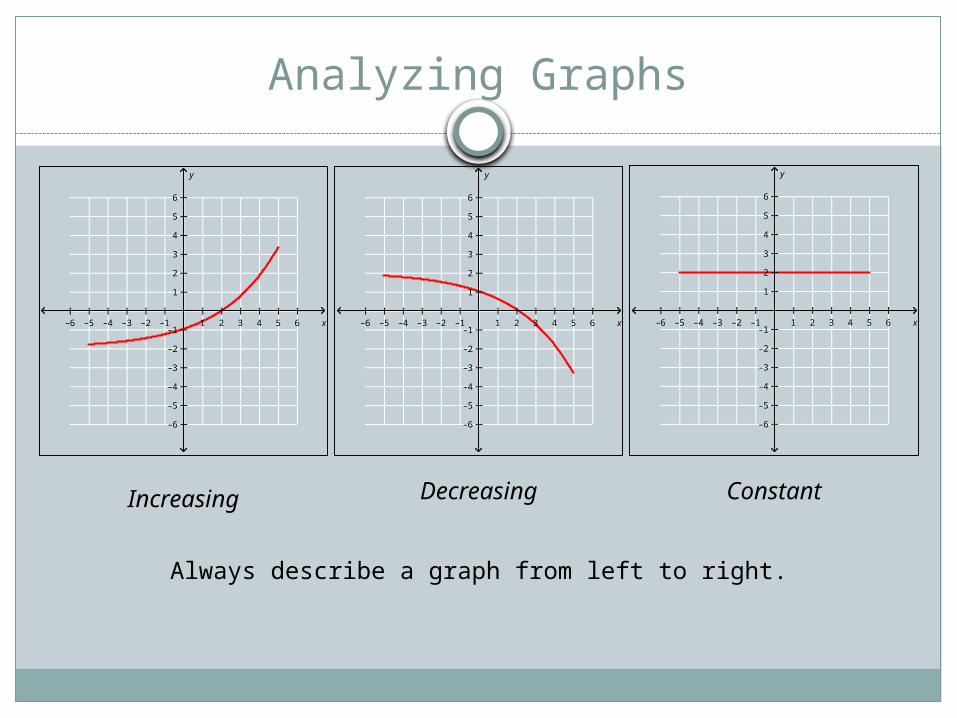
Analyzing Graphs
1 2 3 4 5 6–1–2–3–4–5–6 x
1
2
3
4
5
6
–1
–2
–3
–4
–5
–6
y
1 2 3 4 5 6–1–2–3–4–5–6 x
1
2
3
4
5
6
–1
–2
–3
–4
–5
–6
y
1 2 3 4 5 6–1–2–3–4–5–6 x
1
2
3
4
5
6
–1
–2
–3
–4
–5
–6
y
Increasing Decreasing Constant
Always describe a graph from left to right.
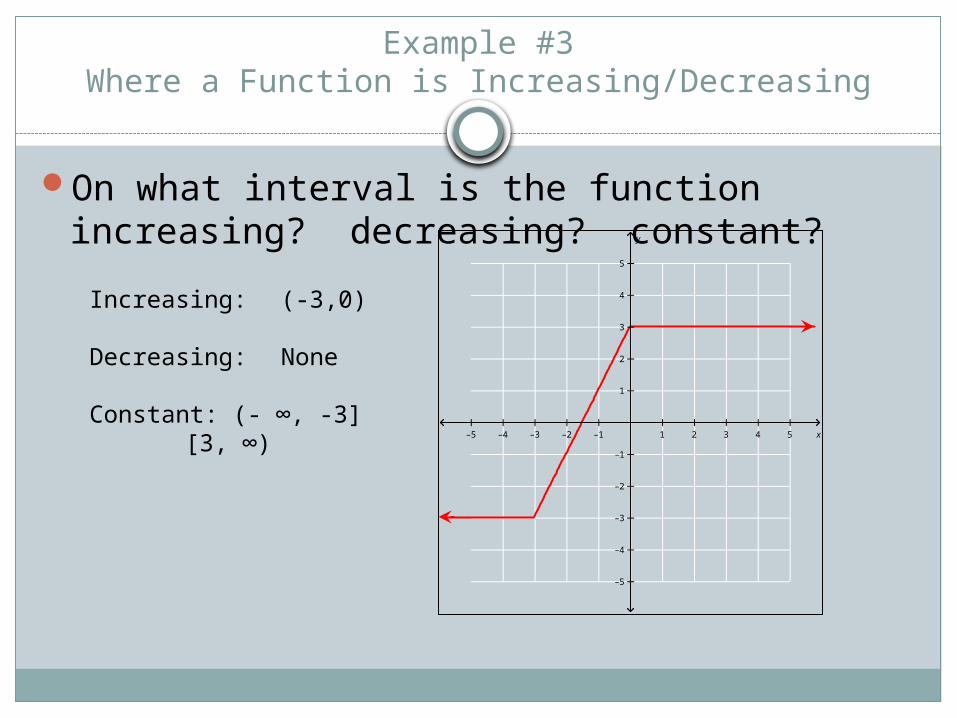
Example #3Where a Function is Increasing/Decreasing
On what interval is the function increasing? decreasing? constant?
1 2 3 4 5–1–2–3–4–5 x
1
2
3
4
5
–1
–2
–3
–4
–5
y
Increasing: (-3,0)
Decreasing: None
Constant: (- ∞, -3][3, ∞)
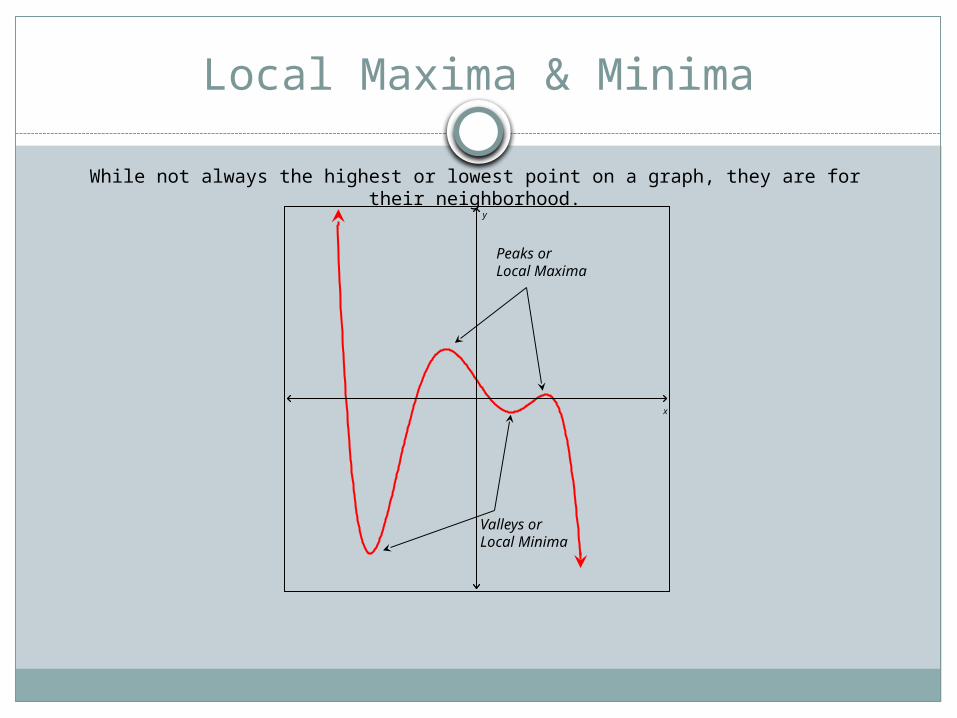
Local Maxima & Minima
x
y
Peaks or Local Maxima
Valleys or Local Minima
While not always the highest or lowest point on a graph, they are for their neighborhood.
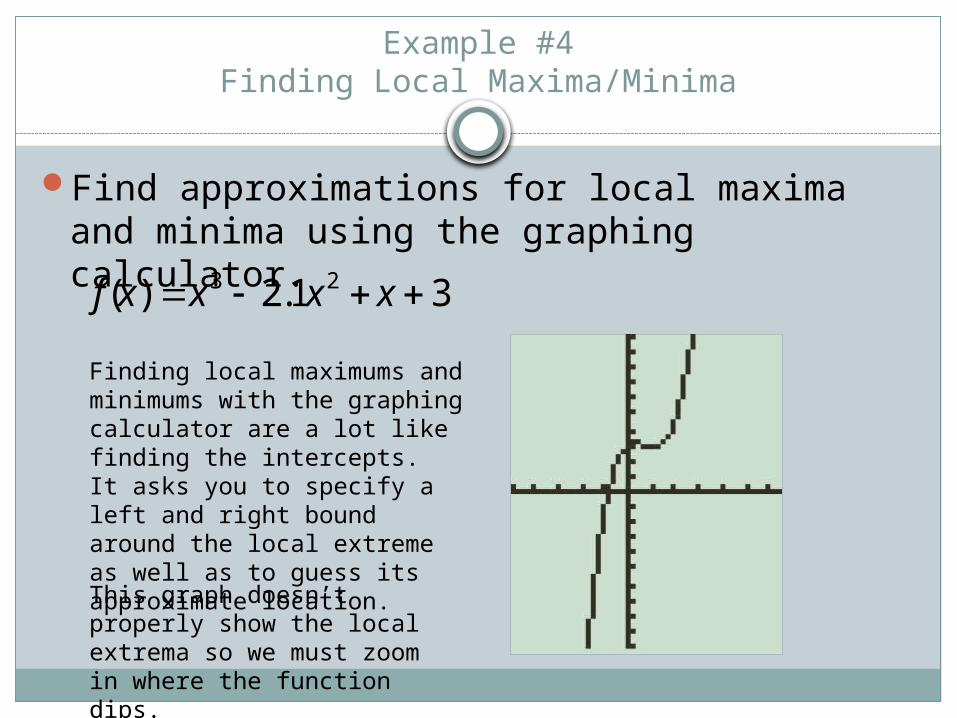
Example #4Finding Local Maxima/Minima
Find approximations for local maxima and minima using the graphing calculator.
f(x) x 3 2.1x 2 x 3
Finding local maximums and minimums with the graphing calculator are a lot like finding the intercepts. It asks you to specify a left and right bound around the local extreme as well as to guess its approximate location.This graph doesn’t properly show the local extrema so we must zoom in where the function dips.

Example #4Finding Local Maxima/Minima
Find approximations for local maxima and minima using the graphing calculator.
f(x) x 3 2.1x 2 x 3 To zoom, press ZOOM 1:ZBox.This will allow you to create a box around the area you wish to magnify.
Move the cursor to the upper left location of where you want to start the rectangle, press ENTER.
Now move the cursor again, this time a rectangle is being drawn on the screen. When you have finished making the box around the region press ENTER again to zoom in.
Here both the local maximum and minimum are visible.
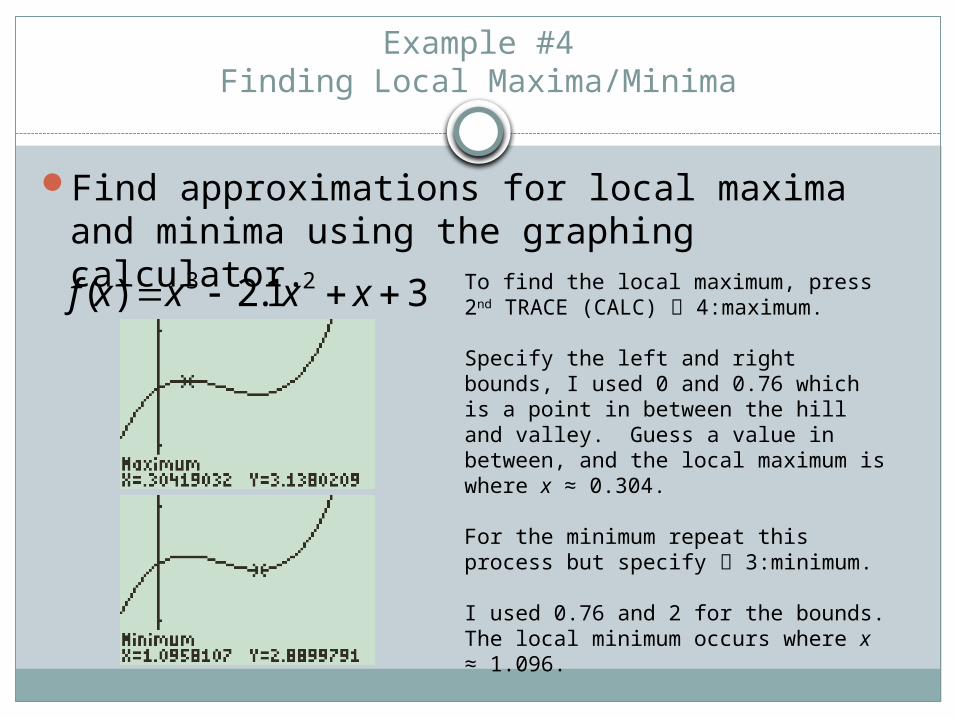
Example #4Finding Local Maxima/Minima
Find approximations for local maxima and minima using the graphing calculator.
f(x) x 3 2.1x 2 x 3 To find the local maximum, press 2nd TRACE (CALC) 4:maximum.
Specify the left and right bounds, I used 0 and 0.76 which is a point in between the hill and valley. Guess a value in between, and the local maximum is where x ≈ 0.304.
For the minimum repeat this process but specify 3:minimum.
I used 0.76 and 2 for the bounds.The local minimum occurs where x ≈ 1.096.
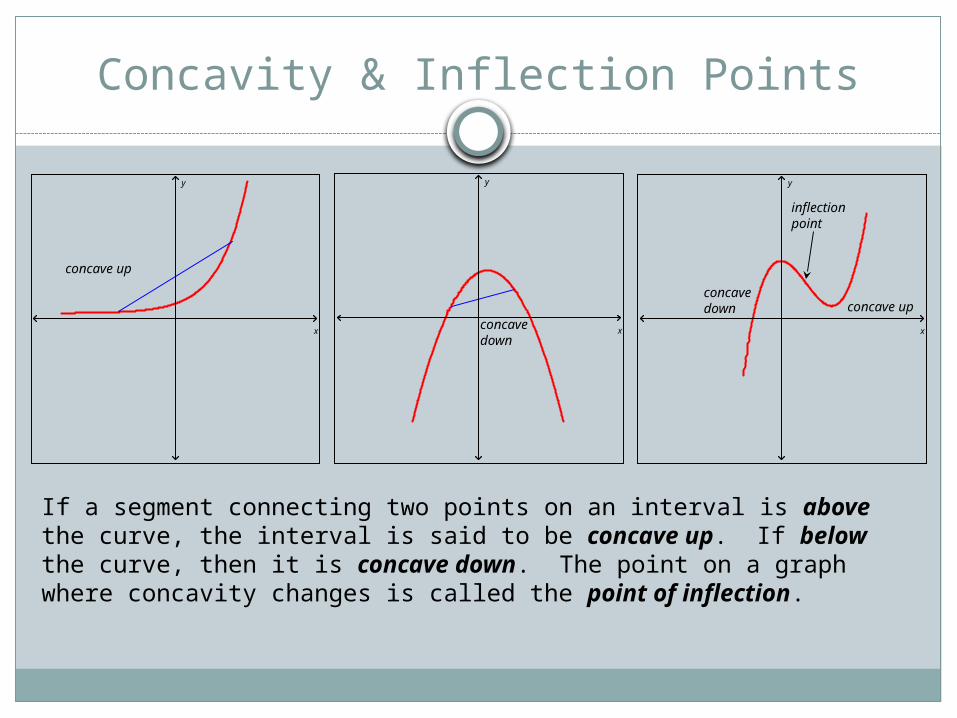
Concavity & Inflection Points
x
y
x
y
x
y
inflection point
concave upconcave down
If a segment connecting two points on an interval is above the curve, the interval is said to be concave up. If below the curve, then it is concave down. The point on a graph where concavity changes is called the point of inflection.
concave up
concave down
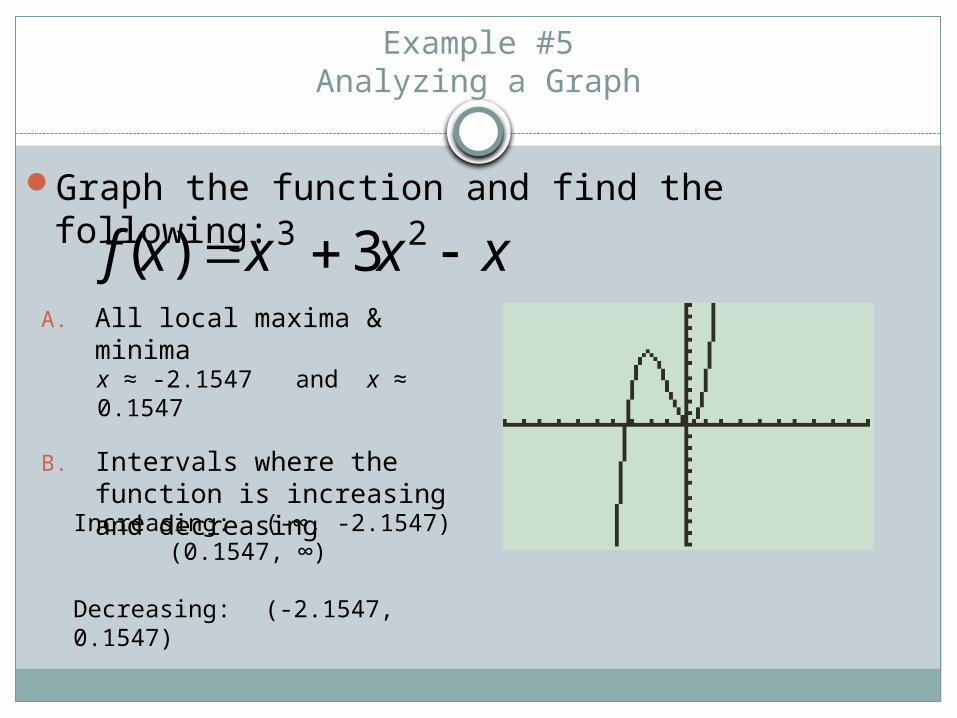
Example #5Analyzing a Graph
A. All local maxima & minima
B. Intervals where the function is increasing and decreasing
f(x) x 3 3x 2 xGraph the function and find the
following:
x ≈ -2.1547 and x ≈ 0.1547
Increasing: (-∞, -2.1547)(0.1547, ∞)
Decreasing: (-2.1547, 0.1547)
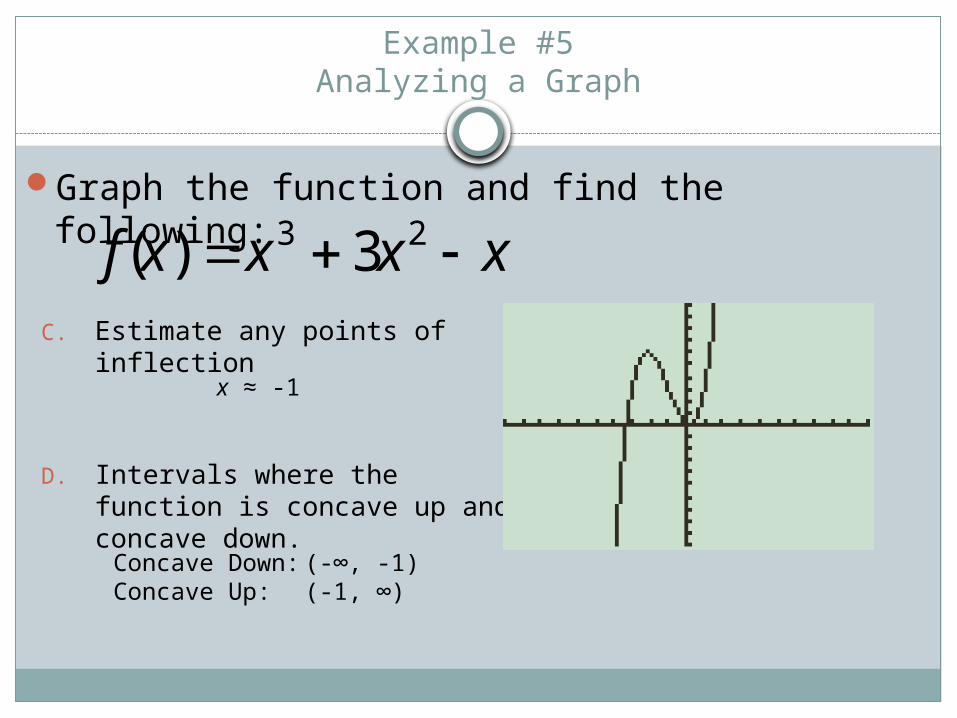
Example #5Analyzing a Graph
C. Estimate any points of inflection
D. Intervals where the function is concave up and concave down.
f(x) x 3 3x 2 xGraph the function and find the
following:
x ≈ -1
Concave Down:(-∞, -1)Concave Up: (-1, ∞)

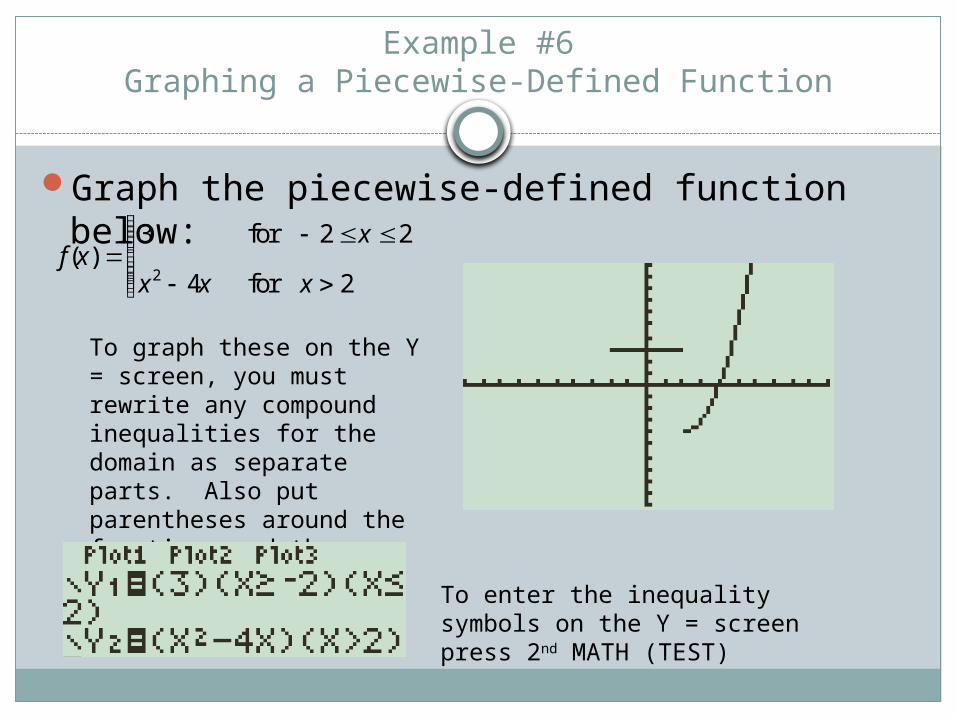
Example #6Graphing a Piecewise-Defined Function
Graph the piecewise-defined function below:
f(x) 3 for 2x 2
x2 4x for x 2
1 2 3 4 5–1–2–3–4–5 x
1
2
3
4
5
–1
–2
–3
–4
–5
y
A piecewise function is made up of pieces of various functions. The dotted lines represent the entire graph of each function while the red parts are what are defined by the given intervals.
Example #6Graphing a Piecewise-Defined Function
Graph the piecewise-defined function below:
f(x) 3 for 2x 2
x2 4x for x 2
To graph these on the Y = screen, you must rewrite any compound inequalities for the domain as separate parts. Also put parentheses around the functions and the domains separately.
To enter the inequality symbols on the Y = screen press 2nd MATH (TEST)
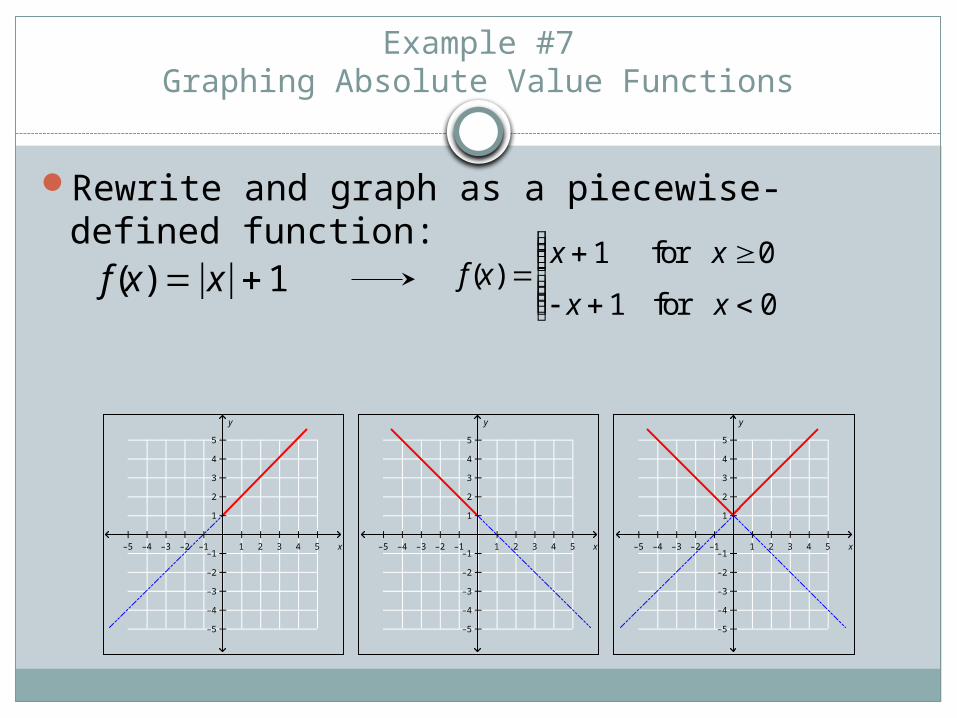
Example #7Graphing Absolute Value Functions
Rewrite and graph as a piecewise-defined function:f(x) x 1
1 2 3 4 5–1–2–3–4–5 x
1
2
3
4
5
–1
–2
–3
–4
–5
y
1 2 3 4 5–1–2–3–4–5 x
1
2
3
4
5
–1
–2
–3
–4
–5
y
1 2 3 4 5–1–2–3–4–5 x
1
2
3
4
5
–1
–2
–3
–4
–5
y
f(x) x 1 for x 0
x 1 for x 0
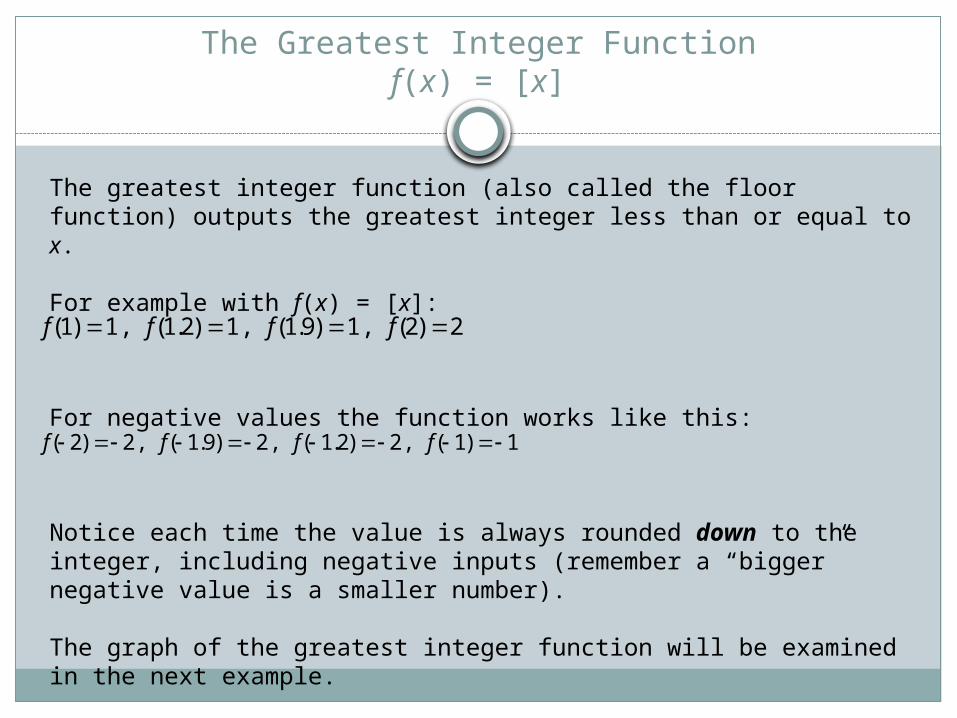
The Greatest Integer Functionf(x) = [x]
The greatest integer function (also called the floor function) outputs the greatest integer less than or equal to x.
For example with f(x) = [x]:
For negative values the function works like this:
Notice each time the value is always rounded down to the integer, including negative inputs (remember a “bigger” negative value is a smaller number).
The graph of the greatest integer function will be examined in the next example.
f(1) 1, f(1.2) 1, f(1.9) 1, f(2) 2
f( 2) 2, f( 1.9) 2, f( 1.2) 2, f( 1) 1
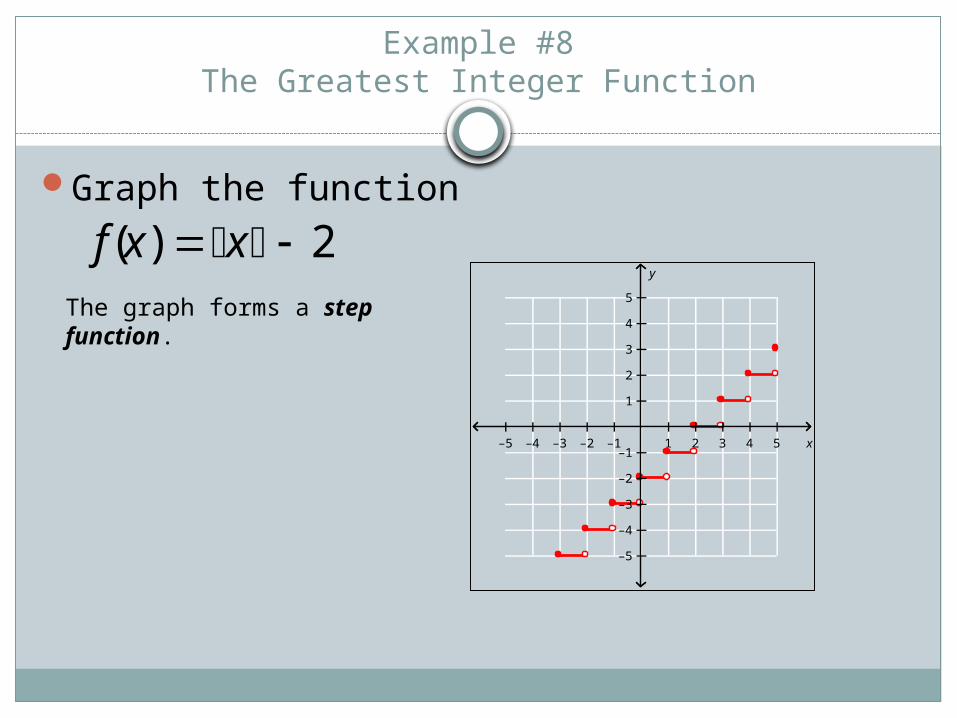
Example #8The Greatest Integer Function
Graph the function
f(x) x 2
1 2 3 4 5–1–2–3–4–5 x
1
2
3
4
5
–1
–2
–3
–4
–5
y
The graph forms a step function.
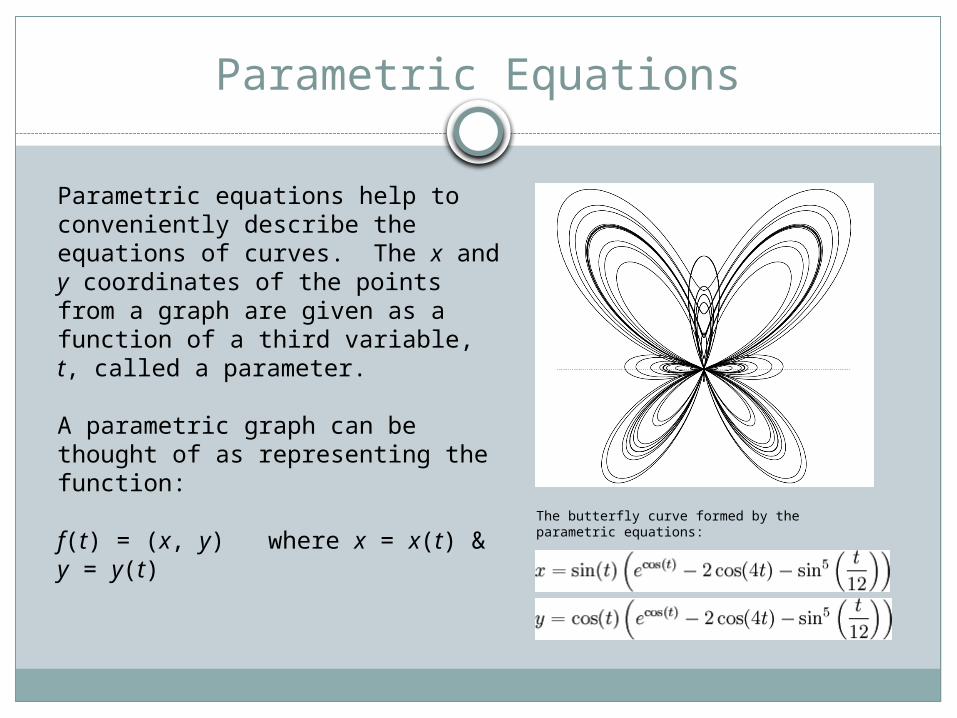
Parametric Equations
Parametric equations help to conveniently describe the equations of curves. The x and y coordinates of the points from a graph are given as a function of a third variable, t, called a parameter.
A parametric graph can be thought of as representing the function:
f(t) = (x, y) where x = x(t) & y = y(t) The butterfly curve formed by the parametric
equations:
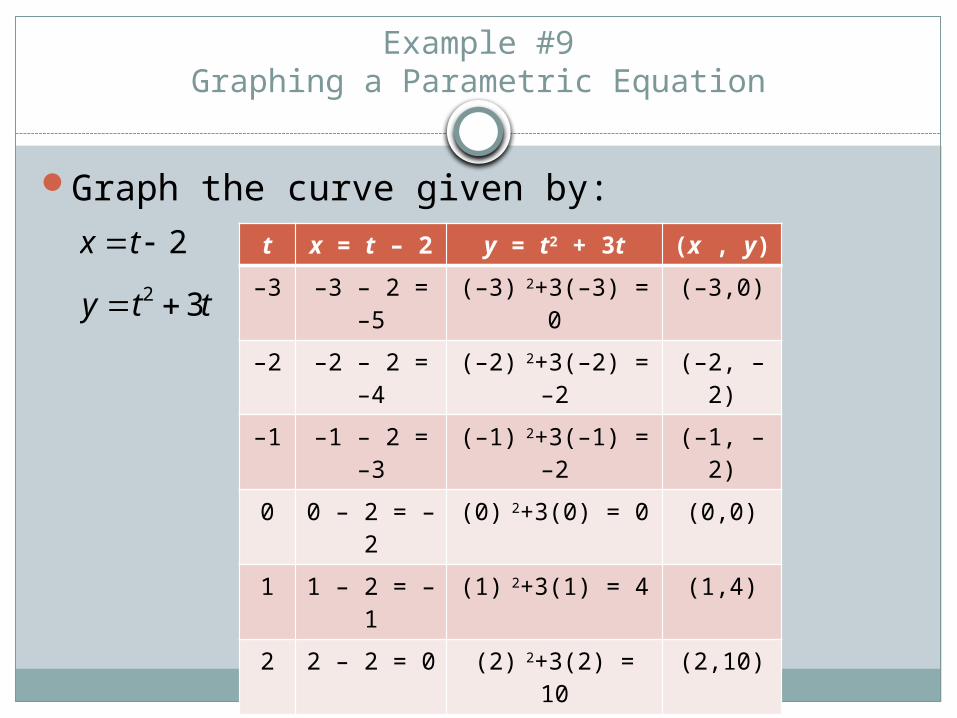
Example #9Graphing a Parametric Equation
Graph the curve given by:
x t 2
y t2 3t
t x = t – 2 y = t2 + 3t (x , y)
–3 –3 – 2 = –5 (–3) 2+3(–3) = 0 (–3,0)
–2 –2 – 2 = –4 (–2) 2+3(–2) = –2
(–2, –2)
–1 –1 – 2 = –3 (–1) 2+3(–1) = –2
(–1, –2)
0 0 – 2 = –2 (0) 2+3(0) = 0 (0,0)
1 1 – 2 = –1 (1) 2+3(1) = 4 (1,4)
2 2 – 2 = 0 (2) 2+3(2) = 10 (2,10)
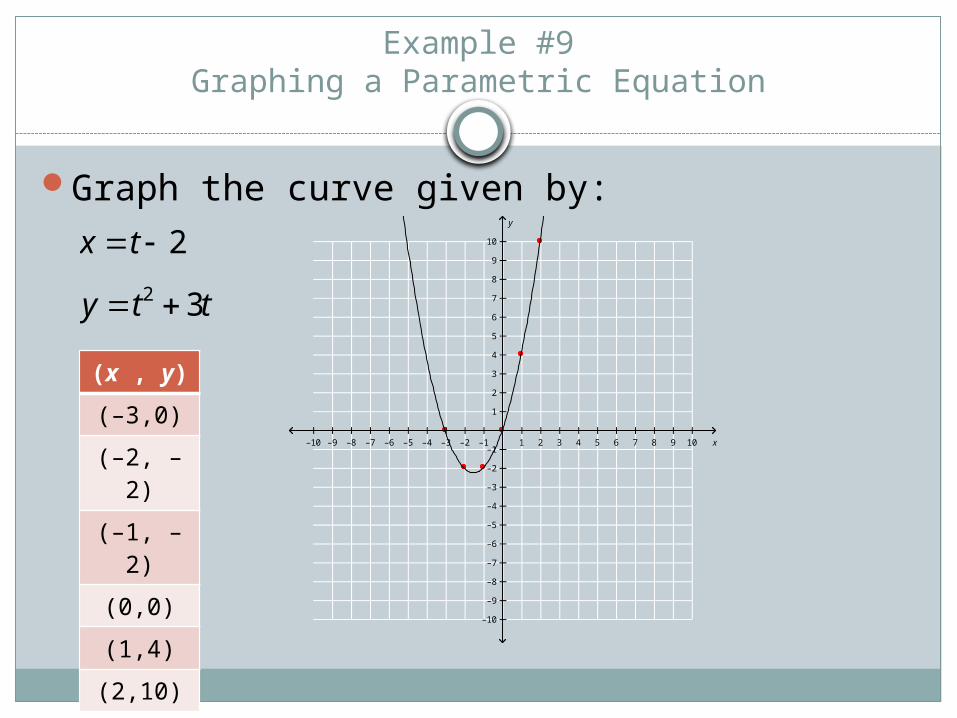
Example #9Graphing a Parametric Equation
Graph the curve given by:
x t 2
y t2 3t
(x , y)
(–3,0)
(–2, –2)
(–1, –2)
(0,0)
(1,4)
(2,10)
1 2 3 4 5 6 7 8 9 10–1–2–3–4–5–6–7–8–9–10 x
1
2
3
4
5
6
7
8
9
10
–1
–2
–3
–4
–5
–6
–7
–8
–9
–10
y
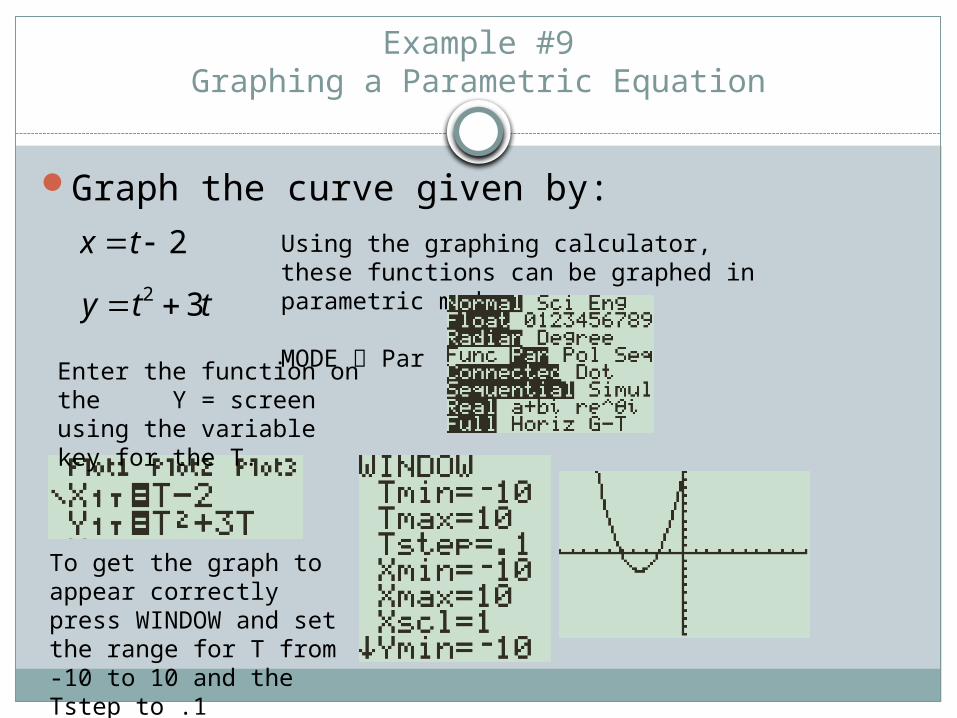
Example #9Graphing a Parametric Equation
Graph the curve given by:
x t 2
y t2 3t
Using the graphing calculator, these functions can be graphed in parametric mode.
MODE ParEnter the function on the Y = screen using the variable key for the T.
To get the graph to appear correctly press WINDOW and set the range for T from -10 to 10 and the Tstep to .1
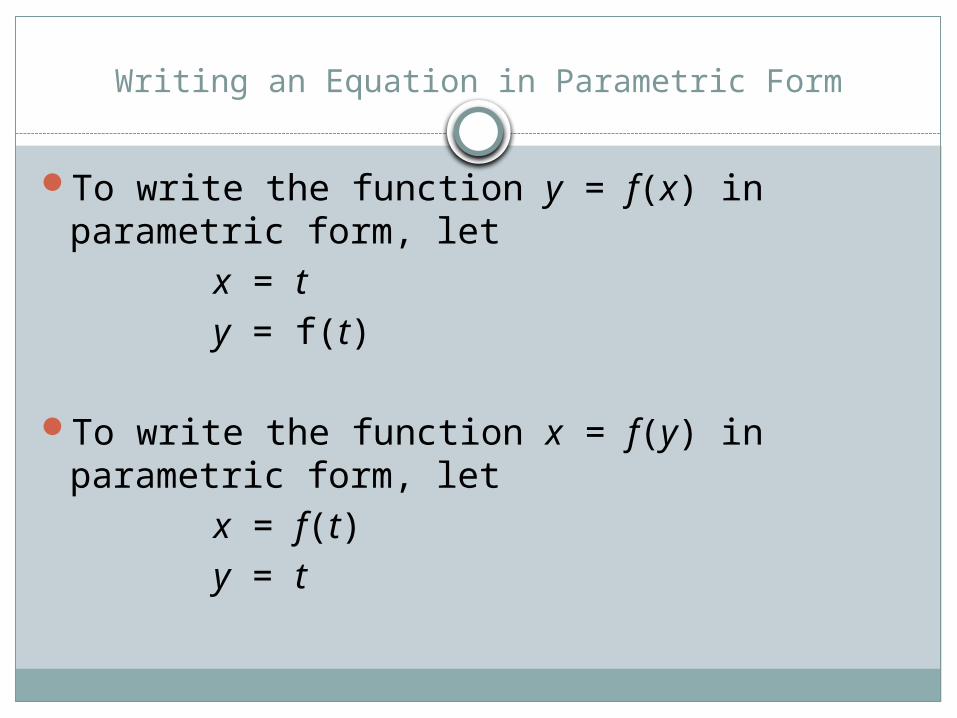
Writing an Equation in Parametric Form
To write the function y = f(x) in parametric form, let
x = t y = f(t)
To write the function x = f(y) in parametric form, let
x = f(t)y = t
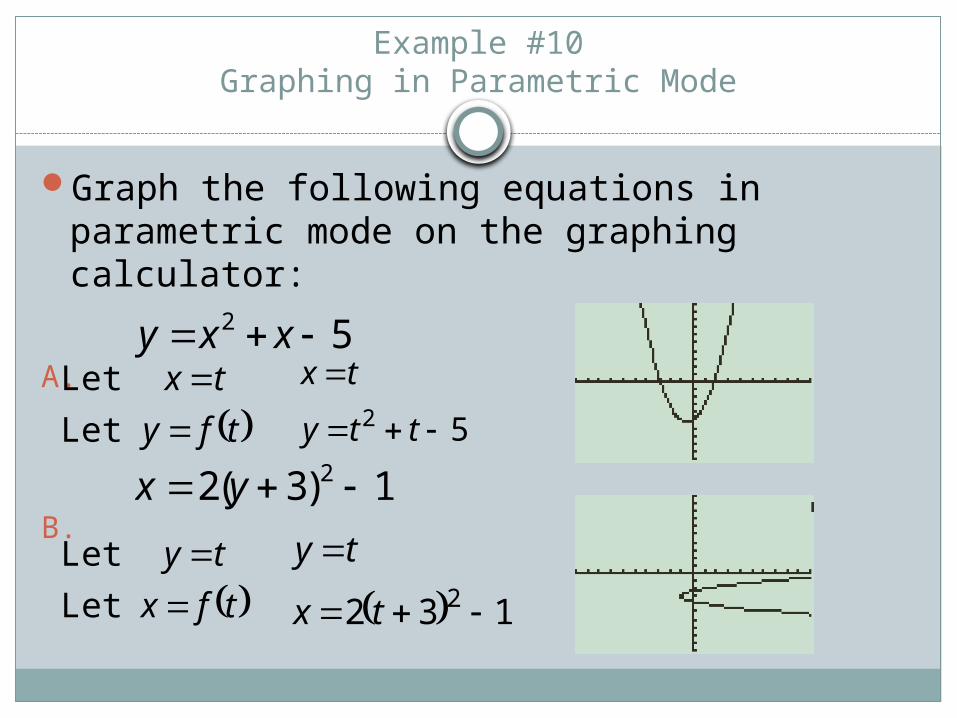
Example #10Graphing in Parametric Mode
Graph the following equations in parametric mode on the graphing calculator:
A.
B.
y x 2 x 5
x 2(y 3)2 1 tfy
tx
Let
Let
tfx
ty
Let
Let
52
tty
tx
132 2
tx
ty