oak ridge national laboratory union carbide …
TRANSCRIPT
OAK RIDGE NATIONAL LABORATORY LIBRARIES
3 44Sb 0S4fl55t> D
DHITBAL Rck^fift .:::•• AniQOGUM
OAK RIDGE NATIONAL LABORATORY
operated by
UNION CARBIDE CORPORATION M ^for the
U.S. ATOMIC ENERGY COMMISSION
ORNL- TM- 34
l^\
CHEMICAL TECHNOLOGY DIVISION
UNIT OPERATIONS SECTION
MONTHLY PROGRESS REPORT
JUNE 1961
CENTRAL RESEARCH LIBRARYDOCUMENT COLLECTION
LIBRARY LOAN COPYDO NOT TRANSFER TO ANOTHER PERSON
If you wish someone else to see thisdocument, send in name with documentand the library will arrange a loan.
NOTICE
This document contains information of a preliminary nature and was preparedprimarily for internal use at the Oak Ridge National Laboratory. It is subjectto revision or correction and therefore does not represent a final report. Theinformation is not to be abstracted, reprinted or otherwise given public dissemination without the approval of the ORNL patent branch, Legal and Information Control Department.

LEGAL NOTICE — —
This report wos prepored as an account of Government sponsored work. Neither the United States,nor the Commission, nor any person acting on behalf of the Commission:
A. Makes any warranty or representation, expressed or implied, with respect to the accuracy,
completeness, or usefulness of the information contained in this report, or that the use of
ony information, apparatus, method, or process disclosed in this report may not infringe
privately owned rights; or
B. Assumes any liabilities with respect to the use of, or for damages resulting from the use of
any information, apparatus, method, or process disclosed in this report.
As used in the above, "person acting on behalf of the Commission" includes any employee or
contractor of the Commission, or employee of such contractor, to the extent that such employee
or contractor of the Commission, or employee of such controctor prepares, disseminates, or
provides access to, any information pursuant to his employment or contract with the Commission,
or his employment with such contractor.

ORNL-TM-^l-
UNIT OPERATIONS SECTION MONTHLY PROGRESS REPORT
June 196l
CHEMICAL TECHNOLOGY DIVISION
M. E. Whatley
P. A. Haas
R. W. Horton
A. D. RyonJ. C. Suddath
C. D. Watson
Date Issued
JAN 2 3 1962
OAK RIDGE NATIONAL LABORATORY
Oak Ridge, TennesseeOperated By
UNION CARBIDE CORPORATION
for the
U. S. Atomic Energy Commission
IIMl ffill mun»Ai LABORATORY LIBRARIES
3 445b DS4aSSb 0

-2-
ABSTRACT
An interfacial viscosimeter has been built for use in an interfacial
phenomena study. Installation of a 6-in.-ID foam separation column systemwas completed. The dispersion-drying-sintering characteristics of sixlow-nitrate batches of thoria sol material were studied. The averageeffective porosity of the CuO pellets used for reactor helium purificationwas determined to be 0.05^5 for Rs transport and 0.0526 for CO transport.In continuous Zirflex dissolution studies no H2O2 decomposition was observedwhen 10$ H2O2 was fed into boiling dissolvent through a water-cooled nozzleand the oxygen concentration in the scrubbed off-gas could be used to controlthe H2O2 concentration in the dissolver. The free fluoride in Zirflexsolutions must be maintained above 1 molar in order to prevent uraniumprecipitation at low concentrations of uranium even though the F~/u ratioexceeds 100. Chopped stainless steel clad UO2 sections were leached ina h stage pyrex leacher model using 6, 7> and 8 M nitric acid as thedissolvent. The temperature distribution expected within fuel elementsconsisting of square arrays of tubes has been calculated for shippingconditions assuming heat be transferred only by radiation. HETS valueswere calculated for uranium stripping under 5$ TBP flowsheet conditions.Very fine particles were obtained by quenching fused salt droplets inwater. A waste calcination run was made using TBP-25 waste and the closecoupled evaporator calciner system.

-3-
CONTENTS
Page
Abstract 2
Previous Reports in This Series h
Summary 5
1.0 Chemical Engineering Research 8
2.0 Fuel Cycle Development lk
3-0 GCR Coolant Purification Studies 17
k.O Power Reactor Fuel Processing 23
5-0 Reactor Evaluation Studies 32
6.0 Solvent Extraction Studies 39
7.0 Volatility kh
8.0 Waste Processing 5&

-4-
PREVIOUS REPORTS IN THIS SERIES
CF Numbers for UNOP Monthly Reports
December 1954 (Part I-:HR) 55-1-45December 1954 (Part II) 55-1-62
January 1955 55-1-194 January 1958 58-1-137February 1955 55-2-185 February 1958 58-2-139March 1955 55-3-190 March 1958 58-3-71April 1955 55_4_l64 April 1958 58-4-123May 1955 55-5-179 May 1958 58-5-50June 1955 55-6-180 June 1958 58-6-85July 1955 55-7-138 July 1958 58-7-126August 1955 55-8-157 August 1958 58-8-59September 1955 55-9-150 September 1958 58-9-62October 1955 55-10-110 October 1958 58-10-90November 1955 55-11-176 November 1958 58-11-93December 1955 55-12-154 December 1958 58-12-35
January 1956 56-1-175 January 1959 59-1-74February 1956 56-2-154 February 1959 59-2-45March 1956 56-3-177 March 1959 59-3-61April 1956 56-4-210 April 1959 59-4-47May 1956 56-5-197 May 1959 59-5-47June 1956 56-6-177 June 1959 56-6-63July 1956 56-7-150 July 1959 59-7-58August 1956 56-8-215 August 1959 59-8-76September 1956 56-9-127 September 1959 59-9-69October 1956 56-10-83 October 1959 59-10-77November 1956 56-11-143 November 1959 59-11-54December 1956 56-12-128 December 1959 59-12-49
Chemical Technology Division Monthly Reports January
Februaryi960i960
60-1-4960-2-56
January 1957 0RNL-2251 March i960 60-3-61February 1957 0RNL-2270 April i960 60-4-37March 1957 ORNL-2307 May i960 60-5-58April 1957 0RNL-2324 June i960 60-6-11
May 1957 ORNL-2361 July i960 60-7-46June 1957 0RNL-2362 August i960 60-8-86
July 1957 ORNL-2385 September i960 60-9-43August 1957 ORNL-2400 October i960 60-10-49September 1957 0RNL-2416 November i960 60-II-38October 1957 0RNL-2417 December i960 60-12-28
November 1957 0RNL-2447December 1957 0RNL-2468 January 196l 61-1-27
February 1961 61-2-65March 1961 61-3-67April 1961 ORNL-TM-32
May 1961 ORNL-TM-33
June 196l ORNL-TM-34

-5-
SUMMARY
1.0 CHEMICAL ENGINEERING RESEARCH
1.1 Interfacial Phenomena in Mass Transfer
An interfacial viscosimeter has been built for use in an interfacial
phenomena study. In a preliminary experiment, the viscosity of the air-water interface of a solution containing 10 ppm of the commercial detergent"Tide" was measured as 0.95 two-dimensional centipoise at 25°C. Thesensitivity of the instrument appears to be on the order of 10~4 two-dimensional poise (i.e., dyne-sec/cm).
1.2 Foam Separation
Installation of a 6-in.-LD foam separation column system was completed.The 0.4-in.-dia cyclone used as a foam breaker gave a wet foam about l/500thof the inlet foam volume. An altered column top was required to eliminateliquid level surging induced by the cyclone foam breaker. An altered feeddistributor reduced, but did not eliminate, channeling in the column.
2.0 FUEL CYCLE DEVELOPMENT
The dispersion-drying-sintering characteristics of six representativelow-nitrate batches (N/Th ratios from 0.040 to 0.066) were studied. Aminimum dispersion of 98 wt $ was obtained for all these powders at N/Thratios of ~0.11. Portions of these same batches, which were leached inhot water (8o°C) and dried immediately after denitration, required N/Thratios between 0.15 and 0.19 fcr dispersion. Toluene densities for allsintered products ranged from 9.76 to 9.88 g/cc and were apparently independent of the N/Th ratio. Eight fuel pins containing Th,02-U02 prepared in thelaboratory by this process and vibratorily compacted to 8.6 or 8.7 g/cchave performed satisfactorily for the initial two months of irradiationin the NRX reactor. These 5/l6-in.-OD elements loaded with 4.3 wt $enriched UO2 will probably accumulate 8,000 to 15,000 megawatt days/metricton of Th at 300,000 Btu/hr-ft2 surface heat flux.
3.0 GCR COOLANT PURIFICATION STUDIES
The average effective porosity of CuO pellets was determined to be0.0545 for H2 transport and 0.0526 for CO transport based on the reactionof H2 or CO with CuO pellets in differential bed tests. The expressionfor the mass transfer factor of H2 across an external gas-film surroundinga CuO pellet as a function of Reynold's Number was determined to be,JD = 0.24 (Re')"°'s9.
4.0 POWER REACTOR FUEL PROCESSING
4.1 Modified Zirflex
In continuing studies of the dissolution of U-Zr-Sn in NH4F-NH4NO3-H2O2no gassing (indicating H202 decomposition in the line) was observed when 10$
-6-
H2O2 was fed into boiling dissolvent through a water-cooled nozzle. Thebehavior of the O2 concentration in the scrubbed off-gas with time indicatedthat the continuous H2O2 addition rate could be controlled by maintaining~3 + 2$ O2 in the off-gas (principally hydrogen). The presence of as muchas 1$ O2 has indicated a sufficient H2O2 addition to maintain UVI in thedissolvent. While a reasonable excess of H2O2 is not harmful in the dissolution, limiting the off-gas O2 concentration to "$ 5$ avoids the flammablerange for O2-H2 mixtures (lower limit for O2 in hydrogen is 6$).
In engineering-scale runs dissolving 8$ U-ZrH a small amount (< 1$ offuel charged) of a green precipitate containing 60$ U, 23$ F, and 6.4$ Zrformed when the final free F~/u ratio -g 82. A similar amount of precipitateformed at F~/u = 115 when dissolving 2$ U-Zr-Sn (PWR seed). Here a higherF~/u ratio resulted from a much lower free F" concentration since the Uwas lower by a factor of 4. This indicated that not only must a free F"/uratio of 90-100 be maintained (controlling for high U fuels) but also thefree F~ M of the dissolvent must not drop below ~1 M (limiting for low Ufuels) if total dissolution without precipitation is to be accomplished.
4.2 Shearing and Leaching
The composite product when leaching the UO2 from chopped stainless steelclad UO2 sections, l/2-in.-OD x 1-in. long, in the 4 stage pyrex leachermodel using 6, 7, and 8 M HNO3 as the dissolvent was 325 g U/liter and2.5 M HNO3, 350 g U/liter and 3-0 M HNO3, and 425 g u/liter and 3-0 M HN03.
5-0 REACTOR EVALUATION STUDIES
5-1 Heat Transfer from Spent Fuel Elements during Shipping
The temperature distributions expected within fuel elements duringshipping if heat could be transferred only by radiation have been calculated.These results are reasonably close to the temperatures obtained from experimental measurements with electrically heated mock fuel elements and a simulatedshipping carrier, especially at higher heat generation rates. Calculationsfor a 36 tube bundle and a heat generation rate of O.0986 watts/cm had anaverage deviation from the measured temperatures of approximately l6°C, andthe maximum temperature could generally be predicted more closely than this.However, there were still noticeable effects of convection such as nonuniform carrier wall temperatures and unsymmetrical temperatures about thehorizontal plane through the center of the bundle.
6.0 SOLVENT EXTRACTION STUDIES
HETS values were calculated for uranium stripping under 5$ TBP flowsheetconditions. HETS values were ~2.0 feet for aqueous continuous operation ofthe sieve plate column and for solvent continuous operation of the nozzleplate column regardless of the pulse frequency used. An aqueous continuousoperation of the nozzle plate column resulted in a HETS value of 3«1 feetfor the pulse frequencies tested.

-7-
7-0 VOLATILITY
Fused NaF, LiF, ZrF4 salt was sprayed with two fluid atomizing nozzlesfor 15 min obtaining a mean droplet size of ~6o micron. Very fine particles(< 5 micron) were obtained by water quenching the hot droplets.
8.0 WASTE PROCESSING
Using simulated TBP-25 waste, the evaporator-calciner close coupledsystem was operated under continuous control conditions. Control of thesystem was satisfactory during the complete test, except for one timeperiod (one hour duration) when the evaporator was upset by foaming and aplugged liquid level probe. Stable ruthenium was added to the feed tofollow its behavior during the test. By chemical analysis the onlyruthenium in the system at the end of the test was in the calcinerand the liquid heel of the evaporator. The ruthenium in the evaporatorcondensate was below the detectable concentration. Mercury behavedsimilar to the ruthenium except its concentration increased in theevaporator heel during the calcination period.
-8-
1.0 CHEMICAL ENGINEERING RESEARCH
1.1 Interfacial Phenomena in Mass Transfer - C V. Chester
Previous studies on the water-uranyl nitrate-tributyl phosphate systemindicate that in solvent extraction contactors the rate-limiting processfor the extraction of uranyl nitrate is diffusive and convective transportof the molecular species concerned to and from the interface. Many investigators have found that certain interfacial phenomena, such as interfacialturbulence, and interfacial pressure caused by surface active agents, canhave a profound effect on the rate of mass transfer in solvent extraction.
To obtain basic information on the mechanics of contactor operation,studies of the hydrodynamics of solvent extraction system interfaces arebeing undertaken. It is believed that such studies will lead to improveddesign of contactors and contactor operation. One of the interfacialproperties of interest is that of two-dimensional shear viscosity. Thisplays a role in the reduction of drop circulation and interfacial turbulence,to the detriment of mass transfer. The presence of surface active agentsincreases interfacial viscosity.
An interfacial viscosimeter has been designed and constructed (Figures 1.1and 1.2). It is essentially a modified two-dimensional Brookfield viscosimeter.A stationary ring is suspended in the interface by a fine wire of known torsional spring constant. A ring surrounding the stationary ring with a knownclearance is rotated at constant velocity. From the torque produced in thestationary ring by the shear in the interface, the interfacial viscositycan be calculated. Momentum transfer from the rotating to the stationaryring is minimized by appropriate baffles, and can be separately measuredand compensated for.
Before operation, the instrument had to be carefully adjusted so thatall the parts were co-axial. The torsional spring constant of the wire wasdetermined by giving a small angular displacement to the inner ring and thenmeasuring its period of oscillation (45 sec). The period is equal to thesquare root of the ratio of the moment of inertia of the ring (223.4 g cm2)to the spring constant of the wire. The spring constant was 0.1104 dyne-cm/radian.
In operation, the instrument was leveled up in a crystallizing dish,and the rest position of the inner ring noted. The motor was connected tothe drive shaft and started. Distilled water was slowly added until theinterface was between the rings. The rotation of the drum dial necessaryto restore the ring to its rest position (through torsion on the wire) wasnoted (120°). The water level was then raised until the top surfaces ofboth rings were submerged, and hence no longer in the interface. Thetorque on the inner ring was continuously increasing during this process,and the drum reading was 220° when the rings were finally wet.
Water was pipetted from the system until the level was again belowboth rings. When the rings had dried, the rest position was again noted(0°). The level was raised again to the interface position between the

Drum Dial
Vernier
To Motor
Interface
UndergoingShear
Water Level
Annular
Baffle
-9-
UNCLASSIFIED
ORNL-LR-DWG 62879
Suspension AndTorsion Wire
.002" Dia.
WWt
Jeweled Pivot
Outer
RotatingRing
Fig. 1.1. Interfacial viscosimeter (set up for air-water interface)

-10-
Fig. 1.2. Interfacial viscosimeter setup.
UNCLASSIFIED
PHOTO 54443

-11-
rings, and the deflection noted (120°). Then 10 ppm of the commercialdetergent "Tide" was added to the system. In a few seconds the inner ringbegan to follow the rotating ring. At equilibrium, four complete turns onthe drum dial (l440°) were required to bring the inner ring to its restposition, with the outer ring making 9 revolutions per minute.
When the level of the solution was raised until the surfaces of the
rings were just submerged, the drum reading was 220°, the same as withoutthe detergent.
The fact that there was no observed decrease in deflection when the
clean interface passed the upper surfaces of the rings indicates that theviscosity of the clean interface per se is below detection in the experiment.
From the radius of the ring (5.59 cm) and the separation of the tworings (0.10 cm) the effective shear viscosity of the interface was calculatedas 0.95 two-dimensional centipoise in a shear field of 52.7 cm/sec, cm. Theshear field is specified as it is expected the interface may not be Newtonian,in the two-dimensional sense. The viscosity measured is in the range foundby Harkins ("Physical Chemistry of Surface Films," Reinhold, 1952) formonolayers of fatty acids on water.
In the immediate future, some of the reported surface viscosities willbe checked quantitatively, and then some interfacial (liquid-liquid) viscositieswill be measured.
1.2 Foam Separation - P. A. Haas, W. W. Wall, Jr.
Engineering studies of foam-liquid contacting columns as separationsystems have started at ORNL. An application of immediate interest wouldbe the removal of certain fission products from waste. Studies of thechemistry of foam and surface active agents in Chemical Development Section Bhave determined systems of interest for waste processing. A 6-in.-ID 'foamcolumn system (Figure 1.3) was installed in Cell 3 of Bldg. 4505- Calibration of flowmeters and preliminary checkout operation of the system werecompleted.
The 0.40-in.-dia cyclone condensed the foam to a liquid and a smallvolume of wet foam. During one two-hour test period, the liquid and wetfoam volume was l/500th of the column foam volume. Effective condensationwas not obtained when the flow was reduced to the 3 liter/min column foamrate. The usual operating conditions were atmospheric pressure at the topof the column and cyclone discharge to house vacuum. Flow rate-condensationefficiency-pressure drop measurements remain to be determined. Cyclicpressure variations of several inches of water, several cycles per minutein the column were observed when the column vent was a 3/8-in. tubing teein the column to cyclone line. Substitution of a 2-in.-ID tee at the columntop as a vent eliminated these fluctuations and results in excellent liquidlevel control by use of the jackleg.

Bottoms
•12-
UNCLASSIFIED
ORNL-LR-DWG 62880
Vacuum
10 psiN2
(From CYL)
Fig. 1.3. Foam separation column system.

-13-
Channeling of liquid in the 6-in.-dia column was evident from regionsof foam downflow at velocities up to 3 cm/sec when the net foam flow was 0.1to 0.4 cm/sec upward. The amount of channeling was reduced when the distribution of the liquid feed across the column cross section was improved. Theamount of channeling varied with foam and liquid flow rates, but somechanneling was observed for all combinations of 1000 to 4000 cc/min foamrates and 100 to 1300 cc/min liquid feed rates.

-14-
2.0 FUEL CYCLE DEVELOPMENT
P. A. Haas
The fuel cycle program is a study of fuel materials preparation andfuel element fabrication procedures economically adaptable to remote operationfor recycle of fissile and fertile materials. Vibratory compaction of highdensity TI1O2 or TI1O2-UO2 particles has been selected as a promising methodfor remote loading of cladding tubes. Denitration of Th(N03)4 in steamatmospheres gives products which can be converted into thoria or thoria-urania sols and then dried and calcined into oxide particles of near theoretical density. The present emphasis is on engineering development ofthese oxide preparation steps and on the irradiation of test elements ofvibratorily compacted oxides.
2.1 Oxide Preparation Development - C. C. Haws, Jr., J. W. Snider, R. D. Arthur
Six runs were made in the trough calciner to determine the reproducibility of the operation and to furnish a number of representative low-nitratefeed materials for drying-dispersion-sintering studies. The N/Th ratio washeld between 0.048 and 0.066 (Table 2.1). By adding nitric acid to a totalN/Th ratio of ~0.11, all batches were dispersed to ^ 98 wt $.' These dispersions have the lowest nitrate content of any thoria sols made to date andoffer an opportunity to study the properties of materials produced fromlow nitrate thorias.
No discernible relationships were found between sintered product density,screen size analysis and the N/Th ratio of the sols. Sintered thoria fromthese samples averaged above 9»8 g/cc density, while previous sinters fromhigher ratio denitrator products (N/Th = 0.15 - 0.20) averaged above 9.7 g/cc.This could mean that density of the sintered sample is more dependent uponthe nitrogen content of the original powder than it is upon the immediateconcentration of the sol from which it is prepared. All samples yielded morethan 90 wt $ of the coarse +l6 mesh shards, easily adequate to meet therequirements of the present vibratory compaction mix of 60 wt $ 10/l6 meshmaterial. For reference, a 1500 g sample of thoria (screen 75 wt $ +l6 meshmaterial) yielded 64 wt $ of +16 mesh shards when ground and screened forvibratory compaction.
It was assumed in the past that a water leaching (80°C for 1 hr withconstant agitation) would leach out or disperse the "high nitrate" thoria,leaving behind "low nitrate" thoria in the "insolable" heel. This suppositionhad never been thoroughly checked. The results of these tests do not bearout this assumption; the thoria in the sedimentary layer is approximatelyas rich in nitrogen as is the supernatant layer within the uncertainty ofresults (Table 2.1). Also the quantity of material dispersible in hot waterincreased with time following denitration. For example, Sample No. l8udispersed only 0-75 wt $ in hot water immediately after denitration, buta duplicate sample dispersed 5.6$ after storage for about three weeks. Thisaging phenomenon does not occur in the '"insolable" heel left after extractionwith water (the "T" samples). The "U" designates the original, untreated

Table 2.1. Characteristics of Sol Gel Process Products Prepared from Low Nitrate Thoria Sols
Dispersion Conditions: One hour with agitation at 8o°C, 2 M Th
Feed8,Material
N/Th Ratio
Wt $ Dispersionin Water Only Nitric Acid-Water
Dispersions°Sintered
Product
Densityg/cc
Screen Size Ana
(weight $)Immediately
After
Denitration
Three Weeks
After
Denitration
lysisRun Wt $
DispersedSol N/Th
RatioNo. +16 16/100 -100
l8ui8t
0.05020.0484
0.75 5.60
- 0.1070.163
9.769-77
92.594.6
7.2
5.1
0.30.3
19U
19T
0.06610.0592
1.6 33-25.2
99-7 0.109
0.159
9.859.88
97-1
95-7
2.8
3-9
0.1
0.4
2ou
20T
0.05170.0462
4.1 1.6
0
99-4 0.1090.146
9.859.78
94.8
92.94-96.5
0.30.6
2iu
21T
0.05170.0422
0.66 3-20.4
98.6 0.1090.118
9.879.85 95-2 4.4 0.4
22U
22T
0.0559 1-7 6.00.8
99.8 0.1130.194
9.859.85
93-392.2
6.1
7-80.6
0
23U
23T0.0597 0.9 4.0
0.899-7 0.117
0.191
9.839.84
95-695-0
4.14.6
0.30.4
Estimated mean deviation for "U" samples was 0.005-
Amounts of nitric acid used were minimum amounts which appeared to give complete dispersion.
1
H
1
-16-
denitrator product. The dried solid material obtained from the immediatehot water dispersion tests following denitration are given the "T" designation.
2.2 Irradiation Testing - S. D. Clinton, work in cooperation with E. S. Bomar,Metallurgy Division
Eight fuel pins containing TI1O2-UO2 prepared by Chemical DevelopmentSection A have performed satisfactorily in the NRX reactor during the two-month period of April and May. Each specimen contains approximately 75 gof fuel with a fully-enriched uranium content of 4.2 to 4.4 wt $. The fuel,consisting of three different particle size fractions, was loaded into 11 in.long tubes (5/16-in.-0D, 304 SS, 25 mil wall) to bulk densities between8.6 and 8.7 g/cc by pneumatic vibratory compaction. Five of the tubes wereloaded with sol-gel TI1O2-UO2 prepared from thorium oxalate precipitatedthoria, and three tubes were filled with sol-gel TI1O2-UO2 prepared by steamstripping thorium nitrate.
The eight fuel pins are located in a single channel of a PRFR irradiation holder at the Chalk River NRX reactor. Assuming a cosine flux distribution along the channel length, the unperturbed thermal neutron flux variesbetween 3«0 and 5-5 x 10¹³ n/cm2-sec. Using the flux perturbation methodof Lewis (Nucleonics, October 1955)> the thermal flux is decreased by ~25$within the fuel pins. At a peak perturbed flux of 4 x 10¹³ n/cm2-sec, theheat flux at the clad surface is 300,000 Btu/hr-ft2. Due to the uncertaintyin the thermal conductivity of the compacted TI1O2-UO2 particles, the center-line fuel temperature cannot be determined to any degree of accuracy. Ifan effective k of 1.0 Btu/hr-ft-°F is assumed for the oxide fuel, then thecenter temperature should not exceed 2250°F. The peak integral of k d9 forthe fuel pins is 18.8 watts/cm which is well below the limits for centermelting (50 watts/cm) and increased fission gas release (30 watts/cm) inUO2 pellets. If the in-pile experiment continues to operate satisfactorily,the fuel specimen should remain in the reactor until burnups in the orderof 8,000 to 15,000 megawatt days/metric ton of Th are achieved, dependingon the pin location (approximately 230 full power days). The major objectivesof the proposed post-irradiation examination are as follows: pressure buildup and chemical analyses of the fission product gases released from the fuel,fission product distribution in the fuel as determined by gamma-ray survey,and void formation or other structural changes in the oxide as determinedby metallographic techniques.
Four 11-in. and two 22-in. long tubes were loaded by vibratory compactionwith Spencer arc-fused TI1O2-UO2 containing 3*9 wt $ fully-enriched uranium.The fuel bulk density in these tubes is 8.6 g/cc. Similar fuel specimensloaded with sol-gel Th02-U02 should be completed by the middle of June.The 11-in. tubes will be scheduled for insertion in the MTR at an unperturbedflux of 1 x 10¹⁴ n/cm2-sec, and the longer tubes will be placed in the NRXreactor by August of this year. One of the major objectives of those proposedirradiations is to compare the in-pile effects of arc-fused Th02-U02, whichhas been formed at temperatures in the order of 3000°C, and sol-gel TI1O2-UO2,which has been fired to a maximum temperature of 1200°C.

-17-
3-0 GCR COOLANT PURIFICATION STUDIES
J. C. Suddath
Contamination of coolant gases by chemical impurities and release offission products from fuel elements are major problems in gas-cooled reactorsand in-pile experimental loops. Investigations are being made to determinethe best methods to reduce the impurities, both radioactive and non-radioactive with emphasis on the kinetics of the fixed bed oxidation of hydrogen,carbon monoxide, and methane by copper oxide.
An attempt is being made to fit experimental data from the study of theCu0-H2 and CuO-CO reactions to a mathematical model of external diffusionand internal diffusion of the H2 or CO controlling a rapid, irreversiblereaction.
3.1 Determination of CuO Pellet Effective Porosity -CD. Scott
With the assumption of external diffusion-internal diffusion controlling the H2-CUO and CO-CuO reactions it is possible to derive an expressionfor the effective porosity of the CuO pellet: (see Unit Operations monthlyreport for March 1961)
b /r2 _,_ ro ro j ,- sa=CtDV6- +3R 2-/ &
where
a = effective porosity for H2 or CO transport within the CuO pellet,effective void volume/total volume
b = molar density of CuO in pellet, g-moles/cc
C = concentration of H2 or CO in the bulk gas phase, g-moles/cc
t = total time of exposure of pellet to reaction environment, sec
D = molecular diffusivity of H2 or CO, cm2/sec
R = radius of CuO pellet, cm
r = radius of the Cu-CuO interface in the pellet after reaction, cm
Several differential bed tests were made in which mono-layers of CuOpellets were contacted with a high velocity stream of helium containingconstant amounts of H2 or CO in the temperature range of 400 - 600°C, concentration range of ~0.1 to 1.0 vol $ H2 or CO and at pressures of 10.2,20.4, and 30 atm (Table 3.1). At the end of each test the position of theCu-CuO interface (rQ) was measured. This allowed determination of theeffective porosity, a, for each set of operating conditions by use ofequation (l). If the postulated kinetic mechanism is correct for boththe CUO-H2 and CuO-CO reactions, then the determined values of effectiveporosity should be constant, over the range of operating conditions forboth H2 and CO.

-18-
Table 3.1. Effective Porosity of CuO Pellets for Molecular Transport
of H2 and CO as Determined from
Differential Bed Tests of the H2-CUO and CO-CuO Reactions
Contaminant Number
Run Temp., Pressure, Concentration, of Cu EffectiveNo. °C atm vol $ Pellets Porosity
H2 + CuO -» H2O + Cu
1 500 20.4 0.95 7 0.06632 400 20.4 0.096 8 0.05503 600 20.4 O.65 6 0.06644 500 20.4 0.54 11 O.06505 4oo 20.4 0-93 11 0.04766 600 20.4 0.46 10 0.05467 400 20.4 0.40 11 0.04598 500 20.4 0.93 11 0.0441
9 500 20.4 0.091 9 0.047910 500 20.4 0.071 9 0.044311 400 10.2 0.89 9 O.067412 500 10.2 0.65 9 0.066413 500 10.2 0.52 9 0.057414 600 10.2 1.08 9 O.059615 4oo 10.2 0.82 9 0.044216 500 10.2 1.05 9 0.056317 400 30.0 0.56 9 0.044918 500 30.0 0.51 9 0.053619 600 30.0 0.39 9 0.0494
Average 0.0545
CO + CuO -» C02 + Cu
1 400 20.4 1.08 12 0.04872 500 20.4 1.04 9 0.04753 600 20.4 1.02 9 0.05404 400 20.4 0.091 9 0.05915 500 20.4 0.50 9 0.04736 500 20.4 0.11 9 0.0550
7 400 10.2 O.89 9 0.04468 500 10.2 0.94 9 O.05809 500 30.0 O.96 9 O.0600
Average O.O526

-19-
It was found that the effective porosity was essentially constant(within experimental error) for either Hs or CO as the contaminant (Table 3.l),The average value for the effective porosity from the H2 tests was 0.0545 witha maximum deviation of 0.0119 and the average effective porosity from theCO tests was O.0526 with a maximum deviation of 0.080. It is possible tohave fairly large experimental errors in these tests since only 7-11 CuOpellets were used for each differential bed test. This is not enough pelletsto insure a good statistical average since the individual pellets have awide range of some of their physical properties (March 1961 Unit Operationsmonthly report).
3.2 Determination of Apparent Mass Transfer Factors for the Hg-CuO Reaction
In order to utilize the assumed mathematical model of external diffusion-
internal diffusion of H2 controlling the CuO-Ife reaction, it is necessaryto have available mass transport properties of the H2 across the assumedexternal gas film surrounding the CuO pellet. These mass transport propertiesare usually presented as a mass transfer coefficient, k , which is used inthe expression, °
rate of transport = k a (C - C*) (2)
where
k = mass transfer coefficient, 5 n 7—=•g ' sec-cm.2-g-moles/cm3
a = external surface of the pellets, cm2/cm3
C = H2 concentration in bulk gas, g-moles/cm3
C* = H2 concentration at solid surface., g-moles/cm3
k„ values are usually correlated as a function of the various physicalproperties of the system. The usual correlation is the mass transfer factor,Jp, as a function of Modified Reynold's Number, Re',
where
JD --4- (r^) (3)k p
S ( »fG (pp)
Re*
and
Jn = mass transfer factor, dimensionless
p = gas density at system conditions, g/cm3
G = mass flow rate of gas stream, g/cm2-sec
(j. = viscosity of gas, poise or g/cm-sec
(4)

-20-
D = molecular diffusivity of H2 in He, cm2/sec
Re' = Modified Reynold's Number, dimensionless
D = mean surface diameter of CuO pellet, cm
There are numerous such correlations in the literature, however, themajority are at system conditions much different from the system of interest.In general, these correlations show that the Jd factor is dependent not onlyon Reynold's Number but also on particle size and the correlation goesthru a transition point between high and low Reynold's Numbers (50 %Re = 150)where the dependence on Reynold's Number changes.(1-8) All of the experimental tests on the H2-CUO system were made at relatively low ModifiedReynold's Numbers, < 15-0, where published correlations are varied and fewin number. Rather than attempting to choose one particular correlation foruse in this system, it was decided to determine the mass transfer factorsfor the range of operating conditions in this system from experimental dataand develop a useable correlation. If this correlation falls in the rangeof published information, it would be further verification of the proposedmathematical model.
The mass transfer coefficients, k , were determined for each run bymaking a trial and error parameter search for k , utilizing a finite difference,machine solution of the proposed mathematical model (Unit Operations monthlyreport, May 1961).
Since the early part of the effluent hydrogen concentration curve fordeep bed tests is influenced strongly by the hydrogen mass transfer throughthe gas film, the trial and error solution was made so that the predictedeffluent hydrogen concentration was within 5$ of the measured effluenthydrogen concentration at 20$ of the run time necessary for the Hs effluentconcentration to reach 90$ of the initial hydrogen concentration. Thispoint was arbitrarily chosen so as to exclude the initial phase of eachtest where there was some data scatter.
From equations (3) and (4) and the calculated kg values, a correlationof JD vs Re' was made for the experimental system of interest (Figure 3«l).The resulting expression for the least squares fitted curve was:
JD =0.24 (Re')"0,69 (5)The resulting correlation is within the range of some of the published
correlations although the slope of the JD vs Re' plot is somewhat different.This correlation will be used in all future calculations for the deep bed
tests.
References
1. Bar-Ilan, M., and Resnick, W., Ind. Eng. Chem. 49, 513 (1957).
2. Chu, Ju. Chin, Kalil, J., and Wetteroth, W. A., Chem. Eng. Prog. 49,141 (1953)-

10.0
o
(J<
z<
I—
1/1
<
1.0
0.10
•21-
UNCLASSIFIED
ORNL-LR-DWG 62881
• Experimental Data for CuO Pellets In The Range of 7-9 Mesh.
Large Particles, Hobson and Thodos
Large Particles, Gaffney and Drew
8-10 Mesh, Hurt
28-35 Mesh, Resnick & White •>>. ••
J I L_L
100
MODIFIED REYNOLD'S NUMBER,DpG
Fig. 3.1. Jq factor for mass transfer as a function of modified Reynold'snumber for the reaction, H2 + CuO = F^O + Cu.

-22-
3. Dryden, C. E., Strange, D. A., and Withrow, A. E., Chem. Eng. Prog.,49, 191 (1953).
4. Ergun, S., Chem. Eng. Prog. 48, 227 (1952).
5. Gaffney, B. J. and Drew, T. B., Ind. Eng. Chem. 42, 1120 (1950).
6. Hobson, M. and Thodas, G., Chem. Eng. Prog. 47, 370 (1951)-
7. Hurt, D. M., Ind. Eng. Chem. 35, 522 (1943).
8. Resnick, W. and White, R. P., Chem. Eng. Prog. 45, 377 (1949)-

-23-
4.0 POWER REACTOR FUEL PROCESSING
Co D. Watson
4.1 Modified Zirflex - F. G. Kitts
Modified Zirflex denotes a process for the recovery of uranium fromU-Zr-Sn fuels by batchwise dissolution in NH4F-NH4NO3-H2O2 solutions,stabilization with HN03-Al(N03)3, and TBP extraction. During dissolutiona small, continuous addition of hydrogen peroxide is made to oxidize UIVto the more soluble UVI. Such a process is desirable for processing zirconiumfuels containing higher percentages of U (up to 10$) without the intermediateprecipitation of UF4 which would occur if no oxidant were added. Presentlydissolutions of unirradiated zirconium fuels are being carried out both ina l-in.-dia recirculating dissolver and in engineering-scale equipment.
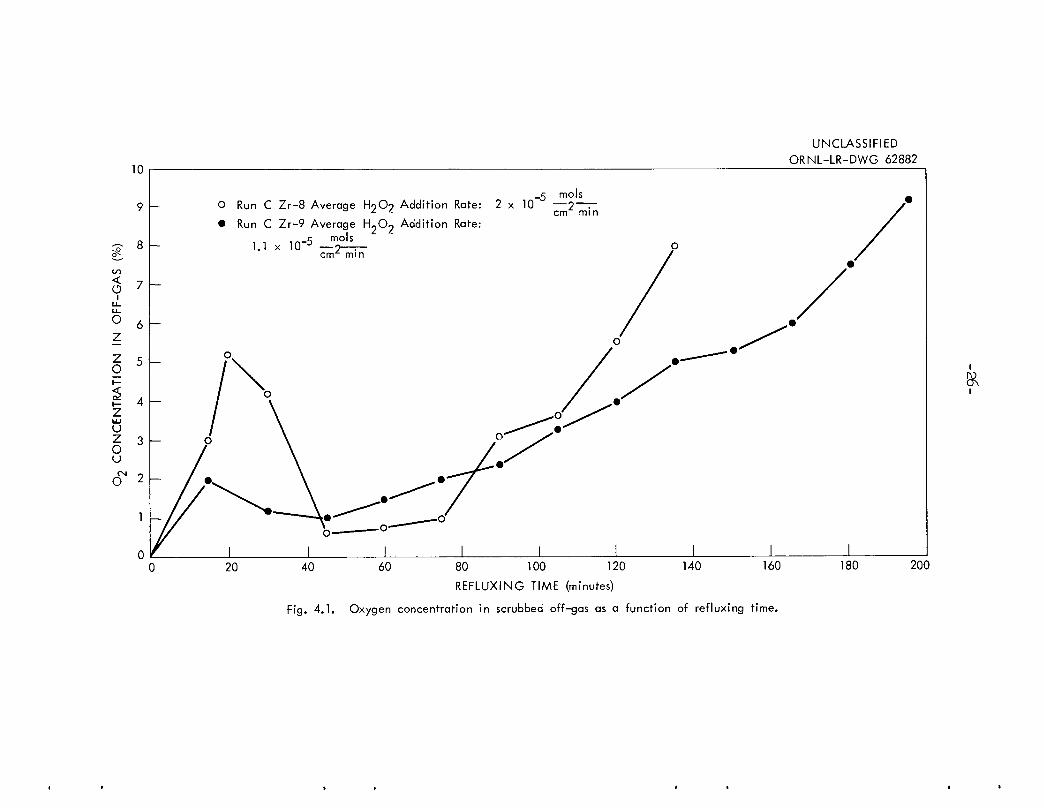
Two runs (CZr-7 and 8) were made In the engineering-scale equipmentdissolving 8$ U-Zr plate (0.122-in. thick) in refluxing dissolvent initially6.53 M NH4F-O.I5 M NH4NO3-O.OI M H2O2 with a continuous H2O2 addition atan average rate of 1-2 x 10⁻⁵ mols/cm2-min (Table 4.1). In these runs andCZr-9 the H2O2 was introduced into the bulk of the boiling dissolvent througha water-cooled nozzle; this eliminated the gassing which had been observedat the H2O2 inlet. In run CZr-7 about 2.5 g of an apparently crystalline,green precipitate was collected which contained 60$ U, 23$ F and 6.4$ Zr.Near the end of the run this material formed on the surface of the U-Zr and
then dropped to the bottom of the dissolver; it is assumed to be the samematerial involved in the coat formation reported by Gens (ORNL-2905). Afterdilution of the dissolution product and standing for 24 hrs a fine whiteprecipitate settled; this material (1.7224 g) contained 3.6$ U (probablyimparted by fines of the green material above) which represented a U lossof 0.15$. These materials had been produced In previous dissolutions butwere not collected from the solvent extraction feeds because both were
dissolved upon addition of the 1.8 M HNO3 - 1.8 M Al(N03)3 stabilizingsolution. In run CZr-8, 9$ more fluoride was charged (calculated terminalfree F"/u = 8l compared to 60 for CZr-7) and total dissolution was achievedin a shorter time (other conditions comparable) with only a trace of thegreen precipitate observed. Although different amounts of F" were charged,equal terminal free F"*/U ratios of 82 were determined from experimentalvalues; a lower free F" would have been calculated had the \Zr balance inrun CZr-7 been ~95$ rather than the 86.5$ reported. Probably a targetfree F~/U of 90 - 100 should be used to assure rapid dissolution and preventcoat and precipitate formation.
Run CZr-9 was made dissolving PWR seed plate ~2$ U-Zr-Sn in 6.53 M NH4F -0.01 M H2O2. The amount of F~ charged was calculated to yield a terminal
F_/Zr ratio of ~6.8; this is about the lowest ratio which will yield areasonable dissolution time. In this run about 2.6 g of a green-blackprecipitate was formed although the free F"/u = 115. Some minimum free F~concentration (a much lower free F~ gave a higher'F"/u here because the Uwas only 2$ instead of 8$) may be required in the case of low U fuels, aswell as the high F~/U ratio required with high U fuels in order to accomplishtotal dissolution without precipitation.

Table k.l. Data for Modified Zirflex Runs
iDissolvent
u -Zr-Sn Fuel Plate
H^02gAdd
Rate
Diss. mols
Time cm2-min
hrs x 10"5
Add
H20
Vol
I
Solvent Extract ion Feed Material Balances
Zr U F
1° i $TypeWt Diss.
g $Area
cm2
Thick
ness,
in.
Run
No.
Vol
I
NH4FM
NH4NO3M
Vol
I
Zr U
g/iF
M
Free F"
U
CZr-7CZr-8CZr-9
MZr-20
MZr-21
MZr-22
MZr-23
6.42
7-0
6.75
ml
21+3
21+8
21+2287
6.536.536.53
6.58
6.586.586.58
0.15
0.150.0
0.0
0.0
0.0
0.0
8% U-Zr8$ U-ZrPWR Seed
8$ U-Zr
8% U-Zr8$ U-ZrPWR Seed
517 99515 100
590 >99
20.8 >99-9
20.8 >99-918.2 >99-925.1+ >99-9
519517862
23
2320
1+6
0.122
0.122
0.08l
0.122
0.122
0.122
0.08l
32-1/1+4-2/3
2.1+
3-61.1+1+.2
1.2
2.0
1.1
0.93
2-552.0
0.81+
5-77-31+.19
ml
87e94
200
267l60
12.3514.31511.09
ml
208
2151+1+0500I+56
33-332.351-3
1+2.0
41.31+0.833A53-1
2-92.651.03
3-12f3.603.582.81
1.71
3.193.01+3.87
3.813.763.653-13
4.13
82
82
6.88°
80
70
65797.l6c
86.5 86.697.6 92.1
100.6d
92.1 85.5
93.8 9I+.799.9 96.6
99.9d
94.395.2
97-5
100
98.1+98.199-5
1
ror—
mols
mol
H2 mols NH3Zr mol Zr
Boil-up Raml
te NH40H inReflux
M
Scrubbed Off-Gas
Run vol
ft3b o2
iH2
1°HsO
%No. cm2 -min
CZr-7CZr-8CZr-9
1.
1.1
32
39
5-171+.61+.06
0.230.21+
0.17
0.1+-0.1
0.3-0.050.1+3-0.0
3-3
5-77 0.5-5.10.2 0.2-1.
95.1 88-97•3 94-97
0.2
0.8-2
1-5
• 5
Also contained 0.01 M Ha02.
b Metered at 25°C and 1 atm.c F/Zr, Free F"/u not controlling at low U.d Combined weight balance given since U and Zr per centages not known accurately.
Dissolution product divided into two equal parts and stabilized as shown.
Precipitate formed
6 As 3-10$ solution.
some U removed from solution.

-25-
Probably the most significant finding of the recent work was the observation of the behavior of the O2 concentration in the HN03-scrubbed off-gas(principally H2)• This variable is plotted as a function of refluxing timefor runs CZr-8 and 9 in Figure 4.1. The O2 concentration was reduced initiallyto < 0.1$ by N2 purging! the initial peak probably came from the decomposition of the 0.01 M H2O2 in the dissolvent. The concentration remained lowduring the period of rapid dissolution and then rose steadily as decompositionbecame the major mode of H2O2 destruction. This suggests that the H2O2addition rate could be controlled to maintain the O2 concentration in theoff-gas at ~3 + 2$. As much as 1$ O2 in the off-gas seems to indicate thepresence of sufficient H2O2 to maintain UVI in the dissolvent. While areasonable excess of H2O2 is not harmful to dissolution, limiting the O2concentration in the off-gas to 5$ avoids the flammable range (lower limitfor O2 in hydrogen is 6$).
Four runs (MZr-20, 21, 22 and 23, Table 4.1) were made in the l-in.-diarecirculating dissolver to study solution stability and function as pilotruns for the larger equipment. Run MZr-20 was made with a calculated free F"/U= 50; a small amount of green precipitate formed near the end of the run.Crystals formed in the more concentrated solvent extraction feed after ~36hrs (before sampling), while the more dilute solution stood for about 30 daysat room temperature before a small amount of crystals appeared. A smallamount of precipitate again formed in the dissolution step of MZr-21 (calculatedF"/U = 55); however, a highly loaded, stable (no crystals after 36 days) SXfeed was produced. Run MZr-22 at a calculated F~/U = 8l produced no greenprecipitate; although the SX feed shown in Table 4.1 (vol = 500 ml) wasstable (no crystals after 30 days), crystals formed in < 24 hrs when it wasfirst diluted to a volume of 475 ml. An additional 25 ml of water dissolvedthe crystals and produced a stable solution. Run MZr-23 was made under thesame calculated terminal conditions (F~/Zr = 6.8) as run CZr-9 in theengineering-scale equipment but no green precipitate formed in the smallscale dissolver. The U-Zr-Sn material dissolved in the small run contained
1.6 times as much U as that used in the large scale run resulting in a muchlower free F"/U (88 compared to 115 for the cell run) but a higher free F"(F~/Zr =7.10 compared to 6.88) since less Zr was present for F" complexing.(The initial fluoride charge was calculated: F" =6.8 [total wt U-Zr-Sn/91.22]). This observation strengthens the hypothesis that some minimum freefluoride concentration (~1 M in the dissolution product) must be maintainedas well as free F~/u = 90 in order to prevent U precipitation during dissolution.
4.2 Shearing and Leaching - B. C. Finney
A chop and leach program tov- determine the economic and technologicalfeasibility of continuously leaching the core material (U02 or U02-Th02)from relatively short sections (l-in. long) of fuel elements produced by shearingis continuing. This processing'-method, enjoys the apparent advantage of recovering fissile and fertile material from spent power reactor fuel elementswithout dissolution of the inert jacketing material and end adaptors. Theseunfueled portions are stored directly in a minimum volume as solid waste.A "cold" chop-leach complex consisting of a shear, conveyor, leacher, andcompactor is being evaluated prior to "hot" runs.
<O
zo
10
zou
o
O Run C Zr-8 Average H202 Addition Rate: 2 x
• Run C Zr-9 Average H-Oj Addition Rate:
1.1 x 10 ^ —9—r-cm mm
_<; mols10 — 2—-
cm mm
80 100 120
REFLUXING TIME (minutes)
Fig. 4.1. Oxygen concentration in scrubbed off-gas as a function of refluxing time.
UNCLASSIFIED
ORNL-LR-DWG 62882
200
roON
I

-27-
Shear. The 250 ton shear including the hydraulic system and feedmechanism has been received from the Birdsboro Corp. Installation of theshear and auxiliary equipment on the third floor of Bldg. 4505 has begun.
Eleven Mark I-Model 7 fuel assemblies have been filled with Davison
Chemical Co. U02 pellets. Each assembly contains ~4000 pellets weighing~60 kg.
Conveyor. The conveyor has been received from the Weld Craft Co. ofDayton, Ohio. Slight modifications will be made to the inner drum to eliminatethe gaps between the flights and inner cylinder and the inner cylinder willbe filled with linear-polyethylene for criticality control.
Leacher. Four leaching runs were made in the 4 stage pyrex glassleacher model (Table 4.2), The fuel charge consisted of chopped stainlesssteel clad U02 (l/2-in.-OD x l-in. long) and 6, 7, and 8 M HN03 was usedas the dissolvent.
Run 28 was a scouting run in which one batch of chopped stainless steelclad UO2 containing 437-8 g of UO2 was leached with 8 M HNO3. The purposeof this run was to determine the operability of the leacher model whenleaching the very fine UO2 from the chopped stainless steel sections. Theresults of this run indicated that there would be no difficulty encounteredin the operation of the model and as a consequence three leaching runs(run 29, 30, and 31) were made in which the UO2 was leached from 9 batchesof chopped stainless steel clad U02-
In each run there was some variation in the weight of UO2 per batch(Table 4.2). The 9 flasks were charged with a similar volume of weighedchopped sections and at the conclusion of each run the empty cladding wasweighed and the amount of UO2 per batch determined by difference.
The product incremental uranium loading and acidity as represented bythe sections of the curves above line A-B for runs 29, 30, and 31 arepresented in Figures 4.2, 4.3, and 4.4. In each run a fresh batch ofchopped sections was put on stream every hour. A comparison of the maximum,minimum and composite product uranium loading and acidity of runs 29, 30,and 31 are presented in the following table:
ProductRun Dissolvent Uranium Loading, g/liter Acidity, M HNO3No. M HNO3 Max Min Composite Max Min Composite
29 8 670 30 425 7.5 0.5 3-030 6 670 35 325 5-5 0.1 2,531 7 615 60 350 6.2 o.l 3-0
In each run 60 - 90 min were required to completely leach the UO2from the chopped sections.

Table 4.2. Leacher Model Dissolution Data U02-HN03 System
Charge: Chopped sections of stainless steel clad U02, ~(l/2-in.-0D x l-in.-long)
U02
Batch
Dissolution
Time Temp,
Dissolvent
Flow
Rate
(HNO3)
Vol
U02
Product (Composite) Off-
Nitrogen
-gas
f> of
Acid
Wt
Charged %Consumption
Run Loading H+ Vol g-mol HNO3
No. No. min °C M ml/min liters g Dissolved g U/liter M liters g-mol HNO3 Feed g-mol U02
28 1 90 102-111 8 18.6 1..67 437-8 100 236 5.24 1.62 0.97 7-2 2.6
29 1
2
34
56
78
9
240240
240240
240
240240
240240
101-111
102-111
102-111
102-111
101-111
102-110
101-110
101-110
102-111
8 18.8 12.•39 478490495472
479466
48o
401524
100
100
100
100
100
100
100
100
100
304 4.45 12.4 7.47 7.65 2.47
30 1
2
34
56
78
9
240240240
240240
240
240240
240
101-107
102-107101-107
102-108101-108
102-108
101-107102-108102-108
6 25.4 15..24 501
496512491502
479474496473
100
100
100
100
100
100
100
100
100
258 3-19 15-1 9-5 10.4 2.58
31 1
2
34
56
78
9
240
240240
240240
240240
240
240
101-109
103-109
101-109
102-109
103-109
103-109102-109100-108
100-109
7 21.0 13..64 494490479520478481
485487504
100
100
100
100
100
100
100
100
100
299 3.84 13.6 9-13 9.56 2.56
roCD

40
CONDITIONS
8 M HNO, - 18.8 ml/minChopped Stainless Steel Clad U02, ~ I inch long, 400-524 gms UOj/batch
UNCLASSIFIED
ORNL-LR-DWG 62883
G-MOL_HN03G-MOL UO,
4.65 - 6.1 O Uranium Loading, gms/liter
• H+, M HNO,
120 160 200 240 280 320
DISSOLUTION TIME, mins.
480 520
Fig. 4.2. Uranium loading and H as a Function of dissolution time for the leaching of 9 batches of chopped stainless steelclad UOj (Run-29) in the 4 stage leacher model based on a 4 hour dissolution time.
I
ro

CONDITIONS
6 M HNO3Chopped Stainless Steel Clad UO~, inch long, 473-501 gms UOjAatch
G-MOL HNO3G-MOL UO,
4.72 - 5.07
Fig. 4.3. Uranium loading and H asclad UO2 (Run-30) in the 4 stage leacher
240 280
DISSOLUTION TIME, mins.
u function of dissolution time for the leaching of 9 batches of chopped stainless steelmodel based on a 4 hour dissolution time.
6th Batch
479 gms UOj
Uranium Loading, gms/liter
M HNO,
UNCLASSIFIED
ORNL-LR-DWG 62884
I
oI

40 120
CONDITIONS
7 M HNO3 - 21.0 ml/minChopped Stainless Steel Clad UOo,
G-MOL HNO3G-MOL U02
200 240 280 320
DISSOLUTION TIME, mins.
UNCLASSIFIED
ORNL-LR-DWG 62885
inch long, 478-520 gms U02/batch
360
0 Uranium Loading gms/lite
• H+, M HNO,
480
9th Batch
504 gms U02
560
Fig. 4.4. Uranium loading and H as a function of dissolution time for the leaching of 9 batches of chopped stainless steelclad U02 (Run-31) in the 4 stage leacher model based on a 4 hour dissolution time.
I
UJ

-32-
5-0 REACTOR EVALUATION STUDIES
J. C. Suddath
5-1 Heat Transfer from Spent Fuel Elements during Shipping - J. S. Watson
Initial efforts have been made to analyze experimental data on temperature rises in electrically heated mock fuel elements contained within simulatedshipping carriers. The apparatus used in these studies has been describedpreviously (Unit Operations April 196l monthly progress report). The firstapproach has been to calculate the temperatures expected within the fuelbundle if radiation were the only method of heat transfer inside the carrier.Thus far calculations have only been made using approximate but conservativeestimates of the radiation factors within the bundle. The .resulting temperatures predicted by these calculations have been surprisingly close to thoseobserved experimentally within the bundles.
In general, the net radiant flux from a surface 1 to a surface 2 iscalculated from relations of the form
fj =AsAscr (Tx4 -T24) (l)
where
cr = Stefan-Boltzman constant
Ti, T2 = absolute temperatures of tubes 1 and 2
Q = net radiation from 1 to 2
Ai, A2 = areas of 1 and 2
^12 = radiation factor for 1 to 2
The problem in using this relation arises because 1^2 is a rather complicatedfunction of the areas, emissivities, and configuration factors not only forradiation between tubes 1 and 2 but between all surfaces in the system."^x2 must account for all of the heat from tube 1 which is sorbed by tube 2and some reaches tube 2 through complicated multiple reflections fromsurrounding tubes.
Efforts are being made to evaluate the radiation factors in the mannerdescribed by McAdams-1- and credited to Hottel. However, until these effortsyield positive results, an approximate system has been used which is believedto give conservative values for 7>'s- Essentially a special case of theMcAdams treatment was used where one assumes that 1 and 2 are the onlysource-sink surfaces. All other tubes are no flux surfaces. If one considers
a tube near the center of the bundle, all tubes surrounding 1 and 2 have thesame area and emissivity, e, and the radiation factor is obtained by1
McAdams, Heat Transmission, 3rd Ed. McGraw-Hill (195^), PP- 72-76.

-33-
112
—+ (- - APl2 U /
^ is defined by the relation
Fl2 = F12 + E FR2 v %1R 1-Frr * ^2
(2)
where R represents the no flux surfaces surrounding 1 and 2. For more conservative values of ^xs> ?"i2 was taken equal to Fi2« This essentiallyneglects any heat going to 2 from R. These simplications in >'s also simplifytemperature calculations within the bundle because the configuration factorbetween any two tubes is only a function of their relative position (adjacent,diagonal, etc.) and not a function of their position in the bundle.
For power reactor fuels, the tubes are generally spaced very closetogether, and each tube can "see" and, with the above simplifications, radiateto no more than four adjacent tubes, four diagonal tubes, and either othertubes which are located adjacent to the diagonal tubes in the square pitchedarray. All of the heat generated within a given tube must be (net) radiatedto these l6 tubes. Then the total net heat radiated, Q.^, from tube i will be
Q, Act £ "j
ij £(3)
A relation such as this can be written for each tube in the fuel bundle,and these equations (linear in T4) can be solved simultaneously for eachT *„ For large tube bundles of varying size, a rapidly convergent trialaffd error procedure for the equations appeared simpler than a procedurefor setting up and evaluating the determinates for direct solution of theequations.
Equation (3) can be solved directly for Tj4 to give
l
16
zj=i L
T,"Qi 16Act + S ~
J=l Fij+ 2 ±(MJ
The first summation is the same for all tubes.
16
I
"Ibid, p. 71-
fc+fe+fe+KH
CO

-34-
where
Fi = configuration factor for radiation to an adjacent tube
F2 = configuration factor for radiation to a diagonal tube
and F3 = configuration factor for radiation to a tube adjacent to a diagonal
In the trial and error procedure, all tubes were initially set at the carrierwall temperature and then the temperature required for each tube to radiateits generated heat was calculated from equation (k) and assigned to that tube.The calculations were repeated throughout the bundle until the center tubetemperature changed by less than 0.01°C
A slight complication arises in the outer two rows of tubes of thebundle since these tubes radiate part of their energy to the cast wall andnot to other tubes. Rather than directly evaluating configuration factorsfor radiation to the wall and using difficult equations, other than (h),for these tubes, it was simpler to simulate the case wall by consideringtwo imaginary rows of tubes, whose temperatures were set at the wall temperature, completely surrounding the bundle. These tubes should affect thecalculations much like the wall but still allow one to proceed completely through the bundle using the same equation for resetting the tubetemperatures.
Some reduction in computation can be obtained by noting that the temperatures within the bundle will by symetrical. Although one needs only evaluatethe temperatures in one octant of the bundle, one must always carry temperaturesof tubes of at least two rows removed from the octant. For machine calculations
the testing and control statements necessary take away most of the advantageof calculating the temperatures of less than one-half Of the tubes.
These calculations were made (with the IBM-7090) for the conditionsemployed in some of the experimental runs (Tables 5.1, 5.2, and 5»3). Thewall temperature of the simulated carrier was not constant for any of theexperiments, but it varied with the angle from vertical (Figure 5-1). Forthe calculations, an average value was used. The agreement of the resultswith the experimental results was surprisingly good, especially at higherheat generation rates. The average deviation of the experimental temperatures and the calculated temperatures (only 19 of the 36 tube temperatureswere measured and could be used in the average) were l6, 19, and 22°C,respectively, for the three runs shown in Tables 5.1, 5.2, and 5.3 withheat generation rates of O.O986, 0.0708, and 0.0^8l watts/cm. One wouldexpect all calculated temperatures to be equal to or higher than the measuredtemperatures if all of the constants employed were correct. This was notalways the case, and although the calculated temperatures were higher onthe average, this still throws some questions on the results.
There were very apparent effects of convection in the experimentaldata which will need to be taken into account. First, the radial dependenceof the cast wall temperature was apparently caused by the convective "chimney"above the bundle. Also because of convection the measured temperaturedistribution was not symetrical. The temperatures in the upper half of thebundle were notably higher than those in the lower half. Methods of accounting for and correlating the effects of convection are being considered.

-35-
Table 5-1. Calculated and Experimental Temperature
Distribution in an Enclosed 36-Tube Bundle
1-1 1-2 1-3 1-4 1-5 1-6
163.48 188.69 198.80 198.80 188.70 163.48
U93! I238I |223 | I 225 |
2-1 2-2 2-3 2-4 2-5 2-6
188.69 222.35 236.04 236.04 222.35 188.70
1 205 1 227 1 |248 j
3-1 3-2 3-3 3-4 3-5 3-6 !
198.80 236.04 251.22 251.22 236.04 198.80
1 243 24o |232| 1x69 1
4-1 4-2 >:? 4-4 4-5 4-6
198.80 236.04 251.22 251.22 236.04 198.80
I234 1234 1 |222 | 1187 1
5-1 5-2 5-3 5-4 5-5 5-6
188.70 222.35 236.04 236.04 222.35
I206 f
188.70
1166 J
6-1 6-2 6-3 6-4 6-5 6-6
163.48 188.70 198.80 198.80 188.70
\l6h |
163.48
I167
Q = O0O986 watts/cm
Average wall temperature = 73»0°C
Emissivity = 0.55
I IExperimentally measured temperature
Difference between
calculated and measured
temperature = l6°C
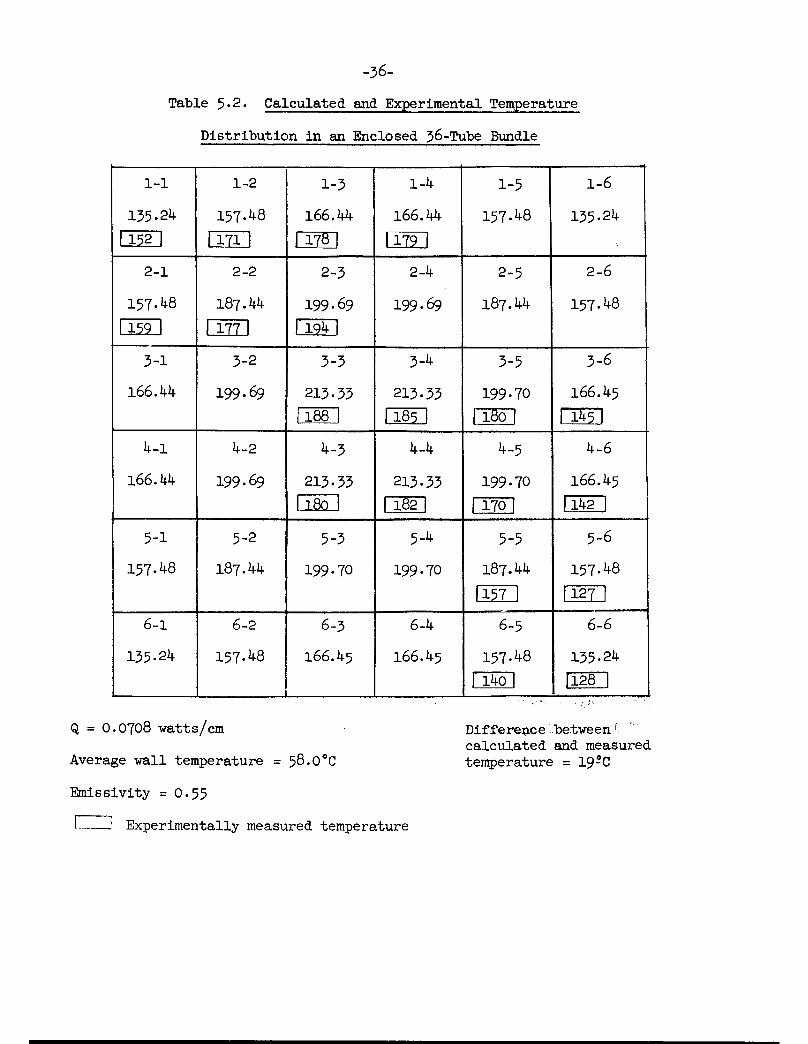
-36-
Table 5.2. Calculated and Experimental Temperature
Distribution in an Enclosed 36-Tube Bundle
1-1 1-2 1-3 1-4 1-5 1-6
135-24 157-48 166.44 166.44 157-48 135-24
U52| 1171 J 1178 1 1179 I
2-1 2-2 2-3 2-4 2-5 2-6
157-48 187.44
1177 1
199.69
Il94|199.69 187.44 157.48
159
3-1 3-2 3-3 3-4 3-5 3-6
166.44 199.69 213-33
188 1
213-33 199-70 166.45
1 145 1U85 llfiol
4-1 4-2 4-3 4-4 4-5 4-6
166.44 199-69 213-33 213.33 199.70 166.45
l&O 1 182 170 142 1
5-1 5-2 5-3 5-4 5-5 5-6
157-48 187.44 199-70 199.70 187.44 157-48
I"127 11157 1
6-1 6-2 6-3 6-4 6-5 6-6
135-24 157-48 166.45 166.45 157-48 135-24
140 1 1128 I
Q = 0.0708 watts/cm
Average wall temperature = 58.0°C
Emissivity =0.55
J Experimentally measured temperature
Difference between[
calculated and measured
temperature = 19?C

-37-
Table 5-3- Calculated and Experimental Temperature
Distribution in an Enclosed 36-Tube Bundle
1-1 1-2 1-3 1-4 1-5 1-6
110.36 128.78 136.30 136.30 128.78 IIO.36
1161 130 1 137 1 1138 1
2-1 2-2 2-3 2-4 2-5 2-6
128.78 154.06 164.53 164.53 154.06 128.78
122 | 1 134 1 U48I
3-1 3-2 3-3 3-4 3-5 3-6
136.30 164.53 176.25 176.25 164.53 136.30
1142 1 |l4l |136 r in 1
4-1 4-2 4-3 4-4 4-5 4-6
136.30 164.53 176.25 176.25 164.53 136.30
U36I 1137 1 128 | 1109 1
5-1 5-2 5-3 5-4 5-5 5-6
128.78 154.06 164.53 164.53 154.07
1119 1
128.78
1 98 I
6-1 6-2 6-3 6-4 6-5 6-6
IIO.36 128.78 136.30 136.30 128.78
1 107
IIO.36
1 99 1
Q = 0.0481 watts/cm
Average wall temperature = 50.0°C
Emissivity =0.55
L I Experimentally measured temperature
Difference between
calculated and measured
temperature = 22°C

at 0.0986 watts/cm, 1"2 = 73°Cat 0.0708 watts/cm, T2 = 58°Cat 0.0481 watts/.
-38-
UNCLASSIFIED
ORNL-LR-DWG 62886
at 0.0986 watts/cm, T] = 82°Cat 0.0708 watts/cm, J} = 66°Cat 0.0481 watts/cm, 1^ = 56°C
at 0.0936 watts/cm, T3 = 64°Cat 0.0708 watts/cm, T3 = 52°Cat 0.0481 watts/cm, T3 = 46°C
Fig. 5.1. Angular wall temperature distribution on simulated spent fuel shipping carrier wall.

-39-
6.0 SOLVENT EXTRACTION STUDIES
A. D. Ryon
The HETS values for uranium stripping reported this month were obtainedusing the 5/0 TBP flowsheet described in the September Unit Operations MonthlyProgress Report (CF 60-9-43).
6.1 HETS Values for Uranium Stripping in Sieve and Nozzle Plate PulseColumns - R. S. Lowrie, F. L. Daley
HETS values were obtained for the aqueous continuous operation of the12 ft sieve plate column (0.125-in.-dia holes, 23$ free area) and for bothaqueous and solvent continuous operation of the 12 ft nozzle plate column(0.125-in.-dia nozzles, 10$ free area with the nozzles facing down).
Operating conditions were those for the 5$ TBP flowsheet, a Purex typeflowsheet employing 5$ TBP in Amsco 125-82 as the solvent and 0.01 M nitricacid as the strip reagent. Loaded solvent for the test was obtained as acontinuous flow from an extraction column. The experimental conditions forthe test are shown in Table 6.1, the average analytical results for theflowing streams and column profile samples in Tables 6.2 and 6.3 and theuranium distribution curves for 5$ TBP and several acid concentrations inFigure 6.1. HETS values were calculated using the number of theoreticalstages determined from a McCabe-Thiele diagram (Figure 6.1 is a typicaldiagram). In order to minimize the effect of increased analytical errorat low uranium concentrations, HETS values based on analysis of less than0.01 g/liter uranium were not calculated. The solvent uranium concentrationswere used for all HETS calculations for stripping regardless of which phasewas continuous in the column. This necessitated calculating solvent valuesfor aqueous continuous runs by material balance (Table 6_.3)° The mostrepresentative HETS values (Table 6.4) for aqueous continuous operation ofthe sieve plate column were 2.2 ft at 50 cpm and 2.4 ft at 70 cpm for a6 ft length of column. HETS values for aqueous continuous operation of thenozzle plate column remained constant at 3-1 ft as the pulse frequencyincreased from 30 to 50 cpm for a 9 ft length of column. Solvent continuousoperation of the nozzle plate column showed that the HETS values decreasedfrom 2.0 to 1.7 ft as the pulse frequency increased from 50 to 90 cpm fora 6 ft length of column. In all cases, 12 ft of column was sufficient toreduce the uranium concentration in the stripped solvent stream to 0.005 g/liter or less, equivalent to a uranium loss of < 0.1$.
Several tests were made with a solvent to aqueous ratio of ~7» Althoughthe operating line and equilibrium lines were too close to permit the calculation of HETS values, in all cases, the uranium loss in the stripped solventstream was < 0.1$.
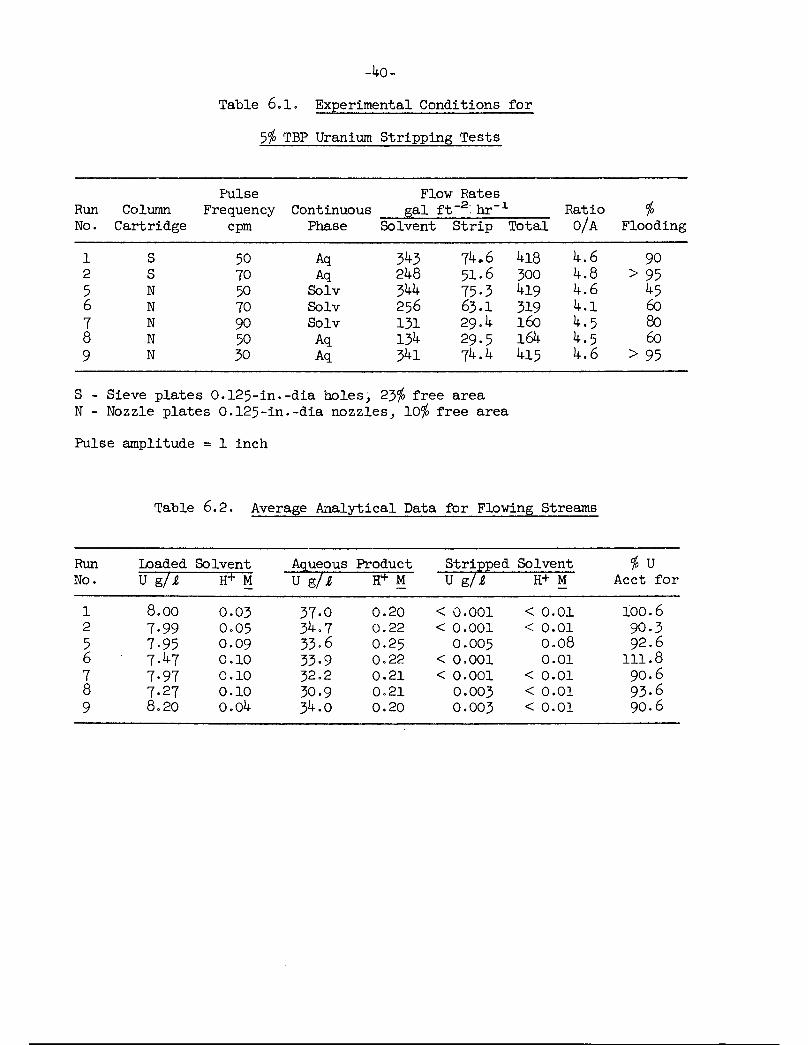
-40-
Table 6.1. Experimental Conditions for
5$ TBP Uranium Stripping Tests
Pulse Flow Rates
Run Column Frequency Continuous gal ft -2; hr"1 Ratio $No. Cartridge cpm Phase Solvent Strip Total o/a Flooding
1 S 50 Aq 343 74.6 418 4.6 902 S 70 Aq 248 51.6 300 4.8 > 955 N 50 Solv 344 75-3 419 4.6 456 N 70 Solv 256 63.1 319 4.1 60
7 N 90 Solv 131 29.4 160 4.5 808 N 50 Aq 134 29.5 164 4-5 60
9 N 30 Aq 34l 74.4 415 4.6 > 95
S - Sieve plates 0.125-in.-dia holes, 23$ free areaN - Nozzle plates 0.125-in.-dia nozzles, 10$ free area
Pulse amplitude = 1 inch
Table 6.2. Average Analytical Data for Flowing Streams
Run Loaded Solvent Aqueous Product Stripped Solvent $ uNo. U g/£ H+ M U g/i H+ M U g/i H+ M Acct for
1 8.00 0.03 37.0 0.20 < 0.001 < 0.01 100.62 7.99 0.05 34.7 0.22 < 0.001 < 0.01 90.3
5 7-95 0.09 33-6 0.25 0.005 0.08 92.66 7-47 0.10 33-9 0.22 < 0.001 0.01 111.8
7 7-97 0.10 32.2 0.21 < 0.001 < 0.01 90.68 7.27 0.10 30.9 0.21 0.003 < 0.01 93.69 8.20 0.04 34.0 0.20 0.003 < 0.01 90.6
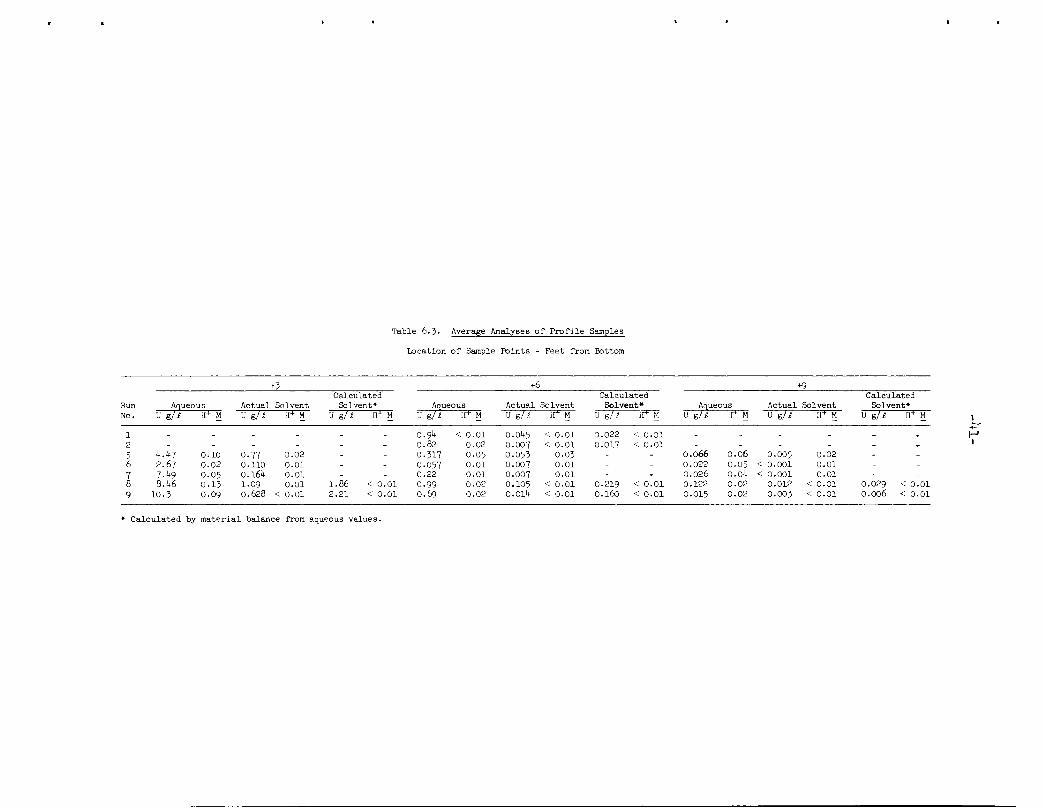
Table 6.5. Average Analyses of Profile Samples
Location of Sample Points - Feet from Bottom
+3 +6 +9Calculated Calculated Calculated
Run Aqueous Actual
U g/lSolvent
H+ M
Solvent* Aqueous Actual
U g/l.Solvent
H+ M
Solvent* Aqueous Actual
U g/iSolvent
H+ M
Solvent*
No. u e/i H+ M U g/l H+ M u ejt H+ M U g/l H+ M U g/i H"1" M U g/i H+ M
-f=-1 _ _ _ _ _ _ 0.94 < 0.01 0.045 < 0.01 0.022 < 0.01 - - - - _ .
2 - - - - - - 0.82 0.02 0.007 < 0.01 0.017 < 0.01 - - - - - -1
5 4.47 0.10 0.77 0.02 - - 0-317 0.05 0.053 0.03 - - 0.066 0.06 0.005 0.02 - -
6 2.67 0.02 0.110 0.01 - - 0.057 0.01 0.007 0.01 - - 0.022 0.05 < 0.001 0.01 - -
7 7.1*9 0.05 0.164 0.01 - - 0.22 0.01 0.007 0.01 - - 0.026 0.04 < 0.001 0.01 - -
8 8.46 0.13 1.09 0.01 1.86 < 0.01 0.99 0.02 0.105 < 0.01 0.219 < 0.01 0.122 0.02 0.012 < 0.01 0.029 < 0.O1
9 10.J 0.09 0.628 < 0.01 2.21 < 0.01 O.69 0.02 0.014 < 0.01 O.I60 < 0.01 0.015 0.02 0.003 < 0.01 0.006 < 0.01
Calculated "by material balance from aqueous values.

ZUJ
>
o
z<
0.01
0.001
0.0001i.OOl
-42-
0.1 1.0
URANIUM IN AQUEOUS PHASE, g/l
Fig. 6.1. McCabe-Thiele diagram for stripping uranium from 5% TBP - Run 8.
UNCLASSIFIED
ORNL-LR-DWG 62887
100

.43-
Table 6.4. HETS Values for Stripping Uranium from 5$ TBP-Amsco
Run
No.
Continuous
Phase
Pulse Phase
Frequency Ratiocpm o/A
HETS Values - FeetLocation of Column Section Above
Feed Point - Feet
0-3 0- "0^9 3^ T^ 6^9"
1
2
Sieve Plate Column (0.125-in.-dia holes, 23$ free area)
Aq 50 4.6Aq 70 4.8
2.2
2.4
zzle Plate Column (0.125-in.-dia nozzles, 10$ free area)No
5 Solv
6 Solv
7 Solv
8 Aq9 Aq
50
70
9050
30
4.6 1-3 2.0 - 3.2 - _
4.1 1.0 1.7 - 3.2 - -
4.5 1.2 1.7 - 3-1 - -
4.5 1.8 2.2 3-1 3.3 3-7 3-44.6 1.8 2.1 3-1 3.2 3-5 3.3

-44-
7.0 VOLATILITY
R. W. Horton
7-1 MSR Core Fuel Reprocessing - W. W. Pitt
The core fuel salt for the proposed Molten Salt Breeder Reactor willbe a mixture of Li7F and BeF2 plus U235F4 and possibly ThF4. The accumulation of fission products in this salt will necessitate processing at frequentintervals to remove accumulated neutron absorbing poisons. The processingscheme1 currently under consideration involves separation of U235 from thesalt by the volatility process and recovery of the high cost Li7F and BeF2from the residue (Figure 7.1).
The salt recovery process consists of dissolution of the salt in liquidHF, followed by a solids separation step to remove insoluble F.P. fluorides,and then finally evaporation of the HF leaving purified salt. Laboratorystudies of the dissolution of lithium and beryllium fluorides in HF haveindicated that the rate of dissolution is greatly increased by agitationor by increasing the surface to volume ratio. This, in addition to a needfor a continuous process, led to the consideration of spraying as a meansof introducing salt into liquid HF.
2Due to the difficulties experienced at Argonne National Laboratory
with single phase nozzles spraying fused salts, a two phase or atomizingnozzle was chosen for study.
Spray Nozzle Performance Specifications. A maximum mean particlediameter of 50 microns was chosen to maintain the high surface volume ratiorequired for rapid dissolution of salt in HF. The nozzle must maintain thesalt fluid (~ 550°C) until it is discharged. Because the salt is highlycontaminated the nozzle must be simple and reliable or easily replacedremotely. The nozzle will have to handle varying rates of fused salt; themean rate will be about 3 gal/hr.
Pressure Nozzles. In pressure nozzles the fluid is under pressure andis broken up by its inherent instability and its impact on the atmosphere.Here the energy required to break the fluid into small drops is suppliedonly by that stored in the fluid under pressure. To produce droplets about50 microns would require pressures greater than 6o psi in the fused saltsystem and nozzle diameter less than 0.020 inches which would tend to plug.
Rotating Nozzles. In rotating nozzles the fluid is fed at low pressureto the center of a rapidly rotating disk or cup. Centrifugal force causesthe fluid to be broken up into drops. This type nozzle would be highlysubject to bearing failure in the corrosive atmosphere of the fused salt,HF system. Also there would be the difficulty of keeping the salt moltenwhile it was on the disk.
Two Fluid Atomizing Nozzles. In atomizing nozzles the fluid is subjectto a high-velocity jet of gas which supplies the energy required to breakit up into fine droplets. In this type nozzle there are no moving parts tofail, the fused salt nozzle can be of fairly large diameter with requiredpressure less than 20 psi, and it may be readily heated by resistance heating.

MSR
Core
_LCore
Fluorinator
Salt
F.P.
Dissolver
90% HF
10% Salt Solution
F.P. Solids
Solids Separator
tF.P. Solids
To Waste
-45-
•*-UF6
HF-H20 ^_Solution
HF-H20Vapor
Salt
Solution
UNCLASSIFIED
ORNL-LR-DWG 62888
UF6, " UF4Reduction
TUF4To
Fuel Makeup
Solvent
Condenser
HF-H20Vapor
A
Evaporator
TPurified
Salt
To
Fuel Makeup
Fig. 7.1. Proposed flowsheet for MSR core fuel processing.

-46-
The problems associated with this nozzle type, that of supplying a largevolume of high velocity gas and of separating the small salt particles fromthe gas, may be solved with present technology.
Two-Fluid Atomizer Sizing Calculations. The two fluid atomizerequations developed by Nukiyama and Tanasawa,-5 were used.
D.^+191/^y-V^>5 {1)\JFl \jnrzj \ qa J
where
cr = surface tension of liquid, dynes/cm
u = viscosity of liquid - centipoises
p = liquid density - lb/ft3
QL, Q. = volumetric flow rates of liquid and air, respectively, ft3/sec
V = relative velocity between two fluids - ft/sec
D = mean droplet diameter - microns
For calculations the following physical constants of the fused saltwere assumed:
a - 180 dynes/cm
u = 8.4 centipoises
p = 134 lb/ft3
The selected diameter of the fused salt nozzle was 25 mils. It wasfelt that this approached the minimum diameter through which fused saltwould easily flow. If the salt driving force through the nozzle is 20 psi,the salt velocity will be
r2g £P
= 0.6 /-v = 0.6 ' e _ , /64.3 x 20 x 144 00 _, ,= 0.6 / 1 = 22 ft/sec
From equation (l), it is apparent Va must be much greater than 400 ft/sec,for D to be less than 50 microns. Therefore VA must be greater than 500ft/sec. Also from equation (l), it is apparent that Qa must be on the orderof 5000/QL.
Q = 5000 ' 7-5 x 10"5 = 0-375 ft3/sec

-47-
Area of gas nozzle = 0-375/500 x l44 = 0.11 in.2
Where the outside diameter of salt nozzle is l/4-in. the ID of gas nozzlemust be 0.63-in.
Nozzle Heating and Construction Details (Figure 7.2). To prevent thefused salt from freezing in the nozzle and plugging it, a means of heatingthe nozzle to greater than 500°C must be provided. The best way of doingthis is by resistance heating the nozzle. This requires a continuouselectrical circuit through the nozzle. The salt nozzle was machined fromInconel bar stock, to a wall thickness of ~32 mils, (the same as small tubing),and an inner diameter of 25 mils at the discharge end (Figure 7-3). The inletof the nozzle was welded to the l/4-in. Inconel transfer line. The dischargeend to l/2-in. Inconel tubing which circumscribed the transfer line for about10-in. and terminated at an Inconel ring joint flange. Two Chromel Alumelthermocouples were attached to the inner wall of the annulus, one at thenozzle tip, and the other about 4 inches from the tip. The annulus wasfilled with magnesium oxide insulation to prevent short circuiting. Thisprovided an electrical path from the flange, which was insulated from theground, through the l/2-in. tubing, nozzle, l/4-in. transfer line, supplytank to ground. The resistance of this circuit was approximately 0.2 ohms.
The atomizing gas was fed through l-in. Inconel tubing which wasconcentric to the l/2-in. tubing for about 5 in. It was tapered to 0.6-in.at the outlet, just beyond the nozzle tip. This provided parallel flow ofthe two fluids. The gas supply tubing was bent 90°, to allow the saltline to enter in a straight line, through an opening cut in the l-in. tubing.A ring joint flange welded to the bend, perpendicular to the discharge section,allowed the salt nozzle and the gas supply line to be disconnected. A sectionof l/2-in. pipe sealed the inner flange to the l-in. tubing.
Molten Salt Supply Tank and Transfer System. To provide a supply ofmolten salt, a tank was made from 6-in. Schedule 40 Inconel pipe, and 1 in.plate. This tank was heated to 800°C in an 8-in. Hevi-duty furnace, andpressurized to 30 psi with nitrogen to provide the driving force for transferof the molten salt. The salt was transferred through l/4-in. Inconel tubingwrapped with asbestos insulation tape. The 10 ft of transfer line and nozzlewere resistance heated by 100 amp current at 18 volts potential. Thisprovided a temperature of approximately 700°C in the transfer line and> 85O°C in the nozzle, before flow of atomizing air.
Atomizer Testing. The atomizer shown in Figure 7-4 was first testedwith water and air. The sprayed water droplets were caught in molten paraffinand examined optically. With a water flow of approximately 0.5 cu ft/hr andan air flow of approximately 5000 cu ft/hr droplets of 5 - 100 micron indiameter were obtained, with a mean less than 25 microns. From equation (l)and the physical constants of water and fused salt, it is apparent that fora given flow of the two fluids the mean droplet diameter of fused saltshould be approximately twice that for water. Therefore with a fused saltflow of 0.5 cu ft/hr and an air flow of 5000 cu ft/hr a mean droplet diameterof < 50 microns should be obtained.

Salt Nozzle
Gas Nozzle
•48-
•mzm^
Fig. 7.2. Molten salt atomizer.
UNCLASSIFIED
ORNL-LR-DWG 62889

Butt Weld To
1/2" InconelTubing
-49-
Butt Weld To.
1/4" InconelTubing
0.025 *
Fig. 7.3. Fused salt nozzle.
UNCLASSIFIED
ORNL-LR-DWG 62890
Scale 1" = 1/16"

•50-
Fig. 7.4. Two fluid atomizing nozzle.
UNCLASSIFIED
PHOTO 54442

-51-
The nozzle was then welded to the l/4-in. transfer line, and resistanceheating circuit connected. After charging the supply tank with 26-42-32 mol$ Na-Li-Zr F salt, the salt was fused and an attempt made to spray it.Though the nozzle and transfer line temperatures were greater than 700°C,no salt was sprayed after a 3 hr effort. Later visual inspection showedthat salt had been transferred to the tip of the nozzle. After drillingthe nozzle out with a 0.025 in. drill, a second attempt was made, and thistime salt was successfully sprayed for 15 min at a rate of 0.3 cu ft/hr.Atomization was not continuous, however, because a cake of frozen salt builtup around the salt nozzle when the atomizing air was on. This would quicklybreak away when the air was turned off, so the nozzle was operated as anatomizer in cycles.
The sprayed salt was collected in water which separated the solids fromthe high velocity air. A 5 gallon open container was placed in an open 55gal drum (Figure 7.5), and both had approximately 4 in. of water. This waythe non-atomized salt was retained in the 5 gal container only.
Results. Samples of sprayed salt were taken from both the 5 gal containerand the 55 gal drum. In addition, samples of dry salt were taken from surfacesnear the nozzle where the salt had settled out.
Microscopic examination of the samples showed that those samples whichhad been wet by water were mostly irregular particles < 5 microns in diameter(Figure 7.6a). Those collected dry were mostly spheres 25 - 100 microns indiameter (Figure 7.6b). However, the existence of sub-micron spheres indicatesthe atomizing nozzle may produce some droplets in this range (Figure 7>7)-
Conclusions - Continuous Dissolution. It appears to be very feasibleto obtain a mean droplet diameter of < 75 microns by atomizing fused salt.The fact that the particles of salt which were sprayed into water were muchsmaller and much more irregular than the droplets collected dry, indicatesthat the droplets had been apparently shattered into very fine particlesby rapid cooling. This suggests that a small droplet diameter is not necessary(even the salt which was not atomized was collected as very small, irregularparticles). For continuous dissolution in HF, it should only be necessaryto introduce molten salt in a fine stream into liquid HF.
The two major problems in atomizing fused salt are the supply of alarge volume of high velocity atomizing gas (probably very corrosive) andthe separation of the solid salt droplets from the atomizing gas. Neitherof these problems should be too difficult to solve.
Continuous Fluoridation. As a result of the preliminary tests of fusedsalt atomization, spray fluorination should be reconsidered as a continuousprocess for recovery of uranium from fused salt in the volatility process.The disadvantages listed by Gabor, et al.,2 should be somewhat overcome bythe use of an atomizing nozzle.
1. The fused salt nozzle diameter is not critical to the atomization,thus fewer nozzle replacements would be required.
2. The use of fluorine as the atomizing gas and the very small dropletsobtained should provide high recovery in one cycle.

A - Non-Atomized
Fig. 7.5. Salt Collection.
UNCLASSIFIED
ORNL-LR-DWG 62891
B - Atomized
i
ro

UNCLASSIFIED
PEM-3263-3
^ff
1 * **4
»r-
* » *.*'
A. Salt Quenched by Water
Fig. 7.6. Atomized salt.
UNCLASSIFIED
M-2997
B. Salt Collected Dry
i

-54-
* -^ # 0.2 M 'k<*£?
Fig. 7.7. Atomized salt quenched in water particularly note sub micron spheres.
UNCLASSIFIED
PEM-3263-1T. IT,
• *?

-55-
References
1. Campbell, D. 0. and Cathers, G. I., "Processing of Molten Salt PowerReactor Fuels," Ind. and Eng. Chem., Vol. 52, p. 4l, January i960.
2. Gabor, J. D., Mecham, W. J., Jonke, A. A. and Rodger, W. A., "SprayFluorination of Fused Salt as a Uranium Recovery Process," ANL-6131.
3. Nukiyarna, S. and Tanasawa, Y., "Trans. Soc Mec Engrs.," (Japan) 4,No. 14, 86 and No. 15, 138 (1938); 5, No. 18, 63 and 68 (1939); 6 No. 22II-7 and No. 15, 158 II-8 (l94o).

-56-
8.0 WASTE PROCESSING
J. C. Suddath
The purpose of this program is to obtain engineering information forthe design of a hot pilot plant, which will demonstrate the disposal ofhigh level waste solutions. Since the hot pilot plant may be built at theIdaho Chemical Processing site where TBP-25 waste is available, TBP-25 wasteof the composition stored at Idaho was used for this test.
8.1 Evaporator-Calciner Test (R-38) - C. W. Hancher
Test R-38 was operated using the same procedure as was used for testR-37 reported in the May 1961 Unit Operations Monthly Report. The closecoupled evaporator-calciner was operated and controlled as reported fortest R-37- The feed for this test was TBP-25, simulated from the sampledcomposition of tank WM-182 at the Idaho Chemical Processing Plant, Table 8.1.Cold Ru was added to check its volatility during the evaporation-calcinationoperation.
The average feed rate for the test was 27.6 liters for an hour, Table 8.2,Figure 8.1. Only 89$ of the nitrate was accounted for, while the rutheniumand mercury balances were 45$ and 42$. The unaccounted for ruthenium andmercury are probably plated as solid in the off-gas system. However, themercury did concentrate in the evaporator during the standby period, Table 8.3.
8.2 Evaporator-Calciner Control and Operation
Test R-38 started with the evaporator filled with cold feed and thecalciner empty and cold (Table 8.4). The evaporator contents were heatedto boiling and then the calciner was heated and filled simultaneously,requiring about 60 min to fill. As the control variables reached their setpoint values they were switched from manual to automatic control. Thecontrol settings for five controlled streams are shown in Tables 8.5 and8.6. The system controlled satisfactorily for over 90$ of the time. Theevaporator level (Figure 8.2) was within control limits at all times, exceptwhen the level probe plugged. This caused feed to foam over into thecondensate tank.
The control of variables has been evaluated by the setting of limits:
Limit "A" Too high, out of control, dangerousLimit "B" Upper limit of good controlLimit "C" Lower limit of good controlLimit "D" Too low, out of control, uneconomical
The evaporator density exceeded only limit "B" during the operationalperiod of the test. When the calciner was filled about the 13. hour the feedrate to the calciner decreased to a low rate, the evaporator was put onstandby, no more feed was added to the system. As the calciner demandedfeed at a low rate the Al+++ concentration of the evaporator decreased,Figure 8.3. The temperature of the evaporator controlled satisfactorily,but acid concentration of the evaporator did not follow the temperature

-57-
Table 8.1. Test R-38 Feed Concentration - "TBP-25"
H Al Hg HN03 Fe Na Rumolar M g/liter M g/liter g/liter g/liter
As made up* 1.26 I.72 4.0 6.6 0.l6 2.4As analyzedTank 1 I.75 1.7 5.75 6.6 0.20 0.148Tank 2 1.48 1.7 4.60 6.6 0-31 0.148Tank 3 1-70 1.7 4.31 6.6 0-31 O.I58
* Concentration of Tank - WM-182, Idaho Chemical Processing Plant

Table 8.2.
Nitrate Balance
InputRecovery
(condensate(solid(off-gas
Ruthenium Balance
InputRecovery
(condensate(solid(evaporator
Mercury BalanceInputRecovery
(condensate(solid(evaporator
-58-
System Balances and Results
Test R-38
2917 g moles
2581 g moles3 g moles6 g moles
66.5 g
0-9 g28.5 g0.8 g
2250 g
17 g89 g840 g
Off-gas
1260 cu ft total1152 cu ft leakage and purge
108 cu ft non-condensable (74 cu ft oxygen)
108/442 = 0.245 cu ft/liter of system feed
Average Feed Rate
442/16 hr = 27.6 liter/hr average
(11 + 5 at low rate)
Water Feed Rate
1457 liter of water, water to feed ratio =3-3
Calcined Solids
38 kg solid/68 liters =0.56 g/cc Bulk Density
TBP-25 Waste
88.5$0.1$0.2$
88.8$
1-3$43-0$1.1$
45.4$
0.7$3-9$37-0$
41.6$

12 14
RUN TIME, hrs.
Fig. 8.1. System flow rates vs run time.
UNCLASSIFIED
ORNL-LR-DWG 62892
24
vn
I

Table 8.3. R-38 Test Conditions and Results
System System Water 1*1 Evap Evap Evap Evap Evap Evap
Test Feed Water to Feed System Evap N03 Mol N03 Evap Evap Al Hg Ru H+ Steam Steam
Time (TBP-25) Feed Ratio Condensate Press Input Condensate Density Temp Cone Cone Cone Cone Temp Cond
hrs i t ratio I pslg g mol g mol g/cc °C s/t eJi S/l molar °C I
1 82 0 0 20 -0-5 541 30 1.33 114 50.4 6.25 0.171 O.76 136 99
2 119 110 0.92 158 -0.5 785 85 1-37 111 56.7 6.88 0.234 3.25 126 198
3 136 136 1.00 246 -0-5 898 296 1-35 117 34.7 4.48 0.376 5.87 130 297
4 172 197 1.14 310 -0-5 1135 539 1.32 117 24.7 3.00 0.205 7-03 128 396
5 221 197 0.89 356 -0.75 1459 741 1.30 114 48.7 5.50 0.247 4.00 120 4956 295 197 0.67 441 -0.75 1947 1063 1-32 118 54.7 6.13 0.205 3.56 129 594
7 515 212 0.67 517 -0.75 2079 1359 1.33 118 53-8 5.88 0.138 2.96 134 693
8 356 265 0.74 595 -0.75 2350 1608 1-35 112 48.6 6.63 0.142 4.27 122 792
9 361 265 0.73 637 -0.75 2383 1763 1.38 115 53-3 7.63 0.139 4.04 119 891
10 371 265 0.71 657 -0.75 2449 1853 1.38 117 58.9 8.75 0.154 1.70 121 990 1
11 380 382 1.01 730 -0.75 2508 1991 1.27 112 40.6 4.48 0.086 0.62 124 1089 ON
12 442 617 1.40 849 -0-75 2917 2098 1.32 111 28.0 2-91 0.049 0.34 120 1188 O
13 442 628 1.42 904 -0.75 2917 2137 - 42 26.6 2.50 0.037 0.72 108 1287 1
14 442 681 1-54 979 -0.75 2917 2152 1.14 104 17-1 2.06 0.035 1.34 112 1386
15 1+1*2 757 1-71 1031 -0-75 2917 2157 1-13 104 14.0 1-75 0.021 1.70 116 1485
16 757 1-71 1075 -1.0 2161 1.15 103 11.0 1-55 0.024 I.98 114 1584
17 848 1.92 1092 -0.75 2164 1.13 103 7-91 1.15 0.014 2.11 115 1683
18 863 1-95 1163 -0.75 2178 1.12 42 6.02 1.05 0.010 2.22 113 1782
19 889 2.01 1212 -0.75 2183 1.12 104 4.67 0.70 0.010 2.24 114 1881
20 939 2.12 1256 -0.75 2196 1.12 102 4.76 1.08 0.013 3.28 115 1980
21 992 2.24 1307 -0.75 2237 1.10 107 5.01 3-35 0.020 5-83 112 2079
22 1045 2.36 1402 -0.75 2341 1.20 104 4.94 3.25 0.022 5-50 117 2178
23 1094 2.48 1450 -0.75 2393 1.25 110 5.45 3.63 0.022 5.25 115 2277
24 1185 2.68 1498 -0.75 2441 1.14 108.5 5.76 6.88 0.022 5.10 114 2376
25 1200 2.71 1542 -0.75 2476 1.14 108 5.94 10.1 0.021 4.90 113 247526 1264 2.86 1594 -0.75 2507 1.13 106.7 5.94 12.1 0.021 4.73 111 2574
27 1279 2.89 1638 -0.75 2529 1.12 105-7 6.12 12.9 0.026 4.63 111 2673
28 1329 3-01 1680 -0.75 2546 1.12 105-2 5.88 16.4 0.023 4.44 110 2772
29 1423 3-22 1721 -0.74 2558 1.12 104.8 5.94 17-8 0.025 4.45 110 2871
30 1457 3-30 1755 -0.75 2565 1.10 103.8 6.12 28.3 0.028 4.03 106 2970

wro
ro
Kiry
ro
ro
ro
wro
ro
HH
HH
HH
HH
HH
O\D
CD
-J0
\0i
-F"O
Jro
1-*
OM
DC
D-J
CT
\^n
4^
^J
MH
OM
)O
D-J
On
oir^
MH
cr\0
\0
\o
io
io
io
io
-iv
no
-io
i•f'-
f'-
f'-
f'-
f'-
f'-
f'o
jo
jo
jo
jo
jro
ro
hh
(-*
rOH
O^
CD
-JV
n*
->
jiH
OM
3-J
ON
-F'O
JW
OV
OC
pO
>-F
'rO
OD
-F-1
vO
Ol
OO
ih
rr^
JU
Jh
m3
uj
on
co
-j
01
md
roo
oo
>ro
o\-P
"o
*jj
oh
roo
i>
oo
-f-o
i
Cp
-J-JC
D-JO
N^
fO
Mr-'r
^H
HH
HH
HH
HH
HH
HH
HH
HH
I-'l
-'
o-j^
jro
^oh*
o-j
Qp
-^O
JO
JV
NV
^o
iuj^
jvjJ
Wro
wo
ju
j-f
*-f
--f
"-f
-oj
roro
oo
oo
oo
ui-jio
uio
ou
io
oo
oo
ou
iv
iy
io
uiv
iu
iu
i'jio
o
Qp
OJ
rO
MM
MM
H'M
MH
MH
MM
r-'(
-,l
-'f
--'(
-,r
-1
|--'(
--'r
-Jl-
-,r
--'l
--'F
-'r
--'
oh
v>
jco
qn
oi
vi
-f~
-f-o
jro
roro
roro
oj
oj
oj
oj
roo
jo
jo
j-f
"-f
--f
--f
*o
jro
-j
Ov
nO
vn
OO
OO
Ou
iu
iv
nv
nu
iv
iO
OO
Oo
io
io
iO
oio
io
io
io
iQ
ui
MH
MH
H(-
*ro
ro
HH
OO
0\
fO—
iO
JC
DO
J—
roh
on
oi
oj
cd
oj
O^
VO
CD
CD
-J-J
Ch
ON
^F
-fV
XW
jJW
Jro
ro
ro
HH
HO
oo
oa\
ho
n(-
•as
ro—
Jro
md
oj
oo
io
on
hco
-F
'O—
jvn
ro
^o
v/i
hU
JF
FO
^^
OC
DH
OO
CD
O^
MD
ro
Hv
nu
iPH
MD
rO
VP
rO
O
h»ro
MD
ro
ui
ov
>ih
^h
oi-
*o
i-f
-h
oj
ho
j\o
-p-
oo
oo
i-j
QA
—j
co
roo
OO
JC
Tn
OnM
DC
DO
JO
ro—
0M
D-4
04
HO
OH
-J-Jiu
iO
J^
VI
(-•
CD
^O
I-1
HM
DM
D
OO
OO
OO
OO
OO
OO
OO
OO
OO
OO
OO
OO
OO
OO
OO
\J0
CO
CD
CO
CD
CD
CD
MD
MD
VO
MD
VO
'vO
VO
^O
co
md
vo
^o
^o
cc^
o\o
co
cd
'-o
md
^o
vo
^o
OOOOOOOOOO
MM
ro
ro
Hro
ro
ro
ro
H1
OO
OO
OO
OH
HO
mro
ro-f
--f-—
]\o
ob
Co
Oo
o
ro
roh
OO
o
CfN
ro
OJ
OO
OO
OO
OO
OO
vn
HU
JH
-F"O
Jh-
»rO
-F
'OJ
OM
O
hro
oj
Mro
H"
HH
O0s
-C
O—
Jo
A
OO
Oo
hro
Hr
CD
lco
MD
OJ^
ro
oro
ro
oD
^o
iro
-jc
oO
OJ-jo
oJC
TN
OJO
ro
ro
-F
'CD
ro
^o
oo
VN
M3
OF
Uiv
nO
vrO
VN
CO
-F
WC
DG
orO
^W
H-JD
JO
OV
IH
HC
D^
O-J
CD
HC
OC
OH
CD
Ol
\Q4
^M
3-J^
H—
JC
O-F
'^O
OJ
CD
-J0
A-F
"OJM
2O
N-F
"C
DH
OO
\0
OOOOOOOOOOOOOOOOOOOOOOOOOOOOOO
^COOOOd030DCO^^^MD^0^1^\0'^Q1OmD^O^O^O\QM3CD00\O
^OOd\0
»*0
OOOOOOOOOOOOOOO
ro
ro
ro
ro
oj
•£-
-f-
-f-
-F*
CT
\oi
.p-
ro-F
"-f
-
OO
OO
OO
HO
O
oj
oj
-F~
oio
jo
iH
oiv
n
-19
-
CD
(-3
oro
rofo
P=
oP
-i-
3P
om
inh
:ro
ro3
nI
0O
>C
JH
-d
-d
-3
roh
-p>
ro"
Od
-4
3
>O
O(
o(y
)ro

-62-
Table 8.4. Test R-38 Operation Log
Run Time
0 8:00
0.5 8:351.0 9:00
2.5 10:30
5-0 13:0011.0 19:0013-0 21:00
24.0 8:0031.0 14:00
Start Wheelco 800°Ccold
Start to fill potCalciner pot full
Calciner level plugged - water added 50 cc/minEvaporator pressure set point moved -0.5 psig to -0.75 psigLow rate of feed to the calciner pot - evaporator standbySystem foam over to condenserWheelco to 900°CCalciner heat off and evaporator shut down
Evaporator full cold - pot empty
Evaporator ll4°C - pot furnace on
EvaporatorEvaporatorEvaporatorEvaporator
Calciner
Table 8.5. Control Setting for Test R-38
Control
Variable
Liquid levelDensityTemperature
Pressure
Liquid level
Control Range0 - 100$
Prop.Band Reset
min
7-4-35-0 liter 250 51.0-1-5 g/cc 200 10101-128 °C 100 5
-5 to +5 psig 10 0.3
44-52 liter 100 10
Set
Point
Scale °t
5070
6542
50

-63-
Table 8.6. Operational Limits for Test R-38
Operational*Limit Limit Set Limit Limit Readings
A B Point C D Min Max
EvaporatorLiquid Levelscale % 90 65 50 35 25 35 60liters 33 26 22 18 15 18 24
Evaporator
Densityscale °fo 80 70 65*** 50 40 20 78g/cc 1.40 1-35 1.32 1-25 1.20 1.10 1-39
EvaporatorTemperature
scale % 90 75 65 30 0 67 2
°C 122 120 117 110 103 118 102
EvaporatorPressure
scale io 47 45 42 40 38 45 35psig -0.25 -0.50 -0.75 -1.0 -1.25 -0.5 -1.5
Calciner
Liquid Levelscale % 30 4o 50 60 70 20 80**
liters 58 59 60 61 62 57 63
* Recorded hourly readings** Was zero before and after filling period*** Al = 45 g/liter

o>
2
70%
Limit "A"
Liquid Level Probe Plugged SystemFoamed-Over Into Condensate Tank.
10 12 14 16
RUN TIME, hrs.
Fig. 8.2. Evaporator liquid level vs time.
UNCLASSIFIED
ORNL-LR-DWG 62893
20 22 24
Set
Point
I
ON
I

CO £1 CO
(J
z >
OU V
U_l
< Q
60
50 1.3 —
40
30
20
10
012 14
RUN TIME, hrs.
Fig. 8.3. R-38 evaporator density and Al concentration vs run time.
UNCLASSIFIED
ORNL-LR-DWG 62894
i
ON

-66-
very closely, Figure 8.4. The high acid level of the 4th hour did not causeany extra Ru volatility. The Ru in the condensate was below 0.005 g/literfor the entire test. The maximum evaporator Ru concentration was 0.25 g/liter.
8.3 Calciner Pot Corrosion
The calciner pot used in test R-38 showed no signs of corrosion on theinside. The outside of the pot showed no signs of corrosion or oxidationscaling. A nitrogen purge of 10 cu ft/hr was used between the calciner potand furnace liner.
8.4 Calcined Solid
The calcined solid had a bulk density of O.56 g/cc (Tables 8.2 and 8.7).The solid was light gray in color and very crumbly. There was a hole downthe center of the pot indicating radial growth of solids. Only 4$ of themercury fed to the system remained with the calcined solids. However, 43$of the ruthenium added as cold ruthenium remained with the calcined solid.
The off-gas line contained a solid film which was 90$ mercury and 1$ Ru.The mercury and ruthenium system balances were 57$ and 42$. The unaccountedfor material probably plated on the system's metal surfaces.
8.5 Off-Gases
The off-gases were sampled before and after the water jet scrubber.The gases were analyzed for O2, N2, A, NO-CO2, and NO2, Table 8.3. Aftersampling,the gas volume is determined by a wet test meter. The total volumeof gas for the test was 1260 cu ft, of which 1152 cu ft was leakage andinstrument purge (~400 cu ft purge). Of the 108 cu ft of non-condensablesother than air, 74 cu ft was excess oxygen, and the remaining 34 cu ftwas N02-

OZ32
of.
<_J
O
12 14
RUN TIME, hrs.
Fig. 8.4. R-38 evaporator temperature and acid concentration vs run time.
UNCLASSIFIED
ORNL-LR-DWG 62895
- 140
u
LiJ i
&L ON
=> -O120 >-
Set ^Point ^
- 100

-68-
Table 8.7. R-38 Solid Analysis
Fe
wt $Al
wt $Hgwt $
N03wt $
Ru
mg/g
Top 70 in. 0.48 42.5 0.84 1.7 1.2
50 in. 0,35 44.0 0.1 0.2 0.530 in. O.38 46.0 o.l 0.3 0.5
Bottom 6 in. 0.39 46.0 0.1 0.1 0.7

-69-
DISTRIBUTION
1. E. L. Anderson (AEC Washington) 54.2. F. P. Baranowski (AEC Washington) 55.3- W. G. Belter (AEC Washington) 56.4. S. Bernstein (Paducah) 57.5- R. E. Blanco 58.6. J. 0. Blomeke 59.
7-10. J". C. Bresee 60.11. R. E. Brooksbank 61.12. K. B. Brown 62.
13- F. R. Bruce 63-14. J. A. Buckham (ICPP) 64.
15. L. P. Bupp (HAPO) 65.16. W. D. Burch 66.
17- W. H. Carr 67.18. G. I. Cathers 68.
19- J. T. Christy (HOO) 69.20. W. E. Clark 70.21. V. R. Cooper (HAPO) 71.22. K. E. Cowser 72.
23- F. E. Croxton (Goodyear Atomic) 73-24. F. L. Culler, Jr. 74.25- W. Davis, Jr. 75-26. 0. C Dean 76.27. D. E. Ferguson 77-79-28. L. M. Ferris 80.
29- R. J. Flanary 81.
30. E. R. Gilliland (MIT) 82.
31- H. E. Goeller 83-32. M. J. Googin (Y-12) 84.
33. H. B. Graham 85.34. A. T. Gresky 86.
35. P. A. Haas 87.36. M. J. Harmon (HAPO) 88.
37. F. E. Harrington 89.38. L. P. Hatch (BNL) 90.
39- 0. F. Hill (HAPO) 91.4o. J. M. Holmes 92.41. R. W. Horton 93-42. A. R. Irvine 94.43. G. Jasny (Y-12) 95-124.44. H. F. Johnson 125.
45. W. H. Jordan 126.
46. S. H. Jury 127.
47- K. K. Kennedy (IDO) 128.48. B. B. Klima 129-130.
49. E. Lamb 131-134.50. D. M. Lang 135.51. S. Lawroski (AWL) 136.52. R. E. Leuze 137-53- W. H. Lewis 138-152.
J. A. Lieberman (AEC Washington)R. B. Lindauer
A. P. Litman
J. T. LongB. Manowitz (BNL)J. L. Matheme
J. A. McBride (ICPP)J. P. McBride
W. T. McDuffee
R. A. McGuire (ICPP)R. A. McNees
R. P. Milford
J. W. Morris (SRP)E. L. Nicholson
J. R. Parrott
F. S. Patton, Jr. (Y-12)H. Pearlman (Al)R. H. RaineyJ. T. Roberts
K. L. Rohde (ICPP)C A. Rohrmann (HAPO)A. D. RyonW. F. Schaffer, Jr.E. M. Shank
M. J. Skinner
C M. Slansky (ICPP)S. H. Smiley (ORGDP)J. I. Stevens (ICPP)C. E. Stevenson (ANL, Idaho)K. G. Steyer (General Atomics)E. G. Struxness
J. C. Suddath
J. A. Swartout
F. M. Tench (Y-12)V. R. Thayer (duPont, Wilmington, DeW. E. UngerJ. Vanderryn (AEC 0R0)F. M. Watzel (ICPP)C. D. Watson
M. E. Whatley
G. C. Williams
R. H. WingetC. E. Winters
R. G. WymerCentral Research Library
Laboratory RecordsLaboratory Records (RC)Document Reference Section
Research and Development DivisionDTIE