oak ridge conference 2008
TRANSCRIPT
Microfluidic Immunoassays in Polymeric ChipsW. W. P. Chang 1, C. Li1, L. Bousse 1, T. Kawabata1, Y. Shih1, C. Kagebayashi2,
T. Kurosawa2, H. G. Wada1, M. Watanabe2, S. Satomura2
1Wako Pure Chemical Industries Ltd., Mountain View R&D Center, Mt. View, CA, USA2Wako Pure Chemical Industries Ltd., Osaka Research Laboratories, Amagasaki, Japan
Introduction
A quantitative method for performing rapid
immunoassays was recently developed utilizing
microfluidic quartz chips1. Here we demonstrate
the performance of a diagnostic application (alpha-
fetoprotein AFP-L3 or AFP-L3 assay) on
disposable thermoplastic chips.
AFP-L3 is an isoform of AFP. AFP-L3 is a
biomarker specific for liver cancer (HCC)2. The
ratio of AFP-L3 to total AFP, or %L3, has been
established as a sensitive marker for patients at
risk for HCC3.
Isotacho-phoresis (ITP) and capillary gel
electrophoresis (CGE) in polymer chips are used
to react the sample and reagents, and to separate
AFP-L3 immunocomplex within 120 s. The
sandwich immunoassay using the electrokinetic
analyte transport method (EATA) yields high
sensitivity, good reproducibility and linearity.
References1. T. Kawabata et al., Electrophoresis (2008) 29: 1399-1406.2. K. Taketa et al., Gastroenterology (1990) 99:508-518.3. H. Oka et al., J Gastroenterol Hepatol (2001) 16:1378-1383.4. C. Park et al., Anal Chem (2008) 80:808-814.
Conclusions
� Disposable microfluidics plastic chips can be
used for rapid diagnostics applications, such as
AFP-L3 assay
� Data is quantitative, linear and reproducible
� Sensitivity is excellent. LOD is 0.014ng/mL
(0.2pM) for AFP
Results and DiscussionA known concentration of purified AFP-L1 and
AFP-L3 is mixed in a BisTris sample buffer to form
the sample. Two monoclonal antibodies
recognizing different epitopes on AFP are
conjugated to either DNA or fluorescent dye.
The DNA tag enhances mobility of the immuno-
complex. LCA (Lens culinaris agglutinin) binds the
alpha-1,6-fucosyl residue (core fucose) unique to
AFP-L3 isoform but not AFP-L1, which shares the
primary sequence. Such binding allows AFP-L3 to
separate from AFP-L1.
DNA-mAb, sample and dye-mAb are loaded into
predetermined zones on microchip (see Scheme),
then high voltage is applied across the EATA zone
for ITP stacking and immunocomplex formation.
AFP-mAb complexes are further separated into
AFP-L1 and AFP-L3 subgroups through LCA
binding after the stacked material enters the CGE
zone.
Contact Information
William W. P. Chang, Ph. D.
650-210-9153 x116
L1mAb1 mAb2DNA- - - - -
- - - - -
L3mAb1
α-1,6-fuc
mAb2DNA- - - - -
- - - - -
DNA-mAb conjugate 1 enhances mobility towards the anode; fluorescentdye-mAb conjugate 2 allows detection of complex, while LCA effects theseparation of AFP-L1 and -L3 isoforms (glycoforms)
AFP-L3 Sandwich Immunoassay
Using the AFP-L3% sandwich immunoassay on
disposable, plastic microfluidic chips, we
observed
1. Good resolution of AFP-L1 and AFP-L3 (Fig. 1);
2. Results that are quantitative and reproducible
(Table 1);
3. Excellent linearity and specificity (Fig. 2 & 3);
4. Limit of detection for AFP-L1 is 0.014 ng/mL
(based on 3SD of noise, data not shown);
5. Good assay sensitivity: 2% AFP-L3 is detected
in 25 ng/mL of total AFP (Fig. 4);
6. Fast analysis: assay completed within 120s
after field is applied.
We are currently developing an automated
instrument for this assay using plastic
microchips.
cancerous
benign
5 Assay Dynamic Range
y = 2.5463x + 55.803
R2 = 0.9996
0.0
1000.0
2000.0
3000.0
0 300 600 900 1200
AFP L1 (ng/mL)
L1 P
eak A
rea
Figure 5. AFP assay dynamic range; inset shows a
lower concentration range.
Material and Methods
4 AFP-L3% Sensitivity
Figure 4. AFP-L 3% sensitivity. 2% AFP-L3 is
detectable at 25ng/mL total AFP (L1+L3). At 10ng/mL
total AFP, as low as 5% AFP-L3 can also be detected
(data not shown).
15
17
19
21
23
25
55 57 59 61 63 65
Time (s)
RF
U
0% L3
2% L3L1
L3
AFP-L1 Linearity2
Figure 2. Relationship between AFP-L1 concentration
and AFP-L1 peak height.
y = 3.272x + 53.455
R2 = 0.998
0
400
800
1200
1600
2000
2400
2800
3200
3600
0 400 800 1200
AFP- L1 Concentration (ng/ mL)
AF
P-
L1
Pe
ak H
eig
ht
(RF
U)
AFP-L3% Linearity and Specificity
Figure 3. Known ratios of purified AFP-L1 and -L3
were applied. Relationship between the measured
AFP-L3 % and expected values are shown.
3
y = 1.0004x - 0.0235
R
2
= 0.9997
0.0
20.0
40.0
60.0
80.0
100.0
0 20 40 60 80 100
Theoritical AFP- L3%
Exp
eri
me
nta
l A
FP
-L
3%
Assay Reproducibility
Table 1. Reproducibility (CV) of migration time, quantifi
-cation, resolution and AFP-L3 ratio (N=10).
N=10 L1 Time(s) L3 Time(s) L1 Area L3 Area L3% Resolution
CV 0.97% 0.96% 1.79% 3.04% 0.96% 4.96%
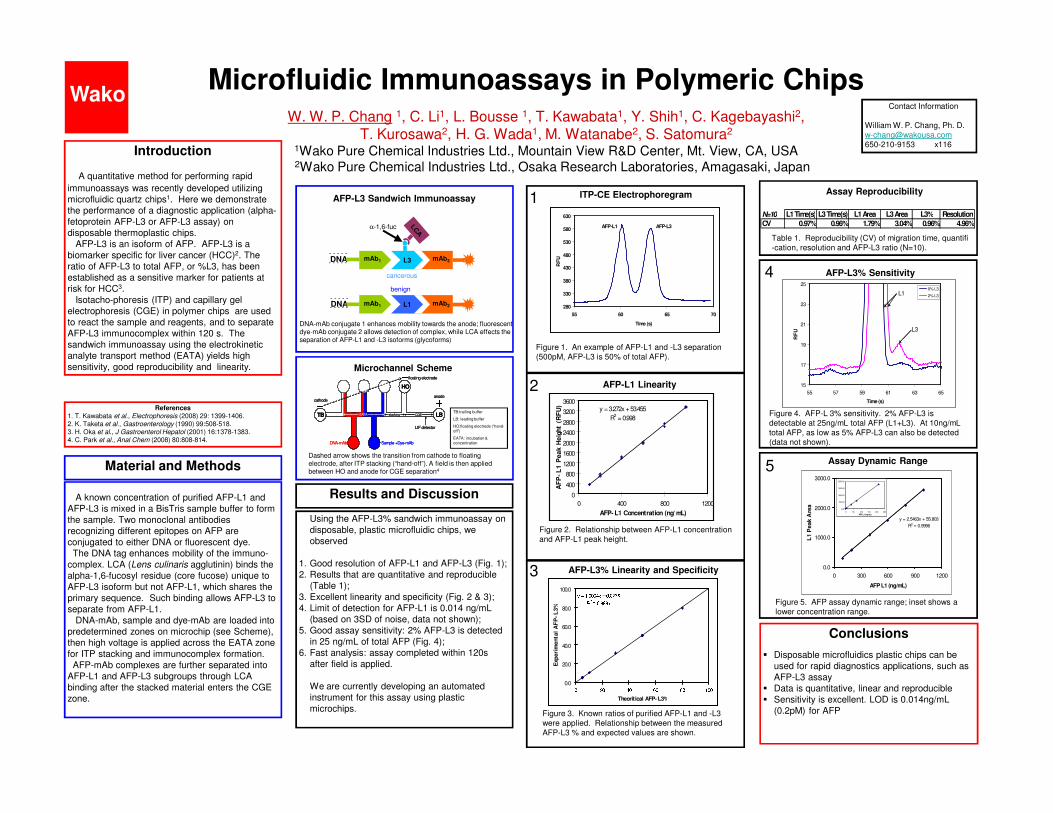
ITP-CE Electrophoregram1
Figure 1. An example of AFP-L1 and -L3 separation
(500pM, AFP-L3 is 50% of total AFP).
280
330
380
430
480
530
580
630
55 60 65 70
Time (s)
RF
U
AFP-L1 AFP-L3
TB:trailing buffer
LB: leading buffer
HO:floating electrode (“hand-
off”)
EATA: incubation &
concentration
Dashed arrow shows the transition from cathode to floating electrode, after ITP stacking (“hand-off”). A field is then applied between HO and anode for CGE separation4
TB LB
HO
floating electrode
CGEstackingEATA
anodecathode
LIF detector
Sample +Dye-mAbDNA-mAb
TB LB
HO
floating electrode
CGEstackingEATA
anodecathode
LIF detector
Sample +Dye-mAbDNA-mAb
Microchannel Scheme
0.00
500.00
1000.00
1500.00
2000.00
0 50 100 150 200 250
AFP L1 (ng/mL)
Wako