nyc department of probation: an overview
TRANSCRIPT

NYC DEPARTMENT OF PROBATION: AN OVERVIEW
PREPARED FOR NATIONAL INSTITUTE OF CORRECTIONS
AND BUREAU OF JUSTICE ASSISTANCE
NOVEMBER 26, 2013
Vincent N. Schiraldi, Commissioner

Presentation Overview
Do No Harm
Do More Good
Do It In the Community
2

Do No Harm
Vincent N. Schiraldi, Commissioner

Doing no harm by…
Reducing Violations Reducing Failure to Reports Increasing Early Discharges Increasing Certificates of Relief Tackling Warrants Cleaning up RAP sheets Increasing Adjustments
4
Do No Harm

Adult Operations: Total Violation Rates - 2009 to 2012
Do No Harm
5
SOURCE: NYC DOP STARS Performance Management Statistics
16.0%
13.9%
8.8% 8.7%
0.0%
2.0%
4.0%
6.0%
8.0%
10.0%
12.0%
14.0%
16.0%
18.0%
20.0%
CY 09 CY 10 CY 11 CY 12
Violation Rate
Decreased 45%
between CY’09 and
CY’12


2012 Violation Rates: NYC/Non-NYC
Do No Harm
7
SOURCE: OPCA State Probation Plan Data Summary, 2013 *Note: Rates reflect the number of probation cases with a violation filed during the year divided by the number of cases sentenced, discharged, or open during the year (including interim cases and cases with an open warrant).
3.1%
11.0%
0%
5%
10%
15%
20%
25%
30%
35%
40%
45%
50%
NYC (N=48,655) Non-NYC (N=113,936)

Rate of Adult Clients Incarcerated Following a Violation, 2009 to 2012
Do No Harm
8
SOURCE: NYC DOP STARS Performance Management Statistics; N=passthrough population Rates reflect the number of clients incarcerated in jail or prison as a result of a VOP over the number of clients on supervision at any point during the year (passthrough)
7.6% 7.1% 5.1% 4.7%
0%
5%
10%
15%
20%
25%
30%
35%
40%
45%
50%
CY 09 CY 10 CY 11 CY 12
Incarceration Rate
Decreased 38%
Between CY’09 and
CY’12
N=34,958 N=33,242 N=30,924 N=29,997
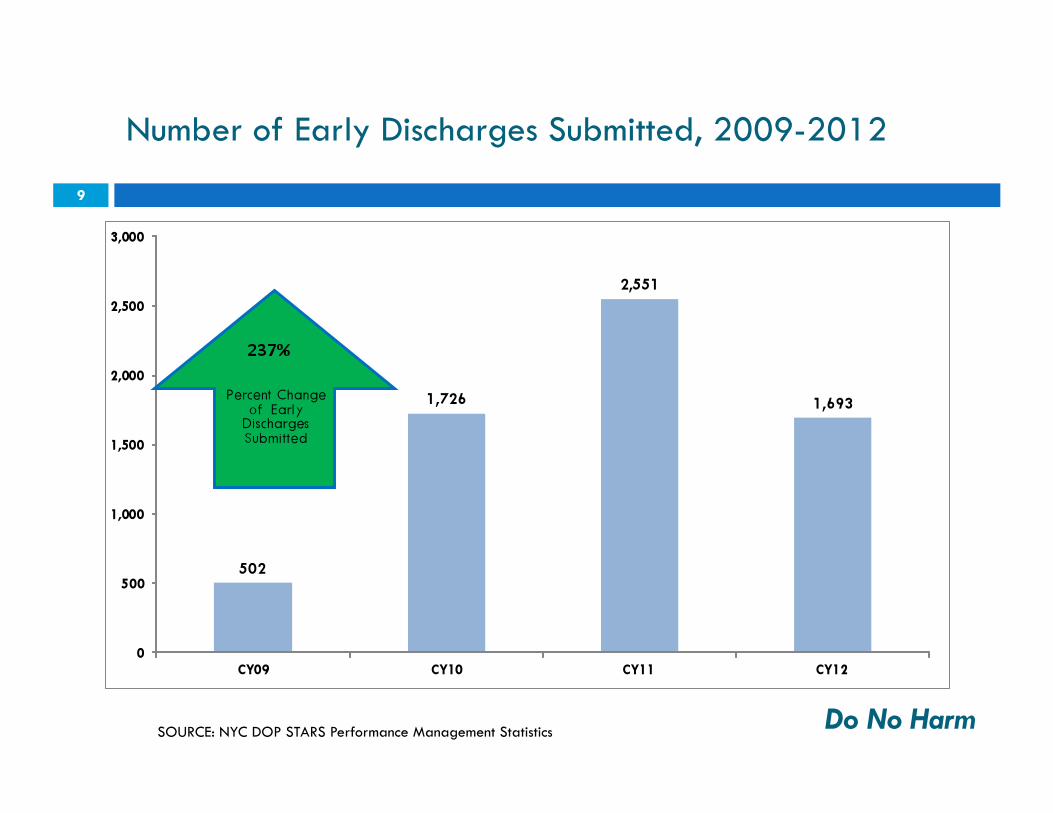
Number of Early Discharges Submitted, 2009-2012
9
SOURCE: NYC DOP STARS Performance Management Statistics Do No Harm

Early Discharges as a Percentage of All Adult Client Discharges, 2007-2012
Do No Harm
10
SOURCE: DCJS data
28.1% 28.2%
26.8% 26.7% 26.7% 26.0%
3.0% 3.7% 4.9%
12.3%
18.5%
17.0%
0.0%
10.0%
20.0%
30.0%
40.0%
50.0%
CY07 CY08 CY09 CY10 CY11 CY12 Non-NYC NYC

Felony Rearrest Rates Within a Year of Discharge, Early Discharges vs. MEDs, 2010
Do No Harm
11
SOURCE: OPCA/DCJS
3.0%
4.3%
0%
5%
10%
15%
20%
25%
30%
Early Discharge (2010 Discharges) Maximum Exp Discharge (2010 Discharges)

Breakdown of Adult Probation Clients by Top Conviction Charge– NYC/Non-NYC
Do No Harm
12
28%
56%
64%
42%
8% 2%
0% 10% 20% 30% 40% 50% 60% 70% 80% 90%
100%
NYC Non-NYC
Other/Unknown Felony Misdemeanor
Source: DCJS/OPCA Probationers Supervised Statewide, December 31, 2011 *Note: Felony/misdemeanor status reflects top conviction charge
N=39,415 N=78,376


3,317
3,971
4,667
3,477
27.5% 32.5%
39.2% 36.3%
0%
10%
20%
30%
40%
50%
60%
70%
80%
90%
100%
0
500
1,000
1,500
2,000
2,500
3,000
3,500
4,000
4,500
5,000
CY09 CY10 CY11 CY12
Number of Case Opened for Adjustment Rate of Cases Opened for Adjustment
Source: DOP STARS Performance Management Sta6s6cs
Number and Rate of Juvenile Intake Cases Opened for Adjustment, 2009-2012
14
Do No Harm

Percentage of Cases Opened for Adjustment That Successfully Completed Adjustment, 2009 to 2012
15
88% 89% 89% 88%
0%
10%
20%
30%
40%
50%
60%
70%
80%
90%
100%
2009 (N=3687) 2010 (N=4121) 2011 (N=4644) 2012 (N=3120)
**Source: RCMS Data Warehouse Note: percentages were calculated only out of cases that were closed during the same year. Each N reflects the number of case closures during that year. Do No Harm

Certificate of Relief from Disabilities
Ongoing COR events in all 5 boroughs – 434 participants 1,983 CORs submitted to the Court in 2012 COR applications submitted at intake into DOP
Do No Harm
Branch Chief Reid Kay helps a client apply for a COR at a Queens DOP COR event.
16

RAP Sheet Cleanup
Three Steps:
1. Correct errors and supply missing information
2. Train clients how to accurately describe record
3. Change systematic processes that result in errors
Do No Harm
17


DOP Warrant Project 19
Do No Harm
811 539
458
205
3,259
1,058
0
500
1000
1500
2000
2500
3000
3500
4000
4500
5000
Warrants Reviewed to Date Administratively Eligible to Vacate Administratively Vacated
Cleared Warrant
Active Warrant
Felonies
Misdemeanors
15,344 Total Warrants as of June 2012
Chart: Status of Warrants Eligible to Request Court Vacate as of 7/31/13
Total: 1269 (39%)
Total: 744 (59%)
Total: 4,317

VFO Warrants Less Than Two Years Old as of 7/31/13
20
92
36
8
2 1
0
10
20
30
40
50
60
70
80
90
100
Active Warrants Located
Deceased 1 Incarcerated 2 Deported 8 Vacated 36
Total: 47 (51%)
Do No Harm
Do More Good
Vincent N. Schiraldi, Commissioner

Doing more good by…
Evidence-Based Policies and Practices Differentiated Caseloads Structured Decision-Making Grid Expanded Continuum of Programs Assessment
22
Do More Good

Evidence-Based Policies & Practices
Do More Good
23

Differentiated Caseloads 24
Intake
Do More Good
Investigations Intake
Intensive Engagement
Track (Targeted Caseload: 25)
Community Progression Track (Targeted Caseload: 75)
Client Development
Track (Targeted Caseload: 50)

Differentiated Caseloads - Juvenile 25
Do More Good

Disposition SDM Matrix
MOST SERIOUS CURRENT ARREST CHARGE
LIKELIHOOD OF RE-ARREST (PER YLS ASSESSMENT) HIGH OR VERY HIGH MODERATE LOW
CLASS I: A, B felonies (violent & non-violent), violent C felonies
BOX #1 Out of Home Placement1
BOX #2 Out of Home Placement or Alternative to Placement
BOX #3 Alternative to Placement or Probation (To Be Specified)
CLASS II: Non-violent C felonies, violent D felonies
BOX #4 Out of Home Placement or Alternative to Placement
BOX #5 Alternative to Placement or
ESP (Level 3 Probation)
BOX #6 Level 1 or 2 Probation
CLASS III: Non violent D, All E felonies, misd assault and misd weapons possession
BOX #7 Alternative to Placement or
ESP (Level 3 Probation)
BOX #8 Level 1 or 2 Probation
BOX #9 Level 1 Probation
or CD
CLASS IV: A misdemeanors except assault and weapons and all B misdemeanors2
BOX #10 Level 1 or 2 Probation
BOX #11 CD or ACD
BOX #12 ACD or short term one time consequence or Dismissal
26
Do More Good

Expanded Continuum of Programs
CLIMB – Queens/Brooklyn
MEARES – Manhattan/The Bronx
Esperanza
Young Men’s Initiative Justice Community
Justice Scholars
Arches
CEPS
AIM
PEAK
ECHOES Do More Good
27

NYC YouthWRAP (Weekend Restoration Assistance Program)
Created in aftermath of Superstorm Sandy Community benefit projects in neighborhoods
hit by Sandy 26 winter/spring weekends 7 summer weeks 10 autumn weekends
500+ stipended participants, ages 14-18 DOP staff & college interns serve as coaches Assist recovery by working on community
projects Help to build life and career readiness skills Emphasize giving back to the community
28
Do More Good

Assessment & Case Planning - Adult
Citywide rollout of (LSI-R)
Individual Achievement Plans
29
Do More Good
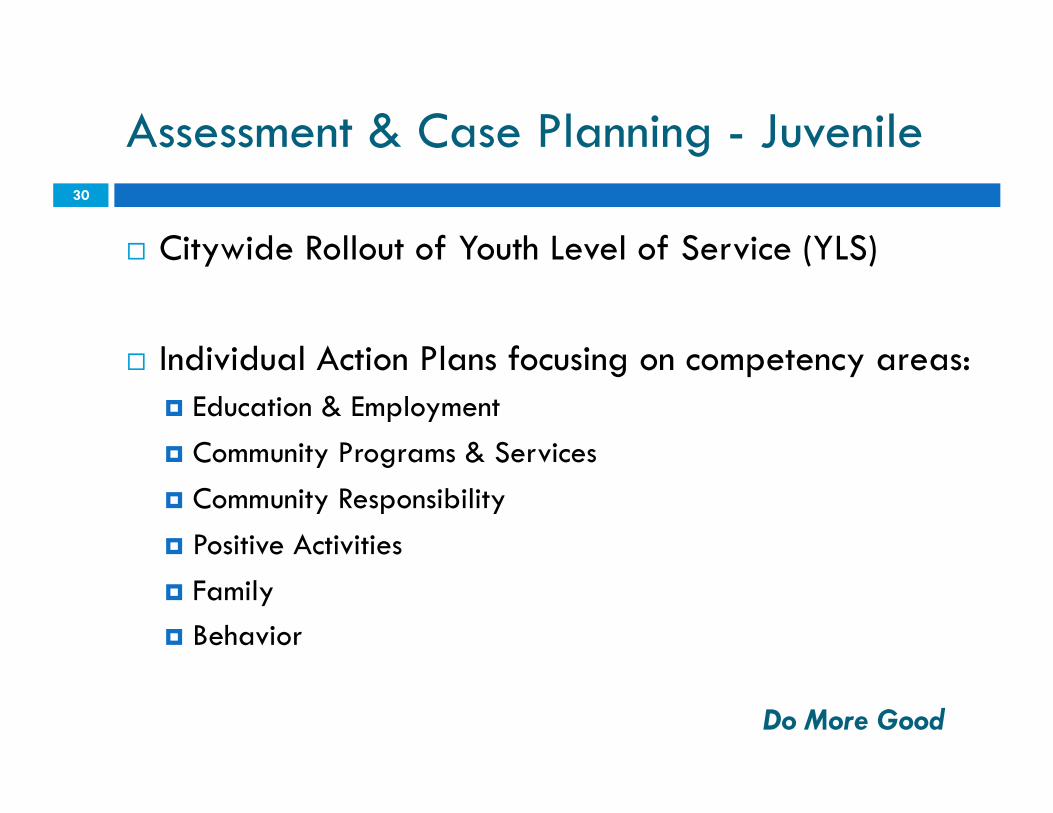
Assessment & Case Planning - Juvenile
Citywide Rollout of Youth Level of Service (YLS)
Individual Action Plans focusing on competency areas: Education & Employment Community Programs & Services Community Responsibility Positive Activities Family Behavior
30
Do More Good

Do It In the Community
Vincent N. Schiraldi, Commissioner

Doing it in the Community by…
Neighborhood Opportunity Network (NeON)
Networks
Client Engagement
Community Engagement
32
Do It In the Community
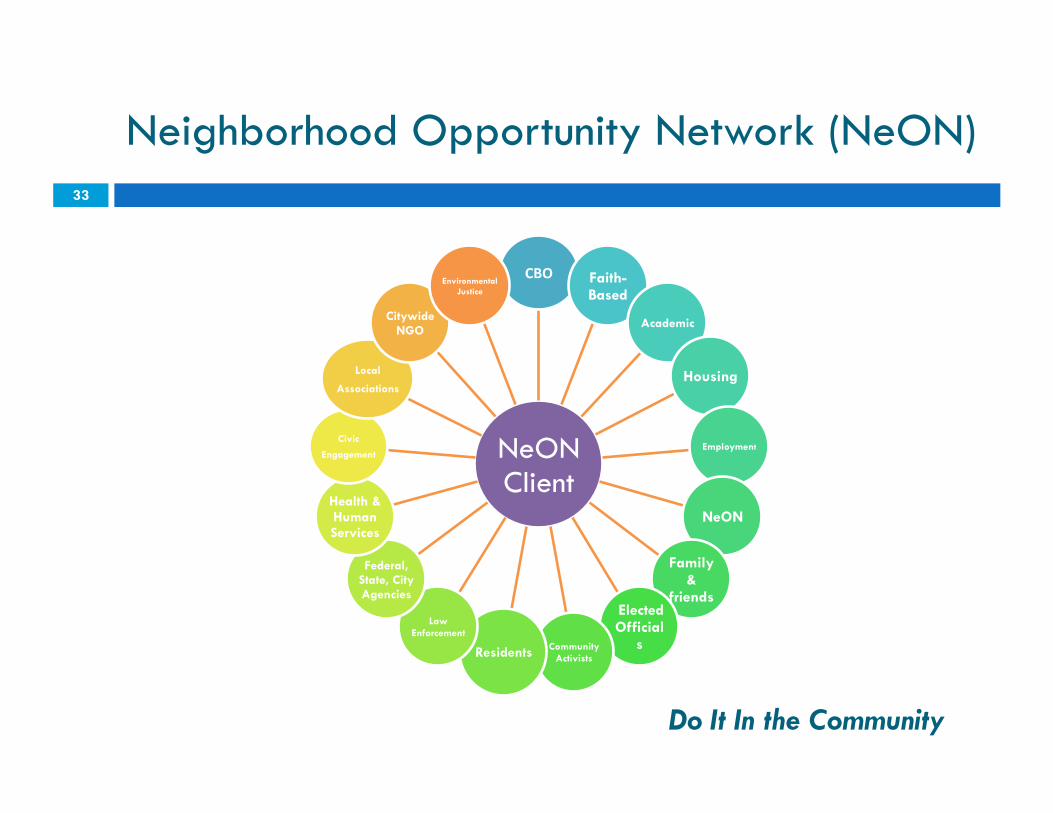
Neighborhood Opportunity Network (NeON)
Do It In the Community
33
NeON Client
CBO Faith- Based
Academic
Housing
Employment
NeON
Family &
friends Elected Official
s Community Activists Residents
Law Enforcement
Federal, State, City Agencies
Health & Human Services
Civic
Engagement
Local
Associations
Citywide NGO
Environmental Justice

NeON – Concentrations of Clients by CD 34
Do It In the Community

NeON – Traditional Offices 35
Do It In the Community

NeON - Satellites 36
Do It In the Community

BRONX • South Bronx NeON Satellite • Castle Hill – Castle Hill YMCA
QUEENS • South Jamaica NeON Satellite • Far Rockaway - Safe Space
BROOKLYN • Brownsville NeON • East New York NeON • Bedford-Stuyvesant NeON (Fall 2013)
STATEN ISLAND • Staten Island NeON
Satellites • Clifton/Stapleton - YMCA of Greater New York
Counseling Services • Port Richmond - Camelot Counseling Center • Mariner’s Harbor - Daytop Village, Inc.
MANHATTAN • Harlem NeON Satellites • East Harlem - Exodus Transitional Community • West Harlem - Fortune Society
NeON Locations
KEY STAT: By the end of 2013, 60% of adult clients (medium and high-risk clients on the Development Track) will be served at one of 7 NeON sites or 7 NeON Satellites.
37
Do It In the Community

NeON Evaluation
Partner: John Jay College of Criminal Justice
Goal: 300+ interviews, observations &meetings
Deliverables: Continuous feedback Final report during this administration Several peer-reviewed articles
Do It In the Community
38

Organizational Excellence
Training Leadership Focus
Professional Development Day Train the Trainers/Coaching
Staff Recognition Stars at STARS
Probation Week
All-Staff Assembly and Picnic & Year-End Celebration
Communications Staff-driven intranet
Flickr – 2.1 million views
Posters
39
Do It In the Community