nutritional value of sorghum for poultry feed in … · nutritional value of sorghum for poultry...
TRANSCRIPT

NUTRITIONAL VALUE OF SORGHUM FOR POULTRY FEED IN WEST AFRICA
by
SALISSOU ISSA
B.S., Agronomic and Veterinary Institute Hassan II, Rabat, Morocco, 1990 M.S., Cheikh Anta Diop University, Dakar, Senegal, 1997
AN ABSTRACT OF A DISSERTATION
submitted in partial fulfillment of the requirements for the degree
DOCTOR OF PHILOSOPHY
Department of Animal Sciences and Industry College of Agriculture
KANSAS STATE UNIVERSITY Manhattan, Kansas
2009

ABSTRACT
A total of 2,840 1-d-old broiler chicks and 450 1-d-old layer chicks were used in three
experiments to determine the nutritional value of corn- and sorghum-based diets in
poultry reared in West Africa. In the broiler experiments, birds fed corn had greater
average daily gain (P < 0.001) with similar carcass weight and yield for birds fed corn-
vs sorghum-based diets (P > 0.18). Particle size treatments did not affect growth
performance or carcass characteristics (P > 0.20). In the layer experiment, birds fed
sorghum had greater body weight at d 126 (P < 0.001), started laying earlier (P < 0.01),
ate more feed (P < 0.01), and produced more eggs (P < 0.01) than birds fed the corn-
based diet. However, there was no difference in average egg weight among birds fed
corn vs sorghum (P > 0.85). In conclusion, sorghums produced in West Africa are a
good alternative to corn when fed to broiler chicks and laying hens.
Key Words: Corn, Sorghum, Particle-size, Broilers, Layers

NUTRITIONAL VALUE OF SORGHUM FOR POULTRY FEED IN WEST AFRICA
by
SALISSOU ISSA
B.S., Agronomic and Veterinary Institute Hassan II, Rabat, Morocco, 1990 M.S., Cheikh Anta Diop University, Dakar, Senegal, 1997
A DISSERTATION
submitted in partial fulfillment of the requirements for the degree
DOCTOR OF PHILOSOPHY
Department of Animal Sciences and Industry College of Agriculture
KANSAS STATE UNIVERSITY Manhattan, Kansas
2009
Approved by:
Major Professor Dr. Joe D. Hancock

ABSTRACT
A total of 2,840 1-d-old broiler chicks and 450 1-d-old layer chicks were used in three
experiments to determine the nutritional value of corn- and sorghum-based diets in
poultry reared in West Africa. In the broiler experiments, birds fed corn had greater
average daily gain (P < 0.001) with similar carcass weight and yield for birds fed corn-
vs sorghum-based diets (P > 0.18). Particle size treatments did not affect growth
performance or carcass characteristics (P > 0.20). In the layer experiment, birds fed
sorghum had greater body weight at d 126 (P < 0.001), started laying earlier (P < 0.01),
ate more feed (P < 0.01), and produced more eggs (P < 0.01) than birds fed the corn-
based diet. However, there was no difference in average egg weight among birds fed
corn vs sorghum (P > 0.85). In conclusion, sorghums produced in West Africa are a
good alternative to corn when fed to broiler chicks and laying hens.
Key Words: Corn, Sorghum, Particle-size, Broilers, Layers

Table of Contents
List of Figures ..................................................................................................... vii
List of Tables ......................................................................................................viii
Acknowledgements............................................................................................... x
Dedication........................................................................................................... xii
CHAPTER 1 - Sorghum in Poultry Diets: A Review of the Literature ...................1
INTRODUCTION...............................................................................................2
SORGHUM GRAIN PHYSIOCHEMICAL CHARACTERISTICS .......................5
PROTEINS IN SORGHUM GRAIN ...................................................................6
STARCH AND ENERGY IN SORGHUM GRAIN ..............................................8
PHENOLIC COMPOUNDS IN SORGHUM GRAIN...........................................9
PHYTATE IN SORGHUM GRAIN ...................................................................12
TREATMENT AND PROCESSING OF SORGHUM TO ENHANCE ITS
NUTRITIONAL VALUE....................................................................................13
Processing to enhance its nutritional value..................................................13
Grinding and hydro-thermal processing .......................................................14
EFFECTS OF KAFIRINS, TANNINS, AND PHYTATE IN SORGHUM-BASED
DIETS..............................................................................................................16
IMPLICATIONS...............................................................................................18
REFERENCES................................................................................................19
CHAPTER 2 - Effects of Sorghum Variety on Growth and Carcass
Characteristics in Broiler Chicks Reared in West Africa ...............................40
ABSTRACT .....................................................................................................41
INTRODUCTION.............................................................................................42
MATERIALS AND METHODS ........................................................................42
RESULTS AND DISCUSSION........................................................................44
IMPLICATIONS...............................................................................................47
REFERENCES................................................................................................48
v

CHAPTER 3 - Effects of Sorghum Variety on Growth Performance and
Subsequent Egg Production of Layer Chicks Reared in West Africa ...........54
ABSTRACT .....................................................................................................55
INTRODUCTION.............................................................................................56
MATERIALS AND METHODS ........................................................................56
RESULTS AND DISCUSSION........................................................................57
IMPLICATIONS...............................................................................................60
REFERENCES................................................................................................61
CHAPTER 4 - Effects of Sorghum and Particle Size on Growth and Carcass
Characteristics of Broiler Chicks Reared in West Africa ...............................67
ABSTRACT .....................................................................................................68
INTRODUCTION.............................................................................................69
MATERIALS AND METHODS ........................................................................70
RESULTS AND DISCUSSION........................................................................72
IMPLICATIONS...............................................................................................75
REFERENCES................................................................................................77
Appendix A - Effects of Abrupt Changes from Corn- to Sorghum-Based Diets on
Growth Performance in Finishing Pigs .........................................................86
ABSTRACT .....................................................................................................87
INTRODUCTION.............................................................................................88
MATERIALS AND METHODS ........................................................................88
RESULTS AND DISCUSSION........................................................................89
IMPLICATIONS...............................................................................................90
REFERENCES................................................................................................91
vi

List of Figures
Figure 4.1. Temperature and humidity in naturally ventilated open-sided poultry
houses in Senegal, Mali, Burkina Faso, Niger, and Nigeria .........................85
vii

List of Tables
Table 1.1. Cereal and legume production in West Africa ....................................30
Table 1.2. Effects of sorghum-based diets on poultry performance....................31
Table 1.3. Physical and chemical characteristics of maize and sorghum hybrid
grain samples ..............................................................................................32
Table 1.4. Nutrient content of corn and sorghum as a percentage of NRC
requirement, in 0- to 3-wk old broiler chicks.................................................33
Table 1.5. Approximate amino acid profile of α-, β-, and λ-kafirins (mole, %) in
sorghum.......................................................................................................34
Table 1.6. In vitro digestion of starch from sorghum and corn genotypes varying
.....................................................................................................................35
Table 1.7. Correlation among tannin content, TAAD of essential amino acid, and
TMEn for 12 sorghum samples....................................................................36
Table 1.8. Correlation among protein content, tannin content, kafirins, TAAD, and
TMEn for 12 sorghum samples....................................................................37
Table 1.9. Effects of dietary phytate and tannins on amino acid digestibility in
poultry ..........................................................................................................38
Table 1.10. Effects of sodium bicarbonate on growth performance and nutrients
.....................................................................................................................39
Table 2.1. Corn- and sorghum-based diets fed to broilers chicks in West Africa
(as fed basis) ...............................................................................................51
Table 2.2. Physical and chemical composition of imported corn and domestically
.....................................................................................................................52
Table 2.3. Growth performance and carcass characteristics of broiler chicks fed
imported corn and domestically produced sorghums in West Africa............53
Table 3.1. Corn- and sorghum-based diets fed to layer chicks in West Africa (as
fed basis) .....................................................................................................64
viii

Table 3.2. Physical and chemical characteristics of imported corn and
domestically produced sorghums fed to layer chicks in West Africa (as fed
basis) ...........................................................................................................65
Table 3.3. Growth and laying performance of poultry fed imported corn and
domestically produced sorghums in West Africa .........................................66
Table 4.1. Diets fed to broiler chicks in Senegal, Mali, Burkina Faso, Niger, and
Nigeria .........................................................................................................81
Table 4.2. Chemical and physical characteristics of cereals and base premix fed
to broiler chicks in Senegal, Mali .................................................................82
Table 4.3. Growth performance for broiler chicks fed corn- or sorghum-based
diets with different particle sizes in Senegal, Mali, Burkina Faso, Niger, and
Nigeria .........................................................................................................83
Table 4.4. Carcass characteristics for broiler chicks fed corn- or sorghum-based
diets with different particle ...........................................................................84
Table A.1. Composition of corn- and sorghum-based diets fed to finishing pigs.93
Table A.2. Chemical composition of the feeds and ingredients fed to finishing
pigs ..............................................................................................................94
Table A.3. Effects of abrupt changes from corn to sorghum and vice-versa on
growth performance in finishing pigs ...........................................................95
ix

Acknowledgements
This manuscript would not have been possible without the support,
assistance and guidance of the people I am most closely associated with. First, I
would like especially thank My Major Professor (Dr. Joe Hancock) and his
Family, for giving me the opportunity to continue my education at Kansas State
University, for your research ideas, and for your financial and moral support. You
gave me the guidance, criticism and encouragement needed for me to be the
best I could be. I express my appreciation to my Advisory Committee of Drs.
Mitchell Tuinstra, Scott Bean, and Scott Beyer. Your contribution and support to
my education and research are greatly appreciated. To other swine faculty (Drs.
Jim Nelssen, Mike Tokach, Bob Goodband, Joel DeRouchy, and Steve Dritz),
thank you for your contributions and encouragement and for helping me keep
everything in perspective.
A special thanks to present (Julie, Mandy, Christina, Jeremy, Nick, Romel,
Chad, Scott, Jon, Solange, Barrios, Rusty, Chris, and Jay), and all former grad
students for everything you have done. The friendly manner in which we
conducted our business will be some of my fondest memories from my time at
Kansas State University.
Also to the ASI Staff (Kay, Alice, Val, Lois, Theresa, Dave, Cheryl, Tim
(Carson), Terry (Gugle), Mark, Lyle, Frank, Eldo, Robert, Darla, Christina, Judy,
Karen, and Terry (Dekat)), thanks for your help and for offering your friendly
faces.
x

My research activities would not have been possible without funding from
INTSORMIL and the assistance of the Ministry of Animal Resources in Niger
which provided use of facilities and personnel at Goudel Poultry Station.
To our collaborators in West Africa (Pr. Ayao Missohou at EISMV Dakar, Dr.
Bantieni at IER Bamako, Dr. Hien Ollo at INERA Bobo-Dioulasso, Dr. Hamani
Marichatou at UAM Niamey, and Pr. Iro Nkama at the University of Maiduguri)
thanks you for your interest in building a network of collaborating poultry
researchers in West Africa.
Finally a special thanks to all my friends (Dustin, Mohan, and Alassane) for
your invaluable friendship and support. But above all, thank you God for sticking
with and blessing me; none of this could have happen without your loving
guidance.
xi

xii
Dedication
To my parents Maimouma and Issa, my brother Sani, my wife Tsaibatou,
my friend Abdou Dan-Gomma, and my children Samira, Hafidou, Oubeida,
Abdourahmane, and Fatouma Zara. This dissertation is for you. I never could
have accomplished this without your loving support and constant
encouragement. I want to thank all of you for helping and praying for me.
Especially, thanks to those of you that cared for my family while I was in the U.S.

CHAPTER 1 -
Sorghum in Poultry Diets: A Review of the Literature
1

INTRODUCTION Grain sorghum (Sorghum bicolor (L.) Monch) is a drought resistant cereal
that is produced worldwide. Sorghum is the fifth most important crop after wheat,
rice, corn, and barley (Bryden et al., 2009). However, in West Africa sorghum is
the 2nd most important cereal grain after millet and just before corn (Table 1.1).
Also, sorghum is the primary alternative feedstuff for corn in the U.S., Central
America, South America, and Asia and for wheat in Australia. In contrast to corn
use in the Americas, in Africa and India sorghum is a staple food used
secondarily as feed (Maunder, 2002; Abdoulaye et al., 2006).
Major sorghum producing countries are the U.S., India, Nigeria, Mexico,
China, Sudan, Argentina, and Australia. Worldwide the area planted to sorghum
steadily increased from 24 to 46 million ha between 1950 and 1980, but has
decreased and stagnated at 41 million ha for the past 20 years. Globally average
yield increased from 0.57 to 1.48 metric tons/ha (260%) from 1950 to 2000
whereas the sorghum yield in the U.S. averaged 4.4 metric tons/ha during that
same time period. According to Maunder (2002), from 1992 to 1994 Africa was
producing 17.1 million metric tons (27% of the world’s production) on 21.8 million
ha (48% of the world’s planted area).
2
The major constraints for sorghum production in West Africa are water
stress, availability of seeds of improved varieties and hybrids, fertilizers, and pest
and disease control. To cope with abiotic stress, drought-tolerant varieties and
hybrids were released in North Africa (Sudan) in 1983 and Niger in 1992
(INTSORMIL, 2007). However, the acceptance and widespread adoption of
these improved genotypes of sorghum will take many years. Because of the high

cost of production inputs and low income of producers, Africa with 12% of the
world’s population uses only 2% of the world’s fertilizer. Fertilizer and pesticide
accessibility to producers are key factors in boosting sorghum production in West
Africa just as in any other location around the globe.
Finally, sorghum is subject to parasite threats such as Striga, ergot, and
Fusarium in Africa. Striga is a plant parasite that attaches to sorghum roots from
where it takes nutrients and inhibits plant and seed yield. Striga affects almost
40% of the sorghum grown in Africa causing over $90 million United States
Dollar (USD) in crop damage. Striga resistant varieties for sorghum in East and
West Africa have been developed but their acceptance and widespread use will
take decades to accomplish (INTSORMIL, 2007). Ergot (Claviceps africana) is a
constraint in Africa, Australia, and India mainly when planting is delayed
(Bandyopadhyay et al., 2002). Ergot can cause crop loss, and ergot alkaloids are
toxic to cattle, poultry, and swine (INTSORMIL, 2007). In addition to ergot,
Fusarium verticillioides can infect sorghum and millet and produce mycotoxins.
Among insects, midge (Contarinia sorghicola) is a major sorghum pest in
Africa and Australia. Midge resistant varieties tested in Niger in 2006 performed
well (INTSORMIL, 2007) and the widespread use of these varieties will contribute
in more grain of good quality.
The next issue worth noting is one of marketing and utilization. In Africa,
Australia, and the U.S. sorghum generally is less expensive than corn or wheat
(Abdoulaye et al., 2006; Blein et al., 2009). However, there remains a perception
of suboptimal performance in birds fed sorghum-based diets compared to those
3

fed corn- or wheat-based diets (Table 1.2). Thus, the objectives of this review
are:
1. To understand the reasons for the perception (true or false) of lower
performance in birds fed sorghum-based diets
2. To identify the main anti-nutritional factors in sorghum grain, their actual
effects on poultry performance and how to prevent/alleviate their negative
effects
3. To make some recommendations regarding improvement in utilization of
sorghum in poultry diets especially as related to West Africa.
4
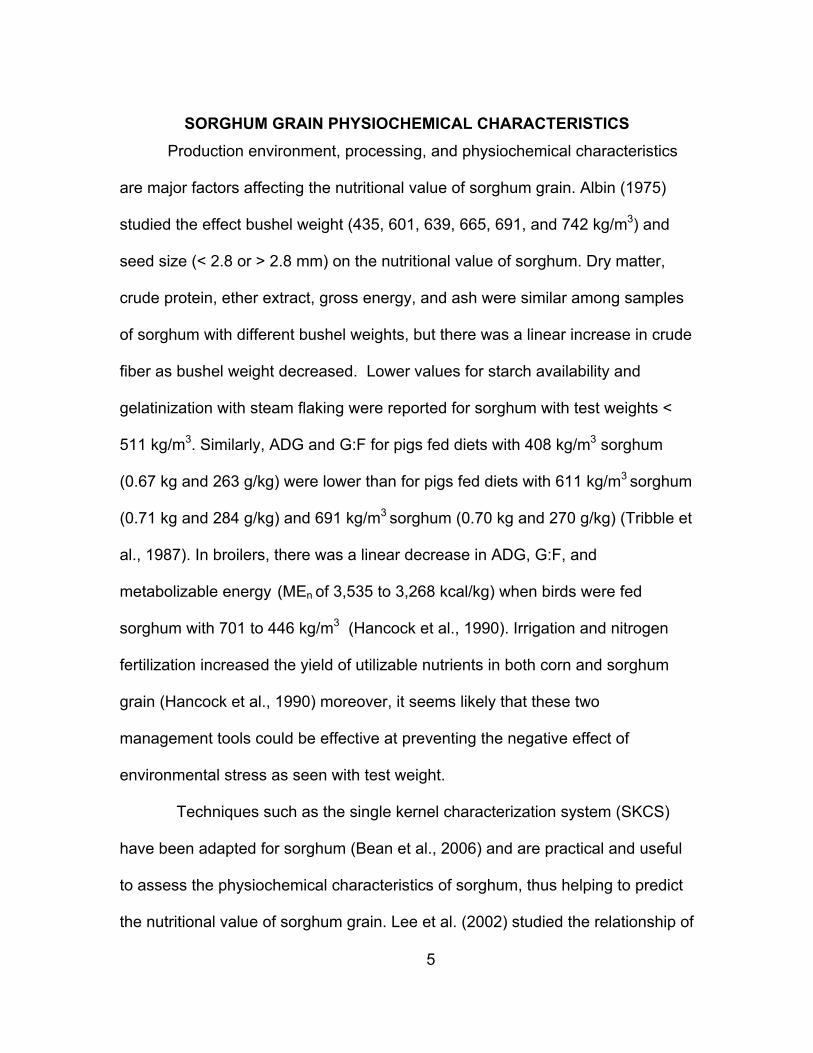
SORGHUM GRAIN PHYSIOCHEMICAL CHARACTERISTICS Production environment, processing, and physiochemical characteristics
are major factors affecting the nutritional value of sorghum grain. Albin (1975)
studied the effect bushel weight (435, 601, 639, 665, 691, and 742 kg/m3) and
seed size (< 2.8 or > 2.8 mm) on the nutritional value of sorghum. Dry matter,
crude protein, ether extract, gross energy, and ash were similar among samples
of sorghum with different bushel weights, but there was a linear increase in crude
fiber as bushel weight decreased. Lower values for starch availability and
gelatinization with steam flaking were reported for sorghum with test weights <
511 kg/m3. Similarly, ADG and G:F for pigs fed diets with 408 kg/m3 sorghum
(0.67 kg and 263 g/kg) were lower than for pigs fed diets with 611 kg/m3 sorghum
(0.71 kg and 284 g/kg) and 691 kg/m3 sorghum (0.70 kg and 270 g/kg) (Tribble et
al., 1987). In broilers, there was a linear decrease in ADG, G:F, and
metabolizable energy (MEn of 3,535 to 3,268 kcal/kg) when birds were fed
sorghum with 701 to 446 kg/m3 (Hancock et al., 1990). Irrigation and nitrogen
fertilization increased the yield of utilizable nutrients in both corn and sorghum
grain (Hancock et al., 1990) moreover, it seems likely that these two
management tools could be effective at preventing the negative effect of
environmental stress as seen with test weight.
Techniques such as the single kernel characterization system (SKCS)
have been adapted for sorghum (Bean et al., 2006) and are practical and useful
to assess the physiochemical characteristics of sorghum, thus helping to predict
the nutritional value of sorghum grain. Lee et al. (2002) studied the relationship of
5

sorghum kernel diameter 2.36 mm (small), 2.80 mm (medium), and 3.35 mm
(large) to physiochemical and processing properties. The authors reported that
for large, medium, and small grain, loss after 1 min decortications was 5.5, 6.5,
and 18.5%, crude protein was 12.7, 12.2, and 12.4%, starch was 75.7, 74.7, and
74.5%, and ash was 1.56, 1.60 and 1.78%. In addition, Travis et al. (2006)
reported ME values of 3.51 Mcal/kg for corn, 3.48 Mcal/kg for sorghum offspring
of a large-seeded male parent (KS115), and 3.36 Mcal/kg for normal-seeded
hybrids (Table 1.3). Thus, the authors concluded that use of KS115 as a mean of
increasing seed weight and fat content would improve the nutritional value of
sorghum grain.
PROTEINS IN SORGHUM GRAIN Corn typically has 1% more crude fat than sorghum, but typically sorghum
has 1% more crude protein than corn. Otherwise, the gross physiochemical
characteristics of corn and sorghum are similar and these cereals have similar
amino acid profiles (Table 1-4). These facts lead Rooney and Serna-Saldivar
(2000) to suggest that reports of low performance in poultry and swine fed
sorghum-based diets resulted from protein and starch characteristics and
possibly use of sorghum with high tannin and phytate content.
Protein content in sorghum is variable and ranges from 10 to 6% with
approximately 80, 16, and 3% of the protein in the endosperm, germ, and
pericarp respectively (Gualtieri and Rapaccini, 1990; Rooney and Serna-
Saldivar, 2000). The major protein fraction in sorghum is the kafirins (alcohol
6

soluble) followed by alkali soluble or acid extractable (Bryden et al. 2009).
Kafirins are storage proteins found in protein bodies, while glutelins are localized
in the protein matrix. Kafirins are characterized as α-, β-, and λ- and they
comprise 70 to 80% of total protein in sorghum (Hamaker et al., 1995; Salinas et
al., 2006). Within the kafirins, α-, β-, and λ-kafirins represent 75, 15, and 10%, of
the total protein (Oria et al., 1995). The amino acid composition of β-and λ-
kafirins are unique because of their high content of cysteine and histidine that
increase disulfide linkage formation among the different protein fractions. Kafirins
also have high content in proline, glycine, glutamine, and asparagine (Table 1-5)
which place them among the list of proline-rich-proteins (PRP). The PRP have
1,000 times the affinity for tannins compared to the other proteins and are
thought to be the first defense in humans and other mammals adapted to high
tannin food (Butler et al., 1992).
Researchers at Purdue University developed sorghum mutants with high
digestibilities of protein and starch. Oria et al. (2000) demonstrated that the
shape of protein bodies is a key factor in sorghum protein digestibility. In highly
digestible sorghum proteins, transmission-electronic-microscopy revealed that α-,
β-, and λ-kafirins are localized within protein bodies. The protein bodies were
irregular in shape, folded, and had numerous deep invaginations. Protein bodies
of normal sorghum were spherical and contained no invagination and the λ-
kafirins were concentrated at the base of the folds instead of at the protein body
periphery. Furthermore, Benmoussa et al. (2006) demonstrated that the mutant
line (111) has spherical starch with dense channels (i.e., many pores).
7

STARCH AND ENERGY IN SORGHUM GRAIN Starch is the major proximate component (63 to 74%) and the major
energy supplier in sorghum grain (Perez-Maldonado and Rodriguez, 2007).
Starch granules consist of a linear polysaccharide called amylose (20-30% of
starch) and a highly branched polysaccharide called amylopectin (70-80% of
starch). Sorghum starch granules are surrounded by a protein matrix that can
limit access of enzymes (Oria et al., 2000; Benmoussa et al., 2006).
Other factors important to the energy value of sorghum include channels
or pores on starch granules that are sites for enzyme entry (Benmoussa et al.,
2006), granule size, starch-lipid complexes, kafirin content (Watterson et al.,
1993; Cao et al., 1998), and kernel size (Ioerger et al., 2007). Additional factors
affecting sorghum starch digestibility are waxiness and hardness. Waxy starch is
more digestible than starch of non-waxy (conventional) sorghum (Table 6).
Unfortunately, waxy sorghums have lower yields compared to non-waxy lines
(Rooney and Serna-Saldivar, 2000) and seed companies have placed no
emphasis on developing high-yielding waxy germplasm. Data from 280 sorghum
samples in Australia revealed a range in kernel diameter from 2.4 to 4.8 mm and
diameter was negatively correlated to percentage vitreousity. Vitreous
endosperm contains more protein, kafirins and disulfide bonds than floury
endosperm which has more soluble protein (Bryden et al., 2009). Cao, et al.
(1998) reported feed:gain of 1.49 in broilers fed soft sorghum-based diets vs 1.68
for birds fed medium and hard sorghum-based diets. The differences in kafirin
structure likely contribute to the differences in bird performance reported by Cao
8

et al. (1998). Abdelrahaman and Hoseney (1984) reported that sorghum’s cross-
linked kafirins cause hardness.
PHENOLIC COMPOUNDS IN SORGHUM GRAIN Cheeke (1998) classified phenolic compounds as simple phenol, phenolic
acids, hydrolysable tannins, condensed tannins, lignin, and lignans. All of them
consist of one or more aromatic (benzene) and one hydroxyl group which enable
formation of cross linkages with proteins such as kafirins, cellulose, and phytate.
Among cereals, a unique characteristic of sorghum is having some cultivars that
produce large amounts of condensed tannins. Total phenols in sorghums range
from 2 to 103 g/kg, while they are negligible in corn and wheat and 14 g/kg in
barley (Bravo, 1998).
Using the vanillin-HCl method for condensed tannin determination, the
presence of a testa, and the testa color allowed Price et al. (1978) and Cheng et
al. (2009) to provide sorghum breeders and users a practical and useful
approach to determination of tannin content . The authors stated that white
sorghum without testa or with purple testa and yellow or red sorghum without
testa have very low percentage of tannins (0.0 to 0.2% tannin); whereas white,
yellow or red sorghums with brown testa have medium to high tannin content (1.2
to 12.8%).
Animal nutritionists are interested in tannins because they bind protein,
cellulose, hemicelluloses, pectin, phytate, and minerals to form, indigestible
complexes (Van Soest, 1994). Many studies have reported that diets with tannin-
9

sorghum affect feed intake and feed efficiency in broilers (Amstrong et al., 1974;
Sell et al., 1985; Douglas et al., 1990; Gualtieri and Rapaccini, 1990; Nyachoti et
al., 1997; Hancock, 2000). Butler et al. (1992) suggested that tannins coagulate
and precipitate proteins (including digestive enzymes) while Sell et al. (1984) and
Nyanmambi et al. (2007) argued that tannins reduced crypt depth, intestinal wall
thickness, and sucrase activity with increased mucus production. Donald et al.
(2008) reported similar intestinal morphology for broilers chicks fed corn-,
sorghum-, and wheat-based diets although birds fed corn- and wheat-based diets
had better growth performance compared to those fed the sorghum-based diet.
Lucbert and Castaing (1986) reported ME of 3,306, 3,028, and 2,888 kcal/kg for
sorghum with 0.23, 1.0, and 1.4 % tannins and concluded ME decreased by 40
kcal for each 0.1% tannin above 0.23%. Douglas et al. (1990) reported ME of
3,838 and 3,200 kcal/kg for low- and high-tannin sorghum, respectively. The
authors reported that adding animal fat can improve nutritive value of tannin-
sorghums. As for protein utilization, when compared with corn, apparent amino
acid digestibility for low-, medium, and high-tannin sorghum was 73, 41, and
22%, respectively, in growing chicks (Rostagno et al., 1974). However, Donkoh
et al. (2009) reported ileal amino acid digestibilities of 86.2% for corn, 85.5% for
low-tannin (0.38% CE) sorghum, and 80.6% for high-tannin (1.87% CE)
sorghum.
Egg production, egg weight, and yolk coloration were decreased when
tannic acid was 2% of layers diets (Gualtieri and Rapaccini, 1990). Armanious et
al. (1973) reported sorghum with 0.6% or less tannin content could be used in
10

layer diets with adequate methyl donors (e.g., methionine) and xanthophylls. In
addition, Sell et al. (1984) reported no negative effect of tannins and a positive
effect of methionine addition in layers fed sorghum-based diets. In a 24-wk trial in
Kenya, Jacob et al. (1996) reported egg production of 71% for layers fed corn-
based diets vs 65% for those fed sorghum-based diets with 3.7% tannins.
However, Ambula et al. (2003) reported that varying tannin level from 0 to 3.1%
of the diet by graded inclusion of high-tannin sorghum did not affect egg
production (69 to 71%), egg weight (57 to 61 g), and egg specific gravity (1.083
vs 1.090 mg/mL). In a 42-d experiment, corn, low-tannin sorghum (0.6%), high
tannin sorghum (3.7%), and bentonite (2.5 or 5%) were tested in layers. Birds fed
low- tannin sorghum performed better than birds fed corn or high- tannin
sorghum. Bentonite treatment did not improve the nutritive value of the high-
tannin sorghum (Ambula et al., 2003). Similarly in an 18-month experiment, Issa
et al. (2007) reported 57% egg production for layers fed low-tannin (0.3%)
sorghum vs 47% for birds fed a corn-based diet. However egg weight (48 g) was
similar for all birds.
It is thought that tannins provide protection for plants against fungi,
bacteria, birds, and herbivores (Nyachoti et al., 1997; Perez-Maldonado, 2008).
Monge et al. (2007) reported that broiler chicks can tolerate dietary tannin
concentrations of 1.35% before their growth performance is compromised.
Fortunately, most cultivated sorghums do not contain condensed tannins
(Hagerman and Butler, 1998; Abdoulaye et al., 2006) and it is well established
that sorghum can be used as the sole grain source in either broiler or layer diets
11

without compromising performance (Parthasarathy et al. 2005; Travis et al.,
2006; Issa et al., 2007; Nyannor et al., 2007).
PHYTATE IN SORGHUM GRAIN Phytate is a mixed salt of phytic acid (myo-inositol hexaphosphate) that
occurs in plant feedstuffs. Digestibility of plant phosphorus in monogastrics
ranges from 23 to 69% with a value of 42% for sorghum (Wu et al., 2004). In
addition to its ability to bind with P, phytate’s anti-nutritional properties include its
ability to complex with protein and minerals (Bryden et al., 2007). In contrast to
tannins, sorghum phytate content has not been reduced through breeding
research. Results of six surveys conducted between 1968 and 2003 showed that
total P content in sorghum ranged from 3 to 4 g/kg and phytate-P content ranged
from 2.1 to 2.4 g/kg (Nelson et al., 1968; Selle et al., 2003).
To improve the digestibility and utilization of P from phytate, poultry
producers can use phytases. Use of bacterial phytase (E.coli) or fungal phytase
(A. niger) has been shown by several authors to enhance P utilization in livestock
and poultry (Michel and Edwards, 1996; Denbow et al., 1998; Dilger et al., 2004).
Jondreville et al. (2009) stated that the two enzyme types have similar efficiency
in broilers. However, Cowieson et al. (2004) reported reduced endogenous
amino acid flow with phytase supplementation. But, the reduction was greater
with bacterial phytase compared to fungal phytase.
12
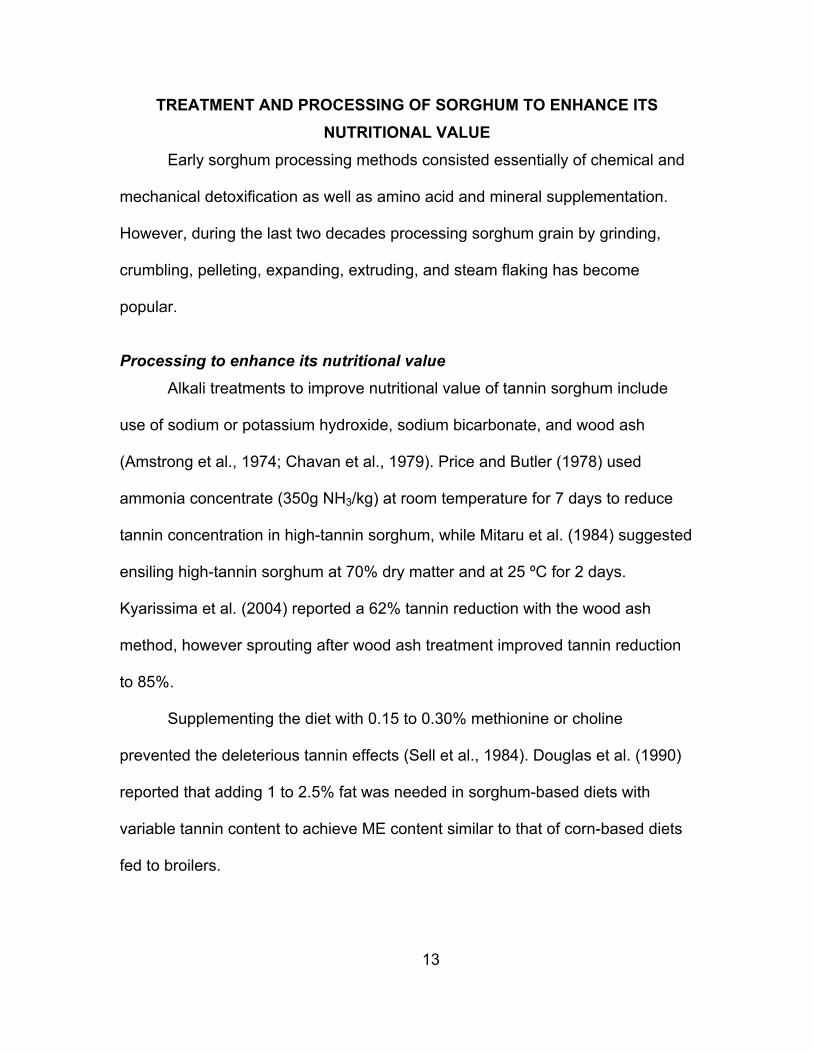
TREATMENT AND PROCESSING OF SORGHUM TO ENHANCE ITS NUTRITIONAL VALUE
Early sorghum processing methods consisted essentially of chemical and
mechanical detoxification as well as amino acid and mineral supplementation.
However, during the last two decades processing sorghum grain by grinding,
crumbling, pelleting, expanding, extruding, and steam flaking has become
popular.
Processing to enhance its nutritional value Alkali treatments to improve nutritional value of tannin sorghum include
use of sodium or potassium hydroxide, sodium bicarbonate, and wood ash
(Amstrong et al., 1974; Chavan et al., 1979). Price and Butler (1978) used
ammonia concentrate (350g NH3/kg) at room temperature for 7 days to reduce
tannin concentration in high-tannin sorghum, while Mitaru et al. (1984) suggested
ensiling high-tannin sorghum at 70% dry matter and at 25 ºC for 2 days.
Kyarissima et al. (2004) reported a 62% tannin reduction with the wood ash
method, however sprouting after wood ash treatment improved tannin reduction
to 85%.
Supplementing the diet with 0.15 to 0.30% methionine or choline
prevented the deleterious tannin effects (Sell et al., 1984). Douglas et al. (1990)
reported that adding 1 to 2.5% fat was needed in sorghum-based diets with
variable tannin content to achieve ME content similar to that of corn-based diets
fed to broilers.
13

Grinding and hydro-thermal processing
Grinding grains before mixing into diets is thought to improve feed
homogeneity, increase surface area for enzymatic degradation, and reduces
selective feeding/sorting. However, results of particle size studies in broilers have
shown conflicting results. In the U.S. broiler industry, cereal grains are usually
ground through a hammermill equipped with screens having openings of 4 to 5
mm (Behnke, 2009). However, Reece et al. (1986) reported a 35% reduction in
energy input and a 27% increase in hammermill throughput by increasing screen
openings from 4 to 6 mm. In addition, Deaton et al. (1995) stated that increasing
particle size from 679 to 1,289 µm saved 50% of energy cost without
compromising body weight and feed efficiency in broilers at 49 d of age housed
in either moderate (21ºC) or high (31ºC) temperature.
14
Healy et al. (1994) reported data from an experiment where corn and
sorghums were ground to 900, 700, 500, and 300 µm. From day 0 to 7 d,
maximum feed efficiency was achieved with particle sizes of 500, 500 and 300
µm for corn, hard endosperm sorghum, and soft endosperm sorghum,
respectively. For d 0 to 21, maximum gains in body weight were achieved with
particle sizes of 700 µm for corn, 500µm for hard endosperm sorghum, and 300
µm for soft endosperm sorghum. Gizzard weights were less for birds fed ground
cereals with particle sizes of 300 µm. Similarly, Mikkelson et al. (2008) reported
that broiler chicks fed a coarse, wheat-based diet outperformed those fed a
coarse, sorghum-based diet. However, broiler chicks fed fine sorghum-based
diets had numerically better growth performance than birds fed a finely ground
wheat-based diet. Douglas et al. (1990) reported improvements of 8% in ADG

and 3% in feed efficiency for broilers fed sorghum ground to 837 µm compared to
birds fed sorghum ground to 1,786 µm. In contrast, Parsons et al. (2006)
reported improved nutrient retention in broilers fed corn-based diets when corn
particle size was increased from 781 to 1,042 µm. However, growth performance
and energy metabolism decreased when corn particle size exceeded 1,042 µm
because of an increase in size and maintenance requirement for the gastro-
intestinal tract. Biggs and Parson (2009) reported that feeding broilers 10 to 20%
whole grain of barley, sorghum, and wheat from d 0 to 21increased gizzard
weights, ME, and amino acid digestibility.
In addition to the effects of grinding, Douglas et al. (1990) reported that
pelleted diets improved weight gain and feed efficiency in broilers by 13 and 7%,
respectively, compared to a mash diet. Similarly, Elkin et al. (1991) reported
large improvements in weight gain (42%) and feed efficiency (15%) with a diet
pelleted at 55 to 66ºC vs mash sorghum-based diets. In contrast, Nir et al.
(1995) obtained only modest improvements in weight gain and feed efficiency for
broilers fed sorghum based diets pelleted at 85 ºC. Cramer et al. (2003) fed
broilers mash and crumbled sorghum-based diets pelleted or expanded at 85 ºC.
Growth performance was similar for birds fed mash or crumbles. Finally, Cao et
al. (1998) reported that broiler chicks fed extruded diets had lower performance
to d 21 compared to those fed steam-flaked sorghum.
Bryden et al. (2009) reported that starch gelatinization usually does not
exceed 200 g/kg following steam conditioning and pelleting. The temperature at
which sorghum starch gelatinizes (68 to 78ºC) exceeds that of corn (62 to 72ºC)
15

and wheat (58 to 64ºC), implying that sorghum-based diets require a greater
temperature during pelleting. However, pelleting sorghum-based diets at higher
temperatures (82 to 90ºC) may induce the honey comb protein matrix to collapse,
especially in vitreous sorghum. This collapse inhibits starch expansion, denies
amylases access to their substrates, and reduces starch digestibility in cooked
sorghum meal (Ezeogou et al., 2008). Thus, there is little consensus about the
need to pellet sorghum-based diets to maximize nutrient utilization and growth
performance in poultry.
EFFECTS OF KAFIRINS, TANNINS, AND PHYTATE IN SORGHUM-BASED DIETS
As previously stated, condensed tannins are only partially responsible for
variation in nutrient digestibility in sorghum grain cultivars. Perez-Maldonado and
Rodriguez (2007) reported that amino acid ileal digestibly for non-tannin sorghum
in poultry varied from 73 to 82% with poor digestibility of cysteine (53%), histidine
(69%), threonine (63%), and tryptophan (71%). Likewise, Vasan et al. (2008)
reported amino acid digestibilities of 85% in corn and 73% in sorghum with lower
values observed for cysteine, histidine, threonine, and arginine in sorghum. Oria
et al. (2000) demonstrated that protein body shape and exposure and β- and λ-
kafirin location are key factors in sorghum protein digestibility. β-and λ-kafirins
bind to each other as well as to α-kafirins, tannins, and phytate to form stable
complexes (Taylor et al., 2007).
16

Elkin et al. (1996) evaluated amino acid digestibility and TME of 20
sorghum cultivar with an average protein content of 10.7%. The sorghums had a
range in tannins from 2 to 38 g/kg. The α-kafirins were assayed using a SDS-
PAGE procedure. As shown in Table 1.8, α-kafirin (r = - 0.79) was negatively
correlated with the mean essential amino acids digestibility, even more closely
than tannin content (r = -0.60). In addition, there was a strong negative
correlation between α-kafirins and TMEn (-0.81) whereas the negative correlation
between tannin and TMEn was not significant. The correlation between kafirins
and total protein also was not significant. Finally, correlations between
“combined tannin and kafirin” and digestibility of individual amino acid and TMEn
were consistently negative and significant (Table 1-8).
As presented in Table 1.9, Ravindran et al. (2006) suggested that amino
acid digestibility is high in tannin-free or very low-tannin sorghums compared to
tannin sorghums. The authors went on to suggest that an increase of 0.1% in
tannin can induce a decrease of 10% in digestibility of most amino acids with
twice that much reduction for sulfur amino acids and lysine. Additionally, an
increase of 0.35% dietary phytate reduced amino acid digestibility by 3.6%
(Ravindran et al., 2006). In a 42-d growth assay, Hassan et al. (2003) evaluated
the effect of tannins (2.8 vs 13.8 g/kg) on growth performance and mineral
absorption in broiler chicks. Response criteria were weight gain, feed intake,
gain:feed, and total tract absorption of eight minerals. Depression in weight gain,
feed intake, and gain:feed were 4, 1, and 2% respectively. For mineral
absorption, Na, Mg, and Zn were the most affected with 10, 5, and 5%
17

reductions, respectively. Those results are in agreement with Monge et al. (2007)
who reported that up to 14 g/kg tannins had no significant negative effect on
broiler growth. Tannins and phytate have the capacity to alter Na metabolism
which may impair intestinal nutrient absorption. Ravidran et al. (2006) reported
more Na excretion by broilers fed high phytate diets. Inclusion of phytase helped
to alleviate the loss of sodium. Supplementation with sodium bicarbonate
improved dietary electrolyte balance and prevented the adverse effects of
tannins. However, addition of sodium bicarbonate at levels higher than 2.5 g/kg
(Table 1.10) reduced growth performance (Banda Nyirenda and Vohra, 1990).
IMPLICATIONS Among the five major cereals produced worldwide, sorghum is unique for
its physical characteristics, kafirin proteins, high proportion of phytate, and ability
to produce tannins. During the last five decades, the effects of tannins, phytate,
kafirins, and starch characteristics have been evaluated in sorghum-based feeds
and foods. Most of the presently cultivated sorghums are tannin free. However,
less progress towards phytate-free sorghums has been made, and tannins
sometimes still are found in sorghum.
18

REFERENCES Abdelraham, A. A., and R. C. Hoseney. 1984. Basis of hardness in pearl millet,
grain sorghum and corn. Cereal Chem. 61:232-235.
Abdoulaye T., J. Sanders, and B. Ouendeba. 2006. Which grain for poultry feed
in West Africa: sorghum or corn? Bulletin N° 4, Marketing-Processing
Project. INTSORMIL/USAID West Africa, Niamey, Niger. 24p.
Albin, C. A., and D. Heitz. 1975. Nutritional characteristics of sorghum differing in
bushel weight and seed size. Final Report. Texas Tech University. Anim.
Sci. Dept. Lubock, Texas 9409.
Ambula, M. K., G. W. Oduho, and J. K. Tuitoek. 2003. Effect of high tannin and
bentonite on the performance of laying hens. Trop. Anim. Heath and Prod.
35:285-292.
Amstrong, W. D., J. C. Rogler, and W. R. Featherston. 1974. Effect of bird
resistant sorghum grain and various commercial tannins on chicks
performance. Poult. Sci. 53:714-720.
Armanious, M., M.N. Britton, and H. L. Fuller. 1973. Effect of methionine and
choline on tannic acid toxicity in laying hens. Poult. Sci. 52:2160-2168.
Banda-Nyirenda, C.B.C., and P. Vohra.1990. Nutritional improvement of tannin
containing sorghums (sorghum bicolor) by sodium bicarbonate. Cereal
Chem. 67:533-537.
Bandyopadhyay, R., D.E. Frederickson, N. W. McLaren, G. N. Odvody, and M.
G. Raly. 1998. Ergot: A new disease threat to sorghum in the America and
Australia. Plant Dis. 82:356-367.
19

Bean, S. R., O. K. Chung, M. R. Tuinstra, J. F. Pederson, and J. Erpelding. 2006.
Evaluation of a single kernel characterization system (SKCS) for
measurement of sorghum grain attributes. Cereal Chem. 83:108-113.
Behnke, K. C. 1996. Feed manufacturing technology: Current issues and
challenge. Anim. Feed Sci. Technol. 62:49-57.
Biggs, P., and C. M. Parsons. 2009. The effects of whole grains on nutrients
digesibilities, growth performance, and cecal short-chain in young chicks
fed ground corn-soybean meal diets. Poult. Sci. 88:1893-1905.
Benmousa, M., B. Suhendra, B. Adam, and B. R. Hamaker. 2006. Distinctive
sorghum starch granule morphologies appear to improve raw starch
digestibility. Starke. 58:92-99.
Black, J. L., J. L. Nielsen, A. M. Tredrea, R. MacAlpine, and R.J. van Bareveld.
2005. The energy value of cereal grains, particularly wheat and sorghum,
for poultry. Proc. Austr. Poult. Sci. Symposium. 17:21-29.
Bravo, L. 1998. Polyphenols: chemistry, dietary sources, metabolism, and
nutritional significance. Nutr. Rev. 56:317-333.
Bryden, W. L., P. H. Selle, D. J. Cadogan, X. Li, N. D. Muller, D. R. Jordan, M. J.
Gidley, and W. D. Hamilton. 2009. A review of the nutritive value of
sorghum in broilers. Rural Industry Res. Dev. Corp. Kingston, Aust.
Bryden, W. L., P. H. Selle, V. Ravindran, and T. Acamovic. 2007. Phytate: an
anti-nutrient factor in animal diets. In: Poisonous plants: global research
and solutions. (editors: K. E. Panter, T. L. Wierenga, and J. A. Pfister)
Page 279. CABI Publ. Wallinford, U. K.
20 Butler, L. G., and J. C. Rogler. 1992. Biochemical-mechanism of the

antinutritional effects of tannins. J. Nutr. Sci. 38:49:55.
Butler, L. G. 1978. Tannin in sorghum grain: problems solution, and
opportunities. J. Agric. Food Chem. 27: 441–445.
Cao, H., J. D. Hancock, R. H. Hines, K. C. Behnke, J. C. Park, B. W. Senne, J.
R. Froetschener, J. M. Jiang, and S. L. Johnston. 1998. Effect of sorghum
starch type, endosperm hardness, and processing on digestibility and
growth performance in finishing pigs and chickens. KS State Univ. Swine
Day. Report Prog. 819:256-260.
Chavan, J. K., S. S. Kadam, C. P. Ghonsikar, and D. K. Salunke. 1979. Removal
of tannins and improvement of in vitro protein digestibility of sorghum seed
by soaking in alkali. J. Food Sci. 44:1319-1321.
Cheeke, P. R. 1998. Natural toxicants in feeds, forages and poisonous plants.
Interstate Publ. 479p. Danville, Illinois.
Cheng, S., Y. Sun, and L. Halgreen. 2009. The relationships of sorghum kernel
pericarp and testa characteristics with tannin content. Asian J. Crop.
Sci.1 :1-5.
Cowieson, A. J., T. Acamovic, and M. R. Bedford. 2004. Effect of phytase and
phytic acid on the loss of endogenous amino acids and minerals from
broilers chickens. Br. Poult. Sci. 45:101-108.
Cramer, K. R., K. J. Wilson, J. S. Moritz, and R. S. Beyer. 2003. Effect of
sorghum-based diets subject to various manufacturing procedures on
broiler performance. J. Appl. Poult. Res. 12:404-410.
Denbow, D.M., , E.A., Grabau, G.H. Lacy, P. Umbeck, and D. R. Russell. 1998.
21

Soybeans transformed with a fungal phytase gene improve phosphorus
availability for broilers. Poult. Sci. 77:878-881.
Dilger, R.N., E.M. Onyango, J.S. Sands, and O. Adeola. 2004. Evaluation of
microbial phytase in broiler diets. Poult. Sci. 83:962-970.
Donald, V. T., and V. Ravindran. 2008. Effect of cereal type on the performance,
gastrointestinal tract development and intestinal morphology of newly
hatched broiler chick. J. Poult. Sci. 45:45-50.
Donkoh, A., and V. Attoh-Kotoku. 2009. Nutritive value of feedstuffs for poultry in
Ghana: chemical composition, apparent metabolizable energy and ileal
amino acid digestibility. Dept. Anim. Sci. College Agric. Kwame Nkrumah
Univ. Sci. Tech. Kumassi, Ghana. Livestock Rural Res. Dev. 21 (3).
Douglas, J. H., T. W. Sulivan, P. L. Bond, F. J. Baier, and L. G. Robeson. 1990.
Nutrient composition and metabolizable energy of selected grain sorghum
varieties and yellow corn. Poult. Sci. 69:1147-1155.
Elkin, R. G., M. B. Freed, Y. Zhang, and C. M. Parsons. 1996. Condensed
tannins are only partially responsible for variation in nutrients digesibilities
of sorghum grain cultivars. J. Agric. Food Chem. 44:848-853.
Elkin, R. G., J. C. Rogler, and T. W. Sulivan. 1991. Differential response of ducks
and chicks to dietary sorghum tannins. J. Sci. Food Agric. 57:543-553.
Ezeogou, L. I., K. G. Duodu, M. N. Emmambux, and J. R. N. Taylor. 2008.
Influence of cooking on the protein matrix of sorghum and maize
endosperm flours. Cereal Chem. 85:397-402.
Gualtieri, M., and S. Rappaccini. 1990. Sorghum grain in poultry feeding. World
22

Poult. Sci. J. 46:246-254.
Hagerman, A. E., and L. G. Butler. 1998. Condensed tannins purification and
characterization of tannin-associated proteins. J. Agric. Food Chem.
28:947-952.
Hamaker, R. B., A. A. Mohamed, J. E. Habben, C. P. Huang, and B. A. Larkin.
1995. Efficient procedure for extracting maize and sorghum kernel protein
reveals higher prolamin contents than conventional methods. Cereal
Chem. 72:583-588.
Hancock, J. D. 2000. Value of sorghum and sorghum co-products in diets for
livestock. PP. 731-751. In: Sorghum Origin, History, Technology and
Production. W. Smith and R. A. Fredericksen (ed.), Wiley Series Crop.
Sci.
Hancock, J. D., R . D. Goodband, and J A. Hansen. 1990. Effect of test weight on
feeding value and MEn of sorghum for growing chicks. J. Anim. Sci.
91(suppl. 1):315 (abstract.).
Hassan, I. A. G., E. A., Elzubeir, and A. H. El Tinay. 2003. Growth and apparent
absorption of minerals in broilers chickens fed diets with low and high
tannin contents. Tropic. Anim. Health Prod. 35:189-196.
Healy, B. J., J. D. Hancock, P. J. Bramel-Cox, K. C. Behnke, and G. A.
Kennedy. 1994. Optimum paricle sizes of corn and hard and softsorghum
grain for nursery pig and broilers chicks. PP. 66-72. In: Kansas State Univ.
Swine Day Report 641.
Ioerger, B., S. R. Bean, M. R. Tuinstra, J. F. Pedersen, K. M. Lee, and T. J.
23

Herman. 2007. Characterization of polymeric proteins from vitreous and
floury sorghum endosperm. J. Agric. Food Chem. 55:232-239.
INTSORMIL 2007. INTSORMIL Publication 07-01. 2007. Annual report. 113
Biochem. Hall Univ. Lincoln, Nebraska, Lincoln.
Issa S., J. D. Hancock, M. R. Tuinstra, I. Kapran, and S. Kaka. 2007. Effects of
sorghum variety on growth and carcass characteristics in broiler chicks
reared in West Africa. . J. Poult. Sci. Vol 86( Suppl. 1.):69(Abstract).
Jacob, J. P., B. N. Mitaru, P. N. Mbugua, and R. Blair. 2004. The feeding value of
Kenyan sorghum, sunflower seed cake, and sesame seed cake for
broilers and layers. Anim. Feed Tech. 61:41-46.
Jondreville, C., M. Magnin, P. Lescoat, D. Feuerstein, B. Gruenberg, and Y. Nys.
2008. Remplacement du sulfate de zinc par la 3-phytase microbienne
d’aspergillus niger dans les aliments pour poulets de chair. 104-108 in
Proc. Jour. Rech. Avic. Saint-Malo, France.
Kyarissiima, C.C., M. W. Okot, and S. Svihus. 2004. Use of wood ash in the
treatment of high tannin sorghum for poultry feeding. S. Afric. J. Anim. Sci.
34:110-115.
Lee, W. J., J. F. Pedersen, and D. R. Shelton. 2002. Relationship of sorghum
kernel size to physiochemical, milling, and cooking properties. Food Res.
Int. 35:643-649.
Lucbert, J. and J. Castaing. 1986. Utilisation des sorghos de differentes teneurs
en tannins pour l’alimentation des poulets de chair. Proc. 7th European
Poult. Conf. 1:472-476.
Maunder, A. B. 2002. Sorghum worldwide. PP. 11-18 in Sorghum and
24

Millet Diseases. J. F. Lesile (ed.). Iowa State Pres, Blackwell Publ. Comp.
Ames, Iowa.
Michel, R.D., and H.M. Edwards. 1996. Additive effects of 25-
dihyroxycholecalciferol and phytase on phytate phosphorus utilization and
related parameters in broiler chickens. Poult. Sci. 75:111-119.
Mikkelsen, L. L., S. Yan, J. P. Goopy, and P. A. Ili. 2008. Effect of grain type and
particle size on growth performance and intestinal microbial populations in
broiler chickens. Proc. XXIII World Poutl. Sci. Assoc. June 30th to July 4th,
Brisbane.
Mitaru B. N., R. D. Reichert, and R. Blair. 1984. The binding of dietary protein by
sorghum tannins in the digestive tract of pigs. J. Nutr. 114:1787-1796.
Monge, C. R., J. D. Hancock, C. Feoli, S. Bean and S. Beyer. 2007. Effects of
tannin concentration on nutritional value of sorghum grain in broiler chicks.
J. Anim. Sci. 85(Suppl.1):589(abstract).
Nelson, T. S., L. W. Ferrera, and N. L. Storer. 1968. Phytate phosphorus content
of feed ingredients derived from plants. Poult. Sci. 47:1372-1374.
Nir, I., R. Hillel, I. Ptichi, and G Shefet. 1995. Effect of particle size on
performance. 3. Grinding and pelleting interactions. Poult. Sci. 74:771-
783.
NRC. 1994. Nutrient Requirement of Poultry. 4th Revised Edition, Natl.
Acad. Press, Washington, DC.
Nyachoti, C. M., J. L. Atkinson, and S. Lesson.1997. Sorghum tannins : a
Review. World Poult. Sci. J. 53:5-21.
25

Nyachoti, C. M., J. L. Atkinson, and S. Lesson.1996. Response of broiler chicks
fed a high tannin sorghum diets. J. Appl. Poult. Res. 5:239-245.
Nyamambi, B., N. R. Ndlovu, Y. S. Naik, and N. D. Kock. 2007. Intestinal
growth of broiler chicks fed sorghum-based diets differing in condensed
tannin levels. South. Afric. J. Anim. Sci. 37:202-214.
Nyannor, E. K. D., S. A. Adedokum, B. R. Hamaker, G. Ejeta, and O. Adeola.
2007. Nutritional evaluation of high-digestible sorghum for pigs and broiler
chicks. J. Anim. Sci. 8:196-203.
Oria, M.P., B. R. Hamaker, J. D. Axtell, and C. H. Huang. 2000. A high digestible
mutant cultivar exhibits a unique folded structure of endosperm protein
body. Proc. Natl. Acad. Sci.10:5065-5070.
Oria, M.P., B. R. Hamaker, and J. M. Shull. 1995. Resistance of sorghum α-, β-,
and λ-kafirins to pesin digestion. J. Agric. Food Chem. 43:2148-2153.
Parsons, C. M., N. P. Buchanan, K. P. Blemings, M. E. Wilson, and J. S. Moritz.
2006. Effects of corn particle size and pellet texture on broiler
performance in the growing phase. J. Appl. Poult. Res. 15:245-255.
Parthasarathy, P. R., K. R. Gurava, V. S. Reddy, and C. L. Gowda. 2005.
Linking producers and processors of sorghum for poultry feed: A case
study from India. Int. lnst. Crop. Res. Inst. Semi Arid Trop. (ICRISAT).
www.globalfoodchainpartnerships.org.
Perez-Maldonado, R. A., and H. D. Rodriguez. 2007. Nutritional characteristics of
26

sorghums in Queensland and New South Wale for chicken meat
production. RIRDC Publication No 07. Rural Industry Res. Dev. Corp.
Barton, ACT.
Price, M. L., S. Van Scoyoc, and L. G. Butler. 1978. A critical evaluation of the
vanillin reaction as an assay for tannin in sorghum grain. J. Agric. Food
Chem. 26:1214-1218.
Ravindran, V., P. C. H. Morel, G. G. Partridge, M. Hruby, and J. S. Sands. 2006.
Influence of a E. coli-derived phytase on nutrient utilization in broiler starts
fed diets containing varying concentrations of phytic acid. Poult. Sci.
85:82-89.
Reece, N., McNaughton, J. L., and B. D. Lott. 1986. Responses of broilers chicks
to dietary energy and lysine levels in a warm environment. Poult. Sci. 63:
1170-1174.
Rooney, L. W., and S. O. Serna-saldvar. 2000. PP 149-175. In: Sorghum. 2nd
Ed. K. Kulp and Ponte J. (ed). Hanbook of Cereal Sci. Tech. New York,
NY.
Rostagno, H. S., J. C. Rogler, and W. R. Featherston. 1974. Studies on the
nutritional value of sorghum grains with varying tannin content for chicks.
2. Amino acid digestibility studies. Poult. Sci. 52:772-778.
Salinas, P H., A. Pro, E. Sosa, C. M. Becceril, M. Cuca, M. Cervante, and J.
Gallegos. 2006. Compositional variation among sorghums hybrids: effect
of kafirin concentration on metabolizable energy. J. Cereal Chem. 44:342-
346.
27
Sell, D. R., J. C. Rogler, and W. R. Featherston. 1984. The effect of sorghum
tannin and methionine level on the performance of laying hens maintained
in two temperature environments. Poult. Sci. 62:2420-2428.
Selle, P. H., A. R. Walker, and W. L. Bryden. 2003. Total and phytate-
phosphorus contents and phytase activity of Australian-sourced feed
ingredients for pigs and poultry. Aust. J. Exp. Agric. 45:475-479.
Shull, J. M., J. J. Waterson,and A. W. Kirleis. 1992. Purification and
immunocythochemical localization of kafirins in sorghum bicolor (L.
Monech) endosperm. Protoplasm 171:64-74.
Taylor, J., S. Bean, B. P. Ioerger, and J. R. N. Taylor. 2007. Preferential binding
of sorghum tannin with λ-kafirins and the influence of binding on kafirin
digestion and biodegradation. J. Cereal Chem. 46:22-31.
Travis, D. K., M. R. Tuinstra, and J. D. Hancock. 2006. Variation in nutritional
value of sorghum hybrids with contrasting seed weight characteristics and
comparisons with maize in broiler chicks. Crop Sci. 46:695-699.
Tribble, L. F., W. F. Stansbury, and J. J. McGlone. 1987. Feeding value of low
bushel test weight sorghum for growing finishing swine. p21. Texas Tech
Univ. Agric. Sci. Tech. Rep.T-5-233.
Van Soest, J. P. 1994. Nutrition Ecology of Ruminant. 2nd Ed.
Comstock Publ. Assoc. Cornell Univ. Press.
Vasan, P., N. Duta, A. B. Mandal, K. Sharma, and M. M. Kadam. 2008.
Comparative digestibility of amino acids of maize, sorghum, and finger
millet in cockerels and Japanese quail. Br. Poult. Sci. 49:176-180.
28

Watson, J. J., J. M. Shull, and A. W. Kirleis. 1993. Quantifiquation of α-, β-, and
λ-kafrins in vitreous and opaque endosperm of sorghum bicolore.Cereal
Chem. 70:452-457.
Wu, Y. B., V. Ravindran, and W. H. Hendriks. 2004. Influence of exogenous
enzyme supplementation on energy utilization and nutrient digestibility of
cereals for broilers. J. Sci. Food Agric. 84:1817-1822.
29

30
Table 1.1. Cereal and legume production in West Africaa
Production, tons Cereal 1990 2006
Increase, %
Millet 5,183,641 14,477,496 279
Sorghum 5,445,024 13,899,135 255
Corn 2,129,165 11,778,729 553
Rice 3,199,964 9,091,018 284
Legumesb 1,191,194 4,787,657 402 aAdapted from Blein et al.(2008)
bCowpea, beans, and peas

Table 1.2. Effects of sorghum-based diets on poultry performance
Weight gain, g G:F, g/kg Egg production, % ME, kcal/kg Amino acid digestibility,%
Reference Ca FLTSb MHTSc Ca FLTSb MHTSc Ca FLTSb MHTSc Ca FLTSb MHTSc Ca FLTSb MHTS1 - - - - - - - - - - - - - 73.0 31.5 2 667 636 583 565 556 508 - - - - - - - - - 3 - - - - - - - - - - 3,306 3,044 - - - 4 575 556 571 617 553 578 - - - - - - - - - 5 - 703 670 649 - - - - - 6 - - - - - - - - - - - - - 81.4 60.9 7 580 - 644 - - 719 - - - - - - - - - 8 - - - - - - - - - - - - 82.0 79.0 9 796 807 - 714 730 - - - - 4,023 4,054 - 77.8 86.7 -
10 528 - 230 610 - 439 - - - - - - - - - 11 - - - - - - - - - 3,672 3,476 - - - - 12 370 - 358 403 - 408 - - - - - - - - - 13 949 951 - 768 745 - - - - 3,510 3,440 - - - - 14 321 326 269 393 402 247 - - - - - - - - - 15 273 252 - 621 - - - - - - - - - - - 16 711 733 966 - - - - - - - - - - - - 17 - - - - - - - - - 3,105 3,173 - 18 - - - - - - - - - 3,134 2895 2,608 86.2 85.5 80.6 19 - - - - - - - 69.2 46.6 - - - - - - 20 - - - - - - 70.9 - 64.7 - - - - - - 21 - - - - - - 68.5 69.0 69.2 - - - - - - 22 - - - - - - 89.0 88.0 - - - - - - - 23 - - - - - - 47.0 56.0 - - - - - - -
aC=corn; bFLTS= free/low-tannin sorghum; cMHTS = medium/high-tannin sorghum. 1Rostagno et al., 1974; 2Luis and Sulivan,1980;3Lucbert and Castaing, 1988; 4Banda-Nyirenda et al.,1990; 5Healy et al., 1994; 6Elkin et al., 1996; 7Nyachoti et al., 1996; 8Ravindran et al.,1999; 9Elkin et al., 2002; 10Kyarisiima et al., 2004; 11Nadeem et al., 2005; 12Oduho and Baker, 2005;13Travis, et al; 2006; 14Nyamambi et al., 2007; 15Issa et al., 2007; 16Nyannor et al., 2007; 17Ravindran et al., 2008; 18Donkoh et al., 200918Donkoh et al., 2009; 19Sell et al.,1984; 20Jacob et al., 1996; 21Ambula et al., 2003; 22S Parthasarathy et al., 2005; 23Issa et al., 2007.
31
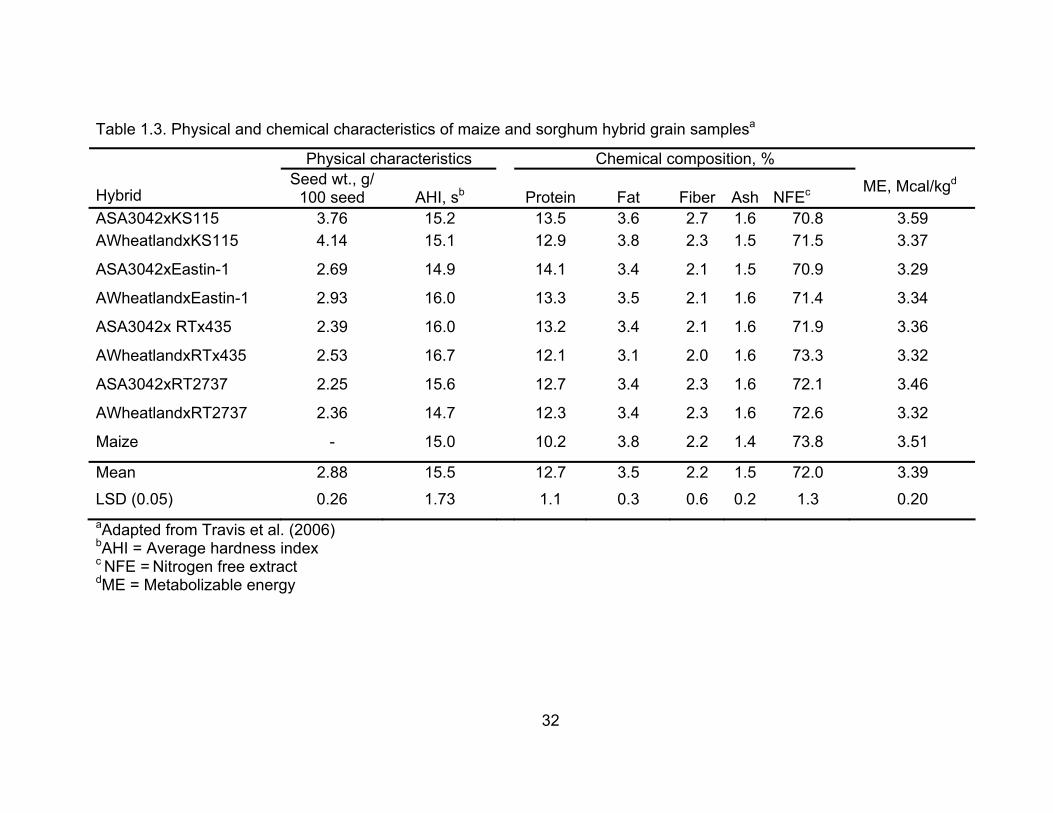
Table 1.3. Physical and chemical characteristics of maize and sorghum hybrid grain samplesa
Physical characteristics Chemical composition, % Hybrid
Seed wt., g/100 seed
AHI, sb
Protein
Fat
Fiber
Ash
NFEc
ME, Mcal/kgd
ASA3042xKS115 3.76 15.2 13.5 3.6 2.7 1.6 70.8 3.59 AWheatlandxKS115 4.14 15.1 12.9 3.8 2.3 1.5 71.5 3.37
ASA3042xEastin-1 2.69 14.9 14.1 3.4 2.1 1.5 70.9 3.29
AWheatlandxEastin-1 2.93 16.0 13.3 3.5 2.1 1.6 71.4 3.34
ASA3042x RTx435 2.39 16.0 13.2 3.4 2.1 1.6 71.9 3.36
AWheatlandxRTx435 2.53 16.7 12.1 3.1 2.0 1.6 73.3 3.32
ASA3042xRT2737 2.25 15.6 12.7 3.4 2.3 1.6 72.1 3.46
AWheatlandxRT2737 2.36 14.7 12.3 3.4 2.3 1.6 72.6 3.32
Maize - 15.0 10.2 3.8 2.2 1.4 73.8 3.51
Mean 2.88 15.5 12.7 3.5 2.2 1.5 72.0 3.39
LSD (0.05) 0.26 1.73 1.1 0.3 0.6 0.2 1.3 0.20 aAdapted from Travis et al. (2006) bAHI = Average hardness index c NFE = Nitrogen free extract dME = Metabolizable energy
32

Table 1.4. Nutrient content of corn and sorghum as a percentage of NRC requirement, in
0- to 3-wk old broiler chicksa
Nutrient content, % of requirementb
Nutrient
Requirement, % Corn Sorghum
Proteinc 23.0 38 41
Arginine 1.25 31 29
Gly + Ser 1.25 57 58
Histidine 0.35 67 65
Isoleucine 0.80 37 45
Leucine 1.20 85 98
Lysine 1.10 24 20
Met + Cys 0.90 41 38
Phe + Tyr 1.34 52 62
Threeonine 0.80 37 37
Tryptophan 0.20 31 41
Valine 0.90 46 50 aAdapted from the Poultry NRC (1994) bValues are nutrient concentration in corn or sorghum as a percentage of the requirement. cThere is no protein requirement in broilers chicks. The value of 23% simply is that expected in a corn-soybean meal-based diet
33

Table 1.5. Approximate amino acid profile of α-, β-, and λ-kafirins (mole, %) in sorghuma
aAdapted from Shull et al. (1992)
Amino acid α-kafirins β-kafirins λ-kafirins Weighted meanb
Arginine 0.8 2.7 2.0 1.1
Histidine 1.2 0.9 6.9 1.8
Isoleucine 4.4 2.3 2.6 4.1
Leucine 15.1 12.0 9.0 14.2
Lysine 0.4 0.5 0.4 0.4
Methionine 0.6 5.7 1.0 1.0
Phenylalanine +tyrosine 6.3 4.9 3.9 5.9
Threonine 3.2 4.6 4.2 3.4
Valine 4.8 5.2 5.8 4.9
Alanine 15.2 13.4 6.3 14.1
Aspartic acid 5.6 3.3 0.6 4.9
Cysteine 1.1 4.9 6.9 2.0
Glutamitic acid 21.8 17.7 13.8 20.7
Glycine 4.1 6.8 8.6 4.8
Proline 8.9 9.7 22.6 10.0
Serine 5.8 4.6 5.0 5.6
bBased on proportions of 0.820 α-kafirins, 0.075 β-kafirins, and 0.105 λ-kafirins
34

Table 1.6. In vitro digestion of starch from sorghum and corn genotypes varying
in ratio of amylose:amylopectina
Grain
Starch content, g/kg
Amylose in starch, g/kg
Starch enzyme digestion, g/kg
Sorghum Conventional 660 460 300 Non-waxy isoline 640 350 330 Waxy isoline 630 240 560 Corn Cultivar 1 638 0 550 Cultivar 2 663 300 350 Cultivar 3 586 570 210 aAdapted from Black et al. (2005)
35

Table 1.7. Correlation among tannin content, TAAD of essential amino acid, and TMEn for
12 sorghum samplesa
Tannins, g/kg catechin equivalent
Item rb P=d Arginine 0.52 *** Histidine 0.52 ***
Isoleucine 0.51 ***
Leucine 0.60 ***
Lysine 0.46 ***
Methionine 0.46 ***
Phenylalanine 0.30 **
Threonine 0.54 ***
Valine 0.61 ***
TMEn
c -0.44 *** aAdapted from Elkin et al. (1996) bRelationship between tannins and TAAD for essential amino acids was Y = 75.44-10.6X (R = 0.58 ***) bRelationship between tannins and TAAD for essential amino acids was Y = 3,653-88X (R = 0.44 ***) cTAAD = true amino acid digestibility, mean of nine essential amino acids determined cecectomized cockerels. cTMEn = Nitrogen-corrected metabolizable energy d** P ≤ 0.01; **** P ≤ 0.001
36
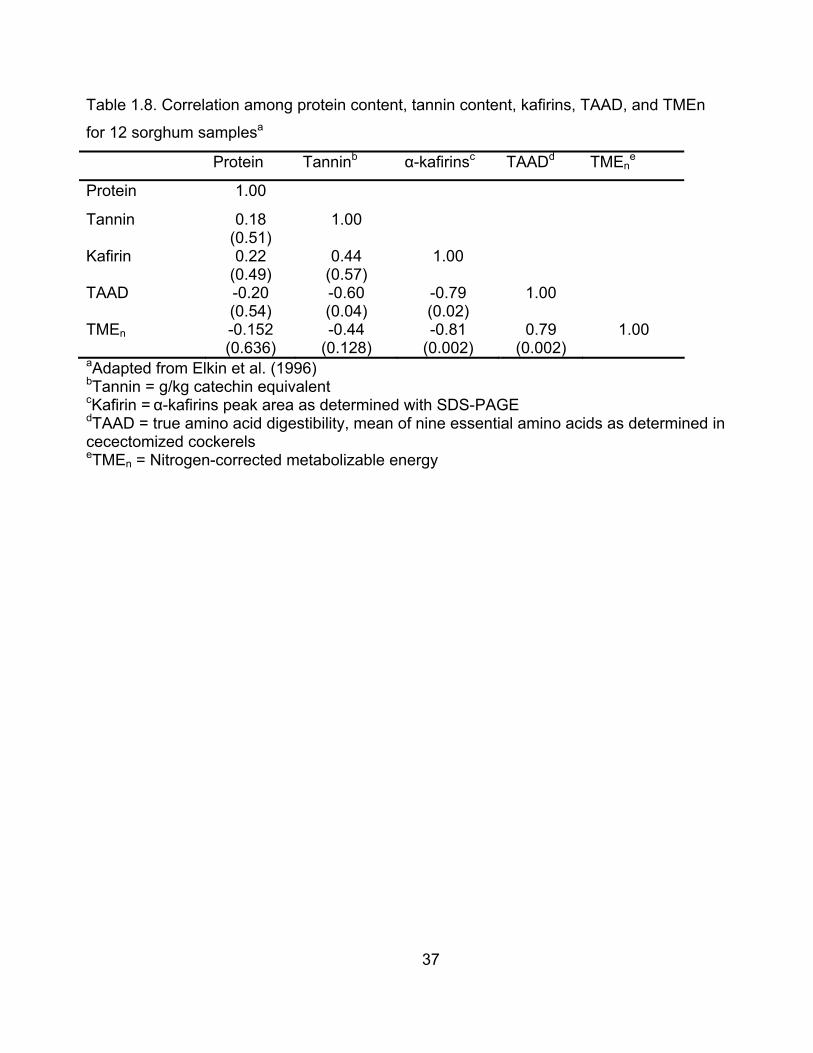
Table 1.8. Correlation among protein content, tannin content, kafirins, TAAD, and TMEn
for 12 sorghum samplesa
Protein Tanninb α-kafirinsc TAADd TMEne
Protein 1.00
Tannin 0.18 (0.51)
1.00
Kafirin 0.22 (0.49)
0.44 (0.57)
1.00
TAAD -0.20 (0.54)
-0.60 (0.04)
-0.79 (0.02)
1.00
TMEn -0.152 (0.636)
-0.44 (0.128)
-0.81 (0.002)
0.79 (0.002)
1.00
aAdapted from Elkin et al. (1996) bTannin = g/kg catechin equivalent cKafirin = α-kafirins peak area as determined with SDS-PAGE dTAAD = true amino acid digestibility, mean of nine essential amino acids as determined in cecectomized cockerels eTMEn = Nitrogen-corrected metabolizable energy
37

Table 1.9. Effects of dietary phytate and tannins on amino acid digestibility in poultrya
Phytate (n=18)b Tannin (n=1)b Amino acid
10.0g/kg
13.6g/kg
Reduction, %
0.9g/kg
1.9g/kg
Reduction, %
Arginine 0.89 0.87 2.59 0.96 0.80 17.4
Histidine 0.79 0.74 6.08 0.86 0.70 21.9
Isoleucine 0.82 0.79 3.05 0.97 0.87 9.5
Leucine 0.83 0.81 2.64 0.98 0.87 11.1
Lysine 0.87 0.84 3.21 0.96 0.79 18.1
Methionine 0.90 0.89 0.22 0.98 0.93 5.8
Phenylalanine 0.83 0.80 3.37 0.97 0.93 4.2
Threonine 0.77 0.73 5.17 0.96 0.86 10.7
Tryptophan 0.80 0.78 3.00 -c - -
Valine 0.81 0.77 4.47 0.94 0.86 8.7
Alanine 0.81 0.79 2.95 0.98 0.93 4.8
Aspartic acid 0.80 0.76 4.63 0.98 0.93 4.4
Cysteine 0.66 0.64 3.03 0.96 0.83 14.1
Glutamitic acid 0.87 0.84 2.54 0.98 0.95 2.9
Glycine 0.77 0.73 5.17 - - -
Proline 0.81 0.79 2.10 0.92 0.85 7.4
Serine 0.78 0.73 6.26 0.97 0.90 7.2
Tyrosine 0.82 0.79 3.67 0.98 089 8.2
Mean 0.81 0.78 3.56 0.96 0.87 9.8aAdapted from Ravindran et al. (2006 ) bn= number of sorghum cultivars cDashes indicate that no data were available
38

Table 1.10. Effects of sodium bicarbonate on growth performance and nutrients
utilization in broilers fed sorghum-based dietsa
Sodium bicarbonate, g/kg
Weight gainb g
Feed:gain
AME, MJ/kgb
Nitrogen retention, %b
0 583y 2.01 13.88x 63.4x
2.5 616z 1.91 14.41y 72.1y
5.0 582y 2.00 14.07x 71.0y
7.5 555x 2.24 14.46y 70.1y
LSD (P < 0.01) 13 0.33 0.218 3.4 aAdapted from Banda Nyirenda and Vohra (1990) bValues in columns with different subscripts differ significantly (P < 0.01). AME = Apparent metabolizable energy
39

CHAPTER 2 -
Effects of Sorghum Variety on Growth and Carcass
Characteristics in Broiler Chicks Reared in West Africa
40

ABSTRACT A total of 840 1-d-old broiler chicks (Arbor Acres line with an average BW of 31 g)
were used in a 60-d experiment to determine the effects of sorghum variety on growth and
carcass characteristics. There were 40 chicks/pen and seven pens/treatment with feed
and water consumed on an ad-libitum basis. The control diet was corn-based with
fishmeal and peanut meal used as the primary protein supplements. The diet was
formulated to 1.3, 1.1, and 1.0% Lys for d 0 to 21, 21 to 42, and 42 to 60, respectively.
Sorghum was used to replace the corn on a wt/wt basis so that treatments were: 1) corn
(imported from Nigeria)-based control; 2) a locally adapted landrace variety of sorghum
(Mota Galmi) with red seed, purple plant, and 0.3 mg catechin equivalents/100 mg of grain
DM; and 3) an agronomically improved variety of sorghum (IRAT 204) with white seed, tan
plant, and no detectable tannins. Average daily gain (ADG) and average daily feed intake
(ADFI) were greater (P < 0.001) for chicks fed corn vs the sorghums. However, most of
this difference was caused by the low ADG and ADFI for chicks fed the agronomically
improved sorghum variety vs the locally adapted sorghum variety (P < 0.001). Gain to
feed ratio was not different (P > 0.26) among chicks fed the treatments. Carcass weight,
carcass yield, and carcass fat were not different for corn vs the sorghums (P > 0.35) but
chicks fed the locally adapted sorghum variety had greater carcass weights and yield than
those fed the agronomically improved sorghum variety (P < 0.001). In conclusion, the
locally adapted landrace sorghum was superior in nutritional value to the agronomically
improved sorghum and comparable in nutritional value to imported corn.
Key words: Sorghum, Corn, Poultry
41

INTRODUCTION In Niger, 80% of the rural population raises animals that include cattle, goats,
sheep, and camels. Although, sorghum is the second most produced cereal in Niger (after
millet), imported corn remains the main cereal used in poultry feed (Abdoulaye, 2006).
With corn importation and an abundant supply of fish meal, backyard poultry and
commercial broilers contribute 98 and 2%, respectively of the poultry meat supply while
domestic egg production accounts for only 29% of the national egg demand (Maizama et
al., 2003). Thus, it is clear that in dry, sahelian countries like Niger, sorghum grain can play
an important role in poultry feed (Parthasarathy, 2005; Issa et al., 2007). Comparisons of
corn with sorghums produced in West Africa are not available to demonstrate the relative
merits of these two cereals. Thus, it is necessary to provide poultry producers and
extension personnel with information about sorghum-based diet formulations and feed
processing technologies that might allow broiler performance similar to that obtained with
corn-based diets. It was the objective of the experiments reported herein to compare corn
with sorghum during a 60-day broiler feeding experiment.
MATERIALS AND METHODS A total of 840 1-d-old broiler chicks (Arbor Acres line with an average Bw of 31 g)
were used in a 60-d experiment to determine the effects of sorghum variety on growth and
carcass characteristics. There were 40 chicks/pen and seven pens/treatment with feed
and water consumed on an ad-libitum basis. Birds were housed on deep litter in an open-
sided building with 12-m2/pen. Vaccinations included Newcastle HB1/Lasota (NVD-I2) and
Gumboro (nobilis gumboro 228E). Temperature in the building ranged from 26 to 40°C
42

during the day. The control diet was corn-based with fishmeal and peanut meal used as
the primary protein supplements. The diet (Table 1) was formulated to 1.3, 1.1, and 1.0%
Lys for d 0 to 21, 21 to 42, and 42 to 60, respectively. Sorghum was used to replace the
corn on a wt/wt basis so that treatments were: 1) corn (imported from Nigeria)-based
control; 2) a locally adapted landrace variety of sorghum (Mota Galmi) with red seed,
purple plant, and 0.3 mg catechin equivalents/100 mg of grain DM; and 3) an
agronomically improved variety of sorghum (IRAT 204) with white seed, tan plant, and no
detectable tannins. Corn, sorghum, and diet samples were collected and analyzed for
proximate components (AOAC, 1990) and particle size. Birds consumed water and food on
an ad-libitum basis with body weights recorded on d 0, 21, 42, and 60. At the end of the
experiment, 10 birds per pen were randomly chosen and killed for carcass analysis.
Response criteria were live weight (at d 0, 42, and 60), average daily gain (ADG), average
daily feed intake (ADFI), gain to feed ratio (G:F), and carcass yield, and weights of gizzard,
liver, and mesenteric fat.
All growth and carcass data were analyzed as a randomized complete block design
using the Proc Mixed procedure of SAS. Live weight was used as a covariate during
carcass data analysis and orthogonal contrasts were used to separate treatment means.
Comparisons were corn vs the sorghums and locally adated sorghum vs agronomcaly
improved sorghum.
43

RESULTS AND DISCUSSION Cereal grains and diets (Table 2-2) had similar particle sizes, DM, ash, ether extract, and
crude fiber. However, corn had greater nitrogen free extract and sorghums had greater
crude protein. As for the growth assay, ADG and ADFI were greater (P < 0.001) for chicks
fed corn vs sorghum. However, most of this difference was caused by the low ADG and
ADFI for chicks fed the improved sorghum variety vs the locally adapted sorghum variety
(P < 0.001).
Travis et al. (2006) reported 44 to 47g of ADG for d 0 to 21 for Cobb chicks fed nine
sorghum-based diets vs 46 g for birds fed corn-based diets. Perez-Maldonado et al. (2008)
reported ADG of 39 g for d 0 to 21 and 73 g for d 0 to 42 for Arbor Acres chicks fed 17
Australian sorghum cultivars when the birds were reared in cages in a environmentally-
controlled house. In addition, ADG of 32 g was reported for d 0 to 21 when Cobb broiler
chicks were fed sorghum-based diets as mash and standard or expanded crumbles
(Cramer et al., 2003). For d 0 to 42, the authors reported ADG of 58 and 57g for birds fed
standard or expanded sorghum-based diets.
44
Average daily gain at d 60 (31 to 37g) was lower than the58 and 57g obtained by
Cramer et al. (2003) at d 42 with Cobb-500 broiler chicks fed standard or expanded
crumbled sorghum-based diets. Finally, Defang et al. (2008) observed 48 g of ADG in
Arbor Acres broiler chicks fed a corn-based diet with soybean meal, meat meal, fish meal,
cotton seed meal, peanut meal, and wheat middlings as protein supplement in a 49-d
experiment. However, when meat meal was replaced with boiled cowpea or black beans,
ADG ranged from 38 to 42 g. The low ADG in our experiment likely was caused by
extreme heat stress in our naturally ventilated building. Ahmed et al. (2006) reported ADG
of 26 to 32 g when broiler chicks reared at a constant 32ºC from d 0 to 42.

Our feed intake from d 0 to 21 (19 g) was lower than 46 to 61 g/d reported by
Cramer et al. (2003), and Travis et al. (2006) for Cobb broiler chicks which would be due to
line and rearing conditions. Feed intake can also be explained by the high temperature
prevailing in the building (26 to 40°C), and the low 170 mEq/kg DEB. Perez-Maldonado et
al. (2008) reported F:G of 57g for d 0 to 21 and 125 g for birds fed sorghum-based diets
and reared in environmentally-controlled house. Ahmed et al. (2006) improved water use
by 34%, and feed intake by 16%, when DEB was changed from 174 to 250 mEq/kg with
building temperature of 32°C. Henken et al. (1993) reported change in ADFI from 92 to 78
g and in ADG from 35 to 30 g when broiler chicks were reared at 25°C or at temperatures
30 to 40°C.
Lu et al. (2007) reported live weight of 1,876 g when Arbor Acres broilers were
raised at 34°C from d 0 to 60 in China, while Sarker et al. (2002) reported 42-d BW of
1,260 to 1,330 g for Arbor Acres chicks reared during winter in Bangladesh. In our study,
average live BW at 60 d of age was 2,209 g for birds fed corn-based diets and 2,101 g for
birds fed landrace sorghum-based diets. Adeyemo et al. (2007) reported BW of 1,722 to
2,097g at 60 d when Arbor Acre broiler chicks were fed corn fish meal diets supplemented
with desert locust meal in the hot weather of Nigeria. During a 56-d growth assay, Jacob et
al. (1996) reported BW of 2,028 g for birds fed corn-based diets and 1,899 g for birds fed
high-tannin, sorghum-based diets.
As for differences among the treatments in our experiment, growth performance
variation from birds fed corn-based diets vs those fed sorghums-based diets, and birds fed
the landrace vs the improved sorghum was primarily due to intake. The local sorghum a
had low tannin level (0.30 mg CE/100 mg DM) that did not seem to affect its nutritive
45

value. Tannin is harmful to chick performance if it is greater than 1.35 mg CE/100 g DM
(Monge, 2007). This substance decreases protein digestibility by complexing with proteins
and inhibiting enzyme activity during test tube experiments (Balla, 1999).
Gain:feed ratio from d 0 to 42 was higher (P < 0.09) for birds fed corn-based diet
compared to birds fed the sorghums, however G:F was similar (P > 0.11) for birds fed the
landrace vs the improved sorghum (Table 3). Gain:feed from d 0 to 60 was not different (P
> 0.26) among chicks fed the various treatments. Travis et al. (2006) reported G:F of 723
to 756 g/kg from d 0 to 21 for Cobb broiler chicks fed nine sorghum-based diets vs 767 g
/kg for birds fed corn-based diets. In addition, Elkin et al. (2002) observed G:F of 592 g/kg
from d 0 to 42 for broiler chicks fed corn-based diets vs 575 to 592 g/kg for birds fed
sorghum-based diets.
With BW used as covariate, chicks fed the locally adapted sorghum variety had
greater carcass yield (P < 0.001) than those fed the improved sorghum variety (Table 2-3).
However, carcass yield, carcass fat, gizzard and liver were not different for corn vs the
sorghums (P > 0.16). Indeed most carcass measurements were similar for all treatments,
which favors substitution with sorghum in place of corn if priced more cheaply. Similarly,
Perez-Maldonaldo et al. (2008) reported that birds fed sorghum-based diets had similar
BW, weight of fat pad, and breast meat yield at d 42 compared to bird fed wheat-based
diets. Also, our results agreed with those of Shelton et al. (2004) where pigs fed corn, non-
waxy sorghum, and waxy sorghum had similar growth and carcass traits. Finally, Carré
(2000) reported that with similar particles size, gizzard weights which were not different in
birds fed corn- or sorghum-based diets.
46

IMPLICATIONS In summary, the differences observed in performance among birds fed corn-based
vs sorghum-based diets primarily were caused by difference in feed intake when the
agronomically improved sorghum was the cereal grain. Perhaps most significant to poultry
feeding in West Africa, the locally adapted landrace sorghum was superior in nutritional
value to the agronomically improved sorghum and comparable in nutritional value of
imported corn.
47

REFERENCES Abdoulaye T., J. Sanders, and B. Ouendeba. 2006. Which grain for poultry feed
in West Africa: sorghum or corn? Bulletin N° 4, Marketing-Processing Project.
INTSORMIL/USAID West Africa, Niamey, Niger. 24p.
Adeyemo, G. O., O. G. Longe, and H. A. Lawal. 2008. Effect of feeding desert locust
meal (Schistocerca Gregaria) on performance and hematology of broilers. Dept.
Anim. Sci. Fac. Agric. Univ. Ibadan, Nigeria.
www.tropentag.de/2008/abstracts/full/623.pdf.
Ahmad, T., T. Mushtaq, U. N. Mahr, M. Sarwar, D. M. Hooge, and M. A. Mirza.
2006. Effect of non-chloride electrolyte sources on the performance of heat-
stressed broiler chickens. Br. Poult. Sci. 47:249-256.
AOAC. 1990. Official Methods of Analysis. 15th ed. Assoc. Offic. Anal. Chem., Arlington,
VA.
Balla, A. 1999. Etude des propriétés inter faciales du gluten et des protéines du
sorgho en vue de la planification : Thèse doct. Sci. Agron. Biol. Univ. Gembloux
Belgique.
Carré, B. 2000. Effets de la taille des particules alimentaires sur les processus
digestifs chez les oiseaux d’élevage. INRA Prod. Anim. 13:131-136.
Cramer, K. R., K. J. Wilson, J. S. Moritz, and R. S. Beyer. 2003. Effect of
sorghum-based diets subject to various manufacturing procedures on broiler
performance. J. Appl. Poult. Res. 12:404-410.
Defang, R. F., A. Teguia, J. Ahwa-Ndukm, A. Kenfack, F. Ngoulou, and F.
48

Metuge. 2008. Performance and carcass characteristics of broilers fed cowpea and
or black common bean meal diets. Afri. J. Biol. 7:1351-1356.
Elkin, R. G., E. Arthur, B. R. Hamaker, J. D. Axtell, M. W. Douglas, and C. M.
Parsons. 2002. Nutritional value of a highly digestble sorghum cultivar for meat-
type chickens. J. Agric. Food Chem. 50:4146-4150.
Hancock, J. D. 2000. Value of sorghum and sorghum co-products in diets for
livestock. PP 731-751. In: Sorghum Origin, History, Technology and Production. W.
Smith and R. A. Fredericksen (ed.), Wiley Series Crop. Sci.
Henken, A. M., A. M. J. Groote Shaarsberg, and W. van der Hel. 1983. The effect
of environmental temperature on immune response and metabolism of young
chickens. 4. Effect environmental temperature on some aspects of energy and
protein metabolism. World Poult. Sci. J. 62:59-67.
Issa S., J. D. Hancock, M. R. Tuinstra, I. Kapran, and S. Kaka. 2007. Effects of
sorghum variety on growth and carcass characteristics in broiler chicks reared in
West Africa. Poult. Sci. Vol 86(Suppl. 1):69(abstract).
Jacob, J. P., B. N. Mitaru, P. N. Mbugua, and R. Blair. 1996. The feeding value of
Kenyan sorghum, sunflower seed cake, and sesame seed cake for broilers and
layers. Anim. Feed Tech. 61:41-46.
Lu, Q., J. Wen, and H. Zang. 2007. Effect of chronic heat exposure on fat deposition
and meat quality in two genetic types of chicken. Poult. Sci. 86:1059-1064.
Maizama, D. G., F., Sanoko, A. Beidou, and A. Ganahi. 2003. Repères pour un
développement de la filière avicole moderne au Niger. Minist. Anim. Resour.
Niamey, Niger.
49

Monge, C. R., J. D. Hancock, C. Feoli, S. Bean, and S. Beyer. 2007. Effects of
tannin concentration on nutritional value of sorghum grain in broiler chicks. J. Anim.
Sci. 85(Suppl.1):589(abstract).
NRC. 1994. INutrient Requirement of Poultry. 4th Revised Ed. Natl.
Acad. Press, Washington, DC.
Nyachoti, C. M., J. L. Atkinson, and S. Lesson. 1996. Response of broiler chicks fed a high
tannin sorghum diets. J. Appl. Poult. Res. 5:239-245.
Parthasarathy, P. R., K. R. Gurava, V. S. Reddy, and C. L. Gowda. 2005. Linking
producers and processors of sorghum for poultry feed: A case study from India. Int.
lnst. Crop. Res. Inst. Semi Arid Trop. (ICRISAT),
www.globalfoodchainpartnerships.org.
Perez-Maldoado, R. A. 2008. Chicken meat production in Australia using
sorghum-based diets: Problems and solutions. Proc. XXIII. World Poult. Cong.
World Poult. Sci. Assoc. June 30th to July 4th, Brisbane.
Saker, M. S. K., M. A. Islam, S. U. Ahmed, and J. Alam. 2002. Profitability and meat yield
of different fast growing broiler strains in winter. J. Biol. Sci. 2:361-363.
Shelton, J. L., J. O. Mathews, L. L. Southern, A. D. Higbie, T. D. Bidner, J. M.
Fernandez, and J. E. Pontif. 2004. Effect of nonwaxy and waxy sorghum on
growth, carcass, and glucose and insulin kinetics of growing-finishing barrows and
gilts. J. Anim. Sci. 82:1699-1706.
Travis, D. K., M. R. Tuinstra, and J. D. Hancock. 2006. Variation in nutritional
value of sorghum hybrids with contrasting seed weight characteristics and
comparisons with maize in broiler chicks. Crop Sci. 46:695-699.
50

Table 2.1. Corn- and sorghum-based diets fed to broilers chicks in West Africa (as fed
basis)
Ingredient, % d 0 to 21 d 21 to 42 d 42 to 60
Cereala 58.85 63.00 65.85
Wheat bran 10.00 10.00 7.00
Peanut meal 14.00 11.35 11.00
Fish meal 10.00 8.00 8.00
Blood meal 2.00 2.50 3.00
Bone meal 4.00 4.00 4.00
D,L-methionine 0.20 0.20 0.20
L-lysine HCl 0.20 0.20 0.20
Salt 0.50 0.50 0.50
Premixb 0.25 0.25 0.25
Total 100.00 100.00 100.00
Calculated Analysis
MEn, kcal/kg 2,805 2,835 2,892
Total Ca, % 1.22 0.90 0.96
Available P, % 0.80 0.52 0.52
CP, % 21.3 20.2 20.1
Lys, % 1.27 1.14 1.00
Met, % 0.56 0.57 0.56
Thr, % 0.88 0.74 0.77
Trp, % 0.22 0.21 0.21
DEB, mEq/kgc 169 171 170 aSorghum replacd corn on a wt/wt basis bSupplied (per kg of diet): 220 mg of Mg; 220 mg of Zn; 110 mg of Fe; 248 mg of
Cu; 33 mg of I; 77,105 IU of Vit A; 27,538 IU of Vit D; 165 IU of Vit E; 0.11 mg of
Vit B12; 8 mg of menadione; 66 mg of rivoflavin; 11 mg of thiamin; 66 mg of pantothenic acid; 275
mg of niacin; 14 mg of Vit B6; 7 mg of folic acid; 3,855 of choline; and 0.33 mg of biotin. CDEB (diet) = sodium + potassium – chloride (mEq/kg as % in diet x valence x 10,000/atomic
weight)
51

Table 2.2. Physical and chemical composition of imported corn and domestically
produced sorghums fed to broilers chicks in West Africa (as fed basis)
Item Corn Local sorghum Improved sorghum
Particles size, μma 598 615 611
Moisture, %b 9.8 8.0 7.5
Crude protein, %b 8.0 10.7 11.7
Ether extract, %b 4.8 3.6 3.6
Crude fiber, %b 1.9 2.2 1.9
Ash, %b 1.2 1.5 2.2
Nitrogen free extract, %b 74.2 74.0 73.2 aGeometric mean particle size (dgw) was determined from 100 g samples according to
AOAC procdures (1990)
52

Table 2.3. Growth performance and carcass characteristics of broiler chicks fed imported
corn and domestically produced sorghums in West Africaa
Treatment
P value
Item Corn
Local
sorghum
Improved
sorghum
SE C vs Sb LS vs ISc
d 0 to 21
ADG, g 13 12 10 1 0.001 0.09
ADFI, g 20 19 17 1 0.01 0.02
G:F, g/kg 647 635 592 24 0.09 0.11
d 0 to 42
ADG, g 28 25 22 1 0.01 0.01
ADFI, g 51 48 43 1 0.01 0.01
G:F, g/kg 547 533 514 12 0.01 0.07
d 0 to 60
ADG, g 37 35 31 1 0.001 0.001
ADFI, g 77 72 65 1 0.001 0.001
G:F, g/kg 478 488 484 10 0.28 0.73
Carcass measurements
Carcass yield, % 76.0 76.6 74.7 0.6 0.18 0.001
Gizzard weight, g 51 51 49 2 0.56 0.97
Liver weight, g 52 47 49 2 0.16 0.12
Fat weight, g 25 19 21 2 0.15 0.23 aA total of 840 chicks (280/treatment) bCorn vs sorghum cLandrace sorghum vs agronomically improved sorghum
53

CHAPTER 3 -
Effects of Sorghum Variety on Growth Performance and
Subsequent Egg Production of Layer Chicks Reared in West
Africa
54

ABSTRACT A total of 450 1-d-old layer chicks (Harco line with an initial BW of 29 g) were used
in an 18-month experiment to determine the effects of sorghum variety on growth and egg
production. There were 50 chicks/pen and three pens/treatment with feed and water
consumed on an ad libitum basis. The control diet was corn-based with fishmeal and
peanut meal used as the primary protein supplements. Sorghum was used to replace corn
on a wt/wt basis so that treatments were: 1) a corn (imported from Nigeria)-based control;
2) a locally adapted landrace variety of sorghum (Mota Galmi) with red seed, purple plant,
and 0.3 mg catechin equivalents/100 mg of grain DM; and 3) an agronomically improved
variety of sorghum (IRAT 204) with white seed, tan plant, and no detectable tannins. For d
0 to 126, there were no differences (P > 0.13) in ADG and G:F among birds fed the corn
and sorghum treatments. However, the numerical advantage in ADG for birds fed the
agronomically improved sorghum resulted in a 78 g advantage in BW (P < 0.001) at the
beginning of the laying period compared to birds fed the locally adapted sorghum. For the
laying period, birds fed the sorghum grains took fewer days (P < 0.01) to come into
production than birds fed the corn-based diet. Egg production and feed intake tended to be
greater (P < 0.1) in layers fed sorghum-based diets, however there were no differences in
average egg weight (P > 0.85) and feed conversion (P > 0.16) among birds fed corn and
the sorghums.
Keys words: Corn, Chicks, Layers, West Africa, Niger
55

INTRODUCTION Because of corn importation, high production costs are the main constraint to
poultry production in Niger (Maizama et al., 2003). In experiments undertaken in India,
sorghum varieties developed by the International Crop Research Institute for the Semi-Arid
Tropics (ICRISAT) were equal to corn in nutritional value for broilers and layers
(Parthasarathy et al., 2005). Additionally, Hancock et al. (2000) proposed that adequate
processing improved the nutritive value of sorghum in poultry and swine to levels similar to
that of corn. Consequently, with selection of good varieties and proper processing,
sorghum could play an important part in diets fed to livestock and poultry in West Africa.
However, poultry producers and extension personnel in the Sahel of West Africa have
concerns about using sorghum in layer feeds because of perceived low nutritional value of
domestically produced sorghum grain. Thus, a layers experiment was completed to
determine the nutritional value of layer diets formulated with either imported corn or locally
produced sorghum grain.
MATERIALS AND METHODS A total of 450 1-d-old layer chicks (Harco line with an average BW of 29 g) were
used in an 18-month experiment to determine the effects of diets with imported corn vs
locally produced sorghums on growth performance and egg production. There were 50
chicks/pen (3.9 m2 from d 1 to 21 and 12.5 m2 after d 21) having rice hulls as eddings.
Birds were vaccinated for Newcastle HB1/Lasota (NVD-I2) and Gumboro (nobilis gumboro
228E). Temperature inside the naturally-ventilated house averaged 21 to 32°C and 35 to
42°C at 8:00 am and 4:00 pm, respectively. Birds were allowed to consume water and feed
on an ad libitum basis. The control diet (Table 3.1) was corn-based with fishmeal and 56

peanut meal used as the primary protein supplements. The diet was formulated to exceed
recommendations for all nutrient concentrations as suggested in the 1994 NRC for poultry.
Sorghum was used to replace the corn on a wt/wt basis so that treatments were: 1) a corn
(imported from Nigeria)-based control; 2) a locally adapted landrace variety of sorghum
(Mota Galmi) with red seed, purple plant, and 0.3 mg catechin equivalents/100 mg of grain
DM; and 3) an agronomically improved variety of sorghum (IRAT 204) with white seed, tan
plant, and no detectable tannins.
Cereal grains were ground through a hammermill equipped with a screen having 1.5
mm openings. The ground cereals had particle sizes of 598, 615, and 611 µm for corn,
local sorghum, and improved sorghum, respectively. Ingredients and experimental diets
were analyzed for proximate components (DM, CP, crude fat, crude fiber, and ash),
tannins (catechin equivalents), and particle size (Table 3.2). Response criteria were live
weight at d 0, 42, 84, and 126, average daily gain (ADG), average daily feed intake (ADFI),
gain to feed ratio (G:F), age at 20% of birds laying, egg weight, egg production, and g
egg/g feed.
Data were analyzed as a randomized complete block design using the Proc Mixed
procedure of SAS. Means were separated using the orthogonal contrasts of: 1) corn vs
sorghums, and 2) local landrace vs agronomically improved sorghum.
RESULTS AND DISCUSSION Cereal grains and diets (Table 3.2) had similar particle sizes, DM, ash, ether
extract, and crude fiber, but corn had greater nitrogen free extract and sorghums had
greater crude protein. From d 84 to 126 ADG for pullets fed the improved sorghum was
greater (p > 0.01) by 1.3 g compared to birds fed either corn or local sorghum. However,
57

Average daily gain was similar (P > 0.25) for pullets fed corn vs sorghums from d-1 to 126
(Table 3.3).
Body weight from d 0 to 126 reported by Parthasarathy et al. (2005) was 1,208 g for
white Leghorn pullets, whereas our average BW at d 126 was 1,841 to 1,919 g. This
difference in weight could be explained by the fact that Leghorns are light BW strains
whereas Harco layers are heavy strains. As for the effect of our treatments, the low
content tannins (0.3 CE/100 g DM) did not affect growth. This is in agreement with results
reported by Balla (1999) and Monge (2007) who also reported that low tannin sorghum did
not depress growth performance.
Overall ADFI to d 126 was not affected (P > 0.17) by treatment for birds fed corn
and the sorghums. However, birds fed sorghum-based diets consumed more (P < 0.01)
feed to d 84. Our ADFI to d 126 (41 g) was lower than 49 g for white Leghorn layers fed
sorghum-based diets in India (Parthasarathy, 2005). The low feed intake for both corn- and
sorghum-based diets in our experiment may have been caused by heat stress. Between
30 and 35°C, a 1°C increase induces four times as much decrease in feed intake as a
change of 1°C between 10 and 20°C (McDonald, 1978). Thus, with the temperature
experienced by our birds (average of 32°C), one could expect a decrease in ADFI.
Gain:feed among birds fed the corn and sorghum treatments were similar (P >
0.14) from d 0 to 84. However, birds fed the agronomically improved sorghum had the best
G:F for d 84 to 126 (P < 0.01). Butler (1978), Carré (2000) and Hancock (2000) reported
that low tannin content in sorghum grain and adequate milling (particles sizes 598 to 615
μm) contributed to sorghum-based diets supporting similar efficiencies to those for birds
fed the corn-based diets.
58

The numerical advantage in ADG for birds fed the agronomically improved sorghum
resulted in a 78 g advantage in BW at the beginning of the laying period compared to birds
fed the locally adapted sorghum (P < 0.001). Consuming the sorghum-based diets resulted
in earlier entry into laying and greater egg production compared to consuming the corn-
based diet. This observation supports the use of sorghum to feed layers in warm and dry
environments which also are more suitable for production of sorghum vs corn. Birds fed
the sorghum grains took fewer days (P < 0.01) to come into production and during the
laying period ate more feed (P < 0.01) and produced more eggs (P < 0.01) than birds fed
the corn-based diet. There were no differences (P > 0.85) in average egg weight among
birds fed corn and the sorghums.
Age at 20% egg production was 133 to 154 for commercial layers in data reported
by Ryan et al. (1998) and ours was 133 to141 d. Sell et al. (1984) reported low egg
production in layers fed high-tannin (47%) vs those fed low-tannin sorghum-based diets
(69%). However, feed intake was similar for birds fed the two sorghums. Jacob et al.
(1996) reported egg production of 71% for layers fed corn-based diets vs 65% for birds fed
high-tannin sorghum. Egg production did not decrease when layers were fed diets with
sorghum as 32 to 50% of the diet (Nakhede et al., 1981; Gowda et al., 1984; Thakur et al.,
1985) or when sorghum was the sole cereal in the diet (Rama Rao et al., 1995; Ambula et
al., 2003; Partharathy et al., 2005).
Smith and Olivier (1972) reported egg production of 82, 79, 70, and 53% when
building temperatures were 27, 29, 32 and 35°C, respectively. In addition, Mashaly et al.
(2004) reported feed intake, egg production and egg weight at 87, 87 and 56 at thermo-
neutral conditions (24ºC); 67 83 and 54 at cyclic conditions (24 to 35ºC); and 42, 56, and
59

47 during heat stress (35ºC) in commercial laying hens. Thus, our egg production data
would be considered typical for birds exposed to heat stress.
In our experiment, egg weight and feed efficiency were similar in layers fed corn-
and sorghum-based diets (P > 0.16). Previous research reports have suggested similar
egg weight and feed efficiency in layers fed sorghum vs corn (Rama Rao et al., 1995;
Ambula et al., 2003; Partharathy et al., 2005). However, feed efficiency has been reported
to be lower in layers fed high-tannin sorghum compared to those fed low-tannin sorghum
or corn (Sell et al., 1984; Jacob et al., 1996).
From d 0 to 126, there were no differences (P > 0.80) among treatments for
mortality. Mortality averaged 5% during wk 1, 1% for wk 1 to wk 12, 4% wk 12 to wk 18
and these results are in agreement with the results reported by Balnave and Brake, (2005).
IMPLICATIONS In summary, sorghum grain was equal (if not superior) to corn as a feedstuff in diets
for layers reared in West Africa. Consequently, in the Sahel, poultry producers should not
hesitate to use locally produced sorghum grain in layer diets if it helps to cheaper their cost
of production.
60

REFERENCES Abdoulaye, T., Sanders, J., and B. Ouendeba. 2006. Quelle Céréale pour les
aliments de Volaille en Afrique de l’Ouest: Sorgho ou Maïs ? Bulletin N0 4
Marketing-Processing Project, Mars 2006, INTSORMIL/USAID West Africa, Niamey
Niger. 24p.
Ahmad, T., T. Mushtaq, U.N. Mahr, M. Sarwar, D. M. Hooge, and M. A. Mirza.
2006. Effect of non-chloride electrolyte sources on the performance of heat-
stressed broiler chickens. Br. Poult. Sci. 47:249-256.
Ambula, M. K., G. W. Oduho, and J. K. Tuitoek. 2003. Effect of high tannin and
bentonite on the performance of laying hens. Trop. Anim. Heath and Prod. 35:285-
292.
Balla, A. 1999. Etude des propriétés inter faciales du gluten et des protéines du
sorgho en vue de la planification : Thèse doct. Sci. Agron. Biol. Univ. Gembloux
Belgique.
Balnave, D., and J. Brake. 2005. Nutrition and management of heat-stressed
pullets and laying hens. World Poult. Sci. J. 61:399-405.
Butler, L. G. 1978. Tannin in Sorghum grain: problems solution, and
opportunities. J. Agric. Food Chem. 27:441-445.
Carré, B. 2000. Effets de la taille des particules alimentaires sur les processus
digestifs chez les oiseaux d’élevage. INRA Prod. Anim. 13:131-136.
Gowda, D. R., A. Devegowd, and B. S Ramappa. 1984. Effect of subabul leaf
meal (Leucocephala) and sorghum in layer diets. Ind. J. Poult. Sci. 19:180-186.
Hancock, J. D. 2000. Value of sorghum and sorghum co-products in diets for
61

livestock. PP 731-751. In: Sorghum Origin, History, Technology and Production. W.,
Smith and R. A. Fredericksen (ed.), Wiley Series Crop. Sci.
Jacob, J. P., B. N. Mitaru, P. N. Mbugua, and R. Blair. 1996. The feeding value of
Kenyan sorghum, sunflower seed cake, and sesame seed cake for broilers and
layers. Anim. Feed Tech. 61:41-46.
Maizama, D. G., F., Sanoko, A. Beidou, and A. Ganahi. 2003. Repères pour un
développement de la filière avicole moderne au Niger. Minist. Anim. Resour.
Niamey, Niger.
Masahly, M. M., G. L. Hendricks, M. A. Kalama, and A. E. Gehad. 2004. Effects of
heat stress on production parameters and immune responses of commerci al layers.
Poult. Sci. 83:889-894.
Monge, C. R., J. D. Hancock, C. Feoli, S. Bean and S. Beyer. 2007. Effects of
tannin concentration on nutritional value of sorghum grain in broiler chicks. J. Anim.
Sci. 85(Suppl.1):589(abstract).
Narkhede, P. N., M. R. Kaduskar, and V. R. Tatte. 1981. Replacement of maize
by sorghum (jowar grain) in layer rations. Indian J. Poult. Sci. 16:403-406.
NRC. 1994. Nutrient Requirement of Poultry. 4th Revised Ed. Natl.
Acad. Press, Washington, DC.
Parthasarathy, P. R., K. R. Gurava, V. S. Reddy, and C. L. Gowda. 2005. Linking
producers and processors of sorghum for poultry feed: A case study from India. Int.
lnst. Crop. Res. Inst. Semi Arid Trop. (ICRISAT),
www.globalfoodchainpartnerships.org.
Rama Rao, S. V., J. N. K. Prahra, G. Shyam Sundar, M. M. Chawak, and S. K.
62

Mishra. 1995. Replacement of yellow maize with tannin free sorghum in white
leghorn layer diets. Ind. J. Poult. Sci. 30:76-78.
Ryan, A. M., and M. A. Latour. 1998. Commercial egg production and
processing. AS-545-W. Dept. Anim. Sci. Purdue Univ. West Lafayette, IN.
ag.ansc.purdue.edu/poultry/.../commegg/Full line.
Sell, D. R., J. C. Rogler, and W. R. Featherston. 1984. The effect of sorghum tannin
and methionine levels on the performance of laying hens maintained in two
temperature environments. Poult. Sci. 62:2420-2428.
Smith A. J. and J. Olivier. 1972. Some nutritional problems associated with egg
production at high environmental temperature. Rhod. J. Agric. Res. 5:259-270.
Thakur, R. S., P. C. Gupta, and G. P. Lodhi. 1985. Feeding values of different
varieties of sorghum in broiler rations. Indian J. Poult. Sci. 19:103-107.
63
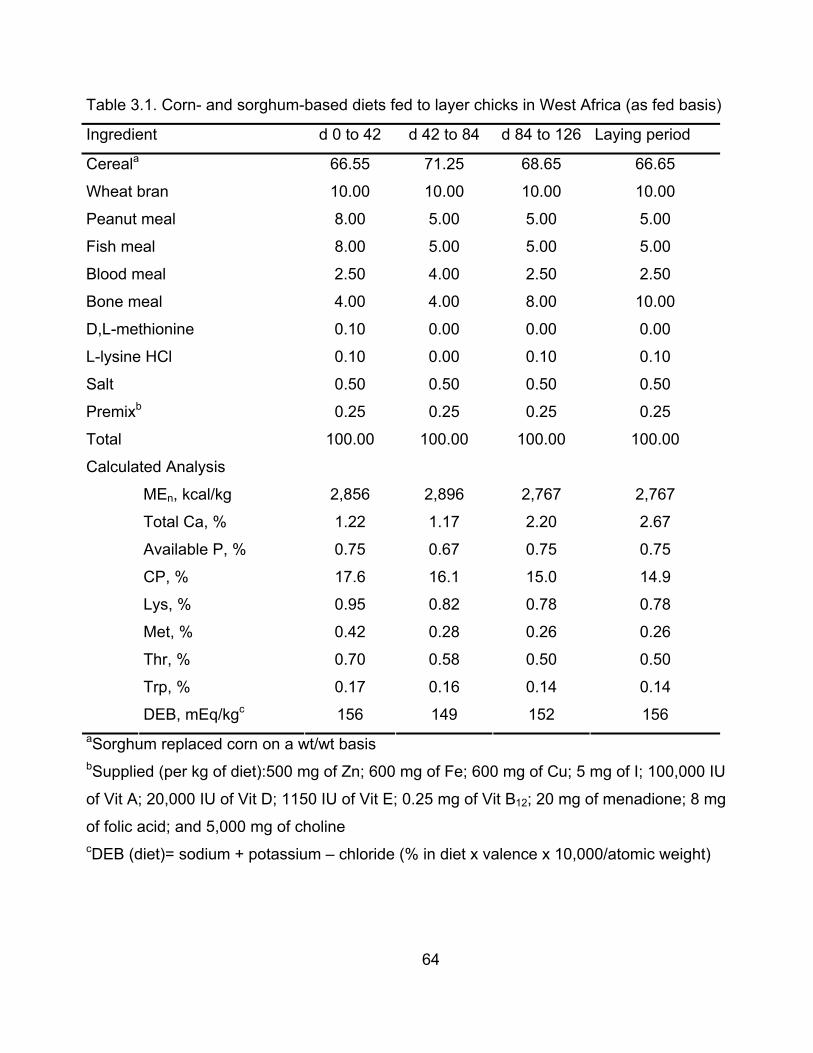
Table 3.1. Corn- and sorghum-based diets fed to layer chicks in West Africa (as fed basis)
Ingredient d 0 to 42 d 42 to 84 d 84 to 126 Laying period
Cereala 66.55 71.25 68.65 66.65
Wheat bran 10.00 10.00 10.00 10.00
Peanut meal 8.00 5.00 5.00 5.00
Fish meal 8.00 5.00 5.00 5.00
Blood meal 2.50 4.00 2.50 2.50
Bone meal 4.00 4.00 8.00 10.00
D,L-methionine 0.10 0.00 0.00 0.00
L-lysine HCl 0.10 0.00 0.10 0.10
Salt 0.50 0.50 0.50 0.50
Premixb 0.25 0.25 0.25 0.25
Total 100.00 100.00 100.00 100.00
Calculated Analysis
MEn, kcal/kg 2,856 2,896 2,767 2,767
Total Ca, % 1.22 1.17 2.20 2.67
Available P, % 0.75 0.67 0.75 0.75
CP, % 17.6 16.1 15.0 14.9
Lys, % 0.95 0.82 0.78 0.78
Met, % 0.42 0.28 0.26 0.26
Thr, % 0.70 0.58 0.50 0.50
Trp, % 0.17 0.16 0.14 0.14
DEB, mEq/kgc 156 149 152 156 aSorghum replaced corn on a wt/wt basis bSupplied (per kg of diet):500 mg of Zn; 600 mg of Fe; 600 mg of Cu; 5 mg of I; 100,000 IU
of Vit A; 20,000 IU of Vit D; 1150 IU of Vit E; 0.25 mg of Vit B12; 20 mg of menadione; 8 mg
of folic acid; and 5,000 mg of choline cDEB (diet)= sodium + potassium – chloride (% in diet x valence x 10,000/atomic weight)
64

Table 3.2. Physical and chemical characteristics of imported corn and domestically
produced sorghums fed to layer chicks in West Africa (as fed basis)a
Item Corn Landrace sorghum Improved sorghum
Particles size, μma 598 615 611
Moisture, %b 9.8 8.0 7.5
Crude protein, %b 8.0 10.7 11.7
Ether extract, %b 4.8 3.6 3.6
Crude fiber , %b 1.9 2.2 1.9
Ash, %b 1.2 1.5 2.2
Nitrogen free extract, %b 74.2 74.0 73.2 aGeometric mean particle size (dgw) was determined from 100 g samples according to
ASAE (1983) bAOAC (1990)
65

Table 3.3. Growth and laying performance of poultry fed imported corn and domestically
produced sorghums in West Africaa
Treatment P value
Item
Corn
Local
sorghum
Improved
sorghum
SE C vs Sc LS vs ISd
d 0 to 42 BW, ga 363 363 360 6 0.92 0.72 ADG, g 8.0 8.0 7.9 0.2 0.60 0.43 ADFI, g 16.0 16.7 16.0 0.4 0.51 0.28 G:F, g/kg 503 473 483 16 0.81 0.25 d 42 to 84 BW, g 1,119 1,102 1,114 6 0.16 0.17 ADG, g 18.0 17.7 17.7 0.3 0.64 0.43 ADFI, g 38.7 40.3 42.3 1.0 0.04 0.15 G:F, g/kg 467 440 427 15 0.12 0.16 d 84 to 126 BW, g 1,854 1,841 1,919 10 0.03 0.01 ADG, g 17.7 17.7 19.0 0.3 0.05 0.05 ADFI, g 55.3 56.3 56.3 0.8 0.61 0.39 G:F, g/kg 317 310 340 4 0.05 0.28 d 0 to 126 BW, g 1,854 1,841 1,919 10 0.01 0.01 ADG, g 14.7 14.3 15.0 0.3 0.15 0.37 ADFI, g 39.7 40.7 41.1 0.6 0.09 0.52 G:F, g/kg 397 380 393 6 0.43 0.07 Mortality d 0 to 126, % 9.9 10.5 12.5 2.0 0.51 0.52 20% egg production, d 141 133 135 2 0.01 0.43 ADFI, g 70 79 77 7 0.02 0.54 Laying rate, % 46.6 56.2 55.1 4.7 0.01 0.65 Egg weight, g 49 49 49 2 0.85 0.98 FC, feed/egg 3.28 3.05 2.96 0.45 0.16 0.23aA total of 450 chicks (150/treatment) bBW = Live body weight
66
cCorn vs sorghums; dLocally adapted sorghum vs the agronomically improved sorghum

CHAPTER 4 -
Effects of Sorghum and Particle Size on Growth and Carcass
Characteristics of Broiler Chicks Reared in West Africa
67

ABSTRACT A total of 2,000 1-d-old chicks (with an average BW of 41 g) were used in a regional
experiment to determine the effects of cereal grain and particle size on growth and carcass
characteristics. There were 25 chicks/pen and four pens/treatment at five stations
(Senegal, Mali, Burkina Faso, Niger, and Nigeria) with feed and water consumed on an ad-
libitum basis. For Senegal, Mali, Burkina Faso, and Niger, Cobb 500 broiler chicks were
used. In Nigeria, Arbor Acres broiler chicks were used. The control diet was corn-based
with fish meal, peanut meal, cotton seed meal, and soybean meal as the primary protein
supplements. The diet was formulated to 1.30 and 1.07% Lys for d 0 to 21, and d 21 to
42, respectively, with all other nutrients at or above NRC (1994) recommendations.
Sorghum was used to replace corn on a wt/wt basis so that treatments were cereal (corn
and sorghum grain) and particle size (the cereals ground through a 6.4-mm vs 2-mm
screen). There was no cereal*particle size interaction (P > 0.56) for growth performance.
Also, ADG (P > 0.20), ADFI (P > 0.15), and F:G (P > 0.36) were not affected by particle
size treatment. However, average daily gain (P < 0.001), and gain:feed ratio (P < 0.001)
were greater for birds fed corn-based diets vs those fed the sorghum-based diets.
Carcass weight and yield were similar for all birds (P > 0.38). In conclusion, local sorghum
had comparable nutritional value to corn in broiler chicks and in West Africa local
sorghums are a good alternative for poultry feeds when priced on expected difference in
rate and efficiency of grain
Keys words: Sorghum, Corn, Particle Size, Poultry, West Africa
68

INTRODUCTION Corn is the main cereal used for poultry diets in West Africa (Abdoulaye, 2006).
Yet, sorghum is produced extensively in Sahelian countries like Senegal, Mali, Burkina
Faso, Niger, and Nigeria and could play an important role in poultry feed (Parthasarathy et
al., 2005; Issa et al., 2007). Many studies have demonstrated that tannin-sorghums reduce
feed intake, rate of gain, and efficiency in broilers (Sell et al., 1985; Douglas et al., 1990;
Hancock, 2000). Butler et al. (1992) suggested that these negative effects resulted from
the ability of tannins to bind and precipitate proteins including grain proteins and digestive
enzymes. Yet, it is well established that cereal type (e.g. corn vs sorghum) does not affect
gastrointestinal tract or intestinal morphology measurements in poultry (Donald et al.,
2008). Furthermore, sorghum can be used as the sole grain source in either broiler or layer
diets without compromising performance (Cramer et al., 2003; Parthasarathy et al. 2005;
Travis et al., 2006; Nyannor et al., 2007).
Physical kernel characteristics (eg., seed size and texture), production environment,
and processing are major factors recognized to induce variation in sorghum-based diets
for poultry (Wondra et al., 1992; Hancock, 2000, Oria et al., 2000). Research results are
consistent in showing that sorghum grain, when ground finely, has similar nutritive value to
that of corn (Healy et al., 1994; Hancock, 2000) and wheat (Mikkelson et al., 2008; Perez-
Maldonado et al., 2008). Unfortunately, data from comparisons of corn vs sorghum,
especially when processed differently to maximize nutrient digestibility of the two cereals,
are not available in West Africa. Thus, the goal of the experiment reported herein was to
determine the nutritional merits of diets based on corn and locally produced (non-tannin)
sorghums when the cereals were milled to different particle sizes.
69

MATERIALS AND METHODS A common protocol was used in experiments at five sites that included the Regional
College of Science and Veterinary Medicine (EISMV), Dakar, Senegal; the Institute of
Rural Economy (IER), Bamako, Mali; the National Institute for Environment and
Agricultural Research (INERA) Bobo-Dioulasso, Burkina Faso; the Abdou Moumouni
University (UAM) Niamey, Niger; and the University of Maiduguri (UNIMAID) Maiduguri,
Nigeria. At each site, 400 1-d-old broiler chicks were randomly allocated to 16 pens (25
birds/pen) with four pens per treatment and four treatments for a total of 2,000 birds. The
control diet was corn-based with fish meal, peanut meal, cotton seed meal, and soybean
meal used as protein supplements (Table 4.1). It was very important that the diets were as
similar as possible across locations with the only differences being the cereal grain
treatments. Thus, a supplement of all ingredients except the cereal grain was made in
Senegal. Allotments of this supplement were transported to each experiment station and
mixed with the appropriate amount of cereal grain to form the finished diets. The
supplement was based on the 1994 NRC for poultry with essential amino acids at least
115%, vitamins at least 150%, Ca, available P, Na, and Cl at leat 115%, and other
minerals at least 115% of NRC recommendations. Also, electrolyte balance (Na + K – Cl)
was adjusted to 240 mEq/kg and a coccidiostat and antibiotic were added to all diets.
To produce the cereal grain treatments, corn and sorghum were ground through a
hammermill equipped with 6.4 vs 2 mm screens. The corn was white, and the local
sorghum was white and tannin free (purchased at the local market in Burkina Faso and
Senegal, Niatitema in Mali, Sepon 82 in Niger, and Chakara white in Nigeria). In Senegal,
Mali, Burkina Faso, and Niger Cobb-500 broiler chicks were used. Arbor Acres broiler
70

chicks were used in Nigeria. Birds were vaccinated for Newcastle HB1/Lasota (NVD-I2)
and Gumboro (nobilis gumboro 228E). The birds were bedded on deep litter in open-sided
buildings with 12-m2/pens. The buildings were naturally ventilated while temperature and
humidity ranged from 24 to 29°C and 76 to 91% in the mornings, and from 31 to 37°C and
56 to 70% during the afternoons (Figure 1).
The control diet was formulated to 1.29 and 1.15% Lys for d 0 to 21 and d 21 to 42,
respectively. Sorghum was used to replace the corn on a wt/wt basis so that treatments
were cereal source corn vs sorghum and particle size (cereals ground through 6.4 vs 2-
mm screens). The birds were allowed to consume feed and water on an ad-libitum basis.
They were weighed at d 0, 21, and 42 with ADG, ADFI, and G:F as response criteria. At
the end of the experiment, 12 birds per pen were randomly chosen and killed for carcass
evaluation. Weights of the live bird, carcass, gizzard, liver, mesenteric fat and empty
intestines were recorded. Additionally, gizzards were opened and scored for lesions on a
scale of 0 (none) to 5 (severe). Samples of the cereals and diets were analyzed for dry
mater, ash, crude fat, crude fiber, and crude protein using AOAC (1990) procedures (Table
4.2). Additionally, the cereal grains were evaluated for kernel diameter, weight, and
hardness (Bean et al., 2006) and tannins (Butler et al., 1978).
All growth and carcass data were analyzed as a randomized complete block with a
2x2 factorial arrangement of treatments using the Proc Mixed procedure of SAS. Live
weight was used as a covariate for carcass data analysis.
71
RESULTS AND DISCUSSION
The present study is the first regional project in West Africa conducted through a
network representing the combined effort of EISMV, IER, INERA, UAM, INRAN, UMAID,
and KSU. The objective especially was to evaluate local sorghums fed to broiler chicks.
Sorghum grain was bought at local markets in Burkina Faso and Senegal while they were
chosen by scientists at IER in Mali, INRAN in Niger, and UNMAID in Nigeria. The cereal
grains (Table 4.2) were similar for dry mater, ash, and crude fiber, but corn had greater
nitrogen free extract and fat, and sorghums had greater crude protein. The corn used at
various sites was white and had similar seed weight (24.9 ± 1.7g/100 seeds), DM (89.7 ±
0.3%), CP (7.6 ± 0.2), and NFE (74.8 ± 0.2). At all sites sorghum grain was white, tannin-
free, and with seeds weighing 2.3 g/100 seeds, and with a seed diameter of 1.9 mm. Other
sorghum characteristics included DM of 89.6 ± 1.1%, CP of 9.1 ± 0.5%), fat of 2.5 ± 0.2%,
CFof2.4 ± 0.2, ash of 2.0 ± 0.1, NFE of 74.0 ± 0.7%), and hardness of 92 ± 13).
No cereal*particle size interactions were observed (P > 0.67) for ADG, ADFI, or
G:F. Also, ADG, ADFI and G:F were not affected by particle size (P > 0.15). However,
ADG was greater (P < 0.001) in birds fed corn-based diets than for birds fed sorghum-
based diets. Average daily gains at d 21, (31 g for corn and 29 g sorghum) were similar to
data from Donald et al. (2008) who reported ADG of 33 g for corn-based, 31 g for wheat-
based, and 30 g for sorghum-based diets. The resulting ADG for birds fed sorghum in our
experiment were similar to those reported by Cramer et al. (2003) with ADG of 32 g at d 21
for birds fed mash, crumbled and pelleted sorghum-based diets.
72
Elkin et al. (2002) reported ADG at d 21 of age of 38 g for corn and 38 g for
experimental sorghum. Similarly, Nyannor et al. (2007) reported ADG of 34 g for chicks fed

corn vs 35 g for birds fed experimental sorghums for 21 d. In addition, Travis et al. (2006)
reported ADG of 45 g for chicks fed corn and 45 g for birds fed nine high digestibility
sorghum hybrids for 21 d whereas Perez-Maldonado (2008) reported ADG of 44 g for
broiler chicks fed wheat-based vs 39 g for those fed sorghum-based diets for 21 d.
In the hot and humid environments of Africa, Kyarissiima et al. (2004) reported ADG
of 25 g for chicks fed corn vs 11 g for chicks fed sorghum with 4% tannins for 21 d.
Similarly, Nyamambi et al. (2007) reported ADG at 21 d as 15 g for chicks fed corn, 16 g
for chicks fed sorghum with 0.07% tannins, and 15 g for chicks fed sorghum with 0.2 to
2.48% tannins. Issa et al. (2007) reported ADGs to d 21 as 13 g for chicks fed corn and 12
g for chicks fed sorghum with 0.3% tannins.
For d 0 to 21, ADFI was not affected by cereal*particle size interactions (P > 0.70),
or the main effects of corn vs sorghum (P > 0.33) or particle size (P > 0.15). However, our
ADFI for d 0 to 21 were similar to data reported by Elkin et al. (2002) with 53 g for chicks
fed corn and 54 g for chicks fed sorghum. Recent research reported feed intakes of 46 g
for chicks fed corn and 47 g for chicks fed sorghum (Nyannor et al., 2007), 42 g for chicks
fed corn and 38 g for chicks fed sorghum with 4% tannins (Kyarissiima et al., 2004), 39 g
for chicks fed corn and 38 g for chicks fed sorghum with 0.2 to 2.48% tannins (Nyamambi
et al., 2007); and 20 g for chicks fed corn vs 19 g those fed sorghum with 0.3% tannins
(Issa et al., 2007). Travis et al. (2006) reported ADFI of 59 g for chicks fed corn and 62 g
birds fed sorghum for 21 d and Perez-Maldonado (2008) reported ADFI of 60 g for birds
fed wheat vs 57 g for birds fed sorghum for 21.
The G:F for d 0 to 21 was greater (P < 0.001) for birds fed corn vs those fed
sorghum. However particle size did not affect G:F (P > 0.15). Our G:F for d 0 to 21(605
73

g/kg for corn and 565 g/kg for sorghum) was lower than those reported by Elkin et al.
(2002) of 702 g/kg for birds fed corn and 712 g/kg for birds fed sorghum. Also, Nyannor et
al. (2007) and Perez-Maldonado (2008) reported higher G:F (725, 690, and 768 g/kg for
birds fed corn, wheat and sorghum) whereas G:F ranging from 393 to 596 g/kg for corn
and 357 to 586 for sorghum were reported by Kyarissiima et al. (2004) and Nyamambi et
al. (2007).
ADG for d 0 to 42 was greater (P < 0.001) for birds fed corn vs those fed sorghum.
However, ADG was not affected by particle size (P > 0.23). Elkin et al. (2002) reported for
d 0 to 42 ADG of 58 g for birds fed corn sorghums for 42 d. Perez-Maldonado (2008)
reported similar ADG of (75 vs 73 g) in broilers chicks fed wheat-based and sorghum-
based diets, for 42 d. In the hot and dry environments of West Africa, Issa et al. (2007)
reported ADG of 28 g for chicks fed corn and 25 g for chick fed sorghum with 0.3% tannin
for 42 d.
Particle size did not affect ADG in our experiment. These results are in contrast with
those of Healy et al. (1994) who reported ideal particle sizes of 700 and 500 µm for corn
and sorghum. However, reducing particle size did not improve ADG in experiment by
Reece et al. (1986), Deaton et al. (1995), and Pearson et al. (2006).
In our experiment, ADFI for d 0 to 42 was 89 g for birds fed corn and sorghum.
These ADFI are higher than the 61g for corn and sorghum as reported by Nyamambi et al.
(2007), the 51 and 48 g for birds fed corn vs low-tannin (0.3%) sorghum as reported by
Issa et al. (2007), and 62 g in birds fed mash or hydro-thermally treated sorghum-based
diets as reported by Cramer et al. (2003). However, our ADFI were lower than the 100 g
for bird fed corn vs 102 g for birds fed sorghum (Elkin et al., 2002).
74
As for ADG and ADFI, there was no cereal particle size interaction for G:F (P >
0.75). Yet, G:F was greater (P < 0.001) for birds fed corn based-diets vs those fed the
sorghum-based diets (P < 0.01). Our sorghum was tannin free. However grain hardness
(97) and the large particle sizes in this study may partially be responsible for feed
efficiency differences observed in corn and sorghum-based diets. Particle size did not
affect G:F (P > 0.67).
Because of the high ADFI in our experiment, G:F for d 0 to 42 was only 532 g/kg for birds
fed corn and 505 g/kg for birds fed sorghum-based diets. These values were lower than
the 571 g/kg for bird fed corn and 565 g/kg for birds fed sorghum as reported by Elkin et
al. (2002) and the 567 g/kg for birds fed corn and 554 for bird fed sorghum as reported by
Nyamambi et al. (2007). Furthermore, Cramer et al. (2003) reported G:F of 569 and 575
g/kg for birds fed sorghum crumbles, whereas Perez-Maldonado et al. (2008) reported
G:F of 550 g/kg for birds fed wheat and 555 g/kg for those fed sorghum.
Weight of carcass, carcass yield, and weights of fat, gizzard, liver, and intestine
were not affected by a cereal*particle size interaction or the main effects of cereal, and
particle size (P > 0.14). Also, all gizzards were normal without occurrence of ulceration. In
contrast, Parsons et al. (2006) reported improved nutrient retention in broilers fed corn-
based diets when corn particles size was increased from 781 to 1,042 µm. However,
growth performance and ME were decreased when corn particle size exceeded 1,042 µm
because of an increase in size and maintenance requirements for the gastrointestinal tract.
IMPLICATIONS Birds fed corn-based diets had greater growth performance compared to birds fed
sorghum-based diets. Carcass characteristics were similar for birds fed the cereals. Thus,
75

tannin free sorghum had nutritional value comparable to that of corn and in West Africa
local sorghum is a good alternative for poultry feeds when slight discount are applied for
the differences in ADG ad G:F.
76

REFERENCES Abdoulaye T., J. Sanders, and B. Ouendeba. 2006. Which grain for poultry feed
in West Africa: sorghum or corn? Bulletin N° 4, Marketing-Processing Project.
INTSORMIL/USAID West Africa, Niamey, Niger. 24p.
AOAC. 1990. Official Methods of Analysis. 15th ed. Assoc. Offic. Anal. Chem., Arlington,
VA.
Bean, S. R., O. K. Chung, M. R. Tuinstra, J. F. Pederson, and J. Erpelding. 2006.
Evaluation of a single kernel characterization system (SKCS) for measurement of
sorghum grain attributes. Cereal Chem. 83:108-113.
Butler, L. G. 1978. Tannin in Sorghum grain: problems solution, and
opportunities. J. Agric. Food Chem. 27:441-445.
Cao, H., J. D. Hancock, R. H. Hines, K. C. Behnke, JC Park, B. W. Senne, J. R.
Froetschener, J. M. Jiang, and S. L. Johnston. 1998. Effect of sorghum starch type,
endosperm hardness, and processing on digestibility and growth performance in
finishing pigs and chickens. KS State Univ. Swine Day. Report Prog. 819:256-260.
Cramer, K. R., K. J. Wilson, J. S. Moritz, and R. S. Beyer. 2003. Effect of
sorghum-based diets subject to various manufacturing procedures on broiler
performance. J. Appl. Poult. Res. 12:404-410.
Dale, N. M., and H. L. Fuller. 1979. Effects of diet composition on feed intake and
growth of chicks under heat stress. 1. Dietary fat levels. Poult. Sci. 58:1529-1534.
Deaton, J. W., B. D. Lott, and S. L. Branton. 1995. Corn grind size and broilers reared
under two temperature conditions. J. Appl. Poult. Res. 4:402-406.
Donald, V. T., and V. Ravindran. 2008. Effect of cereal type on the performance,
77

gastrointestinal tract development and intestinal morphology of the newly hatched
broiler chicks. J. Poult. Sci. 45:45-50.
Elkin, R. G., E. Arthur, B. R. Hamaker, J. D. Axtell, M. W. Douglas, and C. M.
Parsons. 2002. Nutritional value of a highly digestble sorghum cultivar for meat-
type chickens. J. Agric. Food Chem. 50:4146-4150.
Hancock, J. D. 2000. Value of sorghum and sorghum co-products in diets for
livestock. PP 731-751. In: Sorghum Origin, History, Technology and Production. W.
Smith and R. A. Fredericksen (ed.), Wiley Series Crop. Sci.
Effects of corn particle size and pellet texture on broiler performance in the growing
phase. J. Appl. Poult. Res. 15:245-255.
Issa S., J. D. Hancock, M. R. Tuinstra, I. Kapran, and S. Kaka. 2007. Effects of
sorghum variety on growth and carcass characteristics in broiler chicks reared in
West Africa. J. Poult. Sci. Vol 86(Suppl. 1):69(abstract).
Kyarissiima, C.C., M. W. Okot, and S. Svihus. 2004. Use of wood ash in the
treatment of high tannin sorghum for poultry feeding. South. Afric. J. Anim. Sci.
34:110-115.
Lu, Q., J. Wen, and H. Zang. 2007. Effect of chronic heat exposure on fat deposition and
meat quality in two genetic types of chicken. Poult. Sci. 86:1059-1064.
Mikkelsen, L. L., S. Yan, J. P. Goopy, and P. A. Ili. 2008. Effect of grain type and
particle size on growth performance and intestinal microbial populations in broiler
chickens. Proc. XXIII World Poult. Sci. Assoc. June 30th to July 4th, 2008, Brisbane.
Mitchell, M. A., and C. Goddard. 1990. Some endocrine responses during heat stress
induced depression of growth in young domestic fowl. Proc. Nutr. Soc. 49:129-135.
78
Mongin, P. 1981. Recent advances in dietary cation-anion balance. Applications in
poultry. Proc. Nutr. Soc. 40:285-294.
Moreira, J., A. M. Mendes, E. A. Garcia, R. P. de Oliveira, R. G. Garcia, and I. C. L. de
Almeida. 2003. Evaluation of performance, carcass yield and breast meat quality in
broilers of conformation versus conventional strain. Rev. Bras. Zootec. 3:1663-
1673.
NRC. 1994. Nutrient Requirement of Poultry. 4th Revised Ed. Natl.
Acad. Press, Washington, DC.
Nyamambi, B., N. R. Ndlovu, Y. S. Naik, and N. D. Kock. 2007. Intestinal growth of broiler
chicks fed sorghum-based diets differing in condensed tannin levels. South. Afric.
J. Anim. Sci. 37:202-214.
Nyannor, E. K. D., S. A. Adedokum, B. R. Hamaker, G. Ejeta, and O. Adeola.
2007. Nutritional evaluation of high-digestible sorghum for pigs and broiler chicks. J.
Anim. Sci. 8:196-203.
Oria, M.P., B. R. Hamaker, J. D. Axtell, C. H. Huang. 2000. A high digestible
mutant cultivar exhibits a unique folded structure of endosperm protein body. Proc.
Natl. Acad. Sci. 10:5065-5070.
Oria, M.P., B. R. Hamaker, and J. M. Shull. 1995. Resistance of sorghum α-, β-,
and λ-kafirins to pesin digestion. J. Agric. Food Chem. 43:2148-2153.
Parthasarathy, P. R., K. R. Gurava, V. S. Reddy, and C. L. Gowda. 2005.
Linking producers and processors of sorghum for poultry feed: A case study from
India. Int. lnst. Crop. Res. Inst. Semi Arid Trop. (ICRISAT),
www.globalfoodchainpartnerships.org.
79

Perez-Maldoado, R. A. 2008. Chicken meat production in Australia using
sorghum-based diets: Problems and solutions. Proc. XXIII. World Poult. Cong.
World Poult. Sci. Asso. June 30th to July 4th, Brisbane.
Price, M. L., Van Scoyoc, S., and L. G. Butler. 1978. A critical evaluation of the vanillin
reaction as an assay for tannin in sorghum grain. J. Agric. Food Chem. 26:1214-
1218.
Reece. N., McNaughton, J. L., and B. D. Lott. 1986. Responses of broilers chicks to
dietary energy and lysine levels in a warm environment. Poult. Sci. 63:1170-1174.
Rosa, P.S., D.E. Faria Filho, F. Dahke, B.S. Vieira, M. Macari, and R.L. Furlan. 2009.
Performance and carcass characteristics of broiler chickens with different growth
potential and submitted to heat stress. Braz. Poult. Sci. 9:181-186.
Travis, D. K., M. R. Tuinstra, and J. D. Hancock. 2006. Variation in nutritional value of
sorghum hybrids with contrasting seed weight characteristics and comparisons with
maize in broiler chicks. Crop. Sci. 46:695-699.
Wondra, K. J., R. A. McCoy, J. D. Hancock, K.C. Behnke, R. H. Hines, C. H.
Fahrenholz, and G. A. Kennedy. 1992. Effect of diet form (pellet vs meal) and
particle size on growth performance and stomach lesions in finishing pigs. J. Anim.
Sci. 70(Suppl. 1):239 (abstract).
80

81
Table 4.1. Diets fed to broiler chicks in Senegal, Mali, Burkina Faso, Niger, and Nigeriaa
Ingredient, % d 0 to 21 d 21 to 42
Cereal grain b 57.30 60.56Peanut meal 5.00 5.00Fish meal 10.00 5.00Cottonseed meal 3.00 3.00Soybean meal 21.55 22.77D,L-methionine 0.26 0.15L-lysine HCl 0.00 0.25L-threonine 0.05 0.10Salt 0.22 0.15CaCO3 (38% Ca) 1.00 1.00Dicalcium phosphate 0.75 1.20Sodium bicarbonate 0.33 0.37Vit-min premixc 0.34 0.25Coccidiostatd 0.10 0.10Antibiotice 0.10 0.10Total 100.00 100.00Calculated analysis
MEn, Kcal/kg 2,889 2,888Total Ca, % 1.15 1.04Available P, % 0.52 0..40CP, % 23.78 21.61Lys, % 1.29 1.15Met, % 0.64 0.50Thr, % 0.92 0.86Trp, % 0.28 0.26DEB, mEq/kgf 244 240
a2,000 broiler chicks used (500 chicks/treatment) bSorghum replaced corn on a wt/wt basis cSupplied (per kg of diet): 220 of mg of Mg; 220 mg of Zn; 110 mg of Fe; 248 mg of Cu; 33
mg of I; 77,105 IU of Vit A; 27,538 IU of Vit D; 165 IU of Vit E; 0.11 mg of Vit B12; 8 mg of
menadione; 66 mg of riboflavin; 11 mg of thiamin; 66 mg of d-pantothenic acid; 275 mg of
niacin; 14 mg of Vit B6; 7 mg of folic acid; 3,855 mg of choline; and 1.13 mg of biotin dProvided 2 g of Coban per kg of feed eProvided 0.9 g of tylosin per kg of feed. fDEB (diet) = sodium DEB + potassium DEB – chloride DEB (mEq/kg) = % in diet x
valence x 10,000/atomic weight)

Table 4.2. Chemical and physical characteristics of cereals and base premix fed to broiler chicks in Senegal, Mali,
Burkina Faso, Niger, and Nigeriaa
Kernel characteristics %
Cereal Site Seed
color
Diameterb,
mm
Seed
wt, g
Hardnessb
Tanninsc
DM
CP
EE
CF
Ash
NFE Senegal White 23.03 - - 89.77 7.49 3.54 2.12 1.94 74.68
Mali White - 28.56 - - 89.69 7.82 3.43 2.00 1.74 74.70
Burkina White - 25.56 - - 89.92 7.27 3.60 2.46 1.94 74.66
Niger White - 23.40 - - 90.48 7.60 3.30 2.83 1.51 75.51
Nigeria White - 34.80 - - 90.83 7.79 3.50 2.81 1.22 75.50 Corn Mean - 26.96 - - 90.14 7.59 3.47 2.44 1.67 75.01
Senegal White 1.94 2.31 106.30 ND 89.48 9.49 2.79 2.26 2.03 72.91
Mali White 1.75 1.82 87.41 ND 87.92 8.17 2.50 1.45 1.90 73.90
Burkina White 1.74 2.22 112.38 ND 90.07 9.51 2.55 1.81 2.15 74.04
Niger White 1.92 1.74 83.32 ND 91.07 9.16 2.19 2.72 2.04 74.96
Nigeria White 2.21 3.55 70.65 ND 90.90 9.32 2.22 2.26 2.11 74.98
Sorghum
Mean 1.91 2.33 92.01 ND 89.89 9.13 2.45 2.10 2.05 74.16
Premixd d 0 to 21 - - - - 91.52 44.39 4.21 7.32 16.96 18.65
Premixd d 21 to 42 - - - - 91.54 41.98 3.12 8.99 14.77 22.69 a2,000 broiler chicks used (500 chicks/treatment) bDetermined using SKCS (Bean et al., 2006) cDetermined using HCl-vanillin method (Butler and Fisher, 1978) dAll ingredients in the diet except the cereal
82

Table 4.3. Growth performance for broiler chicks fed corn- or sorghum-based diets with different particle sizes in Senegal,
Mali, Burkina Faso, Niger, and Nigeriaa
Corn Sorghum P-value
Item 6.4 mm 2 mm 6.4 mm 2 mm SE Cereal ( C ) Particle size (P) C*P
Particle size, µmb 934 643 953 729 52 - - -
d 0 to 21
ADG, g 31 30 29 28 2 < 0.001 0.20 0.87
ADFI, g 52 52 52 51 2 0.33 0.15 0.73
G:F, g/kg 590 584 558 551 16 < 0.001 0.36 0.93
d 0 to 42
ADG, g 47 46 45 45 2 0.001 0.25 0.67
ADFI, g 89 88 89 89 5 0.65 0.23 0.70
G:F, g/kg 522 527 503 502 10 < 0.001 0.67 0.56 aA total of 2,000 chicks (400/treatment) bGeometric mean particle size (dgw) was determined from 100 g samples
83

84
Table 4.4. Carcass characteristics for broiler chicks fed corn- or sorghum-based diets with different particle
sizes in Senegal, Mali, Burkina Faso, Niger, and Nigeriaa
Corn Sorghum P-value
Item 6.4 mm 2 mm 6.4 mm 2 mm SE Cereal ( C ) Particle size (P) C*P
Particle size, µmb 934 643 953 729 52 - - -
Carcass, g 1,505 1,510 1,509 1,517 11 0.61 0.56 0.88
Yield, % 73.4 73.8 73.8 74.4 0.6 0.38 0.40 0.83
Fat, g 24 22 23 25 1 0.49 0.87 0.14
Gizzard, g 42 41 40 38 2 0.21 0.25 0.68
Liver, g 44 42 43 42 2 0.67 0.47 0.66
Intestine, g 48 47 46 47 1 0.44 0.86 0.39
aA total
of 2,000 chicks (400/treatment)
bGeometric mean particle size (dgw) was determined from 100 g samples according to ASAE (1983)

26.3
27.926.9
26.226.9 27.5
33.0 32.9 32.932.0
33.3 32.8
60 63
67 68
63 65
77 79 82 83
80 80
-
10
20
30
40
50
60
70
80
90
100
0.0
5.0
10.0
15.0
20.0
25.0
30.0
35.0
40.0
45.0
d 0 to 7 d 7 to 14 d 14 to 21 d 21 to 28 d 28 to 35 d 35 to 42
Hum
idity
, %
Tem
pera
ture
, °C
Bird Age
T°C min
T°C max
Rh min
Rh max
Figure 4.1. Temperature and humidity in naturally ventilated open-sided poultry
houses in Senegal, Mali, Burkina Faso, Niger, and Nigeria
85

Appendix A - Effects of Abrupt Changes from Corn- to Sorghum-
Based Diets on Growth Performance in Finishing Pigs
86

ABSTRACT
A total of 208 pigs (104 barrows and 104 gilts) were used in a 28-d growth
assay to determine the effects of abrupt changes from corn to sorghum and
sorghum to corn in diets for finishing pigs. The pigs (average initial BW of 92.0
kg) were allotted by sex, weight, and ancestry to 16 pens (13 pigs/pen and four
pens/treatment). All pigs were housed in a modified open-front building and
allowed to consume feed and water on an ad libitum basis. Treatments were
switching from corn to corn, corn to sorghum, sorghum to corn, and sorghum to
sorghum mid-experiment. For d 0 to 14, there were trends (P < 0.09) for pigs fed
the sorghum-based diet to have better ADG and F:G than pigs fed the corn-
based diet. However, for d 0 to 28, ADG, ADFI, and G:F were not affected (P >
0.15) by feeding either corn or sorghum. Especially noteworthy was the lack of
interactions for d 0 to 14 vs 14 to 28 (P > 0.15) suggesting no negative effects of
changing cereal at mid-point of the growth assay. In conclusion, pigs fed
sorghum-based diets had growth performance that was similar to pigs fed corn-
based diets and there was no evidence that abrupt changes from corn to
sorghum or sorghum to corn during the finishing phase adversely affected growth
rate, feed intake, or efficiency of growth.
Key Words: Corn, Sorghum, Finishing Pigs
87

INTRODUCTION
Corn continues to be the major cereal fed to pigs in the U.S. and
throughout the world. Previous data from our laboratory (Hancock, 2000) suggest
that pigs fed sorghum-based diets (when properly milled) have growth
performance similar to that of pigs fed corn-based diets. Shelton et al. (2004)
reported that pigs fed corn, non-waxy sorghum and, waxy sorghum had similar
growth and carcass traits. Finally, Feoli et al. (2007) reported that pigs fed
sorghum-based DDGS had greater dressing percentage and lower iodine value
than those fed corn-based DDGS. However, there still are concerns about the
effects of abrupt changes among corn- and sorghum-based diets (as prices
change) on growth performance in pigs. Therefore, the objective of the
experiment reported herein was to determine the effects of an abrupt change
from corn to sorghum and vice-versa on growth performance in finishing pigs.
MATERIALS AND METHODS
A total of 208 pigs (104 barrows and 104 gilts) were used in a 28-d growth
assay. The pigs (average initial BW of 92 kg) were allotted by sex, weight, and
ancestry to 16 pens (13 pigs/pen and four pens/treatment). All pigs were housed
in a modified open-front building with 2-m x 5-m pens that had half solid and half
slatted concrete flooring. Each pen had a self-feeder and nipple waterer to allow
ad libitum consumption of feed and water. Diets (Table 1) were 80% cereal for d
0 to 14 and 85% cereal from d 14 to 28 with soybean meal, minerals, vitamins,
and amino acids added to meet or exceed all nutrient concentrations suggested
by the National Research Council (1998). Treatments were corn- and sorghum-
88

based diets that were switching from corn to corn, corn to sorghum, sorghum to
corn, and sorghum to sorghum, on d 14 of the experiment.
Corn, sorghum, and diet samples were collected and analyzed for
proximate components (AOAC, 1990) and particle size. All growth data were
analyzed as a randomized complete block design using the Proc Mixed
procedure of SAS. Orthogonal contrasts were used to separate treatment means
with comparison of corn vs sorghum for d 0 to 14, corn vs sorghum for d 14 to
28, and the interaction effect of changing cereal s mid-experiment.
RESULTS AND DISCUSSION
Cereal grains and diets (Table 5-2) had similar particle sizes, dry mater,
ash, ether extract, and crude fiber. However, corn and corn-based diets had
greater nitrogen free extract while sorghum and sorghum-based diets had
greater crude protein. Average daily gain, ADFI and G:F (Table 5-3) indicate
similar growth performance from d 0 to 28 for all treatments (P > 0.10). For d 0 to
14, there were trends (P < 0.09) for pigs fed the sorghum-based diet to have
greater ADG and G:F compared to pigs fed the corn-based diet. However, for d
0 to 28, ADG, ADFI, and G:F were not affected by feeding corn vs sorghum (P >
0.15). Additionally, there were no interactions among cereals fed for d 0 to 14 vs
14 to 28 suggesting no negative effects (P > 0.15) of an abrupt and total change
of cereal at mid-point of the finishing phase.
The similar growth performance in our experiment for pigs fed corn and
sorghum is in agreement is in agreement with data reported by Shelton et al.
(2004). In addition, Hancock (2000) reported that the use of sorghum grains in
89

diets did not decrease body weight gain in finishing pigs. The high performance
obtained with pigs fed sorghum can be explained by the relative small particle
size of the diets used in our experiment (692 μm for corn-based diet and 663 μm
for the sorghum based-diet). O’Quinn et al. (1997) also reported similar ADG,
ADFI and F:G in finishing pigs fed sorghum-based diets. In addition, our results
are in agreement with data from Nyachoti et al. (1996) who reported similar
overall body weight gain, feed intake, and G:F in broilers fed corn and sorghum
when broiler chicks were subjected to abrupt changes from corn to sorghum and
vice-versa.
IMPLICATIONS
Pigs fed sorghum-based diets had growth performance not different from
that of pigs fed corn-based diets. Additionally, there was no evidence that abrupt
changes from corn to sorghum or from sorghum to corn during the finishing
period adversely affected growth rate, feed intake, or efficiency of growth.
Consequently, sorghum grain is a good alternative feedstuff for swine producers
at any time when corn is expensive. Producers should not hesitate to make a
total substitution.
90

REFERENCES
AOAC. 1990. Official Methods of Analysis. 15th ed. Assoc. Offic. Anal. Chem.,
Arlington, VA.
Feoli, C., J. D. Hancock, C. Monge, T. L. Gugle, S. D. Carter, and N. A. Cole.
2007. Digestible energy content of corn- vs sorghum-based dried distillers
grains with soluble and their effects on growth performance and carcass
characteristics in finishing pigs. Dept. Anim. Sci. KS Univ. Swine Day
2007, www.asi.kstate.edu/DesktopModules/ViewDocument.aspx.
Hancock, J. D. 2000. Value of sorghum and sorghum co-products in diets for
livestock. PP 731-751. In: Sorghum Origin, History, Technology and
Production. W. Smith, and R. A. Fredericksen (ed.), Wiley Series Crop.
Sci.
Mushanda, J., M. Chimonio, S. M. Dzazama, and F.N. Mhlanga. 2005.
Influence of sorghum inclusion on level of performance of growing local
Mukota, Large White and their F1 crossbred pigs in Zimbabwe. Anim.
Feed Sci. Tech. 122:321-329.
NRC. 1996. Nutrient Requirements of Swine. 4th Revised Ed. Natl.
Acad. Press, Washington, DC.
Nyachoti, C. M., J. L. Atkinson, and S. Lesson. 1996. Response of broiler chicks
fed a high tannin sorghum diets. J. Appl. Poult. Res. 5:239-245.
Nyannor, E. K. D., S. A. Adedokum, B. R. Hamaker, G. Ejeta, and O. Adeola.
2007. Nutritional evaluation of high-digestible sorghum for pigs and broiler
chicks. J. Anim. Sci. 8:196-203.
91

O’Quinn, P. R., D. A. Knabe, and E. J. Gregg. 1997. Efficacy of Natuphos in
sorghum-based diets of finishing swine. J. Anim. 75:1299:1307.
Shelton, J. L., J. O. Mathews, L. L. Southern, A. D. Higbie, T. D. Bidner, J. M.
Fernandez, and J. E. Pontif. 2004. Effect of nonwaxy and waxy sorghum
on growth, carcass, and glucose and insulin kinetics of growing-finishing
barrows and gilts. J. Anim. Sci. 82:1699-1706.
92

Table A.1. Composition of corn- and sorghum-based diets fed to finishing pigsa
d 0 to 14 d 14 to 28Ingredient, %
Cerealb 79.54 84.82 Soybean meal, 47.5% CP 17.90 12.90Monocalcium phosphate 0.72 0.59Limestone 1.10 1.06L-lysine HCl 0.24 0.16D,L-methionine 0.01 - L-threonine 0.03 -Salt 0.30 0.30 Vitamins 0.04 0.04 Minerals 0.07 0.07Vitamin add packc - 0.01Antibioticd 0.05 0.05Total, % 100.00 100.00Calculated Analyses ME 3,274 3,265 Ca, % 0.60 0.55
Total P, % 0.50 0.45Available P, % 0.21 0.18CP, % 16.1 13.2Lysine, % 0.90 0.70Methionine, % 0.27 0.23Threonine, % 0.61 0.48Tryptophan, % 0.20 0.14
aA total of 208 pigs (52 pigs/treatment) with an average initial BW of 92 kg bSorghum replaces corn on a wt/wt basis cSupplied (per kg of diet): 44,060 IU of Vit A; 5,508 IU of Vit D; 176 IU of Vit E;
0.15 mg of B12; 18 mg of menadione; 33 mg of riboflavin; 110 mg of pentatonic
acid; and 22 mg of niacin dProvided 0.9 g of tylosin phosphate per kg of feed
93

94
Table A.2. Chemical composition of the feeds and ingredients fed to finishing
pigs
Cereal Diet
Item Corn Sorghum Corn Sorghum
Particles size, μma 659 658 692 663
Dry matter, %b 86.5 86.5 87.0 87.0
Crude protein, %b 7.1 9.3 13.0 14.1
Ether extract, %b 2.4 2.6 2.3 2.4
Cellulose, %b 1.9 1.7 2.2 1.9
Ash, %b 1.3 1.2 3.6 3.6
Nitrogen free extract, %b 73.8 71.7 65.9 65.0 aGeometric mean particle size (dgw) was determined from100 g samples
according to ASAE (1983) bAOAC, 1990

Table A.3. Effects of abrupt changes from corn to sorghum and vice-versa on growth performance in finishing pigsa
Treatmentb P-valuec
Item
C to C
C to S
S to S
S to C
SE
C vs S d 0 to 14
C vs S d 14 to 28
Cvs S d 0 to 14 *
C vs S d 14 to 28
d 0 to 14 ADG, g 0.99 1.04 1.07 1.11 0.04 0.07 - - ADFI, g 3.24 3.24 3.30 3.32 0.17 - - - G:F, g/kg 307 321 330 337 18 - - - d 14 to 28 ADG, g 1.07 1.12 1.07 1.00 0.03 - - - ADFI, g 3.64 3.70 3.61 3.52 0.14 - - - G:F, g/kg 295 303 298 285 7 - - - d 0 to 28 ADG, g 1.03 1.08 1.07 1.06 0.03 - - - ADFI, g 3.44 3.47 3.45 3.42 0.15 - - - G:F, g/kg 300 311 313 310 11 - - - aA total of 208 pigs (52/treatment). bC = corn and S = sorghum cDash = Non significant (P > 0.15)
95