nutrient management guide (rb209) - microsoft publication docs/rb209...soil, and explains why good...
TRANSCRIPT
Section 2 Organic materials
Updated February 2020Nutrient Management Guide (RB209)

2
AcknowledgementsFunding for the production of this section of the Nutrient Management Guide (RB209) is provided by AHDB, BBRO and PGRO.
Revision of the Fertiliser Manual (RB209) to create the Nutrient Management Guide (RB209) has been overseen by the UK Partnership for Crop Nutrient Management, which is led by AHDB.
AHDB wishes to thank all those who freely give their time to serve on the Steering Group, as well as the Arable, Horticulture and Livestock Technical Working Groups. AHDB also wishes to thank the numerous farmers and growers across the country who host trials.
Arable Technical Working Group: Agrii, AHDB, AIC, BBRO, Bunn Fertiliser Ltd, C F Fertilisers UK Ltd, Catchment Sensitive Farming, Cropwell, DAERA, Defra, Frontier Agriculture Ltd, H. L. Hutchinson Ltd, ICL, John Clarke Agronomy, K+S UK & Eire Ltd, Limex, OMEX Agriculture Ltd, PepsiCo International, PGRO, Potash Development Association, Scottish Government, Teagasc, Velcourt Ltd, Welsh Government and Yara UK Ltd.
Horticulture Technical Working Group: Agrii, Agrovista, AHDB, Bord na Mona, Bulrush, DARD, Defra, Engage Agro, Freshgro, Hortifeeds, Hutchinsons, ICL group, J&A Growers, Lucozade Ribena Suntory, New Forest Fruits, OMEX Agriculture Ltd, PGRO, Omya, SAC Consulting, Sinclair Pro, STRI, Teagasc and Welsh Government.
Livestock Technical Working Group: Agrisearch, AHDB, British Grassland Society, British Society of Plant Breeders, CF Fertilisers UK Ltd, Creedy Associates, DAERA, Defra, FACTS, Frontier Agriculture Ltd, George Fisher (Independent Consultant), Meat Promotion Wales, Potash Development Association, Scottish Government, Welsh Government and Yara UK Ltd.
Steering Group: AHDB, Agricultural Industries Confederation, Association of Independent Crop Consultants, BBRO, Catchment Sensitive Farming, DAERA, Defra, FACTS, PGRO, Professional Nutrient Management Group, Scottish Government and Welsh Government.
Funding for trials was provided by:
Research providers: The revision of this section of the Nutrient Management Guide (RB209) was carried out by ADAS.
Greenhouse Gas Action Plan: The industry-wide Greenhouse Gas Action Plan (GHGAP) for agriculture focuses on improving resource use efficiency in order to enhance business performance while reducing GHG emissions from farming.
Nutrient Management Guide (RB209) contains public-sector information licensed under the Open Government Licence (OGL) v3.0 nationalarchives.gov.uk/doc/open-government-licence/version/3

Using the Nutrient Management Guide (RB209)
Section 1 Principles of nutrient management and fertiliser use
Section 2 Organic materials
Section 3 Grass and forage crops
Section 4 Arable crops
Cereals
Oilseeds
Sugar beet
Peas and beans
Biomass crops
Section 5 Potatoes
Section 6 Vegetables and bulbs
Section 7 Fruit, vines and hops
This section provides guidance on the use of organic materials. For each material, the content of nitrogen (N), phosphate (P2O5), potash (K2O), magnesium (MgO) and sulphur (SO3) are given in kilograms per tonne (kg/t) or cubic metre (kg/m3).
Using the Nutrient Management Guide (RB209)The Nutrient Management Guide (RB209) helps you make the most of organic materials and balance the benefits of fertiliser use against the costs – both economic and environmental. The guide outlines the value of nutrients and soil, and explains why good nutrient management is about more than just fertilisers. It can save you money as well as help protect the environment.
AHDB first published the Nutrient Management Guide (RB209) in May 2017. Since its publication, recommendations have been revised, with the latest independent research funded by AHDB and its partners. A list of updates is available at ahdb.org.uk/rb209
To improve the accessibility and relevance of the recommendations and information, the Nutrient Management Guide (RB209) is published as seven sections that are updated individually.
Further informationThe Nutrient Management Guide (RB209) will be updated regularly. Please email your contact details to [email protected] so that we can send you notifications of when they are published.
Always consider your local conditions and consult a FACTS Qualified Adviser if necessary.
RB209: Nutrient ManagementDownload the app for Apple or Android devices to access the current version of the guide. With quick and easy access to videos, information and recommendations, it is practical for use in the field.

4
Contents
Compost 31Nutrient supply from compost 31Understanding the value of compost applications 32
Digestate 33Nutrient supply from digestate 34Understanding the value of digestate applications 35
Waste-derived materials 36Paper crumble 36Spent mushroom compost 36Water treatment cake 37Food industry wastes 37
Glossary 38
Contents Regulation, codes of practice and assurance schemes 5Sampling livestock manures 6
Taking a representative sample of a liquid manure 6Taking a representative sample of a solid manure 7Calculations and interpretation of laboratory analysis results 8
Principles of nitrogen supply and losses 9Ammonia volatilisation 9Nitrate leaching 10Release of crop-available nitrogen from organic materials 10
Phosphate, potash and magnesium 12Sulphur 12Using organic materials and fertilisers together 13
Practical aspects of organic material use 13Application management 14
Livestock manures 15Cattle, pig, sheep, duck, horse and goat farmyard manure (FYM) 15Poultry manure 17Cattle slurry and dirty water 19Pig slurry 22Understanding the value of livestock manure applications 25
Biosolids 27Nutrient content of biosolids 27Understanding the value of biosolids applications 30

5
Regulation, codes of practice and assurance schemes
Regulation, codes of practice and assurance schemesOrganic materials applied to agricultural land, such as livestock manures, biosolids, composts, anaerobic digestates and waste-derived materials, are valuable sources of most major plant nutrients and organic matter. Careful recycling to land allows their nutrient value to be used for the benefit of crops and soil fertility, which can result in large savings in the use of manufactured fertilisers.
However, organic materials can present a considerable environmental risk if not handled carefully. Guidance on avoiding pollution, including manure management planning, is given in Protecting our Water, Soil and Air: A Code of Good Agricultural Practice for farmers, growers and land managers.
For all organic materials, it is important to check their use complies with contracts, relevant assurance schemes and animal by-product regulation.
Nitrate Vulnerable Zones (NVZs)England gov.uk/guidance/nutrient-management-nitrate-vulnerable-zonesScotland gov.scot/Topics/farmingrural/Agriculture/EnvironmentWales gov.wales/topics/environmentcountrysideNorthern Ireland daera-ni.gov.uk/articles/nitrates-directive
Further informationProtecting our Water, Soil and Air: A Code of Good Agricultural Practice for farmers, growers and land managers gov.uk
Return to Contents

6
Sampling livestock manures
Sampling livestock manures For nutrient management planning, it is important to know the nutrient content of manures applied to land. The tables in this section give typical values of the total nutrient content of manures based on the analysis of samples from a wide range of sources.
However, the nutrient content of livestock manures is likely to vary significantly, depending on the source and management of the material. For example, the nutrient content will be influenced by farm-specific feeding and bedding practices, and digestate nutrient content will vary on a site-by-site basis depending on feedstock used in the digestion process. The livestock manures produced may have a nutrient content that is consistently different from the values given in the tables.
It can, therefore, be worthwhile having the nutrient content of representative manure samples determined by analysis. Rapid on-farm kits (e.g. Agros, Quantofix) can reliably assess the ammonium-N content of liquid manures (e.g. cattle slurries and digestates), but laboratory analysis is necessary for other nutrients. Laboratory analyses should include dry matter (DM), organic matter, total nitrogen (N), total phosphate (P2O5), total potash (K2O), total sulphur (SO3), total magnesium (MgO) and ammonium-N (NH4-N).
Additionally, nitrate-N (NO3-N) should be measured in well-composted farmyard manure (FYM) and poultry manures, and uric acid-N in poultry manures. Hydrometers can be used to measure the dry matter content of liquid manures. Where dry matter varies, adjust previous laboratory results or the typical values in the following tables.
The nutrient content of liquid manures can vary considerably within a store, due to settlement and crusting. In particular, pig slurry can ‘settle out’ in storage, with a higher dry matter layer being at the base of the store and a lower dry matter layer occupying the mid/upper levels, which, during store emptying, can markedly affect slurry dry matter and associated nutrient contents.
Similarly, the composition of solid manure in a heap can vary depending on the amount of bedding and losses of nutrients during storage. If stored materials are to be analysed either in a laboratory or using a rapid on-farm method
(e.g. using Agros or Quantofix slurry-N meters), it is important that the sample taken represents an ‘average’ of what is found in the heap or store.
It is important that sampling is carried out carefully and that representative samples are provided for analysis. The optimum sampling frequency will vary depending on how manures are managed on the farm, but at least two samples per year are recommended, coinciding with the main spreading periods.
Taking a representative sample of a liquid manure
• Collect at least five subsamples of two litres each and pour into a large container
• Thoroughly mix the bulked sample
• On-farm rapid analysis of slurries should be carried out immediately
• If a sample is to be sent to a laboratory, 250 ml should be dispatched in a clean, screw-topped, plastic container (normally available from the laboratory)
• Leave 2–3 cm of airspace to allow the sample to be shaken in the laboratory
• Label the sample clearly, providing as much information as possible
• As soon as possible, send the sample first class to the laboratory (prepaid envelopes are normally available from the laboratory)
Health & SafetyWhen sampling enclosed liquid manure stores (pits or tanks), never climb down or lean into the store because of the risk of inhaling toxic gases which can be lethal.
Return to Contents

7
Sampling livestock manures
Above-ground storesIdeally, the liquid manure should be fully agitated before sampling. If this is not possible and, provided there is safe access from an operator’s platform, the five subsamples can be taken at a range of positions, using a weighted two-litre container attached to a rope.
Below-ground pitIt may be possible to obtain subsamples at various positions using a weighted container.
Earth-banked lagoonsDo not attempt to sample direct from the lagoon unless there is a secure operator’s platform that provides safe access. If the slurry has been well agitated, subsamples can be obtained from the slurry tanker or irrigator. If the tanker is fitted with a suitable valve, it may be possible to take five subsamples from this stationary tanker at intervals during filling or while field spreading is in progress.
Taking a representative sample of a solid manure
• Take at least 10 subsamples of about 1 kg each as described below
• Place on a clean, dry tray or sheet
• Break up any lumps and thoroughly mix the sample
• Take a representative sample of around 500 g for analysis
• Samples should be dispatched in 500-gauge polythene bags (normally available from the laboratory) – expel excess air from the bag before sealing
• Label samples clearly, providing as much information as possible
Manure heaps• Provided the manure is dry and safe to walk on, identify at least 10 locations
which appear to be representative of the heap
• After clearing away any weathered material with a spade or fork, either:- dig a hole approximately 0.5 metres deep and take a 1 kg sample from each point- use a soil auger to obtain subsamples from at least 50 cm in to the heap
• Alternatively, take subsamples from the face of the heap at various stages during spreading
Weeping-wall storesDo not attempt to take samples before the store is emptied as it is not safe to walk on the surface of the stored material. Subsamples may be taken from the face of the heap once emptying has commenced.
Health & SafetyYou should wear rubber gloves and protective clothing when collecting samples. Remember to wash hands and forearms thoroughly after taking samples and before eating or drinking.
Videos on how to sample farmyard manure and slurry are available at ahdb.org.uk/rb209
How to sample farmyard manure How to sample slurry
Return to Contents

8
Sampling livestock manures
Calculations and interpretation of laboratory analysis resultsLaboratories differ in the way that the analysis results are expressed and conversion of the results is often needed. Analysis results are variously reported:
• On a dry-weight (DW or 100% DM) or fresh-weight (FW) basis
• In units of grams or milligrams per kilogram (g/kg, mg/kg), grams per 100 grams (g/100 g), per cent (%), grams or milligrams per litre (g/l, mg/l), kilograms per tonne (kg/t) or kilograms per cubic metre (kg/m3)
• As the nutrient element (N, P, K, Mg, S) or the nutrient oxide (P2O5, K2O, MgO, SO3)
Ifindoubtabouthowyourresultsareexpressed,asafirststepyou shouldconfirmwiththelaboratory.
Use the following conversions if analysis results need to be converted.
Nutrients
To convert nutrient element to nutrient oxide P x 2.291 = P2O5 K x 1.205 = K2O Mg x 1.658 = MgO S x 2.5 = SO3
Solid manures (DM expressed as %)
To convert mg/kg nutrient in DM to kg/t FW: mg/kg nutrient x % DM 1,000 100
To convert g/kg nutrient in DM to kg/t FW: g/kg nutrient x % DM 100
To convert g/100 g nutrient in DM to kg/t FW: g/100 g nutrient x % DM 10
To convert % nutrient in DM to kg/t FW: % nutrient x % DM 10
Solid manures (DM expressed as g/kg)
To convert mg/kg nutrient in DM to kg/t FW: mg/kg nutrient x g/kg DM 1,000 1,000
To convert g/kg nutrient in DM to kg/t FW: g/kg nutrient x g/kg DM 1,000
To convert g/100 g nutrient in DM to kg/t FW: g/100 g nutrient x g/kg DM 100
To convert % nutrient in DM to kg/t FW: % nutrient x g/kg DM 100
Liquid manures
To convert mg/l nutrient to kg/m3: mg/l nutrient 1,000
To convert g/l nutrient to kg/m3: g/l nutrient (no change)
Example 2.1Digested sludge cake with 27% DM, and 4.0% N and 3.0% P in DM
4.0%N x 27% DM = 10.8 kg N/t in FW 10
3.0%P x 27% DM x 2.29 = 18.6 kg P2O5/t in FW 10
Return to Contents

9
Principles of nitrogen supply and losses
Ammonia volatilisationTypically, around 40% of the readily available nitrogen content of organic materials can be lost following surface application to land. Ammonia loss and odour nuisance can be reduced by ensuring that organic materials are rapidly incorporated into soils (within six hours of application for liquid materials and 24 hours for solid materials to tillage land).
For liquid materials, shallow-injection and band-spreading techniques are effective application methods that reduce ammonia emissions (typically by 30–70%), compared with broadcast application. Band-spreading (trailing shoe and trailing hose) and shallow-injection application techniques increase the number of spreading days and cause less sward contamination than surface-broadcast applications. These practices will also increase the amount of nitrogen available for crop uptake. Ammonia losses are generally smaller from low dry matter liquid materials, because they more rapidly infiltrate into the soil.
Higher dry matter liquid materials remain on the soil/crop surface for longer, leading to greater losses. Losses are also higher when they are applied to dry soils under warm weather conditions.
Principles of nitrogen supply and losses
Nitrogen is present in organic materials in two main forms:
• Readily available nitrogen (i.e. ammonium-N as measured by N meters, nitrate-N and uric acid-N) is the nitrogen that is potentially available for rapid crop uptake
• Organic-N is the nitrogen contained in organic forms, which are broken down slowly to become potentially available for crop uptake over a period of months to years
Crop-available nitrogen is the readily available N that remains for crop uptake after accounting for any losses of nitrogen. This also includes nitrogen released from organic forms.
Following the application of organic materials to land, there can be losses of nitrogen as follows:
• Ammonium-N can be volatilised to the atmosphere as ammonia gas
• Following the conversion of ammonium-N to nitrate-N, further losses may occur through nitrate leaching and denitrification of nitrate to nitrous oxide and nitrogen gas under warm and wet soil conditions
To make best use of their nitrogen content, organic materials should be applied at or before times of maximum crop growth – generally during the late winter to summer period.
Return to Contents
Further informationLow emissions – focus on ammonia ahdb.org.uk/knowledge-library/low-emissions-focus-on-ammonia

10
Principles of nitrogen supply and losses
Nitrate leachingThe amount of nitrogen leached following land application is mainly related to the soil type, the application rate, the readily available N content and the amount of rainfall after application. As ammonium-N is rapidly converted in the soil to nitrate-N, organic material applications during the autumn or early-winter period should be avoided, as there is likely to be sufficient overwinter rainfall to wash a large proportion of this nitrate out of the soil before the crop can use it.
Delaying applications until late winter or spring will reduce nitrate leaching and increase the efficiency of utilisation of manure nitrogen. This is particularly important for organic materials with a high content of readily available nitrogen.
Release of crop-available nitrogen from organic materialsThe organic nitrogen content of organic material is released (mineralised) slowly over a period of months to years. Where the nitrogen mineralised from the material is not taken up by the crop in the season following application, nitrate may be lost by leaching during the following overwinter period or accumulate in soil organic matter, allowing further long-term savings in nitrogen fertiliser inputs. Around 5% of the total nitrogen content of organic material may become available for the second crop following application.
Points to consider• In NVZs, there are mandatory closed-spreading periods for high
readily available nitrogen organic materials (e.g. cattle slurries, poultry manures and digestates), which typically have greater than 30% of their total nitrogen content present as readily available nitrogen
Return to Contents

11
Principles of nitrogen supply and losses
Figure 2.1 Typical proportions of different forms of nitrogen in organic materials
MANNER-NPK is a free practical software tool that provides farmers and advisers with a quick estimate of crop-available nitrogen, phosphate and potash supply from applications of organic materials. MANNER-NPK is applicable in England, Wales, Scotland and Northern Irelandplanet4farmers.co.uk/manner
The Farm Crap App is a free app that enables you to visually assess manures and slurry applications (rates) and calculate what is being provided in terms of total and crop-available nutrients. You can select different seasons,
types of manure(s) and crops growing to see what the manure will provide in terms of fertiliser value. The app is available on Apple and Android devices, through the iTunes or Google Play stores.
Return to Contents
Cattle slurry (6% dry matter)
Organic-NAmmonium-N
Pig slurry (4% dry matter)
Organic-NAmmonium-N
Whole digestate
Organic-NAmmonium-N
Biosolids digested
cakeOrganic-NAmmonium-N
Cattle FYM Organic-NAmmonium-N
Poultry manure Organic-N
Ammonium-N
Uric acid-N

12
Phosphate, potash and magnesium/Sulphur
Phosphate, potash and magnesiumOrganic materials are valuable sources of other nutrients as well as nitrogen, although not all of the total nutrient content is available for the next crop. Typical values for the total and available phosphate and potash contents of organic materials are given in this guide.
Nutrients which are not immediately available will mostly become available over a period of years and will usually be accounted for when soil analysis is carried out. The availability of manure phosphate to the next crop grown (typically 50–60%) is lower than from water-soluble phosphate fertilisers. However, around 90% of manure potash is readily available for crop uptake.
Where crop responses to phosphate or potash are expected (e.g. soil Indices 0 or 1 for combinable crops and grassland), or where responsive crops are grown (e.g. potatoes or vegetables), the available (not total) phosphate and potash content of the organic material should be used when calculating the nutrient contribution. Soils at Index 0 will particularly benefit from organic material applications.
Where the soil is at target Index (usually Index 2) or above for phosphate or potash, the total phosphate and potash content of the organic material should be used in nutrient balance-sheet calculations.
For most arable crops, typical organic material application rates can supply the phosphate and potash requirement. At soil P Index 3 or above, take care to ensure that total phosphate inputs do not exceed the amounts removed in crops during the rotation. This will avoid the soil P Index reaching an unnecessarily high level. It is important to manage organic material applications to ensure phosphate and potash are used through the crop rotation.
SulphurOrganic materials contain valuable amounts of crop-available sulphur and recent research has quantified sulphur supply from livestock manures and biosolids applications (Table 2.1). Sulphur from autumn applications may be lost via overwinter leaching. The quantity leached will depend on soil type and overwinter rainfall and is likely to be higher on light textured soils in high rainfall areas.
Table 2.1 Sulphur availability from organic materials
Organic materialProportion of total SO3 available
%
Autumn-applied
Livestock manures 5–10 [15]
Biosolids 10–20 [25]
Spring-applied
Cattle FYM 15
Pig FYM 25
Poultry manure 60
Cattle/pig slurry 45
Biosolids 35
[ ] use for grassland and winter oilseed rape cropping
Return to Contents

13
Using organic materials and fertilisers together
Using organic materials and fertilisers together
You should plan to utilise as much as possible of the nutrient content of organic materials. Not adequately allowing for these nutrients, particularly nitrogen, not only wastes money because of unnecessary fertiliser use but also can reduce crop yields and quality, e.g. lodging in cereals, poor fermentation in grass silage and low sugar levels in beet.
Step 1 Calculate the quantity of crop-available nutrients supplied by each application of organic material.
Step 2 Identify the fields that will benefit most from the application of organic material. This will need to take account of the accessibility and likely soil conditions in individual fields and the application equipment that is available. Crops with a high nitrogen demand should be targeted first. Fields at low soil P or K Indices will benefit more than those at high Indices. Silage fields should be separated in preference to grazing-only fields.
Step 3 Plan the application rates for each field, taking account of the phosphate content of organic material over the crop rotation to avoid excessive enrichment of soil phosphorus levels. Make sure that plans adhere to NVZ rules. As far as possible, apply organic materials in the late-winter to summer period – this will make best use of the nitrogen content.
Step 4 Aim for the organic material application to supply no more than 50–60% of the total nitrogen requirement of the crop and use manufactured fertiliser to make up the difference. This approach will minimise the potential impact of variations in nitrogen supply from organic materials on crop yields and quality.
Step 5 Calculate the nutrient requirement of the crop, then deduct the nutrients supplied from organic materials. This will give the balance that needs to be supplied as manufactured fertiliser.
Step 6 Make sure that application equipment is well maintained and suitable for applying the organic material in the most effective way, minimising losses of ammonia-N and soil or crop damage. The equipment should be routinely calibrated for the type of organic material being applied.
Practical aspects of organic material useOrganic materials are commonly applied to arable stubbles in the autumn prior to drilling winter cereals. To make best use of organic material nitrogen and to minimise nitrate leaching losses, materials should, if possible, be applied in the late-winter to summer period.
Band spreaders and shallow-injection (5–7 cm deep) equipment allow accurate top-dressing of liquid materials across full tramline widths, without causing crop damage. An additional benefit of these application methods is that odour nuisance and ammonia emissions are reduced by 30–70% compared with conventional ‘splash-plate’ surface application. Herbage contamination is also reduced.
Organic material applications before spring-sown crops (e.g. root crops, cereals and oilseed rape) should be made from late winter onwards to minimise nitrate leaching losses, particularly where high readily available nitrogen manures are applied.
In NVZs, applications of organic material with a high readily available nitrogen content (e.g. slurry, poultry manure and digestate) are subject to closed-spreading periods to reduce the risks of nitrate leaching losses. Rapid soil incorporation on tillage land (e.g. within six hours following surface-broadcast application) will minimise ammonia losses and increase crop-available nitrogen supply.
Return to Contents

14
Using organic materials and fertilisers together
Organic material applications to grassland are best made to fields intended for silage or hay production. Cattle slurry and FYM contain large amounts of potash relative to their readily available nitrogen and total phosphate contents and are ideally suited to this situation. However, take care to ensure that the potash supply does not increase the risk of grass staggers (hypomagnesaemia) in stock through reduced herbage magnesium levels.
Application rates of solid material should be carefully controlled to avoid the risk of sward damage and contamination of conserved grass, which can adversely affect silage quality. To encourage a low pH and good fermentation, grass cuts following solid material or late slurry applications should be wilted before ensiling, or an effective silage additive used.
Where slurry and solid manure applications are made to grazed grassland, the pasture should not be grazed for at least four weeks following application, or until all visible signs of slurry or digestate solids have disappeared. This will minimise the risk of transferring disease to grazing livestock.
Forage crops, particularly forage maize, provide an opportunity to apply organic materials prior to drilling in late spring. Organic material application rates should be carefully controlled and, where possible, the material should be rapidly incorporated into the soil to minimise ammonia-N emissions and odour nuisance.
Where organic material applications are made before ‘ready-to-eat crops’ (crops that are generally not cooked before eating), relevant industry guidance should be followed to minimise the risks of pathogen transfer (e.g. The Safe Sludge Matrix or The Renewable Fertiliser Matrix).
Application managementIt is important that organic materials are applied evenly and at known application rates. The most important causes of uneven application on farms are the incorrect setting of bout widths and poor attention to machinery maintenance.
For both liquid and solid manures, the evenness of spreading is usually better with rear-discharge spreaders than side-discharge machines. Top-dressing liquid manures to arable crops in spring can be carried out using tankers or umbilical systems, with boom applicators (fitted with nozzles or trailing hoses) operating from tramlines.
The aim should be to apply all manure types evenly with a coefficient of variation of less than 25%. This is achievable with commonly used types of manure application equipment, provided they are well maintained and calibrated.
Application rates can be calculated simply from a knowledge of the capacity of the tanker or solid manure spreader (by weighing both full and empty machines on a weighbridge), the number of loads applied per field and the field area. An accurate flow meter should be used to measure the slurry application rate of umbilical and irrigation systems.
Further informationThe Safe Sludge Matrix adlib.everysite.co.uk/resources/000/094/727/SSMatrix.pdf
The Renewable Fertiliser Matrix wrap.org.uk/content/renewable-fertiliser-matrix
Return to Contents

15
Livestock manures
Livestock manures
The nutrient content of livestock manures will depend on a number of factors, including the type of livestock, the diet and feeding system, the volume of dirty water and rainwater entering storage facilities and the amount of bedding used. Consequently, the nutrient content of manures produced on any particular unit may vary significantly from the typical values in the tables.
Therefore, although the following tables provide useful information on the typical nutrient content of livestock manures, it can be worthwhile analysing representative samples (page 6).
Cattle, pig, sheep, duck, horse and goat farmyard manure (FYM)Table 2.2 Typical total nitrogen content of FYM (fresh-weight basis)
Duck farmyard manure is included here because the availability of its nitrogen is generally lower than that of other poultry manures.
To convert kg/t to units/ton, multiply by 2.
a. The crop-available nitrogen supply will depend on the application timing and the delay between application and incorporation.
Further informationThink Manures gov.uk/government/collections/nitrate-vulnerable-zones
Managing nutrients for better returns ahdb.org.uk/knowledge-library/managing-nutrients-for-better-returns
FYMDry matter Total nitrogen
% kg N/ta
Cattle 25 6.0
Pig 25 7.0
Sheep 25 7.0
Duck 25 6.5
Horse 25 5.0
Goat 40 9.5
Return to Contents
16
Livestock manures
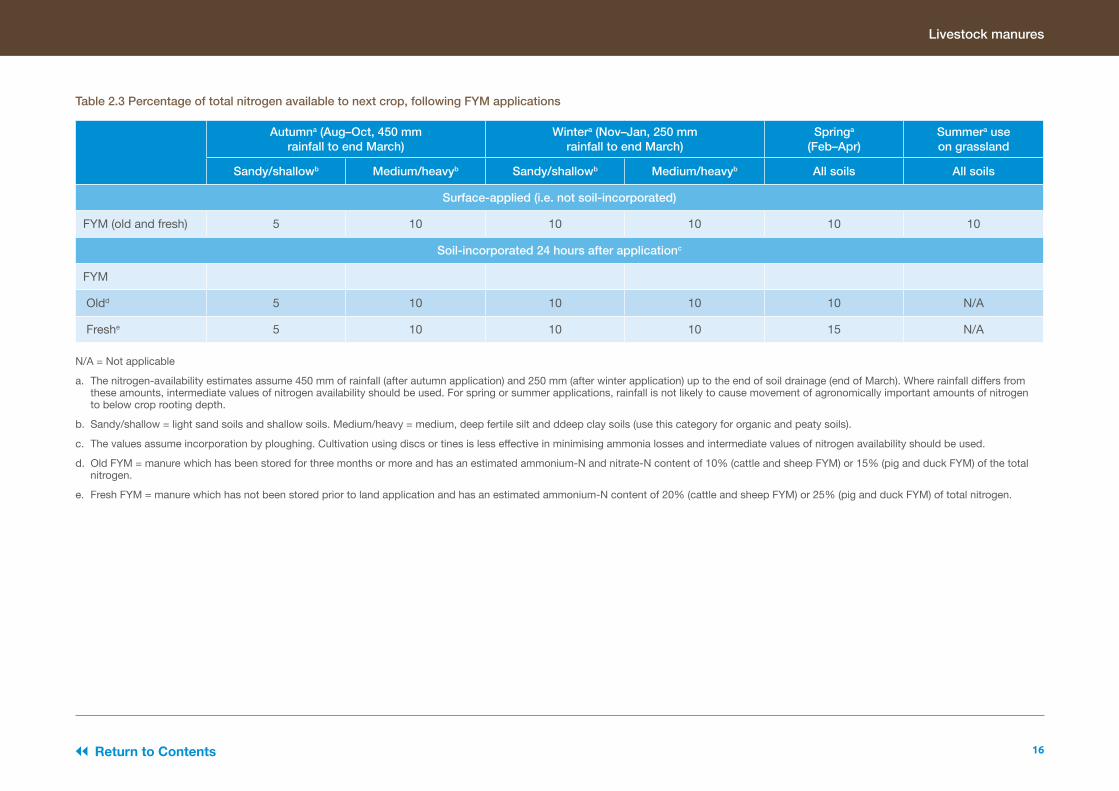
Table 2.3 Percentage of total nitrogen available to next crop, following FYM applications
N/A = Not applicable
a. The nitrogen-availability estimates assume 450 mm of rainfall (after autumn application) and 250 mm (after winter application) up to the end of soil drainage (end of March). Where rainfall differs from these amounts, intermediate values of nitrogen availability should be used. For spring or summer applications, rainfall is not likely to cause movement of agronomically important amounts of nitrogen to below crop rooting depth.
b. Sandy/shallow = light sand soils and shallow soils. Medium/heavy = medium, deep fertile silt and ddeep clay soils (use this category for organic and peaty soils).
c. The values assume incorporation by ploughing. Cultivation using discs or tines is less effective in minimising ammonia losses and intermediate values of nitrogen availability should be used.
d. Old FYM = manure which has been stored for three months or more and has an estimated ammonium-N and nitrate-N content of 10% (cattle and sheep FYM) or 15% (pig and duck FYM) of the total nitrogen.
e. Fresh FYM = manure which has not been stored prior to land application and has an estimated ammonium-N content of 20% (cattle and sheep FYM) or 25% (pig and duck FYM) of total nitrogen.
Return to Contents
Autumna (Aug–Oct, 450 mm rainfall to end March)
Wintera (Nov–Jan, 250 mm rainfall to end March)
Springa
(Feb–Apr)Summera use on grassland
Sandy/shallowb Medium/heavyb Sandy/shallowb Medium/heavyb All soils All soils
Surface-applied (i.e. not soil-incorporated)
FYM (old and fresh) 5 10 10 10 10 10
Soil-incorporated 24 hours after applicationc
FYM
Oldd 5 10 10 10 10 N/A
Freshe 5 10 10 10 15 N/A

17
Livestock manures
Table 2.4 FYM – phosphate, potash, magnesium and sulphur (fresh-weight basis)
a. Values of potash may be lower for FYM stored for long periods in the open.
b. For crop-available sulphur supply, refer to Table 2.1 on page 12.
FYMDry matter
Phosphate Potasha Sulphurb Magnesium
Total phosphate
Availability(%)
Available phosphate Total potash Availability Available
potash Total sulphur Totalmagnesium
% kg P2O5/t % kg P2O5/t kg K2O/t % kg K2O/t (kg SO3/t kg MgO/t
Cattle 25 3.2 60 1.9 9.4 90 8.5 2.4 1.8
Pig 25 6.0 60 3.6 8.0 90 7.2 3.4 1.8
Sheep 25 3.2 60 1.9 8.0 90 7.2 4.0 2.8
Duck 25 5.5 60 3.3 7.5 90 6.8 2.6 2.4
Horse 25 5.0 60 3.0 6.0 90 5.4 1.6 1.5
Goat 40 4.5 60 2.7 12.0 90 10.8 2.8 1.9
Poultry manureTable 2.5 Typical total nitrogen content of poultry manure (fresh-weight basis)
Dry matter Total nitrogena
% kg N/t
20 9.4
40 19.0
60 28.0
80 37.0
To convert kg/t to units/ton, multiply by 2.
a. Typically, greater than 30% of the total nitrogen content of poultry manure is present as readily available N. As a result, poultry manure is subject to the closed-spreading period in Nitrate Vulnerable Zones. The crop-available nitrogen supply will depend on the application timing and the delay between application and incorporation.
Return to Contents

18
Livestock manures
Table 2.6 Percentage of total nitrogen available to next crop, following poultry manure applications (% of total nitrogen)
Table 2.7 Phosphate, potash, magnesium and sulphur content of poultry manure (fresh-weight basis)
[ ] = use for grassland and winter oilseed rape cropping
N/A = Not applicable
a. The nitrogen-availability estimates assume 450 mm of rainfall (after autumn application) and 250 mm (after winter application) up to the end of soil drainage (end March). Where rainfall differs from these amounts, intermediate values of nitrogen availability should be used. For spring or summer applications, rainfall is not likely to cause movement of agronomically important amounts of nitrogen to below crop rooting depth.
b. Sandy/shallow = light sand soils and shallow soils. Medium/heavy = medium, deep fertile silt anddeep clay soils (use this category for organic and peaty soils).
c. The values assume incorporation by ploughing. Cultivation using discs or tines is less effective in minimising ammonia losses and intermediate values of nitrogen availability should be used.
To convert kg/t to units/ton, multiply by 2.
a. For crop-available sulphur supply, refer to Table 2.1 on page 12.
Dry matter Autumna (Aug–Oct, 450 mm to end March)
Wintera (Nov–Jan, 250 mm rainfall to end March)
Springa
(Feb–Apr)Summera use on grassland
% Sandy/shallowb Medium/heavyb Sandy/shallowb Medium/heavyb All soils All soils
Surface-applied (i.e. not incorporated)
20 15 [20] 25 [30] 25 25 35 35
40 10 [15] 25 [30] 20 25 30 30
60 10 [15] 25 [30] 20 25 30 30
80 10 [15] 25 [30] 20 25 30 30
Soil-incorporated 24 hours after applicationc
20 15 [20] 35 [40] 25 40 50 N/A
40 10 [15] 30 [35] 20 30 40 N/A
60 10 [15] 30 [35] 20 30 40 N/A
80 10 [15] 30 [35] 20 30 40 N/A
Dry matterPhosphate Potash Sulphura Magnesium
Total phosphate Availability Available phosphate Total potash Availability Available potash Total sulphur Total magnesium
% kg P2O5/t % kg P2O5/t kg K2O/t % kg K2O/t kg SO3/t kg MgO/t
20 8.0 60 4.8 8.5 90 7.7 3.0 2.7
40 12 60 7.2 15 90 14 5.6 4.3
60 17 60 10.2 21 90 19 8.2 5.9
80 21 60 12.6 27 90 24 11 7.5
Return to Contents

19
Livestock manures
Cattle slurry and dirty waterTable 2.8 Total nitrogen content of cattle slurry and dirty water (fresh-weight basis)
Dry matter Total nitrogena
% kg N/m3 or /t
Slurries/liquids
Cattle
2 1.6
6b 2.6b
10 3.6
Dirty water 0.5 0.5
Separated cattle slurries (liquid portion)
Strainer box 1.5 1.5
Weeping wall 3 2.0
Mechanical separator 4 3.0
Separated cattle slurry (solid portion)
20 4.0
To convert kg/m3 to units/1,000 gallons, multiply by 9.
a. Cattle slurry and the liquid portion of separated cattle slurry are high readily available nitrogen manures, typically with greater than 30% of their total nitrogen content present as readily available nitrogen and will be subject to closed-spreading periods in Nitrate Vulnerable Zones. The crop-available nitrogen supply from manures will depend on the application timing, application method and the delay between application and incorporation.
b. Typical dry matter and nitrogen contents of cattle slurry are shown in bold.
Return to Contents

20
Table 2.9 Percentage of total nitrogen available to next crop, following cattle slurry and dirty water applications (% of total nitrogen)
Dry matter Autumna (Aug–Oct, 450 mm rainfall to end March)
Wintera (Nov–Jan, 250 mm rainfall to end March)
Springa
(Feb–Apr)Summera use on grassland
% Sandy/shallowb Medium/heavyb Sandy/shallowb Medium/heavyb All soils All soils
Cattle slurry – liquid (surface-applied, i.e. not soil-incorporated)
2 5 [10] 30 [35] 30 30 45 35
6 5 [10] 25 [30] 25 25 35 25
10 5 [10] 20 [25] 20 20 25 20
Cattle slurry – liquid (soil-incorporated 6 hours after application)c
2 5 [10] 35 [50] 25 35 50 N/A
6 5 [10] 30 [35] 20 30 40 N/A
10 5 [10] 25 [30] 15 25 30 N/A
Cattle slurry – liquid (band-spread)
2 5 [10] 30 [35] 30 30 50 40
6 5 [10] 25 [30] 25 25 40 30
10 5 [10] 20 [25] 20 20 30 25
Cattle slurry – liquid (shallow-injected)
2 5 [10] 30 [35] 35 35 55 45
6 5 [10] 25 [30] 30 30 45 35
10 5 [10] 20 [25] 25 25 35 30
Dirty water (surface-applied)
10 [15] 35 [40] 35 35 50 30
Separated cattle slurry – solid portion (surface-applied, i.e. not soil-incorporated)
5 10 10 10 10 10
Separated cattle slurry – solid portion (soil-incorporated 24 hours after application)d
5 10 10 10 15 N/A
[ ] = use for grassland and winter oilseed rape cropping
N/A = not applicable.
For separated cattle slurry (liquid portion), use the values for 2% dry matter slurry.
a. The nitrogen-availability estimates assume 450 mm of rainfall (after autumn application) and 250 mm (after winter application) up to the end of soil drainage (end March). Where rainfall differs from these amounts, intermediate values of nitrogen availability should be used. For spring or summer applications, rainfall is not likely to cause movement of agronomically important amounts of nitrogen to below crop rooting depth.
b. Sandy/shallow = light sand soils and shallow soils. Medium/heavy = medium, deep fertile silt and deep clay soils (use this category for organic and peaty soils).
c. The values assume incorporation by ploughing. Cultivation using discs or tines is less effective in minimising ammonia. Where slurry has been applied in spring or summer and incorporated more quickly than six hours or has been deep-injected, nitrogen availability will be similar to the shallow-injected values.
d. The values assume incorporation by ploughing. Cultivation using discs or tines is less effective in minimising ammonia losses and intermediate values of nitrogen availability should be used.
Return to Contents
Livestock manures

21
Livestock manures
Table 2.10 Phosphate, potash, magnesium and sulphur content of cattle slurry and dirty water (fresh-weight basis)
ND = No data
To convert kg/m3 to units/1,000 gallons, multiply by 9.
a. For crop-available sulphur supply, refer to Table 2.1 on page 12.
b. Typical dry matter and nitrogen contents of cattle slurry are shown in bold.
Dry matter Phosphate Potash Sulphura Magnesium
Total phosphate Availability Availablephosphate Total potash Availability Available
potash Total sulphur Total magnesium
% kg P2O5/m3 or /t % kg P2O5/m3 or /t kg K2O/m3 or /t % kg K2O/m3 or/t kg SO3/m3 kg MgO/m3
Slurries/liquids
Cattle
2 0.6 50 0.3 1.7 90 1.5 0.3 0.2
6b 1.2b 50b 0.6b 2.5b 90b 2.3b 0.7b 0.6b
10 1.8 50 0.9 3.4 90 3.0 1.0 0.9
Dirty water 0.5 0.1 50 0.05 1.0 100 1.0 0.1 0.1
Separated cattle slurries (liquid portion)
Strainer box 1.5 0.3 50 0.15 1.5 90 1.4 ND ND
Weeping wall 3 0.5 50 0.25 2.3 90 2.1 ND ND
Mechanical separator 4 1.2 50 0.6 2.8 90 2.5 ND ND
Separated cattle slurry (solid portion)
20 2.0 50 1.0 3.3 90 3.0 ND ND
Return to Contents

22
Livestock manures
Pig slurryTable 2.11 Typical total nitrogen content of pig slurry (fresh-weight basis)
Dry matter Total nitrogena
% kg N/m3 or /t
Pig slurry – liquid
2 3.0
4b 3.6b
6 4.4
Separated pig slurry (liquid portion) 3 3.6
Separated pig slurry (solid portion) 20 5.0
To convert kg/m3 to units/1000 gallons, multiply by 9.
a. Pig slurry and the liquid portion of separated pig slurry are in high readily available N manures, typically with greater than 30% of their total nitrogen content present as readily available N, and will be subject to closed-spreading periods in Nitrate Vulnerable Zones. The crop-available nitrogen supply from manures will depend on the application timing, application method and the delay between application and incorporation.
b. Typical dry matter and nitrogen contents of pig slurry are shown in bold.
Return to Contents

23
Table 2.12 Percentage of total nitrogen available to next crop, following pig slurry applications (% of total nitrogen)
[ ] = use for grassland and winter oilseed rape cropping
N/A = Not applicable
a. The nitrogen-availability estimates assume 450 mm of rainfall (after autumn application) and 250 mm (after winter application) up to the end of soil drainage (end March). Where rainfall differs from these amounts, intermediate values of nitrogen availability should be used. For spring or summer applications, rainfall is not likely to cause movement of agronomically important amounts of nitrogen to below crop rooting depth.
b. Sandy/shallow = light sand soils and shallow soils. Medium/heavy = medium, deep fertile silt and deep clay soils (use this category for organic and peaty soils).
c. The values assume incorporation by ploughing. Cultivation using discs or tines is less effective in minimising ammonia losses. Where slurry has been applied in spring or summer and incorporated more quickly than six hours or has been deep-injected, nitrogen availability will be similar to the shallow-injected values.
d. The values assume incorporation by ploughing. Cultivation using discs or tines is less effective in minimising ammonia losses and intermediate values of nitrogen availability should be used.
For separated pig slurry (liquid portion), use the values for 2% dry matter slurry.
Livestock manures
Return to Contents
Dry matter Autumna (Aug–Oct, 450 mm rainfall to end March)
Wintera (Nov–Jan, 250 mm rainfall to end March)
Springa
(Feb–Apr)Summera use on
grassland
% Sandy/shallowb Medium/heavyb Sandy/shallowb Medium/heavyb All soils All soils
Pig slurry – liquid (surface-applied, i.e. not soil-incorporated)
2 10 [15] 35 [40] 40 40 55 55
4 10 [15] 30 [35] 35 35 50 50
6 10 [15] 25 [30] 30 30 45 45
Pig slurry – liquid (soil-incorporated 6 hours after application)c
2 10 [15] 40 [45] 35 50 65 N/A
4 10 [15] 40 [45] 30 45 60 N/A
6 10 [15] 40 [45] 25 40 55 N/A
Pig slurry – liquid (band-spread)
2 10 [15] 35 [40] 40 40 60 60
4 10 [15] 35 [40] 35 35 55 55
6 10 [15] 30 [35] 35 35 50 50
Pig slurry – liquid (shallow-injected)
2 10 [15] 40 [45] 45 45 65 65
4 10 [15] 35 [40] 40 40 60 60
6 10 [15] 30 [40] 40 40 55 55
Separated pig slurry – solid portion (surface-applied, i.e. not soil-incorporated)
5 10 10 10 10 10
Separated pig slurry – solid portion (soil-incorporated 24 hours after application)d
5 10 10 10 15 N/A

24
Livestock manures
Table 2.13 Phosphate, potash, magnesium and sulphur content of pig slurry (fresh-weight basis)
ND = no data
To convert kg/m3 to units/1,000 gallons, multiply by 9.
a. For crop-available sulphur supply, refer to Table 2.1 on page 12.
b. Typical dry matter and nitrogen contents of pig slurry are shown in bold.
Return to Contents
Dry matter Phosphate Potash Sulphur Magnesium
Total phosphate Availability Available phosphate Total potash Availability Available potash Total sulphura Total magnesium
% kg P2O5/m3 or/t % (g P2O5/m3 or/t kg K2O/m3 or /t % kg K2O/m3 or/t kg SO3/m3 or /t kg MgO/m3
Pig slurry – liquid
2 0.8 50 0.4 1.8 90 1.6 0.4 0.4
4b 1.5 50 0.8 2.2 90 2.0 0.7 0.7
6 2.2 50 1.1 2.6 90 2.3 1.0 1.0
Separated pig slurry (liquid portion)
3 1.1 50 0.6 2.0 90 1.8 ND ND
Separated pig slurry (solid portion)
20 3.7 50 1.9 2.0 90 1.8 ND ND

25
Livestock manures
Understanding the value of livestock manure applications
Stage and calculation procedure Nitrogen (N)a Phosphate (P2O5)a Potash (K2O)a Financial saving
1. Estimated total nutrients in slurry (kg/m3)
2.6 1.2 2.5
2. Estimated available nutrients in slurry (kg/m3)
0.9b 0.6 2.3
3. Nutrients supplied by slurry that are equivalent to manufactured fertiliser (kg/ha)
30 m3/ha supplies 78 kg/ha total N and 27 kg/ha crop-available N 27 36c 75c
Potential saving from manure use £83/had
4. Nutrient requirements for first-cut silage to produce a yield of 6+ t DM/ha (kg/ha)
Section 3: Grass and forage crops 120 40e 80e
5. Manufactured fertiliser needed for the silage crop (kg/ha)
Stage 4 minus Stage 3 93 4 5
Actual saving for silage crop from manure use £83/ha
6. Surplus manure nutrients for subsequent crops that are equivalent to manufactured fertiliser (kg/ha)
Stage 3 minus Stage 4 NIL NIL
Saving for subsequent crops from manure use NIL
Assumed fertiliser costs: Nitrogen 60p/kg; phosphate 60p/kg; potash 60p/kg.a. Analyses of representative sample or typical values from Tables 2.8, 2.9 and 2.10 on pages
19–21. b. Crop-available nitrogen is 35% of total nitrogen.
c. Total phosphate and potash content used in calculations to maintain Soil Indices.d. Saving for next crop plus value of surplus manure phosphate and potash which will contribute
to the nutrient requirement of future crops.e. Nutrients required for spring application (soil P Index 2 and K Index 2-).
Example 2.2 30 m3/ha of cattle slurry (6% dry matter) is surface-applied in early spring before first-cut silage. The soil is at P Index 2 and K Index 2-. Where the slurry is surface-applied in the spring, the application saves up to £83/ha on manufactured fertiliser costs. This potential saving will be less following autumn or winter application, or where soil P or K Indices are above maintenance levels.
Return to Contents

26
Livestock manure
Example 2.335 t/ha of pig FYM is applied in autumn to a clay soil before drilling winter wheat (8 t/ha grain yield, straw baled). It is NOT rapidly incorporated. The soil is at P Index 2 and K Index 2-. Where the FYM is surface applied in the autumn, the application saves up to £309/ha on manufactured fertiliser costs. This potential saving will be less where soil P or K Indices are above maintenance levels.
Return to Contents
Stage and calculation procedure Nitrogen (N) Phosphate (P2O5) Potash (K2O) Financial saving
1. Estimated total nutrients in FYM (kg/t)
Analysis of representative sample or typical total values (Table 2.2 and 2.4) 7.0 6.0 8.0
2. Estimated available nutrients in FYM (kg/t)
Nitrogen (Table 2.3) 0.7a
Phosphate and potash (Table 2.4) 3.6 7.2
3. Nutrients supplied by FYM that are equivalent to manufactured fertiliser (kg/ha)
35 t/ha supplies 245 kg/ha total N and 25 kg/ha crop-available N 25 210b 280b
Potential saving from manure use £309/hac
4. Nutrient requirements for winter wheat (kg/ha)
Section 4: Arable crops (Table 4.12 and 4.15) 220 65d 85d
5. Manufactured fertiliser needed for the wheat crop (kg/ha)
Stage 4 minus Stage 3 195 NIL NIL
Actual saving for next crop from manure use £108/ha
6. Surplus manure nutrients for subsequent crops that are equivalent to manufactured fertiliser (kg/ha)
Stage 3 minus Stage 4 140 195
Saving for subsequent crops from manure use £201/ha
Assumed fertiliser costs: Nitrogen 60p/kg; phosphate 60p/kg; potash 60p/kga. Crop-available nitrogen is 10% of total nitrogen.b. Total phosphate and potash content used in calculations to maintain Soil Indices.
c. Saving for next crop plus value of surplus manure phosphate and potash which will contribute to the nutrient requirement of future crops.
d. Nutrients required for maintenance of soil reserves (soil P Index 2 and K Index 2-).

27
Biosolids
BiosolidsBiosolids (treated sewage sludge) are valuable fertilisers and soil conditioners, which have undergone processes to create an agriculturally beneficial product. However, applications must comply with several regulations and best practice guidance.
The Biosolids Assurance Scheme (BAS) brings together regulations and best practice to provide food chain and consumer reassurance that BAS Certified Biosolids can be safely and sustainably recycled to agricultural land.
Nutrient content of biosolids
Most biosolids applications apply more phosphate than is taken off by the following crop, which may lead to increases in soil phosphate levels. The phosphate supplied by a biosolids application should be considered over the whole crop rotation by managing inputs in relation to crop offtake and soil analysis. On fields receiving biosolids applications, soil sampling every 3–5 years is essential.
Biosolids only contain small amounts of potash but useful quantities of sulphur and magnesium. Lime-stabilised biosolids also have value as liming materials with a neutralising value typically in the range of 2–6% per tonne fresh weight.
Biosolids contain heavy metals such as copper, lead, mercury, nickel or zinc but at lower concentrations than in the past. Heavy metals are elements that are potentially toxic to mammals above critical levels. However, copper, nickel and zinc are required by plants in very small amounts (micronutrients).
Where biosolids are used, there is a statutory requirement to analyse topsoil for metals before land spreading to ensure that concentrations are below maximum permissible soil levels and to control annual additions of metals. Analysis is typically carried out by the supplier. Limits for soil concentrations and permitted rates of addition of heavy metals are given in the Defra Code of Practice for Agricultural Use of Sewage Sludge.
Table 2.14 Typical total nitrogen content of biosolids (fresh-weight basis)
BiosolidsDry matter Total nitrogen
% kg N/t
Digested cake 25 11
Thermally dried 95 40
Lime-stabilised 25 8.5
Composted 40 11
To convert kg/m3 to units/1,000 gallons, multiply by 9.To convert kg/t to units/ton, multiply by 2.
Points to consider• The Biosolids Nutrient Management Matrix provides a useful overview
of regulation and guidance• Seek support, guidance and nutrient analysis from the biosolids suppliers• Contract and assurance scheme conditions
Further informationThe Sludge (Use in Agriculture) Regulations 1989 legislation.gov.ukThe Sludge (Use in Agriculture) (Amendment) Regulations 1990 legislation.gov.ukSewage sludge on farmland: code of practice for England, Wales and Northern Ireland (2017) gov.uk/government/publications/sewage-sludge-in-agriculture-code-of-practice/sewage-sludge-in-agriculture-code-of-practice-for-england-wales-and-northern-irelandThe ADAS Safe Sludge Matrix (2001)Biosolids Nutrient Management Matrix adas.ukBiosolids Assurance Scheme assuredbiosolids.co.uk
Return to Contents

28
Biosolids
Table 2.15 Percentage of total nitrogen available to next crop, following biosolids applications (% of total nitrogen)
BiosolidsAutumna (Aug–Oct, 450 mm
rainfall to end March)Wintera (Nov–Jan, 250 mm
rainfall to end March)Springa
(Feb–Apr)Summera use on grassland
Sandy/shallowb Medium/heavyb Sandy/shallowb Medium/heavyb All soils All soils
Surface-applied, i.e. not soil-incorporated
Digested cake 10 15 15 15 15 15
Thermally dried 10 15 15 15 15 15
Lime-stabilised 10 15 15 15 15 15
Composted 10 15 15 15 15 15
Soil-incorporated after application – 6 hours for liquids and 24 hours for solidsc
Digested cake 10 15 15 15 20 N/A
Thermally dried 10 15 15 15 20 N/A
Lime-stabilised 10 15 15 15 20 N/A
Composted 10 15 15 15 15 N/A
N/A = Not applicable
a. The nitrogen-availability estimates assume 450 mm of rainfall (after autumn application) and 250 mm (after winter application) up to the end of soil drainage (end March). Where rainfall differs from these amounts, intermediate values of nitrogen availability should be used. For spring or summer applications, rainfall is not likely to cause movement of agronomically important amounts of nitrogen to below crop rooting depth.
b. Sandy/shallow = light sand soils and shallow soils. Medium/heavy = medium, deep fertile silt and deep clay soils (use this category for organic and peaty soils).
c. The values assume incorporation by ploughing. Cultivation using discs or tines is likely to be less effective in minimising ammonia losses and intermediate values of nitrogen availability should be used.
Return to Contents

29
Biosolids
Table 2.16 Phosphate, potash, magnesium and sulphur content of biosolids (fresh-weight basis)
To convert kg/m3 to units/1,000 gallons, multiply by 9.
To convert kg/t to units/ton, multiply by 2.
a. For crop-available sulphur supply, refer to Table 2.1 on page 12.
BiosolidsDry matter
Phosphate Potash Sulphura Magnesium
Total phosphate Availability Available phosphate Total potash Availability Available
potash Total sulphur Total magnesium
% kg P2O5/t % kg P2O5/t kg K2O/t % kg K2O/t kg SO3/t kg MgO/t
Digested cake 25 11 50 5.5 0.6 90 0.5 8.2 1.6
Thermally dried 95 55 50 28 2.0 90 1.8 23 6.0
Lime-stabilised 25 7 50 3.5 0.8 90 0.7 7.4 2.4
Composted 40 10 50 5.0 3.0 90 2.7 6.1 2.0
Return to Contents

30
Understanding the value of biosolids applications
Biosolids
Example 2.420 t/ha of digested cake is applied in autumn before winter wheat (8 t/ha grain yield, straw baled), grown on a medium soil following a previous cereal crop. The sludge is rapidly incorporated. The soil is at P Index 2 and K Index 2-. Where the digested cake is surface-applied in the autumn, the application saves up to £243/ha on manufactured fertiliser costs. This potential saving will be less where soil P or K Indices are above maintenance levels.
Return to Contents
Stage and calculation procedure Nitrogen (N) Phosphate (P2O5) Potash (K2O) Financial saving
1. Estimated total nutrients in digested cake (kg/t)
Analysis provided by biosolids supplier or typical values (Table 2.14 and 2.16) 11 11 0.6
2. Estimated available nutrients in digested cake (kg/t)
Nitrogen (Table 2.15) 1.7a
Phosphate and potash (Table 2.16) 5.5 0.5
3. Nutrients supplied by digested cake that are equivalent to manufactured fertiliser (kg/ha)
20 t/ha supplies 220 kg/ha total nitrogen and 33 kg/ha of crop-available N 33 220b 12b
Potential saving from biosolids use £159/ha,c
4. Nutrient requirements for winter wheat (kg/ha)
Section 4: Arable crops 220 65d 85d
5. Manufactured fertiliser needed for the wheat crop (kg/ha)
Stage 4 minus Stage 3 187 NIL 73
Actual saving for wheat crop due to biosolids use £69/ha
6. Surplus digested cake phosphate for subsequent crops that is equivalent to manufactured fertiliser (kg/ha)
Stage 3 minus Stage 4 150 NIL
Saving for subsequent crops due to biosolids use £90/ha
Assumed fertiliser costs: Nitrogen 60p/kg; phosphate 60p/kg; potash 60p/kg. a. Crop-available nitrogen is 15% of total nitrogen.b. Total phosphate and potash content used in calculations to maintain soil P and K Indices.
c. Saving for next crop plus value of surplus biosolids phosphate which will contribute to the nutrient requirement of future crops.
d. Nutrients required for maintenance of soil reserves (soil P Index 2 and K Index 2-).

31
CompostCompost is both a soil conditioner and a source of major plant nutrients produced by the controlled biological decomposition of either ‘green waste’ (e.g. landscaping and garden waste) or from a mix of green waste and food waste in the presence of oxygen. Compost usually contains little readily available nitrogen, but repeated use over time can increase soil organic matter levels, improving workability and water-retention properties.
Compost that is certified under the Compost Certification Scheme does not normally need an environmental permit or exemption to be in place for application to land. Non-certified compost is usually applied to land under the Environmental Permitting Regulations. The Compost Certification Scheme sets baseline quality specifications, set by the British Standards Institution’s Publicly Available Specification 100 (PAS100). While the PAS scheme specifies minimum quality criteria, it also allows customers to specify higher quality thresholds. It is important to check whether customers have any additional quality requirements before compost is applied.
Table 2.17 Typical total nutrient content of compost (fresh-weight basis)
Compost
Compost typeDry matter Total nitrogen Total phosphate Total potash Total sulphur Total magnesium
% kg N/t kg P2O5/t kg K2O/t kg SO3/t kg MgO/t
Green 60 7.5 3.0 6.8 3.4 3.4
Green/food 60 11 4.9 8.0 5.1 3.4
Nutrient supply from compostThe available field experimental data indicates that green compost supplies only very small amounts of crop-available nitrogen and that manufactured fertiliser nitrogen application rates should not be changed for the next crop grown. In the case of green/food compost, the available experimental data indicates that around 5% of the total nitrogen applied is available to the next crop grown (irrespective of application timing). Following the repeated use of green and green/food composts, long-term soil nitrogen supply will be increased.
As little work has been done on the availability of compost phosphate to crops, it is appropriate to extrapolate from work on livestock manures and sewage sludge, which suggests that around 50% of the phosphate will be available to the next crop grown, with the remainder released slowly over the crop rotation. Around 80% of compost potash is in a soluble form and is readily available for crop uptake. Composts also supply useful quantities of sulphur and magnesium, although there is no data on availability to the next crop grown.
Points to consider
• The nutrient content of compost products will vary depending on the source materials and treatment process
• PAS100 compost should be supplied with specific nutrient content data and other relevant information
Further informationDigestate and compost in agriculture wrap.org.uk
Return to Contents

32
Compost
Understanding the value of compost applications
Assumed fertiliser costs: Nitrogen 60p/kg; phosphate 60p/kg; potash 60p/kg.a. Crop-available nitrogen is negligible or, for practical purposes, nil.b. Total phosphate and potash content used in calculations to maintain soil P and K Indices.
c. Saving for barley crop plus value of surplus compost phosphate and potash which will contribute to the nutrient requirement of future crops.
d. Nutrients required for maintenance of soil reserves (soil P Index 2 and K Index 2-).
Example 2.530 t/ha of green compost is applied in autumn to a sandy soil before drilling winter barley (8 t/ha grain yield, straw baled). The soil is at P Index 2 and K Index 2-. Allowing for the green compost nutrient supply saves up to £153/ha. This potential saving will be less where soil P or K Indices are above maintenance levels.
Return to Contents
Stage and calculation procedure Nitrogen (N) Phosphate (P2O5) Potash (K2O) Financial saving
1. Estimated total nutrients in green compost (kg/t)
Analysis provided by green compost supplier or typical values (Table 2.17) 7.5 3.0 6.8
2. Estimated available nutrients in green compost (kg/t)
Nitrogen NILa
Phosphate and potash (Table 2.17) 1.5 5.4
3. Nutrients supplied by green compost that are equivalent to manufactured fertiliser (kg/ha)
30 t/ha supplies 225 kg/ha total nitrogen NILa 90b 204b
Potential saving from green compost use £176/hac
4. Nutrient requirements for barley (kg/ha)
Section 4: Arable crops 200 65d 95d
5. Manufactured fertiliser needed for the barley crop (kg/ha)
Stage 4 minus Stage 3 200 NIL NIL
Actual saving for next crop due to green compost use £99/ha
6. Surplus compost phosphate and potash for subsequent crops that is equivalent to manufactured fertiliser (kg/ha)
Stage 3 minus Stage 4 NIL 20 109
Saving for subsequent crops due to green compost use £77/ha

33
Further informationDigestate and compost in agriculture PAS110 wrap.org.uk
Biofertiliser Certification Scheme biofertiliser.org.uk
Digestate Digestate is one of the products of anaerobic digestion, which is the controlled biological decomposition of biodegradable materials such as food wastes, animal manures and crops (e.g. maize and rye) in the absence of oxygen. Digestate is also known as ‘biofertiliser’ if it meets Biofertiliser Certification Scheme standards.
Digestate that is certified under the Biofertiliser Certification Scheme and farm-sourced digestate do not normally need an environmental permit or exemption to be in place for application to land. Non-certified digestate from non-agricultural sources is usually applied to land under the Environmental Permitting Regulations.
The Biofertiliser Certification Scheme sets baseline quality specifications, set by the British Standards Institution’s Publicly Available Specification 110 (PAS110). While the PAS scheme specifies minimum quality criteria, it also allows customers to specify higher quality thresholds. It is important to check whether customers have any additional quality requirements before digestate is applied.
Digestate is normally produced ‘whole’ (a slurry-like material with a dry matter content of around 5%), but this can be separated into fibre and liquid fractions. Typically, whole digestate and digestate liquid contain significantly more nitrogen in the readily available form than cattle slurry. Usually 80–90% of the nitrogen in whole and liquid digestate is in the readily available form and applications would be subject to closed-spreading periods in Nitrate Vulnerable Zones.
In separated fibre (typically 25% dry matter), usually less than 30% of the total nitrogen is in the readily available form and applications would not be subject to closed-spreading periods in Nitrate Vulnerable Zones, although this should be checked. Separated fibre contains considerably more phosphate than whole and liquid digestate.
The nutrient content of the digestate is controlled by the feedstock used in the digestion process. Food-based digestates will typically have much higher nutrient contents than farm-sourced (e.g. crop- and manure-based) digestate. The values in Tables 2.18 and 2.19 are indicative and nutrient contents are likely to vary considerably between sites.
PAS110 digestate will have been sampled and analysed regularly during production and should be supplied with specific nutrient content data. It is recommended that application rates of high readily available nitrogen digestates are carefully controlled to reduce the risk of excessive nitrogen applications.
Digestate
Points to consider• The nutrient content of digestate products will vary depending on
the source materials and treatment process
• PAS110 digestate should be supplied with specific nutrient content data and other relevant information
Return to Contents

34
Nutrient supply from digestateThe amount of crop-available nitrogen from digestate will depend on how much of the nitrogen applied is lost following application by ammonia emissions and nitrate leaching.
Information from research studies has shown that ammonia emissions from applications of whole and liquid digestate can be greater than from cattle slurries. Ammonia emissions from liquid digestate applications can be reduced by using precision-application equipment such as band spreaders or shallow injectors or, where appropriate, be incorporated rapidly into the soil. Precision-application equipment allows digestate to be spread evenly, increasing the nutrient use efficiency.
Spring applications are likely to supply more crop-available nitrogen than autumn timings as a result of reduced nitrate leaching losses. Data from the DC-Agri project indicates that crop-available nitrogen supply from spring applications of food-based digestate to cereal crops was 55% of total nitrogen, compared with 10% of total nitrogen applied from autumn applications. The use of precision application is recommended to ensure even application.
As little work has been done on the availability of digestate phosphate and potash to crops, it is appropriate to extrapolate from work on cattle slurries, which suggests that around 60% of the phosphate and 90% of potash will be available to the next crop grown, with the remainder released slowly over the crop rotation. Some digestates also supply useful quantities of sulphur and magnesium, although there is no data on availability to the next crop grown.
Digestate
Table 2.18 Typical total nutrient contents for food-based digestate
Table 2.19 Typical total nutrient contents for farm-sourced digestate
TypeDry
matter Total
NTotalP2O5
TotalK2O
Total MgO
TotalSO3
% kg/m3 or kg/t
Whole 4.1 4.8a,b 1.1 2.4 0.2 0.7
Separated liquid 3.8 4.5a,b 1.0 2.8 0.2 1.0
Separated fibre 27.0 8.9c 10.2 3.0 2.2 4.1
TypeDry
matter Total
NTotalP2O5
TotalK2O
Total MgO
TotalSO3
% kg/m3 or kg/t
Whole 5.5 3.6a,b 1.7 4.4 0.6 0.8
Separated liquid 3.0 1.9a,b 0.6 2.5 0.4 <0.1
Separated fibre 24.0 5.6c 4.7 6.0 1.8 2.1
a. Crop-available nitrogen supply from spring applications is around 55% of total nitrogen applied. Crop-available nitrogen supply following autumn applications to winter cereals is around 15% of total nitrogen applied.
b. For autumn applications to grass or oilseed rape, assume a crop-available nitrogen supply of 35% of total nitrogen applied.
c. For autumn applications, assume crop-available nitrogen supply of 10% of total nitrogen applied and 15% of total nitrogen applied for spring applications.
Return to Contents

35
Example 2.630 m3/ha of whole food-based digestate is applied using a band spreader in spring to winter wheat on a sandy soil (8 t/ha grain yield, straw baled, previous crop – cereal). The soil is at P Index 2 and K Index 2-. Allowing for the digestate nutrient supply saves £110/ha. This potential saving will be less where soil P or K Indices are above maintenance levels.
Digestate
Understanding the value of digestate applications
Assumed fertiliser costs: Nitrogen 60p/kg; phosphate 60p/kg; potash 60p/kg.a. Total phosphate and potash content used in calculations to maintain soil P and K Indices.
b. Nutrients required for maintenance of soil reserves (soil P Index 2 and K Index 2-).
Return to Contents
Stage and calculation procedure Nitrogen (N) Phosphate (P2O5) Potash (K2O) Financial saving
1. Estimated total nutrients in food-based digestate (kg/t)
Typical values 4.8 1.1 2.4
2. Estimated available nutrients in food-based digestate (kg/t)
Nitrogen (assuming 55% availability from spring application) 2.6
Phosphate and potash 0.7 2.2
3. Nutrients supplied by digestate that are equivalent to manufactured fertiliser (kg/ha)
30 m3/ha supplies 145 kg/ha total nitrogen 78 33a 72a
Potential saving from whole food-based digestate use £110/ha
4. Nutrient requirements for winter wheat (kg/ha)
Section 4: Arable crops 180 65b 85b
5. Manufactured fertiliser needed for the winter wheat crop (kg/ha)
Stage 4 minus Stage 3 102 32 13
Actual saving for winter wheat crop due to whole food-based digestate use £110/ha
6. Surplus digestate phosphate and potash for subsequent crops that is equivalent to manufactured fertiliser (kg/ha)
Stage 3 minus Stage 4 NIL NIL NIL
Saving for subsequent crops due to digestate compost use NIL

36
Waste-derived materials
Following the application of chemically/physically treated paper crumble nitrogen, ‘lock-up’ commonly occurs due to the high carbon:nitrogen ratio of the paper crumble, which immobilises soil nitrogen. As a general rule, around 0.8 kg of inorganic nitrogen is required per tonne (fresh weight) of paper crumble applied to compensate for the nitrogen ‘lock-up’ in the soil. As biologically treated paper crumble has a lower carbon:nitrogen ratio, nitrogen ‘lock up’ is not usually experienced following land spreading.
Spent mushroom compostTable 2.21 Typical total nutrient content of spent mushroom compost (fresh-weight basis)
Waste-derived materials The recycling of industrial wastes to agricultural land is controlled by environmental permitting regulations. These regulations allow the spreading of some industrial wastes onto agricultural land under a permit or an exemption, provided that certain conditions are met, including demonstration that they provide agricultural benefit or ecological improvement.
The application of such wastes must be registered with the Environment Agency, who will supply advice on the regulations and their interpretation. Industrial waste materials are supplied to farmers with specific nutrient content data and advice on how to best manage these materials to the benefit of soils and crops. The typical nutrient content of selected industrial ‘waste’ materials that are commonly recycled to farmland are summarised below.
Paper crumbleTable 2.20 Typical total nutrient content of paper crumble (fresh-weight basis)
Dry matter
Total nitrogen
Total phosphate
Totalpotash
Total sulphur
Total magnesium
% kg N/t kg P2O5/t kg K2O/t kg SO3/t kg MgO/t
Chemically/physically treated
40 2.0 0.4 0.2 0.6 1.4
Biologically treated 30 7.5 3.8 0.4 2.4 1.0
Dry matter
Total nitrogen
Total phosphate
Totalpotash
Total sulphur
Total magnesium
% kg N/t kg P2O5/t kg K2O/t kg SO3/t kg MgO/t
Spent mushroom compost
35 6.0 5.0 9.0 ND ND
To convert kg/t to units/ton, multiply by 2.
To convert kg/t to units/ton, multiply by 2.
Further informationEnvironmental permitting regulations gov.uk/topic/environmental-management/environmental-permits
Return to Contents

37
Waste-derived materials
To convert kg/t to units/ton, multiply by 2.
To convert kg/t to units/ton, multiply by 2.
Water treatment cakeTable 2.22 Typical total nutrient content of water treatment cake (fresh-weight basis)
Food industry wastesTable 2.23 Typical total nutrient content of food industry wastes (fresh-weight basis)
Return to Contents
Dry matter
Total nitrogen
Total phosphate
Totalpotash
Total sulphur
Total magnesium
% kg N/t kg P2O5/t kg K2O/t kg SO3/t kg MgO/t
Water treatment cake
25 2.4 3.4 0.4 5.5 0.8
Dry matter
Total nitrogen
Total phosphate
Totalpotash
Total sulphur
Total magnesium
% kg N/t kg P2O5/t kg K2O/t kg SO3/t kg MgO/t
Dairy 4 1.0 0.8 0.2 ND ND
Soft drinks 4 0.3 0.2 Trace ND ND
Brewing 7 2.0 0.8 0.2 ND ND
General 5 1.6 0.7 0.2 ND ND

38
Glossary
Digestate Organic material produced by anaerobic digestion of biodegradable organic materials. May be separated into liquid and fibre fractions after digestion.
Dirty water Lightly contaminated run-off from lightly fouled concrete yards or from the dairy/parlour that is collected separately from slurry. It does not include liquids from weeping-wall stores, strainer boxes, slurry separators or silage effluent which are rich in nitrogen and regarded as slurries.
FACTS UK national certification scheme for advisers on crop nutrition and nutrient management. Membership renewable annually. A FACTS Qualified Adviser has a certificate and an identity card.
Farmyard manure (FYM) Livestock excreta that is mixed with straw bedding material that can be stacked in a heap without slumping.
Fertiliser See Manufactured fertiliser.
Incorporation A technique (discing, rotovating, ploughing or other methods of cultivation) that achieves some mixing between an organic manure and the soil. Helps to minimise loss of nitrogen to the air through volatilisation and nutrient run-off to surface waters.
Layer manure Poultry excreta with little or no bedding.
Glossary
Available (nutrient) Form of a nutrient that can be taken up by a crop immediately or within a short period so acting as an effective source of that nutrient for the crop.
Biosolids Treated sewage sludge.
Clay Finely divided inorganic crystalline particles in soils, less than 0.002 mm in diameter.
Coefficientof Measure of the unevenness of application variation (CV) of fertilisers or manures. CV of 0% indicates perfectly even spreading, unachievable in practice. Correct operation of a well-set-up spreader should give a CV of 10% for fertilisers and 25% for manures under field conditions.
Compost Organic material produced by aerobic decomposition of biodegradable organic materials.
Content (nutrient) Commonly used instead of the more accurate ‘concentration’ to describe nutrients in fertiliser or organic manure. For example, 6 kg N/t often is described as the nitrogen content of a manure.
Crop-available nitrogen The total nitrogen content of organic manure that is available for crop uptake in the growing season in which it is spread on land.
Denitrification Microbial conversion of nitrate and nitrite in anaerobic soil to nitrogen gas and some nitrous oxide.
Return to Contents

39
Glossary
Leaching Process by which soluble materials such as nitrate or sulphate are removed from the soil by drainage water passing through it.
Livestock manure Dung and urine excreted by livestock or a mixture of litter, dung and urine excreted by livestock, even in processed organic form. Includes FYM, slurry, poultry manure, separated manures and granular or pelletised manures.
Manufactured fertiliser Any fertiliser that is manufactured by an industrial process. Includes conventional straight and NPK products (solid or fluid), organo-mineral fertilisers, rock phosphates, slags, ashed poultry manure and liming materials that contain nutrients.
Manure See Livestock manure and Organic manure.
Micronutrient Boron, copper, iron, manganese, molybdenum and zinc, which are needed in very small amounts by crops. Cobalt and selenium are taken up in small amounts by crops and are needed in human and livestock diets.
Mineralisation Microbial breakdown of organic matter in the soil, releasing nutrients in crop-available, inorganic forms.
Neutralising Value (NV) Percentage calcium oxide (CaO) equivalent in a material. 100 kg of a material with a neutralising value of 52% will have the same neutralising value as 52 kg of pure CaO. NV is determined by a laboratory test.
Nitrate Vulnerable Areas designated by Defra as being at risk fromZones (NVZs) agricultural nitrate pollution.
Nitrous oxide (N2O) A potent greenhouse gas that is emitted naturally from soils. The amount emitted is related to supply of mineral nitrogen in the soil so increases with application of manures and fertilisers, incorporation of crop residues and growth of legumes. It is greater in organic and peaty soils than in other soils.
Offtake Amount of a nutrient contained in the harvested crop (including straw, tops or haulm) and removed from the field. Usually applied to phosphate and potash.
Organic materials Livestock manures and all other nitrogen- (manure) containing organic materials, such as sewage sludge, composts, food wastes and organic wastes (treated and untreated).
Peaty soil (peat) Soil containing more than 20% organic matter.
Poultry manure Excreta produced by poultry, including bedding material that is mixed with excreta, but excluding duck manure with a readily available nitrogen content of 30% or less.
Prilled fertiliser Fertiliser in which particles (prills) are formed by allowing molten material to fall as droplets in a tower. Droplets solidify during the fall and tend to be more spherical and somewhat smaller than granules.
Return to Contents

40
Glossary
Readily available Nitrogen that is present in livestock and other nitrogen organic manures at the time of sampling in molecular forms that can be taken up immediately by the crop (ammonium or nitrate, or in poultry manure uric-acid N). High in slurries and poultry manures (typically 35–70% of total N) and low in FYM (typically 10–25%).
Sand Soil mineral particles larger than 0.05 mm.
Silt Soil mineral particles in the 0.002–0.05 mm diameter range.
Slurry Excreta of livestock (other than poultry), including any bedding, rainwater and washings mixed with it, which can be pumped or discharged by gravity. The liquid fraction of separated slurry is also defined as slurry.
Soil Index (P, K or Mg) Concentration of available P, K or Mg, as determined by standard analytical methods, expressed in bands or Indices.
Soil Nitrogen Supply The amount of nitrogen (kg N/ha) in the soil (SNS) that becomes available for uptake by the crop in the growing season, taking account of nitrogen losses.
Soil organic matter Often referred to as humus. Composed of organic compounds ranging from undecomposed plant and animal tissues to fairly stable brown or black material with no trace of the anatomical structure of the material from which it was derived.
Soil type Description based on soil texture, depth, chalk content and organic matter content.
Solid manure Organic manure which can be stacked in a free-standing heap without slumping.
Target Soil Index Lowest soil P or K Index at which there is a high probability that crop yield will not be limited by phosphorus or potassium supply. See Soil Index (P, K or Mg).
Tillage land Land that is not being used for grass production and is sown with a crop.
Volatilisation Loss of nitrogen as ammonia from the soil to the atmosphere.
Water-soluble phosphate Phosphate, expressed as P2O5, that is measured by the statutory method for fertiliser analysis. Not necessarily a measure of available, phosphate – high water solubility indicates high availability but low water solubility does not necessarily indicate low availability.
Return to Contents

41
Notes

42
Notes

43
Notes

Produced for you by:AHDB Stoneleigh Park Kenilworth Warwickshire CV8 2TL
W ahdb.org.uk @The_AHDB
If you no longer wish to receive this information, please email us on [email protected]
While the Agriculture and Horticulture Development Board seeks to ensure that the information contained within this document is accurate at the time of printing, no warranty is given in respect thereof and, to the maximum extent permitted by law, the Agriculture and Horticulture Development Board accepts no liability for loss, damage or injury howsoever caused (including that caused by negligence) or suffered directly or indirectly in relation to information and opinions contained in or omitted from this document.
© Agriculture and Horticulture Development Board 2020. All rights reserved.
70020 0221
For specific AHDB Nutrient Management Guide (RB209) enquiries:T 024 7647 8784 E [email protected] order printed publications:T 0845 245 0009 E [email protected]