dirk brook – punrak drain - peel-harvey catchment … brook - punrak drain: nutrient report 2010...
TRANSCRIPT

Nutrient summary: median concentrations, loads and status classification at 614094Year 1996 1997 1998 1999 2000 2001 2002 2003 2004 2005 2006 2007 2008 2009Annual flow (GL) 28 16 15 23 21 4.3 15 42 4.1* 15 15 18TN median (mg/L) 1.4 1.2 1.1 1.75 1.4 1.9 2.1 1.4 1.9 2.2 2.1 1.7 2.0 1.7TP median (mg/L) 0.19 0.19 0.21 0.29 0.19 0.20 0.19 0.15 0.17 0.26 0.26 0.17 0.23 0.15TN load (t/year) 57 31 28 46 43 7.3 29 88 10* 35 30 40TP load (t/year) 7.1 3.8 3.5 5.8 5.5 0.88 3.4 11 1.3* 3.7 3.6 4.6
Status classification Low Moderate High Very highStatus reported for three-year period end (i.e. 1996–98 reported in 1998) TN = total nitrogen TP = total phosphorus
* best estimate using available data
Dirk Brook – Punrak Drain
Government of Western AustraliaDepartment of Water
Peel-Harvey catchmentNutrient report 2010
Dirk Brook begins on the Darling Plateau, before flowing onto the Swan Coastal Plain, where it is joined by Myara Brook. To the north, Karnet Brook also flows from the plateau, becoming Karnet Drain before its confluence with Dirk Brook. It is at this point the modified drainage system is re-named Punrak Drain.
Punrak Drain flows into Lake Amarillo, one of the Serpentine Lakes. It is responsible for contributing large amounts of nutrients, especially nitrogen, to the Serpentine River and Lakes and depositing sediment at the drain’s outflow – widening the delta.
Since 2006, water quality has been monitored near the bottom of the catchment at the gauging station at Yangedi Swamp (614094). Before this, samples were collected approximately 600 m upstream near the Punrak Road Bridge.
Flow has been measured at the gauging station since 1995. Initially this was undertaken by the Water Corporation however in 2005 the Department of Water assumed responsibility. There was a period of approximately two years when flow was not measured (2004 to 2005).
Punrak Drain flows year-round during wet years but ceases to flow from around December to May in dry years. Much of the Punrak Drain catchment is subject to seasonal inundation (52%).
To the east of the Darling Scarp the catchment remains relatively undisturbed. To the west, the land has been cleared, mostly for agriculture (e.g. stock grazing), as well as more intensive land uses (e.g. piggeries and turf farms). The soils in the greater catchment vary, however the Punrak Drain catchment consists entirely of sandy and clayey swamps and leached sands and has a high or very high risk of phosphorus leaching to waterways.
Punrak Drain
Flow
Serpentine River inflow
Punrak Drain delta
Serpentine River outflow
_̂614094
Punrak Draincatchment
Dirk Brookcatchment
±Dirk Brook
Karnet Brook
Punrak Drain
Karnet Drain
Myara BrookLegend
Catchment boundaryGauging station and sampling point_̂
0 1 2 3 4 5km
Land use classification (2006) Area(km2) (%)
Animal keeping – non-farming (horses) 8.9 6.6Cattle for beef (predominantly) 37 28Cattle for dairy 3.5 2.6Conservation and natural 70 53Horticulture 2.4 1.8Industry, manufacturing and transport 1.3 1.0Intensive animal use 0.87 0.65Lifestyle block 1.0 0.75Mixed grazing 4.1 3.1Plantation 3.9 2.9Residential <0.01 <0.01 Total 134 100
Dirk Brook - Punrak Drain: Nutrient report 2010
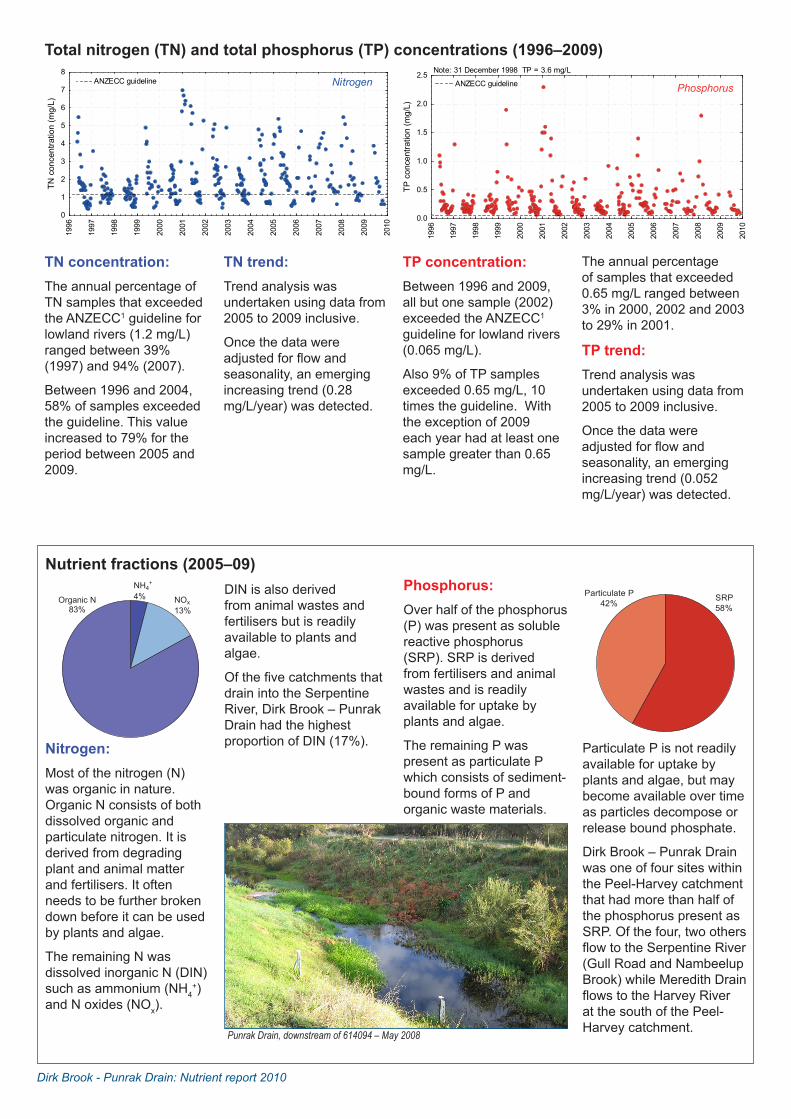
DIN is also derived from animal wastes and fertilisers but is readily available to plants and algae.
Of the five catchments that drain into the Serpentine River, Dirk Brook – Punrak Drain had the highest proportion of DIN (17%).
Nutrient fractions (2005–09)
The annual percentage of samples that exceeded 0.65 mg/L ranged between 3% in 2000, 2002 and 2003 to 29% in 2001.
TP trend:Trend analysis was undertaken using data from 2005 to 2009 inclusive.
Once the data were adjusted for flow and seasonality, an emerging increasing trend (0.052 mg/L/year) was detected.
TN concentration:The annual percentage of TN samples that exceeded the ANZECC1 guideline for lowland rivers (1.2 mg/L) ranged between 39% (1997) and 94% (2007).
Between 1996 and 2004, 58% of samples exceeded the guideline. This value increased to 79% for the period between 2005 and 2009.
TP concentration:Between 1996 and 2009, all but one sample (2002) exceeded the ANZECC1 guideline for lowland rivers (0.065 mg/L).
Also 9% of TP samples exceeded 0.65 mg/L, 10 times the guideline. With the exception of 2009 each year had at least one sample greater than 0.65 mg/L.
TN trend:Trend analysis was undertaken using data from 2005 to 2009 inclusive.
Once the data were adjusted for flow and seasonality, an emerging increasing trend (0.28 mg/L/year) was detected.
Nitrogen: Most of the nitrogen (N) was organic in nature. Organic N consists of both dissolved organic and particulate nitrogen. It is derived from degrading plant and animal matter and fertilisers. It often needs to be further broken down before it can be used by plants and algae.
The remaining N was dissolved inorganic N (DIN) such as ammonium (NH4
+) and N oxides (NOx).
Phosphorus:Over half of the phosphorus (P) was present as soluble reactive phosphorus (SRP). SRP is derived from fertilisers and animal wastes and is readily available for uptake by plants and algae.
The remaining P was present as particulate P which consists of sediment-bound forms of P and organic waste materials.
Particulate P is not readily available for uptake by plants and algae, but may become available over time as particles decompose or release bound phosphate.
Dirk Brook – Punrak Drain was one of four sites within the Peel-Harvey catchment that had more than half of the phosphorus present as SRP. Of the four, two others flow to the Serpentine River (Gull Road and Nambeelup Brook) while Meredith Drain flows to the Harvey River at the south of the Peel-Harvey catchment.
Organic N83%
NH4+
4% NOx13%
Total nitrogen (TN) and total phosphorus (TP) concentrations (1996–2009)
1996
1997
1998
1999
2000
2001
2002
2003
2004
2005
2006
2007
2008
2009
2010
0
1
2
3
4
5
6
7
8
TN c
once
ntra
tion
(mg/
L)
NitrogenANZECC guideline
1996
1997
1998
1999
2000
2001
2002
2003
2004
2005
2006
2007
2008
2009
2010
0.0
0.5
1.0
1.5
2.0
2.5
TP c
once
ntra
tion
(mg/
L)
Note: 31 December 1998 TP = 3.6 mg/L
PhosphorusANZECC guideline
Particulate P42%
SRP58%
Punrak Drain, downstream of 614094 – May 2008

Dirk Brook - Punrak Drain: Nutrient report 2010
All average monthly TP and SRP concentrations exceeded ANZECC1 guideline values.
ANZECC 20001
Months exceeded
TN 1.2 mg/L Nov – Sept
NH4+ 0.08 mg/L Jan – Jun,
NovNOx 0.15 mg/L May – SeptTP 0.065 mg/L AllSRP 0.04 mg/L All
Plant growthIn recent years Punrak Drain has become choked with grass and weeds despite ongoing efforts to remove them.
Fish deathsIn February 2002 approximately 100 cobbler died in Punrak Drain. The cobbler, which were either migrating upstream or living in the drain, had become trapped in small, stagnant, isolated pools.
It was determined that water had been diverted from the drain into the artificial wetland constructed upstream, reducing downstream flow and causing the drain to become a series of pools. Action was taken to ensure that environmental flows are considered when diverting water from the drain to prevent this from happening again.
Average monthly concentrations of TN exceeded ANZECC1 guidelines throughout the year (with the exception of October).
ANZECC1 guideline concentrations were also exceeded in summer by average monthly NH4
+ concentrations and in winter by average NOx concentrations.
Catchment remediation2
Many nutrient reduction measures have been undertaken in the Dirk Brook catchment. In 2001 an artificial wetland was constructed and riffles and meanders were also installed in waterways. Revegetation and stock exclusion took place during subsequent years. The aim was to reduce nutrient concentrations and sediment loads, while enhancing the system’s ecological values by slowing the flows, increasing oxygen concentrations and providing habitat.
The effect of individual interventions on nutrient concentrations could not be assessed due to insufficient data. Similarly, ecological monitoring was not undertaken after these activities so their effectiveness in improving stream health could not be determined.
No improvement in nutrient concentrations at the bottom of the catchment was observed. This is not surprising given the extent of the remediation works in contrast to the size of the entire catchment, as well as land use intensification.
Phosphorus:TP concentrations were greatest between January and April when flow was at its lowest.
Average monthly SRP concentrations were greater than particulate P concentrations with the exception of May and November. During March and April SRP was elevated, possibly due to nutrient-rich groundwater seepage.
Nitrogen:TN and organic N concentrations were greatest during low flows. The high concentrations during the summer were possibly caused by decaying plant matter, or from nutrient-rich groundwater seepage.
Increased winter flows diluted the organic N however average monthly NOx concentrations increased, possibly due to excess fertilisers and animal wastes being flushed into the system.
Seasonal variation in nutrient concentrations and riverine flow (2005–09)NH 4
+ NOxAverage monthly TN Organic N Flow TP Particulate P SRP
Flow
(ML/
day)
Nitr
ogen
con
cent
ratio
n (m
g/L)
0
50
100
150
0
1
2
3
4
5
6
Jan Feb Mar Apr May Jun Jul Aug Sep Oct Nov Dec
Phos
phor
us c
once
ntra
tion
(mg/
L)
Flow
(ML/
day)
0
50
100
150
0
0.2
0.4
0.6
0.8
1
1.2
Jan Feb Mar Apr May Jun Jul Aug Sep Oct Nov Dec
Clear – December 2005 Choked – January 2010Punrak Drain, 614094
Meander and riffle – 2001Un-named drain, north of Karnet Brook
Artificial wetland entrance – 2001Punrak Drain, upstream of 614094

Septic Intensive animal useAnimal keeping – non-farming (horses) Lifestyle blockCattle for beef (predominantly) Mixed grazingCattle for dairy PlantationConservation and natural ResidentialHorticulture Industry, manufacturing and transport
Dirk Brook - Punrak Drain: Nutrient report 2010
Artificial wetland entrance – 2001Punrak Drain, upstream of 614094 Wetland island – 2005
Annual exports to Peel InletThe Dirk Brook – Punrak Drain catchment is 1.6% of the area that drains to the Peel Inlet. On average it contributed to the Peel Inlet:
• 4% of the flow (18 GL/year)
• 7% of the nitrogen load (51 tonnes/year)
• 8% of the phosphorus load (5.6 tonnes/year).
Remediation priorityThe SQUARE-modelled data indicated that based on nutrient loads per cleared area (kg/ha/year):
• Punrak Drain catchment requires high-priority nitrogen and phosphorus remediation action
• Dirk Brook catchment requires high-priority nitrogen and medium-priority phosphorus remediation action.
Modelled results (1997–2007)3
This page reports results from the Streamflow Quality Affecting Rivers and Estuaries (SQUARE) model. It estimated flow, nitrogen and phosphorus loads at the outlets of the 13 subcatchments of the Peel-Harvey estuary.
Nutrient sources There were five main sources of nutrient load in the Dirk Brook – Punrak Drain catchment: ‘cattle for beef’, ‘intensive animal use’, ‘horticulture’, ‘cattle for dairy’ and ‘horse properties’.‘Intensive animal use’ consists of two piggeries, two poultry farms and one dairy. While they only occupied 0.6% of the catchment area, they were responsible for 16% of the nitrogen and 26% of the phosphorus load. Area: Nitrogen: Phosphorus:
How Dirk Brook – Punrak Drain fits within the Peel-Harvey catchment: location and statistics
ISBN 978-1-921992-67-4 (online)
References1 ANZECC & ARMCANZ 2000, Australian guidelines for water quality monitoring and reporting, National Water Quality Management
Strategy, Paper no. 7, Australian and New Zealand Environment and Conservation Council & Agriculture and Resource Management Council of Australia and New Zealand, Canberra.
2 Cousins, MD 2010, Water quality of Dirk Brook, Western Australia – status and trends 2000 – 2006, Water Science Technical Series, Report no. 27, Department of Water, Western Australia – draft.
3 Kelsey, P, Hall, J, Kretschmer, P, Quinton, B & Shakya D 2010, Hydrological and nutrient modelling of the Peel-Harvey catchment, Water Science Technical Series, Report no. 33, Department of Water, Western Australia.
www.water.wa.gov.au For further information please contact the Water Science Branch, Department of [email protected]
Dirk Brook – Punrak Drain had the greatest nitrogen load per cleared area
of all the catchments draining to the Peel-Harvey estuary
Catchment draining to estuary
Area (km2)
Flow (GL)
TN load (tonnes/
year)
TN load per cleared area
(kg/ha)
TP load (tonnes/
year)
TP load per cleared area
(kg/ha)Peel Main Drain 120 11 26 3.0 4.5 0.52Upper Serpentine 502 55 106 3.8 21 0.75Dirk Brook – Punrak Drain 134 18 51 7.5 5.6 0.82Nambeelup 143 19 44 3.6 10.5 0.86Lower Serpentine 94 6.2 9.7 1.6 2.9 0.49Mandurah 24 3.0 7.9 5.0 1.3 0.84Upper Murray 6 752 286 204 0.51 4.9 0.01Lower Murray, mid Murray and Dandalup 638 74 198 6.4 4.9 0.16
Coolup (Peel) 151 23 42 3.2 15 1.2Subtotal Peel Inlet 8 558 496 701 1.4 73 0.14Coolup (Harvey) 113 16 26 3.3 14 1.8Mayfield Drain 119 19 33 3.1 7.1 0.67Harvey 710 142 259 6.9 39 1.0Meredith Drain 56 11 16 4.3 8.3 2.2Subtotal Harvey Estuary 998 188 334 5.6 69 1.2Total Peel-Harvey estuary 9 556 684 1 035 1.8 142 0.25
!
!
!
!
!
!
!
!
!
!
!
!
!
!
!
MyalupHarvey
Byford
Waroona
Kwinana
Mandurah
Pinjarra
Fremantle
SerpentineRockingham
Ravenswood
Dwellingup
Preston Beach
North Dandalup
0 10 20 30 405km
±Peel-Harvey catchmentCatchment boundaryDirk Brook – Punrak Drain