nutrient characteristics of the water masses and their
TRANSCRIPT

1
Author version: Mar. Environ. Res., vol.70(3-4); 2010; 272-282
Nutrient characteristics of the water masses and their seasonal variability in the eastern equatorial Indian Ocean
S. Sardessai1*, Suhas Shetye2, M.V. Maya1, Mangala K.R.1 S. Prasanna Kumar1
1National Institute of Oceanography, Dona-Paula, Goa,-403004. India (Council of Scientisfic & Industrial Research, New Delhi, India) 2National Centre for Antarctic & Ocean Research, Headland Sada, Vasco da Gama, Goa-403804, India.
(Ministry of Earth Sciences, Government of India) S. Sardessai: [email protected] Suhas Shetye: [email protected] M.V. Maya: [email protected] Mangala K.R. [email protected] Prasanna Kumar: [email protected] Equal contribution from all the authors
Abstract Nutrient characteristics of four water masses in the light of their thermohaline properties are examined in the eastern Equatorial Indian Ocean during winter, spring and summer monsoon. The presence of low salinity water mass with “Surface enrichments” of inorganic nutrients was observed relative to 20 m in the mixed layer. Lowest oxygen levels of 19 µM at 3°N in the euphotic zone indicates mixing of low oxygen high salinity Arabian Sea waters with the equatorial Indian Ocean. The seasonal variability of nutrients were regulated by seasonally varying physical processes like thermocline elevation, meridional and zonal transport, the equatorial undercurrent and biological processes of uptake and remineralisation. Circulation of Arabian Sea high salinity waters with nitrate deficit could also be seen from low N/P ratio with a minimum of 8.9 in spring and a maximum of 13.6 in winter. This large deviation from Redfield N/P ratio indicates the presence of denitrified high salinity waters with a seasonal nitrate deficit ranging from -4.85 to 1.52 in the Eastern Equatorial Indian Ocean.
Key words: Equatorial Indian Ocean; thermohaline characteristics; chemical properties; water masses; nutrients; dissolved oxygen; N/P ratio; nitrate deficit; seasonal variability.
*Corresponding Author: S. Sardessai Chemical Oceanography Division, National Institute of Oceanography Dona-Paula, Goa-403004, India Tel: +91(832) 2450290; Fax: +91(832) 2450607 [email protected]

2
1. Introduction
Seasonal thermohaline alteration in the equatorial Indian Ocean caused by surface circulation,
voluminous precipitation and fresh water flow is unique to this region due to the reversing annual wind
patterns associated with Asian monsoon system (from 10°S to 10°N). Consequently the equatorial
currents are seasonal and differ in character from those in the other oceans (Schott and McCreary, 2001).
During the north-east monsoon from November to March there is an eastward flowing equatorial
counter current and a westward flowing north equatorial current apart from the circulations in the
northern Indian ocean. During south west monsoon from May to September, equatorial counter current
merges with the easterly flowing south-west monsoon current and continues to flow to the east. These
zonal currents along the hydrothermal front prevent any general meridional exchange in the upper layers
between the northern and the southern regions except at the eastern and western boundaries (Morales et
al. 1996). They feed the waters drifting south from the central part of the Arabian Sea (Rochford, 1964).
The low salinity surface water mass in the equatorial Indian ocean is formed due to excess
precipitation over evaporation which characterizes the northeastern part (Bay of Bengal) of the Indian
ocean (Rao and jayaraman, 1968; Sengupta et al. 2006) and incursion of the Pacific ocean water through
the Indonesian ThrouFlow (ITF) into the Indian ocean (Sharma et al. 1978). The high salinity water
mass (35-35.6) beneath the less saline surface water form the shallow subsurface maximum and shows
seasonal spatial variability. Based on an ocean general circulation model coupled to an atmospheric
boundary layer model, Schiller (2003) reported that the seasonal cycle of the thermocline water mass
transportation in the Indian waters is associated with seasonal density fluxes and interior mixing. This
water mass is found between 0-190 m . The depth of the salinity maximum deepens where the low
salinity water overlies it. The primary purpose of the present study is to categorize the different water
masses and their seasonal changes, based on their temperature-salinity (TS) characteristics, the oxygen
and nutrients characteristics in the upper 1000 m water column and to add to the sparse information on
the chemical features of the Eastern Equatorial Indian Ocean.
2. Material and Methods
The present study region extends from 5°N to 5°S along 77°E and 83°E (Fig. 1). The variability in
temperature, salinity, dissolved oxygen (DO) and nutrients (nitrate, nitrite, phosphate and silicate) is
studied during winter monsoon (November, 2002, SK 183a) at 77°E and spring intermonsoon (April-
May, 2005, SK 220) and summer monsoon (August, 2006 SK 227) at 77°E and 83°E. Samples were

3
collected at discrete depths in the upper 1000m water column on board ORV Sagar Kanya using 10/30
litres Go- flow bottles attached to a rosette connected to a Sea Bird CTD. The temperature and salinity
profiles were obtained from the CTD data while samples collected in the Go- flow bottles were
subsampled for dissolved oxygen, and nutrients in glass and plastic bottles respectively. Dissolved
oxygen was estimated by the Winkler method (Grasshoff, 1983). Nitrate, nitrite, phosphate were
estimated by autoanalyser (Skalar model 5100/1) during the spring intermonsoon and nitrate, nitrite,
phosphate and silicate were analysed by following the manual methods of Grasshoff et al. (1983) during
the other two seasons using the UV-Visible spectrophotometer within 24 hours of collection. There was
good agreement in the precision between the two methods. The detection limits for nitrate, phosphate
and silicate were 0.1, 0.03 and 0.5 µ mol L-1 respectively. (Position of Fig 1.)
3. Results and Discussion
3.1. Water masses in the area of observation
You and Tomczak (1993) has reviewed the water masses in the Indian Ocean identified by the earlier
workers ( Sverdrup et al. 1942; Mamalev, 1975; and Shcherbinin, 1969) and their characteristics in the
upper Indian ocean. The description of the water masses indicate the presence of the Bay of Bengal
water ( BOB) in the surface layer, the Red Sea water and Persian Gulf water (Arabian Sea High Salinity
Water, ASHSW), the Australasian Mediterranean water (AAMW) (fig.1) which originates from the deep
basins of the Australasian Mediterranean Sea and the Indian Central water (ICW) subducted in the
subtropical Convergence of Southern Hemisphere. Position of ( fig. 1)
The potential temperature-salinity relationship during different seasons (fig. 2) indicate the perennial
presence of low salinity water mass in the surface layer resulting from local excess of precipitation
over evaporation, the influx of the low salinity waters from the North eastern Indian ocean by Ekman
transport ( Sengupta et al. 2006) and the low salinity Australasian Mediterranean waters (AAMW)
flowing from the Indonesian through flow (ITF) which then spreads towards the west under the
influence of south equatorial current. Based on the three dimensional trajectories and tracer pathways
Valsala and Ikeda (2007) observed that the ITF resides in the shallow region of the northern Indian
Ocean owing to the major upwelling zones in the north and gradually deepens towards the equator.
Jensen (2003) also confirms southern Indian ocean sources in the mixed layer of the Arabian sea which
includes ITF. The throughflow transport appears to vary seasonally with maximum values during
northern summer (July-September) and almost negligible values during northern winter (January-March)

4
(Fieux et al. 1994, 1996b; Arief and Murrey, 1996). The scatter in the data is largely due to the spatial
variability in the influx of less saline waters during different seasons. The high sea surface salinity and
low temperature in the Arabian Sea during winter increase the surface water density and leads to the
formation of ASHSW. This ASHSW sinks to subsurface depth (50-100 m) and spreads southward in
the Arabian Sea and equatorial region (Prasanna Kumar & Prasad 1999) The ASHSW is seen along
isopicnal surfaces (sigma Ө- 23-24). The deeper layers between 200 to 1000 m show two distinct water
masses with marked salinity changes. The water mass to the north of the equator with a salinity range of
35-35.1 is seen at 200 m to the south and spreads down to 1000 m to the north of the equator in all the
three seasons. The low salinity water mass to the south of the equator is characterized by a salinity of
≤ 34.9 and is confined between 500 to 1000m to the south of the equator during winter and summer
monsoon whereas it occupied a narrow band between 2°S to 5°S during spring. This water mass is
identified as the intrusion of low salinity waters from the Australasian Mediterranean waters (AAMW)
under the influence of south equatorial counter current (Sharma et al. 1978). The northern higher salinity
water mass is a mixture of the Persian Gulf and Red Sea waters which is found at 200 m at 5° S in the
meridional region of our observations and flows down to 800 m to the north and termed as Indian
central water (ICW) (You and Tomczak, 1993). (position of Fig.2)
3.2. Seasonal variability of water masses
The seasonal variability of water masses are largely governed by the seasonal physical forcings in the
upper 120 m of the water column. During winter season (November 2002), starting at 60 m at the
southern end of the transect (5°S) the 28° C isotherm gradually slopes upwards with maximum elevation
to 40 m at 2° S and deepens to 70 m at the equator. The isotherm shoaled up to 50 m at 3°N (Fig.3a).
The near surface water mass was less saline (34.4-35.0) and extended from equator to 5°S down to 40
m with isolines of increasing salinity shoaling up from 60 m towards the equator (Fig. 3d). The fall jet
induced Arabian Sea high salinity water core ranging from 35.2 -35.6 was observed to the north of the
equator and spread down to 120 m depth. During the spring intermonsoon (May 2005) (fig. 3b) the
mixed layer depth was gradually reduced from 60 m at the equator to 20 and 40 m towards the south
and north of it respectively and shoaling up of the thermocline was observed at 3°N. The isothermal
layer was warmer (>29°C) compared to the winter season and the thermocline deepened to 250 m at
5°N. The core of high salinity water observed to the north of the equator under the influence of fall jet
shifted to the south of it during spring intermonsoon and extended from 20 to 120 m and the low
salinity surface water mass (34.0- 34.6) was restricted to the south and north of the equator up to 40 m

5
(fig.3e). The summer monsoon (August 2006) was characterized by shoaling of the subsurface waters at
2°S and sinking at 2°N. The isothermal layer was shallow towards the south and the 29°C isotherm was
found almost up to the surface at 5°S and at 20 m at 2°S and deepened to about 70 m at 2°N. A deep
thermocline (225 m) was observed during this season towards the north of the equator and the presence
of the Equatorial Under Current between 80 to 300 m during this season depressed the isotherms to
deeper depths (Fig.3c). The low salinity waters (34.6-34.9) occupied the upper 40 m and extended from
4°S to 3°N whereas the core of subsurface salinity maximum (35.1-35.3) occupied the region between
5°S to 2°N between 60 to 200 m. High salinity water mass was also observed from 4 to 5°N from
surface to a depth of about 120 m (fig.3f).
(Position of Fig. 3)
Measurements carried out during spring intermonsoon and summer monsoon at 83° E (fig. 4) were
found to be similar to that observed at 77°E . In this region the core of subsurface high salinity water
spreads from north to south during spring intermonsoon (Fig.4c) whereas it is confined to the southern
region during summer monsoon in the depth range of 40 to 120 m (fig.4d). The deeper water masses do
not show temporal variability. However the extent of spreading of these two water masses in the deep
waters depends on the seasonally varying advection.
(Position of Fig.4)
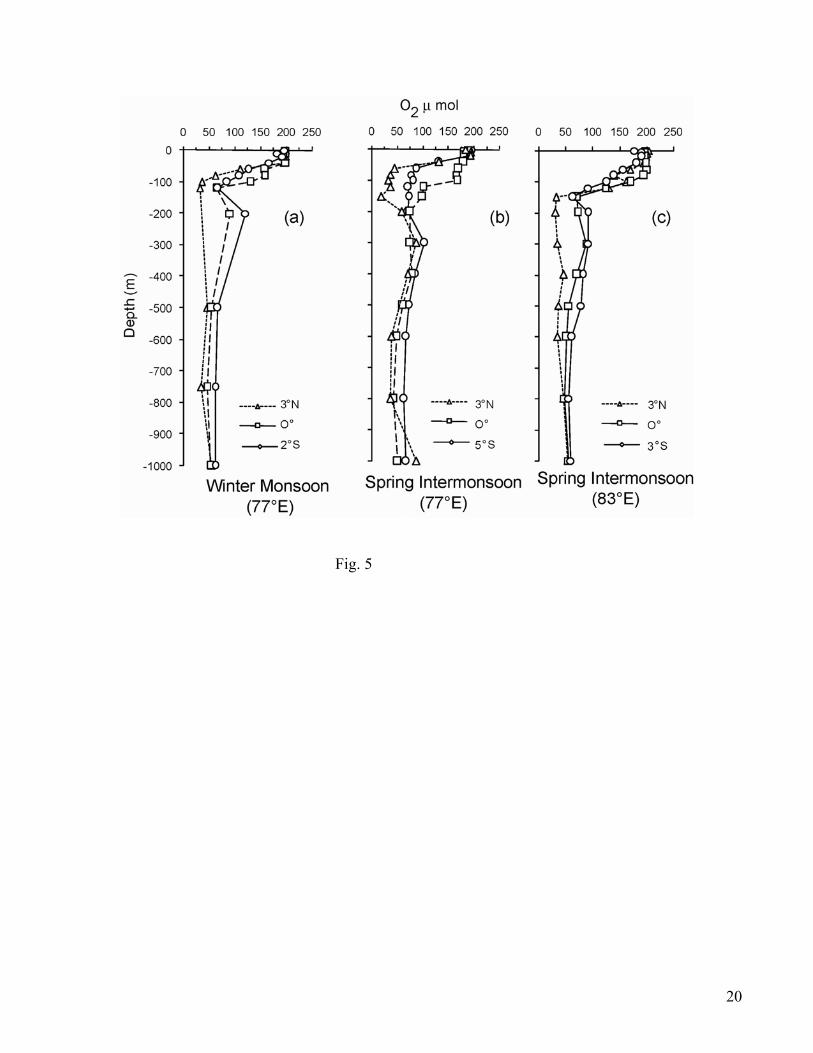
3.3. Oxygen
(Position of Fig.5)
The oxygen variability in the upper 1000 m depth is plotted in the regions of intense physical forcings
i.e. in the region of thermocline shoaling up between 2° S to 5° S; in the region of convergence at the
equator and corresponding upwelling at 3°N during winter and spring seasons at 77°E (Fig.5a,b) and at
3° S , equator and 3°N at 83°E in spring season (Fig.5c). The isothermal layer (>28°C) down to 40 m
at 2°S and the deeper convergence zone at the equator down to 70 m was characterized by high
oxygen levels (>190µM) during winter season. The top of the thermocline was associated with 194 µM
of oxygen which rapidly decreased to 32 µM at the bottom of the thermocline at 120 m. at 3°N. This is
the subsurface oxygen minima of 32µM observed at 3°N which is associated with high salinity Arabian
Sea water (35.2-35.6) north of the equator. The oxygen levels increased to 67 µM at the equator and at
2°S due to the mixing of the low oxygen and high salinity water with the low salinity (34.8-35)

6
subsurface equatorial Indian Ocean water. The gradual decrease in the oxygen levels in the deeper
waters showed minimum oxygen of 50 µM confined to the north of the equator whereas oxygen levels
were higher at similar depths towards the south. The warmer mixed layer (>29°C) during spring had
180µM of oxygen in the surface layer. The upheaval of the thermocline at 5°S elevated the water mass
with low oxygen (132µM) to 40 m whereas the convergence at the equator increased the oxygen to
167µM down to 100 m (fig.5b). The shoaling up of the water mass at 3° N brought the low oxygen
waters of about 40 µM from deeper layers to shallower depths of 80 to 120 m. The oxygen minima of
19 µM (salinity 35.02) was found at 150 m at 3°N which gradually increased to 100 µM at the equator
and to 73 µmol at 5°S. Below 150 m, oxygen levels at 3°N increased down to 300m with a decreasing
trend towards greater depths. At 83°E the oxygen profiles (Fig. 5c) show similar pattern of variations as
that at 77°E, however the convergence at the equator and up to 2-3°N resulted in higher levels of oxygen
at 100 to 120 m and the shoaling up of the thermocline at 3°S reduced the oxygen levels compared to
that at the equator. The signatures of mixing of the ASHSW at 3°N is seen in the steep decrease in
oxygen levels from 131 µM at 120 m to 32 µM at 150 m. In general, the deeper water mass showed
distinct changes in the secondary oxygen minima between 600-800 m to the south and north of the
equator. During spring at 77°E oxygen concentration varied from 32.1 to 55.5 µM (Avg. 42 µM) to the
north of the equator whereas to the south of the equator it varied from 45.9 to 86.8 µM (avg. 64 µM). At
83°E, it varied from 22.2-52.9 µM (Avg. 41.4 µM) to the north and 49.4 to 71.5µM (Avg. 59 µM) to
the south of the equator. Although oxygen is a non conservative property an intermediate oxygen
minimum associated with a salinity maximum indicates the influence of ASHSW. Oxygen levels were
low towards the north and gradually increased towards the south. It is therefore evident that the high
salinity water mass in the northern region i.e. the Indian Central Water contained lower oxygen than the
lower salinity AAMW in the south. The distribution of oxygen is influenced by the spatial and temporal
variability of water masses present in this region which are regulated by the seasonally varying current
pattern as well as utilization of oxygen for the oxidation of organic matter at intermediate depths.
3.4. Nitrate, phosphate and silicate
The nutrients show asymmetric distribution in the meridional sections at different depth levels and are
regulated by seasonally varying physical processes like thermocline elevation meridional and zonal
transport, the equatorial undercurrent and elevation of nutrient replete waters north of the equator and
sinking of nutrient poor water towards the equator driven by tropical instability waves (Evans et al.
2009). Generally the isothermal layer (depth varies with stations and seasons ) is devoid of nutrients

7
but in the area of our observations, enrichment of phosphate (0.01-1.77 µM) , nitrate (0.02-3.0 µM),
and silicate (0.01-2.3 µM) were found in the surface waters (~1 m) compared to the minimum at 20 m
depth . The difference in the concentration between the two depths is referred to as “surface
enrichments” of inorganic nutrients (Haury et.al. 1994). Fig.6 shows the enrichment levels of all the
three nutrients during different seasons. Nitrate showed the least enrichment during spring intermonsoon
and maximum enrichment during summer monsoon, phosphate enrichment was least in winter monsoon
and spring intermonsoon (83°E) . Silicate enrichment was the maximum of all the three nutrients.
Phosphate enrichment in surface waters have been reported over the past four decades and have been
variously attributed to bubble or atmospheric input via dry and wet precipitation (Harvey, 1955), bubble
scavenging (Baylor et al. 1962), Langmuir circulations for bubble aggregated phosphate in surface
layers (Sutclifee et al. 1963) and atmospheric input (Eppley and Koeve, 1990; Eppley et al. 1990, Karl
and Tien, 1992). Taylor et al. (1993) observed surface enrichment in nitrate north of Bermuda whereas
Haury and Shulenberger (1982) and Haury et al. (1994) observed the enrichment of three nutrients in
surface waters over the subsurface waters. Haury et al. (1994) in their analyses of the data on North
Pacific Ocean observed that the enrichment is usually clearest and most frequent in silicate, weakest
and least frequent in nitrate. This report on the surface enrichment of nutrients is believed to be the first
of its kind in the Indian Ocean. (position of Fig 6)
The distribution of nutrients down to 1000m at both the meridional sections are shown in figures 7, 8
and 9 for nitrate, phosphate and silicate respectively. (Position of Fig. 7) At 77°E section, the upheaval
of the water mass towards south and north of the equator elevated the nitrate levels below the mixed
layer whereas in the equatorial convergence zone, waters with low nitrates (1µM) were extended down
to 60 m in the northern region during winter season (fig.7a). The isolines in this layer shoaled up
towards the south, consistent with the southward shallowing of the mixed layer. The thermocline was
between 40 to 120 m at 3°N and the shoaling up of the water mass elevated the nitrate levels from 1µM
at the top of the thermocline to 32 µM at 120 m. The intermediate waters showed deepening of the
isolines at 1°S between 200 to 700 m due to the presence of the undercurrent in the equatorial region.
The spring intermonsoon showed higher nitrate at shallower depths at 3°S and 3°N on either side of the
equatorial convergence and nitrate depleted 60 m mixed layer at the equator ( fig.7b).The subsurface
undercurrent at 80 to 120m depressed the nitrate isolines which reduced the nitrate levels in the vicinity
of the equatorial region. The summer monsoon season (Fig.7c) showed deeper oligotrophic layer (60m)
to the south compared to the north with subsurface water mass upheaval from the equatorial region to
8
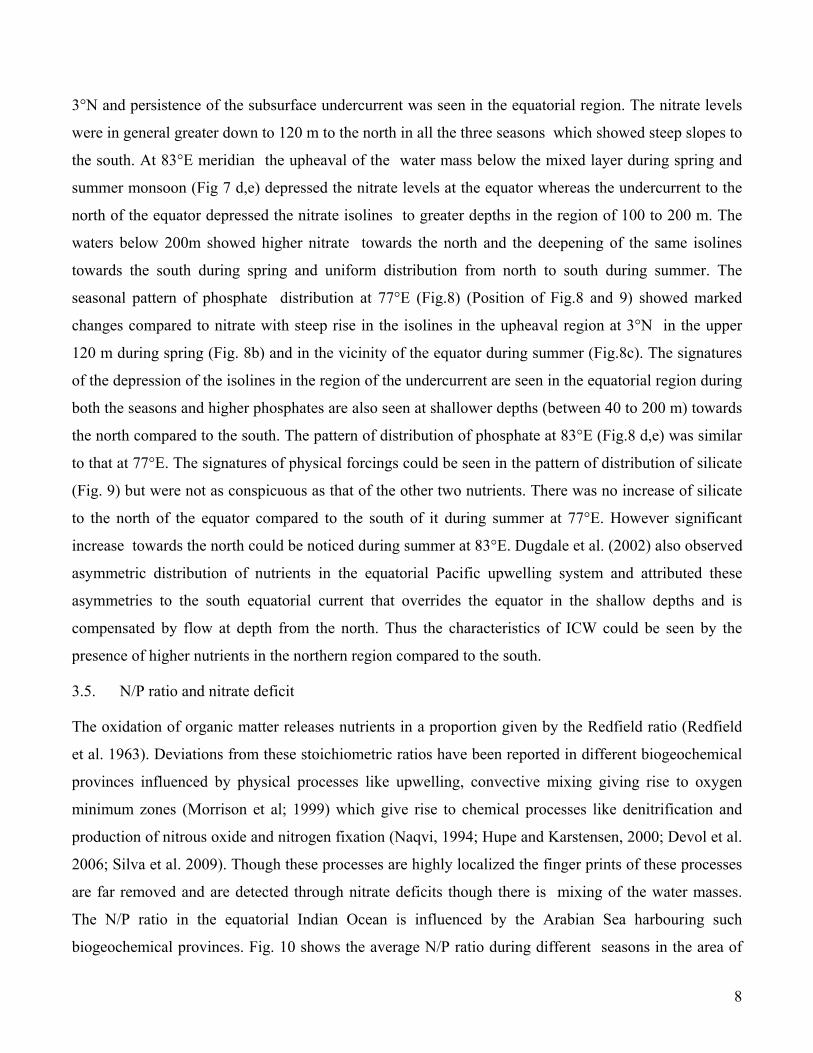
3°N and persistence of the subsurface undercurrent was seen in the equatorial region. The nitrate levels
were in general greater down to 120 m to the north in all the three seasons which showed steep slopes to
the south. At 83°E meridian the upheaval of the water mass below the mixed layer during spring and
summer monsoon (Fig 7 d,e) depressed the nitrate levels at the equator whereas the undercurrent to the
north of the equator depressed the nitrate isolines to greater depths in the region of 100 to 200 m. The
waters below 200m showed higher nitrate towards the north and the deepening of the same isolines
towards the south during spring and uniform distribution from north to south during summer. The
seasonal pattern of phosphate distribution at 77°E (Fig.8) (Position of Fig.8 and 9) showed marked
changes compared to nitrate with steep rise in the isolines in the upheaval region at 3°N in the upper
120 m during spring (Fig. 8b) and in the vicinity of the equator during summer (Fig.8c). The signatures
of the depression of the isolines in the region of the undercurrent are seen in the equatorial region during
both the seasons and higher phosphates are also seen at shallower depths (between 40 to 200 m) towards
the north compared to the south. The pattern of distribution of phosphate at 83°E (Fig.8 d,e) was similar
to that at 77°E. The signatures of physical forcings could be seen in the pattern of distribution of silicate
(Fig. 9) but were not as conspicuous as that of the other two nutrients. There was no increase of silicate
to the north of the equator compared to the south of it during summer at 77°E. However significant
increase towards the north could be noticed during summer at 83°E. Dugdale et al. (2002) also observed
asymmetric distribution of nutrients in the equatorial Pacific upwelling system and attributed these
asymmetries to the south equatorial current that overrides the equator in the shallow depths and is
compensated by flow at depth from the north. Thus the characteristics of ICW could be seen by the
presence of higher nutrients in the northern region compared to the south.
3.5. N/P ratio and nitrate deficit
The oxidation of organic matter releases nutrients in a proportion given by the Redfield ratio (Redfield
et al. 1963). Deviations from these stoichiometric ratios have been reported in different biogeochemical
provinces influenced by physical processes like upwelling, convective mixing giving rise to oxygen
minimum zones (Morrison et al; 1999) which give rise to chemical processes like denitrification and
production of nitrous oxide and nitrogen fixation (Naqvi, 1994; Hupe and Karstensen, 2000; Devol et al.
2006; Silva et al. 2009). Though these processes are highly localized the finger prints of these processes
are far removed and are detected through nitrate deficits though there is mixing of the water masses.
The N/P ratio in the equatorial Indian Ocean is influenced by the Arabian Sea harbouring such
biogeochemical provinces. Fig. 10 shows the average N/P ratio during different seasons in the area of

9
our observations. (Position of Fig.10) It varied from 13.6 during winter to a minimum ratio of 8.9 in
spring. During summer a bimodal type of distribution in the N/P ratio was observed. At concentrations
of < 25 µM of nitrate the N/P ratio was 14.6 and at concentrations > 25 µM it was 10.47 at 77°E. At
83°E the average N/P ratio was 9.81 during summer to 9.57 during spring. Naqvi et al. (1990) have
reported seasonal changes in the chemical composition of intermediate waters with higher nitrate
deficits during NE monsoon and low deficits during SW monsoon in the intermediate waters of the
Arabian Sea. Based on a three end member mixing model Li and Peng (2002) have reported N/P ratio
of 10 for the deep equatorial Indian Ocean and 13 for the northern Pacific ocean and suggest production
of gaseous N2O and N2 by bacteria during nitrification / denitrification processes in low oxygenated
microenvironment. The nitrate deficit is calculated for the upper 1000 m water column based on the
equation ΔN = (NO-O2 )/9.1-NO3-NO2 as given by Naqvi et al. (1990) and also by using the equation
N* = Nitrate -16*phosphate+2.9 µmol kg-1 as given by Deutsch et al. (2001). A typical comparison has
been made on the results obtained using the two formulations and given in table 1. There is found to be a
significant difference in the nitrate deficits since one used oxygen based and the other phosphate
notations. However in view of the proximity of the Arabian Sea to our study area we opt to rely on the
results obtained using the equation by Naqvi et al. (1990). The average seasonal nitrate deficit based on
the equation by Naqvi et al. (1990) was -4.85,1.52 and -3.27 during winter monsoon, spring
intermonsoon and summer monsoon respectively at 77°E and 1.52 for spring intermonsoon at 83°E.
Based on the equation by Deutsch et al. (2001) it was -1.18, -10.48 and -6.82 during winter monsoon,
spring intermonsoon and summer monsoon respectively at 77°E and -9.46 and -8.06 for spring
intermonsoon and summer monsoon respectively at 83°E. The nitrate deficits may not be as strong as
that in the Arabian Sea waters due to the (Position of table 1) mixing of the water masses in the
equatorial Indian Ocean region. Nevertheless the influence of denitrified waters to the south is
conspicuous since the Arabian Sea waters show strong upward advection particularly during spring
intermonsoon even at 5°S (Fig.2e).
4. Conclusion
The physicochemical properties of the eastern Equatorial Indian Ocean along 77°E and 83°E indicate
the presence of 4 water masses. The surface layer with low salinity waters is dominated mainly by the
waters from the northeastern Indian Ocean and the ITF. The surface waters were also enriched with
nutrients with silicates showing the highest enrichment in all the three seasons which is attributed to
bubble or atmospheric input and bubble scavenging. The subsurface waters, the depth of which varies

10
temporally and spatially, are strongly influenced by the ASHSW and carries the signatures of nitrate
deficits and oxygen minimum layer and low N/P ratio. Two distinct water masses are identified below
the subsurface waters (>200m) towards the north and south of the equator. The Australasian
Mediterranean Waters towards the south is identified with relatively less saline waters and higher
oxygen, whereas the water mass towards the north of the equator identified as Indian Central water is
characterized by higher salinity and lower oxygen levels and higher nutrients at shallower depths. In
general the nutrients are higher towards the north compared to the south of the equator and is attributed
to physical forcing like zonal currents, equatorial under currents and elevation of the thermocline to
shallower depths. The fingerprints of nitrate deficits and low N/P ratio are seen down to 1000 m
indicating advection of nitrate deficient Arabian Sea waters to greater depths.
Acknowledgements
The authors would like to thank the Director, National Institute of Oceanography, for his interest and
support in this work. The authors are also thankful to the Ministry of Earth Sciences for providing the
ship time, financial and logistic support to carry out the observations for this project. The reprographical
assistance given by Shri Arun Mahale, Shri Shyam Akerkar and shri U.K. Kumar is greatfully
acknowledged.
References:
Arief, D., Murrey, S., 1996. Low frequency fluctuations in the Indonesian throughflow through Lombok strait. Journal of Geophysical Research 101(C5), 12455-12464.
Baylor, E.R., Sutcliffe, W.H., Hirschfeid D.S., 1962. Adsorption of phosphate onto bubbles. Deep Sea Research 9, 120-124.
Deutsch, C., Gruber, N., Key, R.M., Sarmiento, J.L., 2001. Denitrification and N2 fixation in the Pacific Ocean. Global Biogeochemical Cycles 15 (2), 483–506
Devol, A.H., Uhlenhopp, A.G., Naqvi, S.W.A., Brandes, J.A., Jayakumar, D.A., Naik, H., Gaurin, S., Codispoti, L.A, Yoshinari, T., 2006. Dinitrification rates and excess nitrogen gas concentrations in the Arabian Sea oxygen deficient zone. Deep Sea Research I 53, 1533-1547.
Dugdale, R.C., Wischmeyer, A.G., Wilkerson, F.P., Barber, R.T., Chai, F., Jiang, M.-S. Peng T.-H., 2002. Meridional asymmetry of source nutrients to the equatorial Pacific upwelling ecosystem and its

11
potential impact on ocean–atmosphere CO2 flux; a data and modeling approach. Deep-Sea Research II 49, 2513–2531.
Eppley, R.W., Garside, C., Renger, E.H., Orellana, E., 1990. Variability of nitrate concentration in nitrogen-depleted subtropical surface waters. Marine Biology 107, 53-60.
Eppley R.W., Koeve, W., 1990. Nitrate use by plankton in the eastern subtropical Atlantic. March-April 1989. Limnology and Oceanography 35, 1781-1788.
Evans, W., Strutton , P. G., Chavez, F.P., 2009. Impact of tropical Instability waves on nutrient and chlorophyll distributions in the equatorial Pacific. Deep Sea Research I 56, 178-188.
Fieux M., Andrie, C., Delecluse, P.A., Ilahude, G., Kartavtseff, A., Mantisi, F., Molcard, R., Swallow, J. C., 1994. Measurements within the Pacific-Indian Ocean Throughflow Region, Deep Sea Research I 41, 7, 1091- 1130.
Fieux, M., Molcard, R., Ilahude, A. G., 1996b. Geostrophic transport of the Pacific-Indian Oceans throughflow, Journal of Geophysical Research 101, 12421-12432.
Grasshoff, K., Ehrhardt M., Kremling, K., 1983. Methods of Seawater Analysis. Verlag Chemie, New York, NY, 419pp.
Harvey, H.W. 1955. The chemistry and fertility of sea water. 1st edition Cambridge University Press, Cambridge. 240 pp.
Haury, L.R., Fey, C.L., Shulenberger, E., 1994. Surface enrichment of inorganic nutrients in the North Pacific Ocean. Deep Sea Research I 41, 1191-1205.
Haury, L.R., Shulenberger, E., 1982. Horizontal transport of phosphorus in the California Current. CalCOFI reports 23, 149-159.
Hype, A., Karstensen, J., 2000. redfield stoichiometry in Arabian Sea subsurface waters. Global Biogeochemical Cycles 14, 1,357-372.
Jensen, T.G., 2003. Cross-equatorial pathways of salt and tracers from the northern Indian Ocean: Modelling results Deep-Sea Research II 50, 2111–2127.
Karl D.M., Tien, G., 1992. MAGIC: A sensitive and precise method for measuring dissolved phosphorus in aquatic environments. Limnology and Oceanography 37, 105-116.
Li Y.-H., Peng, T.-H, 2002. Latitudinal change of remineralization ratios in the oceans and its implication for nutrient cycles, Global Biogeochemical Cycles 16, 1130, doi:10.1029/2001GB001828.

12
Mamahyev, I.O., 1975. Temparature salinity analysis of world ocean waters, Elsevier, Amsterdam, p 374.
Morales,R. A; Barton, E. D., Heywood, K. J., 1996. Variability of water masses in the western Indian Ocean. Journal of Geophysical Research 101, 14,027-14,038.
Morrison, J.M., Codispoti, L.A., Smith, S.L., Wishner, K., Flagg, C., Gardner, W.D., Gaurin, S., Naqvi, S.W.A., Manghnani, V., Prosperie, L., Gundersen, J.S., 1999. The oxygen minimum zone in the Arabian Sea during 1995. Deep Sea Research II 46, 1903-1931.
Naqvi, S.W.A., 1994. Denitrification process in the Arabian Sea. In: : Lal, D.(eds) Biogeochemistry of the Arabian Sea: Present information and gaps. Proceedings of. Indian Acadamy of Science (Earth and Planetary Sciences). Indian Academy of Science Bangalore, India 103, 279-300.
Naqvi, S.W.A., Noronha, R.J., Somasundar, K., SenGupta, R., 1990. Seasonal changes in the denitrification regime of the Arabian Sea. Deep Sea Research 37, 593-611
Prasanna Kumar, S., Prasad, T.G., 1999. Formation and spreading of Arabian Sea high-salinity water mass. Journal of Geophysical Research 104, 1455-1464.
Rao , L.V.G., Jayaraman, R., 1968. Hydrographic features of the southern and central Bay of Bengal during the transition period between winter and summer. Bulletin National Institute of Science India 38, 184-205.
Redfield, A.C., Ketchum, B.H., Richards, F.A., 1963. The influence of organisms on the composition of sea water. In: The Sea, 2, M.N. Hill, (eds), Interscience, New York, 26-77 pp.
Rochford, D.J.,1964. Salinity maxima in the upper 1000 m of the north Indian Ocean. Australian Journal of Marine and Fresh water Research 15, 1-24.
Schiller, A., 2003. Seasonal to internannual water mass formation in the upper tropical Indian Ocean. Journal of Geophysical Research 108, 7-1 D 3110 DOI 10.1029/2002 J.COO1531.
Schott, F.A., McCreary Jr. J.P., 2001. The monsoon circulation of the Indian ocean Progress in Oceanography 51, 1-123.
Sengupta, D.,. Bharath Raj G.N., Shenoi, S.S.C., 2006. Surface fresh water from Bay of Bengal runoff and Indonesian Throughflow in the tropical Indian Ocean. Geophysical Research Letters 33, L 22609 doi 10.1029/2006
Sharma, G.S., Gouveia, A.D., Sathendranath, Shubha., 1978. Incursion of the Pacific Ocean water into the Indian Ocean. Proceedings of Indian Academy of Science (Earth and Planetary sciences) 87, 29-45.

13
Shcherbinin, A.D., 1969. Water structure of the Equatorial Indian Ocean. Oceanology 9, 487-495.
Silva, N. Rojas, N.A., Fedele, A., 2009. water masses in the Humboldt current system: properties, distribution and the nitrate deficit as a chemical water mass tracer for equatorial subsurface water off Chile. Deep Sea Research II 56, 1004-1020.
Sutclifee, W.H., Baylor, E.R., Menzel, D.W., 1963. Sea surface chemistry and Langmuir circulation. Deep Sea Research 10, 23-243.
Sverdrup, H.U., Johnson, M.W., Fleming R.H., 1942. The Oceans, their physics, chemistry and general biology, Prantice hall, Englewood cliffs, 1087 pp.
Taylor, C.D., Howes, B.L., Doherty, K.W., 1993. Automated instrumentation for time-series measurement of primary production and nutrient status in production platform-accessible environments. MTS Journal 27, 32-44.
You, Y., Tomczak, M., 1993. Themocline circulation and ventilation in the Indian Ocean derived from water mass analysis. Deep Sea Research I 40, 13-56
Valsala, V.K., Ikeda, M., 2007. Pathways and effect of the Indonesian throughflow water in the Indian Ocean using particle Trajectory and tracers in an OGCM. Journal of climate 20, 2994-3017.

14
Table 1: Comparison of average nitrate deficits during different seasons at different depth intervals calculated using equations given by Naqvi et al. (1990) and Deutsch et.al. (2001)
Season Latitude Depth range (m)
Avg of (positive) NO3 deficit Naqvi et al. (1990)
Avg of NO3 deficit
Deutsch et al. (2001).
Winter monsoon 77° E
5°S-3° N 0-1000m -4.85 (all negative)
-1.18
Spring Intermonsoon 77°E
5 ° N 100-1000 5.25 -15.70 4°, 3°,2.5°N 80-1000 4.98 -19.15
1.5° N 100-1000 4.48 -11.76 1°N,0.5°N,eq
uator & 0.5°S 120-1000 2.99 -10.45
1°S,1.5°S 100-1000 4.15 -13.31 2.5°, 3° S 80-1000 4.70 -11.23 4°S 60-1000 6.91 -7.63 5°S 40-1000 6.51 -11.15
Summer Monsoon 77°E
4°S 60-100
2.54 -2.39
3°S 60-80 2.84 -3.22 1°S 80-100 &
200 0.79 -16.78
0.5°S 200 0.161 -16.50 0° 200 0.823 -5.60 1°N 120 & 200 5.52 -5.11 2°N 120& 150 2.29 -3.21 3°N 40-60 &
120-200 0.50 0.83
Spring Intermonsoon
83°E 5°N 60-1000 7.52 -11.90 4°N 100-1000 6.43 -12.51 3°N 80-1000 4.73 -6.61
2.5°N 120-1000 3.69 -15.63 1.5°N 150-1000 5.09 -5.23 1°,0.5°N 120-1000 4.23 -7.60 0° 200-1000 2.84 -18.34 0.5°S 120-1000 7.70 -13.04 1°S 60-1000 5.27 -10.06 1.5°,2.5°, 3°S 100-1000 4.55 -8.45 4°S 40-1000 5.53 -8.03 5°S 150-1000 7.87 -12.73
Summer monsoon 83°E
5°S-5° N 0-1000 m ----- -8.06

15
Legend to figures:
Figure 1: Map showing the area of observations with current pattern during winter (a) showing NEC—North Equatorial Current, ECC—Equatorial Counter Current, SEC—South Equatorial Current and summer (b) showing SC—Somali Current, SWMC—South West Monsoon Current, & SEC—South Equatorial Current. The two vertical lines in (a) indicate the sampling stations. The insets show the TS diagram with water masses during the winter and summer monsoon.. The curved lines in the insets represents the density (σt ) in kg/m3
Figure 2: Temperature-Salinity diagrams during different seasons at 77°E. and 83°E. The abbreviations for water masses are: BOB- Bay of Bengal, ITF- Indonesian Through Flow, ASHSW- Arabian Sea High Salinity Water, AAMW- Australasian Mediterranean Water and ICW- Indian Central Water. Curved lines show density (σt) in kg/ m3
Figure 3 Vertical distribution of temperature (a,b,c,) and salinity (d,e,f) during winter, spring and summer monsoon respectively at 77°E.
Figure 4: Vertical distribution of temperature (a,b) and salinity (d,e) during spring and summer monsoon respectively at 83°E.
Figure 5: Vertical profiles of oxygen in the regions of intense physical forcings during winter and spring intermonsoon at 77°E and Spring intermonsoon at 83°E.
Figure 6: Surface enrichment (difference between the surface and the minimum concentration at 20 m depth) of nutrients during winter, spring and summer monsoon at 77°E and spring intermonsoon and summer monsoon at 83°E.
Figure 7: Vertical distribution of nitrate during winter monsoon (a), spring intermonsson (b) and summer monsoon (C) at 77°E and spring intermonsson (d) and summer monsoon (e) at 83°E.
Figure 8: Vertical distribution of phosphate during winter monsoon (a), spring intermonsson (b) and summer monsoon (C) at 77°E and spring intermonsson (d) and summer monsoon (e) at 83°E.
Figure 9: Vertical distribution of Silicate during winter monsoon (a), and summer monsoon (b) at 77°E and summer monsoon (c) at 83°E.
Figure 10: Nitrate to phosphate ratio during different seasons at 77°E and 83°E.

16
Fig.1

17
Fig.2

18
Fig. 3

19
Fig. 4
20
Fig. 5

21
Fig. 6

22
Fig. 7

23
Fig. 8

24
Fig. 9

25
Fig.10