nursing & midwifery ward staffing august 2019
TRANSCRIPT

www.cddft.nhs.uk
Prepared for Trust Board meeting: 25th September, 2019
Item 10b: Safe staffing
Nursing & Midwifery
Ward Staffing August 2019
Noel Scanlon – Executive Director of Nursing
Brian Nicholson – Matron: eRostering Lead
27. I
tem
10b
ii_B
oard
ope
n25
0919
Nur
s M
idw
sta
ffing
Page 255.1 of 284

Trust Board Report: Ward Staffing. August 2019 25/09/2019
P a g e | 2
Contents
Executive Summary............................................................................................................................. 3
1. Purpose of this report ................................................................................................................... 6
2. Expectation 7: Safe staffing capacity and capability ..................................................................... 6
2.1 Aggregated Nursing and care assistant staffing data ................................................................. 6
2.2 Ward staffing analysis: ............................................................................................................... 7
2.3 Reporting by Exception .............................................................................................................. 7
2.4 Monthly Model Ward Identified ................................................................................................... 7
3. Staffing management actions ......................................................................................................... 8
3.1 Recruitment ........................................................................................................................... 8
3.2 Staffing management .......................................................................................................... 10
3.2.1 Bank and Agency Fill Rate ........................................................................................... 12
3.2.2 Theatre Agency Workers and ODP’s ............................................................................ 13
3.2.3 Overtime ...................................................................................................................... 13
3.2.4 Monitoring .................................................................................................................... 13
3.2.5 Safer staffing evaluation ............................................................................................... 13
3.2.6 Operating Theatres rostering ........................................................................................ 14
3.2.7 Maternity Services UHND and DMH ............................................................................. 14
4 Model hospital ............................................................................................................................ 17
4.1 NHSI Carter e-Rostering Review ......................................................................................... 25
4.2 2019-2020 Nursing Budgets ................................................................................................ 25
5 Breaches of EWTD Rules ........................................................................................................... 25
6 Safe staffing .............................................................................................................................. 26
6.1 Care Hours per Patient Day (CHPPD) – August 2019 ......................................................... 27
6.2 Reasons for over and under staffing in August 2019 ........................................................... 29
7 Expectation 2: Escalation and Assurance ....................................................................................... 29
8. Assurance statement .............................................................................................................. 30
9. Outstanding Planning Activities ................................................................................................. 30
10. Summary ................................................................................................................................ 31
Appendix 1: ....................................................................................................................................... 32
27. I
tem
10b
ii_B
oard
ope
n25
0919
Nur
s M
idw
sta
ffing
Page 255.2 of 284

Trust Board Report: Ward Staffing. August 2019 25/09/2019
P a g e | 3
NURSING AND MIDWIFERY ESTABLISHMENTS REPORT
Executive Summary
This report confirms on-going compliance with the requirement to publish monthly aggregated nursing and care assistant staffing levels, in accordance with NHSI’s, The NQB’s and the CQC’s requirements.
Furthermore it provides outline detail in the context of local priorities for progression towards the utilisation of robust nurse roster data and information to support and evidence local staffing practice and national safe staffing guidance.
The Trust Board is requested to:
• Receive this report,
• Decide if any if any further actions and/or information are required.
Highlights to this report include:
• August 2019 workforce reports show there were 152.18 RN (WTE) vacancies (taking account of frozen posts and appointments under process) and 29.56 HCA (WTE) vacancies. 12 Nursing Associate Apprentices have been recruited for the September 2019 following the approval of the Business case. The NRC group continues to meet on a monthly basis.
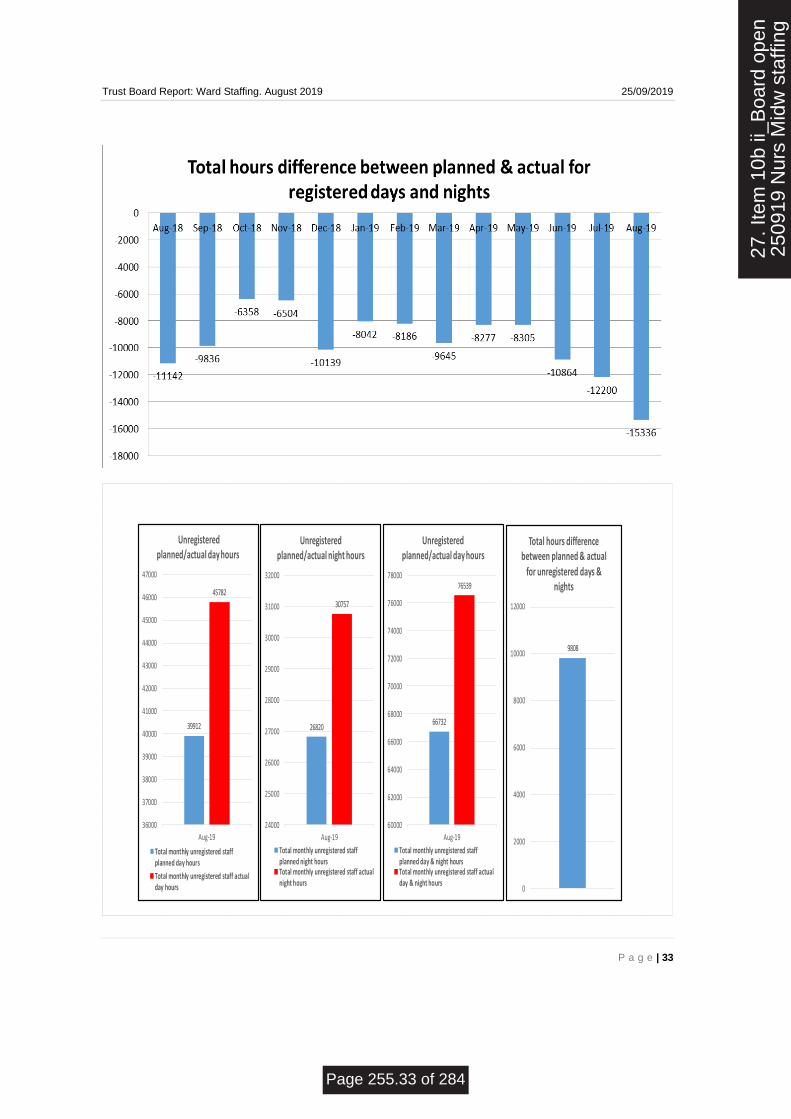
• In relation to the planned against actual, the Trust had understaffed by 15336 Registered hours, but overstaffed by 9808 unregistered hours; with has led to a net understaffing of 5528 hours in total. Overall substantive hours have massively decreased by 5,286hrs in August 2019 when compared to July 2019. This is a worrying trend as temporary staffing processes were unable to flex and meet the additional demand during peak holiday time. This comes at a time when demand remains high for both RN and HCA temporary staffing, but both RN and HCA fill rates have fallen 7% below the acceptable 80% benchmark. RN and HCA agency have compensated to a certain point. Monthly trends show the trust in-patient areas have a maximum capacity of 17000hrs of RN bank, but we have only utilised 15000-16000hrs over the last 4 months. The trust in-patient areas have a maximum capacity of 20000-21000hrs of HCA bank and we have been running at capacity for the last 5 months. To summarise, RN bank demand continues to increase month on month with a worsening fill rate, whilst HCA bank is at full capacity leading. Either demand must plateau or the bank employee supply pool must increase. Otherwise the trust will see an increasing return to agency hours utilisation.
• As with previous months a number of areas exceeded the 120% in relation to unregistered staff, although the number of areas and numbers of hours required had started to fall. Some of these areas were due to a back fill for RN’s, in some cases by Italian RNs assigned to HCA roster lines whilst they are undertaking their language programme. However, there continues to be a marked increase in HCA usage as already discussed. 1:1 and Cohort Care remains a dominant factor. This month the number of wards utilising over 120% HCA’s has reduced by 2 to 12 wards. Areas of note are, Ward 1 UHND, Ward 5 UHND, Ward 12 at UHND, and Ward 52 DMH. All four are continually and heavily cohorting etc.
• Figures show that RN and HCA overtime usage over the 41 identified areas in this report continues to remain negligible, as it has for the past year and continues to comply with the December 2017 plan. There was 38hrs of RN overtime utilised in August and only 26hrs of HCA overtime. RN bank coverage has increased very marginally by 225hrs when compared with July, but RN agency also increased by a further 192hrs. However, HCA agency has decreased by 470hrs on July’s requirement. HCA bank usage has also decreased by 1565hrs this month. To summarise, substantive and bank employee availability decreased at the peak of holiday season whilst staff working overtime, additional hours and RN agency increased in an attempt to compensate.
27. I
tem
10b
ii_B
oard
ope
n25
0919
Nur
s M
idw
sta
ffing
Page 255.3 of 284

Trust Board Report: Ward Staffing. August 2019 25/09/2019
P a g e | 4
• Overall, the total Trust overtime usage has nearly doubled in August 2019 when compared with previous months. We can now say this is all overtime worked within the unmonitored community areas. Total Trust additional hour’s usage increased by 957hrs over August when compared with July. Although this is the cheapest form of organising additional staffing it also transfers the pressures of additional work hours on to part-time staff only.
• Overall 38 out of 41 in-patient areas have now completely stopped using overtime with the remaining areas only using 63.5hrs of overtime in August. The author is pleased to report that overtime usage within the 41 identified areas remains, for all intent and purpose, marginalised. In fact, RN’s utilised only 38hrs of overtime in the 41 monitored areas.
• The Richardson Community Hospital and CCU DMH jointly receive their title of model wards of the month for utilising no additional staffing time via bank, agency, overtime and additional hours. An excellence report has been submitted.
• The Nursing Directorate have now implemented new guidance which will affect safe staffing monitoring in 2019, From this month, it is mandatory for all trusts to include registered and unregistered Nursing Associate utilised hours as part of their monthly safe staffing returns (p.26).
• Graduate Recruitment / Return to Practice Update Cohort Recruitment 14th June 2019. Adult Branch - 45 still going through process. 6 students have withdrawn. Several Students have been identified as having high sickness rates. They have been offered a 6 month probationary period due to their sickness by recruiting managers. Quite a number of students have reapplied for community posts advertised from the trust if they did not get what they wanted first time. 9 going to Surgery. 20 going to medicine + 3 RTP = 23.16 going to Community. Child Branch - 6 still going through process. Midwifery - 12 interviewed - all offered posts. 1 declined and 3 have withdrawn 8 still going through recruitment process.
• Student Nurse Cohorts Qualifying January to April 2020 Attended a Jobs Fair at Teesside University on 18th March with good interest. 5th September meet the team’s Flyer sent out to all Teesside students qualifying in January 2020 and Sunderland Students qualifying in April 2020. Invitations to apply for the posts have been sent out - currently 26 have applied to adult, 6 to child. Interviews are arranged for 4th October 2019 on ward 17 BAGH. 3 recent offers were made to registered nurses through the advert open until the end of January 2019. All have been offered posts within CDDFT.
• Overseas recruitment (EU recruitment) Cohort 12 made up of 2 staff, arrived on the 12th September 2019. All of the new cohort have been allocated placements within mainstream in-patient areas at UHND. This comprises the completion of the 2018 business case.
• This month, 19 out of the 41 in-patient areas had completely stopped using agency and 6 of those left used less than 50hrs a month. Ward 1 UHND, Ward 2 UHND, Ward 3 AMU, Ward 5 UHND, Ward 6 UHND, Ward 12 UHND, Ward 14 UHND, Ward 33 DMH and Ward 52 continue as the identified areas of concern for continued use of agency. These have now been joined by Ward 6 BAGH, Ward 15 UHND, Ward 16 UHND, SAU UHND, Ward 31 DMH, Ward 34 DMH and Ward 41 DMH. Notably, 10 out of 16 of these top areas are from one hospital site, UHND. Ward 1 UHND, Ward 5 UHND, Ward 12 UHND, Ward 33 DMH and Ward 52 DMH are known to be heavily involved in cohorting duties.
• This safe staffing report only relates to permanent established wards and does not take full account of escalation beds that continue to be opened. However, increased usage of staffing to cover this extremely prolonged escalation surge can still be clearly seen in the monthly returns to the NHSI and reported to the board monthly in this paper.
27. I
tem
10b
ii_B
oard
ope
n25
0919
Nur
s M
idw
sta
ffing
Page 255.4 of 284

Trust Board Report: Ward Staffing. August 2019 25/09/2019
P a g e | 5
• Midwifery staffing offers some cause for concern. Staffing matched to demand at UHND was 51%, DMH 35% (though data collection <87.5%). The causes for this are multi-factorial however September being the peak month for deliveries, Caesarean section rate of 27.4% ( >21% is considered above acceptable rates), the long established practice of midwives scrubbing in for Caesarean sections and higher rates of long term sickness appear significant. The Care group are urgently looking at remedial actions in each of these areas with the support of the Surgical department. At times of unacceptably low levels of staffing Labour ward/s will be closed electively to avoid unsafe staffing levels. This has not been necessary in August but is one of a number of possible contingencies during September.
• The Trust Board will continue to be advised of further developments in the nursing and midwifery staffing arena.
Assurance statement
In light of the above mitigating actions the Executive Director of Nursing is assured that there is sufficient resilience – not withstanding some hot spot areas – to ensure that every ward is safely staffed and able to meet patient demand.
27. I
tem
10b
ii_B
oard
ope
n25
0919
Nur
s M
idw
sta
ffing
Page 255.5 of 284
Trust Board Report: Ward Staffing. August 2019 25/09/2019
P a g e | 6
NURSING AND MIDWIFERY ESTABLISHMENTS REPORT
1. Purpose of this report
The purpose of this report is to confirm on-going compliance with the requirement to publish monthly aggregated nursing and care assistant staffing levels, in accordance with NHS England’s, The NQB’s and the CQC’s requirements.
Furthermore it provides outline detail in the context of local priorities for progression towards the utilisation of robust nurse roster data and information to support and evidence local staffing practice and national safe staffing guidance.
The Trust Board is requested to:
• Receive this report,
• Decide if any if any further actions and/or information are required.
2. Expectation 7: Safe staffing capacity and capability
Expectation 7 of the NQB’s standards requires Trust Boards to receive monthly updates1 on workforce information, and that staffing capacity and capability is discussed at a Trust Board meeting in public at least every six months on the basis of a full nursing and midwifery establishment review.
The first specific requirement of Expectation 7 is for provider trusts to upload the staffing levels for all in-patient areas on a monthly basis into the national reporting database. These are then published via the NHS Choices Website alongside other quality indicators for each trust, with a hyperlink to each trust’s web page for more specific information.
The Trust Board is advised that the Trust continues to comply with the requirement to upload and publish the aggregated monthly nursing and care assistant (non-registered) staffing data for inpatient areas. The data within these represents only high level aggregated averages. However it can be contextualised to support an analysis of roster practice through an understanding of data and reasons for what appear as anomalies in some cases.
2.1 Aggregated Nursing and care assistant staffing data
The following section provides an analysis of aggregated monthly nursing and care assistant (non-registered) staffing data for in-patient areas August 2019.In-patient staffing levels are aggregated by ward and site and provide an average overall fill rate against planned and actual staffing for registered nurses/midwives and care assistants for days and nights.
The high level aggregated averages are expressed in percentage terms which often translate as low whole time equivalent (WTE) numbers.
The mix of average fill rates for registered midwives and care assistants on each ward is variable. These figures represent the skill mix between registrants and care assistants. A higher than planned percentage of care assistants often balances with a reduction in registered fill rates to provide available hours with a different, but safe skill mix.
The aggregated data can be utilised within care groups to support challenges in roster practice through provision of Care Group specific reports for review and action.
The Unify staffing data is submitted to the Department of Health on a monthly basis. The information gathered is in relation to inpatient care across 41 wards and is split into the categories listed below.
• Registered Nurse/Midwife hours; planned and actual for days
1 Where Trust Boards do not meet in public monthly, this is to be presented at every Trust Board meeting in public when they occur.
27. I
tem
10b
ii_B
oard
ope
n25
0919
Nur
s M
idw
sta
ffing
Page 255.6 of 284

Trust Board Report: Ward Staffing. August 2019 25/09/2019
P a g e | 7
• Registered Nurse/Midwife hours; planned and actual for nights
• Unregistered care hours; planned and actual for days (Health Care Assistant/Midwifery Care Assistant/ Assistant Practitioners)
• Unregistered care hours; planned and actual for nights (Health care Assistant/Midwifery Care Assistant/ Assistant Practitioners)
The planned staffing is based on the budgeted staffing hours. The uplift in registered staff has resulted in an expected drop for the average fill rate on days, especially the Medical wards.
2.2 Ward staffing analysis:
• CDDFT now comprises 41 Wards.
• In relation to the planned against actual, the Trust had understaffed by 15336 Registered hours, but overstaffed by 9808 unregistered hours; with has led to a net understaffing of 5528 hours in total. Overall substantive hours have massively decreased by 5,286hrs in August 2019 when compared to July 2019. This is a worrying trend as temporary staffing processes were unable to flex and meet the additional demand during peak holiday time. This comes at a time when demand remains high for both RN and HCA temporary staffing, but both RN and HCA fill rates have fallen 7% below the acceptable 80% benchmark. RN and HCA agency have compensated to a certain point. Monthly trends show the trust in-patient areas have a maximum capacity of 17000hrs of RN bank, but we have only utilised 15000-16000hrs over the last 4 months. The trust in-patient areas have a maximum capacity of 20000-21000hrs of HCA bank and we have been running at capacity for the last 5 months. To summarise, RN bank demand continues to increase month on month with a worsening fill rate, whilst HCA bank is at full capacity leading. Either demand must plateau or the bank employee supply pool must increase. Otherwise the trust will see an increasing return to agency hours utilisation.
• Figures show that RN and HCA overtime usage over the 41 identified areas in this report continues to remain negligible, as it has for the past year and continues to comply with the December 2017 plan. There was 38hrs of RN overtime utilised in August and only 26hrs of HCA overtime. RN bank coverage has increased very marginally by 225hrs when compared with July, but RN agency also increased by a further 192hrs. However, HCA agency has decreased by 470hrs on July’s requirement. HCA bank usage has also decreased by 1565hrs this month. To summarise, substantive and bank employee availability decreased at the peak of holiday season whilst staff working overtime, additional hours and RN agency increased in an attempt to compensate.
2.3 Reporting by Exception
The author has attached the total number of overtime and additional hours utilised by every clinical area within CDDFT for August 2019:
Additional Hours 2636.48
Overtime 738.92
Overall, the total Trust overtime usage has nearly doubled in August 2019 when compared with previous months. We can now say this is all overtime worked within the unmonitored community areas. Total Trust additional hour’s usage increased by 957hrs over August when compared with July. Although this is the cheapest form of organising additional staffing it also transfers the pressures of additional work hours on to part-time staff only.
2.4 Monthly Model Ward Identified
As promised at a recent sisters’ away day discussion, the author has decided to identify good practice as well as bad.
27. I
tem
10b
ii_B
oard
ope
n25
0919
Nur
s M
idw
sta
ffing
Page 255.7 of 284

Trust Board Report: Ward Staffing. August 2019 25/09/2019
P a g e | 8
Overall 38 out of 41 in-patient areas have now completely stopped using overtime with the remaining areas only using 63.5hrs of overtime in August. The author is pleased to report that overtime usage within the 41 identified areas remains, for all intent and purpose, marginalised. In fact, RN’s utilised only 38hrs of overtime in the 41 monitored areas.
The Richardson Community Hospital and CCU DMH jointly receive their title of model wards of the month for utilising no additional staffing time via bank, agency, overtime and additional hours. An excellence report has been submitted.
3. Staffing management actions
In August 2019 the Board should note that plans to improve the consistency of ward staffing continues through:
3.1 Recruitment
• Graduate Recruitment / Return to Practice Update
Cohort Recruitment 14th June 2019. Adult Branch - 45 still going through process. 6 students have withdrawn. Several Students have been identified as having high sickness rates. They have been offered a 6 month probationary period due to their sickness by recruiting managers. Quite a number of students have reapplied for community posts advertised from the trust if they did not get what they wanted first time. 9 going to Surgery. 20 going to medicine + 3 RTP
27. I
tem
10b
ii_B
oard
ope
n25
0919
Nur
s M
idw
sta
ffing
Page 255.8 of 284

Trust Board Report: Ward Staffing. August 2019 25/09/2019
P a g e | 9
= 23.16 going to Community. Child Branch - 6 still going through process. Midwifery - 12 interviewed - all offered posts. 1 declined and 3 have withdrawn 8 still going through recruitment process.
• Student Nurse Cohort Qualifying January to April 2020
Attended a Jobs Fair at Teesside University on 18th March with good interest. 5th September meet the team’s Flyer sent out to all Teesside students qualifying in January 2020 and Sunderland Students qualifying in April 2020. Invitations to apply for the posts have been sent out - currently 26 have applied to adult, 6 to child. Interviews are arranged for 4th October 2019 on ward 17 BAGH. 3 recent offers were made to registered nurses through the advert open until the end of January 2019. All have been offered posts within CDDFT. EU recruits
• Cohort 12 made up of 2 staff, arrived on the 12th September 2019. All of the new cohort have been allocated placements within mainstream in-patient areas at UHND.
• Workforce has now produced a brief on EU Workers rights after the UK leaves the EU. The recruitment team are currently implementing a communications plan which will involve the distribution of leaflets, posters and online information throughout the trust. They will also be e-mailing information packs directly to existing workers and new employees arriving from the EU.
• Three Nursing associates have qualified in April and have taken up posts in Community and Paediatric settings. Nine Nursing associate trainees (apprentices) make up the intake for April 2019. Some adjustment in Ward and department establishments is required to accommodate these positions. Thirteen nursing associates are expected to qualify in April 2020. It is hoped that the £7,200 per candidate that clinical areas receive from Health Education England to backfill their theoretical preparation will continue in 2019/20 and a further intake will be recruited in September. 20 candidates each year could make a significant contribution to nursing services. The Nursing Directorate are also studying new guidance which will affect safe staffing monitoring in 2019. From September 2019, it will be mandatory for all trusts to include registered and unregistered Nursing Associate utilised hours as part of their monthly safe staffing returns. These are contained in the charts on p.
• The Return to Practice Steering Group, led by Julie Race and Heather Watson continue their current approach to identifying nurses in the locality who have let their registration lapse and are looking at pioneering a different approach to supporting those identified to return to the NHS, specifically, to join our trust. In the September 2018 Return to Practice cohort, only one candidate has been identified for the Trust pilot (salaried) route, being allocated to Ward 52 DMH. This candidate is expected to complete their course in March 2019. Four others took the traditional University route. Of the four traditional route nurses, two are also projected to complete this month. They have been offered an interview but the trust still awaits a response.
• August 2019 workforce reports show there were 152.18 RN (WTE) vacancies (taking account of frozen posts and appointments under process) and 29.56 HCA (WTE) vacancies. 12 Nursing Associate Apprentices have been recruited for the September 2019 following the approval of the Business case. The NRC group continues to meet on a monthly basis.
• The Temporary staffing team are still actively promoting the employment of staff through recruitment days Interviewing panels are being held on a regular basis to employ further RN and HCA bank staff. New Monitor rules on the use of Agency nurses are aimed at improving the reliability and consistency of supply from partner agencies through the development of framework agreements. The neutral vendor process has now been live since the 25th January 2016. From the graph forecasts, savings are evident in temporary staffing usage. Bank nurses now receive lower enhanced rates of pay following the rate reduction in November 2018. RN enhanced rates have now been further reduced by a 50p per hour on their basic hourly rate. This is scheduled for further review in February.
27. I
tem
10b
ii_B
oard
ope
n25
0919
Nur
s M
idw
sta
ffing
Page 255.9 of 284

Trust Board Report: Ward Staffing. August 2019 25/09/2019
P a g e | 10
• Plans to move medical staff onto a similar “neutral vendor” process (similar to the arrangement nurses currently adhere to) for agency and locum use has now gone live. The pilot scheme is already seeing large financial savings to the Trust cf. the Circular Wave scheme and further in-roads are currently being finalised to award an official contract.
• Both Consultants and junior doctors are being scheduled to become much more involved within the trust electronic rostering system (HealthRoster). Consultants job plans are 93% complete and Ann Sewell has started rolling out Junior Doctors in e-Rostering, with ED and UCC medical areas moving over first. HealthRoster has been further upgraded in August 2019 to manage this new transition. However, this rollout does not appear to be moving along smoothly. Senior medical staff have concerns around the system being “fit for purpose”. Brian Nicholson has been working closely with senior medical staff and has brokered a solution. The contract with Allocate has been reviewed and renewed. Medical staff now have a clause in the new contract allowing them to end the contract after 12 months if they do not see a vast improvement in the system capabilities. The Allocate Managing Director also plans to attend the trust quarterly to review progress. The first visit took place on Tuesday 21st February 2019 and quarterly meetings have continued since. 4 months’ notice is required to be given for termination of the contract, so the trust effectively had 8 months from November 2018 to turn the current situation around, but there are no current discussions to move away from the Allocate system. The ME app is now ready for circulation trust wide, but the CIG have requested a review first. This could substantially delay introducing further advanced technology to assist with the medical rollout.
• More intensive support of nurses on sick leave is planned. Sickness reporting reasons have recently been enhanced in HealthRoster by the E-roster bureau who have been discussions with Human Resources to ensure HealthRoster data interfaced to ESR increases efficiency in accurate sickness reporting to the Department of Health. Trust sickness rates are now being identified as an outlier percentage within the Model Hospital data as you will see later in this report. Brian Nicholson has also recently improved sickness reporting programming within HealthRoster so that the data interface with ESR is much improved and more automated. More useful data such as return to work interview dates can now also be successfully uploaded to ESR.
• Maternity leave in its current form is not involved in the 21% uplift calculation but backfilled centrally in part into Ward budgets at 0.6 wte per wte. The back fill for maternity is now being covered by less expensive and more reliable substantive and temporary staffing usage than previous fixed term agency and substantive agency arrangements.
3.2 Staffing management
• E-Rostering, safer staffing and temporary staffing Policies support and advise in promoting overall better management of staffing within the trust. There continues to be variable practice within the Trust when it comes to rostering staff and we need to ensure all the policies are re-enforced. To this end, the author has introduced a trust wide Rostering calendar. This assures 4 week block off duty are produced in sufficient time to adhere to trust policy and organise use of optimal temporary staff levels where required. This now embedded process also allows for a further level of quality assurance by ensuring the matrons approve the off duty produced by the Ward Managers and their deputies. This means that identified staffing shortfall shifts are now being submitted to the temporary staffing department in record time. In conjunction with this, the Lord Carter report has also been circulated with recommendations for best standards in roster production. Most of these recommendations are now in place or in the process of being introduced to the nursing areas within the trust. Further plans are being drawn up to ensure all of Lord Carters recommendations are implemented within the next 12 months as priorities allow and a further policy update was completed in January 2019.
• A Task and Finish work group has been set up to review the current contractual rolling hours balances and Time Owing In Lieu (TOIL) balances for all nursing staff currently utilising the
27. I
tem
10b
ii_B
oard
ope
n25
0919
Nur
s M
idw
sta
ffing
Page 255.10 of 284
Trust Board Report: Ward Staffing. August 2019 25/09/2019
P a g e | 11
HealthRoster system. The group have formalised a plan to ensure these balances are brought under control and KPI monitored in future for conformity. A paper on planned recommendations has been put before the senior nurses meeting during April 2019 and has been approved. It is anticipated this will ensure all staff work their full contractual hours and TOIL is managed more effectively. The end result should produce an additional saving in temporary staffing spend. Staff would not be allowed to work bank whilst they owed the trust contractual hours and staff would not be able to accrue further TOIL whilst getting their current TOIL under control. Balances are to be capped to +/- 24hrs and three monthly KPI reports will be submitted to Care Groups and the senior nurses meeting to ensure on-going compliance.
• A business case has been approved that will allow a new substantive HCA enhanced care team driving quality care of cohorted patients whilst aiming to ban remaining HCA agency usage in this area. In view of data already reported on earlier, this HCA team approach would achieve and maintain total staffing cost efficiencies for the remainder of the new financial year. Although progress has been made, it is anticipated the new Enhanced care observation Team (ECOT) will not be fully active until the Autumn as recruitment is only at 50% and the senior nurse has only this month been hired. Some early case studies have revealed very encouraging signs from the ECO team for a few cognitively impaired patients whose hospital experience has been transformed, treatments given which were previously impossible and enhanced care interventions handed back to core ward nursing staff as individualised nursing and stimulation plans have been put in place. Jason Cram and the Dementia specialist nurse Janet Mortimer are training the team that has so far been recruited and they continue to recruit to the vacant posts.
• The Centralised Matrons roster went live in February 2018 with 27 matrons from all the care groups’ rostering their duties electronically. This will help ensure adequate matron coverage, recording of Bronze Command shifts and Back to the Floor Friday attendance. Back to the floor Friday was relaunched on April 2018. This roster now includes the Exec Director of Nursing and all the Associate Directors of Nursing and has been renamed “Trust Senior nurses” roster from December 2018.
• A bi-directional interface between ESR and HealthRoster also needs setting up at a yearly cost to ensure the auto rostering process has the latest data input to ensure quality results. This project has been added to the overall staff matters plan for 2019/20. Returning the weekly bank payroll process in-house has now made this project viable once the current weekly payroll process has re-embedded.
• Management/supervisory time is factored into all budgets, allowing Band 7’s 0.8wte of their full-time working week as management/supervisory time. Recent discussions around the reporting of this with an outstanding CQC action still highlighted the need for managers to correctly record this in HealthRoster. Reporting from HealthRoster has vastly improved but a number of managers have still been identified incorrectly reporting this which then does not show up on the monthly reporting spread sheets. A further communication has gone out to ward managers in an effort to reduce this practice.
• All nurse fill for general wards is at current agency capped rates with the exception of Operating Theatres and Occupational Health where an escalated rate is being paid in order to maintain supply, however, this rate was cut in February 2017 from the November 2015 (NHSI) capped rate to the February 2016 (NHSI) capped rate. As Theatres remain only one of a few high rate agency usage areas, this capped rate was reviewed in July 2018 alongside RN enhanced bank rates. The e-Rostering lead has met with senior nursing leads for theatres to review progress made with staffing issues and costs. Work continues to ensure Theatre services are brought into line with the rest of the trust. A further review is planned towards the end of the year.
27. I
tem
10b
ii_B
oard
ope
n25
0919
Nur
s M
idw
sta
ffing
Page 255.11 of 284

Trust Board Report: Ward Staffing. August 2019 25/09/2019
P a g e | 12
3.2.1 Bank and Agency Fill Rate
• Bank and Agency fill rates for the financial year to date should be above the 85% minimum benchmark. These figures are generated from the Allocate Bank Staff module and are an accurate reflection of the number of shifts requested and filled trust wide.
Temporary Workforce Distribution
• The target fill rate for RN bank was set at 85% in early 2015. The rationale being that having 85% of the RNs used to fill temporary vacancies on the trust bank would negate the need for agency use. If current fill rates are maintained then between the bank and De Poel the combined fill rate at capped rate would be 85%.
Month
RN HCA RN Fill Rates HCA Fill Rates
Hours Requested
WTE Requested
Hours Filled Bank
Hours Filled
Agency
Hours Requested
WTE Requested
Hours Filled Bank
Hours Filled
Agency Bank Agency Bank Agency
March 2019 39,719 301 33,663 480 36,446 276 29,541 2,424 83.97% 1.21% 81.05% 6.65%
April 2019 31,487 219 26,212 574 32,807 228 26,340 2,335 83.25% 1.82% 80.29% 7.12%
May 2019 33,332 231 27,834 590 33,315 232 26,274 2,797 83.51% 1.77% 78.87% 8.40%
June 2019 34,461 238 28,430 749 33,149 230 25,691 2,740 82.50% 2.17% 77.50% 8.27%
July 2019 35,838 248 27,974 886 33.067 229 25,400 3,213 78.06% 2.47% 76.81% 9.72%
August 2019 38,621 267 28,115 1022 32,700 226 23,978 3,125 72.80% 2.65% 73.33% 9.56%
RN Bank Pay Rate
In December 2017 the Trust introduced enhanced rates for band 6 and band 7 nurses as part of a strategy to tackle agency and overtime use in Urgent Care Centres as well as general ward areas.
Pre-November 2018 Current rates of pay
The table below details the bank rates of pay for Registered Nurses in place up to November 2018.
Day Sat/Night Sun/BH
Band Rate to worker Cost to trust Rate to Worker Cost to Trust Rate to Worker Cost to Trust
5 £18.00 £23.04 £23.40 £29.95 £28.80 £36.86
6 £21.29 £27.25 £27.68 £35.43 £34.06 £43.60
7 £25.77 £32.99 £33.50 £42.88 £41.23 £52.78
Agenda for Change Pay Increase
In spring 2018, the government announced a pay increase for all workers on Agenda for Change pay points. This will be implemented by CDDFT on the July 2018 payroll. As bank HCAs are on Agenda for Change pay points they will receive the pay rate increase. As bank RNs are on locally agreed pay points they will not receive the increase. The rise for substantive RNs however will close the gap between the rates for substantive workers and bank RNs in the Trust. The impact of the changes is demonstrated in the table below.
Mid Point Substantive Substantive Rates
CDDFT Bank Rate
Differential pre Increase
Differential Post Increase Impact on a 7.5 hour shift
Worked (pre Deductions) Pre Increase Post Increase
Band 5 £13.07 £13.26 £18.00 £4.93 £4.74 -£1.43
Band 6 £15.68 £15.91 £21.29 £5.61 £5.38 -£1.73
Band 7 £18.72 £19.00 £25.77 £7.05 £6.77 -£2.10
27. I
tem
10b
ii_B
oard
ope
n25
0919
Nur
s M
idw
sta
ffing
Page 255.12 of 284

Trust Board Report: Ward Staffing. August 2019 25/09/2019
P a g e | 13
Regional Position
All nurse banks in the region with the exception of CDDFT pay bank rates that are aligned with AFC pay points. Gateshead, Sunderland and South Tyneside have increased their bank rates in direct competition to the rates paid by CDDFT. A further review based on current intelligence will take place next month.
3.2.2 Theatre Agency Workers and ODP’s
• Theatre agency nurses and ODPs are currently paid an escalated day rate of £28.80 (day rate) which matches the November 2015 NHSI agency capped rate. The rate was £38.40 prior to February 2017 when it was reduced to its current level. It is proposed that the rate is reduced further to the April 2016 cap of £.22.34 (prior to March 2017 uplift). Agency data demonstrates that Theatres continue to utilise agency staff however and have used an average of 22 shifts per week since August 2017. If Theatres plan to continue to use agency staff despite assurances given in February then there a risk will exist that Theatre productivity will be impacted. As Theatres also utilise bank staff then a reduction in both rates could result in a ‘double whammy’ for operation theatres. Recent discussions have taken place around Theatre rates, but currently, there are no plans to reduce these rates, at least until December 2019. A Safe staffing study of operating theatres was mooted by Operating theatres when they presented to board in August 2018 and is currently being explored.
3.2.3 Overtime
• Overtime is currently available as an option for RNs working hours above 37.5 per week. It was proposed that overtime should only be considered an absolute last resort as of 4th December 2017. However, usage of additional hours for part-time staff should still be encouraged as this is the lowest rate of pay available without harming quality of care. The Temporary Staffing Manager Adam Watson and the e-Rostering matron Brian Nicholson have introduced an overtime matrix that should ensure overtime remains the last choice for employee additional payment. This has now been introduced into policy and the matrix activated. As a result, overtime usage is now reported to be at an all-time low cost for the Trust.
3.2.4 Monitoring
• The Staff Bank and Agency manager will monitor fill rates on a daily basis providing a twice weekly report to the Executive Director of Nursing. Agency usage is reported to NHS Improvement weekly and monitored at the weekly Executive Clinical Leads meetings. Bank and Agency utilisation will continue to be discussed at the Senior Nurse and Midwifery Leadership Group and will be included in the quarterly board reports. In the event that a drop in fill rates resulted in an unacceptable level of risk then the Trust could reverse its decision. Total hours of nursing overtime will be reported and monitored monthly by the Senior Nurse and Midwifery Leadership group. Matrons will be asked to account for the overtime usage in their areas.
3.2.5 Safer staffing evaluation
• A template plan has been formulated to cover the production, review and final submission of all SNCT audit report submissions from January 2019 onwards. The current July 2019 audit data collection has just concluded. Paediatrics has been testing a new scoring tool and are now part of the bi-annual audit process. The data and draft report are to be discussed at the Senior Nurse meeting in October 2019. The data will then be utilised as part of the Trusts wider yearly workforce plan.
• The NHSI are currently looking at draft guidance resources which had been expected to be published in October 2018 on Emergency department nursing. ED from UHND and DMH participated in a SNCT Beta test organised by the NHSI on London and any further updates on the results will be added to this report. In lieu of the new ED SNCT tool being unavailable,
27. I
tem
10b
ii_B
oard
ope
n25
0919
Nur
s M
idw
sta
ffing
Page 255.13 of 284

Trust Board Report: Ward Staffing. August 2019 25/09/2019
P a g e | 14
both ED’s at UHND and DMH continue to participate in a BEST audit bi-annually. These ED data collections have just been produced for July 2019. Again, it was agreed the data would be utilised as part of the Trusts wider yearly workforce plan.
3.2.6 Operating Theatres rostering
• All Trust Theatres have now been set up on the HealthRoster system. Off duties and bank/agency are now being recorded electronically. The trust is already seeing the benefits from recording temporary staffing usage.
Rest of Nursing Rollout
• It has always been anticipated that the electronic rostering system would be rolled out to all nursing staff within the trust to give senior management and the board an effective umbrella overview of day to day nurse staffing management. Suggested completion of this rollout by October 2018 was identified by Lord Carter and is a current Audit objective. Although this is continuing with a number of office hour nursing departments, engagement has commenced with the various Trust out-patients areas, the last large bastions of manual staff management. OPD services at Darlington had agreed to pilot the new electronic methods of recording substantive and bank staff allocation, with a perceived rollout to all OPD’s during 2019 and this continues slowly. It is anticipated that all nursing areas will, in some way, be implemented onto HealthRoster by the end of 2019. The author is planning a final report on the rollout process at the end of the current financial year.
• A Trust Wide real-time rostering initiative has commenced for all nurse electronic rostering processes. This project will ensure all staffing data kept within the HealthRoster system is kept up to date by end user managers on a real-time basis. Identified “Take Charge” Band 5’s will assist in this process. Although there was initially very little response to this initiative all of the rostered areas have now either identified sufficient Band 5 nursing staff who take charge, to assist in the agreed limited management duties or have replied stating they do not have Band 5’s taking charge and have sufficient coverage. However, care groups still need continued encouragement to continue with this process in order to ensure agency time sheets do not remain unpaid.
3.2.7 Maternity Services UHND and DMH
Maternity services throughout the Trust utilise a real-time system called BirthRate + to monitor staffing against patient acuity. Data is input 4 hourly.
Total deliveries for August 2019 = UHND 248 DMH 164 Trust = 412 Data collection compliance: UHND: 99.5% DMH: 87.5% (For the above data to have true value compliance needs to be above 85%) Maternity UHND (August 2019)
• Data captured over a 4 week month – there was only one gap in the acuity completion.
• The monthly acuity data captured, & averaged over the monthly period demonstrates that the acuity staffing had fluctuations in the green, amber & red, with an increase in amber and red and drop in green.
Hospital Acuity met Up to 2 x M/W short Greater than 2 x M/W short
UHND (August) 51% 43.5% 5.5%
DMH (August) 35% 37% 15%
27. I
tem
10b
ii_B
oard
ope
n25
0919
Nur
s M
idw
sta
ffing
Page 255.14 of 284

Trust Board Report: Ward Staffing. August 2019 25/09/2019
P a g e | 15
• This is the peak holiday period with holidays at full capacity, and we have had some cancellation of bank shifts due to the changes in payment from the bank. This has unsettled many of the staff, causing some staff to remove themselves completely from the bank system.
• We currently have six staff pregnant and have interviewed and recruited NQM on three year programme into vacant VCF’s to commence Oct/Nov. This still leaves some hours still to fill when maternity forms are completed.
• We currently have five staff on LTS who are being managed through the sickness and absence policy, one due for return this week..
• Jo Crawford has requested and been provided with data re HCA/support staffing levels. We have recruited into vacant VCF’s two HCA’s expected to start last month.
IDENTIFIED SHIFT SHORTAGES: (in episodes) over the 5 week period:
• Sudden sickness 2
• M/W scrubbed in theatre 31
• Shifts not covered 22 (staff will have been redeployed from Ward 10 to increase midwifery numbers)
• Delay in commencing Induction of labour 24 episodes (planned work)
• Redeployment of staff from Ward 10: 24 times – this would result in Ward 10 antenatal/postnatal falling below the allocated staffing levels at heightened levels of activity within the unit.
• Staff redeployed to ward 10 to support during their high level of work load from delivery suite – 6 times
• Delay in C/S 8 times – (UHND) have x 2 dedicated theatre sessions in main theatre, therefore over x 3 days where elective C/S are planned there has been x 0 delays.
This data needs to be captured more robustly to ensure the reasons for staff shortages and actions take are identified, and can be flagged closely. Delivery suite coordinators have been requested to improve data capture re Red Flags. Co-Ordinator NOT Supernumerary: Number of episodes 11 Proposed new staffing model:
Ward 8 (delivery suite)
M T W T F S S
AM 7 6 7 6 7 6 6
PM 6 6 6 6 6 6 6
N 6 6 6 6 6 6 6
Ward 10 A/N and P/N: M T W T F S S
AM 5 5 6 5 6 5 5 PM 4 4 5 4 5 4 4 N 4 4 4 4 4 4 4
PAU: M T W T F S S
AM 3 3 3 3 3 2 2 PM 2 2 2 2 2 2 2 N 2 2 2 2 2 2 2
27. I
tem
10b
ii_B
oard
ope
n25
0919
Nur
s M
idw
sta
ffing
Page 255.15 of 284

Trust Board Report: Ward Staffing. August 2019 25/09/2019
P a g e | 16
Maternity DMH (August 2019)
Trends with timings of green / amber / red (staffing)
The above demonstrates that the staffing establishment was met only 35% of recorded occasions throughout the month of August, 2019. However, it has also identified the time periods where it has not met. Plausible reasons for this are;
• Midwives scrubbed in theatre with elective surgery – sometimes x2 which would explain the higher demand between the hours of 10:00 and 14:00. Many of these women will stay in recovery for up to four hours. Action: This has been added to the Risk Register and options for an elective theatre list in main theatres are being explored.
• Staff encouraged to book no more than one LSCS per day where achievable to even out the workload. However, due to current rates of elective C/S, this currently runs at approximately 2 per day Action: Pilot pathway to commence utilising ward 61 staff – new pathway commenced 7/01/2019 utilising ward 61 staff to scrub in theatre, this will ensure LW establishment will remain untouched for elective obstetric theatre.
• Due to staffing on PN ward there are many occasions where this MW cannot attend and responsibility falls back on LW establishment. In the month of August, there were 3 recorded delays to elective LSCS.
• It is important to note that in an emergency, midwives from the labour ward establishment would still scrub for theatre. The Emergency LSCS rate in August was 27.4%, therefore, almost a third of all deliveries in August required 2 midwives to enable a safe standard of care.
• Acuity levels can in some way be accounted for due to induction timing and the times women are admitted i.e. 2pm onwards, some of these women would have spontaneously laboured at varying times thus spreading the work load more evenly. A substantial amount of these women receive their medication for induction shortly after admission and therefore, potentially require 1:1 care from 6pm onwards which in turn pushes the acuity more readily to amber/red after 10pm.
• From 3.30pm until 07.30am the staffing model reduces by 1 WTE further impacting on demand. Action: Work is underway to look at changes to pathways for elective work that could reduce the impact in these hours by creating capacity for inductions earlier in the day. Alternative method of induction being explored across the service.
27. I
tem
10b
ii_B
oard
ope
n25
0919
Nur
s M
idw
sta
ffing
Page 255.16 of 284

Trust Board Report: Ward Staffing. August 2019 25/09/2019
P a g e | 17
IDENTIFIED SHIFT SHORTAGES: (in episodes)
Sudden sickness 5
Unable to fill shifts 49
M/W scrubbed in theatre 16
Redeployment 41
Co-Ordinator NOT Supernumerary: 46 episodes = 27%
There were:
• 44 delays to inductions
• 3 delayed LSCS
However, they were still performed within the stated 24 hour period. Delays can always be attributed to levels of acuity and are to maintain patient safety.
4 Model hospital
The overall vision for the Model Hospital is to provide a nationally available data information system relating to metrics of productivity, efficiency and quality of care.
The Model Hospital (https://model.nhs.uk) will provide information in support of trusts developing a greater understanding of their performance and how it compares nationally as well as with smaller peer groups.
The aim of each compartment of the Model Hospital will be to provide areas of the hospital with information from which decisions can be made as to how they might improve productivity and efficiency, whilst ensuring quality outcomes are met.
As good practice, services and structures change to provide new models of care, it will be critical that the Model Hospital can adapt to these and therefore a structured review and revise programme will be set in place.
It is envisaged that the achievement of this vision will provide acute trusts with a common platform by April 2017 through which they are able to:
• Review their Trust level data against the most important metrics in relation to productivity and efficiency and understand their progress against plan or target;
• Understand how they perform in comparison to their peers;
• Understand how they perform in comparison to ‘what good looks like’ nationally;
• Access to case studies and guides of good practice that provide detail of how other acute trusts have achieved levels of performance and good practice in line with ‘what good looks like’;
• Review unwarranted variation in order to understand where efficiencies can be made.
Model Hospital data relevant to this staffing report will be added and updated here on a monthly basis:
27. I
tem
10b
ii_B
oard
ope
n25
0919
Nur
s M
idw
sta
ffing
Page 255.17 of 284

Trust Board Report: Ward Staffing. August 2019 25/09/2019
P a g e | 18
27. I
tem
10b
ii_B
oard
ope
n25
0919
Nur
s M
idw
sta
ffing
Page 255.18 of 284

Trust Board Report: Ward Staffing. August 2019 25/09/2019
P a g e | 19
27. I
tem
10b
ii_B
oard
ope
n25
0919
Nur
s M
idw
sta
ffing
Page 255.19 of 284

Trust Board Report: Ward Staffing. August 2019 25/09/2019
P a g e | 20
27. I
tem
10b
ii_B
oard
ope
n25
0919
Nur
s M
idw
sta
ffing
Page 255.20 of 284

www.cddft.nhs.uk
27. I
tem
10b
ii_B
oard
open
250
919
Nur
s
Page 255.21 of 284

www.cddft.nhs.uk
27. I
tem
10b
ii_B
oard
ope
n25
0919
Nur
s M
idw
sta
ffing
Page 255.22 of 284

Trust Board Report: Ward Staffing. August 2019 25/09/2019
P a g e | 23
27. I
tem
10b
ii_B
oard
ope
n25
0919
Nur
s M
idw
sta
ffing
Page 255.23 of 284

Trust Board Report: Ward Staffing. August 2019 25/09/2019
P a g e | 24
27. I
tem
10b
ii_B
oard
ope
n25
0919
Nur
s M
idw
sta
ffing
Page 255.24 of 284

Trust Board Report: Ward Staffing. August 2019 25/09/2019
P a g e | 25
4.1 NHSI Carter e-Rostering Review
Pharmacy and AHP services currently have their rotas recorded on a spread sheet on a Trust shared drive and complete annual leave cards. All salary payments are calculated manually by submission of paperwork to payroll etc. The current Allocate HealthRoster system contract does not cover use by Pharmacy and AHP services. Those services do have identified leads for rostering and there is a need to assess Allocate HealthRoster system use within Pharmacy and AHP services and subsequent submission of business cases. Pharmacy and Physiotherapy Heads had a meeting with Allocate, and the e-Rostering lead on 14th August 2019 to discuss a potential bid for funding through the NHSI. Further urgent discussions are being made w/c 19/08/2019 as submission of applications through the bid process closes in September 2019
4.2 2019-2020 Nursing Budgets
April 2017 saw the introduction of the 2017-2018 nursing budgets. These had been updated to reflect the ever changing nature of the nursing environment and included new services, increased/decreased services and ultimately, some closures. Some establishments had been amended utilising the SNCT process and this will remain a twice yearly process. The e-Rostering lead has married these new budgets against the monthly unify returns and incorporated them into the monthly staffing report calculations with improved results. However, this continues to be an on-going process every year. A similar process is being followed for the 2019-2020 nursing budgets.
5 Breaches of EWTD Rules
To ensure the Trust adheres to EWTD rules all nursing staff hours are monitored closely within HealthRoster and shifts automatically declined where breaches would occur. Occasionally breaches do occur and these are usually either due to retrospective entry or last minute urgent service needs that would otherwise compromise patient safety. Each breach is individually assessed by Gold Command. Most breaches occur when there is less than 11hrs between required working shifts or the employee has not had their 24/48hrs required rest period in a 7/14 day period.
27. I
tem
10b
ii_B
oard
ope
n25
0919
Nur
s M
idw
sta
ffing
Page 255.25 of 284
www.cddft.nhs.uk
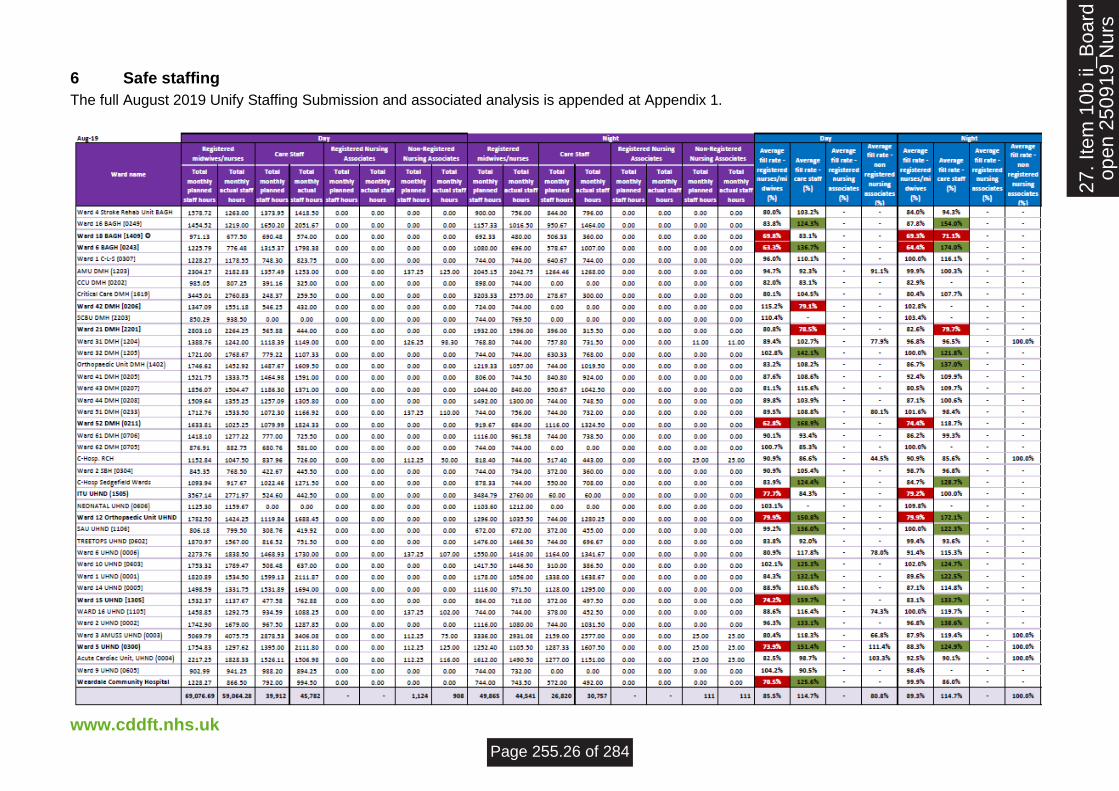
6 Safe staffing
The full August 2019 Unify Staffing Submission and associated analysis is appended at Appendix 1.
27. I
tem
10b
ii_B
oard
open
250
919
Nur
s
Page 255.26 of 284

www.cddft.nhs.uk
6.1 Care Hours per Patient Day (CHPPD) – August 2019
Ward name Cumulative count / month /
patients at 23:59 ea. day
Registered midwives/ nurses
Care Staff Overall
Ward 4 Stroke Rehab Unit BAGH (0248) 733 2.8 3.0 5.8
Ward 16 BAGH [0249] 887 2.5 4.0 6.5
Ward 18 BAGH [1409] 179 6.5 5.2 11.7
Ward 6 BAGH [0243] 636 2.3 4.4 6.7
Ward 1 C-L-S [0307] 486 4.0 3.2 7.2
AMU DMH (1203) 681 6.2 3.7 10.1
CCU DMH [0202] 234 6.6 1.4 8.0
Critical Care DMH (1619) 176 30.3 3.2 33.5
Ward 42 DMH [0206] 245 9.4 1.8 11.1
SCBU DMH [2203] 158 10.8 0.0 10.8
Ward 21 DMH [2201] 219 17.6 3.5 21.1
Ward 31 DMH (1204) 583 3.4 3.2 6.8
Ward 32 DMH (1205) 725 3.5 2.6 6.1
Orthopaedic Unit DMH (1402) 730 3.4 3.6 7.0
Ward 41 DMH [0205] 830 2.5 3.0 5.5
Ward 43 DMH [0207] 900 2.6 2.7 5.3
Ward 44 DMH [0208] 777 3.4 2.6 6.1
Ward 51 DMH (0233) 777 2.9 2.4 5.5
Ward 52 DMH (0211) 781 2.2 4.0 6.2
Ward 61 DMH [0706] 623 3.6 2.3 5.9
Ward 62 DMH [0705] 202 8.1 2.9 10.9
C-Hosp. RCH 302 5.9 3.9 10.1
Ward 2 SBH [0304] 294 5.1 2.7 7.9
C-Hosp Sedgefield Wards 406 4.1 4.9 9.0
ITU UHND (1505) 200 27.7 2.5 30.2
NEONATAL UHND (0606) 250 9.5 0.0 9.5
Ward 12 Orthopaedic Unit UHND (1303) 889 2.8 3.3 6.1
SAU UHND [1106] 240 6.1 3.6 9.8
TREETOPS UHND [0602] 294 10.3 4.9 15.2
Ward 6 UHND (0006) 786 4.1 3.9 8.2
Ward 10 UHND [0603] 678 4.8 1.5 6.3
Ward 1 UHND (0001) 1076 2.4 3.5 5.9
Ward 14 UHND [0005] 968 2.4 3.1 5.5
Ward 15 UHND [1305] 563 3.3 2.2 5.5
WARD 16 UHND [1105] 698 2.9 2.2 5.3
Ward 2 UHND [0002] 701 3.9 3.3 7.2
Ward 3 AMUSS UHND (0003) 1186 5.9 5.0 11.0
Ward 5 UHND (0300) 955 2.5 3.9 6.6
Acute Cardiac Unit UHND (0004) 968 3.4 2.7 6.3
Ward 9 UHND [0605] 281 6.0 3.2 9.1
Weardale Community Hospital (5001) 322 5.0 4.6 9.6
27. I
tem
10b
ii_B
oard
ope
n25
0919
Nur
s M
idw
sta
ffing
Page 255.27 of 284

Trust Board Report: Ward Staffing. August 2019 25/09/2019
P a g e | 28
The graphs at appendix 1 compare the planned against the actual. The unify data is categorised by registered/unregistered and day/nights hours. The graphs also display total hours across both staff groups as unregistered staff can often backfill registered hours. Positive numbers represent overstaffing and negatives understaffing when matching planned against actual:
• Registered Staff –the understaffing was expected in light of the uplifted staffing numbers in 2015 and the previous difficulty backfilling vacant qualified hours. Available substantive hours have remained relatively level over the past 12 months. However, there continues to be a noticeable drop at major vacation periods and prior to financial year end.
• Looking at the substantive planned registered hours per month, they have generally remained constant throughout the last 12 months despite input from EU Nurses.
• Unregistered Staff – the overstaffing of these hours in the past generally resulted from unregistered staff back filling registered duties. However, the unqualified hours are 9808hrs in August 2019, a 31 day month, above the required planned hours compared to July 2019 which was 11967hrs.
Registered and Unregistered combined
• There remain no areas where the RN’s are identified as over the threshold limit of 120%
• There were five wards in August 2019 where RN’s are identified as under the threshold of 80%. The wards are Ward 6 BAGH, Ward 18 BAGH, Ward 52 DMH, Ward 15 UHND and ITU UHND, three of which were previously Community Care Group wards. Ward 18 BAGH is seasonal. However, the other two areas are currently closely being monitored in respect to staffing.
• As with previous months a number of areas exceeded the 120% in relation to unregistered staff, although the number of areas and numbers of hours required had started to fall. Some of these areas were due to a back fill for RN’s, in some cases by Italian RNs assigned to HCA roster lines whilst they are undertaking their language programme. However, there continues to be a marked increase in HCA usage as already discussed. 1:1 and Cohort Care remains a dominant factor. This month the number of wards utilising over 120% HCA’s has reduced by 2 to 12 wards. Areas of note are, Ward 1 UHND, Ward 5 UHND, Ward 12 at UHND, and Ward 52 DMH. All four are continually and heavily cohorting etc.
• Community and acute services are currently looking at ways to resolve the current increase in HCA demand through the Enhanced Care Consortium but there are a number of other reasons for this continued over use of HCA’s.
Areas identified as understaffed with HCA’s - the threshold was set at 80% of budgeted establishment.
• There were three areas with HCA staffing recorded below 80% this month. These were Ward 18 BAGH, Ward 21 DMH and Ward 42 DMH. Ward 18 is seasonal and Ward 21/Ward 42 have a very small number of HCA’s overall, so figures are easily distorted.
27. I
tem
10b
ii_B
oard
ope
n25
0919
Nur
s M
idw
sta
ffing
Page 255.28 of 284

Trust Board Report: Ward Staffing. August 2019 25/09/2019
P a g e | 29
6.2 Reasons for over and under staffing in August 2019
Ward 6 BAGH [0243] 63.3% 136.7% 64.4% 174.0%
Additional staff are being sourced from Ward 4 BAGH. There is currently a query as to whether that information of staff
movement is being recorded accurately within HealthRoster. 1 x member of Band 6 staff recorded full month
movement to Ward 6 BAGH (Joanne Wake)
Ward 52 DMH [0211] 62.8% 168.9% 74.4% 118.7%
Additional staff are being sourced from Ward 4 BAGH. There is currently a query as to whether that information of staff
movement is being recorded accurately within HealthRoster. 2 x Band 6, 15 x Band 5 and 1 x Band 2 recorded full
month movement to Ward 52 (from various wards)
ITU UHND (1505) 77.7% 84.3% 79.2% 100.0%
Its very different in ITU to the wards, July is our quiet time due to surgeons being on holiday and respiratory diseases not
been at there peak, so it is normal for us to have a lower occupancy at this time .Therefore we tend to be more flexibly
with our staffing over this period ,we may give more holidays at short notice or choose to stand down our bank staff. We
also send staff to support DMH if they are short .
We did have some long term sickness which ran over July again we may have selected not to cover that . We would
normally run a shift with 8 registered staff on duty, however we have had some shifts at 7 and even 6 (due to short term
sickness).
We also have more annual leave in July/August/Sept because of staff transferring to us from other areas that have
holiday already booked.
We have 2 apprentice HCA staff current – they are limited by their training regime (cannot do nights and weekends)
therefore our cover is limited because of that – this will resolve in October as they move over to band 2 HCA posts .
Ward 15 UHND [1305] 73.9% 151.4% 88.3% 124.9%10 x RN on leave during August. 3 x RN sickness during August. Back fill with HCA's as usual.
Ward 5 UHND (0300) 73.9% 151.4% 88.3% 124.9%2 x RN sickness during August. 6 x RN on leave during August. Cohorting patients. Vacancy rate. Back fill with HCA's.
Weardale Community Hospital [5001] 70.5% 125.6% 99.9% 86.0%
The WTE planned establishment is 11.37 WTE RN'S
The HCA's are 9.45wte
We have RN vacancies and substantial sickness.
Ward name <80% or >120% - RemarksUnreg Days %RN Days % RN Nights % Unreg Nights %
7 Expectation 2: Escalation and Assurance
Processes are in place to enable staffing establishments to be met on a shift-to-shift basis. The Executive Director of Nursing has ensured that policies and systems are in place, notably eRostering and escalation processes within the safe staffing policy, to support Ward sisters and other colleagues with responsibility for staffing decisions on a shift-to-shift basis. The Associate Directors of Nursing and their teams routinely monitor shift-to-shift staffing levels, including the use of temporary staffing solutions, seeking to manage immediate implications and identify trends. Where staffing shortages are identified, staff refer to escalation policies which provide clarity about the actions needed to mitigate any problems identified. This includes:
• The Bank and Agency Temporary staffing team have now moved to a 6 day per week service and extended their hours of service to 6pm in the evening. This would appear to be giving results as we see an increase in bank RN usage.
• Daily bed management meetings had been observed to react to patient flow and not address staffing as a vital function of this. It is now the case that :
27. I
tem
10b
ii_B
oard
ope
n25
0919
Nur
s M
idw
sta
ffing
Page 255.29 of 284

Trust Board Report: Ward Staffing. August 2019 25/09/2019
P a g e | 30
o Patient flow / bed management meetings return to the Perfect week agenda including an explicit Staffing item.
o Identifying shifts to be given priority for cover by De Poel now occurs on the 11.30 and 16.30 ops calls. A member of the SBAS team is now rostered to dial into every call.
o E-roster bureau develop functionality to offer a ‘helicopter view’ of staffing capacity across the trust on one screen
o This will necessarily mean that all matrons & ward sisters keep their rosters up to date in real time and publish them 6 weeks in advance.
• Matrons & Bronze commanders meet at 0800 daily on each site / teleconference to review & adjust staffing disposition across trust for forthcoming shift / s / days / weekends / night duty
• The potential exists for escalation where staffing pressures cannot be managed to Matrons (Bronze), Associate Directors of Nursing and the Executive Director of Nursing as well as On-call managers (Silver) and the Executive (Gold) out of hours.
• All staff are encouraged and do complete Risk management (Safeguard) forms in order to monitor staffing concerns
• There has been a fall in Staffing related patient safety concerns though most of these now relate to demand management cf. staff shortages (see Appendix 1).
• As well as real time escalation through Bronze command, etc. Safeguard reports are filled and reviewed by managers in real time and a weekly Staffing issues report is prepared at 0800 every Mondays for Executive review at EDs and ECL in tandem with the Monitor bank & Agency report.
• Substantive staffing proportions remained stable in June 2019 (83%) Temporary staffing also remained stable accordingly. (17%).
• This month, 19 out of the 41 in-patient areas had completely stopped using agency and 6 of those left used less than 50hrs a month. Ward 1 UHND, Ward 2 UHND, Ward 3 AMU, Ward 5 UHND, Ward 6 UHND, Ward 12 UHND, Ward 14 UHND, Ward 33 DMH and Ward 52 continue as the identified areas of concern for continued use of agency. These have now been joined by Ward 6 BAGH, Ward 15 UHND, Ward 16 UHND, SAU UHND, Ward 31 DMH, Ward 34 DMH and Ward 41 DMH. Notably, 10 out of 16 of these top areas are from one hospital site, UHND. Ward 1 UHND, Ward 5 UHND, Ward 12 UHND, Ward 33 DMH and Ward 52 DMH are known to be heavily involved in cohorting duties.
8. Assurance statement
Assurance statement
In light of the above mitigating actions the Executive Director of Nursing is assured that there is sufficient resilience – not withstanding some hot spot areas – to ensure that every ward is safely staffed and able to meet patient demand.
9. Outstanding Planning Activities
Re-Audit of HealthRoster System The HealthRoster system was re-audited in July 2017. The previous main audit took place back in early 2016 as Brian arrived at the trust and the system was given an overall “Limited” status at this time. The final re-audit report has now been circulated and the system status overall has jumped up two further levels to a healthy “Good” status. This is only one level away from the top “outstanding” level. Since July 2017, BN has followed the recommendations set out in the final audit report and updated ARC with the results.
27. I
tem
10b
ii_B
oard
ope
n25
0919
Nur
s M
idw
sta
ffing
Page 255.30 of 284
Trust Board Report: Ward Staffing. August 2019 25/09/2019
P a g e | 31
10. Summary
The Trust continues to meets its obligations as set out by NHS England, the CQC and the National Quality Board to review and report ward based nursing and midwifery staffing levels. Overall staffing levels are accurately within tolerance. However the previous process used was insufficiently accurate on an individual ward basis. The Trust Roster Bureau Matron, Brian Nicholson, has undertaken a review of the current process to improve the current reporting mechanisms after his discussions with the Chief Executive and the Director of Nursing. This process is nearing completion and BN continues to work with the Director of Nursing to monitor the monthly staffing performance using this approach. BN has now been in place for 30 months now. The above graphs have now been formatted to a consistent formula over the past 24 months and now show the positive results of the previous 30 months work as well as indicating where the trust staffing process currently is as we again come into a new financial year.
Lord Carters report has now been published and has fully recommended the use of eRostering to meet the workforce productivity challenge. The report has also introduced a new metric called “Care Hours per Patient Day (CHPPD). This metric is related to Nursing Hours per Patient Day, a statutory Australian tool but offers some refinements unrelated to the NICE guidelines on staffing in acute wards which rely upon a benchmarked nurse / patient ratio approach. Care hours per Patient Day is expected to become a key performance reporting metric for all Trusts from 2017 and is achievable by use of an additional Allocate system add-on called “Safe Care”. Review of this additional add-on continues and at some point could be recommended to the board but this would require some additional investment and further benefits costs analysis is required. However, as you can see from this month’s report, the safer care staffing report now also reports on the number of patients on each ward/in-patient area at midnight as part of a move towards the CHPPD metric. However, accuracy of this data also depends on the accuracy of the staffing hours reported. As previously discussed, there continues to be ongoing work required on individual establishment budgets for quality assurance purposes.
The Trust Board will continue to be advised of further developments in the nursing and midwifery staffing arena.
Noel Scanlon Brian Nicholson Executive Director of Nursing Matron: eRostering Lead September 16th, 201
27. I
tem
10b
ii_B
oard
ope
n25
0919
Nur
s M
idw
sta
ffing
Page 255.31 of 284

www.cddft.nhs.uk
Appendix 1:
Appx 1.1 Monthly Graphs The following graphs compare the planned against the actual. The unify data is categorised by registered/unregistered and day/nights hours. The graphs also display total hours across both staff groups as unregistered staff can often backfill registered hours. Positive numbers represent overstaffing and negatives understaffing when matching planned against actual. Registered Staff –the understaffing was expected in light of the uplifted staffing numbers in 2015 and the previous difficulty backfilling vacant qualified hours. Available substantive hours have remained relatively level over the past 12 months.
69077
59064
54000
56000
58000
60000
62000
64000
66000
68000
70000
Aug-19
Registered planned/actual day hours
Total monthly registered staff plannedday hours
Total monthly registered staff actualday hours
49865
44541
41000
42000
43000
44000
45000
46000
47000
48000
49000
50000
51000
Aug-19
Registered planned/actual night hours
Total monthly registered staffplanned night hours
Total monthly registered staff actualnight hours
118942
103606
95000
100000
105000
110000
115000
120000
125000
Aug-19
Registered planned/actual day & night hours
Total monthly registered staff plannedday & night hoursTotal monthly registered staff actual day& night hours
-15336
-18000
-16000
-14000
-12000
-10000
-8000
-6000
-4000
-2000
0
Total hours difference between planned & actual
for registered days & nights
Looking at the substantive planned registered hours per month, they have generally remained constant throughout the last 12 months despite input from EU Nurses.
27. I
tem
10b
ii_B
oard
ope
n25
0919
Nur
s M
idw
sta
ffing
Page 255.32 of 284
Trust Board Report: Ward Staffing. August 2019 25/09/2019
P a g e | 33
39912
45782
36000
37000
38000
39000
40000
41000
42000
43000
44000
45000
46000
47000
Aug-19
Unregistered planned/actual day hours
Total monthly unregistered staffplanned day hours
Total monthly unregistered staff actualday hours
26820
30757
24000
25000
26000
27000
28000
29000
30000
31000
32000
Aug-19
Unregistered planned/actual night hours
Total monthly unregistered staffplanned night hoursTotal monthly unregistered staff actualnight hours
66732
76539
60000
62000
64000
66000
68000
70000
72000
74000
76000
78000
Aug-19
Unregistered planned/actual day hours
Total monthly unregistered staffplanned day & night hoursTotal monthly unregistered staff actualday & night hours
9808
0
2000
4000
6000
8000
10000
12000
Total hours difference between planned & actual
for unregistered days & nights
27. I
tem
10b
ii_B
oard
ope
n25
0919
Nur
s M
idw
sta
ffing
Page 255.33 of 284

Trust Board Report: Ward Staffing. August 2019 25/09/2019
P a g e | 34
27. I
tem
10b
ii_B
oard
ope
n25
0919
Nur
s M
idw
sta
ffing
Page 255.34 of 284

Trust Board Report: Ward Staffing. August 2019 25/09/2019
P a g e | 35
Registered and Unregistered combined
185673
180145
177000
178000
179000
180000
181000
182000
183000
184000
185000
186000
187000
Aug-19
Registered/unregistered planned/total hours
Total monthly registered/unregistered staffplanned day/night hoursTotal monthly registered/unregistered staff actualday/night hours
-5528-6000
-5000
-4000
-3000
-2000
-1000
0
Registered/unregistered difference between planned & actual total
hours
Total hours difference between planned & actualfor registered/unregistered days & nights
27. I
tem
10b
ii_B
oard
ope
n25
0919
Nur
s M
idw
sta
ffing
Page 255.35 of 284

Trust Board Report: Ward Staffing. August 2019 25/09/2019
P a g e | 36
Areas identified as over staffing – the threshold is set at 120% of budgeted establishment.
27. I
tem
10b
ii_B
oard
ope
n25
0919
Nur
s M
idw
sta
ffing
Page 255.36 of 284

Trust Board Report: Ward Staffing. August 2019 25/09/2019
P a g e | 37
27. I
tem
10b
ii_B
oard
ope
n25
0919
Nur
s M
idw
sta
ffing
Page 255.37 of 284

Trust Board Report: Ward Staffing. August 2019 25/09/2019
P a g e | 38
Areas identified as understaffed with HCA’s - the threshold was set at 80% of budgeted establishment.
How the wards were staffed – temporary workers include both bank and agency
27. I
tem
10b
ii_B
oard
ope
n25
0919
Nur
s M
idw
sta
ffing
Page 255.38 of 284

Trust Board Report: Ward Staffing. August 2019 25/09/2019
P a g e | 39
Breakdown of substantive hours by month
27. I
tem
10b
ii_B
oard
ope
n25
0919
Nur
s M
idw
sta
ffing
Page 255.39 of 284

Trust Board Report: Ward Staffing. August 2019 25/09/2019
P a g e | 40
27. I
tem
10b
ii_B
oard
ope
n25
0919
Nur
s M
idw
sta
ffing
Page 255.40 of 284

Trust Board Report: Ward Staffing. August 2019 25/09/2019
P a g e | 41
27. I
tem
10b
ii_B
oard
ope
n25
0919
Nur
s M
idw
sta
ffing
Page 255.41 of 284

Trust Board Report: Ward Staffing. August 2019 25/09/2019
P a g e | 42
Breakdown of temporary worker hours by month
27. I
tem
10b
ii_B
oard
ope
n25
0919
Nur
s M
idw
sta
ffing
Page 255.42 of 284

Trust Board Report: Ward Staffing. August 2019 25/09/2019
P a g e | 43
Backfilling vacant hours for August 2019
27. I
tem
10b
ii_B
oard
ope
n25
0919
Nur
s M
idw
sta
ffing
Page 255.43 of 284

Trust Board Report: Ward Staffing. August 2019 25/09/2019
P a g e | 44
27. I
tem
10b
ii_B
oard
ope
n25
0919
Nur
s M
idw
sta
ffing
Page 255.44 of 284

Trust Board – 25th September, 2019
Item 10b (i) Nursing and Midwifery Ward Staffing Report – August 2019
Open Session x Private & Confidential Session
Author Brian Nicholson e-Rostering Matron; Noel Scanlon Executive Director of Nursing
Reason for Submission
Standing item
Development / approval or update on strategy Decision reserved for Board Statutory / regulatory requirement Oversight of significant risks Update on action log item Requires Board approval e.g. policies or business cases Core performance information
Strategic Aim:
To transform care pathways and develop services which deliver the
best patient outcomes
To enable delivery of care by staff and in patient environments that provide the best patient experience To maximise our resources and relationships to sustain services and deliver best efficiency To attract, support, engage and develop our staff to provide care they are proud of – best employer
Purpose of Report
To inform executive team of monthly key themes around safe staffing and Agency/bank spend.
Positive performance / developments within this
Positive matters Page
In light of mitigating actions the Executive Director of Nursing is assured that there is sufficient resilience – not withstanding some hot spot areas – to ensure that every ward is safely staffed and able to meet patient demand.
5
report Figures show that RN and HCA overtime usage over the 41 identified areas in this report continues to remain negligible, as it has for the past year and continues to comply with the December 2017 plan. There was 38hrs of RN overtime utilised in August and only 26hrs of HCA overtime. RN bank coverage has increased very marginally by 225hrs when compared with July, but RN agency also increased by a further 192hrs. However, HCA agency has decreased by 470hrs on July’s requirement. HCA bank usage has also decreased by 1565hrs this month. To summarise, substantive and bank employee availability decreased at the peak of holiday season whilst staff working overtime, additional hours and RN agency increased in an attempt to compensate.
7
Overall, the total Trust overtime usage has nearly doubled in August 2019 when compared with previous months. We can now say this is all overtime worked within the unmonitored community areas. Total Trust additional hour’s usage increased by 957hrs over August when compared with July. Although this is the cheapest form of organising additional staffing it also transfers the pressures of additional work hours on to part-time staff only.
7
Overall 38 out of 41 in-patient areas have now completely stopped using overtime with the remaining areas only using 63.5hrs of overtime in August. The author is pleased to report that overtime usage within the 41 identified areas remains, for all intent and purpose, marginalised. In fact, RN’s utilised only 38hrs of overtime in the 41 monitored areas.
8
This month, 19 out of the 41 in-patient areas had completely stopped using agency and 6 of those left used less than 50hrs a month. Ward 1 UHND, Ward 2 UHND, Ward 3 AMU, Ward 5 UHND, Ward 6 UHND, Ward 12 UHND, Ward 14 UHND, Ward 33 DMH and Ward 52 continue as the identified areas of concern for continued use of
30
28. I
tem
10b
_i O
pen
Boa
rd25
0919
Cov
er S
heet
- S
afer
Page 255.45 of 284

[Item 10c] – [Safe staffing report] 2
agency. These have now been joined by Ward 6 BAGH, Ward 15 UHND, Ward 16 UHND, SAU UHND, Ward 31 DMH, Ward 34 DMH and Ward 41 DMH. Notably, 10 out of 16 of these top areas are from one hospital site, UHND. Ward 1 UHND, Ward 5 UHND, Ward 12 UHND, Ward 33 DMH and Ward 52 DMH are known to be heavily involved in cohorting duties.
The Richardson Community Hospital and CCU DMH jointly receive their title of model wards of the month for utilising no additional staffing time via bank, agency, overtime and additional hours. An excellence report has been submitted.
8
Key issues and actions within this report
Issue and actions Page
August 2019 workforce reports show there were 152.18 RN (WTE) vacancies (taking account of frozen posts and appointments under process) and 29.56 HCA (WTE) vacancies. 12 Nursing Associate Apprentices have been recruited for the September 2019 following the approval of the Business case. The NRC group continues to meet on a monthly basis.
7
In relation to the planned against actual, the Trust had understaffed by 15336 Registered hours, but overstaffed by 9808 unregistered hours; with has led to a net understaffing of 5528 hours in total. Overall substantive hours have massively decreased by 5,286hrs in August 2019 when compared to July 2019. This is a worrying trend as temporary staffing processes were unable to flex and meet the additional demand during peak holiday time. This comes at a time when demand remains high for both RN and HCA temporary staffing, but both RN and HCA fill rates have fallen 7% below the acceptable 80% benchmark. RN and HCA agency have compensated to a certain point. Monthly trends show the trust in-patient areas have a maximum capacity of 17000hrs of RN bank, but we have only utilised 15000-16000hrs over the last 4 months. The trust in-patient areas have a maximum capacity of 20000-21000hrs of HCA bank and we have been running at capacity for the last 5 months. To summarise, RN bank demand continues to increase month on month with a worsening fill rate, whilst HCA bank is at full capacity leading. Either demand must plateau or the bank employee supply pool must increase. Otherwise the trust will see an increasing return to agency hours utilisation.
7
As with previous months a number of areas exceeded the 120% in relation to unregistered staff, although the number of areas and numbers of hours required had started to fall. Some of these areas were due to a back fill for RN’s, in some cases by Italian RNs assigned to HCA roster lines whilst they are undertaking their language programme. However, there continues to be a marked increase in HCA usage as already discussed. 1:1 and Cohort Care remains a dominant factor. This month the number of wards utilising over 120% HCA’s has reduced by 2 to 12 wards. Areas of note are, Ward 1 UHND, Ward 5 UHND, Ward 12 at UHND, and Ward 52 DMH. All four are continually and heavily cohorting etc
28
Graduate Recruitment / Return to Practice Update Cohort Recruitment 14th June 2019. Adult Branch - 45 still going through process. 6 students have withdrawn. Several Students have been identified as having high sickness rates. They have been offered a 6 month probationary period due to their sickness by recruiting managers. Quite a number of students have reapplied for community posts advertised from the trust if they did not get what they wanted first time. 9 going to Surgery. 20 going to medicine + 3 RTP = 23.16 going to Community. Child Branch - 6 still going through process. Midwifery - 12 interviewed - all offered posts. 1 declined and 3 have withdrawn 8 still going through recruitment process.
9
Student Nurse Cohort Qualifying January to April 2020 The trust practice placement team attended a Jobs Fair at Teesside University on 18th March with good interest. 5th September meet the team’s Flyer sent out to all Teesside students qualifying in January 2020 and Sunderland Students qualifying in April 2020. Invitations to apply for the posts have been sent out - currently 26 have applied to adult, 6 to child. Interviews are arranged for 4th October 2019 on ward 17 BAGH. 3 recent offers were made to registered nurses through the advert open until the end of January 2019. All have been offered posts within CDDFT.
9
28. I
tem
10b
_i O
pen
Boa
rd25
0919
Cov
er S
heet
- S
afer
Page 255.46 of 284

[Item 10c] – [Safe staffing report] 3
Overseas recruitment (EU recruitment) Cohort 12 made up of 2 staff, arrived on the 12th September 2019. All of the new cohort have been allocated placements within mainstream in-patient areas at UHND. This comprises the completion of the 2018 business case.
9
Midwifery Midwifery staffing offers some cause for concern. Staffing matched to demand at UHND was 51%, DMH 35% (though data collection <87.5%). The causes for this are multi-factorial however September being the peak month for deliveries, Caesarean section rate of 27.4% ( >21% is considered above acceptable rates), the long established practice of midwives scrubbing in for Caesarean sections and higher rates of long term sickness appear significant. The Care group are urgently looking at remedial actions in each of these areas with the support of the Surgical department. At times of unacceptably low levels of staffing Labour ward/s will be closed electively to avoid unsafe staffing levels. This has not been necessary in August but is one of a number of possible contingencies during September.
14 to 17
This safe staffing report only relates to permanent established wards and does not take full account of escalation beds that continue to be opened during the course of 2019. However, increased usage of staffing to cover this extremely prolonged escalation surge can still be clearly seen in the monthly returns to the NHSI and reported to the board monthly in this paper.
26 to 44
Regulatory compliance implications
Tick for any implications for compliance with NHS Constitution Provider Licence (especially Condition 6) CQC Fundamental Standards of Care Health and Social Care Act Mental Health Act / Mental Capacity Act
Significant risks identified
On-going risk with nationwide shortage of RN’s and maintaining safe and quality staffing environment within the trust in-patient areas.
Action required from the Board
The Board is asked to receive this report and decide if any further actions and/or information are required.
28. I
tem
10b
_i O
pen
Boa
rd25
0919
Cov
er S
heet
- S
afer
Page 255.47 of 284

Learning from Deaths Dashboard
Organisation
Financial Year
Month
Co Durham and Darlington NHS Foundation Trust
2018-19
March
31. I
tem
11a
(i) T
rust
lear
ning
-fro
m-d
eath
s-
Page 271.1 of 284

Co Durham and Darlington NHS Foundation Trust: Learning from Deaths Dashboard - 2018-19 March
No. % No. % No. % % No. % No. % No. %
Apr-18 Final 204 44 22% 44 100% 82 40% 1 1% 81 99% 65 79% 7 9%
May-18 Final 158 20 13% 20 100% 54 34% 0 0% 54 100% 53 98% 1 2%
Jun-18 Final 152 31 20% 31 100% 66 43% 0 0% 66 100% 60 91% 1 2%
Jul-18 Provisional 163 27 17% 26 96% 59 36% 1 2% 58 98% 44 75% 2 3%
Aug-18 Final 146 33 23% 33 100% 58 40% 1 2% 56 97% 54 93% 1 2%
Sep-18 Provisional 135 26 19% 25 96% 60 44% 0 0% 59 98% 54 90% 2 3%
Oct-18 Provisional 139 22 16% 21 95% 51 37% 0 0% 51 100% 44 86% 2 4%
Nov-18 Provisional 169 30 18% 28 93% 60 36% 1 2% 59 98% 55 92% 2 3%
Dec-18 Provisional 156 25 16% 23 92% 52 33% 1 2% 50 96% 47 90% 2 4%
Jan-19 Provisional 194 40 21% 37 93% 76 39% 0 0% 76 100% 63 83% 4 5%
Feb-19 Provisional 189 36 19% 31 86% 68 36% 0 0% 68 100% 62 91% 2 3%
Mar-19 Provisional 174 31 18% 24 77% 63 36% 0 0% 63 100% 53 84% 1 2%
Q1 18/19 Final 514 95 18.5% 95 100.0% 202 39.3% 1 0.5% 201 99.5% 178 88.1% 9 4.5%
Q2 18/19 Provisional 444 86 19.4% 84 97.7% 177 39.9% 2 1.1% 173 97.7% 152 85.9% 5 2.8%
Q3 18/19 Provisional 464 77 16.6% 72 93.5% 163 35.1% 2 1.2% 160 98.2% 146 89.6% 6 3.7%
Q4 18/19 Provisional 557 107 19.2% 92 86.0% 207 37.2% 0 0.0% 207 100.0% 178 86.0% 7 3.4%
No. % No. % No. % No. % No. % No. % No. % No. %
Apr-18 Final 1 1 100% 1 100% 0 0% 0% 0% Apr-18 Final 14 14 100% 11 79% 0 0%
May-18 Final 2 2 100% 2 100% 0 0% 0% 0% May-18 Final 16 16 100% 13 81% 1 6%
Jun-18 Final 2 2 100% 2 100% 0 0% 0% 0% Jun-18 Final 14 14 100% 14 100% 0 0%
Jul-18 Final 0 Jul-18 Provisional 10 2 20% 2 100% 0 0%
Aug-18 Final 3 3 100% 3 100% 0 0% 0% 0% Aug-18 Provisional 3 1 33% 1 100% 0 0%
Sep-18 Final 1 1 100% 1 100% 0 0% 0% 0% Sep-18 Provisional 16 7 44% 6 86% 0 0%
Oct-18 Final 1 1 100% 0 0% 0 0% 0% 0% Oct-18 Provisional 21 12 57% 7 58% 0 0%
Nov-18 Final 2 2 100% 2 100% 0 0% 0% 0% Nov-18 Provisional 15 7 47% 6 86% 0 0%
Dec-18 Final 1 1 100% 1 100% 0 0% 0% 0% Dec-18 Provisional 20 10 50% 10 100% 0 0%
Jan-19 Final 3 3 100% 3 100% 0 0% 0% 0% Jan-19 Provisional 16 9 56% 9 100% 0 0%
Feb-19 Final 3 3 100% 3 100% 0 0% 0% 0% Feb-19 Provisional 15 9 60% 8 89% 0 0%
Mar-19 Final 2 2 100% 2 100% 0 0% 0% 0% Mar-19 Provisional 19 8 42% 6 75% 1 13%
Q1 18/19 Final 5 5 100.0% 5 100.0% 0 0.0% 0 0.0% 0 0.0% Q1 18/19 Final 44 44 100.0% 38 86.4% 1 2.3%
Q2 18/19 Final 4 4 100.0% 4 100.0% 0 0.0% 0 0.0% 0 0.0% Q2 18/19 Provisional 29 10 34.5% 9 90.0% 0 0.0%
Q3 18/19 Final 4 4 100.0% 3 75.0% 0 0.0% 0 0.0% 0 0.0% Q3 18/19 Provisional 56 29 51.8% 23 79.3% 0 0.0%
Q4 18/19 Final 8 8 100.0% 8 100.0% 0 0.0% 0 0.0% 0 0.0% Q4 18/19 Provisional 50 26 52.0% 23 88.5% 1 3.8%
Description:
The suggested dashboard is a tool to aid the systematic recording of deaths and learning from care provided by NHS Trusts. Trusts are encouraged to use this to record relevant incidents of mortality, number of deaths reviewed and cases from which lessons can be learnt to improve care.
Month of
DeathData
Deaths reviewed
where care during
last admission was
graded as excellent,
very good or good
Data Month of
death
Summary of total number of deaths and total number of cases reviewed under the PRISM II Methodology
Total Number of Deaths, Deaths Reviewed and Deaths Deemed Avoidable (does not include patients with identified learning disabilities or death within the ED Department)
Deaths meeting
inclusion criteriaTotal No. of
deaths
Deaths reviewed
meeting inclusion
criteria
No. of
deaths
Number of deaths
reviewed
ED Death Reviews
Deaths reviewed
where care during
last admission was
graded as poor or
very poor
Deaths reviewed where
care was graded as
excellent or v.good
Deaths reviewed where
care was graded as
poor or very poorMonth of
DeathData
Total Number of
Deaths reviewed
No. of
deaths
Deaths judged as
avoidable (>50%
likelihood of
avoidability
LeDer reviews in
Progress
Learning Disability Review
Total Number of Deaths, Deaths Reviewed and Deaths Deemed Avoidable
Deaths judged as
definitely not
avoidable or slight
evidence of
avoidability
No.
Deaths reviewed
under PRISM II
methodology
Deaths judged as
definitely not
preventable
Deaths judged as
avoidable (>50%
likelihood of
avoidability)
Completed LeDer
reviews
1% 0% 0% 2% 2% 0% 0% 2% 2% 0% 0% 0%
0%
10%
20%
30%
40%
50%
60%
70%
80%
90%
100%
Apr-18 May-18 Jun-18 Jul-18 Aug-18 Sep-18 Oct-18 Nov-18 Dec-18 Jan-19 Feb-19 Mar-19
Mortality over time, total deaths reviewed and deaths considered to have been potentially avoidable
(Note: Changes in recording or review practice may make comparison over time invalid)
Deaths reviewed meeting inclusion criteria
Deaths judged as avoidable (>50% likelihood of avoidability
Deaths judged as definitely not avoidable or slight evidence of avoidability
Deaths reviewed where care during last admission was graded as excellent, very good or good
Deaths reviewed where care during last admission was graded as poor or very poor
31. I
tem
11a
(i) T
rust
lear
ning
-fro
m-d
eath
s-
Page 271.2 of 284

Co Durham and Darlington NHS Foundation Trust: Learning from Deaths Dashboard - 2018-19 March
No. % No. % No. % No. % No. % No. %
Apr-18 Final 130 24 18% 24 100% 48 37% 1 2% 47 98% 37 77% 5 10%
May-18 Final 96 12 13% 12 100% 36 38% 0 0% 36 100% 35 97% 1 3%
Jun-18 Final 94 13 14% 13 100% 35 37% 0 0% 35 100% 31 89% 1 3%
Jul-18 Provisional 105 19 18% 18 95% 39 37% 0 0% 39 100% 30 77% 1 3%
Aug-18 Final 98 21 21% 21 100% 41 42% 0 0% 40 98% 38 93% 0 0%
Sep-18 Final 97 18 19% 18 100% 47 48% 0 0% 46 98% 42 89% 1 2%
Oct-18 Final 98 14 14% 14 100% 38 39% 0 0% 38 100% 32 84% 2 5%
Nov-18 Final 102 17 17% 17 100% 39 38% 0 0% 39 100% 35 90% 2 5%
Dec-18 Final 97 16 16% 16 100% 33 34% 0 0% 32 97% 31 94% 0 0%
Jan-19 Provisional 123 28 23% 27 96% 51 41% 0 0% 51 100% 39 76% 4 8%
Feb-19 Final 105 22 21% 22 100% 43 41% 0 0% 43 100% 37 86% 2 5%
Mar-19 Provisional 114 23 20% 20 87% 42 37% 0 0% 42 100% 36 86% 1 2%
Q1 18/19 Final 320 49 15.3% 49 100.0% 119 37.2% 1 0.8% 118 99.2% 103 86.6% 7 5.9%
Q2 18/19 Provisional 300 58 19.3% 57 98.3% 127 42.3% 0 0.0% 125 98.4% 110 86.6% 2 1.6%
Q3 18/19 Final 297 47 15.8% 47 100.0% 110 37.0% 0 0.0% 109 99.1% 98 89.1% 4 3.6%
Q4 18/19 Provisional 342 73 21.3% 69 94.5% 136 39.8% 0 0.0% 136 100.0% 112 82.4% 7 5.1%
No. % No. % No. % No. % No. % No. % No. % No. % No. %
Apr-18 Final 14 14 100% 11 79% 0 0% 15 7 47% 4 57% 1 14% Apr-18 18 7 39% 6 86% 1 14%
May-18 Final 16 16 100% 13 81% 1 6% 8 6 75% 5 83% 1 17% May-18 16 6 38% 6 100% 0 0%
Jun-18 Final 14 14 100% 14 100% 0 0% 5 2 40% 2 100% 0 0% Jun-18 14 6 43% 6 100% 0 0%
Jul-18 Provisional 10 2 20% 0% 0% 6 3 50% 1 33% 0 0% Jul-18 13 3 23% 3 100% 0 0%
Aug-18 Provisional 3 1 33% 0% 0% 7 5 71% 5 100% 0 0% Aug-18 13 3 23% 3 100% 0 0%
Sep-18 Provisional 16 7 44% 6 86% 0 0% 16 9 56% 9 100% 0 0% Sep-18 5 3 60% 2 67% 0 0%
Oct-18 Provisional 21 12 57% 7 58% 0 0% 12 4 33% 4 100% 0 0% Oct-18 10 3 30% 1 33% 1 33%
Nov-18 Provisional 15 7 47% 0% 0% 11 4 36% 4 100% 0 0% Nov-18 12 8 67% 7 88% 0 0%
Dec-18 Provisional 20 10 50% 0% 0% 7 3 43% 2 67% 0 0% Dec-18 13 7 54% 7 100% 0 0%
Jan-19 Provisional 16 9 56% 0% 0% 6 4 67% 4 100% 0 0% Jan-19 19 10 53% 8 80% 0 0%
Feb-19 Provisional 15 9 60% 0% 0% 8 2 25% 2 100% 0 0% Feb-19 18 5 28% 5 100% 0 0%
Mar-19 Provisional 19 8 42% 0% 0% 14 4 29% 4 100% 0 0% Mar-19 16 8 50% 7 88% 0 0%
Q1 18/19 Final 44 44 100.0% 38 86.4% 1 2.3% 28 15 53.6% 11 73.3% 2 13.3% Q1 18/19 48 19 39.6% 18 94.7% 1 5.3%
Q2 18/19 Provisional 29 10 34.5% 6 60.0% 0 0.0% 29 17 58.6% 15 88.2% 0 0.0% Q2 18/19 31 9 29.0% 8 88.9% 0 0.0%
Q3 18/19 Provisional 56 29 51.8% 7 24.1% 0 0.0% 30 11 36.7% 10 90.9% 0 0.0% Q3 18/19 35 18 51.4% 15 83.3% 1 5.6%
Q4 18/19 Provisional 50 26 52.0% 0 0.0% 0 0.0% 28 10 35.7% 10 100.0% 0 0.0% Q4 18/19 53 23 43.4% 20 87.0% 0 0.0%
Oct-18
Nov-18
Q4 18/19
Jan-19
Feb-19
Mar-19
Q1 18/19
Q2 18/19
Q3 18/19
Dec-18
Jul-18
Deaths reviewed
where care was
graded as poor or
very poor
Aug-18
Sep-18
Jun-18
Deaths reviewed
where care was
graded as poor or very
poor
Apr-18
May-18
Month of
Death
No. of
deaths
No. of
deaths
Month of
Death
Respiratory Death ReviewsED Death Reviews Cardiology Death Reviews
Month of
DeathData
No. of
deaths
Number of deaths
reviewed
Deaths reviewed
where care was
graded as excellent,
v.good or good
Number of deaths
reviewed
Deaths reviewed
where care was
graded as excellent or
good
Deaths reviewed
where care was
graded as poor or
very poor
Number of deaths
reviewed
Deaths reviewed
where care was
graded as excellent,
v.good or good
Acute & Emergency Care
Summary of total number of deaths and total number of cases reviewed under the PRISM II Methodology
Total Number of Deaths, Deaths Reviewed and Deaths Deemed Avoidable (does not include patients with identified learning disabilities or death within the ED Department)
Month of
deathData
Total No. of
deaths
Deaths meeting
inclusion criteria
Deaths reviewed
meeting inclusion
criteria
Total Number of
Deaths reviewed
Deaths judged as
avoidable (>50%
likelihood of
avoidability
Deaths judged as
definitely not
avoidable or slight
evidence of
avoidability
Deaths reviewed
where care during last
admission was graded
as excellent, very
good or good
Deaths reviewed
where care during last
admission was graded
as poor or very poor
% No.
2% 0% 0% 0% 0% 0% 0% 0% 0% 0% 0% 0%
0%
10%
20%
30%
40%
50%
60%
70%
80%
90%
100%
Mortality over time, total deaths reviewed and deaths considered to have been potentially avoidable
(Note: Changes in recording or review practice may make comparison over time invalid)
Deaths reviewed meeting inclusion criteria
Deaths judged as avoidable (>50% likelihood of avoidability
Deaths judged as definitely not avoidable or slight evidence of avoidability
Deaths reviewed where care during last admission was graded as excellent, very good or good
Deaths reviewed where care during last admission was graded as poor or very poor
31. I
tem
11a
(i) T
rust
lear
ning
-fro
m-d
eath
s-
Page 271.3 of 284

Co Durham and Darlington NHS Foundation Trust: Learning from Deaths Dashboard - 2018-19 March
No. % No. % No. % % No. % No. % No. %
Apr-18 Final 48 7 15% 7 100% 16 33% 0 0% 16 100% 12 75% 1 6%
May-18 Final 44 4 9% 4 100% 12 27% 0 0% 12 100% 12 100% 0 0%
Jun-18 Final 36 8 22% 8 100% 15 42% 0 0% 15 100% 14 93% 0 0%
Jul-18 Final 40 1 3% 1 100% 9 23% 0 0% 9 100% 9 100% 0 0%
Aug-18 Final 32 1 3% 1 100% 6 19% 0 0% 6 100% 6 100% 0 0%
Sep-18 Final 25 3 12% 3 100% 7 28% 0 0% 7 100% 6 86% 1 14%
Oct-18 Final 27 0 0% 4 15% 0 0% 4 100% 4 100% 0 0%
Nov-18 Final 50 5 10% 5 100% 12 24% 0 0% 12 100% 12 100% 0 0%
Dec-18 Final 37 1 3% 1 100% 11 30% 0 0% 11 100% 11 100% 0 0%
Jan-19 Final 55 2 4% 2 100% 15 27% 0 0% 15 100% 15 100% 0 0%
Feb-19 Final 65 5 8% 5 100% 18 28% 0 0% 18 100% 18 100% 0 0%
Mar-19 Provisional 43 5 12% 4 80% 15 35% 0 0% 15 100% 11 73% 0 0%
Q1 18/19 Final 128 19 14.8% 19 100.0% 43 33.6% 0 0.0% 43 100.0% 38 88.4% 1 2.3%
Q2 18/19 Provisional 97 5 5.2% 5 100.0% 22 22.7% 0 0.0% 22 100.0% 21 95.5% 1 4.5%
Q3 18/19 Final 114 6 5.3% 6 100.0% 27 23.7% 0 0.0% 27 100.0% 27 100.0% 0 0.0%
Q4 18/19 Provisional 163 12 7.4% 11 91.7% 48 29.4% 0 0.0% 48 100.0% 44 91.7% 0 0.0%
No. % No. % No. % No. % No. % No. %
Apr-18 Provisional 11 3 27% 1 33% 0 0% Apr-18 Provisional 42 14 33% 10 71% 1 7%
May-18 Provisional 11 3 27% 3 100% 0 0% May-18 Provisional 37 12 32% 12 100% 0 0%
Jun-18 Provisional 14 2 14% 2 100% 0 0% Jun-18 Provisional 32 13 41% 12 92% 0 0%
Jul-18 Provisional 14 1 7% 1 100% 0 0% Jul-18 Provisional 34 6 18% 6 100% 0 0%
Aug-18 Provisional 11 3 27% 3 100% 0 0% Aug-18 Provisional 27 6 22% 6 100% 0 0%
Sep-18 Provisional 2 0 0% Sep-18 Provisional 20 6 30% 5 83% 1 17%
Oct-18 Provisional 5 0 0% Oct-18 Provisional 24 4 17% 4 100% 0 0%
Nov-18 Provisional 11 3 27% 3 100% 0 0% Nov-18 Provisional 43 12 28% 12 100% 0 0%
Dec-18 Provisional 6 1 17% 1 100% 0 0% Dec-18 Provisional 33 11 33% 11 100% 0 0%
Jan-19 Provisional 7 1 14% 1 100% 0 0% Jan-19 Provisional 51 15 29% 15 100% 0 0%
Feb-19 Provisional 10 2 20% 2 100% 0 0% Feb-19 Provisional 63 18 29% 18 100% 0 0%
Mar-19 Provisional 5 1 20% 1 100% 0 0% Mar-19 Provisional 39 15 38% 11 73% 0 0%
Q1 18/19 Provisional 36 8 22.2% 6 75.0% 0 0.0% Q1 18/19 Provisional 111 39 35.1% 34 87.2% 1 2.6%
Q2 18/19 Provisional 27 4 14.8% 4 100.0% 0 0.0% Q2 18/19 Provisional 81 18 22.2% 17 94.4% 1 5.6%
Q3 18/19 Provisional 22 4 18.2% 4 100.0% 0 0.0% Q3 18/19 Provisional 100 27 27.0% 27 100.0% 0 0.0%
Q4 18/19 Provisional 22 4 18.2% 4 100.0% 0 0.0% Q4 18/19 Provisional 153 48 31.4% 44 91.7% 0 0.0%
No.
Data No. of
deaths
Integrated Adult Care
Summary of total number of deaths and total number of cases reviewed under the PRISM II Methodology
Total Number of Deaths, Deaths Reviewed and Deaths Deemed Avoidable (does not include patients with identified learning disabilities or death within the ED Department)
Month of
deathData
Total No. of
deaths
Deaths meeting
inclusion criteria
Deaths reviewed
meeting inclusion
criteria
Total Number of
Deaths reviewed
Deaths judged as
avoidable (>50%
likelihood of
avoidability
Deaths judged as
definitely not
avoidable or slight
evidence of
avoidability
Deaths reviewed
where care during
last admission was
graded as excellent,
very good or good
Deaths reviewed
where care during
last admission was
graded as poor or
very poor
Number of deaths
reviewed
Deaths reviewed
where care was
graded as excellent
or good
Elderly Care Death Reviews
Deaths reviewed
where care was
graded as poor or
very poor
Stroke Death Reviews
Deaths reviewed
where care was
graded as poor or
very poorMonth of
Death
Month of
DeathData
No. of
deaths
Number of deaths
reviewed
Deaths reviewed
where care was
graded as excellent
or good
0% 0% 0% 0% 0% 0% 0% 0% 0% 0% 0% 0%
0%
10%
20%
30%
40%
50%
60%
70%
80%
90%
100%
Apr-18 May-18 Jun-18 Jul-18 Aug-18 Sep-18 Oct-18 Nov-18 Dec-18 Jan-19 Feb-19 Mar-19
Mortality over time, total deaths reviewed and deaths considered to have been potentially avoidable
(Note: Changes in recording or review practice may make comparison over time invalid)
Deaths reviewed meeting inclusion criteria
Deaths judged as avoidable (>50% likelihood of avoidability
Deaths judged as definitely not avoidable or slight evidence of avoidability
Deaths reviewed where care during last admission was graded as excellent, very good or good
Deaths reviewed where care during last admission was graded as poor or very poor
31. I
tem
11a
(i) T
rust
lear
ning
-fro
m-d
eath
s-
Page 271.4 of 284
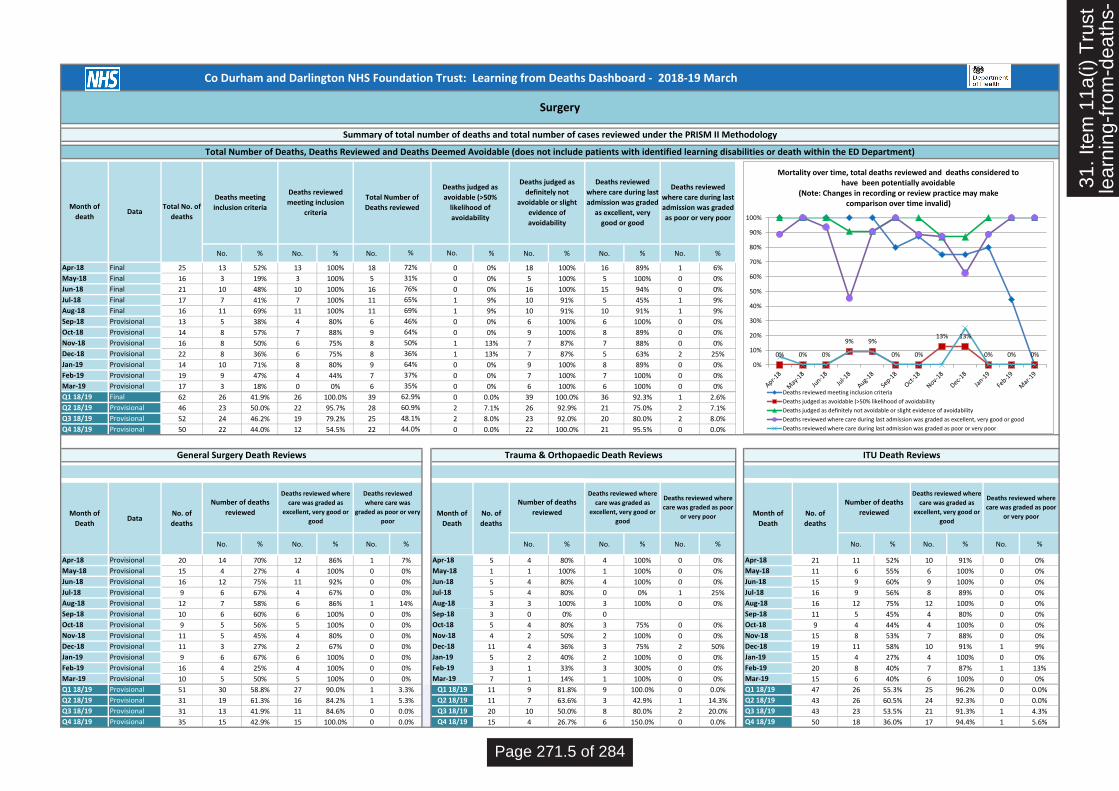
Co Durham and Darlington NHS Foundation Trust: Learning from Deaths Dashboard - 2018-19 March
No. % No. % No. % No. % No. % No. %
Apr-18 Final 25 13 52% 13 100% 18 0 0% 18 100% 16 89% 1 6%
May-18 Final 16 3 19% 3 100% 5 0 0% 5 100% 5 100% 0 0%
Jun-18 Final 21 10 48% 10 100% 16 0 0% 16 100% 15 94% 0 0%
Jul-18 Final 17 7 41% 7 100% 11 1 9% 10 91% 5 45% 1 9%
Aug-18 Final 16 11 69% 11 100% 11 1 9% 10 91% 10 91% 1 9%
Sep-18 Provisional 13 5 38% 4 80% 6 0 0% 6 100% 6 100% 0 0%
Oct-18 Provisional 14 8 57% 7 88% 9 0 0% 9 100% 8 89% 0 0%
Nov-18 Provisional 16 8 50% 6 75% 8 1 13% 7 87% 7 88% 0 0%
Dec-18 Provisional 22 8 36% 6 75% 8 1 13% 7 87% 5 63% 2 25%
Jan-19 Provisional 14 10 71% 8 80% 9 0 0% 9 100% 8 89% 0 0%
Feb-19 Provisional 19 9 47% 4 44% 7 0 0% 7 100% 7 100% 0 0%
Mar-19 Provisional 17 3 18% 0 0% 6 0 0% 6 100% 6 100% 0 0%
Q1 18/19 Final 62 26 41.9% 26 100.0% 39 0 0.0% 39 100.0% 36 92.3% 1 2.6%
Q2 18/19 Provisional 46 23 50.0% 22 95.7% 28 2 7.1% 26 92.9% 21 75.0% 2 7.1%
Q3 18/19 Provisional 52 24 46.2% 19 79.2% 25 2 8.0% 23 92.0% 20 80.0% 2 8.0%
Q4 18/19 Provisional 50 22 44.0% 12 54.5% 22 0 0.0% 22 100.0% 21 95.5% 0 0.0%
No. % No. % No. % No. % No. % No. % No. % No. % No. %
Apr-18 Provisional 20 14 70% 12 86% 1 7% 5 4 80% 4 100% 0 0% Apr-18 21 11 52% 10 91% 0 0%
May-18 Provisional 15 4 27% 4 100% 0 0% 1 1 100% 1 100% 0 0% May-18 11 6 55% 6 100% 0 0%
Jun-18 Provisional 16 12 75% 11 92% 0 0% 5 4 80% 4 100% 0 0% Jun-18 15 9 60% 9 100% 0 0%
Jul-18 Provisional 9 6 67% 4 67% 0 0% 5 4 80% 0 0% 1 25% Jul-18 16 9 56% 8 89% 0 0%
Aug-18 Provisional 12 7 58% 6 86% 1 14% 3 3 100% 3 100% 0 0% Aug-18 16 12 75% 12 100% 0 0%
Sep-18 Provisional 10 6 60% 6 100% 0 0% 3 0 0% 0 Sep-18 11 5 45% 4 80% 0 0%
Oct-18 Provisional 9 5 56% 5 100% 0 0% 5 4 80% 3 75% 0 0% Oct-18 9 4 44% 4 100% 0 0%
Nov-18 Provisional 11 5 45% 4 80% 0 0% 4 2 50% 2 100% 0 0% Nov-18 15 8 53% 7 88% 0 0%
Dec-18 Provisional 11 3 27% 2 67% 0 0% 11 4 36% 3 75% 2 50% Dec-18 19 11 58% 10 91% 1 9%
Jan-19 Provisional 9 6 67% 6 100% 0 0% 5 2 40% 2 100% 0 0% Jan-19 15 4 27% 4 100% 0 0%
Feb-19 Provisional 16 4 25% 4 100% 0 0% 3 1 33% 3 300% 0 0% Feb-19 20 8 40% 7 87% 1 13%
Mar-19 Provisional 10 5 50% 5 100% 0 0% 7 1 14% 1 100% 0 0% Mar-19 15 6 40% 6 100% 0 0%
Q1 18/19 Provisional 51 30 58.8% 27 90.0% 1 3.3% 11 9 81.8% 9 100.0% 0 0.0% Q1 18/19 47 26 55.3% 25 96.2% 0 0.0%
Q2 18/19 Provisional 31 19 61.3% 16 84.2% 1 5.3% 11 7 63.6% 3 42.9% 1 14.3% Q2 18/19 43 26 60.5% 24 92.3% 0 0.0%
Q3 18/19 Provisional 31 13 41.9% 11 84.6% 0 0.0% 20 10 50.0% 8 80.0% 2 20.0% Q3 18/19 43 23 53.5% 21 91.3% 1 4.3%
Q4 18/19 Provisional 35 15 42.9% 15 100.0% 0 0.0% 15 4 26.7% 6 150.0% 0 0.0% Q4 18/19 50 18 36.0% 17 94.4% 1 5.6%Q4 18/19
Jan-19
Feb-19
Mar-19
Q1 18/19
Q2 18/19
Q3 18/19
Jul-18
Aug-18
Sep-18
Oct-18
Nov-18
Dec-18
Jun-18
Apr-18
May-18
Number of deaths
reviewed
Deaths reviewed where
care was graded as
excellent, very good or
good
Deaths reviewed where
care was graded as poor
or very poorMonth of
DeathData
No. of
deaths
Number of deaths
reviewed
Deaths reviewed where
care was graded as
excellent, very good or
good
Deaths reviewed
where care was
graded as poor or very
poorMonth of
Death
No. of
deaths
Number of deaths
reviewed
Deaths reviewed where
care was graded as
excellent, very good or
good
Deaths reviewed where
care was graded as poor
or very poorMonth of
Death
No. of
deaths
ITU Death Reviews
50%
36%
64%
37%
35%
62.9%
60.9%
48.1%
44.0%
General Surgery Death Reviews Trauma & Orthopaedic Death Reviews
64%
72%
31%
76%
65%
69%
46%
Surgery
Summary of total number of deaths and total number of cases reviewed under the PRISM II Methodology
Total Number of Deaths, Deaths Reviewed and Deaths Deemed Avoidable (does not include patients with identified learning disabilities or death within the ED Department)
Month of
deathData
Total No. of
deaths
Deaths meeting
inclusion criteria
Deaths reviewed
meeting inclusion
criteria
Total Number of
Deaths reviewed
Deaths judged as
avoidable (>50%
likelihood of
avoidability
Deaths judged as
definitely not
avoidable or slight
evidence of
avoidability
Deaths reviewed
where care during last
admission was graded
as excellent, very
good or good
Deaths reviewed
where care during last
admission was graded
as poor or very poor
% No.
0% 0% 0%
9% 9%
0% 0%
13% 13%
0% 0% 0%
0%
10%
20%
30%
40%
50%
60%
70%
80%
90%
100%
Mortality over time, total deaths reviewed and deaths considered to have been potentially avoidable
(Note: Changes in recording or review practice may make comparison over time invalid)
Deaths reviewed meeting inclusion criteria
Deaths judged as avoidable (>50% likelihood of avoidability
Deaths judged as definitely not avoidable or slight evidence of avoidability
Deaths reviewed where care during last admission was graded as excellent, very good or good
Deaths reviewed where care during last admission was graded as poor or very poor
31. I
tem
11a
(i) T
rust
lear
ning
-fro
m-d
eath
s-
Page 271.5 of 284

Co Durham and Darlington NHS Foundation Trust: Learning from Deaths Dashboard - 2018-19 March
No. % No. % No. % % No. % No. % No. %
Apr-18 Final 1 0 0% 0 0%
May-18 Final 2 1 50% 1 100% 1 50% 0 0% 1 100% 1 100% 0 0%
Jun-18 Final 1 0 0% 0 0%
Jul-18 Final 1 0 0% 0 0%
Aug-18 Final 0 0
Sep-18 Final 0 0
Oct-18 Final 0 0
Nov-18 Final 1 0 0% 1 100% 0 0% 1 100% 1 100% 0 0%
Dec-18 Final 0 0
Jan-19 Final 2 0 0% 1 50% 0 0% 1 100% 1 100% 0 0%
Feb-19 Final 0 0
Mar-19 Final 0 0
Q1 18/19 Final 4 1 25.0% 1 100.0% 1 25.0% 0 0.0% 1 100.0% 1 100.0% 0 0.0%
Q2 18/19 Final 1 0 0.0% 0 0 0.0% 0 0 0 0
Q3 18/19 Final 1 0 0.0% 0 1 100.0% 0 0.0% 1 100.0% 1 100.0% 0 0.0%
Q4 18/19 Final 2 0 0.0% 0 1 50.0% 0 0.0% 1 100.0% 1 100.0% 0 0.0%
Family Health
Summary of total number of deaths and total number of cases reviewed under the PRISM II Methodology
Total Number of Deaths, Deaths Reviewed and Deaths Deemed Avoidable (does not include patients with identified learning disabilities or death within the ED Department)
Month of
deathData
Total No. of
deaths
Deaths meeting
inclusion criteria
Deaths reviewed
meeting inclusion
criteria
Total Number of
Deaths reviewed
Deaths judged as
avoidable (>50%
likelihood of
avoidability
Deaths judged as
definitely not
avoidable or slight
evidence of
avoidability
Deaths reviewed
where care during
last admission was
graded as excellent,
very good or good
Deaths reviewed
where care during
last admission was
graded as poor or
very poor
No.
0% 0% 0% 0% 0% 0% 0% 0% 0% 0% 0% 0%
0%
10%
20%
30%
40%
50%
60%
70%
80%
90%
100%
Apr-18 May-18 Jun-18 Jul-18 Aug-18 Sep-18 Oct-18 Nov-18 Dec-18 Jan-19 Feb-19 Mar-19
Mortality over time, total deaths reviewed and deaths considered to have been potentially avoidable
(Note: Changes in recording or review practice may make comparison over time invalid)
Deaths reviewed meeting inclusion criteria
Deaths judged as avoidable (>50% likelihood of avoidability
Deaths judged as definitely not avoidable or slight evidence of avoidability
Deaths reviewed where care during last admission was graded as excellent, very good or good
Deaths reviewed where care during last admission was graded as poor or very poor
31. I
tem
11a
(i) T
rust
lear
ning
-fro
m-d
eath
s-
Page 271.6 of 284

Co Durham and Darlington NHS Foundation Trust: Learning from Deaths Dashboard - 2018-19 March
No. % No. % No. % No. % No. % No. %
Apr-18 Final 204 50 25% 50 100% 1 0% 49 98% 42 84% 3 6%
May-18 Final 158 37 23% 37 100% 0 0% 37 100% 36 97% 1 3%
Jun-18 Final 152 37 24% 37 100% 0 0% 37 100% 33 89% 0 0%
Jul-18 Final 163 33 20% 33 100% 0 0% 33 100% 25 76% 2 6%
Aug-18 Final 146 32 22% 32 100% 0 0% 32 100% 31 97% 0 0%
Sep-18 Final 135 39 29% 39 100% 0 0% 38 97% 36 92% 1 3%
Oct-18 Final 139 36 26% 36 100% 0 0% 36 100% 33 92% 0 0%
Nov-18 Provisional 169 33 20% 32 97% 0 0% 32 100% 31 97% 0 0%
Dec-18 Provisional 156 35 22% 33 94% 0 0% 33 100% 32 97% 0 0%
Jan-19 Provisional 194 53 27% 51 96% 0 0% 51 100% 46 90% 1 2%
Feb-19 Final 189 42 22% 42 100% 0 0% 42 100% 42 100% 0 0%
Mar-19 Provisional 174 48 28% 46 96% 0 0% 46 100% 40 87% 0 0%
Q1 18/19 Final 514 124 24.1% 124 100.0% 1 0.2% 123 99.2% 111 89.5% 4 3.2%
Q2 18/19 Final 444 104 23.4% 104 100.0% 0 0.0% 103 99.0% 92 88.5% 3 2.9%
Q3 18/19 Provisional 464 104 22.4% 101 97.1% 0 0.0% 101 100.0% 96 95.0% 0 0.0%
Q4 18/19 Provisional 557 143 25.7% 139 97.2% 0 0.0% 139 100.0% 128 92.1% 1 0.7%
YTD Provisional 1979 475 24.0% 468 98.5% 1 0.1% 466 99.6% 427 91.2% 8 1.7%
Deaths judged as
definitely not
avoidable or slight
evidence of
avoidability
Deaths reviewed
where care during
last admission was
graded as excellent,
very good or good
Deaths reviewed
where care during
last admission was
graded as poor or
very poor
Readmissions within 30 days Trust Deaths
Summary of total number of deaths and total number of cases reviewed under the PRISM II Methodology
Total Number of Deaths, Deaths Reviewed and Deaths Deemed Avoidable (does not include patients with identified learning disabilities or death within the ED Department)
Month of
deathData
Total Trust
deaths
Readmission deathsTotal Number of
Deaths reviewed
Deaths judged as
avoidable (>50%
likelihood of
avoidability
0% 0% 0% 0% 0% 0% 0% 0% 0% 0% 0% 0%
0%
10%
20%
30%
40%
50%
60%
70%
80%
90%
100%
Apr-18 May-18 Jun-18 Jul-18 Aug-18 Sep-18 Oct-18 Nov-18 Dec-18 Jan-19 Feb-19 Mar-19
Mortality over time, total deaths reviewed and deaths considered to have been potentially avoidable
(Note: Changes in recording or review practice may make comparison over time invalid)
Total Number of Deaths reviewed
Deaths judged as avoidable (>50% likelihood of avoidability
Deaths judged as definitely not avoidable or slight evidence of avoidability
Deaths reviewed where care during last admission was graded as excellent, very good or good
Deaths reviewed where care during last admission was graded as poor or very poor
31. I
tem
11a
(i) T
rust
lear
ning
-fro
m-d
eath
s-
Page 271.7 of 284

Co Durham and Darlington NHS Foundation Trust: Learning from Deaths Dashboard - 2018-19 March
Total deathsPriority
reviews
Priority
review
complete
Total deaths
reviewedTotal deaths
Priority
reviews
Priority
review
complete
Total deaths
reviewedTotal deaths
Priority
reviews
Priority
review
complete
Total deaths
reviewedTotal deaths
Priority
reviews
Priority
review
complete
Total deaths
reviewedTotal deaths
Priority
reviews
Priority
review
complete
Total deaths
reviewed
Apr-18 204 44 100% 40% 130 24 100% 37% 48 7 100% 33% 25 13 100% 72% 1 0 0%
May-18 158 20 100% 34% 96 12 100% 38% 44 4 100% 27% 16 3 100% 31% 2 1 100% 50%
Jun-18 152 31 100% 43% 94 13 100% 37% 36 8 100% 42% 21 10 100% 76% 1 0 0%
Jul-18 163 27 96% 36% 105 19 95% 37% 40 1 100% 23% 17 7 100% 65% 1 0 0%
Aug-18 146 33 100% 40% 98 21 100% 42% 32 1 100% 19% 16 11 100% 69% 0 0
Sep-18 135 26 96% 44% 97 18 100% 48% 25 3 100% 28% 13 5 80% 46% 0 0
Oct-18 139 22 95% 37% 98 14 100% 39% 27 0 15% 14 8 88% 64% 0 0
Nov-18 169 30 93% 36% 102 17 100% 38% 50 5 100% 24% 16 8 75% 50% 1 0 100%
Dec-18 156 25 92% 33% 97 16 100% 34% 37 1 100% 30% 22 8 75% 36% 0 0
Jan-19 194 40 93% 39% 123 28 96% 41% 55 2 100% 27% 14 10 80% 64% 2 0 50%
Feb-19 189 36 86% 36% 105 22 100% 41% 65 5 100% 28% 19 9 44% 37% 0 0
Mar-19 174 31 77% 36% 114 23 87% 37% 43 5 80% 35% 17 3 0% 35% 0 0
Q1 18/19 514 95 100.0% 39.3% 320 49 100.0% 37.2% 128 19 100.0% 33.6% 62 26 100.0% 62.9% 4 1 100.0% 25.0%
Q2 18/19 444 86 97.7% 39.9% 300 58 98.3% 42.3% 97 5 100.0% 22.7% 46 23 95.7% 60.9% 1 0 0.0%
Q3 18/19 464 77 93.5% 35.1% 297 47 100.0% 37.0% 114 6 100.0% 23.7% 52 24 79.2% 48.1% 1 0 100.0%
Q4 18/19 557 107 86.0% 37.2% 342 73 94.5% 39.8% 163 12 91.7% 29.4% 50 22 54.5% 44.0% 2 0 50.0%
YTD 1979 365 94.0% 37.8% 1259 227 97.8% 39.1% 502 42 97.6% 27.9% 210 95 83.2% 54.3% 8 1 300.0% 37.5%
Month of death
Dashboard Summary
TRUST Acute & Emergency Care Integrated Adult Care Surgery Family Health
31. I
tem
11a
(i) T
rust
lear
ning
-fro
m-d
eath
s-
Page 271.8 of 284

Learning from Deaths Dashboard
Organisation
Financial Year
Month
Co Durham and Darlington NHS Foundation Trust
2019-20
August
32. I
tem
11a
(ii).
Tru
stle
arni
ng-f
rom
-dea
ths-
Page 271.9 of 284

Co Durham and Darlington NHS Foundation Trust: Learning from Deaths Dashboard - 2019-20 August
No. % No. % No. % % No. % No. % No. %
Apr-19 Provisional 172 19 11% 14 74% 33 19% 0 0% 33 100% 26 79% 4 12%
May-19 Provisional 163 26 16% 15 58% 34 21% 0 0% 34 100% 22 65% 3 9%
Jun-19 Provisional 139 21 15% 9 43% 9 6% 1 11% 8 89% 6 67% 3 33%
Jul-19 Provisional 147 8 5% 1 13% 1 1% 0 0% 1 100% 0 0% 1 100%
Aug-19 Provisional 155 24 15% 8 33% 8 5% 0 0% 8 100% 3 38% 2 25%
Sep-19 0 0 0 0 0 0 0 0
Oct-19 0 0 0 0 0 0 0 0
Nov-19 0 0 0 0 0 0 0 0
Dec-19 0 0 0 0 0 0 0 0
Jan-20 0 0 0 0 0 0 0 0
Feb-20 0 0 0 0 0 0 0 0
Mar-20 0 0 0 0 0 0 0 0
Q1 19/20 Provisional 474 66 13.9% 38 57.6% 76 16.0% 1 1.3% 75 98.7% 54 71.1% 10 13.2%
Q2 19/20 Provisional 302 32 10.6% 9 28.1% 9 3.0% 0 0.0% 9 100.0% 3 33.3% 3 33.3%
Q3 19/20 0 0 0 0 0 0 0 0
Q4 19/20 0 0 0 0 0 0 0 0
YTD Provisional 776 98 12.6% 47 48.0% 85 11.0% 1 1.2% 84 98.8% 57 67.1% 13 15.3%
No. % No. % No. % No. % No. % No. % No. % No. %
Apr-19 Provisional 3 1 33% 1 100% 0 0% 0% 0% Apr-19 Provisional 16 6 38% 6 100% 0 0%
May-19 Provisional 0 May-19 Provisional 12 2 17% 2 100% 0 0%
Jun-19 Provisional 0 Jun-19 Provisional 13 0 0% 0 0
Jul-19 Provisional 0 Jul-19 Provisional 14 0 0% 0 0
Aug-19 Provisional 0 Aug-19 Provisional 14 0 0% 0 0
Sep-19 Sep-19 0 0 0 0
Oct-19 Oct-19 0 0 0 0
Nov-19 Nov-19 0 0 0 0
Dec-19 Dec-19 0 0 0 0
Jan-20 Jan-20 0 0 0 0
Feb-20 Feb-20 0 0 0 0
Mar-20 Mar-20 0 0 0 0
Q1 19/20 Provisional 3 1 33.3% 1 100.0% 0 0.0% 0 0.0% 0 0.0% Q1 19/20 Provisional 41 8 19.5% 8 100.0% 0 0.0%
Q2 19/20 Provisional 0 0 0 0 0 0 Q2 19/20 Provisional 28 0 0.0% 0 0
Q3 19/20 0 0 0 0 0 0 Q3 19/20 0 0 0 0
Q4 19/20 0 0 0 0 0 0 Q4 19/20 0 0 0 0
Month of
Death
Deaths reviewed
where care during
last admission was
graded as poor or
very poor
ED Death ReviewsLearning Disability Review
Deaths reviewed where
care was graded as
poor or very poor
LeDer reviews in
ProgressData
No. of
deaths
Total Number of Deaths, Deaths Reviewed and Deaths Deemed Avoidable
Month of
DeathData
No. of
deaths
Deaths reviewed
under PRISM II
methodology
Deaths judged as
definitely not
preventable
Deaths judged as
avoidable (>50%
likelihood of
avoidability)
Completed LeDer
reviews
No.
Number of deaths
reviewed
Deaths reviewed where
care was graded as
excellent or v.good
Description:
The suggested dashboard is a tool to aid the systematic recording of deaths and learning from care provided by NHS Trusts. Trusts are encouraged to use this to record relevant incidents of mortality, number of deaths reviewed and cases from which lessons can be learnt to improve care.
Summary of total number of deaths and total number of cases reviewed under the PRISM II Methodology
Total Number of Deaths, Deaths Reviewed and Deaths Deemed Avoidable (does not include patients with identified learning disabilities or death within the ED Department)
Month of
deathData
Total No. of
deaths
Deaths meeting
inclusion criteria
Deaths reviewed
meeting inclusion
criteria
Total Number of
Deaths reviewed
Deaths judged as
avoidable (>50%
likelihood of
avoidability
Deaths judged as
definitely not
avoidable or slight
evidence of
avoidability
Deaths reviewed
where care during
last admission was
graded as excellent,
very good or good
0% 0%
11%
0% 0% 0% 0% 0% 0% 0% 0% 0%
0%
10%
20%
30%
40%
50%
60%
70%
80%
90%
100%
Apr-19 May-19 Jun-19 Jul-19 Aug-19 Sep-19 Oct-19 Nov-19 Dec-19 Jan-20 Feb-20 Mar-20
Mortality over time, total deaths reviewed and deaths considered to have been potentially avoidable
(Note: Changes in recording or review practice may make comparison over time invalid)
Deaths reviewed meeting inclusion criteria
Deaths judged as avoidable (>50% likelihood of avoidability
Deaths judged as definitely not avoidable or slight evidence of avoidability
Deaths reviewed where care during last admission was graded as excellent, very good or good
Deaths reviewed where care during last admission was graded as poor or very poor
32. I
tem
11a
(ii).
Tru
stle
arni
ng-f
rom
-dea
ths-
Page 271.10 of 284

Co Durham and Darlington NHS Foundation Trust: Learning from Deaths Dashboard - 2019-20 August
No. % No. % No. % No. % No. % No. %
Apr-19 Provisional 154 13 8% 12 92% 30 19% 0 0% 30 100% 24 80% 4 13%
May-19 Provisional 148 22 15% 14 64% 33 22% 0 0% 33 100% 22 67% 3 9%
Jun-19 Provisional 123 16 13% 9 56% 9 7% 1 11% 8 89% 6 67% 3 33%
Jul-19 Provisional 132 4 3% 1 25% 1 1% 0 0% 1 100% 0 0% 1 100%
Aug-19 Provisional 137 18 13% 7 39% 7 5% 0 0% 7 100% 2 29% 2 29%
Sep-19 0 0 0 0 0 0 0 0
Oct-19 0 0 0 0 0 0 0 0
Nov-19 0 0 0 0 0 0 0 0
Dec-19 0 0 0 0 0 0 0 0
Jan-20 0 0 0 0 0 0 0 0
Feb-20 0 0 0 0 0 0 0 0
Mar-20 0 0 0 0 0 0 0 0
Q1 19/20 Provisional 425 51 12.0% 35 68.6% 72 16.9% 1 1.4% 71 98.6% 52 72.2% 10 13.9%
Q2 19/20 Provisional 269 22 8.2% 8 36.4% 8 3.0% 0 0.0% 8 100.0% 2 25.0% 3 37.5%
Q3 19/20 0 0 0 0 0 0 0 0
Q4 19/20 0 0 0 0 0 0 0 0
YTD Provisional 694 73 10.5% 43 58.9% 80 11.5% 1 1.3% 79 98.8% 54 67.5% 13 16.3%
No. % No. % No. % No. % No. % No. % No. % No. % No. %
Apr-19 Provisional 16 6 38% 6 100% 0 0% 15 3 20% 1 33% 1 33% Apr-19 15 5 33% 5 100% 0 0%
May-19 Provisional 12 2 17% 2 100% 0 0% 8 2 25% 1 50% 0 0% May-19 10 2 20% 1 50% 0 0%
Jun-19 Provisional 13 0 0% 0 0 7 2 29% 0 0% 2 100% Jun-19 17 1 6% 1 100% 0 0%
Jul-19 Provisional 14 0 0% 0 0 12 0 0% 0 0 Jul-19 11 0 0% 0 0
Aug-19 Provisional 14 0 0% 0 0 20 2 10% 1 50% 0 0% Aug-19 11 0 0% 0 0
Sep-19 0 0 0 0 0 0 0 0 Sep-19 0 0 0 0
Oct-19 0 0 0 0 0 0 0 0 Oct-19 0 0 0 0
Nov-19 0 0 0 0 0 0 0 0 Nov-19 0 0 0 0
Dec-19 0 0 0 0 0 0 0 0 Dec-19 0 0 0 0
Jan-20 0 0 0 0 0 0 0 0 Jan-20 0 0 0 0
Feb-20 0 0 0 0 0 0 0 0 Feb-20 0 0 0 0
Mar-20 0 0 0 0 0 0 0 0 Mar-20 0 0 0 0
Q1 19/20 Provisional 41 8 19.5% 8 100.0% 0 0.0% 30 7 23.3% 2 28.6% 3 42.9% Q1 19/20 42 8 19.0% 7 87.5% 0 0.0%
Q2 19/20 Provisional 28 0 0.0% 0 0 32 2 6.3% 1 50.0% 0 0.0% Q2 19/20 22 0 0.0% 0 0
Q3 19/20 0 0 0 0 0 0 0 0 Q3 19/20 0 0 0 0
Q4 19/20 0 0 0 0 0 0 0 0 Q4 19/20 0 0 0 0
Oct-19
Nov-19
Q4 19/20
Jan-20
Feb-20
Mar-20
Q1 19/20
Q2 19/20
Q3 19/20
Dec-19
Jul-19
Deaths reviewed
where care was
graded as poor or
very poor
Aug-19
Sep-19
Jun-19
Deaths reviewed
where care was
graded as poor or very
poor
Apr-19
May-19
Month of
Death
No. of
deaths
No. of
deaths
Month of
Death
Respiratory Death ReviewsED Death Reviews Cardiology Death Reviews
Month of
DeathData
No. of
deaths
Number of deaths
reviewed
Deaths reviewed
where care was
graded as excellent,
v.good or good
Number of deaths
reviewed
Deaths reviewed
where care was
graded as excellent or
good
Deaths reviewed
where care was
graded as poor or
very poor
Number of deaths
reviewed
Deaths reviewed
where care was
graded as excellent,
v.good or good
Integrated Medical Specialties
Summary of total number of deaths and total number of cases reviewed under the PRISM II Methodology
Total Number of Deaths, Deaths Reviewed and Deaths Deemed Avoidable (does not include patients with identified learning disabilities or death within the ED Department)
Month of
deathData
Total No. of
deaths
Deaths meeting
inclusion criteria
Deaths reviewed
meeting inclusion
criteria
Total Number of
Deaths reviewed
Deaths judged as
avoidable (>50%
likelihood of
avoidability
Deaths judged as
definitely not
avoidable or slight
evidence of
avoidability
Deaths reviewed
where care during last
admission was graded
as excellent, very
good or good
Deaths reviewed
where care during last
admission was graded
as poor or very poor
% No.
0% 0%
11%
0% 0% 0% 0% 0% 0% 0% 0% 0%
0%
10%
20%
30%
40%
50%
60%
70%
80%
90%
100%
Mortality over time, total deaths reviewed and deaths considered to have been potentially avoidable
(Note: Changes in recording or review practice may make comparison over time invalid)
Deaths reviewed meeting inclusion criteria
Deaths judged as avoidable (>50% likelihood of avoidability
Deaths judged as definitely not avoidable or slight evidence of avoidability
Deaths reviewed where care during last admission was graded as excellent, very good or good
Deaths reviewed where care during last admission was graded as poor or very poor
32. I
tem
11a
(ii).
Tru
stle
arni
ng-f
rom
-dea
ths-
Page 271.11 of 284

Co Durham and Darlington NHS Foundation Trust: Learning from Deaths Dashboard - 2019-20 August
No. % No. % No. % No. % No. % No. %
Apr-19 Provisional 16 5 31% 2 40% 3 0 0% 3 100% 2 67% 0 0%
May-19 Provisional 15 4 27% 1 25% 1 0 0% 1 100% 0 0% 0 0%
Jun-19 Provisional 16 5 31% 0 0% 0 0 0 0 0
Jul-19 Provisional 14 4 29% 0 0% 0 0 0 0 0
Aug-19 Provisional 16 6 38% 1 17% 1 0 0% 1 100% 1 100% 0 0%
Sep-19 0 0 0 0 0 0 0 0
Oct-19 0 0 0 0 0 0 0 0
Nov-19 0 0 0 0 0 0 0 0
Dec-19 0 0 0 0 0 0 0 0
Jan-20 0 0 0 0 0 0 0 0
Feb-20 0 0 0 0 0 0 0 0
Mar-20 0 0 0 0 0 0 0 0
Q1 19/20 Provisional 47 14 29.8% 3 21.4% 4 8.5% 0 0.0% 4 100.0% 2 50.0% 0 0.0%
Q2 19/20 Provisional 30 10 33.3% 1 10.0% 1 3.3% 0 0.0% 1 100.0% 1 100.0% 0 0.0%
Q3 19/20 0 0 0 0 0 0 0 0
Q4 19/20 0 0 0 0 0 0 0 0
YTD Provisional 77 24 31.2% 4 16.7% 5 6.5% 0 0.0% 5 100.0% 3 60.0% 0 0.0%
No. % No. % No. % No. % No. % No. % No. % No. % No. %
Apr-19 Provisional 11 1 9% 1 100% 0 0% 4 2 50% 1 50% 0 0% Apr-19 19 2 11% 2 100% 0 0%
May-19 Provisional 12 1 8% 0 0% 0 0% 1 0 0% 0 0 May-19 16 3 19% 2 67% 1 33%
Jun-19 Provisional 12 0 0% 0 0 4 0 0% 0 0 Jun-19 9 1 11% 1 100% 0 0%
Jul-19 Provisional 14 0 0% 0 0 0 0 0 0 Jul-19 14 0 0% 0 0
Aug-19 Provisional 10 1 10% 1 100% 0 0% 4 0 0% 0 0 Aug-19 16 0 0% 0 0
Sep-19 0 0 0 0 0 0 0 0 Sep-19 0 0 0 0
Oct-19 0 0 0 0 0 0 0 0 Oct-19 0 0 0 0
Nov-19 0 0 0 0 0 0 0 0 Nov-19 0 0 0 0
Dec-19 0 0 0 0 0 0 0 0 Dec-19 0 0 0 0
Jan-20 0 0 0 0 0 0 0 0 Jan-20 0 0 0 0
Feb-20 0 0 0 0 0 0 0 0 Feb-20 0 0 0 0
Mar-20 0 0 0 0 0 0 0 0 Mar-20 0 0 0 0
Q1 19/20 Provisional 35 2 5.7% 1 50.0% 0 0.0% 9 2 22.2% 1 50.0% 0 0.0% Q1 19/20 44 6 13.6% 5 83.3% 1 16.7%
Q2 19/20 Provisional 24 1 4.2% 1 100.0% 0 0.0% 4 0 0.0% 0 0 Q2 19/20 30 0 0.0% 0 0
Q3 19/20 0 0 0 0 0 0 0 0 Q3 19/20 0 0 0 0
Q4 19/20 0 0 0 0 0 0 0 0 Q4 19/20 0 0 0 0Q4 19/20
Q2 19/20
Q3 19/20
Feb-20
Mar-20
Q1 19/20
Deaths reviewed where
care was graded as poor
or very poorMonth of
Death
Deaths reviewed
where care was
graded as poor or very
poor
Number of deaths
reviewed
Deaths reviewed where
care was graded as
excellent, very good or
goodMonth of
DeathData
No. of
deaths
Number of deaths
reviewed
Deaths reviewed where
care was graded as
excellent, very good or
goodNo. of
deaths
Jan-20
Jun-19
Apr-19
May-19
Number of deaths
reviewedMonth of
Death
No. of
deaths
Deaths reviewed where
care was graded as
excellent, very good or
good
Deaths reviewed where
care was graded as poor
or very poor
Dec-19
Jul-19
Aug-19
Sep-19
Oct-19
Nov-19
ITU Death ReviewsGeneral Surgery Death Reviews Trauma & Orthopaedic Death Reviews
19%
7%
0%
0%
6%
Surgery
Summary of total number of deaths and total number of cases reviewed under the PRISM II Methodology
Total Number of Deaths, Deaths Reviewed and Deaths Deemed Avoidable (does not include patients with identified learning disabilities or death within the ED Department)
Month of
deathData
Total No. of
deaths
Deaths meeting
inclusion criteria
Deaths reviewed
meeting inclusion
criteria
Total Number of
Deaths reviewed
Deaths judged as
avoidable (>50%
likelihood of
avoidability
Deaths judged as
definitely not
avoidable or slight
evidence of
avoidability
Deaths reviewed
where care during last
admission was graded
as excellent, very
good or good
Deaths reviewed
where care during last
admission was graded
as poor or very poor
% No.
0% 0% 0% 0% 0% 0% 0% 0% 0% 0% 0% 0%
0%
10%
20%
30%
40%
50%
60%
70%
80%
90%
100%
Mortality over time, total deaths reviewed and deaths considered to have been potentially avoidable
(Note: Changes in recording or review practice may make comparison over time invalid)
Deaths reviewed meeting inclusion criteria
Deaths judged as avoidable (>50% likelihood of avoidability
Deaths judged as definitely not avoidable or slight evidence of avoidability
Deaths reviewed where care during last admission was graded as excellent, very good or good
Deaths reviewed where care during last admission was graded as poor or very poor
32. I
tem
11a
(ii).
Tru
stle
arni
ng-f
rom
-dea
ths-
Page 271.12 of 284
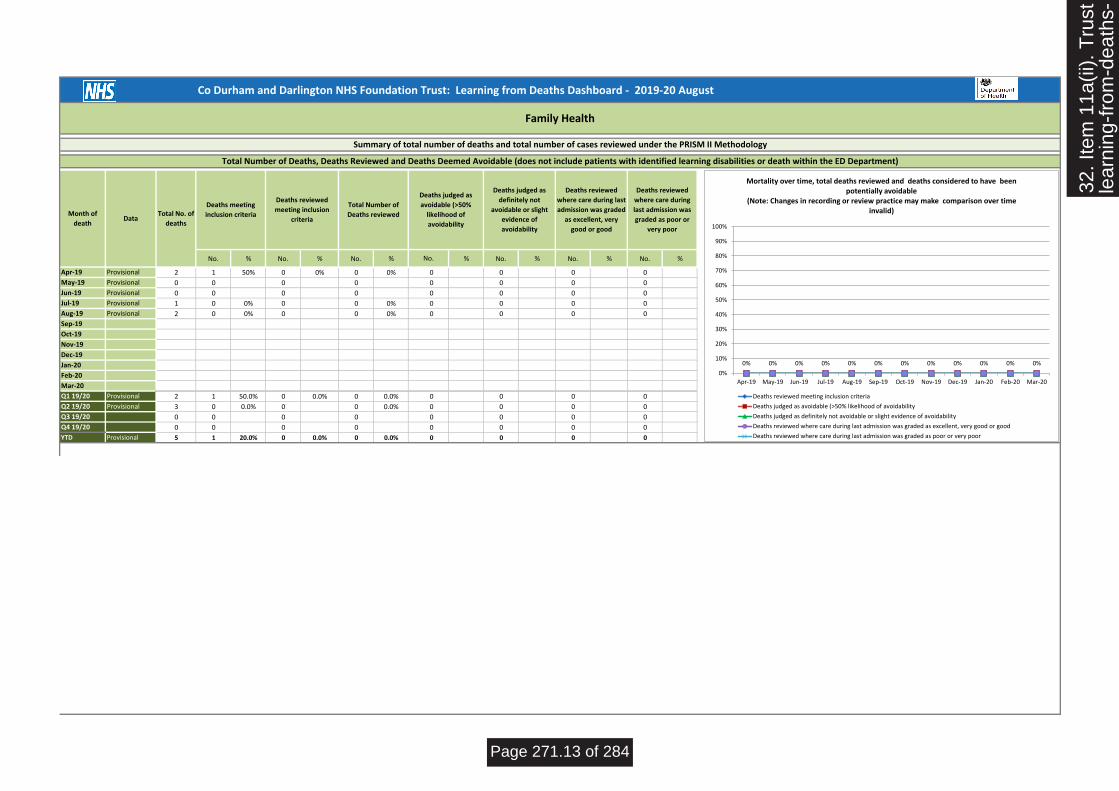
Co Durham and Darlington NHS Foundation Trust: Learning from Deaths Dashboard - 2019-20 August
No. % No. % No. % % No. % No. % No. %
Apr-19 Provisional 2 1 50% 0 0% 0 0% 0 0 0 0
May-19 Provisional 0 0 0 0 0 0 0 0
Jun-19 Provisional 0 0 0 0 0 0 0 0
Jul-19 Provisional 1 0 0% 0 0 0% 0 0 0 0
Aug-19 Provisional 2 0 0% 0 0 0% 0 0 0 0
Sep-19 0 0 0 0 0 0 0 0
Oct-19 0 0 0 0 0 0 0 0
Nov-19 0 0 0 0 0 0 0 0
Dec-19 0 0 0 0 0 0 0 0
Jan-20 0 0 0 0 0 0 0 0
Feb-20 0 0 0 0 0 0 0 0
Mar-20 0 0 0 0 0 0 0 0
Q1 19/20 Provisional 2 1 50.0% 0 0.0% 0 0.0% 0 0 0 0
Q2 19/20 Provisional 3 0 0.0% 0 0 0.0% 0 0 0 0
Q3 19/20 0 0 0 0 0 0 0 0
Q4 19/20 0 0 0 0 0 0 0 0
YTD Provisional 5 1 20.0% 0 0.0% 0 0.0% 0 0 0 0
Family Health
Summary of total number of deaths and total number of cases reviewed under the PRISM II Methodology
Total Number of Deaths, Deaths Reviewed and Deaths Deemed Avoidable (does not include patients with identified learning disabilities or death within the ED Department)
Month of
deathData
Total No. of
deaths
Deaths meeting
inclusion criteria
Deaths reviewed
meeting inclusion
criteria
Total Number of
Deaths reviewed
Deaths judged as
avoidable (>50%
likelihood of
avoidability
Deaths judged as
definitely not
avoidable or slight
evidence of
avoidability
Deaths reviewed
where care during last
admission was graded
as excellent, very
good or good
Deaths reviewed
where care during
last admission was
graded as poor or
very poor
No.
0% 0% 0% 0% 0% 0% 0% 0% 0% 0% 0% 0%
0%
10%
20%
30%
40%
50%
60%
70%
80%
90%
100%
Apr-19 May-19 Jun-19 Jul-19 Aug-19 Sep-19 Oct-19 Nov-19 Dec-19 Jan-20 Feb-20 Mar-20
Mortality over time, total deaths reviewed and deaths considered to have been potentially avoidable
(Note: Changes in recording or review practice may make comparison over time invalid)
Deaths reviewed meeting inclusion criteria
Deaths judged as avoidable (>50% likelihood of avoidability
Deaths judged as definitely not avoidable or slight evidence of avoidability
Deaths reviewed where care during last admission was graded as excellent, very good or good
Deaths reviewed where care during last admission was graded as poor or very poor
32. I
tem
11a
(ii).
Tru
stle
arni
ng-f
rom
-dea
ths-
Page 271.13 of 284

Co Durham and Darlington NHS Foundation Trust: Learning from Deaths Dashboard - 2019-20 August
Total deathsPriority
reviews
Priority review
complete
Total deaths
reviewedTotal deaths
Priority
reviews
Priority review
complete
Total deaths
reviewedTotal deaths
Priority
reviews
Priority review
complete
Total deaths
reviewedTotal deaths
Priority
reviews
Priority review
complete
Total deaths
reviewed
Apr-19 172 19 74% 19% 154 13 92% 19% 16 5 40% 19% 2 1 0% 0%
May-19 163 26 58% 21% 148 22 64% 22% 15 4 25% 7% 0 0
Jun-19 139 21 43% 6% 123 16 56% 7% 16 5 0% 0% 0 0
Jul-19 147 8 13% 1% 132 4 25% 1% 14 4 0% 0% 1 0 0%
Aug-19 155 24 33% 5% 137 18 39% 5% 16 6 17% 6% 2 0 0%
Sep-19 0 0 0 0 0 0 0 0
Oct-19 0 0 0 0 0 0 0 0
Nov-19 0 0 0 0 0 0 0 0
Dec-19 0 0 0 0 0 0 0 0
Jan-20 0 0 0 0 0 0 0 0
Feb-20 0 0 0 0 0 0 0 0
Mar-20 0 0 0 0 0 0 0 0
Q1 19/20 474 66 57.6% 16.0% 425 51 68.6% 16.9% 47 14 21.4% 8.5% 2 1 0.0% 0.0%
Q2 19/20 302 32 28.1% 3.0% 269 22 36.4% 3.0% 30 10 10.0% 3.3% 3 0 0.0%
Q3 19/20 0 0 0 0 0 0 0 0
Q4 19/20 0 0 0 0 0 0 0 0
YTD 776 98 48.0% 11.0% 694 73 58.9% 11.5% 77 24 16.7% 6.5% 5 1 0.0% 0.0%
Month of death
Dashboard Summary
TRUST Integrated Medical Specialties Surgery Family Health
32. I
tem
11a
(ii).
Tru
stle
arni
ng-f
rom
-dea
ths-
Page 271.14 of 284
2018/19 Mortality Reviews
www.cddft.nhs.net
Lisa Ward
Early Detection and Resuscitation Lead Nurse and
Mortality Lead
34. I
tem
11a
(iii)
-20
18.1
9 M
orta
lity
Page 284.1 of 284

www.cddft.nhs.net
750 Reviews Complete
721
29
Clarity
Paper Forms
34. I
tem
11a
(iii)
-20
18.1
9 M
orta
lity
Page 284.2 of 284

www.cddft.nhs.net
750 Reviews Complete
Completed Reviews37.9% (n750)
Deaths not reviewed62.1% (n1229)
34. I
tem
11a
(iii)
-20
18.1
9 M
orta
lity
Page 284.3 of 284
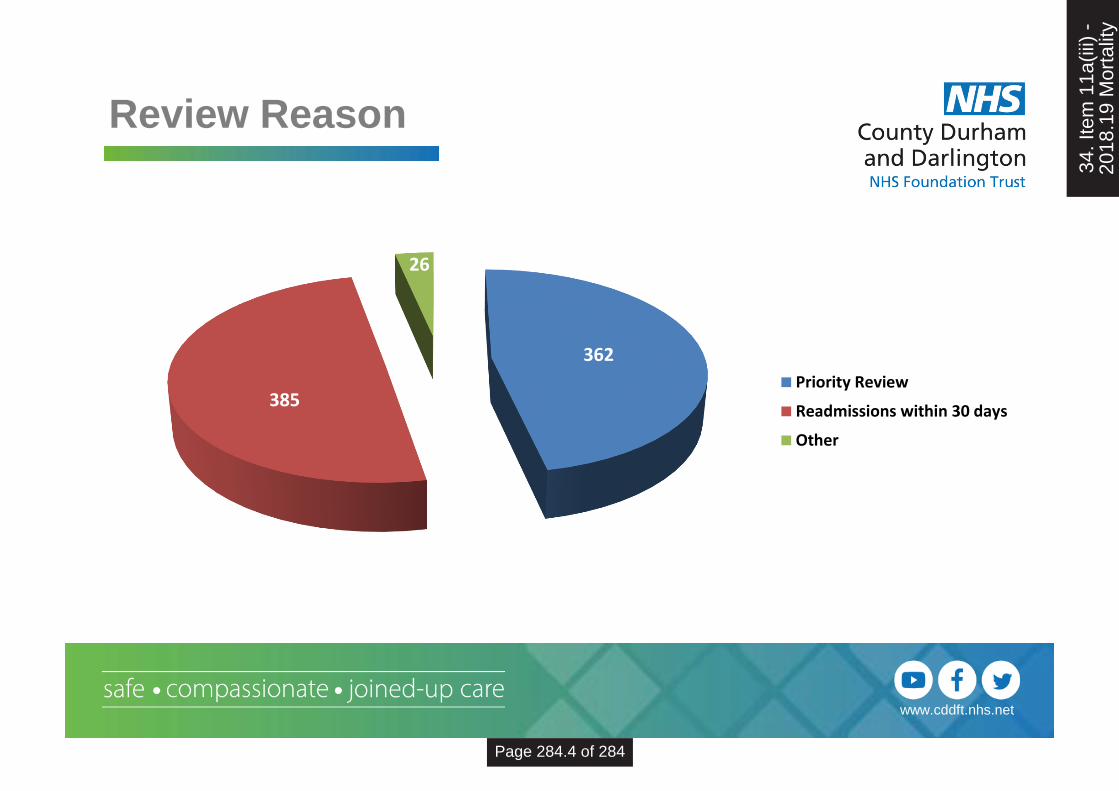
www.cddft.nhs.net
Review Reason
362
385
26
Priority Review
Readmissions within 30 days
Other
34. I
tem
11a
(iii)
-20
18.1
9 M
orta
lity
Page 284.4 of 284

www.cddft.nhs.net
0
20
40
60
80
100
120
140
160
FamilyConcern
StaffConcern
SeriousIncident
30 daysprocedurein theatre
LearningDisability
SevereMentalIllness
Aged 18 -50
CardiacArrest Call
Vlad Alerts<10% risk
Priority Reviews
34. I
tem
11a
(iii)
-20
18.1
9 M
orta
lity
Page 284.5 of 284

www.cddft.nhs.net
NCEPOD Scores
NCEPOD 1 - Good practice: A standard that you would accept from yourself, your
trainees and your institution.
NCEPOD 2 - Room for improvement: Aspects of clinical care that could have
been better.
NCEPOD 3 - Room for improvement: Aspects of organisational care that could
have been better.
NCEPOD 4 - Room for improvement: Aspects of both clinical and organisational
care that could have been better.
NCEPOD 5 - Less than satisfactory: Several aspects of clinical and/or
organisational care that were well below that you would accept from yourself, your trainees and your institution.
34. I
tem
11a
(iii)
-20
18.1
9 M
orta
lity
Page 284.6 of 284

www.cddft.nhs.net
Priority Reviews
623
59
99
554
NCEPOD 5
NCEPOD 4
NCEPOD 3
NCEPOD 2
NCEPOD 1
34. I
tem
11a
(iii)
-20
18.1
9 M
orta
lity
Page 284.7 of 284

www.cddft.nhs.net
0
50
100
150
200
250
Mortality Reviewers
34. I
tem
11a
(iii)
-20
18.1
9 M
orta
lity
Page 284.8 of 284

www.cddft.nhs.net
Central Review Team
0
10
20
30
40
50
60
70
80
34. I
tem
11a
(iii)
-20
18.1
9 M
orta
lity
Page 284.9 of 284

www.cddft.nhs.net
-2
-1
0
1
2
3
4
5
6
7
8
1-Apr 1-May 1-Jun 1-Jul 1-Aug 1-Sep 1-Oct 1-Nov 1-Dec 1-Jan 1-Feb 1-Mar 1-Apr
Mortality Reviews Quality Graded as Poor or Very PoorApril 2018 - April 2019
Poor and Very Poor Overall average incidence Lower Control Limit (LCL) Upper Control Limit (UCL)
34. I
tem
11a
(iii)
-20
18.1
9 M
orta
lity
Page 284.10 of 284

www.cddft.nhs.net
-6
-4
-2
0
2
4
6
8
10
12
1-Apr 1-May 1-Jun 1-Jul 1-Aug 1-Sep 1-Oct 1-Nov 1-Dec 1-Jan 1-Feb 1-Mar 1-Apr
NCEPOD 4 and 5April 2018 – April 2019
Poor and Very Poor Overall average incidence Lower Control Limit (LCL) Upper Control Limit (UCL)
34. I
tem
11a
(iii)
-20
18.1
9 M
orta
lity
Page 284.11 of 284

www.cddft.nhs.net
2019 / 20 Next Steps
• Medical Examiner – 100% Stage 1 Mortality Reviews
will be complete once the service fully implemented
• Peer Review Process• Second Review of 2 of each of the central review teams
members reviews to ensure similar findings.
• Sample of 5 Surgical and 5 Orthopedic cases second
reviewed by central review team
• 10 completed mortality forms per month reviewed for
quality and completeness by Mortality Leads team.
34. I
tem
11a
(iii)
-20
18.1
9 M
orta
lity
Page 284.12 of 284

www.cddft.nhs.net
….To all CDDFT Mortality
Reviewers
34. I
tem
11a
(iii)
-20
18.1
9 M
orta
lity
Page 284.13 of 284

Action Plan to facilitate understanding of rising SHMI*
*CDDFT coding, for both diagnosis and co-morbidities continues to be the lowest of its north east peers and below the national average however this is being addressed in
a separate task and finish group therefore this action plan will not be addressing that issue.
Issue Identified Action Action Owner Completion Date Progress
CDDFT SHMI is rising and is now approaching the upper control line
Prepare spreadsheet with April 2018 – March 2019 SHMI data containing all fields utilised for April 2017 – March 2018 SHMI analysis Repeat in-depth analysis of 2018/19 SHMI period examining Compare 2017/18 and 2018/19 findings from analysis Prepare report for Mortality Reduction Committee Compile data relating to 0 LOS in chemo day unit
RW
LW
LW/SK/RW
LW
RW
6th September 2019
20th September 2019
16th October 2019
21st November 2019
6th September 2019
CRAB data has confirmed CDDFT remains an outlier of AKI incidence with 285 excess deaths per annum. Harris Unit Analysis information usually precedes SHMI.
Establish an AKI Specialist Nurse Service at CDDFT
CS
Commence in post January 2020
The business case is fully completed with the exception of costings and demonstrating actual cost savings. Pt level data has been supplied to finance to enable a cost to be associated using PLICS which can then be added to the business case. Due to go to IPAAG 29th October. JC requested this to be completed and sent to ED’s prior
35. I
tem
11a
(iv)
-S
HM
I Act
ion
Pla
n
Page 271.15 of 284

CDDFT Trust wide education programme for AKI and Fluid Balance to be drafted.
- DPR for Senior Medical Staff needs to be revised with high focus on AKI and Sepsis
- Widespread education programme should continue
Fluid Balance Monitoring within Nerve Centre.
- Audit process is currently in pilot, this is a three step approach which reviews the chart documentation, quality metrics for AKI and whether those patient at risk are being monitored.
- Further education piece needed to ensure that concerns about fluid balance are being escalated, but similarly that fluid balance charts are being acknowledged by clinicians.
CS
LH/DO/LN
AIT/CAP/SPT
CS
SPT/AIT/CAP
30th September 2019
31st October 2019
On-going
31st October 2019
On-going
to IPAAG. Currently Acute Kidney Injury and Fluid Balance is covered on all resuscitation role specific training sessions. The Fluid Balance & Acute Kidney Injury Study Day runs quarterly at CDDFT but medical attendance is limited due to time off the ward. CAP provide F2 and F1 teaching twice a year on AKI & Fluid Balance. CDDFT AKI policy and Fluid Administration policies are now live on the intranet. Audit process tested and will be presented at the next care group governance meetings. Formal results will be available in the September DPR trust level report. CS to co-ordinate education plan for AIT, CAP and Special Projects.
35. I
tem
11a
(iv)
-S
HM
I Act
ion
Pla
n
Page 271.16 of 284

SHMI is higher at UHND than DMH, out of hospital SHMI is higher than in hospital. In addition to this expected deaths are falling at a much quicker rate than observed At UHND 491 patients in IMS died within 30 days of discharge, of these 290 had no palliative input. Of this 290 149 patients had a less than 10% risk of dying. 78 of these died at home or with place of death unknown. The remainder died in hospices of Nursing homes.
Compile a spreadsheet of April 2018 – March 2019 data showing how long after discharge the patient died, which had palliative input, risk of death. Develop a brief proforma to examine whether the discharge was appropriate and whether it could be expected that the patient would die within 30 days Request IMS allocate the 78 patients who did not have palliative input to consultants in the care group and died at home or unknown place, and complete the brief proforma. Allocate the cases to consultants and request proformas All proformas are returned completed Any cases where the reviewer felt they would not have been expected to die sent for full mortality review. Prepare report for MRC Sample of the deaths with palliative input to have coding examined to look for lessons we can learn
RW
LW / SK
JC
LW
Consultants
LW
LW
CL
6th September 2019
6th September 2019
20th September 2019
23rd September 2019
4th November 2019
8th November 2019
20th November 2019
20th November 2019
In Surgery SHMI observed deaths have always been below expected however they are now level and at UHND there are now more
Explore this data and speciality level and compare to 2017/18 Present this information at MRC and use
RW
RW/LW/SK
13th September 2019
20th September 2019
35. I
tem
11a
(iv)
-S
HM
I Act
ion
Pla
n
Page 271.17 of 284

observed deaths than expected. discussion to inform onward action plan
Weekend HSMR continues to rise and therefore it is possible that weekend SHMI will correspond to this.
Prepare a spreadsheet with 2018/19 weekend deaths Decide on a random sample of these deaths to do a brief review of Prepare random sample Review sample Prepare report for MRC
RW
RW/LW/SK
RW
SK / LW
LW
16th October 2019
16th October 2019
5th November 2019
6th November 2019
20th November 2019
Palliative Care coding is dropping Explore potential reasons for palliative care coding dropping and present at MRC
LW / Palliative Team
20th September 2019
35. I
tem
11a
(iv)
-S
HM
I Act
ion
Pla
n
Page 271.18 of 284

0
Trust Board – [September 2019]
Integrated Operational Board report
Open Session X Private & Confidential Session
Author Carole Langrick, Director of Operations
Reason for
Submission
Tick all that apply
If none of the above,
please provide
rationale for
submission
Standing item
Development / approval or update on strategy
Decision reserved for Board
Statutory / regulatory requirement
Oversight of significant risks
Update on action log item
Requires Board approval
Core performance information
Other rationale, please state below:
Strategic Aim:
To deliver the best patient outcomes
To deliver the best patient experience
To deliver best efficiency
To be best employer
Purpose of Report This report informs Board Members in the form of an integrated dashboard report, to triangulate operational and quality performance across key indicators for July and some August.
Positive
performance /
developments within
this report
Positive matters Page
Format and content: The report commentary focusses on those areas that are showing special cause variation and /or those that are indicating they will not achieve the expected performance trajectory, standard or specified target. There are a number of ‘spotlight’ areas that are covered in the report, which are also covered in the wider Board agenda such as Falls. During the development of the report it is anticipated there may be some elements of duplication, some of necessity to provide additional assurance and detailed reporting.
See
Contents
Constitutional Standards: the Trust continues to achieve
in Diagnostic and Cancer 62 days.
Finance: At Month 5, the Trust is ahead of financial NHSI
Plan.
Issue and actions Page
Key issues and
actions within this
report
CQC themes: The Trust continues to deliver strong
performance on several CQC dimensions including “well
led”.
See
Contents
Tick for any implications for compliance with
NHS Constitution
37. I
NT
EG
RA
TE
DO
PE
RA
TIO
NA
L B
OA
RD
Page 284.31 of 284

1
Provider Licence (especially Condition 6)
CQC Fundamental Standards of Care
Health and Social Care Act
Mental Health Act / Mental Capacity Act
Regulatory
compliance
implications
Tick all that apply
Several metrics within the CQC “Responsiveness” theme are showing
below target performance. In particular, NHSE/I is taking a close
interest in the Trust’s A&E 4-hour performance.
Significant risks
identified (if any)
The main current challenges relate to the CQC “Responsiveness”
theme.
Action / decision
required from the
Board
The Board is asked to note the report and endorse the actions being
taken.
37. I
NT
EG
RA
TE
DO
PE
RA
TIO
NA
L B
OA
RD
Page 284.32 of 284

2
Integrated Quality and Performance Report
37. I
NT
EG
RA
TE
DO
PE
RA
TIO
NA
L
Page 284.33 of 284

3
4444444444 444
EXECUTIVE SUMMARY
18 Weeks RTT. Performance remains just below the national standard of 92%, at 89.72% for August. The Trust is working towards recovery in November 2019. The volume of elective cancellations caused by non-elective pressures has reduced, but a number of temporary acute challenges relating to changes in weekly bank payments and equipment decontamination have led to further cancellations. The Care Groups are also now actively escalating the impact of the high-earner pension rules on consultants’ willingness to undertake extra work. Specialty-level recovery plans are in place and closely monitored. The Trust currently has one 52-week wait standard breach due to special circumstances. The Trust’s patient list size has also increased above trajectory, partly due to the addition of all MSK referrals.
A&E 4 hr standard. The Trust continues to fall short of the national A&E 95% target and agreed NHSI targets. Attendances were particularly high in July and August and the growth in Type 1 activity is continuing at both sites. The County Durham and Darlington System is now in escalation with NHSE/I to further review Trust and whole system recovery plans, this system escalation is a new approach outlined in the latest Single Oversight Framework.
Cancer standards. 2ww performance in July was 90.63%, below standard, and the 62-day national standard was delivered. Cancer is protected from non-elective pressures but is nevertheless subject to demand pressures.
Diagnostics standard: The Trust continues to achieve this standard although risks exist in Endoscopy and 2WW capacity.
Finance: Performance against NHSI Plan (Excluding PSF and MRET Funding) is £6,368k deficit which is £216k ahead of its planned Month 05 deficit of £6,584k.
Workforce: Recent internal changes to bank staff payment processes have led to some bank staff reducing the hours they will work for the Trust. The
situation is being reviewed urgently. Several other key staff risks are being monitored closely via monthly performance reviews including nurse
recruitment; sickness levels with stress and MSK being the two main reasons; staff appraisals.
37. I
NT
EG
RA
TE
DO
PE
RA
TIO
NA
L
Page 284.34 of 284

4
Summary: Constitutional Standards
Performance Measure ROVariation
Indicator
Target
IndicatorTarget
Target
Type
A&E % Seen Within 4 Hours (Type 1 and 3) CL Jul-19 83.42% Aug-19 81.31% 91.79% NHSI Traj
A&E Attendances (Type 1 and 3) CL Jul-19 20,053 Aug-19 18,437 17,519 NHSI Traj
A&E % Seen Within 4 Hours (Inc All UCC) CL Jul-19 86.41% Aug-19 85.11% 91.79% NHSI Traj
Last Period This Period
Performance Measure ROVariation
Indicator
Target
IndicatorTarget
Target
Type
Cancer 2WW to Treatment Within 62 Days CL Jun-19 84.50% Jul-19 85.71% 85.00% National
Last Period This Period
Performance Measure ROVariation
Indicator
Target
IndicatorTarget
Target
Type
Referral To Treatment % Within 18wks CL Jul-19 90.66% Aug-19 89.72% 92.20% NHSI Traj
Referral To Treatment Total Incompletes CL Jul-19 22,859 Aug-19 23,393 20,326 NHSI Traj
This PeriodLast Period
Performance Measure ROVariation
Indicator
Target
IndicatorTarget
Target
Type
DM01 Diagnostics % Within 6 Weeks CL Jul-19 99.77% Aug-19 99.66% 99.00% National
Last Period This Period
37. I
NT
EG
RA
TE
DO
PE
RA
TIO
NA
L
Page 284.35 of 284

5
BEST EXPERIENCE: RESPONSIVE
Performance Measure ROVariation
Indicator
Target
IndicatorTarget
Target
Type
A&E % Seen Within 4 Hours - DMH (Type 1) CL Jul-19 78.03% Aug-19 75.15% 95.00% National
A&E % Seen Within 4 Hours - UHND (Type 1) CL Jul-19 70.71% Aug-19 66.97% 95.00% National
Ambulance handovers >15-30mins CL Jul-19 845 Aug-19 728 650 NHSI Traj
Ambulance handovers >30-60mins CL Jul-19 253 Aug-19 243 158 NHSI Traj
Ambulance handovers >60mins CL Jul-19 70 Aug-19 49 23 NHSI Traj
Ambulance Handovers - no. >120 minutes CL Jul-19 10 Aug-19 2 - 0 National
A&E Type 1 - Time to treatment (median) CL Jul-19 87 Aug-19 96 60 National
12 Hour Trolley Waits CL Jul-19 0 Aug-19 0 - 0 National
Community Bed Occupancy CL Jul-19 88.74% Aug-19 80.51% 90.0% Local
Delayed Transfers of Care CL Jun-19 0.3% Jul-19 0.8% <1% Local
Long Stay Patients 7+ Days LoS CL Jul-19 308 Aug-19 302 301 Ambition
Long Stay Patients 14+ Days LoS CL Jul-19 167 Aug-19 168 159 Ambition
Long Stay Patients 21+ Days LoS CL Jul-19 102 Aug-19 106 77 Ambition
Non Elective / ED Access / Bed Management
Last Period This Period
Commentary
The 4hr A&E Standard continues to be challenging to achieve and the A&E Time to treatment (Type 1s) is increasing - showing special cause variation.
Due to challenges in both EDs, ambulance handovers delays are above planned trajectory with 2 taking over 120 minutes in August.
Focus is increasing on our long stay patients, and both are on trajectory to achieve the ambition set by NHSI. The weekly audits now being undertaken evidence that most long stay patients are in our community hospitals and the delayed transfers of care continue on a downward trend.
37. I
NT
EG
RA
TE
DO
PE
RA
TIO
NA
L
Page 284.36 of 284

6
Performance Measure ROVariation
Indicator
Target
IndicatorTarget
Target
Type
Cancelled Operations - Breaches of 28 Days CL Jul-19 0 Aug-19 0 - 0 Local
Urgent Operations cancelled for 2nd time CL Jul-19 0 Aug-19 0 - 0 Local
DNA % Rate CL Jul-19 7.66% Aug-19 7.90% 6.96% National Median
First to Follow Up Ratio CL Jul-19 1 : 1.79 Aug-19 1 : 1.82 - - -
Referral to Treatment 52 Week Breaches CL Jun-19 0 Jul-19 0 - 0 National
Referral to Treatment 18 Weeks Backlog CL Jun-19 1,996 Jul-19 2,136 - 0 National
Cancer 2WW CL Jun-19 94.80% Jul-19 90.63% 93.00% National
Cancer 2WW Breast Symptoms CL Jun-19 91.50% Jul-19 87.16% 93.00% National
Cancer 31 Days Diagnosis to Treatment CL Jun-19 100.00% Jul-19 100.00% 96.00% National
Cancer 2WW to Treatment Within 62 Days CL Jun-19 84.50% Jul-19 85.71% 85.00% National
Cancer 62 Days Consultant Upgrade CL Jun-19 100.00% Jul-19 100.00% 85.00% National
Elective, Theatres & Critical Care
Last Period This Period
Commentary
The Trust reported a final 2WW position of 90.63% for July which is reflective of the pressures being experienced in a number of Specialties including Breast due Radiology resource, Colorectal and Upper GI. The Trust continues to make use of the Independent Sector to support Breast Services.
There has also been an emerging pressure in Plastics due to the change in the way Dermatology patients are now being triaged through the Tele-derm service. Plans are in place to introduce a similar triage for all skin referrals.
DNA rates is showing common cause variation but also that they are expected to consistently fail the targeted reduction. DNA rates are being discussed in Care Group performance reviews and the Outpatient Improvement Group.
37. I
NT
EG
RA
TE
DO
PE
RA
TIO
NA
L
Page 284.37 of 284

7
RESPONSIVE: ED 4 hour performance
Spotlight Report Commentary Risk & Mitigating Actions
The Trust continues to report unadjusted ED performance (excluding urgent booked appointments). Including these improves performance for August to 85.1%, however it is still a deterioration, and is still below trajectory.
Type 1 activity continues to be greater than last year, up by 17.3% in August in DMH compared to the previous year, indicating higher levels of acuity. DMH is also impacted with an additional 40 attendances and 10 admissions per week supporting changes to the Friarage.
Escalation beds remain open to create additional capacity. These beds remain unfunded.
The Trust is working with partners on a range of improvement actions. The recovery strategy sets out those actions that are expected to impact short term including the new AMU model which went live in August in UHND and planned changes to increase capacity and medical and surgical pathways into our Ambulatory Care facilities. These deliver marginal gains in performance. On aggregation the actions set out to deliver circa 10% improvement on Type 1 activity, and it is acknowledged that not all may impact at the same time.
Work has also been undertaken to scope ‘System Wide Actions over the next 1-3 years’ that have the ability to deliver a sustainable step change in performance and achieve a further c10% improvement on Type 1s. To progress this work a System-wide Summit is planned for 15 October 2019.
37. I
NT
EG
RA
TE
DO
PE
RA
TIO
NA
L
Page 284.38 of 284

8
RESPONSIVE: 18 Weeks RTT
Spotlight Report Commentary Risk & Mitigating Actions
RTT for July was 90.7%.
Recovery continues to be challenging in most Surgical specialties and each have recovery plans.
Reliance continues to be placed on the Independent Sector at this time and is subject to regular review.
The MSK service is not yet driving the expected change to Orthopaedics and referrals have been increasing in recent weeks.
The patient list size has also increased, showing signs of special cause variation however it is known that this is due to the additional MSK activity now being included due to the change in the triage process. With adjustment the list size is still above trajectory.
52-week breach August: Due to national demands for use of a specialised kit the Trust has not been able to secure the kit until October. Poor patient experience, and no harm reported.
There are a range of actions in place across the Specialties.
New actions are described below:
Dermatology / Plastics: Plans to introduce a Tele-skin triage early October.
T&O: Plans in development to increase operating capacity at BAGH.
37. I
NT
EG
RA
TE
DO
PE
RA
TIO
NA
L
Page 284.39 of 284

9
BEST EXPERIENCE: CARING
Performance Measure ROVariation
Indicator
Target
IndicatorTarget
Target
Type
Discharge summaries within 24 hours NS Jul-19 92.44% Aug-19 92.26% 95.0% Local
Friends and Family Test - increased response
rate in InpatientsNS Jul-19 35.50% Aug-19 32.60% - National
Friends and Family Test - increased response
rate in A&ENS Jul-19 20.28% Aug-19 17.69% - National
Friends and Family Test - increased response
rate in MaternityNS Jul-19 14.51% Aug-19 5.58% - National
Friends and Family Test - increased response
rate in CommunityNS Jun-19 2.57% Jul-19 1.98% - National
% staff who would recommend the trust to
Friends & Family needing care or treatmentMS Q1 18/19 60.66% Q1 19/20 65.79% - Local
Mixed Sex Accomodation Breaches NS Jul-19 0 Aug-19 3 0 National
Last Period This Period
Admitted Care/ Friends and Family
Commentary
Overall the Trust is improving levels of compliance for sending discharge summaries within 24 hours, however there is variation amongst the care groups. The Family Health Care Group is undertaking a “deep dive” to understand where the weaknesses lie and is in dialogue with the other Care Groups to learn what they can do differently.
The mixed sex breaches are associated with ability to move patients out of Critical Care into base beds.
The Trust’s Family and Friends recommends remain above the national average, although there is disparity between the ED departments. In order to promote the use of F&F in relation to community services the Trust is promoting it as a mechanism to report patient feedback rather than other methods i.e. local surveys etc. The focus of the new F&F process going forward moves away from bare response rates to the content of responses.
improvements it can make.
Mixed sex accommodation breaches: all the breaches in August took place in Critical Care and involved patients being unable to be discharged in a timely manner due to the lack of availability of base ward beds.
37. I
NT
EG
RA
TE
DO
PE
RA
TIO
NA
L
Page 284.40 of 284

10
BEST EXPERIENCE: EFFECTIVE
Performance Measure ROVariation
Indicator
Target
IndicatorTarget
Target
Type
VTE CL Jun-19 97.60% Jul-19 96.71% 95.0% National
Sepsis Screening AE (Quarterly) NS Q4 18/19 100.0% Q1 19/20 100.0% 100.0% National
Sepsis Screening IP (Quarterly) NS Q4 18/19 100.0% Q1 18/19 100.0% 100.0% National
Dementia - eligible admissions screened NS Jun-19 99.55% Jul-19 98.00% 90.0% National
Dementia - AMTS compliance NS Jun-19 86.49% Jul-19 85.40% 90.0% National
Dementia - onward referrals NS Jun-19 100.0% Jul-19 100.0% 90.0% National
SNAPP - Sentinel Audit CL Q4 18/19 B Q1 19/20 B A National
Last Period This Period
Best Practice
Commentary
The Trust continues to perform well across the range of Effective measures with special cause variation evidencing improvement, however further work is required to review the likelihood of Dementia AMTS compliance up to 90%.
37. I
NT
EG
RA
TE
DO
PE
RA
TIO
NA
L
Page 284.41 of 284

11
BEST OUTCOMES: SAFE
Performance Measure ROVariation
Indicator
Target
IndicatorTarget
Target
Type
Clostridium difficile cases NS Jul-19 2 Aug-19 5 - 45 PA National
MRSA Bacteraemia NS Jul-19 0 Aug-19 0 - 0 National
MSSA NS Jul-19 2 Aug-19 4 - 0 National
Ecoli NS Jul-19 36 Aug-19 32 0 National
Never events NS Jun-19 1 Jul-19 0 0 National
Serious Incidents reported <2 working days NS Jul-19 5 Aug-19 8 0 Local
Total number of incidents reported (Monitoring trends) NS Jun-19 1,687 Jul-19 1,960 0 Local
Serious Incident RCAs submitted within 60 working days NS Apr-19 100.00% May-19 85.71% 0 Local
Crude Mortality (rolling 12 months) NS Mar-19 4.36% Apr-19 4.27% - National (Indirect)
HSMR (rolling 12 months) NS Mar-19 105.29 Apr-19 104.84 - National (Indirect)
SHMI (rolling 12 months) NS Feb-19 110.05 Mar-19 111.20 - National (Indirect)
Reduction in Falls - Acute (per 1000 beddays) (Cumulative) NS Jun-19 5.5 Jul-19 5.5 - Monitoring
Reduction in Falls - Community (per 1000 beddays) (Cumulative) NS Jun-19 6.0 Jul-19 5.7 - Monitoring
Grade 3 & 4 newly acquired avoidable pressure ulcers - Acute NS Jul-19 1 Aug-19 0 0 Monitoring
Grade 3 & 4 newly acquired avoidable pressure ulcers - Community NS Jul-19 0 Aug-19 0 0 Monitoring
Grade 2 newly acquired avoidable pressure ulcers - Acute NS Jul-19 0 Aug-19 1 0 Monitoring
Grade 2 newly acquired avoidable pressure ulcers - Community NS Jul-19 1 Aug-19 0 0 Monitoring
Last Period This Period
Infection Control/ Incident Reporting/ Mortality/ Harm Free Care
Commentary
There is ongoing improvement in falls reduction shown by special cause variation, however this is also showing that it is unlikely to reach the improvement target. A separate Falls report is submitted to Board.
HCAIs – Ecoli is showing common cause variation but unlikely to reach target reduction. The HCAI reduction group is looking to develop robust action plans and monitor progress in line with the NHSI Gram Negative Bloodstream Infection (GNBSI) Improvement plan to reduce GNBSI by 50% by 2023/24. CDiff - 23 cases have been reported to date. MRSA - 0 cases have been reported so far this year. The last reported case, as at 19th September 2019, was 388 days ago.
HSMR and SHMI are both showing special cause variation. Please see Spotlight report overleaf.
37. I
NT
EG
RA
TE
DO
PE
RA
TIO
NA
L
Page 284.42 of 284
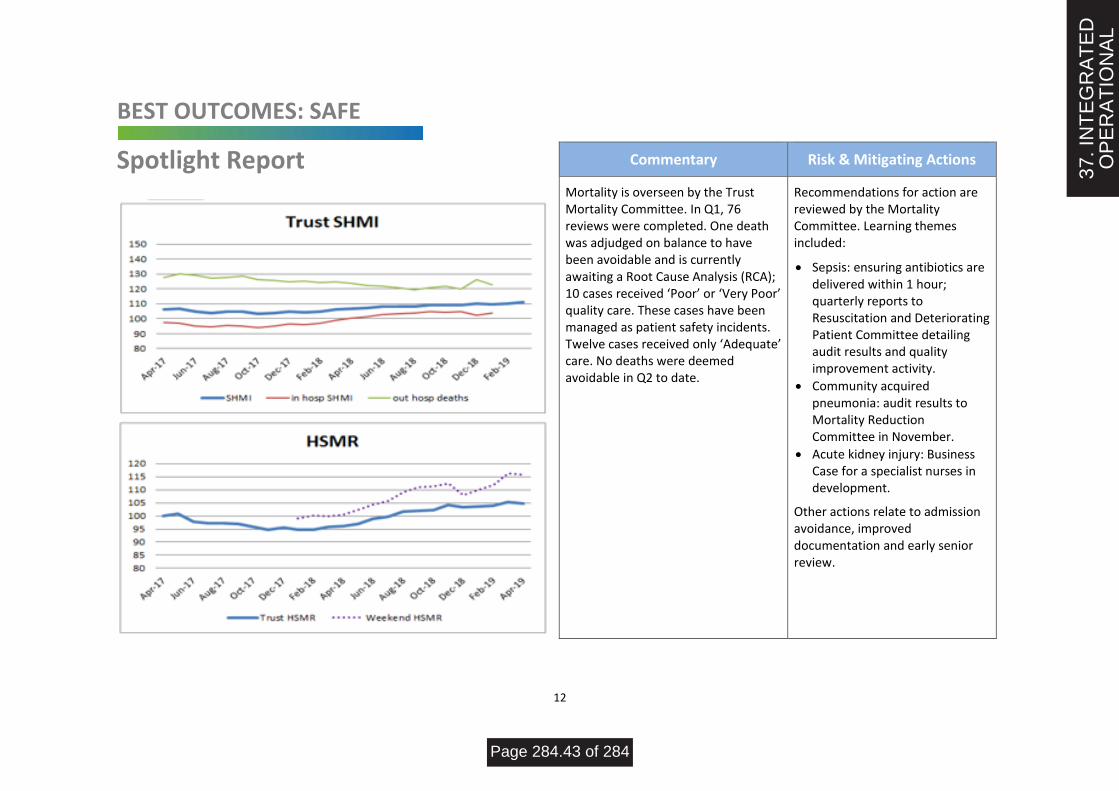
12
BEST OUTCOMES: SAFE
Spotlight Report Commentary Risk & Mitigating Actions
Mortality is overseen by the Trust Mortality Committee. In Q1, 76 reviews were completed. One death was adjudged on balance to have been avoidable and is currently awaiting a Root Cause Analysis (RCA); 10 cases received ‘Poor’ or ‘Very Poor’ quality care. These cases have been managed as patient safety incidents. Twelve cases received only ‘Adequate’ care. No deaths were deemed avoidable in Q2 to date.
Recommendations for action are reviewed by the Mortality Committee. Learning themes included:
• Sepsis: ensuring antibiotics are delivered within 1 hour; quarterly reports to Resuscitation and Deteriorating Patient Committee detailing audit results and quality improvement activity.
• Community acquired pneumonia: audit results to Mortality Reduction Committee in November.
• Acute kidney injury: Business Case for a specialist nurses in development.
Other actions relate to admission avoidance, improved documentation and early senior review.
37. I
NT
EG
RA
TE
DO
PE
RA
TIO
NA
L
Page 284.43 of 284

13
BEST OUTCOMES: SAFE STAFFING
*Please note the Non-registered nursing associates have been added this month
37. I
NT
EG
RA
TE
DO
PE
RA
TIO
NA
L
Page 284.44 of 284

14
BEST OUTCOMES: SAFE STAFFING
Commentary
Exception reporting
Workforce reports show there were 152.18 RN (wte) vacancies and 29.56 HCA (wte) vacancies, resulting in net understaffing of 5,528 hours. Demand for bank staff outstripped supply leaving gaps to be filled by overstaffing health care assistants and agency staff. 12 Nursing Associate Apprentices have been recruited for September 2019. The use of overtime doubled in the community but, as per Trust policy, 38 out of 41 in-patient areas have now stopped using overtime. 1:1 and Cohort Care are still regularly needed.
In terms of recruitment, 45 potential adult nursing graduates are going through the recruitment process along with 6 potential children’s nurses and 8 potential midwives. Applications have also been received from 32 student nurses qualifying at Teesside or Sunderland Universities in Jan-Apr 2020; job offers have been made to three existing RN applicants; 2 overseas staff joined the Trust in September.
In addition to the staffing pressures on existing permanent established wards, the Trust works hard to keep escalation beds and areas open. Beds have consistently remained open on wards but not all escalation areas are able to be resourced.
37. I
NT
EG
RA
TE
DO
PE
RA
TIO
NA
L
Page 284.45 of 284

15
BEST EMPLOYER | BEST EFFICIENCY: WELL LED
Performance Measure ROVariation
Indicator
Target
IndicatorTarget
Target
Type
Sickness MS Jun-19 4.65% Jul-19 5.09% <4% Local
Appraisals MS Jun-19 84.0% Jul-19 76.0% - - 95.0% Local
Essential Training MS Jun-19 91.00% Jul-19 90.00% - - 95.0% Local
Voluntary Turnover MS Jun-19 6.77% Jul-19 6.61% 9.0% Local
Performance against NHSI Plan excluding PSF,
FRF and MRET funding (Cumulative)DB Jul-19 £317 Aug-19 £216 N/A - National
Cost Reduction (£000s) (cumulative) DB Jul-19 £3,597 Aug-19 £4,834 N/A £2,389 National
Agency use (£000's) (cumulative) DB Jul-19 £2,750 Aug-19 £3,523 £4,457 National
Cash Balance DB Jul-19 £6,176 Aug-19 £4,994 N/A £2,300 Local
Capital Spend (£000's) (cumulative) DB Jul-19 £2,414 Aug-19 £3,683 N/A £5,237 National
Last Period This Period
Finance/ Workforce
Commentary
Sickness absence is showing a special variation cause for concern.
Sickness levels and reasons are monitored through the monthly performance reviews. Mental health/stress and spinal problems are the most significant sources of sickness in all Care Groups. Workforce and Occupational Health staff are working closely with Care Group managers to ensure HR policies are applied pro-actively and are assessing what actions can be taken to reduce the incidence of mental health and MSK – generated sickness.
Work is also underway in each Care Group to ensure all employee appraisals are entered into ESR.
37. I
NT
EG
RA
TE
DO
PE
RA
TIO
NA
L
Page 284.46 of 284

16
BEST EMPLOYER | BEST EFFICIENCY: WELL LED
▪ Performance against NHSI Plan
(Excluding PSF and MRET Funding) is £6,368k deficit which is £216k ahead of its planned Month 05 deficit of £6,584k.
▪ Cost Improvement Programme as at Month 05 has delivered £4,834k of savings which is £37k ahead of the planned level of £4,797k. In total £9,920k (41.0%) has been removed from budgets, phased over the entire 2019/20 financial year.
▪ Agency Usage - As at Month 05
agency expenditure totals £3,523k which is £3,904k below the phased NHSI capped level of £7,427k. Agency expenditure therefore remains well under the targeted level. The chart plots agency performance on a rolling basis to ensure that any material changes in performance against this target are not masked within YTD performance.
Performance against NHSI Plan excluding PSF, FRF and MRET funding Cost Reduction Performance
Agency Usage (SPC)
Additional Finance Commentary
37. I
NT
EG
RA
TE
DO
PE
RA
TIO
NA
L
Page 284.47 of 284