numerical modelling of impact fracture of cortical bone · pdf filenumerical modelling of...
TRANSCRIPT

Loughborough UniversityInstitutional Repository
Numerical modelling ofimpact fracture of corticalbone tissue using X-FEM
This item was submitted to Loughborough University's Institutional Repositoryby the/an author.
Citation: ABDEL-WAHAB, A.A. and SILBERSCHMIDT, V.V., 2011. Nu-merical modelling of impact fracture of cortical bone tissue using X-FEM. Jour-nal of Theoretical and Applied Mechanics, 49 (3), pp. 599-619
Additional Information:
• This article was published in the serial, Journal of Theoreti-cal and Applied Mechanics [ c© Polish Society of Theoretical andApplied Mechanics ]. The definitive version is available at:http://www.ptmts.org.pl/article.xsl?vol=49&no=3&page=599
Metadata Record: https://dspace.lboro.ac.uk/2134/8786
Version: Accepted for publication
Publisher: c© Polish Society of Theoretical and Applied Mechanics
Please cite the published version.
This item was submitted to Loughborough’s Institutional Repository (https://dspace.lboro.ac.uk/) by the author and is made available under the
following Creative Commons Licence conditions.
For the full text of this licence, please go to: http://creativecommons.org/licenses/by-nc-nd/2.5/
1
Numerical Modelling of Impact Fracture of Cortical Bone Tissue Using X-FEM
Adel A. Abdel-Wahaba and Vadim V. Silberschmidtb
a,b Wolfson School of Mechanical and Manufacturing Engineering, Loughborough University, Loughborough, Leicestershire, UK
a [email protected]; b [email protected]
Abstract
A cortical bone tissue is susceptible to fracture that can be caused by events, such as traumatic falls, sports injuries and traffic accidents. A proper treatment of bones and prevention of their fracture can be supported by in-depth understanding of deformation and fracture behaviour of this tissue in such dynamic events. Parameters such as damage initiation under impact, damage progression and impact strength can help to achieve this goal. In this paper, Extended Finite-Element Method (X-FEM) implemented into the commercial finite-element software Abaqus is used to simulate the actual crack initiation and growth in a cantilever beam of cortical bone exposed to quasi-static and impact loading using the Izod loading scheme. Izod tests were performed on notched bone specimens of bovine femur to measure its impact strength and to validate simulations. The simulation results show a good agreement with experimental data.
Keywords: Cortical bone; Impact; X-FEM; Finite-element; Fracture
1. Introduction
Bone is the principal structural component of a skeleton: it assists the load-bearing framework of a living body. Bone fractures have significant health, economic and social consequences. Both healthy and unhealthy bones are susceptible to fracture as a result of low- or high-energy trauma. High-energy traumas are usually linked to car or cycling accidents, while low-energy traumas often occur in contact sports. In both cases they are caused by dynamic loading. Factors such as mass, material properties and geometry of bone as well as the magnitude and orientation of applied loads affect its response to such loading. Bones are fractured when they are exposed to severe loads that, in their turn, generate stresses exceeding its ultimate strength. Thus, a fracture event occurs initially at the material level that eventually affects the load-carrying capacity of the whole bone at its structural level (Cullinane and Einhorn 2002). It is worth mentioning here that bone is a viscoelastic material. Therefore, this type of mechanical behaviour has to be considered when dealing with dynamic events, such as impact.
By developing adequate numerical models capable of predicting and describing bone’s deformation and fracture behaviour, a detailed study of reasons for, and ways to prevent bone fracture could be performed. To plan prevention therapies and treatment strategies, scientific knowledge of bone fracture mechanisms is also
2
needed. From the experimental point of view, impact resistance of the cortical bone tissue did not get enough attention in the literature though it is essential for activities such as jumping and running as well as protecting internal organs from impact as in the case of skull and ribs (Lee et al. 2010). Still, numerous previous studies have been devoted to analysis of quasi-static mechanical properties and resistance to fracture of the cortical bone tissue. For instance, Augat and Schorlemmer (2006) demonstrated the role of structural properties of cortical bone and its microstructure in its competence. Another study, by Bonney et al. (2010), was devoted to investigation of local variations in mechanical properties of cortical bone (porcine femur). Also, various experimental studies investigating the effect of structural properties of cortical bone and its mechanical properties have been conducted (Zioupos 1998; Zioupos et al. 1999; Wachter et al. 2002; Currey 2004; Kulin et al. 2010). They dealt with acquisition of the respective data at different levels of bone’s hierarchical structure – macroscopic and microscopic – using different methodological approaches. From a fracture mechanics perspective, a review of the structure and properties of bone focusing on mechanical and deformation behaviour at different length scales was introduced by Launey et al. (2010). In another study, Nalla et al. (2005) analysed the nature of local cracking events that preceded catastrophic fracture of human cortical bone and their relation to the microstructure. Zioupos and Currey (2008) studied a relation between the strain rate and the microcracking damage in the fracture process of human cortical bone in tensile failure. According to dynamic properties of this tissue, only few studies paid attention to that issue. For instance, both dynamic and static material properties of a human femur were investigated using, respectively, a split Hopkinson bar technique and tests with a universal testing machine (Katsamanis and Raftopoulos 1990). The average dynamic Young’s modulus of 19.9 GPa was found to be 23% greater than that for static loading - 16.2 GPa. In terms of bone impact characteristics only preliminary data are available (Panagiotopoulos et al. 2005), with a Charpy impact test used to measure the energy absorbed by strips cut from proximal femur. In a related experimental work, employing an Izod impact tester, Kovan (2008) investigated the absorbed energy and the impact strength of a mandible at different positions. In our previous work, the impact properties of a cortical bone tissue were investigated using Izod tests for different cortex position of a bovine femur (Abdel-Wahab et al. 2010). The obtained experimental results emphasized that bovine femur cortical bone had a nearly uniform fracture energy character with regard to cortex position. In addition, a 2D finite-element model to simulate the test and capture its behaviour up to fracture was developed. In that model, the behaviours of three different constitutive material models – linear-elastic, elastic-plastic and viscoelastic – based on our previous experiments (Abdel-Wahab et al. 2011) were compared. It was found that the viscoelastic model showed a good agreement with the experimental data.
In other experiments, Lee et al. (2010) tested non-mineralized and mineralized materials, such as cortical bone utilizing a drop-weight test to investigate the impact
3
strength along with the impact damage. In a similar study, longitudinal human cortical specimens were tested in a tensile impact tester at a strain rate of 133 s-1 (Saha and Hayes 1976). A marked non-linearity was observed in the stress-strain behaviour, including plastic deformation and strain-hardening effects. The mean tensile impact strength and impact energy were 126.3±33.1 MPa and 18790±7355 J/m2, respectively.
Often, in-vivo bone fracture is initiated and promoted by cracks; therefore, fracture mechanics is used as an important tool to assess its strength and fracture toughness and to improve the diagnoses and treatment of bone fractures (Wang and Puram 2004). Up to now, Linear-Elastic Fracture Mechanics (LEFM) was mostly used to assess the toughness of cortical bone tissue; it yields a single-valued fracture parameter – the critical stress intensity factor or the critical strain energy release rate (Norman 1995&1996). Due to complex composition and microstructure of the cortical bone tissue, it has several toughening mechanisms, such as diffuse microcracking, crack deflection, and fibre bridging (Zioupos 1998; Vashishth et al. 2000; Yeni and Norman 2000; Nalla et al. 2004). The inadequacy of LEFM theory application to describe cortical bone tissue fracture was raised due to observed resistance curve (R-curve) behaviour (Lucksanasombool et al. 2001; Ural and Vashishth 2006). Therefore, cohesive zone models were used to analyse the initiation and propagation of cortical bone cracks (Ural and Vashishth 2006; Yang et al. 2006; Cox and Yang 2007). In a recent study, Morais et al. (2010) demonstrated the adequacy of a Double-Cantilever Beam (DCB) test for determining fracture toughness under pure mode-I loading of cortical bone by implementing a new data-reduction scheme based on specimen compliance.
Despite this body of research, experimental and numerical studies of the dynamic behaviour of a cortical bone tissue attracted less attention. Therefore, this study comprises two parts covering experimental and numerical aspects of such analysis. Still, analysis of the actual crack initiation and growth was hard to achieve using the mentioned approaches in simulations. With the new Extended Finite-Element Method (X-FEM), crack initiation and propagation can be modelled more easily. Thus, the aim of this study is to develop and validate a numerical model for analysis of fracture behaviour of the cortical bone tissue under impact and quasi-static loading using X-FEM.
2. Materials and Methods 2.1 Specimen Preparation
Longitudinal specimens for Izod tests were cut from fresh bovine femora bones (aged 1.5-2 years) along their osteons, see Fig. 1a. Sixteen specimens were used to assess reproducibility of experimental results. All the specimens had the same dimensions: 50 mm × 8 mm × 4 mm (length × width × thickness), see Fig. 1b. A 300 µm-deep notch was created perpendicular to the bone axis and along the radial axis

4
using a razor. Specimens were stored at room temperature in a 0.9% saline solution until tested.
(a) (b)
Figure 1: (a) Cortical bone with axes and direction of specimen cutting. (b) Izod test specimen
2.2 Izod Test
An amount of energy absorbed during a suddenly applied force can be quantified with impact tests of materials; the required data about deformation and failure of materials during high-strain-rate loading cannot be determined using quasi-static fracture tests. Impact testing is usually performed with Charpy or Izod test machines. An Izod test system incorporates a swinging pendulum (hammer) that impacts a notched specimen fixed in a cantilever-beam position with the notch facing the hammer (Lee et al. 2010). In our study, impact tests were carried out using a CEAST Resil Impactor. In the tests, the bottom half of the specimen was fixed firmly in the machine vice and a knife-edge wedge was used to define the notch position. The upper half of the specimen was struck by a pendulum hammer with a controlled level of energy. The distance between the notch and the position of hammer strike was standard - 22 mm. In this study, a calibrated hammer with a mass of 0.6746 kg and 0.3268 m long was used. The maximum nominal hammer energy of 2 J corresponds to the striking position of 150° resulting in an impact velocity of 3.46 m/s. The level of initial energy can be varied by changing the initial angle of the hammer. The energy level used in this study was 0.5 J that corresponded to the initial angle of 58°. A piezoelectric force transducer was fixed rigidly to the hammer to capture the impact-force signal. When the pendulum is released from the pre-defined angle, its impact with the specimen generates a change in electrical resistance of the piezoelectric
5
sensor that is captured by the data acquisition system - DAS 8000 - connected to the impactor.
2.3 Numerical Model 2.3.1 Extended Finite Element Method
X-FEM is a numerical method that enables analysis of crack propagation without remeshing a cracked specimen in accordance to newly created crack faces. It employs a local enrichment of the approximation areas. The method can be useful for evolving processes with non-smooth characteristics in small parts of a computational domain, e.g. near discontinuity or singularity regions, as in the case of cracks for which standard finite element method is not accurate. The X-FEM was first introduced by Belytschko and Black (1999). Enrichment is realized based on a partition-of-unity concept developed by Melenk and Babuska (1996); it allows incorporation of local enrichment functions into a finite-element approximation domain. Spatial enrichment functions with additional degrees of freedom ensure account for discontinuities. The general framework of this method is incorporated in the finite- element software Abaqus 6.10 (2010).
2.3.2 Geometry, Mesh, and Boundary Conditions
In this study, three finite-element models (FEM) were developed: Model A, Model B, and Model C. Model A is a 2D X-FEM model used to simulate the fracture of cortical bone exposed to impact loading in the Izod test, see Fig. 2. Model B is a 3D formulation of Model A, whereas Model C is a 3D X-FEM model for quasi-static fracture analysis. The impact tests were simulated with the finite-element software Abaqus 6.10/Implicit using Models A and B to verify the applicability of the X-FEM to analysis of the failure behaviour of the cortical bone tissue under impact-loading conditions. In addition, Model C was developed to elucidate fracture development in the cortical bone tissue under different loading conditions. A full description of the Model A can be found in our previous work (Abdel-Wahab et al. 2010); however, in that work only the behaviour up to failure was studied. Figure 2 shows its geometry and mesh formulation.
In Model B, the real geometry and masses of the hammer and specimen with a 300 μm notch were used (see Fig. 3). In Abaqus 6.10, a kinematic coupling constraint is used to transmit rotation to a structure while permitting radial motion. Hence, this feature was employed to constraint the hammer from radial or translational movements except around one axis only; it is z-axis in our case. To get the exact movement of the hammer as it happens in reality, all the nodes of the surface of the inner cylinder of the upper block of the hammer was kinematically coupled to a reference point at the middle of that cylinder, then the reference point was restrained to translate along x, y, and z and to rotate around x or y axes. The reference point was only free to rotate around z-axis. Two sets were defined: the reference point

6
(set1) and the inner surface (set2). The following equation was used to define the coupling between those sets:
ur1 - ur2 = 0, (1)
where ur1 and ur2 are the rotational degrees of freedom for set1 and set2, respectively.
(a) (b) (c)
Figure 2: (a) Real hammer. (b) Model A. (c) Hammer-specimen interaction and mesh around the notch
7
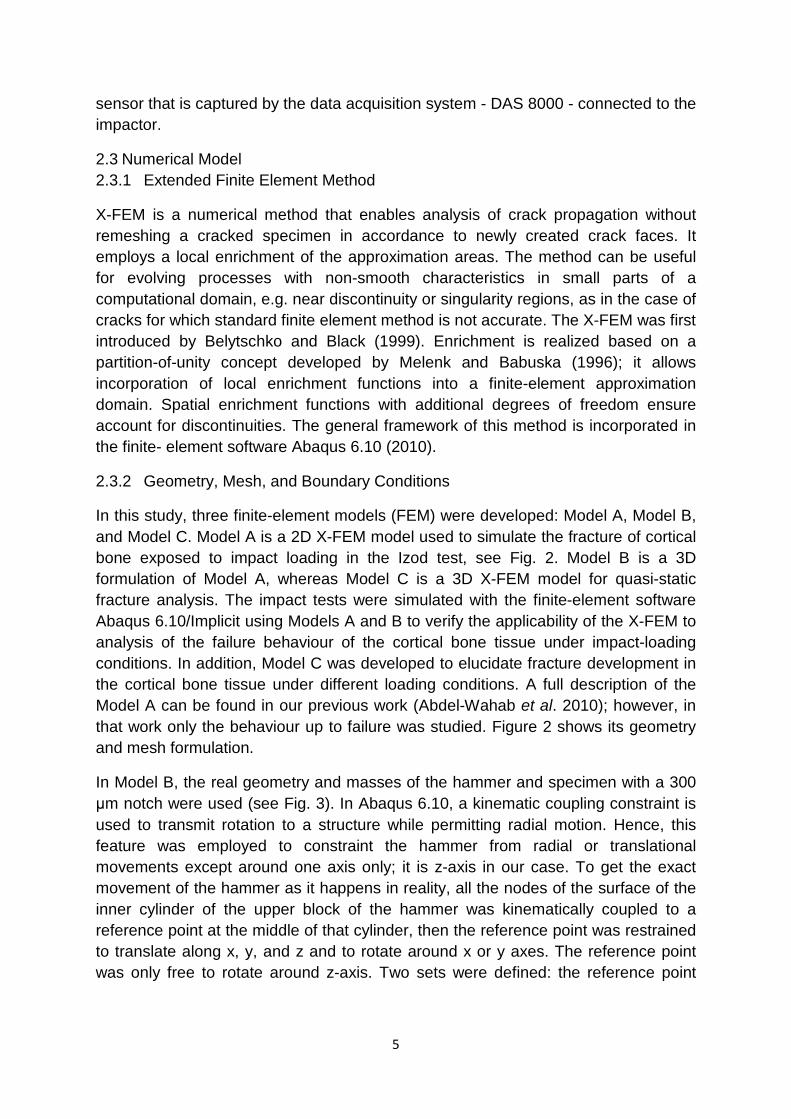
Figure 3: (a) Setup of Izod test. (b) Model B. (c) Hammer-specimen interaction. (d) Meshing of hammer and specimen (specimen is increased)
On the other hand, two surfaces were chosen to define a surface-to-surface contact between the specimen and the hammer. These surfaces are shown as S1 and S2 in Fig. 3d. The master surface was chosen to be S2 with S1 chosen to be the slave one. The mesh of the master surface was adjusted to be finer than that of the slave surface. A finite sliding with frictionless tangential behaviour formulation was chosen between the two surfaces. To reduce the computation time, the hammer was assembled very close to the specimen as an initial position in simulations. An angular velocity of 5.33 rad/s - around x-axis - corresponding to the initial angle of 58° (initial energy of 0.5 J) was applied to the hammer. The specimen’s support was modelled as rigid; all the degrees of freedom of the specimen’s bottom part were constrained (see Figs. 3b). Linear tetrahedron (C3D4) elements were used for both
8
specimen and hammer; it is currently the only element type that can be used for 3D X-FEM analysis. A total number of 53113 elements and 10967 nodes for the bone specimen and 23695 elements and 6871 nodes for the hammer were used. The force due to contact pressure between the piezoelectric force sensor and counterpart of the specimen was recorded in the history output of the finite-element software Abaqus/Implicit. Also, the status of the X-FEM that shows the crack path was used as an output along with the distributions of stress and strain components and their principal values.
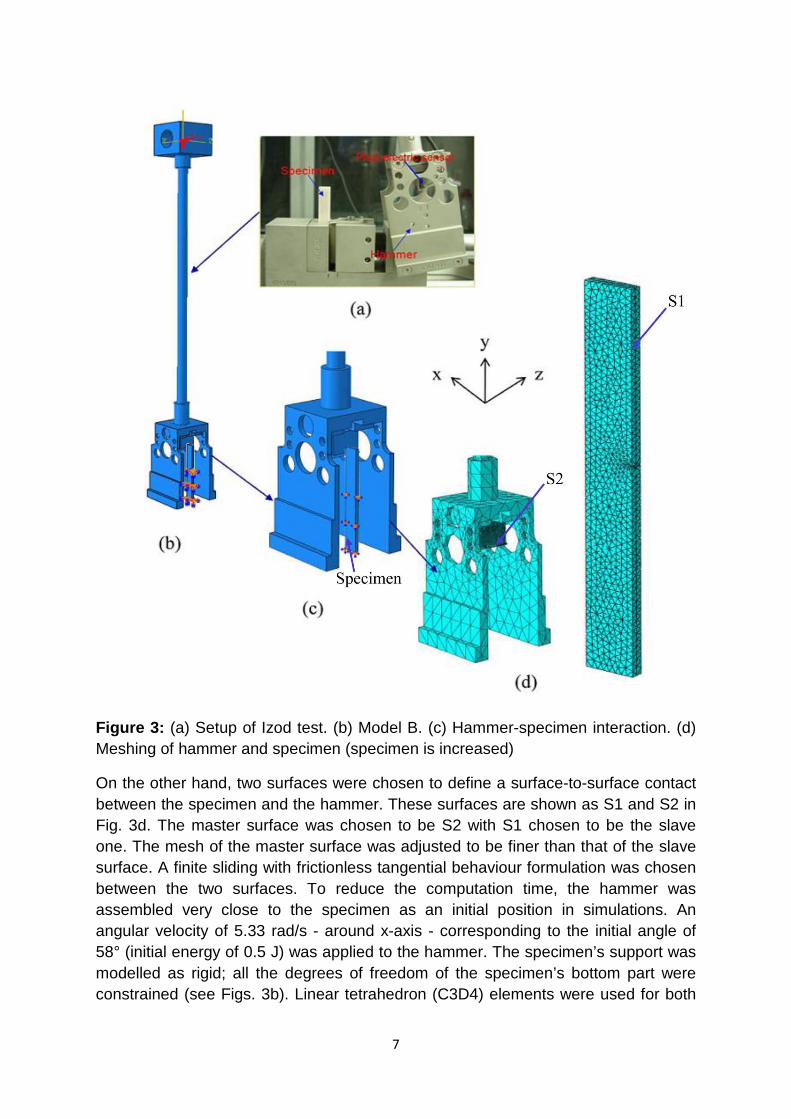
In order to compare the fracture behaviour of the cortical bone specimen under quasi-static and impact loading, Model C was developed, Fig. 4. It consists of a cantilever-beam specimen of cortical bone with the same geometry, mesh and material properties as Model B. In Model C, the hammer was excluded from the analysis and instead a displacement-controlled load of 2 mm was applied at the same position of the hammer-specimen interaction, see Fig. 4b.
Figure 4: (a) Meshed 3D quasi-static specimen. (b) Applied displacement and boundary conditions of 3D quasi-static model.
2.3.3 Material Properties
Elastic material properties for the hammer and cortical bone tissue used in the
9
numerical simulations are given in Table 1. The viscous behaviour of bones was introduced into models A and B in terms of the Prony series expansion based on the normalized creep compliance. These material’s constants are the normalized shear modulus, g = 0.13256 ± 0.01, and relaxation time, τ = 119.57 ± 0.5. These relaxation parameters were defined based on our experimental creep data and using the evaluation technique for viscoelastic materials implemented in Abaqus 6.10, as discussed elsewhere (Abdel-Wahab et al. 2011). This technique converts the creep data into relaxation data by means of convolution integrals; then it uses the normalized shear modulus data to determine the Prony series parameters (Abaqus 6.10).
Only linear-elastic material model was used for Model C for quasi-static loading. All material properties for cortical bone were obtained in our previous experiments (Abdel-Wahab et al. 2011).
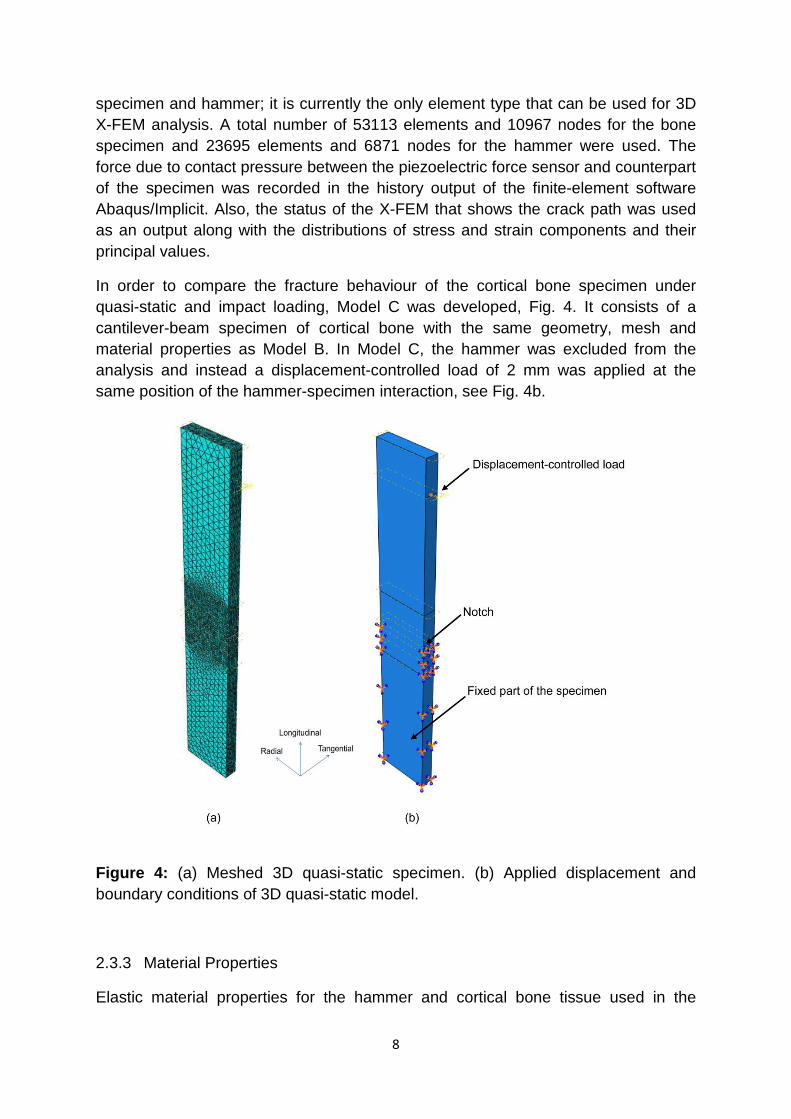
Table 1: Material properties for finite-element models
Part Material Elastic modulus (GPa)
Poisson’s ratio
Density (kg/m3)
Hammer Carbon steel 210 0.3 7850 Specimen Bone 23.15 ± 0.72 0.44 ± 0.009 1860 ± 0.9
In this study, the X-FEM-based cohesive segments method was used to simulate crack initiation and propagation along an arbitrary, solution-dependent path in the balk material, since the crack path is independent from the boundaries of the elements in the mesh (Abaqus 6.10, 2010). In the model, the enrichment area was chosen as the bone specimen; the crack was introduced as a plane with dimensions of 300 𝜇m × 4 mm to reproduce the notch depth and the specimen thickness of real experiments, respectively. Damage modelling allows simulation of crack initiation and eventual failure of an enriched area in the solution domain. The initial response is linear, while the failure mechanism consists of a damage initiation criterion and a damage propagation law. Damage initiation was defined based on the maximum principal strain of 0.25% (Pattin et al. 1996; Bayraktae et al. 2004). When damage initiation criterion is met, damage propagation law starts to take place. In this study, damage evolution is defined in terms of fracture energy (per unit area) and linear softening was chosen. The mixed-mode behaviour was chosen and the fracture energies for those modes were introduced into X-FEM. The fracture toughness values were 1374 N/m, 4710 N/m and 4016 N/m for Mode I, Mode II and Mode III, respectively (Feng et al. 2000). The following model assumptions were made: (1) homogeneous and isotropic material properties for both the specimen and the hammer; (2) frictionless contact between them.
10
3. Results and Discussion
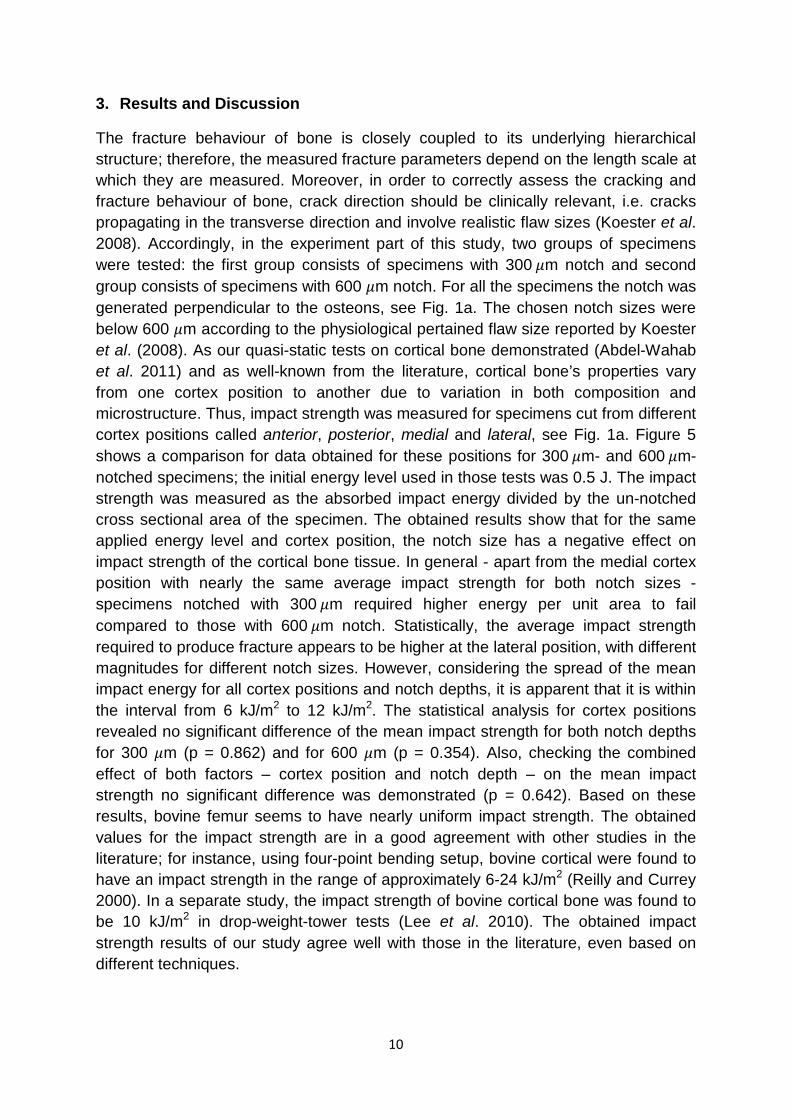
The fracture behaviour of bone is closely coupled to its underlying hierarchical structure; therefore, the measured fracture parameters depend on the length scale at which they are measured. Moreover, in order to correctly assess the cracking and fracture behaviour of bone, crack direction should be clinically relevant, i.e. cracks propagating in the transverse direction and involve realistic flaw sizes (Koester et al. 2008). Accordingly, in the experiment part of this study, two groups of specimens were tested: the first group consists of specimens with 300 𝜇m notch and second group consists of specimens with 600 𝜇m notch. For all the specimens the notch was generated perpendicular to the osteons, see Fig. 1a. The chosen notch sizes were below 600 𝜇m according to the physiological pertained flaw size reported by Koester et al. (2008). As our quasi-static tests on cortical bone demonstrated (Abdel-Wahab et al. 2011) and as well-known from the literature, cortical bone’s properties vary from one cortex position to another due to variation in both composition and microstructure. Thus, impact strength was measured for specimens cut from different cortex positions called anterior, posterior, medial and lateral, see Fig. 1a. Figure 5 shows a comparison for data obtained for these positions for 300 𝜇m- and 600 𝜇m-notched specimens; the initial energy level used in those tests was 0.5 J. The impact strength was measured as the absorbed impact energy divided by the un-notched cross sectional area of the specimen. The obtained results show that for the same applied energy level and cortex position, the notch size has a negative effect on impact strength of the cortical bone tissue. In general - apart from the medial cortex position with nearly the same average impact strength for both notch sizes - specimens notched with 300 𝜇m required higher energy per unit area to fail compared to those with 600 𝜇m notch. Statistically, the average impact strength required to produce fracture appears to be higher at the lateral position, with different magnitudes for different notch sizes. However, considering the spread of the mean impact energy for all cortex positions and notch depths, it is apparent that it is within the interval from 6 kJ/m2 to 12 kJ/m2. The statistical analysis for cortex positions revealed no significant difference of the mean impact strength for both notch depths for 300 𝜇m (p = 0.862) and for 600 𝜇m (p = 0.354). Also, checking the combined effect of both factors – cortex position and notch depth – on the mean impact strength no significant difference was demonstrated (p = 0.642). Based on these results, bovine femur seems to have nearly uniform impact strength. The obtained values for the impact strength are in a good agreement with other studies in the literature; for instance, using four-point bending setup, bovine cortical were found to have an impact strength in the range of approximately 6-24 kJ/m2 (Reilly and Currey 2000). In a separate study, the impact strength of bovine cortical bone was found to be 10 kJ/m2 in drop-weight-tower tests (Lee et al. 2010). The obtained impact strength results of our study agree well with those in the literature, even based on different techniques.
11
Figure 5: Impact strength of longitudinal cortical bone specimens for different cortex positions and two different notch sizes
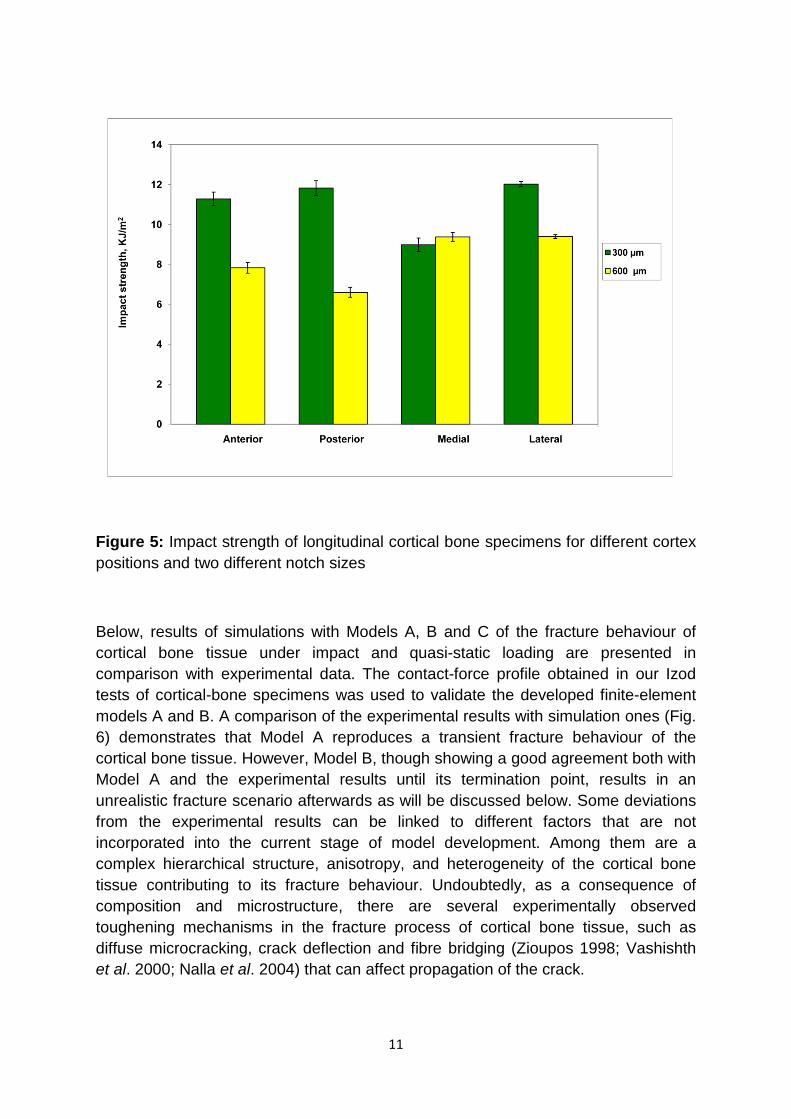
Below, results of simulations with Models A, B and C of the fracture behaviour of cortical bone tissue under impact and quasi-static loading are presented in comparison with experimental data. The contact-force profile obtained in our Izod tests of cortical-bone specimens was used to validate the developed finite-element models A and B. A comparison of the experimental results with simulation ones (Fig. 6) demonstrates that Model A reproduces a transient fracture behaviour of the cortical bone tissue. However, Model B, though showing a good agreement both with Model A and the experimental results until its termination point, results in an unrealistic fracture scenario afterwards as will be discussed below. Some deviations from the experimental results can be linked to different factors that are not incorporated into the current stage of model development. Among them are a complex hierarchical structure, anisotropy, and heterogeneity of the cortical bone tissue contributing to its fracture behaviour. Undoubtedly, as a consequence of composition and microstructure, there are several experimentally observed toughening mechanisms in the fracture process of cortical bone tissue, such as diffuse microcracking, crack deflection and fibre bridging (Zioupos 1998; Vashishth et al. 2000; Nalla et al. 2004) that can affect propagation of the crack.
12
Figure 6: Comparison of evolution of contact force in impact loading (notch size 300 𝜇m)
It was also noticed that the cortical bone specimen failed in tests catastrophically in a brittle manner as soon as the maximum force was reached; it is presented by a nearly vertical line in Fig. 6 after the peak. In the simulation results of Model A, see Fig. 7, specimen fracture is represented in terms of a normalized crack length (Lcr/(W-Lnotch)) against time. It was calculated as the length of the crack (Lcr) divided by the un-notched width (W-Lnotch) measured on the specimen’s surface. At the beginning, the crack started to evolve slowly up to approximately 10% of this width at t = 0.2 ms, then grew steeply up to the contact force’s peak (331.3 N at t = 0.36 ms) at which only 30% of the specimen failed. However, even when the force started to decline; it was still high enough to propagate the crack. The crack growth accelerated after the maximum force position up to the specimen’s failure point, with the crack spending only 0.28 ms to reach the opposite side of the specimen. Obviously, at the moment of complete failure of the specimen the contact force vanished.

13
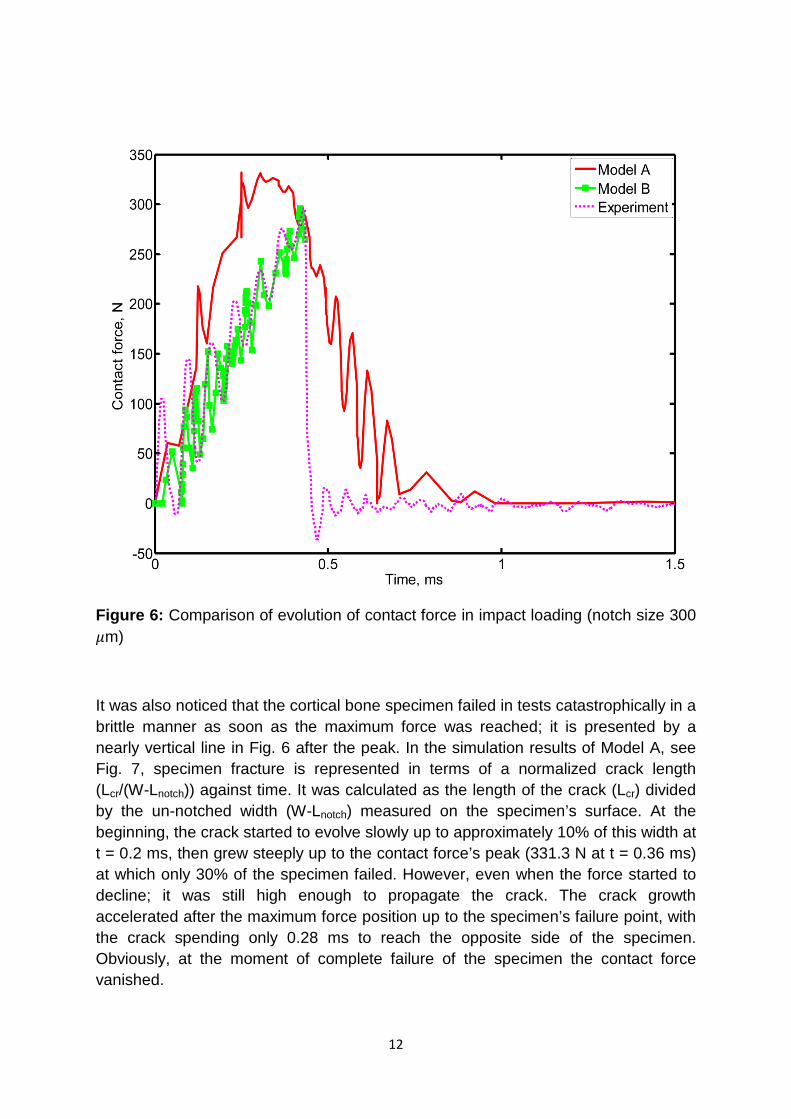
For Model A, the STATUSXFEM output - available in Abaqus 6.10 - shows the crack evolution during the course of analysis. This parameter varies over the range between 0 and 1; when it equals to 0 there is no damage and in the case of complete failure, it equals to 1. Figure 8 shows the evolution of the crack originating from the notch and propagating across the width of the specimen towards the opposite side.
Figure 7: Evolution of contact force and normalized crack length in Model A (notch size 300 𝜇m)
14
Figure 8: Crack evolution at different time increments (Model A)
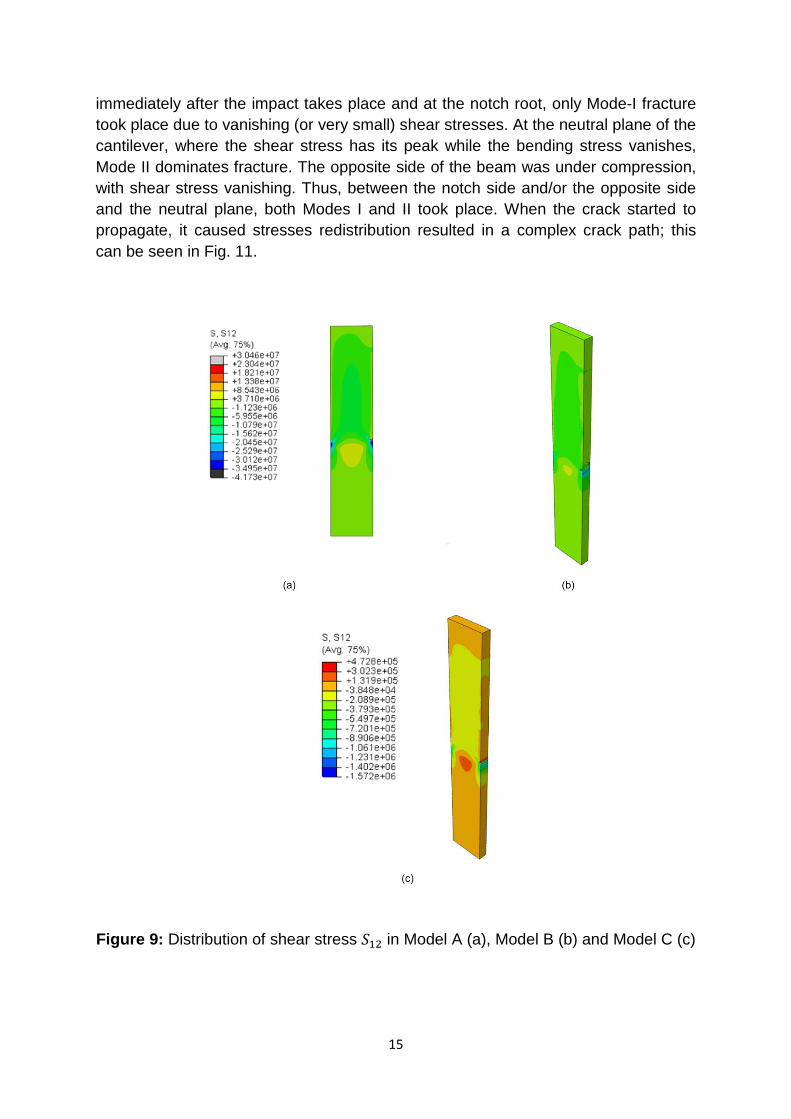
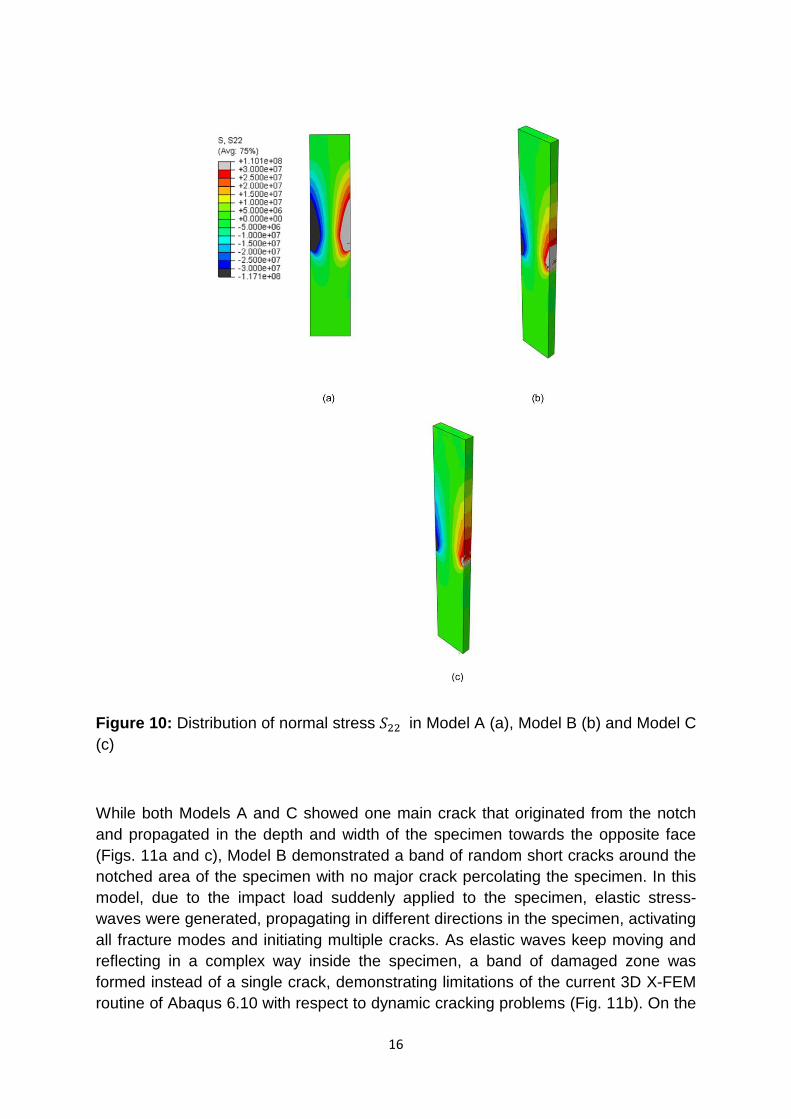
It was noticed that the crack started to propagate immediately along an inclined plane, with the notch root indicating mixed-mode fracture behaviour (Mode I and Mode II). That was followed by a small horizontal crack path. These changes in the crack path direction correspond to kinks in the first part of the contact force-time curve up to the contact-force’s peak, see Fig. 7. Obviously, from the point of view of the beam theory, the studied cantilever beam is exposed to two types of stresses: normal stress (bending) and transverse shear stress. In these models, the beam’s span-to-width ratio is 2.2; so the transverse shear stresses should be significant. It was found that the shear stress level was comparable to that of normal ones (Figs. 9 and 10). Also, a transverse distribution of shear stress is parabolic across the width of the cantilever and uniform from the position of specimen-hammer interaction up to the notch location, see Fig. 9. This stress state causes Mode-II fracture. On the other hand, normal stress 𝑆22 in y-direction causes Mode-I fracture behaviour. Therefore,
15
immediately after the impact takes place and at the notch root, only Mode-I fracture took place due to vanishing (or very small) shear stresses. At the neutral plane of the cantilever, where the shear stress has its peak while the bending stress vanishes, Mode II dominates fracture. The opposite side of the beam was under compression, with shear stress vanishing. Thus, between the notch side and/or the opposite side and the neutral plane, both Modes I and II took place. When the crack started to propagate, it caused stresses redistribution resulted in a complex crack path; this can be seen in Fig. 11.
Figure 9: Distribution of shear stress 𝑆12 in Model A (a), Model B (b) and Model C (c)
16
Figure 10: Distribution of normal stress 𝑆22 in Model A (a), Model B (b) and Model C (c)
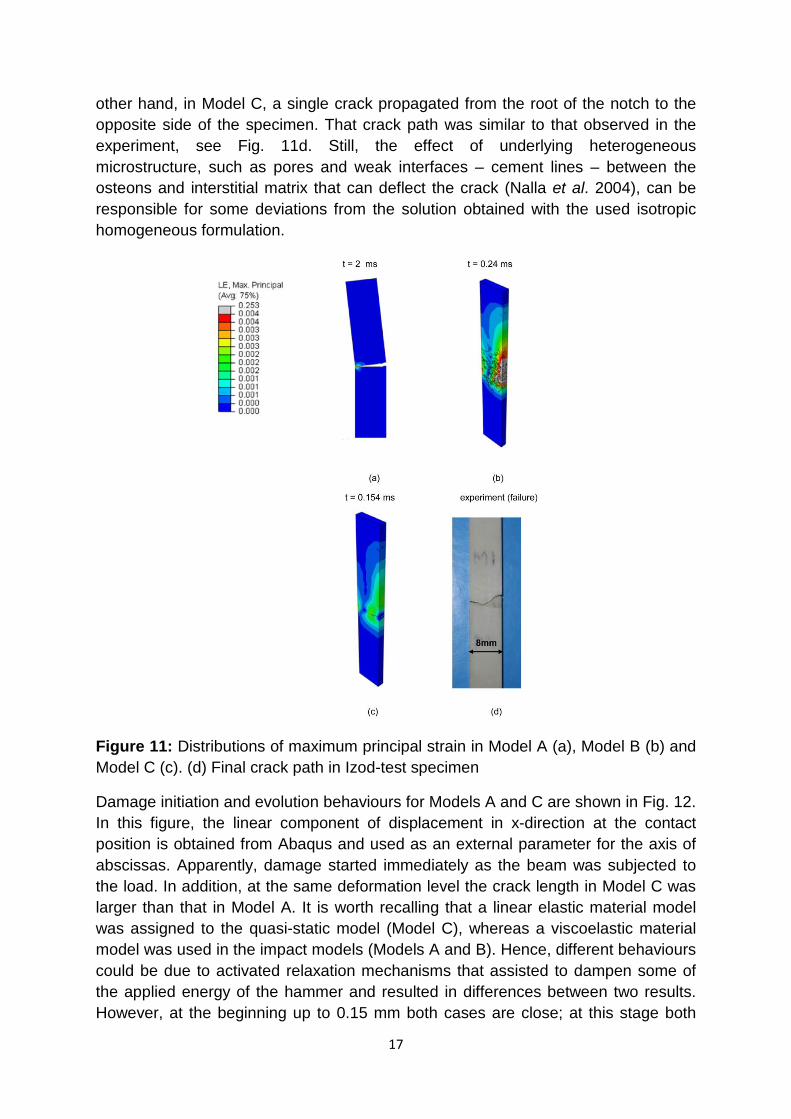
While both Models A and C showed one main crack that originated from the notch and propagated in the depth and width of the specimen towards the opposite face (Figs. 11a and c), Model B demonstrated a band of random short cracks around the notched area of the specimen with no major crack percolating the specimen. In this model, due to the impact load suddenly applied to the specimen, elastic stress-waves were generated, propagating in different directions in the specimen, activating all fracture modes and initiating multiple cracks. As elastic waves keep moving and reflecting in a complex way inside the specimen, a band of damaged zone was formed instead of a single crack, demonstrating limitations of the current 3D X-FEM routine of Abaqus 6.10 with respect to dynamic cracking problems (Fig. 11b). On the
17
other hand, in Model C, a single crack propagated from the root of the notch to the opposite side of the specimen. That crack path was similar to that observed in the experiment, see Fig. 11d. Still, the effect of underlying heterogeneous microstructure, such as pores and weak interfaces – cement lines – between the osteons and interstitial matrix that can deflect the crack (Nalla et al. 2004), can be responsible for some deviations from the solution obtained with the used isotropic homogeneous formulation.
Figure 11: Distributions of maximum principal strain in Model A (a), Model B (b) and Model C (c). (d) Final crack path in Izod-test specimen
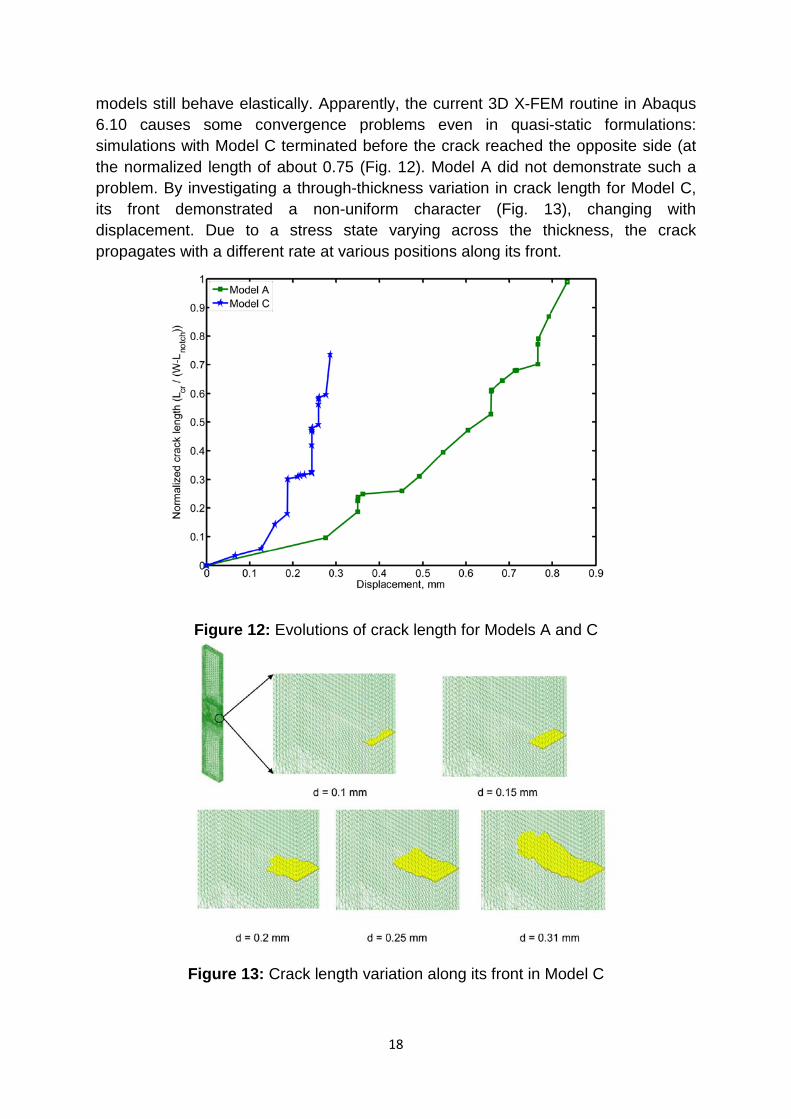
Damage initiation and evolution behaviours for Models A and C are shown in Fig. 12. In this figure, the linear component of displacement in x-direction at the contact position is obtained from Abaqus and used as an external parameter for the axis of abscissas. Apparently, damage started immediately as the beam was subjected to the load. In addition, at the same deformation level the crack length in Model C was larger than that in Model A. It is worth recalling that a linear elastic material model was assigned to the quasi-static model (Model C), whereas a viscoelastic material model was used in the impact models (Models A and B). Hence, different behaviours could be due to activated relaxation mechanisms that assisted to dampen some of the applied energy of the hammer and resulted in differences between two results. However, at the beginning up to 0.15 mm both cases are close; at this stage both
18
models still behave elastically. Apparently, the current 3D X-FEM routine in Abaqus 6.10 causes some convergence problems even in quasi-static formulations: simulations with Model C terminated before the crack reached the opposite side (at the normalized length of about 0.75 (Fig. 12). Model A did not demonstrate such a problem. By investigating a through-thickness variation in crack length for Model C, its front demonstrated a non-uniform character (Fig. 13), changing with displacement. Due to a stress state varying across the thickness, the crack propagates with a different rate at various positions along its front.
Figure 12: Evolutions of crack length for Models A and C
Figure 13: Crack length variation along its front in Model C
19
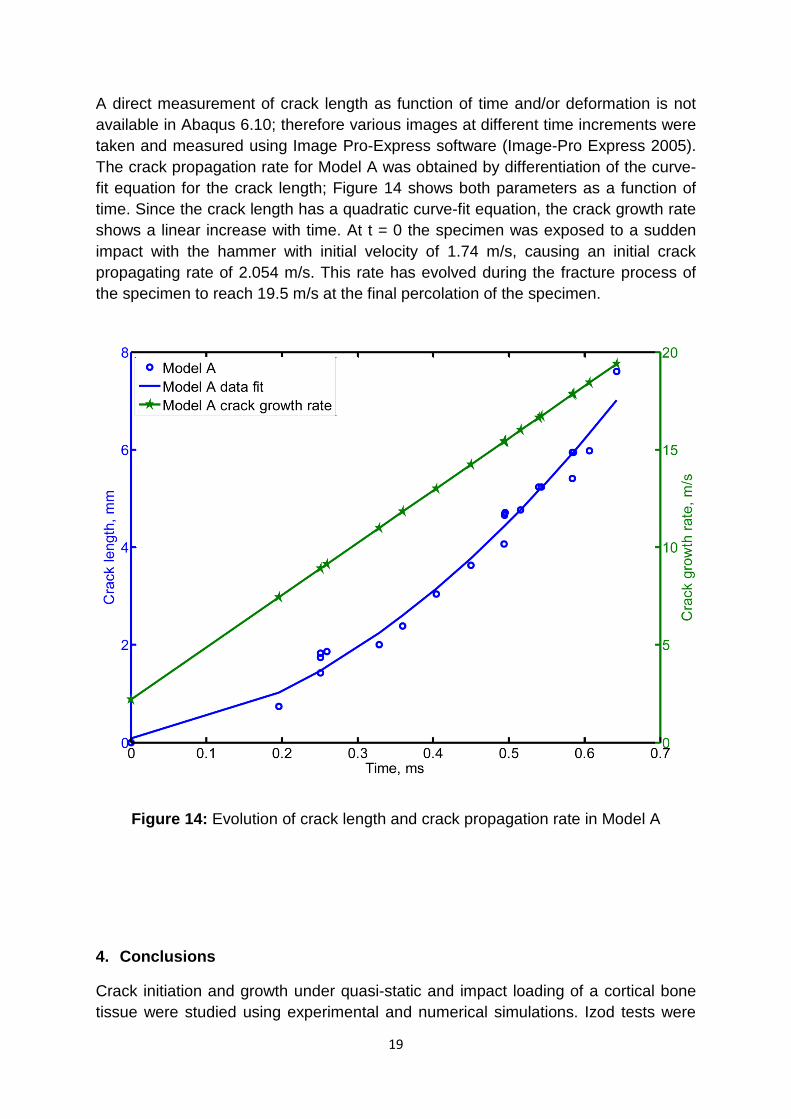
A direct measurement of crack length as function of time and/or deformation is not available in Abaqus 6.10; therefore various images at different time increments were taken and measured using Image Pro-Express software (Image-Pro Express 2005). The crack propagation rate for Model A was obtained by differentiation of the curve-fit equation for the crack length; Figure 14 shows both parameters as a function of time. Since the crack length has a quadratic curve-fit equation, the crack growth rate shows a linear increase with time. At t = 0 the specimen was exposed to a sudden impact with the hammer with initial velocity of 1.74 m/s, causing an initial crack propagating rate of 2.054 m/s. This rate has evolved during the fracture process of the specimen to reach 19.5 m/s at the final percolation of the specimen.
Figure 14: Evolution of crack length and crack propagation rate in Model A
4. Conclusions
Crack initiation and growth under quasi-static and impact loading of a cortical bone tissue were studied using experimental and numerical simulations. Izod tests were
20
performed to characterise its impact strength for different cortex positions. Three different finite-element models – Models A, B, and C - were implemented into the commercial finite-element software Abaqus 6.10 using its implicit solver. A series of simulations was performed to study the crack initiation and propagation under quasi-static and impact loading. The obtained numerical results were quite close to the experimental ones, and the numerical models have the capability to reproduce the failure of cortical bone tissue under both impact and quasi-static loading. The finite-element results provide more detailed information than the experimental tests and helped to gain a better understanding of the fracture behaviour of the cortical bone tissue. Numerical simulations showed that its fracture behaviour was reasonably well predicted using Model A in terms of the contact force profile and the crack path, while Model B exhibited unrealistic fracture scenario: formation of a damage band with multiple cracks across the specimen’s width and thickness around the notch area. The stress state generated by the applied load triggered Modes I and II in the fracture process of bone specimen in the Izod test setup. In general, the results showed the suitability of the developed numerical approach to study the fracture of cortical bone tissue under quasi-static and impact loading.
References
Abaqus 6.10, (2010). "Analysis user's manual, Section 10.6.1." Abdel-Wahab, A. A., Maligno, A., Silberschmidt, V.V. (2010). "Dynamic Properties of Cortical Bone Tissue: Izod Tests and Numerical Study." Comput. Mater. Continua 19 (3): 217-238. Abdel-Wahab, A. A., Alam, K., Silberschmidt, V.V. (2011). "Analysis of anisotropic viscoelastoplastic properties of cortical bone tissues." J. Mech. Behav. Biomed. Mater., DOI.org/10.1016/j.jmbbm.2010.10.001. Augat, P., Schorlemmer, S. (2006). "The role of cortical bone and its microstructure in bone strength." Age Ageing 35-s2: ii27-ii31. Bayraktae, H. H., Morgan, E.F., Niebur, G.L., Morris, G.E., Wong, E.K., Keaveny, T.M., (2004). "Comparison of the the elastic and yield properties of human femoral trabecular and cortical bone tissue " J. Biomech. 37: 27-35. Belytschko, T., Black, T. (1999). "Elastic Crack Growth in Finite Elements With Minimal Remeshing." Int. J. Numer. Meth. Eng. 45(5): 601-620. Bonney, H., Colston, B. J., Goodman, A. M. (2011). "Regional variation in the mechanical properties of cortical bone from the porcine femur." Med. Eng. & Phys. 33 (4): 513-520. Cox, B. N., Yang, Q. (2007). "Cohesive zone models of localization and fracture in bone." Eng. Fract. Mech. 74: 1079-1092. Cullinane, D. M., Einhorn, T.A. (2002). Biomechanics of Bone. Principles of Bone Biology. J. P. Bilezikian, Raisz, L.G., Rodan, A.R. San Diego, USA, Academic Press. 1.
21
Currey, J. D. (2004). "Tensile yield in compact bone is determined by strain, post yield behaviour by mineral content." J. Biomech. 37: 549-556. Feng, Z., Rho, J., Ziv, I. (2000). "Orientation and loading condition dependence of fracture toughness in cortical bone " Mater. Sci. Eng. C 11: 41-46. Katsamanis, F., Raftopoulos, D. D. (1990). "Determination of mechanical properties of human femoral cortical bone by the Hopkinson bar stress technique." J. Biomech. 23(11): 1173-1184. Koester, K. J., AgerIII, J.W., Ritchie, R.O. (2008). "The true toughness of human cortical bone measured with realistically short cracks." Nat. Mater. 7: 672-677. Kovan, V. (2008). "An assessment of impact strength of the mandible." J. Biomech. 41(16): 3488-3491. Kulin, R. M., Jiang, F., Vecchio, K.S. (2010). "Effects of age and loading rate on equine cortical bone failure." J. Mech. Behav. Biomed. Mater. 4(1): 57-75. Launey, M. E., Buehler, M.J., Ritchie, R.O. (2010). "On the mechanistic origins of toughness in bone." Ann. Rev. Mater. Res. 40: 25-53. Lee, S., Novitskaya, E. E., Reynante, B., Vasquez, J., Urbaniak, R., Takahashi, T., Woolley, E., Tombolato, L., Chen, Po-Yu, McKittrick, J. (2011). "Impact testing of structural biological materials." Mater. Sci. Eng. C 31 (4): 730-739. Lucksanasombool, P., Higgs, W.A.J., Higgs, R.J.E.D., Swain, M.V. (2001). "Fracture toughness of bovine bone: influence of orientation and storage media." Biomater. 22: 3127-3132. Melenk, J. M., Babuska, I (1996). "The partition of unity finite element method: basic theory and applications." Comput. Method Appl. Math. 39: 289-314. Morais, J. J. L., de Moura, M. F. S. F., Pereira, F. A. M., Xavier, J., Dourado, N., Dias, M. I. R., Azevedo, J. M. T. (2010). "The double cantilever beam test applied to mode I fracture characterization of cortical bone tissue." J. Mech. Behav. Biomed. Mater. 3(6): 446-453. Nalla, R. K., Kruzic, J.J., Ritchie, R.O. (2004). "On the origin of the toughness of mineralized tissue: microcracking or crack bridging?" Bone (34): 790-798. Nalla, R. K., Stolken, J.S., Kinney, J.H., Ritchie, R.O. (2005). "Fracture in human cortical bone: local fracture criteria and toughening mechanisms " J. Biomech. 38: 1517-1525. Norman, T. L., Nivargikar, S.V., Burr, D.B. (1996). "Resistance to crack growth in human cortical bone is greater in shear than in tension." J. Biomech. 29: 1023-1031. Norman, T. L., Vashishth, D., Burr, D.B. (1995). " Fracture toughness of human bone under tension." J. Biomech. 28: 309-320. Panagiotopoulos, E., Kostopoulos, V, Tsantzalis, S, Fortis, A P, Doulalas, A (2005). "Impact energy absorption by specimens from the upper end of the human femur." Injury 36(5): 613-617.
22
Pattin, C. A., Calet, W.E., Carter, D.R. (1996). "Cyclic mechanical property degradation during fatigue loading of cortical bone " J. Biomech. 29: 69-79. Reilly, G. C., Currey, J.D. (2000). "The effect of damage and microcracking on the impact strength of bone " J. Biomech. 33: 337-343. Saha, S., Hayes, W. C. (1976). "Tensile impact properties of human compact bone." J. Biomech. 9(4): 243-244, IN5, 245-251. Ural, A., Vashishth, D. (2006). "Cohesive finite element modelling of agerelated toughness loss in human cortical bone." J. Biomech. 39: 2974-2982. V. Image-Pro Express, V. m. c. (2005). Vashishth, D., Tanner, K.E., Bonfield, W. (2000). "Contribution, development and morphology of microcracking in cortical bone during crack propagation." J. Biomech. 33: 1169-1174. Wachter, N. J., Krischak, G.D., Mentzel, M., Sarkar, M.R., Ebinger, T., Kinzl, L., Claes, L., Augat, P. (2002). " Correlation of bone mineral density with strength and microstructural parameters of cortical bone in vitro." Bone 3: 90-95. Wang, X., Puram, S. (2004). "The toughness of cortical bone and its relationship with age." Ann. Biomed. Eng. 32: 123-135. Yang, Q. D., Cox, B.N., Nalla, R.K., Ritchie, R.O. (2006). "Re-evaluating the toughness of human cortical bone. Bone 38, 878–88." Bone 38: 878-887. Yeni, Y. N., Norman, T.L. (2000). "Calculation of porosity and osteonal cement line effects on the effective fracture toughness of cortical bone in longitudinal crack growth." J. Biomed. Mater. Res. B Appl. Biomater. 51: 504-509. Zioupos, P. (1998). "Recent developments in the study of failure of solid biomaterials and bone: fracture and prefracture toughness." Mater. Sci. Eng. C 6: 33-40. Zioupos, P., Currey, J.D. (1998). "Changes in the stiffness, strength, and toughness of human cortical bone with age." Bone 22: 57-66. Zioupos, P., Currey, J.D., Hamer, A.J. (1999). " The role of collagen in the declining mechanical properties of aging human cortical bone." J. Biomed. Mater. Res. 45: 108-6. Zioupos, P., Hansen, U., Currey, J.D. (2008). "Microcracking damage and the fracture process in relation to strain rate in human cortical bone tensile failure." J. Biomech. 41(14): 2932-2939.