numerical modeling of urea water based selective catalytic ...repozitorij.fsb.hr/3506/1/numerical...
TRANSCRIPT

Seediscussions,stats,andauthorprofilesforthispublicationat:https://www.researchgate.net/publication/269219818
NumericalmodelingofureawaterbasedselectivecatalyticreductionformitigationofNOxfromtransportsector
ArticleinJournalofCleanerProduction·February2015
ImpactFactor:3.84·DOI:10.1016/j.jclepro.2014.06.042
CITATIONS
3
READS
189
4authors,including:
JakovBaleta
UniversityofZagreb
4PUBLICATIONS7CITATIONS
SEEPROFILE
NevenDuic
UniversityofZagreb
409PUBLICATIONS1,643CITATIONS
SEEPROFILE
Allin-textreferencesunderlinedinbluearelinkedtopublicationsonResearchGate,
lettingyouaccessandreadthemimmediately.
Availablefrom:JakovBaleta
Retrievedon:10May2016

lable at ScienceDirect
Journal of Cleaner Production 88 (2015) 280e288
Contents lists avai
Journal of Cleaner Production
journal homepage: www.elsevier .com/locate/ jc lepro
Numerical modeling of urea water based selective catalytic reductionfor mitigation of NOx from transport sector
Jakov Baleta a, *, Milan Vujanovi�c a, Klaus Pachler b, Neven Dui�c a
a Department of Mechanical Engineering, Faculty of Mechanical Engineering and Naval Architecture, University of Zagreb, Ivana Lu�ci�ca 5,10 002 Zagreb, Croatiab Advanced Simulation Technologies, AVL List GmbH, Alte-Poststraße 152, A-8020 Graz, Austria
a r t i c l e i n f o
Article history:Received 27 December 2013Received in revised form12 June 2014Accepted 13 June 2014Available online 23 June 2014
Keywords:Exhaust gas aftertreatmentSelective catalytic reductionWall filmUrea water solutionNOx reductionSurface tension
* Corresponding author. Tel.: þ385 1 6168 494; faxE-mail addresses: [email protected] (J. Bale
(M. Vujanovi�c), [email protected] (K. Pachler), n
http://dx.doi.org/10.1016/j.jclepro.2014.06.0420959-6526/© 2014 Elsevier Ltd. All rights reserved.
a b s t r a c t
Various environmental regulations put ever stringent requirements on the automotive industry as a partof solution to the problem of global warming and climate change. In Europe, the upcoming Euro 6standard that will come into force on September 1, 2014 demands reduction in NOx emissions from carsand vehicles intended for transport by more than 50% compared to the current standard. The urea-water-solution (UWS) based selective catalytic reduction (SCR) is currently the most promising method forfulfilling these requirements. In principle, the UWS spray is injected into a hot exhaust gas streampreceding the SCR catalyst and ammonia is generated through series of chemical reactions. Then, thegenerated ammonia acts in various deNOx reactions as a reductant.
This paper investigates application of numerical modeling in the area of environmentally friendlytechnology of mobile SCR as a green engineering measure to reduce pollution in the road transportsector. Within this work the mathematical model of surface tension has been developed and compared toanalytical expression for isothermal droplet spreading. Furthermore, this model was incorporated intothe wall film module of the commercial computational fluid dynamics code FIRE for description of urea-water-solution injection into hot exhaust gases of diesel engine and compared to experimental data.Results of the conducted numerical study support the feasibility of commercial application of the pre-sented model.
© 2014 Elsevier Ltd. All rights reserved.
1. Introduction
Transport is one of the most challenging sectors whenaddressing energy security and climate changes (Liu et al., 2013).Preferred option for accomplishing goals of cleaner production isthrough improved governmental policies (Kleme�s et al., 2012), oneof them being European emission standards. Strict requirements ofthe upcoming Euro 6 (Regulation (EC) No 715/2007) standard canonly be met by a combination of new exhaust gas aftertreatmentand advanced engine technologies. For the commercial diesel en-gines, this means the use of common rail fuel injection systemswith pressures of up to 2500 bar, charging pressures of 4 bar andexhaust gas recirculation up to 30% at full load (Kr€ocher et al.,2008). Further reduction of NOx emissions below emission limitscan be achieved by a suitable exhaust gas aftertreatment system.The most promising technology for reduction of NOx is selective
: þ385 1 6156 940.ta), [email protected]@fsb.hr (N. Dui�c).
catalytic reduction in the exhaust gas system using ammonia pro-duced from precursor substances such as urea. Due to combustionwith the oxygen excess in diesel engines, O2 is present in theexhaust gas in higher concentration, which makes a simplereduction of NOx very difficult. Generally, all the applicablereducing agents prefer to react with oxygen prior to the conversionof the less reactive NO, because reaction with NO has higher acti-vation energy. Application of a catalyst lowers that energy, so thatthe reaction proceeds selectively towards the nitrogen, without thereductant being oxidized. Hence the generally known name - se-lective catalytic reduction (SCR).
Spatially uniform distribution of the reducing agent that pre-cedes the SCR catalyst is a crucial factor for the conversion of NOx.The uniformity of distribution and the degree of processing of thereducing agent upstream of the SCR catalyst can be, besides theevaporation and decomposition, influenced also by the spray/wallinteraction.
Usage of CFD simulations to investigate and improve thermo-chemical processes is becoming increasingly important (Kleme�set al., 2010). Well established mathematical models of all relevant

J. Baleta et al. / Journal of Cleaner Production 88 (2015) 280e288 281
physical phenomena regarding the SCR, which are implemented inthe commercial CFD codes, form the basis for the design of modernselective catalytic reduction systems, including dozing apparatus(Kim et al., 2004; Nguyen et al., 2010; van Helden et al., 2004). Inthe upcoming sections the possibility of numerical modeling ofurea-water-solution injection into hot exhaust gases using the CFDcode FIRE (FIRE, 2013) is investigated.
2. Mathematical model
In this study, as in the most engineering applications today, theEulerianeLagrangian method for solving the multiphase flowphenomena is used. In this approach, the spray droplets are rep-resented by finite numbers of droplet groups called parcels. It isassumed that all the droplets within one parcel are similar in sizeand have the same physical properties. The motion and the trans-port of the parcels are tracked through the flow field using aLagrangian formulation, while the gas phase is described by solvingconservation equations using an Eulerian formulation. Thecoupling between the liquid and the gaseous phase is taken intoaccount by introducing appropriate source terms for interfacialmass, momentum, and energy exchange (Mikul�ci�c et al., 2013).
2.1. Continuous phase
The constitutive equations of continuummechanics are based onthe conservation laws formass,momentumand energy. The generalform of the time averaged conservation equation for any dependentvariable 4; of the continuous phase in the differential form is:
v
vtr4þ v
vxj
�r4mj
� ¼ v
vxj
G4
v4
vxj
!þ S4; (1)
where r is the density, uj Cartesian velocity, G4 diffusion coefficient,and S4 is the source term of the dependent variable 4: In Eq. (1) thefirst term is an unsteady term, the second term is convection, thethird term is diffusion and the last term is source or sink. The sourceterm S4 is used for the coupling of the liquid and the gaseous phases(Mikul�ci�c et al., 2012a).
2.2. Urea water solution injection
Urea-water solution (UWS) is the most commonly usedammonia precursor for mobile SCR applications since it representsno danger for environment in the case of a traffic accident. AdBlueis a commercial name for an aqueous urea solution blended with32.5% high purity urea and 67.5% deionized water.
Once AdBlue spray is injected into the hot exhaust gas streambefore the SCR catalyst, water evaporates from the UWS. After-wards, ammonia is generated through thermal decomposition ofurea and hydrolysis of isocyanic acid:
ðNH2Þ2CO/NH3 þHNCO (2)
Hydrolysis of isocyanic acid:
HNCOþ H2O/NH3 þ CO2 (3)
Generated ammonia takes part in various deNOx reactions as areductant (Fang and DaCosta, 2003):
4NH3 þ 4NOþ O2/4N2 þ 6H2O ðstandard SCRÞ (4)
4NH3 þ 2NO2 þ 2NO /4N2 þ 6H2O ðfast SCRÞ (5)
NOx in diesel exhaust is usually composed of >90% of NO andonly 5e10% of NO2. Therefore, the main reaction of SCR with
ammonia is a reaction (4). The reaction with equimolar amounts ofNO and NO2 (5) is much faster than the main reaction and thereforeis called the fast SCR reaction. The NO2 needed for the fast SCRreaction could be produced from engine-emitted NO in the pre-oxidation catalyst. Under ideal spraying conditions for the ureawater solution, engine test results have shown a stoichiometricratio of 2.2e2.9 mol of NO per 1mol of urea consumption (Fang andDaCosta, 2003). This is equal to a weight ratio 0.67e0.9 g of urearequired to reduce 1 g of NO in the exhaust.
In order to include all relevant phenomena appearing during theinjection of urea-water solution into a confined space of mobile SCRsystems, a suitable mathematical description of the followingprocesses is needed (Birkhold et al., 2006):
� Momentum interaction between the gas phase and droplets;� Evaporation and thermolysis of droplets;� Heat transfer between the wall and droplets;� Spray/wall interaction;� Two-component wall film interaction with the gas phase andthe exhaust tube;
� Secondary break-up of the spray.
This section presents the basics of some mathematical modelsimplemented in the commercial CFD code FIRE used for conductingof numerical simulations.
2.2.1. Evaporation and thermolysis of UWS dropletsDespite numerous experimental studies (Kontin et al., 2010;
Musa et al., 2006; Wang et al., 2009), theoretical understandingof evaporation and decomposition of UWS droplets is still far fromsatisfactory. Theoretical study conducted by Birkhold et al. (2007)was implemented in FIRE and represents the trade-off betweenaccuracy of results and computational demands. This approachassumes a two-stage process e pure water evaporation until thedroplet is composed of urea only, and subsequent thermolysis. It isalso assumed that the droplets remain spherical throughout theevaporation and decomposition processes, and there is no ureacrystallization.
2.2.1.1. Water evaporation. In order to evaluate the influence ofdissolved urea on the evaporation of water, Rapid Mixing Model isemployed. Within this model, infinitely high transport coefficientsare assumed for the liquid phase, resulting in spatially uniformtemperature, concentration and fluid properties in the droplet.However, these parameters will change in time (Abramzon andSirignano, 1989). The variation in droplet's urea concentration canbe evaluated by:
dYudt
¼ � _mvap
mdYu; (6)
where Yu is urea concentration, md is a droplet mass and ṁvap is avapor mass flow. Evaporation rates are calculated using theAbramzon-Sirignano model, which represents the extension of theclassical droplet vaporization model (Dukowicz, 1979) and includesimportant effects such as variable physical properties, variableLewis number in the gas phase and the influence of the Stefan flowon the heat and mass transfer. The model has low computationaldemands per droplet and therefore is suitable for the spray calcu-lations that simultaneously trace many individual droplets.
2.2.1.2. Urea thermolysis. Urea melts at 406 K, at which point thethermal decomposition of urea into ammonia and isocyanic acidstarts.

J. Baleta et al. / Journal of Cleaner Production 88 (2015) 280e288282
Arrhenius-type expression describes chemical kinetics of thereaction:
dmu
dt¼ �Af S expð � Ea=RTdÞ (7)
wheremu is urea mass, S is droplet surface area, Af is the frequencyfactor [kg/(sm2)], Td is the droplet temperature, R is the universalgas constant and Ea is the activation energy. Experimental datafrom Yim et al. (2004) were used for a default parameter fit. Thewall film approach for evaporation of UWS is similar, except for thethermolysis, which occurs when the mass fraction of water is lessthan 5%.
2.2.2. Spray/wall interaction modelAccording to dimensionless analysis carried out by Kuhnke
(2004), there are four different regimes of sprayewall interactiondepending on the dimensionless wall temperature and thedimensionless droplet velocity, as presented in Fig. 1. Dimension-less temperature is defined as follows:
T* ¼ TWTS
(8)
where TW is the wall temperature and TS is the droplet saturationtemperature.
Dimensionless droplet velocity is defined as:
K ¼ðrdDdÞ3=4u5=4d;⊥
s1=2d m
1=4d
(9)
where rd is the droplet density, ud,t is the wall normal componentof the droplet velocity, sd is the surface tension on the dropletegasinterface, Dd is the droplet diameter and md is the dynamic viscosityof the droplet.
2.2.3. Wall film modelingWall film model is implemented as a 2D finite volume method
on the airflow wall boundaries. The film thickness equation is thebasic governing equation for the wall film flow. It represents aslightly modified formulation of the continuity equation where,instead of mass, thewall film thickness is a conserved property. TheCartesian formulation of the film thickness equation is:
vd
vtþ vdu1
vx1þ vdu2
vx2¼ 1
rAðSmD � SmV Þ (10)
where d is the film thickness, r is the film density, u1 and u2 are filmvelocity components, SmD and SmV are source/sink terms and A is
Fig. 1. Diagram of spray/wall interaction e Kuhnke (2004).
the surface area of the film. If we assume that the source terms areprovided, Equation (10) can be solved explicitly if the velocitycomponents are known.
The current wall film model in the commercial CFD code FIREcontains mathematical description of physical phenomena in theform of three conservation laws: conservation of mass, momentumand energy. However, the surface tension effects, which are of greatimportance at the late film spreading stages when the inertialforces are negligible (Horvat, 2007) as well as when shear-drivenfilm comes at a sharp expanding corner (Friedrich et al., 2008),are not taken into account.
The film surface tension effects that are present at the boundaryedges of the liquid phase play a crucial role in slowing down thefilm progression. These effects are not currently accounted for, andapproximation of constant film thickness over the control volumedoes not allow reconstructing the characteristics of the interface.That way, the scattering of liquid film causes high numericaldiffusion, which does not correspond to physical reality. Thethreshold value of theminimal film thickness can be set by the user,and only the cells where the film is thicker are considered active.Such an approach is not suitable. Therefore, the objective of thiswork is also improvement of the current model by incorporatingappropriate mathematical description of surface tension effects.
The continuum surface force (CSF) method of Brackbill has beenemployed extensively over the last 13 years to model the surfacetension in various fixed (Eulerian) mesh formulations for interfacialflows, in particular in the volume-of-fluid (VOF), the level-set (LS)and the front tracking (FT) interface representation techniques(Francois et al., 2006). The main drawback of mentioned ap-proaches is that they are unsuitable for finite area Eulerianapproach because of high computational demands. Those areusually used on small scale interfaces such as impinging droplet orfew droplet collisions. Another approach to describe surface ten-sion was made by Bai (1996), who developed the solution proce-dure where capillary forces are taken into account through acapillary pressure term. It is suitable to incorporate this pressureterm into the momentum equation of wall film. The details of theprocedure are given as follows.
The film momentum equation describes dynamics of liquid filminteraction with its environment - wall, air stream above the film,impinging droplets, etc. Equation (11) gives mathematical formu-lation of the wall film momentum conservation law:
dMi
dt¼IL
rui�ui � Vj
�bnidL ¼ZL
pdbnidLþmgi þ Gi þ SM (11)
whereMi is film momentum, r is the film density, ui is film velocity,Vj is wall velocity, bni is normal to the face cell facing outwards, dL isdifferential length of the face cell boundary, d is the film thickness, pis film pressure, m is film mass, gi is the component of gravityvector, Gi is the term that takes into account all shear stresses andSm presents various source and sink terms such as film entrain-ment, spray droplets impingement and film evaporation.
Inclusion of surface tension effects into the pressure term ofmomentum equation was made by calculating the capillary pres-sure. This force drives the surface towards a minimal energy statecharacterized by a configuration of minimum surface area and isrepresented by the combined action of liquid surface tension s andfilm surface curvature C (Horvat, 2007):
ps ¼ �sC (12)
As shown in O'Brien and Schwartz (2006) and Schwartz andWeidner (1995), the mean curvature of the free surface can beapproximated using the following expression:
J. Baleta et al. / Journal of Cleaner Production 88 (2015) 280e288 283
Cz�1R1
þ 1R2
�þ
d
R21þ d
R22
!þ V � Vd (13)
On quality computational meshes the surface area patches areso small that the first two terms of Equation (13) could be neglec-ted. Thus, the film surface curvature could be approximated withLaplacian of film thickness whose numerical form is:
Dd ¼ V � Vd ¼ 1S
Xnedges
i¼1
niVd$Li ¼1S
Xnedges
i¼1
nidB � dA
AB$Li (14)
where V is del operator, d is the film thickness, S is surface patcharea, Li is the length of the neighboring edge, ni is unit normal oncommon edge facing outwards and AB is length between cell cen-ters A and B. Equation (14) was incorporated into the pressure termof momentum equation of the existing numerical framework.
3. Experimental setup
For the investigation, a six-hole injector (200 mmhole diameter)made by Emitec, type EM-A1.3, was used. The cycle time was100 ms. In order to achieve the desired flow rate of 2.5 kg/h, theopening and closing times of the injector needlewere changedwitha frequency generator Rigol DG1022, which was connected to theinjector via an amplifier.
3.1. Spray calibration
Experiments were conducted using a water at 25 �C. Water wasinjected at a relative pressure of 8 bar into a quiescent air at 20 �Cvertically from above the rectangular test chamber where injectorwas mounted. Visualization of spray behavior inside the testchamber was performed using the AVL VisioScope which is a dig-ital, triggerable video system especially designed for the IC engineresearch. The images delivered by a digital camera are transmittedstraight to the PC as digital data and therefore with no loss ofquality.
The so called spray pattern represents the spatial distribution ofa liquid mass on a plain perpendicular to the spray axis, measuredat a fixed distance from the nozzle. The device for measuring thespray pattern is conveniently called a patternator. In our case itconsisted of 61 tubes (d¼ 5.25mm) arranged in a circular form. Themeasuring procedure consists of positioning the patternator atdifferent distances from the nozzle, perpendicular to the spray axis.The injected liquid was captured by the patternator tubes. Byanalyzing the amount of liquid collected in each tube was possibleto deduce the spray mass distribution at given distances.
Finally, the Spraytec instrument was used to measure the size ofspray particles using the laser diffraction technique.
3.2. Test rig
A test rig with a rectangular cross-section made of transparentand heat-resistant borosilicate glass was used for the analysis ofwall film and air composition. Its dimensions were970 � 120 � 45 mm and it was available for optical measuringmethods. Experiments were conducted using pure air. For theintroduction of AdBlue into the test section the same injector thatwas described in Section 3, was used with identical operatingconditions. The injector was located 40 mm after the inlet and wasdelivering the liquid perpendicular to the inlet air stream. Con-centrations of ammonia and isocyanic acid formed during the ureathermolysis were determined at the outlet of the test chamber
using Fourier transform infrared spectroscopy (FTIR). Sampling ofair was conducted at twelve points that were vertically distributedacross the channel cross-section, at 13, 18, 23 and 30 mm.
4. Results and discussion
This section presents results of numerical simulations, whichinvestigated the spray interaction with the hot air stream and wall.As the modeling of primary breakup is still insufficiently under-stood, the first step was spray calibration. The obtained spray pa-rameters, together with the newly developed surface tensionmodel, served as an input for the main simulation of urea thermaldecomposition in rectangular flow channel geometry.
4.1. Spray calibration
Numerical simulations of the spray processes were based on theLagrangian multiphase model implemented in the CFD code FIRE,which takes into account full two-way coupling between the gasand liquid phase.
The simulation domain had a rectangular shape. A three-dimensional 35 � 35 � 60 mm computational mesh with 73 500orthogonal hexahedron cells was used. The wall boundary condi-tions were defined at the top and bottom of the domain, whilst astatic pressure outlet was imposed at the sides. In the FIRE code, anozzle is defined as a point in a domain and is described by a set ofparameters given in the so called nozzle file. The domain pressureand temperature were initialized according to the experimentaldata.
The pressure velocity coupling of momentum and continuityequation was obtained using the SIMPLE/PISO algorithm. The cen-tral difference discretization scheme was used for the convectiveterm in the continuity equation with a blending factor of 1, whilst aMINMOD Relaxed with a blending factor of 0.5 was used for theconvective terms in the momentum equations. The most favoredmethod for modeling the turbulent flows in industrial applicationsis the Reynolds-averaged NaviereStokes equations (RANS) with anappropriate turbulence model. Many turbulent models employ theconcept of a turbulent viscosity or a turbulent diffusivity toapproximate the turbulent Reynolds stresses and the turbulentheat fluxes (Mikul�ci�c et al., 2012b). In this work the turbulence wasmodeled by the advanced k-zeta-f model (Hanjali�c et al., 2004). Thespray calibration procedure consisted of the steps described below.
4.1.1. Spray penetrationAnalysis of the spray penetration inside the test chamber pro-
vided data for the simulations carried out in order to determine thestart velocity of the spray. In the FIRE the start velocity can bespecified by a certain function, table or it can be set as constant.Relatively low injection pressure of 8 bar enables the usage ofconstant start velocity. Experimental data of spray penetration as afunction of time were extracted from the VisioScopemeasurements.
Fig. 2 shows comparison between the measured and thecalculated results in the case of AdBlue as an injected liquid. Itdemonstrates that the spray penetration curve has almost linearprofile. There are only indications of expected saturation at the endof the curve. This is a consequence of high velocities, big dropletsand relatively small dimensions of the test chamber, so that theaerodynamic forces due to relative velocity between the dropletsand air cannot significantly slow down the spray droplets and thusyield a more familiar saturated spray penetration curve.
Despite the fact that the experiments were carried out withwater, there was no noticeable difference between the penetrationof AdBlue and the water spray. In the case of water, the best

Fig. 2. Spray penetration e comparison between simulation and experiment.
J. Baleta et al. / Journal of Cleaner Production 88 (2015) 280e288284
agreement with the experimental results was achieved by settingthe start velocity at 29 m/s and this value had to be corrected to29.8 m/s for AdBlue.
4.1.2. Spray patternThe injection direction of the nozzle orifices and the angle of the
spray plumes depicted in the Fig. 3 were varied in numericalsimulation in order to match the spray patterns obtained by thepatternator measurements. The simulation set-up was slightlydifferent than that of the spray penetration. A knownmass from thepatternator measurements was injected in one cycle over the 1 stime, because themass flow does not affect the spray pattern. In theFig. 3 legend, the first angle indicates orifice inclination, while thesecond one indicates the angle of spray plumes. The value of 8� forboth angles yields a very good agreement with the measured data,as can be seen in the Fig. 4. The last check of the selected values wasperformed on the mesh that enables simulation of the spraypattern from the nozzle at a 50 mm distance. Agreement with theexperiment, as shown on the right diagram in Fig. 4, is satisfactory,although not as good as at the 30 mm distance. The area occupiedby the spray is larger and the mass is more evenly distributed, asexpected when increasing the nozzle distance.
With respect to all of the above, the final values of the sprayangles were 8� for both the injection direction of the nozzle orificesand the angle of the spray plumes.
Fig. 3. Schematic representation of spray angles.
4.1.3. Particle size distributionThe final step of the spray calibration was determination of the
initial particle size distribution (PSD). This is the most importantinitial condition since the primary break-up mechanisms imple-mented in the FIRE cannot be used for low injection pressures thatprevail in the SCR applications (Gapin et al., 2010).
The initial particle size distribution was specified using experi-mental measurements at the 30mm distance from the nozzle. Theywere slightly modified, keeping the integral of surface under thecurve equal to 1. The accuracy of the modified distribution forinitializing the simulation was verified by comparing the extractedPSD curve for a 30 mm distance from the nozzle with the sameexperimental data that were the basis for the modified distribution.In order to obtain a reliable average for comparison with theexperiment, two injection cycles were simulated. Fig. 5 showsverification of the chosen initial PSD curve. For a visual clarity,simulation results are shown with markers, contrary to theconvention.
The chosen input curve is confirmed by a good agreement be-tween the simulated and measured PSD at a 30 mm distance. Thereare some deviations at the beginning of the curve, most likelyattributable to the error in experiment due to the vertical beginningof the experimental curve, which is nonphysical. The averageWeber numberwas below 12. Therefore, according to Birkhold et al.(2006), it appears reasonable to assume the absence of any sec-ondary atomization process.
4.2. Validation of implemented surface tension model
In order to test the numerical scheme and to check if thecapillary pressure effects can be predicted properly, there is a needfor a simple case, where only the capillary force effects are relevant.Thus, the spreading of an isothermal droplet on a solid surface issimulated. The droplet is driven with a Laplace (capillary) pressureas dominant force and other forces being absent or negligible.Similar tests were obtained by Diez et al. (1994). He proposed ananalytical solution using lubrication theory, which neglectsconvective terms in the momentum equation, and confirmed itexperimentally. The problem can be observed as a two-dimensionalbecause of axial symmetry. Diez et al. (1994) showed that thenormalized film thickness h/h0 can be expressed as a single func-tion of the scaled radial position r/rf, irrespective of the time level.
The simulation domainwith the relevant boundary conditions isshown in Fig. 6. A three- dimensional 5 � 5 � 0.1 mm computa-tional mesh with 20 000 orthogonal hexahedron cells was used forthe simulation. The wall boundary condition was defined at thebottom of the domain, whilst a static pressure outlet was imposedat all other sides. The domain pressure was 1 bar and temperaturewas equal to the droplet temperature. The pressure velocitycoupling of momentum and continuity equation was obtained us-ing the SIMPLE/PISO algorithm. The central difference discretiza-tion scheme was used for the convective term in the continuityequation with a blending factor of 1, whilst a MINMOD Relaxedwith a blending factor of 0.5 was used for the convective terms inthe momentum equations. Turbulence model was deactivated,since a quiescent air is necessary for comparison with analyticalexpression. Energy equation was also deactivated, so that the onlyrelevant force is capillary pressure, which tends to spread a givendroplet shape into a state of minimal surface energy.
The simulation starts from a drop, which initially takes a shapeof a rotational paraboloid, with a volume of 0.12 mm3 and 0.08 mmthickness at the center. The spatial and time discretization incre-ment were 0.05 mm and 10�5 s, respectively. Simulation time was0.5 s, since the spreading of the droplet practically remained un-changed around and after 0.4 s.

Fig. 4. Comparison between the simulated spray pattern and the experiment.
J. Baleta et al. / Journal of Cleaner Production 88 (2015) 280e288 285
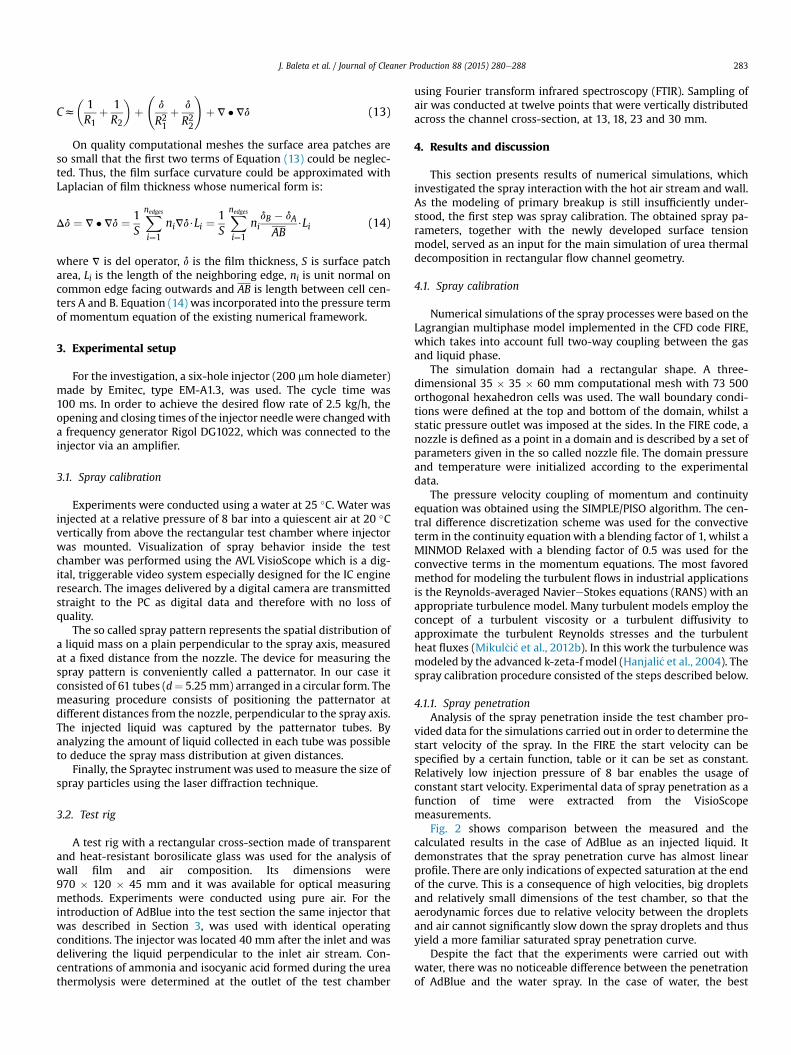
Quantitative comparison of simulation results and non-dimensional analytical droplet profile given in Fig. 7 shows thatthe present numerical predictions are in excellent agreement withthe experimental data, indicating that the numerical modeling ofthe capillary pressure is reasonable in terms of trade-off betweenthe accuracy of results and computational demands. However, themodel does not include correction of the film curvature at the filmfront due to the wettability effects represented by the dynamiccontact angle. These effects are omitted from modeling due to therelatively large spatial discretization, which prevails in most of thepractical applications where the wall film phenomena areimportant.
4.3. Main simulation
The experiments carried out on the test section have supplieddata for the numerical simulations, where the cases with andwithout the surface tension model were compared to the experi-mental data.
4.3.1. Simulation settingsThe simulation domain with relevant boundary conditions is
shown in Fig. 8. A three dimensional 970 � 120 � 45 mm compu-tational mesh with 335 280 hexahedron cells was used for thesimulations. The mesh was refined in the vicinity of the nozzle inorder to capture transient spray behavior. A boundary layer wasalso created towards the bottom plate as the wall film formationwas expected to occur during the injection. The inlet was describedwith normal velocity, air temperature, turbulent kinetic energy andturbulent length scale.
Fig. 5. Number based droplet size distribution.
The pressure velocity coupling of themomentum and continuityequations was obtained using the SIMPLE algorithm. The centraldifference discretization scheme was used for the convective termin the continuity equation with a blending factor of 1, whilst aMINMOD Relaxed with the same blending factor was used for theconvective terms in the momentum equations. Turbulence wasmodeled using the k-zeta-f model as was the case in Section 4.1.
Heat transfer through the wall was modeled using thin wallmodule that approximates the temperature profile of the wall withmean temperature. Heat loss towards the environment wasmodeled through the combined effect of convection and radiation.External heat transfer coefficient was set to 20W/(m2K), which wasa reasonable assumption for a free convection in the environmentalair. External wall emissivity was taken to be 0.3, and external airtemperature was set to 293.15 K according to the experiment.
4.3.2. ResultsFig. 9 shows the wall film evolution in the case without surface
tension model, i.e. default model. It can be seen that the increase ofthe surface covered with film gradually diminishes over time. Theincrease in the film covered area formed between the 3rd and 7thsecond is larger than the one formed between the 7th and 10thsecond. Furthermore, after 10 s the surface occupied by the wallfilm remains unchanged, as well as the wall film shape. It can beconcluded that a quasi steady state occurred. Most of the film massis deposited at the peripheral parts of the film due to the influenceof the main flow. The deposited liquid front of semi-circular shapepropagates in the direction of the main flow. Due to the effect ofviscosity, it leaves a liquid trail behind. The average film thicknessin those areas was between 200 and 250 mm.
Fig. 6. Computational domain for droplet spreading case.
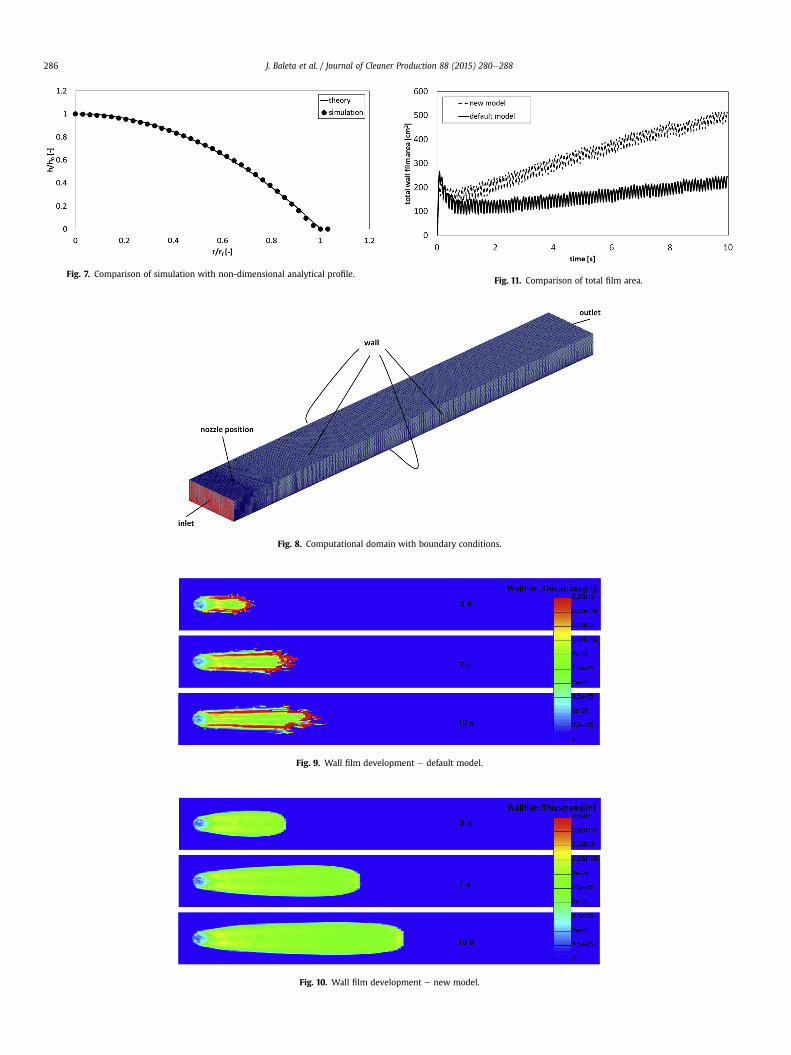
Fig. 7. Comparison of simulation with non-dimensional analytical profile.
Fig. 8. Computational domain with boundary conditions.
Fig. 9. Wall film development e default model.
Fig. 10. Wall film development e new model.
Fig. 11. Comparison of total film area.
J. Baleta et al. / Journal of Cleaner Production 88 (2015) 280e288286
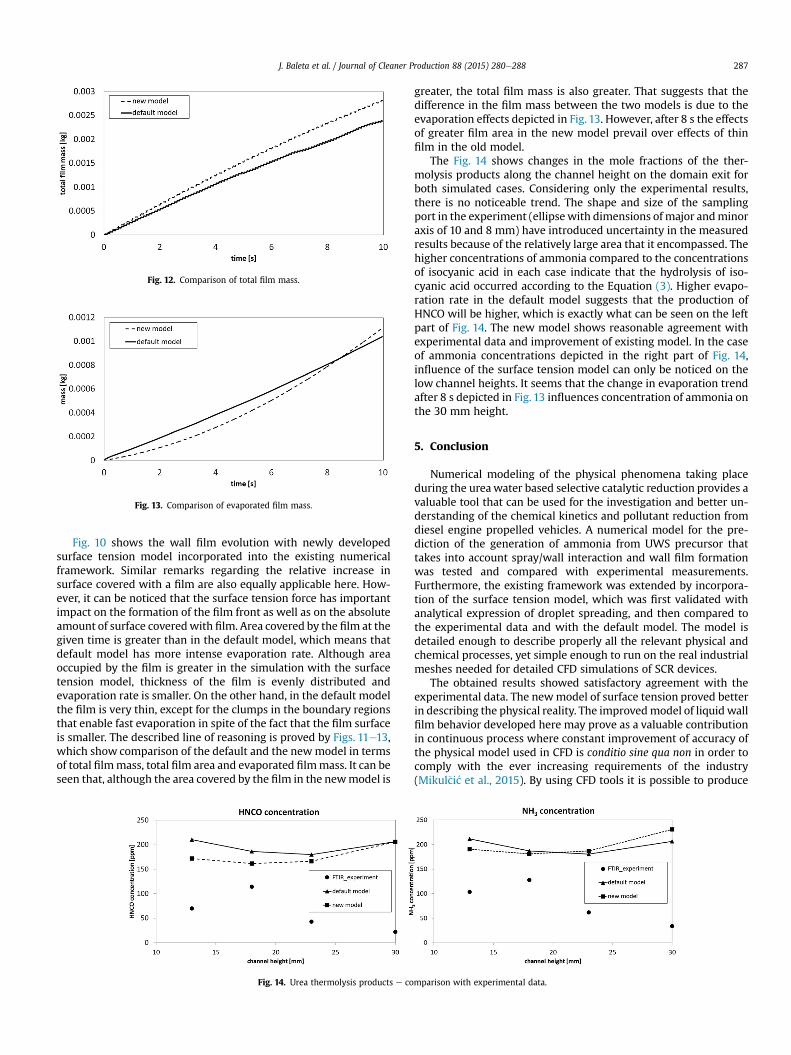
Fig. 12. Comparison of total film mass.
Fig. 13. Comparison of evaporated film mass.
J. Baleta et al. / Journal of Cleaner Production 88 (2015) 280e288 287
Fig. 10 shows the wall film evolution with newly developedsurface tension model incorporated into the existing numericalframework. Similar remarks regarding the relative increase insurface covered with a film are also equally applicable here. How-ever, it can be noticed that the surface tension force has importantimpact on the formation of the film front as well as on the absoluteamount of surface coveredwith film. Area covered by the film at thegiven time is greater than in the default model, which means thatdefault model has more intense evaporation rate. Although areaoccupied by the film is greater in the simulation with the surfacetension model, thickness of the film is evenly distributed andevaporation rate is smaller. On the other hand, in the default modelthe film is very thin, except for the clumps in the boundary regionsthat enable fast evaporation in spite of the fact that the film surfaceis smaller. The described line of reasoning is proved by Figs. 11e13,which show comparison of the default and the newmodel in termsof total filmmass, total film area and evaporated filmmass. It can beseen that, although the area covered by the film in the newmodel is
Fig. 14. Urea thermolysis products e co
greater, the total film mass is also greater. That suggests that thedifference in the film mass between the two models is due to theevaporation effects depicted in Fig. 13. However, after 8 s the effectsof greater film area in the new model prevail over effects of thinfilm in the old model.
The Fig. 14 shows changes in the mole fractions of the ther-molysis products along the channel height on the domain exit forboth simulated cases. Considering only the experimental results,there is no noticeable trend. The shape and size of the samplingport in the experiment (ellipsewith dimensions of major andminoraxis of 10 and 8 mm) have introduced uncertainty in the measuredresults because of the relatively large area that it encompassed. Thehigher concentrations of ammonia compared to the concentrationsof isocyanic acid in each case indicate that the hydrolysis of iso-cyanic acid occurred according to the Equation (3). Higher evapo-ration rate in the default model suggests that the production ofHNCO will be higher, which is exactly what can be seen on the leftpart of Fig. 14. The new model shows reasonable agreement withexperimental data and improvement of existing model. In the caseof ammonia concentrations depicted in the right part of Fig. 14,influence of the surface tension model can only be noticed on thelow channel heights. It seems that the change in evaporation trendafter 8 s depicted in Fig. 13 influences concentration of ammonia onthe 30 mm height.
5. Conclusion
Numerical modeling of the physical phenomena taking placeduring the ureawater based selective catalytic reduction provides avaluable tool that can be used for the investigation and better un-derstanding of the chemical kinetics and pollutant reduction fromdiesel engine propelled vehicles. A numerical model for the pre-diction of the generation of ammonia from UWS precursor thattakes into account spray/wall interaction and wall film formationwas tested and compared with experimental measurements.Furthermore, the existing framework was extended by incorpora-tion of the surface tension model, which was first validated withanalytical expression of droplet spreading, and then compared tothe experimental data and with the default model. The model isdetailed enough to describe properly all the relevant physical andchemical processes, yet simple enough to run on the real industrialmeshes needed for detailed CFD simulations of SCR devices.
The obtained results showed satisfactory agreement with theexperimental data. The newmodel of surface tension proved betterin describing the physical reality. The improvedmodel of liquid wallfilm behavior developed here may prove as a valuable contributionin continuous process where constant improvement of accuracy ofthe physical model used in CFD is conditio sine qua non in order tocomply with the ever increasing requirements of the industry(Mikul�ci�c et al., 2015). By using CFD tools it is possible to produce
mparison with experimental data.
J. Baleta et al. / Journal of Cleaner Production 88 (2015) 280e288288
more efficient, environmentally friendlier SCR technology forimproved gas aftertreatment.
Abbreviations
CFD Computational Fluid DynamicsEC European CommissionFTIR Fourier transform infrared spectroscopyLEVs low emission vehiclesPSD particle size distributionSCR selective catalytic reductionUWS urea water solution
References
Abramzon, B., Sirignano, W.A., 1989. Droplet vaporization model for spray com-bustion calculations. Int. J. Heat Mass Transf. 32 (9), 1605e1618. http://dx.doi.org/10.1016/0017-9310(89)90043-4.
Bai, C., 1996. Modelling of Spray Impingement Processes. Ph.D. thesis. ImperialCollege, University of London.
Birkhold, F., Meingast, U., Wassermann, P., Deutschmann, O., 2006. Analysis of theInjection of Urea-water-solution for Automotive SCR DeNOx-systems: Modelingof Two-phase Flow and Spray/Wall-Interaction. SAE 2006-01-0643 (http://dx.doi.org/10.4271/2006-01-0643.
Birkhold, F., Meingast, U., Wassermann, P., Deutschmann, O., 2007. Modeling andsimulation of the injection of urea-water-solution for automotive SCR DeNOx-systems. Appl. Catal. B Environ. 70, 119e127. http://dx.doi.org/10.1016/j.apcatb.2005.12.035.
Diez, J.A., Gratton, R., Thomas, L.P., Marino, B., 1994. Laplace pressure driven dropspreading. Phys. Fluids 6 (1), 24e33. http://dx.doi.org/10.1063/1.868072.
Dukowicz, J.K., 1979. Quasi-steady Droplet Phase Change in the Presence of Con-vection. Informal Report. Los Alamos Scientific Laboratory. LA-7997-MS. http://dx.doi.org/10.2172/6012968.
European Union, 2007. Regulation (EC) No 715/2007.Fang, H.L., DaCosta, H.F.M., 2003. Urea thermolysis and NOx reduction with and
without SCR catalysts. Appl. Catal. B: Environ. 46 (1), 17e34. http://dx.doi.org/10.1016/S0926-3373(03)00177-2.
FIRE v2013.2 Manual, 2013. Graz, Austria.Francois, M.M., Cummins, S.J., Dendy, E.D., Kothe, D.B., Sicilian, J.M., Williams, M.W.,
2006. A balanced-force algorithm for continuous and sharp interfacial surfacetension models within a volume tracking framework. J. Comp. Phys. 213 (1),141e173. http://dx.doi.org/10.1016/j.jcp.2005.08.004.
Friedrich, M.A., Lan, H., Wegener, J.L., Drallmeier, J.A., Armaly, B.F., 2008.A separation criterion with experimental validation for shear-driven films inseparated flows. J. Fluids Eng. 130, 051301. http://dx.doi.org/10.1115/1.2907405.
Gapin, A., Demoulin, F., Dumouchel, C., Pajot, K., Patte-Rouland, B., R�eveillon, J.,2010. Development of an initial drop-size distribution model and introductionin a CFD code to predict spray evolution. In: 7th International Conference onMultiphase Flow ICMF 2010, Tampa, Florida.
Hanjali�c, K., Popovac, M., Had�ziabdi�c, M., 2004. A robust near-wall elliptic-relaxa-tion eddy-viscosity turbulence model for CFD. Int. J. Heat Fluid Flow 25 (6),1047e1051. http://dx.doi.org/10.1016/j.ijheatfluidflow.2004.07.005.
Horvat, K., 2007. Computational Modelling of Spray Impingement Accounting forthe Wall Film Formation. Forschungsberichte Stromungslehre Und Aero-dynamik, Shaker Verlag, Gemany.
Kim, J.Y., Ryu, S.H., Ha, J.S., 2004. Numerical prediction on the characteristics ofspray-induced mixing and thermal decomposition of urea solution in SCR
system. In: Proc. 2004 Fall Technical Conference of the ASME Internal Com-bustion Engine Division, Long Beach, California, USA, pp. 165e170. http://dx.doi.org/10.1115/ICEF2004-0889.
Kleme�s, J.J., Varbanov, P.S., Huisingh, D., 2012. Recent cleaner production advancesin process monitoring and optimisation. J. Clean. Prod. 34, 1e8. http://dx.doi.org/10.1016/j.jclepro.2012.04.026.
Kleme�s, J.J., Varbanov, P.S., Pierucci, S., Huisingh, D., 2010. Minimising emissions andenergy wastage by improved industrial processes and integration of renewableenergy. J. Clean. Prod. 18 (9), 843e847. http://dx.doi.org/10.1016/j.jclepro.2010.02.028.
Kontin, S., H€ofler, A., Koch, R., Bauer, H.J., 2010. Heat and mass transfer accompaniedby crystallisation of single particles containing urea-water-solution. In: ILASS e
Europe 2010, 23rd Annual Conference on Liquid Atomization and Spray Sys-tems, Brno, Czech Republic.
Kr€ocher, O., Elsener, M., Jacob, E., 2008. New reducing agents for the low NOx SCRtechnology. In: Proceedings of the 5th International Exhaust Gas and ParticulateEmissions Forum, Ludwigsburg (Germany), pp. 98e119.
Kuhnke, D., 2004. Spray/Wall-Interaction Modelling by Dimensionless Data Anal-ysis. Shaker Verlag GmbH.
Liu, W., Lund, H., Vad Mathiesen, B., 2013. Modelling the transport system in Chinaand evaluating the current strategies towards the sustainable transportdevelopment. Energy Policy 58, 347e357. http://dx.doi.org/10.1016/j.enpol.2013.03.032.
Mikul�ci�c, H., Vujanovi�c, M., Dui�c, N., 2015. Improving the sustainability of cementproduction by using numerical simulation of limestone thermal degradationand pulverized coal combustion in a cement calciner. J. Clean. Prod. 88,262e271. http://dx.doi.org/10.1016/j.jclepro.2014.04.011.
Mikul�ci�c, H., von Berg, E., Vujanovi�c, M., Priesching, P., Perkovi�c, L., Tatschl, R.,Dui�c, N., 2012a. Numerical modelling of calcination reaction mechanism forcement production. Chem. Eng. Sci. 69 (1), 607e615. http://dx.doi.org/10.1016/j.ces.2011.11.024.
Mikul�ci�c, H., von Berg, E., Vujanovi�c, M., Priesching, P., Tatschl, R., Dui�c, N., 2013.Numerical analysis of cement calciner fuel efficiency and pollutant emissions.Clean. Techn. Environ. Policy. 15 (3), 489e499. http://dx.doi.org/10.1007/s10098-013-0607-5.
Mikul�ci�c, H., Vujanovi�c, M., Fidaros, D.K., Priesching, P., Mini�c, I., Tatschl, R., Dui�c, N.,Stefanovi�c, G., 2012b. The application of CFD modelling to support the reductionof CO2 emissions in cement industry. Energy 45, 464e473. http://dx.doi.org/10.1016/j.energy.2012.04.030.
Musa, S.N.A., Saito, M., Furuhata, T., Arai, M., 2006. Evaporation characteristics of asingle aqueous urea solution droplet. In: International Conference on LiquidAtomization and Spray Systems (ICLASS).
Nguyen, T.D.B., Lim, Y., Eom, W.H., Kim, S.J., Yoo, K.S., 2010. Experiment and CFDsimulation of hybrid SNCReSCR using urea solution in a pilot-scale reactor.Comput. Chem. Eng. 34 (10), 1580e1589. http://dx.doi.org/10.1016/j.compchemeng.2009.12.012.
O'Brien, S.B.G., Schwartz, L.W., 2006. Thin Film Flows: Theory and Modeling,Encyclopedia of Surface and Colloid Science, second ed. Marcel Dekker, Inc,pp. 6304e6317.
Schwartz, L.W., Weidner, D.E., 1995. Modeling of coating flows on curved surfaces.J. Eng. Math. 29, 91e103. http://dx.doi.org/10.1007/BF00046385.
van Helden, R., Verbeek, R., Willems, F., van der Welle, R., 2004. Optimization ofUrea SCR deNOx Systems for HD Diesel Engines. SAE 2004-01-0154. http://dx.doi.org/10.4271/2004-01-0154.
Wang, T.J., Baek, S.W., Lee, S.Y., Kang, D.H., Yeo, G.K., 2009. Experimental investi-gation on evaporation of urea-water-solution droplet for SCR applications.AIChE J. 55 (12), 3267e3276. http://dx.doi.org/10.1002/aic.11939.
Yim, S.D., Kim, S.J., Baik, J.H., Nam, I., Mok, Y.S., Lee, J.H., Cho, B.K., Oh, S.H., 2004.Decomposition of urea into NH3 for the SCR Process. Ind. Eng. Chem. Res. 43(16), 4856e4863. http://dx.doi.org/10.1021/ie034052j.